Embed Size (px)
Citation preview

Results for the year ended 31 March 2012
25 June 2012
Gatwick Airport Limited

Operational and financial performance
• Underlying traffic growth from
existing and new carriers, including
long haul carriers to Asian markets
• Continuous improvement in
operational performance, delivering
great customer service
• Strong financial performance
reflecting passenger growth,
increase in allowable aeronautical
yield and tight cost control
• Investment programme continuing to
deliver new and improved facilities
• Financial structure strengthened
through further bond issuance.
Highlights
Traffic growth
- Actual + 6.9%
- Underlying + 3.0%
EBITDA (pre-exceptionals) + 16.9%
Capital expenditure £239.2m
RAB £2,201m
Senior Debt net of cash £1,326m
Senior RAR 0.60x
Senior ICR 3.28x
All figures are for the year ended 31 March 2012 except Senior Debt net of cash and RAB which are shown as at 31 March 2012 2

Our ambition & strategy, consistently applied
3

Improved service and passenger satisfaction
4
Service quality targets met in Q5
Security queuing in Q5
Customer survey score in Q5
On-time departures in peak summer
25.0%
30.0%
35.0%
40.0%
45.0%
50.0%
55.0%
60.0%
65.0%
70.0%
75.0%
2007 2008 2009 2010 2011
Peak summer is June, July and August
75%
80%
85%
90%
95%
100%
2009 2010 2011 2012
(Pe
rce
nta
ge)
(Financial years ending 31 March)
North Terminal Average <5 min South Terminal Average <5 min Target
3.9
4.0
4.1
4.2
2009 2010 2011 2012
(Pas
sen
ger
sati
sfac
tio
n)
(Financial years ending 31 March)
Overall QSM Target
50%
55%
60%
65%
70%
75%
80%
85%
90%
95%
100%
Jan
-09
Ap
r-0
9
Jul-
09
Oct
-09
Jan
-10
Ap
r-1
0
Jul-
10
Oct
-10
Jan
-11
Ap
r-1
1
Jul-
11
Oct
-11
Jan
-12
Ap
r-1
2
% Measures Passed % Measures Failed
(Calendar years)
Change of ownership

• New airlines attracted to Gatwick, in competition with other airports
- Asian airlines starting services as an alternative to Heathrow
- AirAsia X latest airline to switch from Stansted to Gatwick (but now ceased all European services)
- Lufthansa and Turkish Airlines providing connectivity beyond home markets
New routes delivering growth and connectivity
• Underlying traffic growth largely from existing carriers making more effective use of peak capacity and available slots:
- Record load factors each month; 88.4% in August 2011
- New routes/frequencies from easyJet, BA, Norwegian
- Some turnover of airlines/routes e.g. Ryanair, Malev, Delta
5
• New long-haul Asian carriers for summer 2012
- Assisting London‟s connectivity to the Far East

Investing in airport transformation
• Delivery of investment programme on schedule
– £239m invested in 2011/12
– £757m invested in Q5-to-date
– Approx. £436m remaining of Q5 programme
(including extension year)
• Projects completed during 2011/12
– South Terminal forecourt (£31m)
– South Terminal security (£45m)
– Pier 2 reconfiguration and upgrade (£38m)
– North Terminal extension (£85m)
• Major projects started in 2011/12
– South Terminal baggage and Pier 1 (£174m)
– Pier 5 reconfiguration (£72m)
– North Terminal baggage (£46m)
– Main runway resurfacing (£44m) 6

Delivering a better retail offering
• Brand new walk-through duty free store
– New walk-through duty and tax-free opens July
2012
– Retail space in the South Terminal departure
lounge being reconfigured
• Innovative bookshop rebranding
– WH Smith stores being rebranded as „London
News Company‟ or „London Book Company‟
– First rebranded store opened March 2012; all
complete in Summer 2012
• Improved catering in the North Terminal
– Two new restaurants opening this year
– First airport in the world to offer a Jamie
Oliver restaurant, opening July 2012
7
8
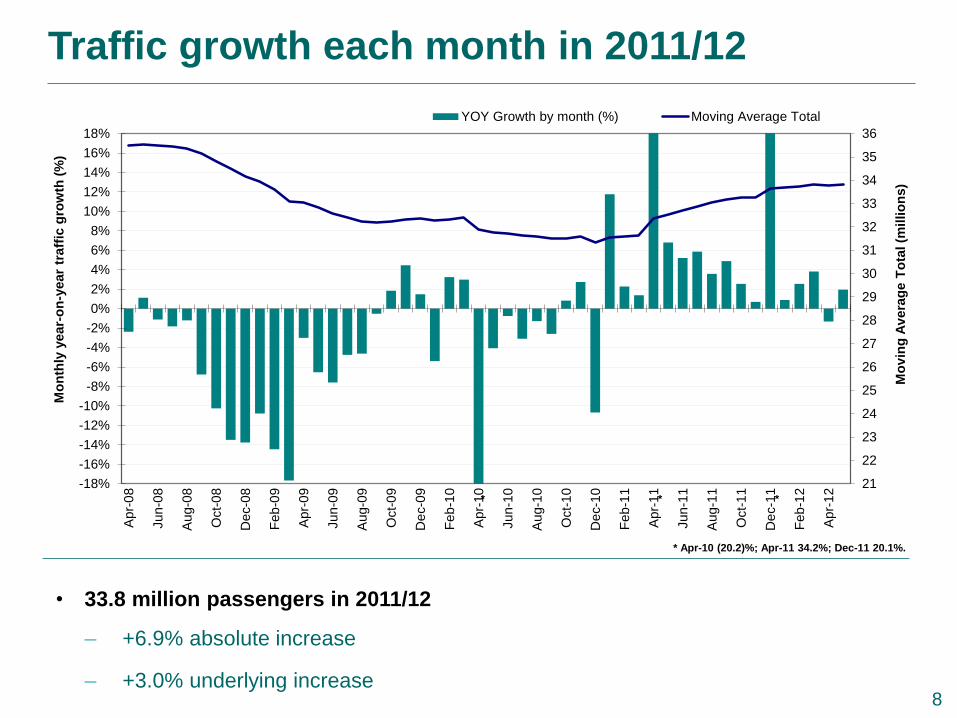
Traffic growth each month in 2011/12
21
22
23
24
25
26
27
28
29
30
31
32
33
34
35
36
-18%
-16%
-14%
-12%
-10%
-8%
-6%
-4%
-2%
0%
2%
4%
6%
8%
10%
12%
14%
16%
18%A
pr-
08
Jun-0
8
Aug-0
8
Oct-
08
De
c-0
8
Feb
-09
Apr-
09
Jun-0
9
Aug-0
9
Oct-
09
De
c-0
9
Feb
-10
Apr-
10
Jun-1
0
Aug-1
0
Oct-
10
De
c-1
0
Feb
-11
Apr-
11
Jun-1
1
Aug-1
1
Oct-
11
De
c-1
1
Feb
-12
Apr-
12
Mo
vin
g A
vera
ge T
ota
l (m
illio
ns)
Mo
nth
ly y
ear-
on
-year
traff
ic g
row
th (
%)
YOY Growth by month (%) Moving Average Total
* Apr-10 (20.2)%; Apr-11 34.2%; Dec-11 20.1%.
* * *
• 33.8 million passengers in 2011/12
– +6.9% absolute increase
– +3.0% underlying increase
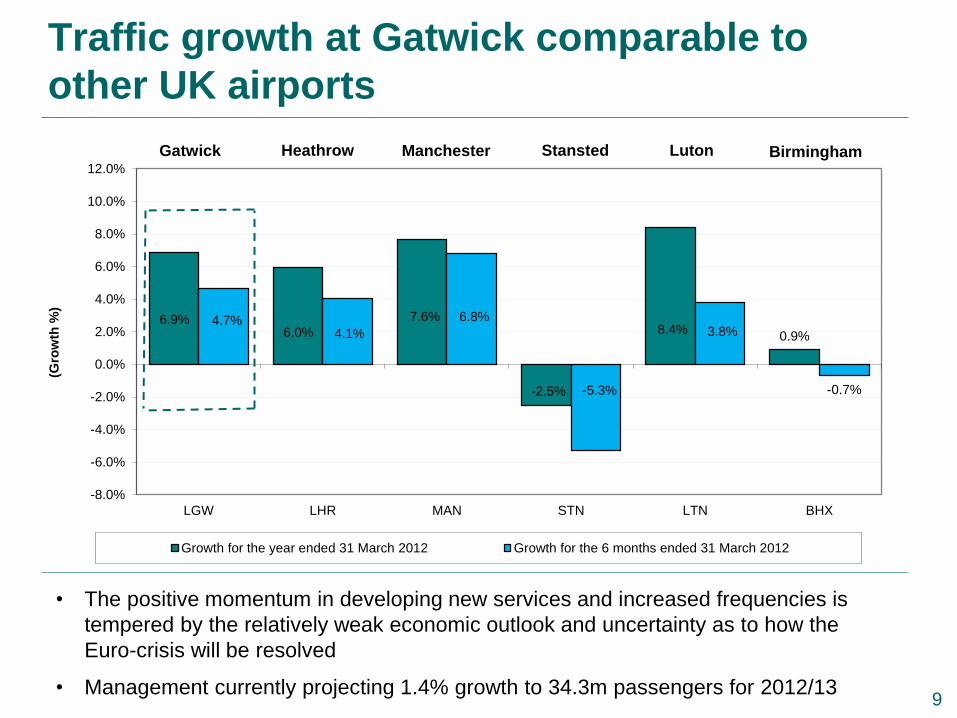
Traffic growth at Gatwick comparable to
other UK airports
9
• The positive momentum in developing new services and increased frequencies is
tempered by the relatively weak economic outlook and uncertainty as to how the
Euro-crisis will be resolved
• Management currently projecting 1.4% growth to 34.3m passengers for 2012/13
6.9% 6.0%
7.6%
-2.5%
8.4% 0.9%
4.7% 4.1%
6.8%
-5.3%
3.8%
-0.7%
-8.0%
-6.0%
-4.0%
-2.0%
0.0%
2.0%
4.0%
6.0%
8.0%
10.0%
12.0%
LGW LHR MAN STN LTN BHX
(Gro
wth
%)
Growth for the year ended 31 March 2012 Growth for the 6 months ended 31 March 2012
Stansted Heathrow Luton Manchester Gatwick Birmingham
9

Strong financial performance building on
traffic growth
* Net debt and RAB are shown as at 31 March 2012 and 2011
Figures in £m unless stated Year ended
31 March 2012
Year ended
31 March 2011 Change
Passengers (millions) 33.8 31.6 6.9%
Turnover 517.4 476.3 8.6%
Operating costs (ex D&A and pre-exceptional items)
295.9 286.9 3.1%
EBITDA (pre-exceptional items)
221.5 189.4 16.9%
Net debt * 1,266.5 1,184.3 6.9%
RAB * 2,200.9 1,985.5 10.8%
10

£517.4m +8.6%
Increased turnover reflecting traffic
growth and increase to aeronautical yield • Aeronautical income up +12.2%,
reflecting increases in passengers
(+6.9%) and allowable yield (+5.8%)
• Retail revenue up +4.6%. Net retail
income per passenger declined by
£0.08 to £3.54, reflecting
– greater proportion of EU
passengers
– retail footprint reduced by 6.2%
during terminal redevelopment
– ST retail with new duty and tax-
free store to open in July 2012
• Car park revenue up +5.0%. Net car
park income per passenger higher by
£0.08 at £1.20, reflecting
– more effective pricing and
increased short-stay capacity
– but, lower proportion of UK
originating passengers
274.2 Aeronautical
Retail
Cark
parking
Other
income
Turnover analysis
2010/11 2011/12
244.3
120.9 115.6
51.7 54.3
68.0 64.7 +5.1%
+4.6%
+12.2%
+5.0%
11 £476.3m Total

Increase of 3% in adjusted operating costs*
• Reliance on BAA removed
– IT systems separation
completed in October 2011
– Transitional IT under TSA costs
reduced from £14.4m to £2.4m
• Staff costs increase reflects:
– RPI-linked, 2-year pay deal for
negotiated grades
– Lower operational headcount
– Increased staff costs
associated with the capital
investment and IT programmes
offset by capitalisation
Net staff
costs
General &
other expenses
Rent, rates
& utilities
Maintenance,
IT & TSA
* Operating costs excluding depreciation and amortisation
2010/11 2011/12
Operating costs analysis
40.0 37.6
50.7 57.0
84.6 81.7
111.6 119.6
+7.2%
-3.4%
+12.4%
-6.0%
12 £286.9m Total £295.9m +3.1%

199.3
0.0
242.0
36.4
3.1
1,184.3
1,266.5
1,100.0
1,150.0
1,200.0
1,250.0
1,300.0
1,350.0
1,400.0
1,450.0
1,500.0
Opening Capitalexpenditure
Net interest Cash flowfrom ops
Dividend Other Closing
£m
Net debt 31 March 2011 to 31 March 2012
* Interest capitalised of £11.7m is included within capital expenditure 13

Re-financing risk lowered through further
bond issuance in January 2012
• Debt maturity profile reduces
refinancing risk
– £300m 2041/43 Class A Bond
– £300m 2037/39 Class A Bond
– £300m 2026/28 Class A Bond
– £300m 2024/26 Class A Bond
– £106m Dec-14 Bank Facilities
• Strong liquidity position to fund
investment programme of c.£436m over
next two years from:
– Undrawn bank commitments (£350m
as at 31 March 2012)
– Annual cash flow from operations
(£199m for the year ended 31 March
2012)
• £75m restricted payment planned July
2012
Financial ratio Year ended
31 March
2012
Year ended
31 March
2011
Cash flow
(per covenant) £154.7m £144.8m
Total interest (net) £48.1m £42.0m
Senior ICR 3.28x 3.45x
Trigger <1.50x <1.50x
Senior Debt net of
cash £1,325.8m £1,212.8m
RAB £2,200.9m £1,985.5m
Senior RAR 0.60x 0.61x
Trigger >0.70x >0.70x
14

Regulatory developments
15
• Civil Aviation Bill progressing through Parliament
– General duty on CAA to further interests of passengers
– Provision for derogations for pre-existing financing arrangements
• CAA undertaking assessment of airport market power
– Gatwick‟s analysis indicates it does not have “substantial market power”
– CAA‟s initial views are that each of LGW, LHR & STN have some degree of market
power and thus could be subject to economic regulation beyond the end of Q5
– CAA continuing work on market power and alternatives for economic regulation
• Beyond Q5 preparation
– Constructive Engagement with the airlines underway based on initial business plan
– Outputs of Constructive Engagement to inform the Company‟s business plan to be
submitted to CAA in early 2013
• Q5 extension year
– Gatwick and airlines defining new capital expenditures triggers for 2013/14
Conclusion
• Underlying traffic growth, slowing growth in 2012/13
• Connecting London to Asian markets for Summer 2012
• Continuous improvement in operational performance, delivering great
customer service
• Investment programme on track, transforming facilities
• Strong financial performance in 2011/12, but moderating in 2012/13 with
lower growth in traffic (+1.4%) and aeronautical yield (+1.5%)
Full details of today’s announcement at: www.gatwickairport.com/investor
16

Disclaimer
This material contains certain tables and other statistical analyses (the “Statistical Information”) which have been prepared in reliance on publicly available information and may be
subject to rounding. Numerous assumptions were used in preparing the Statistical Information, which may or may not be reflected herein. Actual events may differ from those
assumed and changes to any assumptions may have a material impact on the position or results shown by the Statistical Information. As such, no assurance can be given as to
the Statistical Information‟s accuracy, appropriateness or completeness in any particular context; nor as to whether the Statistical Information and/or the assumptions upon which it
is based reflect present market conditions or future market performance. The Statistical Information should not be construed as either projections or predictions nor should any
information herein be relied upon as legal, tax, financial or accounting advice. Gatwick Airport Limited (“GAL”) does not make any representation or warranty as to the accuracy or
completeness of the Statistical Information.
These materials contain statements that are not purely historical in nature, but are “forward-looking statements”. These include, among other things, projections, forecasts,
estimates of income, yield and return, and future performance targets. These forward-looking statements are based upon certain assumptions, not all of which are stated. Future
events are difficult to predict and are beyond GAL‟s control. Actual future events may differ from those assumed. All forward-looking statements are based on information available
on the date hereof and neither GAL nor any of its affiliates or advisers assumes any duty to update any forward-looking statements. Accordingly, there can be no assurance that
estimated returns or projections will be realised, that forward-looking statements will materialise or that actual returns or results will not be materially lower that those presented.
This material should not be construed as an offer or solicitation to buy or sell any securities, or any interest in any securities, and nothing herein should be construed as a
recommendation or advice to invest in any securities.
This document has been sent to you in electronic form. You are reminded that documents transmitted via this medium may be altered or changed during the process of electronic
transmission and consequently neither GAL nor any person who controls it (nor any director, officer, employee not agent of it or affiliate or adviser of such person) accepts any
liability or responsibility whatsoever in respect of the difference between the document sent to you in electronic format and the hard copy version available to you upon request
from GAL.
Any reference to “GAL” will include any of its affiliated associated companies and their respective directors, representatives or employees and/or any persons connected with them.
17

Questions


