Embed Size (px)
Citation preview

Gateway School District Gateway School District General Fund BudgetGeneral Fund Budget
Final Summary Budget Information for the Final Summary Budget Information for the 2014-2015 Fiscal Year2014-2015 Fiscal Year
As of June 30, 2014As of June 30, 2014

Summary of Final Total Summary of Final Total Revenues for 2014-2015Revenues for 2014-2015
Projected Final Total Revenues for the 2014-Projected Final Total Revenues for the 2014-2015 fiscal year of 2015 fiscal year of $68,403,000.$68,403,000.
(***Projected Final Total Revenues DON’T (***Projected Final Total Revenues DON’T include any real estate tax increase ($0) for include any real estate tax increase ($0) for the 2014-2015 fiscal year.***)the 2014-2015 fiscal year.***)
IncreaseIncrease of $631,000 or .93%of $631,000 or .93% over the 2013- over the 2013-2014 fiscal year budgeted Total Revenues.2014 fiscal year budgeted Total Revenues.

Summary of Final Total Summary of Final Total Expenditures for 2014-2015Expenditures for 2014-2015
Projected Final Total Expenditures for the Projected Final Total Expenditures for the 2014-2015 fiscal year of 2014-2015 fiscal year of $70,180,000.$70,180,000.
IncreaseIncrease of $2,408,000 or 3.55%of $2,408,000 or 3.55% over the over the 2013-2014 fiscal year budgeted Total 2013-2014 fiscal year budgeted Total Expenditures.Expenditures.

Net Final Budgetary Shortfall or Net Final Budgetary Shortfall or Deficit for 2014-2015Deficit for 2014-2015
IncreaseIncrease in Revenues of in Revenues of $631,000$631,000 + + IncreaseIncrease in Expenditures of in Expenditures of $2,408,000$2,408,000 = =
Net Projected Final Total Budget Net Projected Final Total Budget Shortfall Shortfall or Deficit for the 2014-2015 fiscal year or Deficit for the 2014-2015 fiscal year of ($1,777,000).of ($1,777,000).

Direct District Impact of Final Direct District Impact of Final State Budget for 2014-2015 State Budget for 2014-2015
NONO Increase Increase $0$0 in Basic Education in Basic Education Subsidy in the State budget. Subsidy in the State budget.
IncreaseIncrease of of $35,827$35,827 in Special Education in Special Education Subsidy – (NOT Included in the 2014-2015 Subsidy – (NOT Included in the 2014-2015 fiscal year Budget due to the District fiscal year Budget due to the District approving the Budget before the approval approving the Budget before the approval of the State budget). of the State budget).

Direct District Impact of Final Direct District Impact of Final State Budget for 2014-2015State Budget for 2014-2015
New State grant called the New State grant called the Ready to Learn Block GrantReady to Learn Block Grant (RLBG) (RLBG) was created for the 2014-2015 fiscal year.was created for the 2014-2015 fiscal year.
Collapses the Accountability Block Grant ($130,950) into the RLBG Collapses the Accountability Block Grant ($130,950) into the RLBG and adds a and adds a Student-Focused Funding Supplement ($165,165)Student-Focused Funding Supplement ($165,165) to to create the RLBG.create the RLBG.
For the District: $130,950 + $165,165 = For the District: $130,950 + $165,165 = $296,115$296,115 for the RLBG. for the RLBG.
The Student-Focused Funding Supplement is new money and The Student-Focused Funding Supplement is new money and requires new expenditures; therefore, it requires new expenditures; therefore, it DOES NOTDOES NOT provide any provide any relief to the District’s current revenue shortfall for the 2014-2015 relief to the District’s current revenue shortfall for the 2014-2015 fiscal year.fiscal year.

State Retirement Changes – No State Retirement Changes – No Changes for 2014-2015Changes for 2014-2015
No changes to the Pennsylvania School No changes to the Pennsylvania School Employees Retirement System (Employees Retirement System (PSERSPSERS) were ) were adopted & enacted by the State.adopted & enacted by the State.
(***ALL Changes to PSERS must first be (***ALL Changes to PSERS must first be approved by the State Legislature.***)approved by the State Legislature.***)
Thus, no changes formally enacted and effective Thus, no changes formally enacted and effective as of 7/1/14 for the 2014-2015 fiscal year.as of 7/1/14 for the 2014-2015 fiscal year.

State Retirement Changes – No State Retirement Changes – No Changes for 2014-2015Changes for 2014-2015
NONO reduction in the 2014-2015 fiscal year reduction in the 2014-2015 fiscal year employer contribution rate by a reduction in the employer contribution rate by a reduction in the pension collars of pension collars of (2.25%)(2.25%) to reduce the overall to reduce the overall rate from 21.40% to rate from 21.40% to 19.15%19.15%. . (Thus, 21.40% (Thus, 21.40% utilized in the 2014-2015 fiscal year Budget.)utilized in the 2014-2015 fiscal year Budget.)
Current net effect (Expenditures Less State 50% Current net effect (Expenditures Less State 50% Reimbursement Subsidy) in the 2014-2015 fiscal Reimbursement Subsidy) in the 2014-2015 fiscal year Budget is an increase in pension year Budget is an increase in pension expenditures of expenditures of $778,259$778,259 to PSERS. to PSERS.

Final Revenue and Expenditure Final Revenue and Expenditure Issues for 2014-2015Issues for 2014-2015
ReductionReduction in Current Real Estate Tax revenues in Current Real Estate Tax revenues ((Loss of $914,001Loss of $914,001).).
Actual Increases of Actual Increases of 55..75% for PPO & 5.75% for 75% for PPO & 5.75% for HMOHMO in employer medical insurance in employer medical insurance expenditures. expenditures.
Increase of 4.47%Increase of 4.47% (from 16.93% to (from 16.93% to 21.40%21.40%) in ) in required employer retirement benefit required employer retirement benefit expenditures to PSERS. expenditures to PSERS.

Composition of Major Revenue Composition of Major Revenue Categories for 2014-2015Categories for 2014-2015
LocalLocal – – 74%74% of the Final 2014-2015 Budget. of the Final 2014-2015 Budget.
StateState – – 25%25% of the Final 2014-2015 Budget. of the Final 2014-2015 Budget.
FederalFederal - - 1%1% of the Final 2014-2015 Budget. of the Final 2014-2015 Budget.
FLAT or very Little Revenue Growth FLAT or very Little Revenue Growth Projected in the 2014-2015 fiscal year Projected in the 2014-2015 fiscal year BudgetBudget..

Major Types of Local Revenue Major Types of Local Revenue Categories for 2014-2015Categories for 2014-2015
Current Real Estate Tax (Largest)Current Real Estate Tax (Largest).. Current Earned Income Tax.Current Earned Income Tax. Delinquent Real Estate Tax.Delinquent Real Estate Tax. Mercantile Tax.Mercantile Tax. Deed Transfer Tax. Deed Transfer Tax. Local Services Tax. Local Services Tax. Delinquent Earned Income Tax. Delinquent Earned Income Tax.
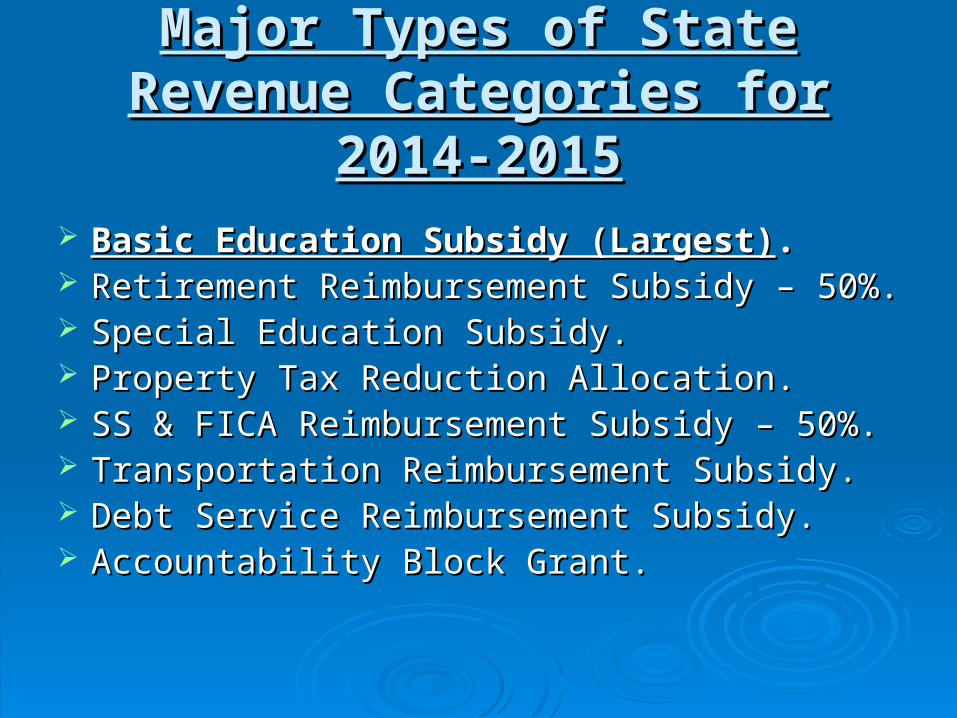
Major Types of State Revenue Major Types of State Revenue Categories for 2014-2015Categories for 2014-2015
Basic Education Subsidy (Largest)Basic Education Subsidy (Largest).. Retirement Reimbursement Subsidy – 50%. Retirement Reimbursement Subsidy – 50%. Special Education Subsidy. Special Education Subsidy. Property Tax Reduction Allocation. Property Tax Reduction Allocation. SS & FICA Reimbursement Subsidy – 50%.SS & FICA Reimbursement Subsidy – 50%. Transportation Reimbursement Subsidy.Transportation Reimbursement Subsidy. Debt Service Reimbursement Subsidy.Debt Service Reimbursement Subsidy. Accountability Block Grant. Accountability Block Grant.

Major Types of Federal Revenue Major Types of Federal Revenue Categories for 2014-2015Categories for 2014-2015
IDEA Funds (Largest)IDEA Funds (Largest) - Passed Through - Passed Through the AIU#3.the AIU#3.
Title I Funds - Passed Through PDE.Title I Funds - Passed Through PDE. Title II Funds - Passed Through PDE.Title II Funds - Passed Through PDE. ACCESS Funds - Passed Through PDE.ACCESS Funds - Passed Through PDE. Title III Funds - Passed Through PDE.Title III Funds - Passed Through PDE.

Top Ten Revenues for 2014-2015Top Ten Revenues for 2014-2015
1. 1. Current Real Estate TaxesCurrent Real Estate Taxes - - $42,328,491$42,328,491 2. Basic Education Subsidy - $6,996,2482. Basic Education Subsidy - $6,996,248 3. Current Earned Income Taxes - $3,745,0003. Current Earned Income Taxes - $3,745,000 4. Retirement Reimburse. Subsidy - $3,424,1524. Retirement Reimburse. Subsidy - $3,424,152 5. Special Education Subsidy - $1,941,7125. Special Education Subsidy - $1,941,712 6. Delinquent Real Estate Taxes - $1,490,000 6. Delinquent Real Estate Taxes - $1,490,000 7. State Property Tax Reduction - $1,459,7417. State Property Tax Reduction - $1,459,741 8. SS & FICA Reimburse. Subsidy - $1,230,2928. SS & FICA Reimburse. Subsidy - $1,230,292 9. Mercantile Taxes - $1,209,0009. Mercantile Taxes - $1,209,000 10. Transportation Reimb. Subsidy - $1,175,00010. Transportation Reimb. Subsidy - $1,175,000

Top Ten Expenditures for 2014-Top Ten Expenditures for 2014-20152015
1. 1. All Employee Wages & SalariesAll Employee Wages & Salaries - - $31,997,292$31,997,292 2. Retirement Expenditures - $6,848,3042. Retirement Expenditures - $6,848,304 3. Health Insurance Expenditures - $6,100,0003. Health Insurance Expenditures - $6,100,000 4. Transportation Expenditures - $4,243,0004. Transportation Expenditures - $4,243,000 5. Bond Debt Service Expenditures - $4,002,1505. Bond Debt Service Expenditures - $4,002,150 6. Charter & Cyber School Expenditures - $3,600,000 6. Charter & Cyber School Expenditures - $3,600,000 7. Special Education Expenditures (Other) - $2,740,0007. Special Education Expenditures (Other) - $2,740,000 8. SS & FICA Expenditures - $2,460,5848. SS & FICA Expenditures - $2,460,584 9. Technology Expenditures (All) - $1,356,0009. Technology Expenditures (All) - $1,356,000 10. Utility Expenditures - $1,024,00010. Utility Expenditures - $1,024,000

Final Total Personnel & Final Total Personnel & Employee Benefit Expenditures Employee Benefit Expenditures
for 2014-2015for 2014-2015 Projected Final Personnel Wage & Salary Projected Final Personnel Wage & Salary
Expenditures = Expenditures = 45.5%45.5% of the 2014-2015 fiscal of the 2014-2015 fiscal year Budget.year Budget.
Projected Final Employee Benefits Expenditures Projected Final Employee Benefits Expenditures = = 23.3%23.3% of the 2014-2015 fiscal year Budget. of the 2014-2015 fiscal year Budget.
Projected Final Total Gross Employee Projected Final Total Gross Employee Expenditures = 68.8% of the Total 2014-2015 Expenditures = 68.8% of the Total 2014-2015 fiscal year Budget.fiscal year Budget.

Projection of Ending Total Fund Projection of Ending Total Fund Balance at 6/30/14 for 2013-2014Balance at 6/30/14 for 2013-2014
Beginning Fund Balance as of 7/1/13 Beginning Fund Balance as of 7/1/13 $11,669,241$11,669,241
Less: 1. C/Y Real Estate Tax Refunds ($ 713,377)Less: 1. C/Y Real Estate Tax Refunds ($ 713,377) 2. C/Y & P/Y Refunds – Westinghouse Property ($ 469,805)2. C/Y & P/Y Refunds – Westinghouse Property ($ 469,805) 3. Transportation Expenditures for Additional3. Transportation Expenditures for Additional Fuel, Additional Routes, & HomelessFuel, Additional Routes, & Homeless Students ($ To Be Determined)Students ($ To Be Determined) 4. Other Expenditures ($ To Be Determined)4. Other Expenditures ($ To Be Determined)
Add: 1. No Major Increases to List at this Time. Add: 1. No Major Increases to List at this Time. $ 0$ 0 Net Projected Decrease for 2013-2014 Fiscal Year Net Projected Decrease for 2013-2014 Fiscal Year ($1,183,182)($1,183,182)
Projected Ending Fund Balance as of 6/30/14 Projected Ending Fund Balance as of 6/30/14 $10,486,059$10,486,059

Composition of Projected Ending Composition of Projected Ending Fund Balance at 6/30/14 for 2013-Fund Balance at 6/30/14 for 2013-
20142014
Unassigned Fund Balance $4,137,271Unassigned Fund Balance $4,137,271 Nonspendable Fund Balance $ 681,274Nonspendable Fund Balance $ 681,274 Committed Fund Balance Committed Fund Balance $5,667,514$5,667,514
Projected Total Fund BalanceProjected Total Fund Balance$10,486,059$10,486,059

Components of Fund BalanceComponents of Fund Balance Unassigned Fund BalanceUnassigned Fund Balance: Portion that : Portion that is immediately availableis immediately available
to be utilized for identified purposes such as balancing the Budget & to be utilized for identified purposes such as balancing the Budget & making transfers to other funds.making transfers to other funds.
Nonspendable Fund BalanceNonspendable Fund Balance: Portion that offsets the amount of : Portion that offsets the amount of Prepaid Expenditures on the District’s balance sheet & Prepaid Expenditures on the District’s balance sheet & is not is not availableavailable for expenditure. for expenditure.
Committed Fund BalanceCommitted Fund Balance: Portion that : Portion that is not immediately is not immediately availableavailable due to official designation by the Board for specific due to official designation by the Board for specific purposes through a formal Board resolution. Can be designated by purposes through a formal Board resolution. Can be designated by the Board for different purposes or classified back to Unassigned the Board for different purposes or classified back to Unassigned Fund Balance through an additional formal Board resolution. Fund Balance through an additional formal Board resolution. Designations Currently IncludeDesignations Currently Include: 1. Future employer health insurance : 1. Future employer health insurance increases; 2. Future employer pension cost increases; & 3. Future increases; 2. Future employer pension cost increases; & 3. Future capital repair project expenditures for District school buildings. capital repair project expenditures for District school buildings.

Projection of Total Fund Balance Projection of Total Fund Balance at 6/30/15 for 2014-2015at 6/30/15 for 2014-2015
Projected Fund Balance as of 7/1/14 $10,486,059Projected Fund Balance as of 7/1/14 $10,486,059
Less: Utilization to Balance the Less: Utilization to Balance the ($ 1,777,000)($ 1,777,000) 2014-2015 fiscal year Budget 2014-2015 fiscal year Budget
Projected Fund Balance as of 6/30/15 Projected Fund Balance as of 6/30/15 $ 8,709,059$ 8,709,059
The Projected Total Ending Fund Balance Represents The Projected Total Ending Fund Balance Represents 12.41%12.41% of of the Final 2014-2015 fiscal year Budget.the Final 2014-2015 fiscal year Budget.
((NOTENOTE:: The Unassigned Fund Balance portion of the Total Ending The Unassigned Fund Balance portion of the Total Ending Fund Balance is projected to be Fund Balance is projected to be 3.36%3.36% of the 2014-2015 fiscal year of the 2014-2015 fiscal year budgeted expenditures which is in compliance with 24 PS 6-688 or budgeted expenditures which is in compliance with 24 PS 6-688 or less than less than 8%8% in a fiscal year when the real estate tax millage rate is in a fiscal year when the real estate tax millage rate is increased by the District.)increased by the District.)

What if Only Two Budget Line What if Only Two Budget Line Items Didn’t Change for 2014-Items Didn’t Change for 2014-
2015?2015? Utilization of Fund Balance ($1,777,000)Utilization of Fund Balance ($1,777,000) Add: Net Increase in PSERS $ 778,259Add: Net Increase in PSERS $ 778,259 Expenditures.Expenditures. Add: Net Decrease in Current Year Add: Net Decrease in Current Year $ 914,001$ 914,001
Real Estate Tax Revenue.Real Estate Tax Revenue.
Adjusted Utilization of Fund BalanceAdjusted Utilization of Fund Balance ($ 84,740) ($ 84,740) for the 2014-2015 fiscal year if thefor the 2014-2015 fiscal year if the PSERS Rate & Current Year RealPSERS Rate & Current Year Real
Estate Tax Revenues Didn’t Change.Estate Tax Revenues Didn’t Change.

Gateway School District Gateway School District General Fund BudgetGeneral Fund Budget
Final Real Estate Tax Millage Rate & Other Budget Final Real Estate Tax Millage Rate & Other Budget Information for the 2014-2015 Fiscal YearInformation for the 2014-2015 Fiscal Year
As of June 30, 2014As of June 30, 2014

What is Millage?What is Millage?
Millage is a tax rate applied to a real estate property’s Millage is a tax rate applied to a real estate property’s assessed valuation for the purpose of revenue assessed valuation for the purpose of revenue generation by a taxing body such as the District.generation by a taxing body such as the District.
Each mill represents $1 of tax assessment per Each mill represents $1 of tax assessment per $1,000 of assessed property value.$1,000 of assessed property value.
A mill is derived from the root word mill, which means A mill is derived from the root word mill, which means “thousand.”“thousand.”
Thus, one mill is one part per thousand or 0.1% which Thus, one mill is one part per thousand or 0.1% which can also be expressed as .001 for calculation purposes.can also be expressed as .001 for calculation purposes.

Gateway School District Real Gateway School District Real Estate Tax Millage Rate for 2014-Estate Tax Millage Rate for 2014-
20152015
At At 18.8919 Mills18.8919 Mills in the 2014-2015 fiscal year, in the 2014-2015 fiscal year, GSD has the 18GSD has the 18thth Lowest Lowest Millage RateMillage Rate out of out of 42 school districts in Allegheny County.42 school districts in Allegheny County.
McKeesport Area School District – McKeesport Area School District – LowestLowest in in Allegheny County at Allegheny County at 15.70 Mills15.70 Mills..
Wilkinsburg Area School District – Wilkinsburg Area School District – HighestHighest in in Allegheny County at Allegheny County at 32.63 Mills32.63 Mills..

Neighboring Allegheny County Neighboring Allegheny County School District Real Estate Tax School District Real Estate Tax
Millage Rates for 2014-2015Millage Rates for 2014-2015
Gateway School District – Gateway School District – 18.891918.8919 Mills Mills Plum Borough School Dist. – Plum Borough School Dist. – 18.758018.7580 Mills Mills Penn Hills School District – Penn Hills School District – 24.154024.1540 Mills Mills Woodland Hills School Dist. – Woodland Hills School Dist. – 22.40022.400 Mills Mills East Allegheny School Dist. – East Allegheny School Dist. – 27.54027.540 Mills Mills

Effects of Allegheny County Real Effects of Allegheny County Real Estate Reassessment in 2014-Estate Reassessment in 2014-
20152015
Real estate assessment values for properties located in Real estate assessment values for properties located in Monroeville and Pitcairn Monroeville and Pitcairn CONTINUECONTINUE to decrease in to decrease in value and owner appeals will value and owner appeals will CONTINUECONTINUE to occur in the to occur in the 2014-2015 fiscal year.2014-2015 fiscal year.
Current year and prior year real estate tax refunds will Current year and prior year real estate tax refunds will CONTINUECONTINUE to have a negative effect on current year to have a negative effect on current year real estate tax revenue as well as prior year real estate real estate tax revenue as well as prior year real estate tax refund expenditures which will ultimately effect the tax refund expenditures which will ultimately effect the District’s Fund Balance.District’s Fund Balance.

District Real Estate Assessment District Real Estate Assessment Issues for 2014-2015Issues for 2014-2015
The current total assessed value of the District’s real estate The current total assessed value of the District’s real estate properties properties CONTINUECONTINUE to decrease each month. to decrease each month.
The number of taxpayer appeals The number of taxpayer appeals CONTINUECONTINUE to occur and the to occur and the successful taxpayer appeals further decrease the total assessed successful taxpayer appeals further decrease the total assessed real estate value of the District.real estate value of the District.
Thus, the District’s calculation of real estate tax revenue for the Thus, the District’s calculation of real estate tax revenue for the 2014-2015 fiscal year has factored in an adjustment for the 2014-2015 fiscal year has factored in an adjustment for the continuation of successful taxpayer appeals.continuation of successful taxpayer appeals.
In addition, new taxpayer appeals will probably In addition, new taxpayer appeals will probably CONTINUECONTINUE to be to be initiated during the 2014-2015 fiscal year which initiated during the 2014-2015 fiscal year which CAN NOTCAN NOT be be quantified by the District. quantified by the District.

Continued Decline of District Continued Decline of District Total Real Estate Assessed Total Real Estate Assessed
ValuesValues 6/14/136/14/13 Total Value Total Value $2,499,750,315$2,499,750,315 7/19/13 Total Value $2,463,880,1157/19/13 Total Value $2,463,880,115 8/23/13 Total Value $2,461,222,7158/23/13 Total Value $2,461,222,715 9/27/13 Total Value $2,453,451,1659/27/13 Total Value $2,453,451,165 11/8/13 Total Value $2,453,099,91511/8/13 Total Value $2,453,099,915 11/12/13 Total Value $2,447,304,61611/12/13 Total Value $2,447,304,616 12/13/13 Total Value $2,445,921,91612/13/13 Total Value $2,445,921,916 1/15/14 Total Value $2,451,626,716 (Certified Value from Allegheny County)1/15/14 Total Value $2,451,626,716 (Certified Value from Allegheny County) 1/24/14 Total Value $2,449,255,9161/24/14 Total Value $2,449,255,916 2/21/14 Total Value $2,442,479,7162/21/14 Total Value $2,442,479,716 3/28/14 Total Value $2,438,104,5663/28/14 Total Value $2,438,104,566 4/4/14 Total Value $2,438,038,0664/4/14 Total Value $2,438,038,066 4/28/14 Total Value $2,437,550,2414/28/14 Total Value $2,437,550,241 5/2/14 Total Value $2,432,476,0415/2/14 Total Value $2,432,476,041 5/9/14 Total Value $2,432,411,0415/9/14 Total Value $2,432,411,041 5/23/14 Total Value5/23/14 Total Value $2,432,411,041 $2,432,411,041 5/30/145/30/14 Total Value Total Value $2,418,463,341$2,418,463,341
From 6/14/13 to 5/30/14, the Total Real Estate Assessed Value of the District continued to Decrease by From 6/14/13 to 5/30/14, the Total Real Estate Assessed Value of the District continued to Decrease by ($81,286,974) or (3.25%).($81,286,974) or (3.25%).
District utilized a (District utilized a ($36,000,000)$36,000,000) adjustment leaving a balance of ( adjustment leaving a balance of ($45,286,974)$45,286,974) unanticipated for the 2013-2014 unanticipated for the 2013-2014 fiscal year. fiscal year.

Assessed Value Adjustment for Assessed Value Adjustment for Taxpayer Real Estate Appeals in Taxpayer Real Estate Appeals in
2014-20152014-2015
District has utilized an adjustment of District has utilized an adjustment of $$5,000,0005,000,000 for current taxpayer real estate for current taxpayer real estate appeals which appeals which MAYMAY require the District to require the District to issue a refund or return current year issue a refund or return current year revenue collected by the District to the revenue collected by the District to the taxpayers during the 2014-2015 fiscal year taxpayers during the 2014-2015 fiscal year after a successful appeal. after a successful appeal.

Primary Reason for the Decline Primary Reason for the Decline in District Total Real Estate in District Total Real Estate
Assessed Values for 2014-2015Assessed Values for 2014-2015
Successful and Pending Taxpayer Real Estate Successful and Pending Taxpayer Real Estate Assessment Appeals!Assessment Appeals!
Thus, the District’s real estate tax millage rate was set Thus, the District’s real estate tax millage rate was set TOO LOWTOO LOW for the 2013-2014 fiscal year and is for the 2013-2014 fiscal year and is TOO TOO LOWLOW for the 2014-2015 fiscal year without any additional for the 2014-2015 fiscal year without any additional increases to equalize the real estate tax revenues back increases to equalize the real estate tax revenues back to the original calculated amounts for the 2013-2014 to the original calculated amounts for the 2013-2014 fiscal year.fiscal year.

Analysis of Real Estate Tax Analysis of Real Estate Tax Revenue at 6/30/14 for 2013-2014Revenue at 6/30/14 for 2013-2014
Amount Originally Budgeted $43,242,492Amount Originally Budgeted $43,242,492 Less: Amount Collected ($42,530,854)Less: Amount Collected ($42,530,854) Add: Refunds to Taxpayers Add: Refunds to Taxpayers $ 1,240,933$ 1,240,933 Balance to be Collected $ 1,952,571Balance to be Collected $ 1,952,571 Less: Future Delinquents Less: Future Delinquents ($ 1,623,757)($ 1,623,757) Amount Never to be Collected $ 328,814Amount Never to be Collected $ 328,814 Percentage Never to be Collected 0.76%Percentage Never to be Collected 0.76%

Correct Millage Rate for 2013-Correct Millage Rate for 2013-20142014
Utilizing a Utilizing a $86,286,974$86,286,974 decrease in the District’s total decrease in the District’s total assessed value in calculating the revenue for the 2013-assessed value in calculating the revenue for the 2013-2014 fiscal year, the correctly adjusted millage rate 2014 fiscal year, the correctly adjusted millage rate would have been would have been 19.285519.2855 Mills. Mills.
District’s rank would have changed from the 17District’s rank would have changed from the 17thth to the to the 1919thth Lowest Lowest Millage Rate in Allegheny County. Millage Rate in Allegheny County.
Represents an increase of Represents an increase of .3936.3936 Mills over the 18.8919 Mills over the 18.8919 mills previously set for the 2013-2014 fiscal year.mills previously set for the 2013-2014 fiscal year.

2.5% Index - Equivalent in Mills2.5% Index - Equivalent in Mills
The District was permitted to increase the millage rate by up to a The District was permitted to increase the millage rate by up to a 2.5%2.5% (Index) for the 2014-2015 fiscal year. (Index) for the 2014-2015 fiscal year.
Current Millage: 18.8919 MillsCurrent Millage: 18.8919 Mills Multiplied by 2.5% Index: Multiplied by 2.5% Index: X .025X .025 Max Increase in Millage of: Max Increase in Millage of: .4722.4722 MillsMills
Thus, the maximum amount the Real Estate Tax Millage Rate Thus, the maximum amount the Real Estate Tax Millage Rate COULDCOULD have been for the 2014-2015 Fiscal Year is 18.8919 Mills have been for the 2014-2015 Fiscal Year is 18.8919 Mills + .4722 Mills = 19.3641 Mills.+ .4722 Mills = 19.3641 Mills.
***NO INCREASE IN THE MILLAGE RATE WAS UTILIZED TO ***NO INCREASE IN THE MILLAGE RATE WAS UTILIZED TO BALANCE THE DISTRICT’S BUDGET FOR THE 2014-2015 BALANCE THE DISTRICT’S BUDGET FOR THE 2014-2015 FISCAL YEAR.***FISCAL YEAR.***

Comparison of 2013-2014 to Comparison of 2013-2014 to Maximum Real Estate Tax Maximum Real Estate Tax
Millage Rate FOR 2014-2015Millage Rate FOR 2014-2015 2013-2014 Millage Rate: 18.8919 Mills2013-2014 Millage Rate: 18.8919 Mills 2014-2015 Maximum Millage Rate: 19.3641 Mills2014-2015 Maximum Millage Rate: 19.3641 Mills
Maximum Increase of (.4722 Mills) in the Millage Rate.Maximum Increase of (.4722 Mills) in the Millage Rate.
Maximum Increase of (2.5%) in the Millage Rate.Maximum Increase of (2.5%) in the Millage Rate.
***NO increase in the real estate tax millage rate was ***NO increase in the real estate tax millage rate was included in the Final Budget for the 2014-2015 fiscal included in the Final Budget for the 2014-2015 fiscal year. A full increase of 2.5% would have yielded a year. A full increase of 2.5% would have yielded a net amount of approximately $1,094,508.***net amount of approximately $1,094,508.***

$ Amount of Real Estate Tax $ Amount of Real Estate Tax Maximum Millage Increase Per Maximum Millage Increase Per
Resident Available for 2014-2015Resident Available for 2014-2015
MonroevilleMonroeville::
Based on median taxable Based on median taxable value of value of $107,700$107,700..
At Maximum 2.5% Index At Maximum 2.5% Index = = $50.86/YEAR$50.86/YEAR..
At Maximum 2.5% Index At Maximum 2.5% Index = = $4.24/MONTH$4.24/MONTH..
PitcairnPitcairn::
Based on median taxable Based on median taxable value of value of $35,000$35,000..
At Maximum 2.5% Index At Maximum 2.5% Index = = $16.53/YEAR$16.53/YEAR..
At Maximum 2.5% Index At Maximum 2.5% Index = = $1.38/MONTH$1.38/MONTH..

Assessment Value for 2014-2015Assessment Value for 2014-2015
Allegheny County formally issued new certified real estate Allegheny County formally issued new certified real estate assessment values via a CD on 1/15/14 for properties located in assessment values via a CD on 1/15/14 for properties located in Monroeville and Pitcairn to be utilized by the District for the Monroeville and Pitcairn to be utilized by the District for the preliminary real estate tax calculations required in the 2014-2015 preliminary real estate tax calculations required in the 2014-2015 fiscal year Budget.fiscal year Budget.
Allegheny County issued a CD to the District as of 4/28/14 with the Allegheny County issued a CD to the District as of 4/28/14 with the eligible homestead properties to receive property tax relief for the eligible homestead properties to receive property tax relief for the 2014-2015 fiscal year.2014-2015 fiscal year.
District compared the total 1/15/14 & 4/28/14 real estate District compared the total 1/15/14 & 4/28/14 real estate assessment values and millage rate calculations to the value and assessment values and millage rate calculations to the value and millage rate calculations performed on the available summary millage rate calculations performed on the available summary assessment values per the Allegheny County website.assessment values per the Allegheny County website.

Homestead Exclusion for 2014-Homestead Exclusion for 2014-20152015
The 2013-2014 fiscal year amount was initially projected to be in the The 2013-2014 fiscal year amount was initially projected to be in the District’s 2014-2015 fiscal year Budget. District’s 2014-2015 fiscal year Budget.
State determined (on April 15, 2014) gaming revenues were available for State determined (on April 15, 2014) gaming revenues were available for distribution to the school districts during the 2014-2015 fiscal year.distribution to the school districts during the 2014-2015 fiscal year.
PDE certified and officially released the actual distribution amount to the PDE certified and officially released the actual distribution amount to the District on May 1, 2014 in the amount of District on May 1, 2014 in the amount of $1,459,741.27$1,459,741.27 for the 2014-2015 for the 2014-2015 fiscal year. An increase of only fiscal year. An increase of only $487.84$487.84 from the 2013-2014 fiscal year. from the 2013-2014 fiscal year.
The 2014-2015 fiscal year will be the The 2014-2015 fiscal year will be the 77thth year year in a row for the District to in a row for the District to receive and to distribute a State gaming revenue distribution.receive and to distribute a State gaming revenue distribution.
Impact of the distribution is Impact of the distribution is revenue neutralrevenue neutral in the District’s 2014-2015 in the District’s 2014-2015 fiscal year Budget.fiscal year Budget.

Homestead Exclusion for 2014-Homestead Exclusion for 2014-20152015
$174.63$174.63 per eligible homestead property in per eligible homestead property in both Monroeville & Pitcairn for the 2014-both Monroeville & Pitcairn for the 2014-2015 fiscal year.2015 fiscal year.
Monroeville Monroeville PitcairnPitcairn
.4722 Mill Increase $ 50.86 $ 16.53.4722 Mill Increase $ 50.86 $ 16.53
Less: Exclusion Less: Exclusion ($174.63)($174.63) ($174.63)($174.63)
Net Credit EffectNet Credit Effect ( ($123.77)$123.77) ( ($158.10)$158.10)

Budget Process for 2014-2015 Budget Process for 2014-2015
A not to exceed Index A not to exceed Index ((2.5%2.5%)) resolution resolution was previouslywas previously adopted by the Board on adopted by the Board on January 22, 2014 for the 2014-2015 fiscal year.January 22, 2014 for the 2014-2015 fiscal year.
Thus, referendum exceptions Thus, referendum exceptions were notwere not requested and requested and were notwere not utilized by the utilized by the District for the 2014-2015 fiscal year to further increase the millage rate above the District for the 2014-2015 fiscal year to further increase the millage rate above the 2.5% Index rate.2.5% Index rate.
The Proposed Final 2014-2015 General Fund Budget was adopted by the Board on The Proposed Final 2014-2015 General Fund Budget was adopted by the Board on May 21, 2014. The Budget was displayed and continues to be displayed via the May 21, 2014. The Budget was displayed and continues to be displayed via the PDE-2028PDE-2028 on the District’s website at on the District’s website at www.gatewayk12.orgwww.gatewayk12.org
Various detailed Excel spread sheets were also displayed and continue to be Various detailed Excel spread sheets were also displayed and continue to be displayed on the District’s website at displayed on the District’s website at www.gatewayk12.orgwww.gatewayk12.org
Thus, the Pre-Act 1 budget timeline was followed by the District through final Thus, the Pre-Act 1 budget timeline was followed by the District through final Budget adoption by the Board on June 25, 2014.Budget adoption by the Board on June 25, 2014.


![Budget 2014: Budget plan [French]](https://img.dokumen.tips/doc/110x75/55cf9902550346d0339afd61/budget-2014-budget-plan-french.jpg)