Embed Size (px)
Citation preview

Thesis for the degree of Doctor of technology
Sundsvall 2014
GASIFICATION-BASED BIOREFINERY FOR
MECHANICAL PULP MILLS
Jie He
Supervisors:
Prof. Per Engstrand
Asso. Prof. Wennan Zhang
Dr. Olof Björkqvist
FSCN - Fibre Science and Communication Network
Faculty of Science, Technology and Media
Mid Sweden University, SE-851 70 Sundsvall, Sweden
ISSN 1652-893X,
Mid Sweden University Doctoral Thesis 188
ISBN 978-91-87557-60-6

i
Akademisk avhandling som med tillstånd av Mittuniversitetet i Sundsvall
framläggs till offentlig granskning för avläggande av teknologie doktorsexamen i
kemiteknik, tisdagen den 20 maj 2014 klockan 09:15 i sal N109 Fälldinsalen,
Mittuniversitetet, Sundsvall.
Seminariet kommer att hållas på engelska.
GASIFICATION-BASED BIOREFINERY FOR
MECHANICAL PULP MILLS
Jie He
© Jie He, 2014
FSCN - Fibre Science and Communication Network
Faculty of Science, Technology and Media
Mid Sweden University, SE-851 70 Sundsvall, Sweden
Telephone: +46 (0)771-975 000
Printed by Service and Maintenance Office, Mid Sweden University, Sundsvall,
Sweden, 2014

ii
GASIFICATION-BASED BIOREFINERY FOR
MECHANICAL PULP MILLS
Jie He
FSCN - Fibre Science and Communication Network
Department of Chemical Engineering
Mid Sweden University, SE-51 70 Sundsvall, Sweden
ISSN 1652-893X, Mid Sweden University Doctoral Thesis 188;
ISBN 978-91-87557-60-6
ABSTRACT
The modern concept of “biorefinery” is dominantly based on chemical pulp mills
to create more value than cellulose pulp fibres, and energy from the dissolved
lignins and hemicelluloses. This concept is characterized by the conversion of
biomass into various bio-based products. It includes thermochemical processes
such as gasification and fast pyrolysis. In thermo-mechanical pulp (TMP) mills, the
feedstock available to the gasification-based biorefinery is significant, including
logging residues, bark, fibre material rejects, bio-sludges and other available fuels
such as peat, recycled wood and paper products. On the other hand, mechanical
pulping processes consume a great amount of electricity, which may account for
up to 40% of the total pulp production cost. The huge amount of purchased
electricity can be compensated for by self-production of electricity from
gasification, or the involved cost can be compensated for by extra revenue from
bio-transport fuel production. This work is to study co-production of bio-
automotive fuels, bio-power, and steam via gasification of the waste biomass
streams in the context of the mechanical pulp industry. Ethanol and substitute
natural gas (SNG) are chosen to be the bio-transport fuels in the study. The
production processes of biomass-to-ethanol, SNG, together with heat and power,
are simulated with Aspen Plus. Based on the model, the techno-economic analysis
is made to evaluate the profitability of bio-transport fuel production when the
process is integrated into a TMP mill.
The mathematical modelling starts from biomass gasification. Dual fluidized bed
gasifier (DFBG) is chosen for syngas production. From the model, the yield and
composition of the syngas and the contents of tar and char can be calculated. The
model has been evaluated against the experimental results measured on a 150
iii
KWth Mid Sweden University (MIUN) DFBG. As a reasonable result, the tar content
in the syngas decreases with the gasification temperature and the steam to biomass
(S/B) ratio. The biomass moisture content is a key parameter for a DFBG to be
operated and maintained at a high gasification temperature. The model suggests
that it is difficult to keep the gasification temperature above 850 ℃ when the
biomass moisture content is higher than 15.0 wt.%. Thus, a certain amount of
biomass or product gas needs to be added in the combustor to provide sufficient
heat for biomass devolatilization and steam reforming.
For ethanol production, a stand-alone thermo-chemical process is designed and
simulated. The techno-economic assessment is made in terms of ethanol yield,
synthesis selectivity, carbon and CO conversion efficiencies, and ethanol
production cost. The calculated results show that major contributions to the
production cost are from biomass feedstock and syngas cleaning. A biomass-to-
ethanol plant should be built over 200 MW.
In TMP mills, wood and biomass residues are commonly utilized for electricity
and steam production through an associated CHP plant. This CHP plant is here
designed to be replaced by a biomass-integrated gasification combined cycle
(BIGCC) plant or a biomass-to-SNG (BtSNG) plant including an associated heat &
power centre. Implementing BIGCC/BtSNG in a mechanical pulp production line
might improve the profitability of a TMP mill and also help to commercialize the
BIGCC/BtSNG technologies by taking into account of some key issues such as,
biomass availability, heat utilization etc.. In this work, the mathematical models of
TMP+BIGCC and TMP+BtSNG are respectively built up to study three cases:
1) scaling of the TMP+BtSNG mill (or adding more forest biomass logging
residues in the gasifier for TMP+BIGCC);
2) adding the reject fibres in the gasifier;
3) decreasing the TMP SEC by up to 50%.
The profitability from the TMP+BtSNG mill is analyzed in comparison with the
TMP+BIGCC mill. As a major conclusion, the scale of the TMP+BIGCC/BtSNG mill,
the prices of electricity and SNG are three strong factors for the implementation of
BIGCC/BtSNG in a TMP mill. A BtSNG plant associated to a TMP mill should be
built in a scale above 100 MW in biomass thermal input. Comparing to the case of
TMP+BIGCC, the NR and IRR of TMP+BtSNG are much lower. Political
instruments to support commercialization of bio-transport fuel are necessary.
Keywords: Gasification, Mechanical Pulping, Biofuels, Power Generation, Biomass
Residues, ASPEN Plus

iv
TABLE OF CONTENTS
ABSTRACT ....................................................................................................................... II
TABLE OF CONTENTS ................................................................................................. IV
LIST OF PAPERS ............................................................................................................ VI
AUTHOR’S CONTRIBUTIONS ................................................................................ VII
ABBREVIATIONS ....................................................................................................... VIII
1 INTRODUCTION ...................................................................................................... 1
1.1 OBJECTIVES ............................................................................................................ 3
1.2 CONTENT DESCRIPTION ........................................................................................... 5
2 BACKGROUND ......................................................................................................... 6
2.1 DFBG ..................................................................................................................... 6
2.2 BIOMASS-TO-ETHANOL ........................................................................................... 9
2.3 TMP+BIGCC ....................................................................................................... 11
2.4 TMP+BTSNG ....................................................................................................... 13
3 PROCESS AND MODELING ................................................................................ 15
3.1 DFBG ................................................................................................................... 15
3.1.1 DFBG .................................................................................................................. 15
3.1.2 Simulation ........................................................................................................... 17
3.2 BIOMASS-TO-ETHANOL ......................................................................................... 19
3.2.1 Process ................................................................................................................ 19
3.2.2 Evaluation ........................................................................................................... 20
3.3 TMP+PM.............................................................................................................. 21
3.4 TMP+BIGCC ....................................................................................................... 23
3.4.1 BIGCC .......................................................................................................... 23
3.4.2 Simulation..................................................................................................... 25
3.4.3 Economic evaluation .................................................................................... 26
3.5 TMP+BTSNG ....................................................................................................... 28
3.5.1 BtSNG ........................................................................................................... 28
3.5.2 Simulation..................................................................................................... 31
v
3.5.3 Economic Evaluation ................................................................................... 33
4 RESULT AND DISCUSSION ................................................................................ 35
4.1 DFBG ................................................................................................................... 35
4.1.1 Effect of temperature .................................................................................... 35
4.1.2 Effect of S/B .................................................................................................. 36
4.1.3 Effect of biomass moisture content ............................................................... 37
4.1.4 Effect of residence time ................................................................................ 38
4.2 BIOMASS-TO-ETHANOL ......................................................................................... 39
4.2.1 Ethanol production cost vs. plant scale ........................................................ 39
4.2.2 Capital Investment ........................................................................................ 40
4.2.3 Production cost contribution ........................................................................ 40
4.3 TMP+BIGCC ....................................................................................................... 42
4.3.1 Implementation of BIGCC in a TMP mill ..................................................... 42
4.3.2 Additional biomass ....................................................................................... 43
4.3.3 Reject fibres to gasifier ................................................................................. 44
4.3.4 Improved electric energy efficiency of the TMP-line.................................... 46
4.4 TMP+BTSNG ....................................................................................................... 48
4.4.1 Implementation of BtSNG in a TMP mill ...................................................... 48
4.4.2 Economics of scale ....................................................................................... 50
4.4.3 Reject fibres to gasifier ................................................................................. 51
4.4.4 Improved electric energy efficiency of the TMP-line.................................... 53
5 CONCLUSIONS ....................................................................................................... 55
6 FUTURE RESEARCH .............................................................................................. 58
7 ACKNOWLEDGEMENTS ..................................................................................... 59
8 REFERENCES ........................................................................................................... 60
vi
LIST OF PAPERS
This thesis is mainly based on the following five papers, herein referred to by their
Roman numerals:
Paper I Simulation of Biomass Gasification in a Dual Fluidized Bed Gasifier
J. He, K. Göransson, U. Söderlind and W. Zhang.
Biomass Conversion and Biorefinery 2 (2012), 1–10.
Paper II Review of Syngas Production via Biomass DFBGs
Göransson, U. Söderlind, J. He and W. Zhang.
Renew Sust Energ Rev 15(1) (2011), 482–92.
Paper III Techno-economic Evaluation of Thermo-chemical Biomass-to-
Ethanol
J. He and W.N. Zhang.
Applied Energy 88 (2011), 1224–32.
Paper IV Techno-economic Evaluation of a Mechanical Pulp Mill with
Gasification
J. He, P. Engstrand, O. Björkqvist and W. Zhang.
Nord Pulp Pap Res J 28(3) (2013), 349–57.
Paper V Bio-SNG Production in a TMP Mill in Comparison with BIGCC
J. He, P. Engstrand, O. Björkqvist and W. Zhang.
To be submitted to Applied Energy.

vii
AUTHOR’S CONTRIBUTIONS
The author’s contributions to the papers in the thesis are as follows:
Paper I Author’s entire modelling work. The experimental measurement
data to evaluate author’s mathematic model were obtained by
Kristina Göransson and Ulf Söderlind.
Paper II Author has provided some information on the syngas cleaning-
applied catalytic materials.
Paper III Author’s entire modelling work.
Paper IV Author’s entire modelling work. Supervisors provided the required
operation data both on biomass gasification and on mechanical
pulping.
Paper V Author’s entire modelling work. Supervisors provided some
required data both on biomass gasification and on mechanical
pulping.
viii
ABBREVIATIONS
bdt bone dry tonne
BFB Bubbling Fluidized Bed
BIGCC Biomass Integrated Gasification Combined Cycle
bio-SNG SNG produced from biomass
BtDME Biomass to DME
BtSNG Biomass to SNG
BTL Biomass to Liquid Fuels
CFB Circulating Fluidized Bed
CHP Combined Heat and Power
CIGCC Coal Integrated Gasification Combined Cycle
CNG Compressed Natural Gas
CPD Chemical Percolation Devolatilization
CTMP Chemithermomechanical Pulp
CTU Clean Technology Universe
daf dried and ash free
DD Double Disc
DDB Double Declining Balance Depreciation Method
DFBG Dual Fluidized Bed Gasifier
DH District Heating
DME Dimethyl Ether
ESP Electrostatic Precipitators
FB Fluidized Bed
FSCN Fibre Science and Communication Network
FT Fischer-Tropsch
GHG Greenhouse Gas
H&P Heat and Power
HTDD High Temperature Double Disc Refiner
IGCC Integrated Gasification Combined Cycle
IGHATC Integrated Gasification Humid Air Turbine Cycle
IRR Internal Rate of Return
LC Low Consistency
LHV Lower Heating Value
MIUN Mid Sweden University
MTBE Methyl Tertiary-butyl Ether
NR Net Revenue

ix
O&M Operation and Maintenance Cost
PFI Pulp and Paper Research Institute
PGW Pressurized Groundwood
PM Papermaking
PSA Pressure Swing Adsorption
PSI Paul Scherrer Institute
RME Rapeseed Methyl Ester
ROR Rate of Return
RTS High Temperature Refiner, High rpm
R—Lower Retention
T—Higher Temperature
S—Higher Refiner Disc Speed
SD Single Disc Refiner
SEC Specific Electricity Consumption
SECR Reduction of SEC, %
SGW Stone Groundwood
SNG Substitute Natural Gas
TMP Thermomechanical Pulp
tpy tonne per year
VOC Volatile Organic Carbon
WH Waste Heat
T gasification temperature
S/B steam to biomass mass ratio
M biomass moisture content
τ gasification residence time
dp biomass/char particle size
t tonne
yr year
hr hour
Nm3 normal cubic meter (0 ℃, 1.0 atm)

1
1 INTRODUCTION
TMP refining is a very energy-intensive process. Substantial improvement of
electric energy efficiency in refining is needed in order to secure a long term
operation of many TMP mills. With rapidly growing energy costs the problem of
high energy demand has become acute in recent years.
The present transport biofuels in the market are produced mainly from food crops,
referred to as the 1st generation biofuels, which are not encouraged any longer.
From the viewpoint of economics, environment, land use, water use, chemical
fertilizer use, etc., however, there is a strong preference for the 2nd generation
biofuels that are produced from woody, grassy materials as well as agricultural
residues, municipal wastes and industrial wastes as the feedstock. Thus, the
production of the synthetic transport fuels such as methanol, ethanol, dimethyl-
ether (DME), Fischer-Tropsch (FT) fuel and SNG via gasification and synthesis is
promising (Zhang 2010).
The Fibre Science and Communication Network (FSCN) is a multi-disciplinary
research centre at Mid Sweden University (MIUN). FSCN is aiming for the improved
profitability of mechanical paper and pulp industry and to find new ways to use
the forest as a resource. An EU research project, Forest as a Resource (FORE), runs
from 2011-01 to 2013-12 in FSCN, which deals with production of fibre-based
products in synergy with extraction of materials, chemicals and bio-energy. The
principle structure of the FORE concept is shown in Fig. 1.1.

2
Fig. 1.1: The concept of Forest as a Resource (FORE) with the role of biomass
gasification
The work is included in the FORE-subproject Gasification-based Biorefinery for
Mechanical Pulp Mills, where the bio-energy research group focuses on synthesis
gas production for bio-automotive fuels. The group consists of Wennan Zhang,
asso. Prof., Ulf Söderlind, Ph.D. student and research engineer, Kristina Göransson,
Ph.D. student, Till Henschel, master student, and Jie He. The project has two tasks,
1) development of biomass to liquid (BTL) pilot plant and experimental test, 2)
mathematic simulation of the BTL system and its application to the pulp industry.
The author, Jie He, undertakes the 2nd task.
The bio-energy research group is included in Swedish Gasification Centre (SFC), a
research centre with academic and industry cooperation supported by Swedish
Energy Agency from 2011 to 2020. The research in SFC supports the Swedish
industry for commercialization of bio-transport fuel production.

3
1.1 Objectives
International Energy Agency defines biorefinery as “the sustainable processing of
biomass into a spectrum of marketable products (food, feed, materials and
chemicals) and energy (fuels, power, heat)”. The modern concept of “biorefinery”
in the forest industry is dominantly based on chemical pulp mills to create more
value than pulp fibres, and energy from the dissolved lignins and hemicelluloses.
This concept is characterized by the conversion of biomass into various bio-based
products. It includes thermochemical processes such as gasification and fast
pyrolysis.
In mechanical pulp mills, the feedstock available to the gasification-based
biorefinery is significant, and can be classified into five categories: 1) residues from
the thinning and logging such as tree tops and branches (about 30% of the
harvested trees); 2) bark, taking up 10–13% of the pulp wood flow; 3) reject fibres
(deteriorate paper properties; 10–20% of the total pulp fibres); 4) wastewater
treatment sludge from sedimentation or primary clarification operations and
secondary/biological treatment operations; 5) other available fuels such as peat, the
recycled wood, and paper products. This work is to study co-production of bio-
automotive fuels, chemicals, bio-power, and steam via gasification in the context of
the mechanical pulp industry. In particular, the aim is to study the possibility of
commercializing conversion of the above-mentioned biomass residues into ethanol
and SNG plus electricity and steam.
The production of various fuels and chemicals from biomass through the syngas
platform in a biorefinery concept is illustrated in Fig. 1.2.
Fig. 1.2: Products from syngas

4
The indirect gasification technology has seen a rapid development in the last
decade and several commercial plants for CHP production have been built. This
technology can use inhomogeneous and moist biomass as a source for gasification.
This means that this technology is a good candidate to be integrated into a
mechanical pulping mill where the gasifier can utilize low quality fiber material
and wood residuals from the pulp and paper production process. The specific
objective in this study is to develop a set of mathematical models reliable for
evaluating and optimizing the production lines from biomass to electricity and
transport fuels. The work includes:
1. Developing a mathematic model to predict the performance of an indirect
biomass gasifier. Tar evolution during gasification is taken into account. It
is also significant to estimate how much extra biomass is needed to feed in
the combustor to hold a normal gasification temperature level against the
biomass moisture content;
2. Developing a mathematic model to evaluate a case in which BIGCC with
efficiency close to 50% will be introduced into a TMP mill for electricity
production, instead of CHP, with efficiency less than 30%, being
introduced. An economic analysis will be conducted in 3 cases: 1) adding
more forest biomass logging residues in the gasifier, 2) adding the reject
fibres in the gasifier, and 3) decreasing the TMP-specific electricity
consumption (SEC) by up to 50%;
3. Developing a mathematic model to perform a techno-economic evaluation
of a process producing bio-ethanol from biomass via a gasification-
synthesis pathway. Heat integration will be paid attention to;
4. Developing a mathematic model applied to evaluate a case in which a
Biomass-to-SNG route via a gasification-synthesis pathway will be
implemented in a TMP mill. The implementation of BtSNG will be
compared with that of BIGCC. The reciprocal utilization of energy will be
investigated.

5
1.2 Content description
Chapter 2 presents the background of DFBG (Paper I), syngas preparation (Paper II),
biomass-to-ethanol (Paper III), TMP+BIGCC (Paper IV) and TMP+BtSNG
(Paper V);
Chapter 3 describes the biomass conversion processes and the evaluation methods.
Section 3.1 describes the MIUN DFBG system (Paper I). Section 3.2 describes
a biomass-to-ethanol process and the techno-economic evaluation method
(Paper III). Section 3.3 describes a TMP+PM process. Section 3.4 describes a
TMP+BIGCC process and the techno-economic evaluation method (Paper IV).
Section 3.5 describes a TMP+BtSNG process and the techno-economic
evaluation method (Paper V);
Chapter 4 presents a review of the main results presented in papers I–V. Section 4.1
presents the predicted performance of a DFBG gasifier (Paper I). Section 4.2
presents the results of a techno-economic evaluation of a biomass-to-ethanol
process (Paper III). Section 4.3 presents the results of a techno-economic
evaluation of a TMP+BIGCC process (Paper IV). Section 4.4 presents the
results of a techno-economic evaluation of a TMP+BtSNG process (Paper V);
Chapter 5 presents the main conclusions from this thesis;
Chapter 6 suggests future work about fuel cell and DME.

6
2 BACKGROUND
This chapter presents the background of DFBG (Paper I), syngas preparation (Paper II),
biomass-to-ethanol (Paper III), TMP+BIGCC (Paper IV) and TMP+BtSNG (Paper V).
2.1 DFBG
The DFBG (also referred to as indirect or allothermal gasifier), with steam as the
gasification agent, can be used to produce a syngas of 12–20 MJ/Nm3 (LHV), which
is the appropriate syngas for the downstream synthesis of transportation fuels and
chemicals. The gasifier consists of two separate reactors: a steam gasifier used to
convert biomass into syngas, and an air combustor used to burn the char and to
provide the necessary heat for biomass steam gasification. A typical DFBG is
composed of a BFB (bubbling fluidized bed) and a CFB (circulating fluidized bed).
In comparison with auto-thermal pressurised gasifiers, the advantages of DFBGs
are (Zhang 2010):
no oxygen demand to obtain nitrogen-free syngas;
low temperature operation;
low investment cost;
no or simple pre-treatment of biomass;
easy feeding of biomass;
suitable for the biomass-based S/M scale bio-automotive fuel plants.
For biomass, a small or medium scale bio-automotive fuel plant close to the
feedstock resources is preferable as this kind of feedstock is widely sparse and has
relatively low density, low heating value and high moisture content (Zhang W,
Forsman B et al. 2005). An oxygen production system costs about the same as the
gasification system, and is too expensive for a small biomass-based plant. For a
DFB gasifier, no oxygen and pressurization are required, which makes the gasifier
robust and cost-efficient for small-scale.
Syngas mainly consists of CO and H2. In addition, it contains CO2, CH4, H2O, trace
amounts of higher hydrocarbons (tars), and possible inert gases. An expensive
cleaning process is generally required for syngas production towards automotive
fuels synthesis. Reduction of tar/CH4 in the syngas is a major challenge to the
commercialization of DFBGs for synthetic fuels production. Tar condenses with
temperature (below 400 ℃), which leads to knotty problems to the downstream
processes. The problems are e.g., fouling and blocking of filters and pipeline
passages, dirty working environment, heavy waste water treatment, poisoning of
7
catalyst in synthesis reactors, etc. Moreover, tar results in a part of energy lost from
the syngas.
Reduction of tars and CH4 to an acceptable low level is usually achieved by
thermal cracking with or without catalyst, or physical tar treatment like water or
oil scrubbing. Catalysts can be used directly inside a gasifier. An internal
reforming method is more cost-effective than a secondary downstream method
(Göransson 2014). Tar/CH4 catalytic reforming performance might be improved by
more intensive contact between the gases and catalytic bed material.
Göransson et al. (Göransson, Söderlind et al. 2011; Göransson 2014) have being
conducting a research in syngas cleaning, especially, the reforming of tars and CH4.
The work investigates catalytic bed material and an internal reformer in the MIUN
gasifier.
The main function of bed material in a DFBG is to supply the gasification zone
with energy for conversion of biomass (Göransson 2014). Reactive bed materials
can be applied to improve agglomeration behaviour, to enhance tar cracking, and
to increase H2 content. Catalytic reforming can be performed either with catalytic
bed material during gasification or after gasification by using a separate,
downstream catalytic reactor. There is a great interest in using in-bed additives
since complex downstream cleaning methods can be simplified.
For bed materials used in DFBGs, examples of natural minerals are dolomite,
limestone, olivine and iron ores, and examples of synthetic minerals are Ni-
supported olivine, Fe-supported olivine, alkali metal-based materials, and char
(Pfeifer, Rauch et al. 2004; Göransson 2014). Sulphur substances (H2S, COS, etc.)
can be retained (up to 90%) by sorbents such as limestone (Zhang, Söderlind et al.
2007).
For the R&D of DFBG technology, a great deal of effort has been contributed to the
experimental study. Very little work can be found on the mathematic simulation,
especially, the simulation on tar evolution in biomass gasification.
In coal industry, a chemical percolation devolatilization (CPD) model was
developed to model coal devolatilization based on characteristics of the chemical
structure of the parent coal. The direct use of chemical structure data as a function
of coal properties is useful to justify the model on a theoretical basis rather than an
empirical basis. Fletcher (Fletcher) made a contribution to the CPD model
development. The predictions of the amount and characteristics of syngas and tar

8
fit well with available measurement data. The application of CPD model to
biomass has not been seen to a certain extent.
ASPEN Plus is often used to simulate the coal/biomass conversion processes.
Sotudeh-Gharebaagh et al. (Sotudeh-Gharebaagh, Legros et al. 1998) used it to
predict coal combustion in a CFB combustor regarding combustion efficiency,
emission levels of CO, SO2, and NOx, as well as concentration profiles of O2 and
CO. Lee et al. (Lee, Kim et al. 1998) presented the kinetic expressions for steam–
char and oxygen–char reactions in the atmospheric coal gasification in a fluidized
bed reactor. These expressions were cited by Nikoo et al. (Nikoo and Mahinpey
2008) in the biomass gasification simulation with ASPEN Plus. Doherty et al.
(Doherty, Reynolds et al. 2009) developed a simple model with ASPEN Plus for the
simulation of biomass gasification with steam and air in a CFB gasifier. Parameter
sensitivity analyses, especially the effect of air preheating on gasification, were
performed. The result is plausible. Corella et al. (Corella and Sanz 2005) set up a
model for atmospheric biomass gasification in a CFB gasifier. In this model, the
hydrodynamics and reaction kinetics aspects were considered, and the issues on
the tar formation and reduction were discussed. On the basis of this model, Corella
et al. (Corella and Sanz 2005) investigated the axial profiles of temperature, and the
concentrations of ten different substances (H2, CO, CO2, tar, char…). However, the
details have not been presented.
In this work, biomass gasification with steam in a DFBG is simulated by taking
care of the evolutions of tar and char. Some subroutines are designed based on
relevant empirical equations from literature. The sub-models are set up based on
the thermodynamics and reaction kinetics. The yield and composition of the
syngas, and the contents of tar and char can be calculated from the model. The
concerned variables are: structure of the gasifier, gasification temperature (T),
steam to biomass mass ratio (S/B), and biomass moisture content (M), gasification
residence time (τ) and biomass/char particle size (dp). The model is evaluated
against the experimental results measured on a 150 KWth MIUN DFBG.
9
2.2 Biomass-to-Ethanol
In the transport sector, energy consumption accounts for more than 30% of the
total energy supply in developed countries, which is 98% dependent on fossil fuel
and difficult to be replaced with sustainable and CO2 neutral bio-automotive fuel
in the transport fuel market. Bio-ethanol is the major bio-automotive fuel today,
and is rapidly expanding as a fuel additive in addition to its use as a chemical raw
material. It is already commonly used in gasoline blended with 10% ethanol, and
can be blended up to 85% by flexible fuel technology (Piccolo and Bezzo 2009).
Through on-board reforming to hydrogen, ethanol is also suitable to be applied in
future fuel cell vehicles (Hamelinck, Hooijdonk et al. 2005). As an alternative to
methyl tert-butyl ether (MTBE) which raises serious health risks, ethanol enhances
octane rating of gasoline and reduces emissions of CO, VOC (volatile organic
carbon) and particulates (Hamelinck, Hooijdonk et al. 2005).
Ethanol is commercially produced via two routes, hydrolysis-fermentation of
sugars from corn or sugar cane and hydration of petroleum-based ethylene. The
ethylene hydration route is unattractive for large-scale ethanol production, which
is dependent on imported crude oil and the volatile price of crude oil. Bio-ethanol
feedstock can be divided into two major groups, sugar/starch materials and
lignocellulosic biomass. Ethanol produced from sugar/starch materials is referred
to as the 1st generation bio-automotive fuel (Zhang 2010). However, with regard to
raw material potential, sustainability, fossil fuel consumption, farmland
occupation, conflict with productions of food and high value chemicals, as well as
net CO2 emission, bio-ethanol produced from lignocellulosic biomass is more
attractive, which is referred to as the 2nd generation bio-automotive fuel.
Production of the 2nd generation bio-automotive fuels is too expensive at present
due to complex conversion process and its demands on large scale and big
investment. However, the production cost is expected to drop down as the
lignocellulosic biomass feedstock is cheap, abundant, and does not compete with
food production. Lignocellulosic biomass is envisaged to provide a significant
portion of the raw materials for bio-ethanol production in the medium and long-
term.
Lignocellulosic biomass can be converted into bio-ethanol by gasification-synthesis,
gasification-fermentation, and hydrolysis-fermentation. In the hydrolysis-
fermentation route, the biomass-to-ethanol conversion efficiency is fairly low since
25--30 wt % biomass as lignin cannot be broken down, and hydrolysis of cellulose
and hemicellulose is difficult. A significant portion of 5-carbon sugars from
hemicellulose hydrolysis cannot be completely metabolized into alcohol. Further
achievements strongly depend on the development of cheaper and more efficient
enzymes and microorganisms (Rajagopalan, P Datar et al. 2002; Younesi,

10
Najafpour et al. 2005; Sassner, Galbe et al. 2008; Zheng, Pan et al. 2009). The techno-
economic assessment of production of ethanol (hydrolysis-fermentation) from
lignocellulosic biomass has been made (Murphy and McCarthy 2005; Balat and
Balat 2009; Yu and Tao 2009; Eriksson and Kjellström 2010; Qiu, Huang et al. 2010;
Starfelt, Thorin et al. 2010; Naqvi, Yan et al. 2012).
In the gasification-synthesis route, biomass is gasified into raw syngas which is
further reformed, cleaned, compressed, heated and converted into mixed alcohols
from which ethanol and higher alcohols are obtained through a series of separation
and purification treatments. This route has the following advantages — short
reaction time, inexpensive and abundant raw materials, nearly complete biomass
conversion and so on. However, commercialization of catalytic synthesis of ethanol
from syngas is under development (Subramani and Gangwal 2008).
On the other hand, catalytic synthesis of methanol from H2 + CO is an existing
commercially available technology. It is evaluated (Kumabe, Fujimoto et al. 2008)
that MeOH yield is 0.31 Kg MeOH per Kg dry biomass (Japanese cedar 400 t dry/d),
the production cost lies between 12.8 and 78.0 U/m3 MeOH, and the energy
recovery rate is 31% (higher than the wood-to-power generation efficiency 22%).
The lowest production cost is achieved when the shortfall of heat and power is
compensated by an auxiliary CHP plant fed with biomass, char, off-gas, etc.
The present work aims at commercial ethanol production via thermo-chemical
route in the near future. The thermo-chemical process is designed, simulated and
optimized. Techno-economic evaluation is conducted in terms of ethanol yield,
synthesis selectivity, carbon and CO conversion efficiencies, and ethanol
production cost. Sensitivity of the important techno-economic parameters is also
analyzed.
11
2.3 TMP+BIGCC
Paper mill with thermomechanical pulp (TMP) process has a very high wood-to-
pulp/wood-to-paper yield (> 95%), but consumes a large amount of electricity
(about 2.5 MWh per tonne of pulp). As a TMP-process normally is integrated with
paper production, and electricity consumed in the refining process is
simultaneously utilized to obtain steam and hot water, one can say that the electric
power is used twice, first to produce the pulp and then to produce steam for
drying paper. Chemical pulp mill producing bleached softwood Kraft can be self-
sufficient in both heat and electric energy use, but has a low wood-to-pulp yield
(45%). Lignin, extractives, and most of the hemicellulose, which make up about
half of the pulp wood, are dissolved to become black liquor, which is incinerated to
produce steam and electricity. This way, black liquor has become the most
important bioenergy source in the pulp and paper industry and also the largest
bioenergy source presently in Sweden. A focus has been on the technology
development on black liquor gasification for the cogeneration of heat and power
(Berglin and Berntsson 1998; Eriksson and Harvey 2004; Harvey and Facchini 2004;
Holmberg and Gustavsson 2007; Naqvi, Yan et al. 2010; Naqvi, Yan et al. 2012). On
the other hand, very little development has been accomplished for gasification-
based cogeneration of heat and power in the context of a TMP mill.
The pulp quality possible to achieve by means of mechanical pulping processes is a
prerequisite for producing printing paper and paperboard, especially due to their
important functional properties of these products, such as printability and stiffness.
In the Nordic countries, a larger share of paper production uses mechanical pulp
than anywhere else in the world (Ruohonen and Ahtila 2011). Energy-efficient
refining has been an important research subject for a long period of time
(Engstrand, Hammar et al. 1991; Baeck, Danielsson et al. 1994; Sabourin 1999;
Engstrand, Jonsson et al. 2002; Norgren and Höglund 2009; Gorski, Hill et al. 2010;
Muhic, Sundström et al. 2010). The institute of Fibre Science and Communication
Network (FSCN) at Mid Sweden University, together with Scandinavian forest and
supplier companies, the Pulp and Paper Research Institute (PFI), and other
Scandinavian universities, is working with a large research program with the goal
of showing how to design the TMP and chemithermomechanical pulp (CTMP)
mills of the future. It is possible to reduce 50% of the specific electricity
consumption (SECR). Today, a large part of biomass such as the logging residues
(branches and tree tops), is normally not utilized as a source of bioenergy.
Furthermore, the possibility of utilizing the fibre material that has negative
influence on the final product properties as a source of bioenergy has not been
evaluated. Normally, only the bark, shavings, and bio-sludge are utilized in
present bark boilers of CHP systems of mechanical pulp mills. It is also important

12
to explore the potential of achieving cost-effective and energy-efficient heat and
power production from those biomass residues, especially for a TMP mill.
The back-pressure system with a steam turbine is popular in TMP mills. This
system has low electricity generation efficiency less than 30%. In comparison, a gas
turbine system has the efficiency up to 40%; while a biomass integrated gasification
combined cycle (BIGCC) may reach the efficiency up to 50%. Implementing BIGCC
to a TMP mill may create significant potential for self-sufficient electricity and for
more economic benefit to the mill.
Ong’iro, et al. (Ong'iro, Ugursal et al. 1995; Ong'iro, Ugursal et al. 1996) developed
several models to study the effects of design and operation parameters on the
energy efficiency of a coal-based integrated gasification combined cycle (CIGCC)
and on the efficiency of an integrated gasification humid air turbine cycle,
respectively. A thermodynamic model of a combustion power plant was also
developed with ASPEN Plus to evaluate the thermodynamic feasibility of the
cogeneration with a higher ratio of electricity to heat. Using ASPEN Plus, Emun et
al. (Emun, Gadalla et al. 2010) simulated a CIGCC, and pointed out that the overall
energy efficiency can approach to 45%. Eriksson and Kjellström (Eriksson and
Kjellström 2010) performed a techno-economic analysis over a CHP plant process
integrated into a wood-based ethanol production process. They claimed that the
utilization of the residues from an ethanol production plant process through a
CHP system was the most promising of all. For a CHP process, the annual fixed
operation cost was assumed to be 2% of the total investment, and the capital
investment was only about 10% of the total cost of a wood-based ethanol
production process (Eriksson and Kjellström 2010).
In the present study, a BIGCC model, special for a combined TMP+BIGCC system, is
set up with ASPEN Plus. The syngas is produced from the biomass residues,
collected at a pulpwood logging site, and the rejects from a TMP mill, by means of
a dual fluidized bed gasifier (DFBG) system. A BIGCC system consists of a gas-
and steam-turbine cycles. The obtained syngas will fuel the gas-turbine cycle,
while the steam used in a papermaking (PM) process is withdrawn from the
coupled steam cycle.
A techno-economic analysis is performed on the basis of this modelling. Three
cases are studied:
1) adding more forest biomass logging residues in the gasifier;
2) adding the reject fibres in the gasifier;
3) decreasing the TMP-specific electricity consumption (SEC) by up to 50%.

13
The production profits are evaluated. The economic benefit from a TMP+BIGCC mill
is compared with that from a TMP+CHP mill.
2.4 TMP+BtSNG
The possibility of producing transportation fuels from biomass and wastes has
been a more and more important issue with regard to the challenges of energy
security and climate change.
The present transport biofuels in the market are produced mainly from food crops,
referred to as the 1st generation biofuels, which are not encouraged any longer.
From the viewpoint of economics, environment, land use, water use, chemical
fertilizer use, etc., however, there is a strong preference for the 2nd generation
biofuels that are produced from woody, grassy materials as well as agricultural
residues, municipal wastes and industrial wastes as the feedstock. Thus, the
production of the synthetic transport fuels such as methanol, ethanol, dimethyl-
ether (DME), Fischer-Tropsch (FT) fuel and SNG via gasification and synthesis is
promising (Zhang 2010). Production of these fuels from coal and natural gas has
been well commercialized e.g., by Sasol and Mobil (Dry 2002). For biomass,
however, the technology has not been established mainly due to the high
production cost against a limited scale of biomass-based plant.
Among the above mentioned fuels, Bio-SNG can be produced easily since the once
through methanation conversion efficiency is high even at a moderate condition,
and a sophisticated upgrading of products is not needed. Thus, Biomass to SNG
(BtSNG) can be realized commercially with a small & medium scale of around 100
MW.
For an extremely small scale, the German company, Agnion, offers bio-SNG plants
based on a heat-pipe reformer concept with a capacity of approximate 3 MW bio-
SNG (Held 2013). The isothermal fluidized bed methanation developed at Paul
Scherrer Institute (PSI) and commercialized by Clean Technology Universe (CTU)
was demonstrated with a scale of 1 MW in Güssing in 2009. A larger scale
demonstration plant of 20 MW bio-SNG output has been put into operation at the
beginning of 2014 in Gothenburg as the GoBiGas project, which is scheduled to
scale up to 100 MW bio-SNG plant. A bio-SNG plant of 200 MW is planned in the

14
E.ON Bio2G project. Depending on technology, scale, and energy prices, the most
economic configuration may provide a net SNG yield of 66 to 75% from wood
(based on LHV of the dry substance) at 50 wt.% moisture content, and the poly-
generation of fuel, heat, and power allows for a total useful energy yield ranging
from 71 to 91% (Gassner and Marechal 2012).
Bio-SNG can be used in a variety of applications:
Grid injection;
Vehicle fuel;
Chemical feedstock;
Fuel for electricity or heat production.
In Sweden, biogas produced from waste treatment through digestion has been
used as vehicle fuel in the market. The scale expands rapidly up to about 1 TWh in
recent years. This provides an excellent opportunity for cost-effective co-
production of biogas and bio-SNG with respect to the gaseous fuel infrastructure
and the synergy in the gas cleaning and upgrading processes.
In the present study, the feasibility of biomass gasification-based technology to
produce CH4, in a TMP mill is evaluated and compared with TMP+BIGCC in terms
of the technical and economic aspects. Fig. 2.1 schematically shows two designed
systems integrated with a TMP mill.
Fig. 2.1: Two designed systems integrated with a TMP mill respectively

15
3 PROCESS AND MODELING
This chapter describes the biomass conversion processes and the evaluation methods.
Section 3.1 describes the MIUN DFBG system (Paper I). Section 3.2 describes a biomass-
to-ethanol process and the techno-economic evaluation method (Paper III). Section 3.3
describes a TMP+PM process. Section 3.4 describes a TMP+BIGCC process and the
techno-economic evaluation method (Paper IV). Section 3.5 describes a TMP+BtSNG
process and the techno-economic evaluation method (Paper V).
3.1 DFBG
3.1.1 DFBG
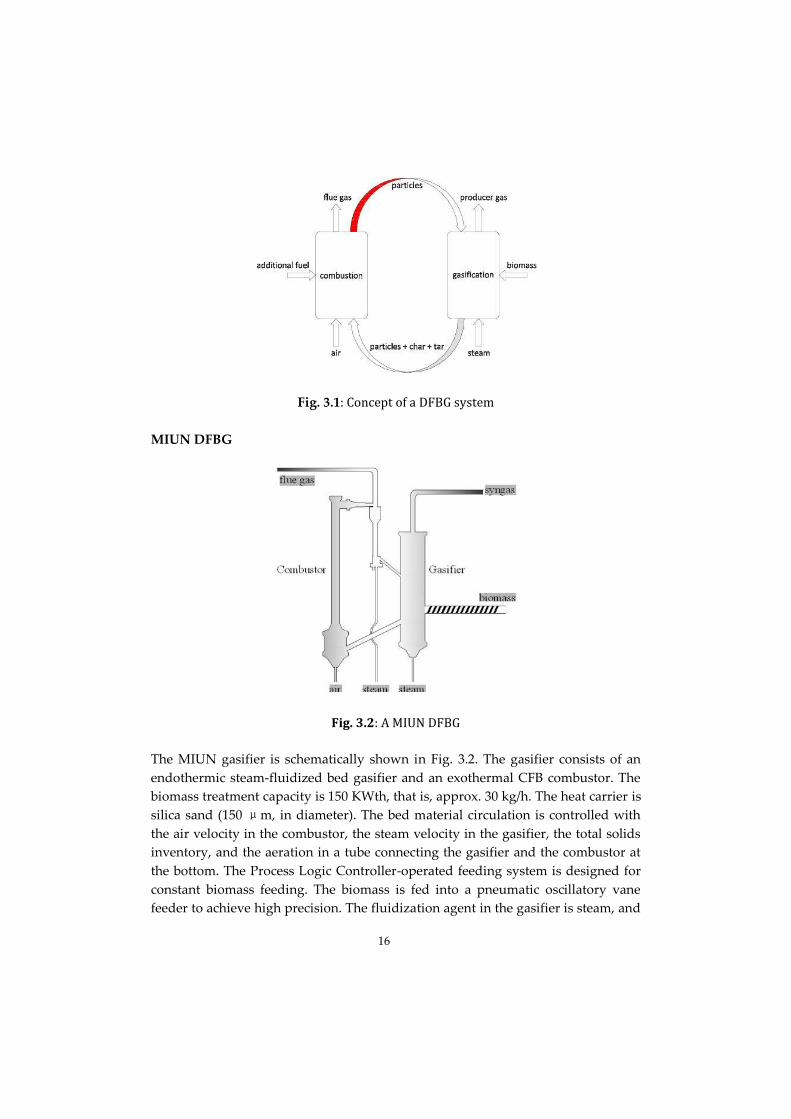
A DFBG consists of two beds (Fig. 3.1). One is blown with steam to gasify biomass
and to produce syngas. The other is blown with air to burn char to produce heat.
Bed material is circulated to transfer heat from combustion bed to gasification bed.
Flue gas is prevented from mixing with the produced syngas. Since air is not
injected into the gasifier directly, N2-free syngas can be obtained. The temperatures
in the reactors are maintained by the char combustion and bed material
recirculation. Some options for DFBG technology are possible from different
combinations of the BFB and the CFB. So far, the most attractive design is
supposed to have biomass gasification in the BFB and char combustion in the CFB
from the viewpoints of particle circulation, fuel conversion, tar cracking, etc. Some
typical combination (gasifier/combustor) examples are BFB/CFB (Güssing
(Hofbauer, Veronik et al. 1997; Fercher, Hofbauer et al. 1998; Pfeifer, Rauch et al.
2004), Trisaia (Foscolo 2007), CAPE (Brown 2006), Chalmers (Seemann and
Thunman 2009; Heyne 2010), MIUN (Zhang 2010; Göransson, Söderlind et al. 2011;
Göransson, Söderlind et al. 2011)), CFB/BFB (MILENA (van der Meijden, Bergman
et al. 2010; Zwart, van der Heijden et al. 2010)), and CFB/CFB (SilvaGas (Paisley,
Corley et al. 2007; Tarka, Wimer et al. 2009), Taylor (Paisley, Corley et al. 2007)).
The measured H2/CO ratios range from 0.45 (SilvaGas) to 3.5. The CH4
concentration is generally around 10.0 vol. %. The tar contents range from 0.5
g/Nm3 (Trisaia, Güssing) to 32.0 g/Nm3 (MIUN, Milena). The measurement data
are scattering in a wide range. Similar summaries can be found (Göransson,
Söderlind et al. 2011; Göransson, Söderlind et al. 2011; He, Göransson et al. 2012).
16
Fig. 3.1: Concept of a DFBG system
MIUN DFBG
Fig. 3.2: A MIUN DFBG
The MIUN gasifier is schematically shown in Fig. 3.2. The gasifier consists of an
endothermic steam-fluidized bed gasifier and an exothermal CFB combustor. The
biomass treatment capacity is 150 KWth, that is, approx. 30 kg/h. The heat carrier is
silica sand (150 μm, in diameter). The bed material circulation is controlled with
the air velocity in the combustor, the steam velocity in the gasifier, the total solids
inventory, and the aeration in a tube connecting the gasifier and the combustor at
the bottom. The Process Logic Controller-operated feeding system is designed for
constant biomass feeding. The biomass is fed into a pneumatic oscillatory vane
feeder to achieve high precision. The fluidization agent in the gasifier is steam, and

17
the syngas is drawn off from the top of the gasifier. The residual biomass char is
transferred along with bed material into the combustor through the lower pressure
lock. In the combustor, the fluidization agent is air participating in the char
combustion (950–1050 ℃). The hot bed material is separated from the flue gas
through a cyclone and recycled into the gasifier through the upper pressure lock
(loop seal pot) which is designed to prevent gas leakage. The heights of the gasifier
and combustor are 2.5 m and 3.1 m, and the inner diameters are 300 and 90 mm,
respectively. It is 0.7 m from the surface of bed material to the distributor, and
about 0.2 m to the feeding point. The experiments were carried out at 750 ℃, 800 ℃,
and 850 ℃, respectively. The steam input into the gasifier was held at 4.0 kg/h.
Wood pellets are from SCA BioNorr AB. The S/B ratios are 0.3, 0.6, and 0.9,
respectively. The details on experiments have been reported elsewhere (Göransson,
Söderlind et al. 2011; He, Göransson et al. 2012).
3.1.2 Simulation
Fig. 3.3: Flowsheet of a DFBG biomass gasification model
ASPEN Plus consists of various sub-models simulating various unit operations. It
can be used to model complicated chemical engineering systems. Equations and
data for the calculations are accessed from ASPEN Plus databases. Customized
models can be created to extend the capability of ASPEN Plus. Here, the RGibbs
module was mainly adopted. The RGibbs module performs calculations according
to the Gibbs free energy theory. Some subroutines are integrated for simulating
biomass devolatilization and the evolutions of tar and char. Relevant empirical

18
correlations (Lee, Kim et al. 1998; Fagbemi, Khezami et al. 2001; Kiel, Van Paasen et
al. 2004; Corella and Sanz 2005; Nikoo and Mahinpey 2008) are adapted and
employed in the subroutines. As illustrated in Fig. 3.3, this model consists of four
sections. The bed materials are not considered in the phase and chemical equilibria
calculations. Qcg denotes a stream of heat carried by bed material. With respect to
tar and char, as nonconventional components, the calculations will be conducted
independently from using the database in ASPEN Plus. S/B is calculated according
to:
(3-1)
where, denotes the mass flow (kg/s). A number of hypotheses for the model are
listed:
the process is of steady state;
the biomass feedstock and bed materials are fed at an uniform temperature;
ash as well as bed materials are inert;
the char particles are spherical and of uniform size;
the mixing of solid particles is perfect;
the combustion and gasification of biomass are described by the shrinking
core model.

19
3.2 Biomass-to-Ethanol
3.2.1 Process
In the gasification–synthesis route, biomass is gasified into raw syngas which is
further reformed, cleaned, compressed, heated and converted into mixed alcohols
from which ethanol and higher alcohols are obtained through a series of separation
and purification treatments. Advantages of this route include a short reaction time,
inexpensive and abundant raw materials, high conversion rate, etc (Kumabe,
Fujimoto et al. 2008; Subramani and Gangwal 2008).
The process consists of five steps: biomass pre-treatment, gasification, syngas
cleaning and conditioning, alcohols synthesis, and separation. Fresh biomass needs
pre-treatment. Weighed wood chips are screened. Metal debris is removed using a
magnetic separator. Particles larger than 10 mm are conveyed to a hammer mill for
further size reduction. By direct contact with the hot flue gas, wet biomass is dried.
Gasification is carried out in DFBG. Particles from raw syngas are separated. A
small amount of MgO is added to raise the ash melting point and to avoid the
agglomeration that would result from the interaction of biomass potassium with
silicate compounds. The composition and quality of syngas from the biomass
gasifier are dependent on a number of factors. Syngas with H2/CO molar ratio of 1–
2 is suitable for ethanol synthesis. Raw syngas contains various impurities which
are potential threats to ethanol synthesis catalysts. Tars are cracked. Additional CO
and H2 are formed. Additional cooling is done via water scrubbing, and impurities
such as particulates, residual tars, and ammonia are further reduced. Subsequently,
in a five-stage compressor, the syngas is compressed to 29 bar. NH3 and H2O are
condensed. Afterwards, acid gases (CO2 and H2S) removal is carried out in an
amine system. Other sulphurous compounds—if contained in raw syngas, will be
converted into H2S. The presence of some CO2 (about 5.0 vol.%) is necessary for the
function of a methanol synthesis catalyst, and may also be advantageous for
ethanol synthesis. After cleaning, syngas is compressed and pre-heated to the
synthesis conditions of 100 bar and 300 ℃. Synthesis is completed in seconds or
minutes, and the product is cooled and initially purified to separate out the
unconverted syngas. Mixed alcohols are de-gassed, dried, and separated into
ethanol and higher alcohols. In a flash separator, alcohols are separated from off-
gas, and off-gas is diverted to a gas cleaning section. Since the recycled gas is at
high pressure, it is further heated and applied to generate extra electricity. The
depressurized alcohols stream is dehydrated with a molecular sieve and then sent
to the main distillation column. The overhead is further processed in the second
column to get high-purity ethanol. The obtained methanol/water mixture is

20
recycled for alcohols synthesis. The biomass-to-ethanol process is designed to be
energy self-sufficient.
3.2.2 Evaluation
Fig. 3.4: Block flow diagram of a biomass-to-ethanol process
Before setting up the model, an optimal thermo-chemical biomass-to-ethanol
process is designed (Fig. 3.4). In the process, off-gas and MeOH from ethanol
synthesis and separation steps are recycled to increase conversion efficiency. A
CHP plant is integrated from economic and environmental points of view.
The cost of equipment can be estimated by:
(3-2)
(3-3)
Here, “n” denotes the characteristic scaling exponent of either the overall plant or a
single piece of equipment. Typically, “n” equals 0.6, that is, “0.6 exponent method”.
“n” has different referential values for different processes and types of equipment.
Equipment installation cost is estimated to be 1.45 times equipment purchase cost.
Operation cost consists of fixed and variable operation costs. Labour cost equals
national per capita income multiplied by a factor of 1.2. Variable operation cost is
calculated according to the stream flow rate. Price of cost item equals the temporal
market price at the time when economic analysis is performed. Biomass
procurement cost is set as 60 €/dry tonne. The fixed operation cost is supposed to
stay invariable within a certain range, while variable operation cost is varied with
the production scales. Since capital recovery charge is related to capital investment,
“0.6 exponent method” is adopted to calculate the charge. Once total capital and
operation costs are determined, ethanol production cost is calculated by
“discounted cash flow analysis” when the NPV is zero.
21
3.3 TMP+PM
A typical flowsheet of TMP process (Fig. 3.5) can be found in the literature
(Sundholm, Yhdistys et al. 1999). Some of the input data to this model are from a
TMP+PM mill, Hallsta, Holmen Paper (Pettersson 2005). Biomass residues from a
TMP+PM mill are traditionally utilized through a CHP plant to supply the mill
electricity and steam. The original CHP plant is intended to be replaced by a
BIGCC plant.
Available biomass residues from a TMP plant are significant and include: 1)
logging residues, amounting to 30% of the tree; 2) bark, 12% of the stem, 3) bio-
sludge, 2% of the pulpwood, and 4) reject fibres, 10% of the pulp. Fig. 3.5 implies
that 0.7 tonne of biomass residues are available from the production of each tonne
of pulp. Additional biomass (including peat) can be gained from other applications
such as the production of chemical pulp, construction of woody structures, etc.
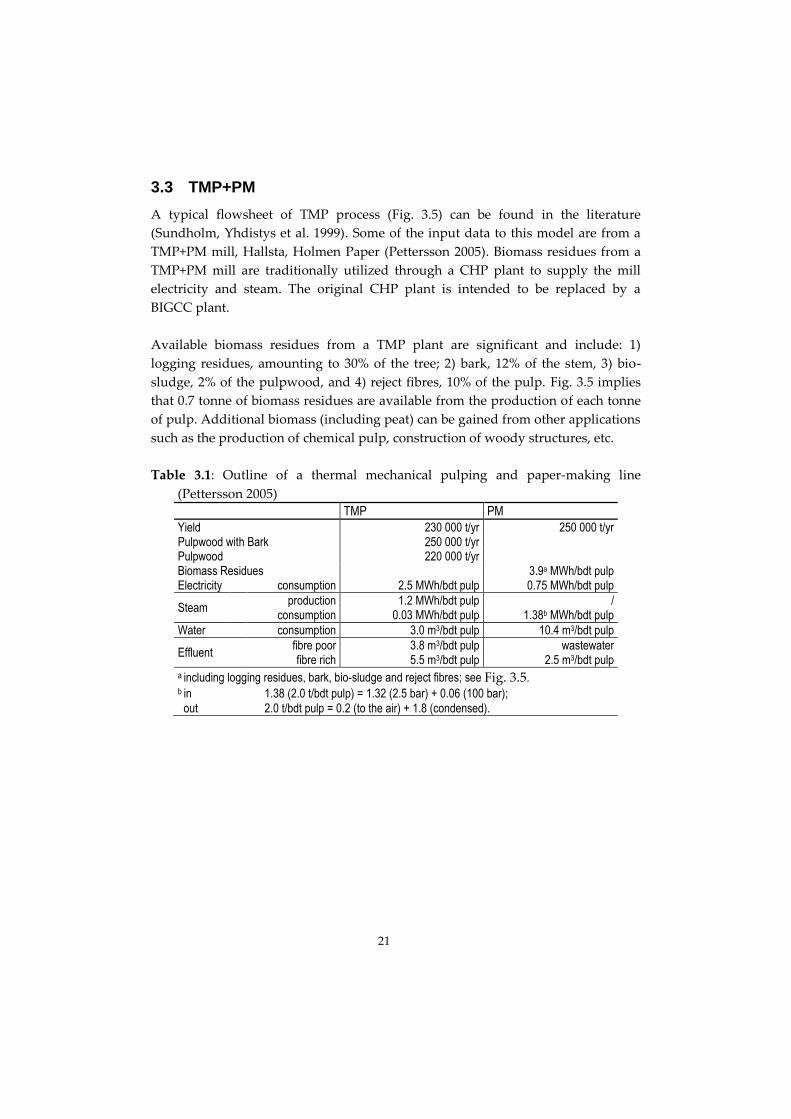
Table 3.1: Outline of a thermal mechanical pulping and paper-making line
(Pettersson 2005)
TMP PM
Yield 230 000 t/yr 250 000 t/yr Pulpwood with Bark 250 000 t/yr Pulpwood 220 000 t/yr Biomass Residues 3.9a MWh/bdt pulp Electricity consumption 2.5 MWh/bdt pulp 0.75 MWh/bdt pulp
Steam production 1.2 MWh/bdt pulp /
consumption 0.03 MWh/bdt pulp 1.38b MWh/bdt pulp
Water consumption 3.0 m3/bdt pulp 10.4 m3/bdt pulp
Effluent fibre poor 3.8 m3/bdt pulp wastewater
2.5 m3/bdt pulp fibre rich 5.5 m3/bdt pulp a including logging residues, bark, bio-sludge and reject fibres; see Fig. 3.5. b in 1.38 (2.0 t/bdt pulp) = 1.32 (2.5 bar) + 0.06 (100 bar);
out 2.0 t/bdt pulp = 0.2 (to the air) + 1.8 (condensed).

22
Fig. 3.5: Flowsheet of a typical TMP–PM process
23
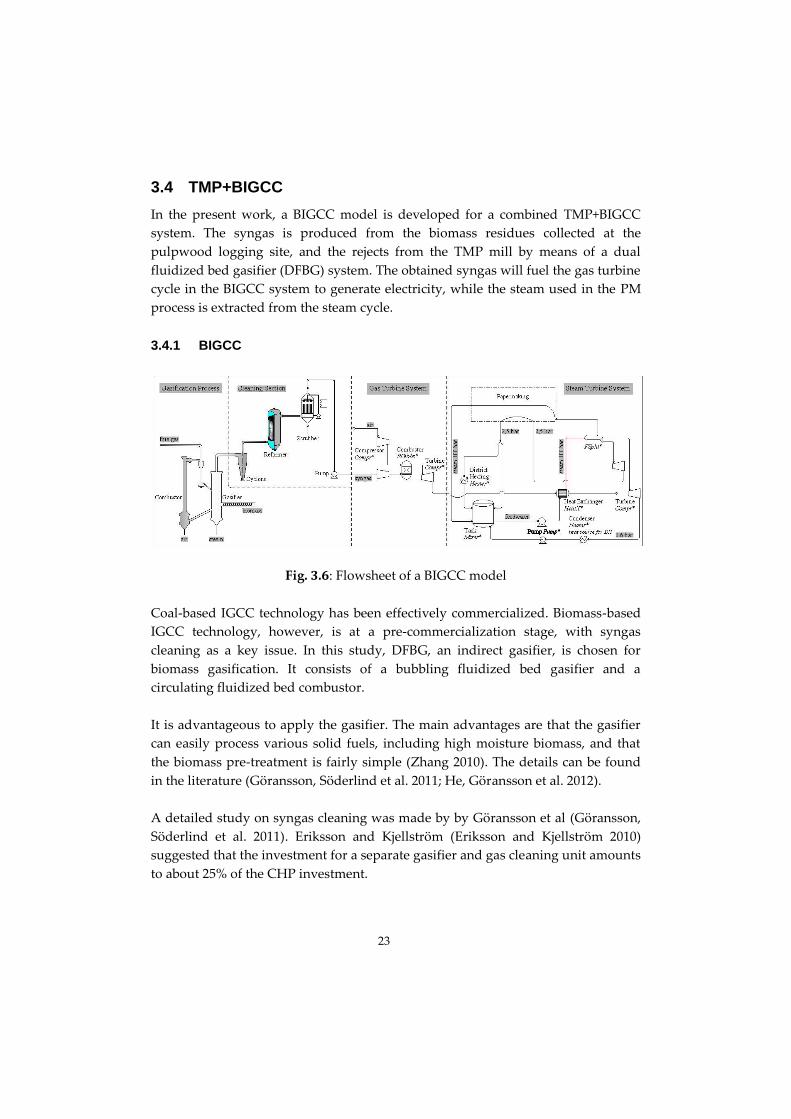
3.4 TMP+BIGCC
In the present work, a BIGCC model is developed for a combined TMP+BIGCC
system. The syngas is produced from the biomass residues collected at the
pulpwood logging site, and the rejects from the TMP mill by means of a dual
fluidized bed gasifier (DFBG) system. The obtained syngas will fuel the gas turbine
cycle in the BIGCC system to generate electricity, while the steam used in the PM
process is extracted from the steam cycle.
3.4.1 BIGCC
Fig. 3.6: Flowsheet of a BIGCC model
Coal-based IGCC technology has been effectively commercialized. Biomass-based
IGCC technology, however, is at a pre-commercialization stage, with syngas
cleaning as a key issue. In this study, DFBG, an indirect gasifier, is chosen for
biomass gasification. It consists of a bubbling fluidized bed gasifier and a
circulating fluidized bed combustor.
It is advantageous to apply the gasifier. The main advantages are that the gasifier
can easily process various solid fuels, including high moisture biomass, and that
the biomass pre-treatment is fairly simple (Zhang 2010). The details can be found
in the literature (Göransson, Söderlind et al. 2011; He, Göransson et al. 2012).
A detailed study on syngas cleaning was made by by Göransson et al (Göransson,
Söderlind et al. 2011). Eriksson and Kjellström (Eriksson and Kjellström 2010)
suggested that the investment for a separate gasifier and gas cleaning unit amounts
to about 25% of the CHP investment.

24
The cleaned syngas will be combusted to generate electricity through a gas turbine
system. The exhausted high temperature flue gas flows through a heat exchanger.
The steam (100 bar 565 C) can be therefore afforded, and expands through a steam
turbine cycle from 100 bar to 0.6 bar to generate extra electricity. Simultaneously, a
certain amount of 2.5 bar steam is withdrawn to PM. Besides, the 2.5 bar steam
from TMP has been provided to PM.
For comparison, TMP+Boiler and TMP+CHP are also modelled, respectively. The
available amount of heat energy for a district heating (DH) system is calculated
with the model. Additionally, for the TMP+Boiler case, it is assumed that 50% of
the energy after the production of steam is utilized in DH. Table 3.2 lists the model
input data.
Table 3.2: Model input data (Göransson, Söderlind et al. 2011; He, Göransson et al.
2012)
LHV biomass [MJ/kg] 18
efficiency
gasification
combustion
boiler
DH
[%]
80
99
75
50a
syngas
yield [m3/kg daf
biomass] 1.1
composition [vol.%]
H2 37.5, CO 35.0, CO2
15.0, CH4 8.0, C2H4 0.5
and N2 4.0
LHV [MJ/kg] 13.2
flue gas [℃] 120b
working steam [bar]
[℃]
100 bar and 565 ℃ 100 bar to 0.6 bar (through
a steam turbine cycle)
steam (in PM) [bar] 2.5
a DH = (energy content of biomass - energy content of steam
(steam from the boiler to TMP+PM))0.5
b The hot inlet-cold outlet temperature difference is set as 209.6 ℃ for a sub-model of a
heat exchanger connecting a gas- and steam-turbine cycles.
25
3.4.2 Simulation
The BIGCC model (Fig. 3.6) is set up with several ASPEN Plus modules. Each
module simulates a unit process. The electricity generation efficiency of BIGCC
depends on the efficiencies of gasification, compression, combustion, expansion,
etc. The input data are collected from a variety of sources including experimental
and literature data. The mass balance and energy balance are verified.
A compressor or a turbine is simulated with a module “Compr” which can
calculate the power consumed or produced when the pressure ratio, isentropic,
polytropic, and mechanical efficiencies, and clearance volume are given.
The combustor is modeled as a reactor in ASPEN Plus with the module “RGibbs”
which executes equilibriums calculations by Gibbs free energy minimization.
When a system does not reach a complete equilibrium state, “RGibbs” can also be
used by additionally specifying an extent of equilibrium.
The heat exchanger is simulated with the module “Heatx”, the pump with the
module “Pump”, and the flow splitter “FSplit”.
The accessed equations and data are “packaged” in a specific Property Method set
in ASPEN Plus. The involved substances and operation conditions are crucial in
choosing a proper Property Method. In modelling the gas turbine system, the
Property Method PR-BM is adopted, and for the steam turbine system, the
Property Method STEAM-TA is employed.
The ASPEN Plus function block “Design Spec” is auxiliarily applied to predict how
much steam can be produced from the heat exchanger. In essence, it is a multi-
objective optimum design method adopted. The 100 bar, 565 ℃ steam is targeted to
be produced. Simultaneously, the temperature of the flue gas is set to be 120 ℃.
The manipulated variable is “MASS-FLOW” (flowrate, kg/s). Similarly, for
simulating the distribution of steam (by “FSplit”), the function block is also
employed. The original stream of steam will be divided into two parts. In
optimization, the target value is the known amount of 2.5 bar steam used in PM.
The manipulated variable is “FLOW/FRAC” (stream fraction). Some details of the
model can be found elsewhere (He, Göransson et al. 2012).

26
3.4.3 Economic evaluation
The economic profitability of TMP+BIGCC is evaluated in terms of the net revenue
(after subtracting the depreciation) and IRR. IRR is also called the discounted cash
flow rate of return or the rate of return. IRR disregards the absolute amount of
money to be gained, and is an indicator of the efficiency, quality, or yield of an
investment. An investment is considered acceptable if its IRR is higher than an
established minimum acceptable IRR, 0.1 for instance. Generally, the higher the
IRR, the better the investment.
Table 3.3: Data for economic analysis (Pettersson 2005; Holmberg and Gustavsson
2007; Eriksson and Kjellström 2010; Stridsberg and Lindgren 2010)
operation time 8000 hr/yr
power generation efficiency 44% (calculated, BIGCC)
28% (calculated, CHP)
specific capital investment
3000 €/KWel (CHP)
2300 €/KWel (BIGCC)
1920 €/tpy (TMP+PM)
paper
heat
O & M cost
electricity price
electricity certificate
pulpwood
biomass to BIGCC
710 €/t
80 €/MWh
0.07 the total capital investment
50 €/MWh
30 €/MWh
20 €/MWh
10 €/MWh (the logging residues)
0 €/MWh (the TMP residues)
plant lifespan
discounted payback period
annual depreciation
the first 10 years
the next 20 years
profit tax rate
discount factor
30 years
10 years
DDB (factor 1.5)
Straight-line Depreciation
0
0.1
Table 3.3 lists the data on this economic evaluation. The electricity generation
efficiency of BIGCC or CHP is calculated from the model. For a TMP+PM mill, its
capital investment is about 1920 € /tpy in a given paper production capacity

27
(Holmberg and Gustavsson 2007). The capital investment for BIGCC is 2300 €
/KWel (Wetterlund and Söderström 2010). The capacity of power generation is
about 30 MWel. The prices for some facilities are referred to the literature (Phillips,
Aden et al. 2007; Eriksson and Kjellström 2010). The operation and maintenance
cost accounts for 7.0% of the capital investment of a combined TMP+BIGCC mill.
Electricity is purchased at about 50 €/MWh. An electricity certificate credit of 30 €
/MWh is taken into account. The price of pulpwood is 20 €/MWh. The discounted
payback period is set as 10 years. Available raw biomass materials from a TMP
mill are free of charge. The overall cost for the logging residues is 10 €/MWh in
synergy with pulpwood harvesting. The heat is sold at 80 €/MWh for DH. The
plant lifespan is anticipated to be 30 years. In sensitivity analysis, the pulpwood is
priced at 20 or 40 €/MWh, and the electricity at, 50 or 100 €/MWh. The other values
are unchanged.
Two depreciation methods are adopted: for the first 10 years the Double-Declining
Balance method (DDB), and for the next years the Straight-line Depreciation
Method. Tax is not added. The economic analysis routine is programmed with
Excel.

28
3.5 TMP+BtSNG
3.5.1 BtSNG
Fig. 3.7: Model of BtSNG with a fluidized-bed SNG synthesis system
Before setting up a mathematic model, an optimal BtSNG process flow diagram is
designed as shown in Fig. 3.7. The process is established with five steps: biomass
pretreatment, gasification, syngas cleaning and conditioning, SNG synthesis, and
separation and purification. This system includes a steam turbine to utilize the
waste heat from BtSNG to generate electricity and steam for the use in a TMP+PM
mill.
Methanation can be either carried out in a series of adiabatic fixed bed reactors
with inter-cooling and optional product recycle, or in a single fluidized bed reactor
at isothermal conditions (Heyne 2013). The Ni-based catalysts are commonly used.
Methanation is highly exothermic (Tunå and Center 2008; Agersborg and Lingehed
2013). The temperature should be generally kept low to favor the equilibrium
(Tunå and Center 2008). It should be considered that the temperature is limited by
29
the catalyst activation and carbon deposition problems (Heyne 2013). The
operation is also limited by catalyst sintering problems at higher temperatures. The
fixed bed methanation is operated at temperature around 650 ℃, whereas the
fluidised bed methanation around 300 ℃.
A higher pressure is favorable for CH4 formation, which increases methanation
conversion efficiency and reduces the amount of catalyst required. For adiabatic
fixed bed methanation, the pressure should be high, about 10 bar, corresponding to
the high temperature. For fluidized bed methanation, on the other hand, the
pressure should be low, about 4 bar, corresponding to its low temperature. A high
conversion efficiency of methanation can also be achieved even at atmospheric
pressures. A compression stage prior to the methanation stage ensures the
necessary pressure for final SNG delivery to a local distribution network,
otherwise, additional compression of final SNG is needed (Agersborg and
Lingehed 2013; Heyne 2013).
Fluidized bed methanation is one key technology to unlock cost-effective bio-SNG
production in a medium scale (Gassner and Marechal 2012; Held 2013). This
reactor type is able to handle syngas with a wide range of CO/H2-ratios, from 1:1 to
1:5 if water addition is optimized. The advantages of a fluidized bed methanation
reactor compared to fixed bed methanation reactors are the isothermal operation,
the easy controlling, the possibility for the in situ water gas shift reaction to adjust
the H2/CO ratio and the low risk of catalyst deactivation due to recirculation of the
catalyst particles through the bed. There is a good synergy between DFBG and
fluidized bed methanation as both have a moderate operation condition and make
production cost reduction possible.
Since the methanation reaction equilibrium is reached in both fluidized and fixed
bed reactors, the conversion efficiency to SNG is yet expected to be the same, and
only the combined heat and power production might differ due to the respective
dissimilar heat transfer profiles of the heat exchangers (Gassner and Marechal
2012). In present work, the fluidized bed methanation reactor is chosen for
modeling BtSNG.
Methanation Reactions:
30
CO + 3H2 CH4 + H2O (3-4)
CO2 + 4H2 CH4 + 2H2O (3-5)
C(s) + 2H2 CH4 (3-6)
2CO C + CO2 (3-7)
Water-gas shift reaction:
CO + 3H2O CO2 + H2 (3-8)
The upgrading of bio-SNG is simple comparing to other synthetic fuels. A minor
part component of CO2 in the product gas needs to be removed. MEA, pressure
swing adsorption (PSA) and physical absorption with Selexol are suitable for CO2-
removal either up- or downstream of methanation, whereas membranes can only
be applied downstream due to the fast permeation of H2. Downstream to these
CO2-removal options, a final polysulfone membrane for H2 removal and recycling
to the CH4 synthesis reactor has further proven useful to reach the required grid
quality of 96 mol.% CH4 (Gassner and Marechal 2012).

31
3.5.2 Simulation
Table 3.4: Model input data (Gassner and Marechal 2012; He, Göransson et al. 2012;
He, Engstrand et al. 2013; Heyne 2013)
LHV biomass [MJ/kg] 18
efficiency gasification
combustion
boiler [%]
80
99
75
drying flue gas inlet
outlet [℃]
550
120
gasification [℃] 850–900
syngas
yield [m3/kg daf
biomass] 1.1
composition [vol.%]
H2 37.5, CO 35.0, CO2
15.0, CH4 8.0, C2H4 0.5
and N2 4.0
LHV [MJ/kg] 13.2
mathanation internally cooled FB [℃]
[bar]
300
5–15
Purification
PSA
CO2 removal
SNG recovery
adsorption pressure
[%]
[%]
[bar]
95–99
95–99
5.5
steam
to turbine
in PM
[℃]
[bar]
[bar]
500
60
2.5
The BtSNG model is set up with several ASPEN Plus modules. Each module
simulates a unit process. The input data were collected from a variety of sources
including experimental and literature data. The overall mass and energy balance of
the integrated mill is examined.
The gasifier and combustor were modelled with the module “RGibbs” which
executes equilibriums calculations by Gibbs free energy minimization. When a
system does not reach a complete equilibrium state, “RGibbs” can also be used by
additionally specifying an extent of equilibrium.
The modelling of the shift reactor is done with an adiabatic Gibbs reactor where
CH4 is considered inert and therefore does not take part in the steam reformation
(Agersborg and Lingehed 2013). The assumption is considered valid since the shift
reactor utilizes a different type of catalyst than the methanation reactor and
32
therefore no methanation or steam reformation should occur in the reactor
(Agersborg and Lingehed 2013).
An RGibbs module was used for methanation simulation (Porubova, Bazbauers et
al. 2012; Heyne 2013). A temperature approach to equilibrium measure was
adopted for the composition calculations in order to account for the deviation from
the thermodynamic equilibrium in a real reactor (Heyne 2013). The ASPEN Plus
function block “Design Spec” and in-built “Calculator” were auxiliarily applied for
parameters adjustment and process control. In essence, it is a multi-objective
optimum design method adopted.
This model is based on the following assumptions (Zwart, Boerrigter et al. 2006;
Gassner and Marechal 2012; Agersborg and Lingehed 2013; Held 2013; Heyne 2013;
Thunman H., Alamia A. et al. 2014):
Biomass de-volatilization is instantaneous in comparison with the char
gasification;
The methanation reaction and shift reaction go fast so that the thermodynamic
equilibrium is reached;
The overall CO conversion could approach to 98%;
98% steam is estimated to be condensed;
The energy required for CO2 removal is considered to be 4.0 MJ/kg CO2;
Biomass to bio-methane energy conversion efficiency ≥ 65%;
The overall energy conversion efficiency > 90%;
CH4 concentration > 95%;
The CH4 losses are about 2.0%–4.0%.

33
3.5.3 Economic Evaluation
Table 3.5: Data for economic analysis (He, Engstrand et al. 2013; Held 2013; Heyne
2013; Thunman H., Alamia A. et al. 2014)
operation time 8000 hr/yr
power generation efficiency 45% (calculated, BIGCC)
specific capital investment
3470 €/KWbio-SNG (BtSNG)
2300 €/KWel (BIGCC)
1920 €/tpy (TMP+PM)
pulpwood
biomass to BtSNG
O & M cost
Operators
operator salary
paper
bio-SNG
electricity price
electricity certificate
heat
20 €/MWh
10 €/MWh (the logging residues)
0 €/MWh (the TMP residues)
0.065 the total capital investment
12 p./shift
60000 €/yr
710 €/t
60 €/MWh
40 €/MWh
20 €/MWh
60 €/MWh
plant lifespan
discounted payback period
annual depreciation
the first 10 years
the next 20 years
profit tax rate
discount factor
30 years
10 years
DDB (factor 1.5)
Straight-line Depreciation
0
0.1
The economic profitability of TMP+BtSNG is evaluated in terms of NR (after
subtracting the depreciation) and IRR. For a TMP+PM mill, its capital investment is
about 1920 €/tpy in a given paper production capacity (Holmberg and Gustavsson
2007). The capital investment for BtSNG is 3470 €/KWbio-SNG (Thunman H., Alamia
A. et al. 2014). The prices for some facilities are referred to the literature (Phillips,
Aden et al. 2007; Eriksson and Kjellström 2010). The operation and maintenance
cost accounts for 6.5% of the capital investment of a combined TMP+BtSNG mill.
Electricity is purchased at about 40 €/MWh. An electricity certificate credit of 20 €

34
/MWh is taken into account. The price of pulpwood is 20 €/MWh. The discounted
payback period is set as 10 years. Available raw biomass materials from a TMP
mill are free of charge. The overall cost for the logging residues is 10 €/MWh in
synergy with pulpwood harvesting. The heat is sold at 60 €/MWh for DH. The
plant lifespan is anticipated to be 30 years. In sensitivity analysis, the bio-SNG is
priced at 60 or 120 €/MWh, and the pulpwood at, 20 or 40 €/MWh. The other
values are unchanged.
35
4 RESULT AND DISCUSSION
This chapter presents a review of the main results presented in papers I–V. Section 4.1
presents the predicted performance of a DFBG gasifier (Paper I). Section 4.2 presents the
results of a techno-economic evaluation of a biomass-to-ethanol process (Paper III). Section
4.3 presents the results of a techno-economic evaluation of a TMP+BIGCC process (Paper
IV). Section 4.4 presents the results of a techno-economic evaluation of a TMP+BtSNG
process (Paper V).
4.1 DFBG
4.1.1 Effect of temperature
As seen in Fig. 4.1(a), the syngas yield increases with temperature as a result of the
enhanced gasification and reforming at a higher temperature. Tar content
decreases from 50.0 g/m3 at 750 ℃ down to about 13.0 g/m3 at 900 ℃ attributed to
tar thermal cracking and steam reforming. Char to be combusted is regarded as an
intermediate product. The char fraction decreases from 22.5 wt.% at gasification
temperature of 750 ℃ to 11.5 wt.% at 950 ℃. The lower gasification temperature
leads to higher char yield, and subsequently results in higher combustor
temperature, hotter bed material, and higher gasification temperature, so that less
char will be produced.
As seen in Fig. 4.1(b), the concentration of CO increases with temperature, but that
of H2 reaches a maximum value at about 850 ℃. This is because H2 tends to take
part in the hydrogenation reactions at higher temperatures. The H2 concentration is
higher than that of CO under normal DFBG operating conditions, but they will
change positions when the gasification temperature is too high above about 950 ℃.
The CH4 concentration is around 10.0 vol. % and not sensitive to temperature. CH4
is highly stable, and much more difficult to be cracked or reformed than tar.
Therefore, CH4 concentration is far from its chemical equilibrium value which is
close to zero. Significant reduction of CH4 takes place at a temperature higher than
1250 ℃ or with the help of catalysts (e.g., nickel-based catalysts).

36
(a)
(b)
Fig. 4.1: Effect of temperature on the gasification (experiment—MIUN gasifier, wood
pellets, sand bed material, S/B=0.6, τ=5.0 s, dp=5.0 mm)
4.1.2 Effect of S/B
S/B values were calculated with an assumption that the dry biomass has 5.0 wt.%
moisture. The tar content decreases from 50.0 g/m3 at S/B = 0.3 down to about 10.0
g/m3 at S/B = 1.2 attributed to the enhanced steam reforming of tar. The char
fraction is insensitive to S/B as shown in Fig. 4.2(a). The syngas yield is in the range
of 0.8–1.0 Nm3/kg daf biomass, and the LHV is about 11.65 MJ/Nm3. Both
calculated data are fairly close to the measurement results from a pilot DFBG plant
at Vienna University of Technology (Pfeifer, Rauch et al. 2004).
The H2/CO ratio is a strong function of the S/B ratio, which is primarily controlled
by the water–gas shift reaction. The H2 concentration is higher than that of CO
under normal DFBG operating conditions, but they will change positions when the
S/B ratio is too far below bout 0.15 as seen in Fig. 4.2(b). The CH4 concentration is
around 10.0 vol. % and not sensitive to the S/B ratio.

37
(a)
(b)
Fig. 4.2: Effect of S/B on the gasification (experiment—MIUN gasifier, wood pellets,
sand bed material, 850 ℃, τ=5.0 s, dp=5.0 mm)
4.1.3 Effect of biomass moisture content
For an autothermal gasifier, gasification temperature can be held by adjusting the
oxygen equivalent ratio. For a DFBG, extra fuel needs to be added in the
combustor. Fig. 4.3 shows that the gasification temperature is difficult to be kept
above 850 ℃ when the biomass moisture content is higher than 15.0 wt.%.
Gasification temperature can be raised about 50 to 100 ℃ when the combusted
biomass is 10.0 wt.% of the total biomass feedstock, as seen in Fig. 4.3.
In Fig. 4.4, the exact amount of the combusted biomass can be found out
corresponding to different biomass moisture content when the gasification
temperature is held at 850 ℃ in three cases of S/B = 0.3, 0.6, and 0.9, respectively.
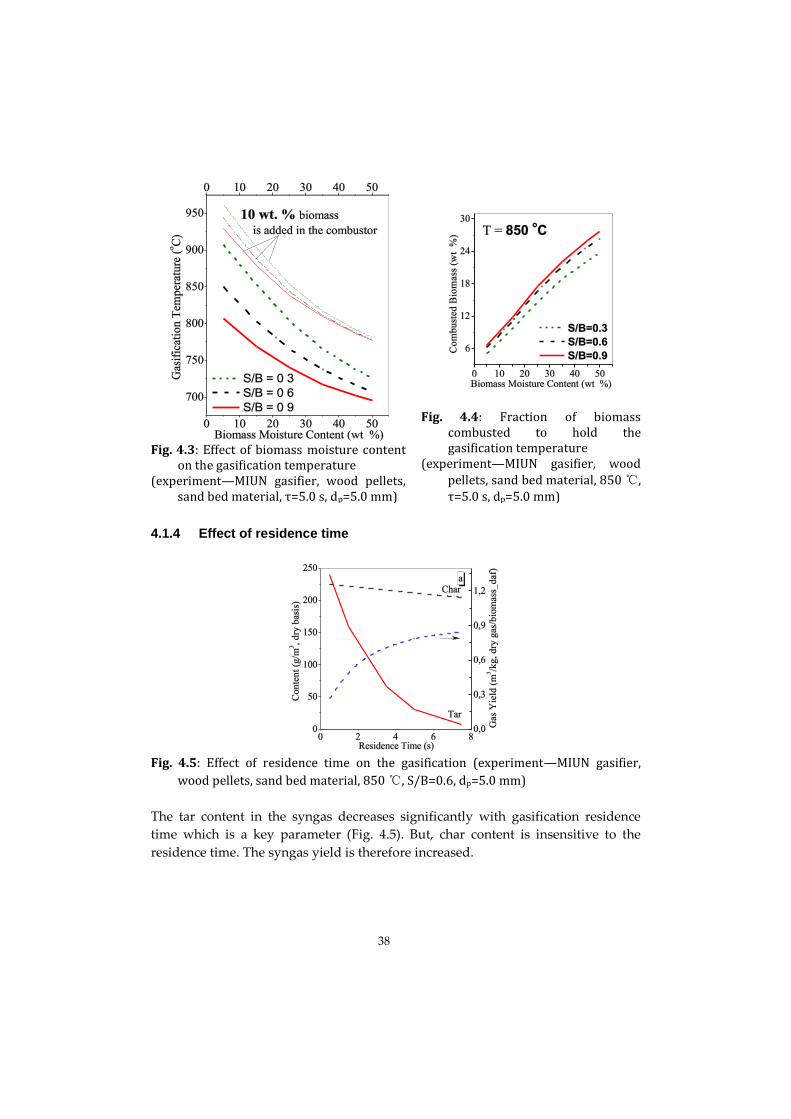
38
Fig. 4.3: Effect of biomass moisture content
on the gasification temperature (experiment—MIUN gasifier, wood pellets,
sand bed material, τ=5.0 s, dp=5.0 mm)
Fig. 4.4: Fraction of biomass
combusted to hold the gasification temperature
(experiment—MIUN gasifier, wood pellets, sand bed material, 850 ℃, τ=5.0 s, dp=5.0 mm)
4.1.4 Effect of residence time
Fig. 4.5: Effect of residence time on the gasification (experiment—MIUN gasifier,
wood pellets, sand bed material, 850 ℃, S/B=0.6, dp=5.0 mm)
The tar content in the syngas decreases significantly with gasification residence
time which is a key parameter (Fig. 4.5). But, char content is insensitive to the
residence time. The syngas yield is therefore increased.

39
4.2 Biomass-to-Ethanol
4.2.1 Ethanol production cost vs. plant scale
Fig. 4.6: Ethanol production cost as a function of plant scale
A mathematic model for techno-economic assessment of the thermo-chemical
biomass-to-ethanol process has been developed mainly with ASPEN Plus. The
assessment is made in terms of carbon and CO conversion efficiencies, ethanol
yield, synthesis selectivity and ethanol production cost.
As shown in Fig. 4.6, obviously the production cost decreases with the plant size
due to the economic scaling effect. In particular, with small scales up to 200 MW,
the production cost decreases rapidly and levels off. This suggests that a thermo-
chemical biomass-to-ethanol plant should be built at around 200 MW. The
production cost at this scale is around 0.33 €/l ethanol, which might be reduced
further to 0.25 €/l ethanol in the scale of 1000 MW. However, a 1000 MW ethanol
plant based on biomass is not realistic due to limited feedstock availability. The
biomass price is held constant in the present model calculation, but it will also rise
dramatically for the large plant and leads to a high operation cost.
The economic scaling effect is mainly attributed to the capital investment. For a
small ethanol plant, the capital investment is much higher than the operation cost,
as shown in Fig. 4.6. The gap between the capital investment and the operation cost
is becoming smaller and smaller as the plant is becoming larger and larger, and the
process equipment is utilized more efficiently. The first huge capital investment
plus the risk in the thermo-chemical conversion technologies is the biggest barrier
to BTL commercialization.
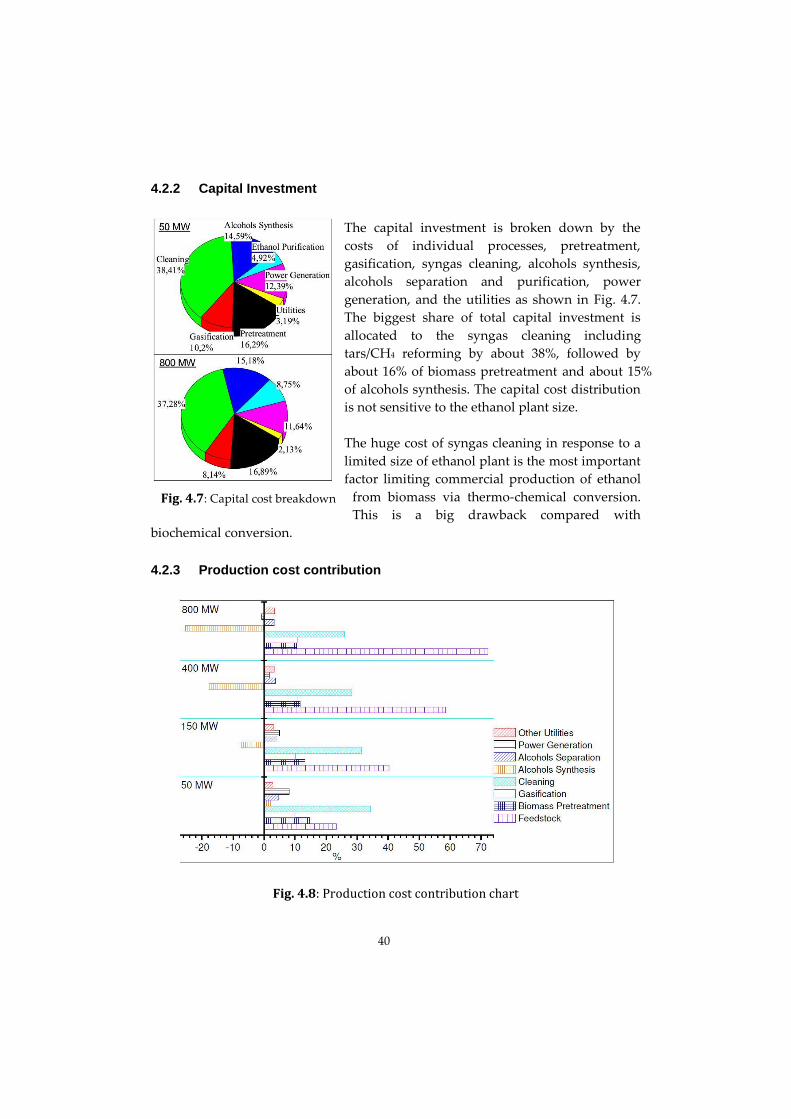
40
4.2.2 Capital Investment
The capital investment is broken down by the
costs of individual processes, pretreatment,
gasification, syngas cleaning, alcohols synthesis,
alcohols separation and purification, power
generation, and the utilities as shown in Fig. 4.7.
The biggest share of total capital investment is
allocated to the syngas cleaning including
tars/CH4 reforming by about 38%, followed by
about 16% of biomass pretreatment and about 15%
of alcohols synthesis. The capital cost distribution
is not sensitive to the ethanol plant size.
The huge cost of syngas cleaning in response to a
limited size of ethanol plant is the most important
factor limiting commercial production of ethanol
from biomass via thermo-chemical conversion.
This is a big drawback compared with
biochemical conversion.
4.2.3 Production cost contribution
Fig. 4.8: Production cost contribution chart
Fig. 4.7: Capital cost breakdown
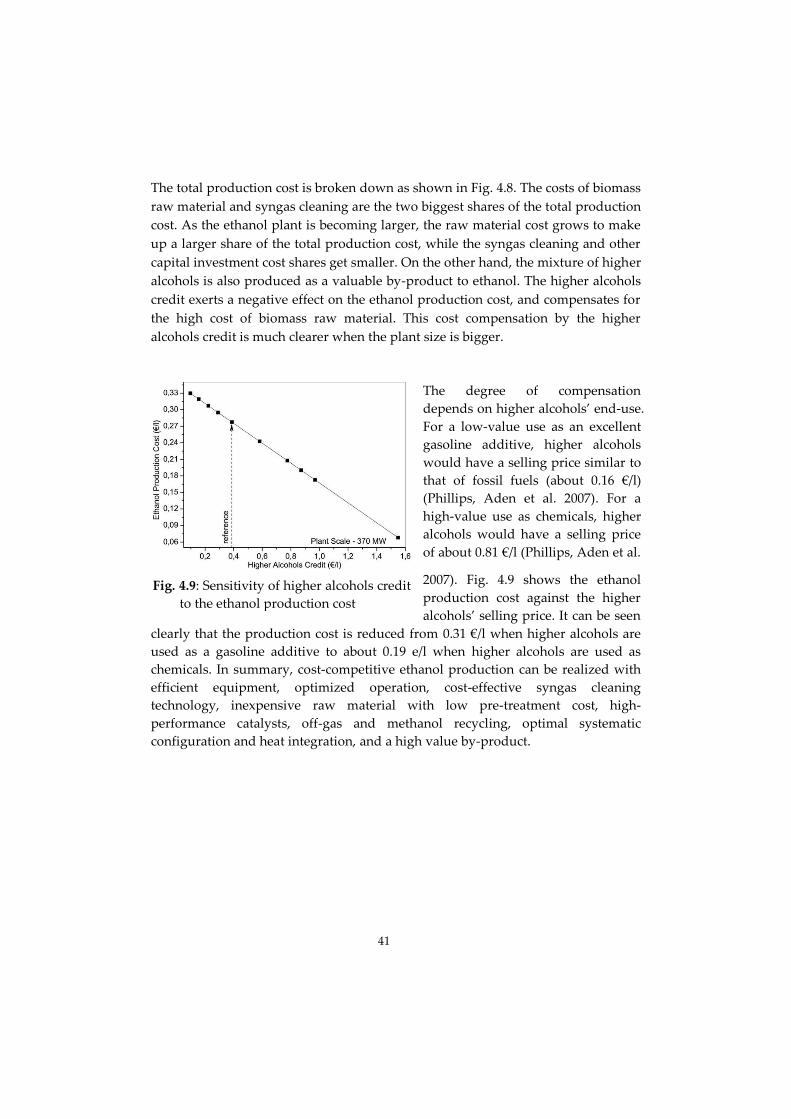
41
The total production cost is broken down as shown in Fig. 4.8. The costs of biomass
raw material and syngas cleaning are the two biggest shares of the total production
cost. As the ethanol plant is becoming larger, the raw material cost grows to make
up a larger share of the total production cost, while the syngas cleaning and other
capital investment cost shares get smaller. On the other hand, the mixture of higher
alcohols is also produced as a valuable by-product to ethanol. The higher alcohols
credit exerts a negative effect on the ethanol production cost, and compensates for
the high cost of biomass raw material. This cost compensation by the higher
alcohols credit is much clearer when the plant size is bigger.
The degree of compensation
depends on higher alcohols’ end-use.
For a low-value use as an excellent
gasoline additive, higher alcohols
would have a selling price similar to
that of fossil fuels (about 0.16 €/l)
(Phillips, Aden et al. 2007). For a
high-value use as chemicals, higher
alcohols would have a selling price
of about 0.81 €/l (Phillips, Aden et al.
2007). Fig. 4.9 shows the ethanol
production cost against the higher
alcohols’ selling price. It can be seen
clearly that the production cost is reduced from 0.31 €/l when higher alcohols are
used as a gasoline additive to about 0.19 e/l when higher alcohols are used as
chemicals. In summary, cost-competitive ethanol production can be realized with
efficient equipment, optimized operation, cost-effective syngas cleaning
technology, inexpensive raw material with low pre-treatment cost, high-
performance catalysts, off-gas and methanol recycling, optimal systematic
configuration and heat integration, and a high value by-product.
Fig. 4.9: Sensitivity of higher alcohols credit
to the ethanol production cost

42
4.3 TMP+BIGCC
4.3.1 Implementation of BIGCC in a TMP mill
Fig. 4.10: TMP energy use and supply
The energy balance over the BIGCC (or Boiler or CHP) process is studied by applying
the model. Table 3.1 shows how much biomass can be available. The TMP+PM
required steam is from the TMP and BIGCC, Boiler, or CHP processes. The total steam
demand is kept constant because of the constant paper throughput. The enhancement
of refining efficiency lowers the steam yield from TMP. Moving out the reject fibres
also facilitates the reduction of TMP SEC. Less steam from TMP aggravates the steam
supply from BIGCC (BIGCCa = CHP = Boiler < BIGCCb < BIGCCc < BIGCCd < BIGCCe).
The model is designed to ensure that the steam consumption is sufficiently satisfied,
as the results indicate (Fig. 4.10). For the TMP+PM mill studied, the TMP SEC is about
2.5 MWh/bdt pulp, the PM SEC is about 0.75 MWh/bdt pulp, and the steam
consumption is about 1.38 MWh/bdt pulp.
Compared with CHP, BIGCC has a higher electricity generation efficiency of 44%. As a
result, by implementing the BIGCC system in a TMP mill, less electricity will need to be
purchased, and less when the TMP SEC is reduced, and even less when the reject
fibres material is taken into account (BIGCCa > BIGCCb > BIGCCc > BIGCCd > BIGCCe)
(Fig. 4.10).

43
The electricity generation efficiency of a full-scale BIGCC plant can approach to 50%. A
BIGCC plant associated with a TMP+PM mill needs to supply PM steam, which lowers
the electricity generation efficiency. As shown in Fig. 4.10, for a BIGCC system,
intensifying the steam supply weakens its electricity yield. For instance, for the steam
supply, the sequence is BIGCCb < BIGCCc (or BIGCCd < BIGCCe), while for the
electricity generation efficiency, the sequence is reversed, i.e., BIGCCb > BIGCCc (or
BIGCCd > BIGCCe).
The residual low-grade energy from the BIGCC (or Boiler or CHP) process is
utilized in DH (Table 3.2). For the TMP+BIGCC cases, the available heat energy for
DH drops with the decreasing of TMP SEC (available heat for DH: BIGCCb >
BIGCCc; BIGCCd > BIGCCe). Two levels of turbine sets are respectively adopted, a
high (from 100 bar to 2.5 bar) and a low (from 100 bar to 0.6 bar) pressure levels
(Fig. 3.6). The most heat energy for DH is from the condensing of the discharged
0.6 bar steam (latent heat). As aforementioned, as the TMP SEC falls, a greater part
of the original 100 bar steam will be distributed to the 2.5 bar level turbine set. As a
result, the usable latent heat is discounted.
4.3.2 Additional biomass
Biomass heat and power plants scaled up to 100 MW (in biomass energy input)
have been popular in Sweden as well as other forest-rich countries. Forest logging
residues, peat, biomass from short rotation forestry, and some industrial and
household wastes, etc. are all available resources that can be taken as feedstock to
BIGCC plants. Electricity consumed in a TMP mill can be fully afforded by a
BIGCC plant without difficulty concerning biomass availability.
As indicated by the thick solid line in Fig. 4.11(a), the electricity supply from
BIGCC, increasing with the amount of biomass used, tends to meet the TMP+PM
consumption when about 9.4 MWh biomass per tonne of pulp is used. However, a
great amount of heat is also generated along with the electricity production. This
huge supply of low-grade energy must be directed to other uses such as DH. As
clearly shown in Fig. 4.11, BIGCC yields much more electricity and much less heat
than CHP.
Fig. 4.11(c) and (d) show that both the net revenue and the IRR increase
significantly with the amount of biomass, and increase faster as the electricity price
gets higher. The economic profitability of a TMP mill is more sensitive to the
electricity price when a smaller amount of biomass is available to be fed into the
gasifier, but is more sensitive to the pulpwood price when a larger amount of
biomass is available to be fed into the gasifier (Fig. 4.11(c) and (d)). The electricity
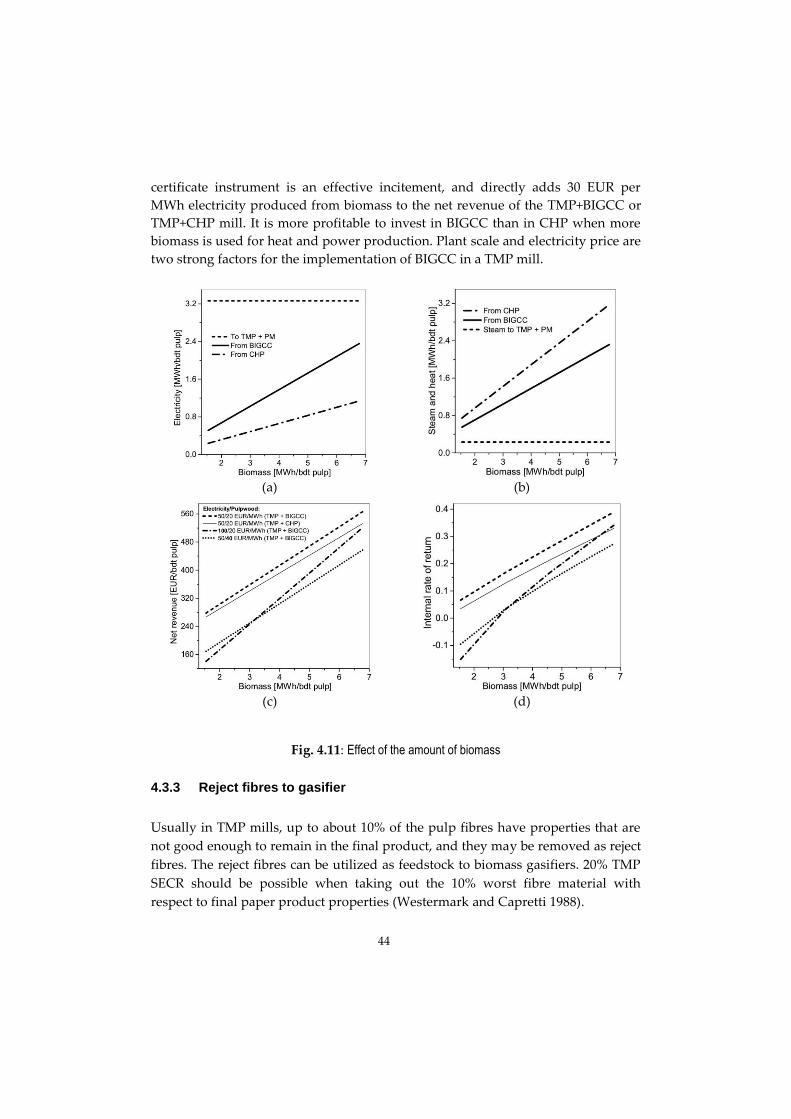
44
certificate instrument is an effective incitement, and directly adds 30 EUR per
MWh electricity produced from biomass to the net revenue of the TMP+BIGCC or
TMP+CHP mill. It is more profitable to invest in BIGCC than in CHP when more
biomass is used for heat and power production. Plant scale and electricity price are
two strong factors for the implementation of BIGCC in a TMP mill.
(a)
(b)
(c)
(d)
Fig. 4.11: Effect of the amount of biomass
4.3.3 Reject fibres to gasifier
Usually in TMP mills, up to about 10% of the pulp fibres have properties that are
not good enough to remain in the final product, and they may be removed as reject
fibres. The reject fibres can be utilized as feedstock to biomass gasifiers. 20% TMP
SECR should be possible when taking out the 10% worst fibre material with
respect to final paper product properties (Westermark and Capretti 1988).

45
As seen in Fig. 4.12(a), the electricity yield from BIGCC slightly increases with the
amount of reject fibres, but is far from the TMP+PM electricity consumption
denoted by the dashed line. The electricity yield of BIGCC has been twice more
than that of CHP.
The y-axis in Fig. 4.12(b) represents the amount of steam and heat produced,
including steam from BIGCC to TMP+PM, and heat from BIGCC to DH. The
amount gets up as more reject fibres are transferred to the gasifier. Lower TMP
SEC will lead to less steam supply from TMP. As a result, the heat and power plant
needs to supply more steam. Obviously, CHP gives more steam and heat than
BIGCC as much less electricity is generated by CHP.
(a)
(b)
(c)
(d)
Fig. 4.12: Effect of adding reject fibres
Normally, the prices of electricity and pulpwood are 50 and 20 € /MWh,
respectively (Fig. 4.12(c) and (d)). Both the net revenue and the IRR values increase
with the amount of the reject fibres. This can be explained by several factors: 1)

46
more electricity is generated as more reject fibres are added; 2) the TMP SEC is cut
down; 3) the paper yield is held by supplementing pulpwood. Both the net
revenue and the IRR values of TMP+BIGCC are much higher than those of
TMP+CHP, as shown in Fig. 4.12(c) and (d). This is because BIGCC produces much
more electricity than CHP for the same amount of biomass residues, and has a
lower specific investment cost than CHP (see Table 3.3). An increase in the market
electricity price from 50 to 100 €/MWh obviously reduces the net revenue, as
shown by the dash-dot line in Fig. 4.12(c). The economic profitability is sensitive to
both the electricity and the pulpwood prices (Fig. 4.12(c) and (d)).
4.3.4 Improved electric energy efficiency of the TMP-line
As discussed above, TMP SEC is a key factor in the high cost pulp production. A 50%
SECR is targeted. The SECR is indicated by a dashed line in Fig. 4.13(a). The
TMP+PM electricity consumption cannot be fully made up by the electricity supply
from BIGCC, even if the TMP SEC goes down by 50%. But the gap becomes fairly
small, and much smaller in comparison with the case of CHP. Since a certain
amount of 2.5 bar steam is withdrawn from BIGCC, the electricity generation
efficiency of the steam turbine cycle will be lowered, which gives rise to a slightly
lower electricity yield from BIGCC, as seen in Fig. 4.13(a).
The steam supply by TMP is impaired with the SECR. The margin must be
supplemented by BIGCC (or CHP). A resulted increase in the steam and heat from
BIGCC (or CHP) can be observed from Fig. 4.13(b). In some TMP+PM mills, a
backup boiler is specially used to supply steam without self-production of
electricity. In the TMP+Boiler case, a proper amount of biomass will be fed into for
offering PM a certain amount of steam. As observed from the inset figure in Fig.
4.13(b), the boiler needs more biomass as the SEC declines, and the available
biomass (bark + bio-sludge) within the TMP mill will no longer be enough when
the SEC is decreased by more than 34%. By further accumulating the reject fibres, it
becomes sufficient.
As shown in Fig. 4.13(c) and (d), lower TMP SEC leads to higher economic profit in
both the net revenue and the IRR. For both the net revenue and the IRR,
TMP+BIGCC > TMP+CHP > TMP+Boiler. This is mainly attributed to the lower
specific investment cost in BIGCC. The investment of BIGCC is expected to be
further decreased with more research and development towards the
commercialization of BIGCC technology. So far, the BIGCC technology has not
been fully commercialized. Risks exist when BIGCC is implemented to the
industries, including the pulp and paper industry.

47
In this evaluation, the heat price is assumed to be 80 €/MWh higher than the
electricity price of 50 €/MWh. This assumption is in line with the current situation
in Sweden that low tax is put on the electricity for industrial use and high tax for
domestic use. In the long run, the electricity price for industrial use is reasonably
going over the price of heat.
In the case that the electricity price for industries is the same as that for residential
use in Sweden, about 150 €/MWh, the IRR of a TMP mill will drop below about -
25%, but for a TMP+BIGCC plant, the IRR can rapidly be raised to a positive value,
depending on how much biomass residues will be used for electricity production.
Both the pulpwood and the electricity prices are key factors in determining the
economic profitability of a TMP mill, as estimated by the model. In the Swedish
market, solid bio-fuels and pulpwood have fairly stable low prices, while the
electricity price is rather volatile. It can be said from practical viewpoint that the
economic profitability of a TMP mill is dominated by the electricity price.
(a)
(b)
(c)
(d)
Fig. 4.13: Effect of reducing the TMP-specific electricity consumption

48
4.4 TMP+BtSNG
4.4.1 Implementation of BtSNG in a TMP mill
Fig. 4.14: A TMP+BtSNG block flow diagram with the major mass and energy inputs
and outputs
The TMP+BtSNG block flow diagram with an outline of mass and energy input
and output is shown in Fig. 4.14. About 100 MW of biomass residues including
bark, bio-sludge, reject fibres from TMP and logging residues from pulpwood
harvesting in forest is available for BtSNG production in the TMP+PM mill with a
paper production capacity of 250,000 t/yr. 63 MW of bio-SNG can be produced as
the bio-SNG yield of BtSNG is estimated to be 63%. The remaining energy of 37
MW of biomass feedstock is carried by flue gas from the combustor, product gas
from the gasifier, the cooling medium from methanation etc. in the form of heat at
different temperatures. This heat energy is recovered to generate 31 MW steam
going to the steam cycle in the heat & power (H&P) centre with 6 MW heat loss.
The H&P centre subsequently supplies TMP+PM with 9.5 MW steam, BtSNG itself
with 6.0 MW electricity, and DH with 4.5 MW low temperature heat.
The steam cycle in the H&P centre has a generation efficiency of 20% and produces
6.0 MW electricity to meet the demand of BtSNG for the compression of syngas
and bio- SNG, syngas cleaning, CO2 removal, gasifier operation etc.. Little excess
electricity is available for the TMP+PM mill. On the other hand, the H&P centre can
supply TMP+PM with enough steam, 9.5 MW, and 4.5 MW low grade heat energy
can be recovered as DH. As a result, the H&P centre has a total efficiency of about
65%, and BtSNG has an overall efficiency of 83%.

49
Fig. 4.15: Comparison of BtSNG with BIGCC regarding their outputs in energy content
Comparing to BIGCC as seen in Fig. 4.15, BtSNG gives almost double product
yield in terms of energy content, which results in much lower waste heat (WH) and
DH.
Fig. 4.16: Poly-generation of SNG, electricity, and heat in a TMP mill
The energy balance over the TMP+BtSNG mill is studied by applying the model, in
comparison with other two cases of TMP+BIGCC and TMP+Boiler studied
previously (He, Engstrand et al. 2013), as seen in Fig. 4.16.
For the TMP+PM mill studied, the TMP SEC is 2.5 MWh/bdt pulp, the PM SEC is
0.75 MWh/bdt pulp, and the steam consumption in the PM is 1.38 MWh/bdt pulp.
The total steam demand is kept constant because of the constant paper throughput,
and is provided from the steam energy recovered mainly from the TMP refining

50
process and also from the BtSNG process to a minor degree. The enhancement of
refining efficiency lowers the steam yield from TMP. Moving out the reject fibres
makes the TMP more energy-efficient, i.e., the TMP SEC is reduced, and the steam
yield from TMP is also reduced. A decrease in the steam generation from TMP is
compensated for from the BtSNG plant so that the bio-SNG yield may be reduced.
The model is designed to ensure that the steam consumption is sufficiently
satisfied, as the results indicate in Fig. 4.16. The residual low-grade energy is
utilized in DH. The heat energy for DH is from both TMP and BtSNG.
4.4.2 Economics of scale
The above analysis of energy balance over the TMP+BtSNG mill is based on a
typical scale of TMP+PM mills with a paper production capacity of 250,000 t/yr.
The corresponding scale of the BtSNG plant is 100 MW of biomass thermal input
according to Fig. 3.5 and Fig. 4.14 estimation. The scale of the BtSNG will be taken
to represent the whole scale of the TMP+BtSNG mill for economical analysis as
shown in Fig. 4.17.
As seen in Fig. 4.17(a), the bio-SNG production per tonne pulp holds constant
against the scale, which indicates a linear relationship between the bio-SNG
production and the TMP pulp output. The steam produced from the H&P centre
associated to the BtSNG plant is fairly limited in comparison with the BIGCC plant,
but still can meet the demand of the TMP+PM mill as shown in Fig. 4.17(b). Very
little heat energy is available for DH, which can also be observed from Fig. 4.16.
The economic profitability is also sensitive to both the SNG price and the
pulpwood price as seen in Fig. 4.17(c) and (d). When the SNG price is doubled, the
IRR increases from about 2% to about 16%. When the pulpwood price is doubled,
the IRR decreases from about 2% down to about -13%.
Comparing to the results of the case of TMP+BIGCC, represented by the dashed
curve in Fig. 4.17(c) and (d), the NR and IRR of TMP+BtSNG are much lower. This
is attributed to 3 reasons, 1) the specific investment cost is much higher for BtSNG,
2) The electricity certificate instrument in Sweden has added a credit to the
electricity production, and 3) Much more DH is produced by BIGCC, and DH has a
price unusually high (higher than electricity) in Sweden.
In summary, plant scale and SNG price are two strong factors for the
implementation of BtSNG in a TMP mill. A BtSNG plant associated to a TMP mill
should be built at a scale above 100 MW in biomass thermal input. Political
instruments to support commercialization of bio-transport fuel are necessary.

51
(a)
(b)
(c)
(d)
Fig. 4.17: Effect of the scale of TMP+Mill represented by the biomass thermal input to the BtSNG
plant
4.4.3 Reject fibres to gasifier
Usually in TMP mills, up to about 10 wt.% of the pulp fibres have properties that
are not good enough to remain in the final product, and they may be removed as
reject fibres. They can be utilized as feedstock to biomass gasifiers. 20% TMP SECR
should be possible when taking out the fibres with respect to final paper product
properties (Westermark and Capretti 1988).
As seen in Fig. 4.18(a), with the amount of reject fibres, the bio-SNG yield per
tonne pulp clearly increases for two reasons, 1) the reject fibres are directly added
in the gasifer, and 2) the usable biomass residues increases as the product paper
output is kept constant. Corresponding to the increase in feedstock, the amount of
steam and heat produced from BtSNG increases as well. At the same time, the
steam demand by the TMP+PM mill also increases since the low quality fibre
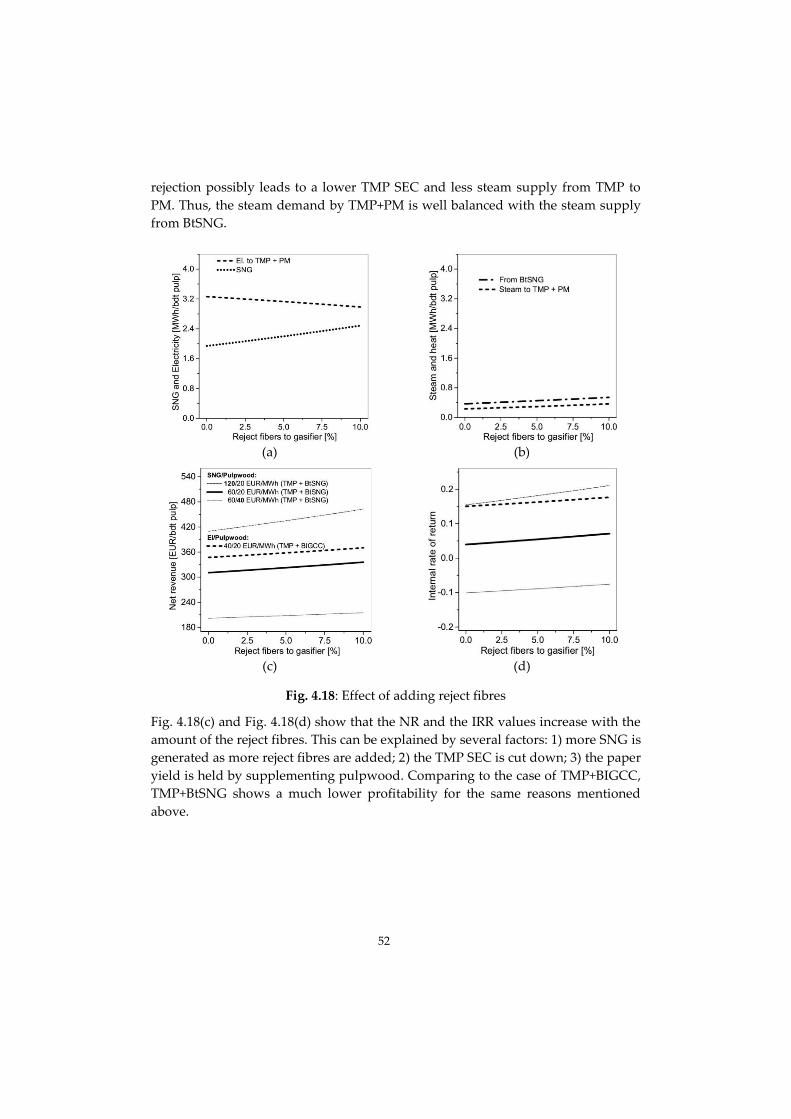
52
rejection possibly leads to a lower TMP SEC and less steam supply from TMP to
PM. Thus, the steam demand by TMP+PM is well balanced with the steam supply
from BtSNG.
(a)
(b)
(c)
(d)
Fig. 4.18: Effect of adding reject fibres
Fig. 4.18(c) and Fig. 4.18(d) show that the NR and the IRR values increase with the
amount of the reject fibres. This can be explained by several factors: 1) more SNG is
generated as more reject fibres are added; 2) the TMP SEC is cut down; 3) the paper
yield is held by supplementing pulpwood. Comparing to the case of TMP+BIGCC,
TMP+BtSNG shows a much lower profitability for the same reasons mentioned
above.
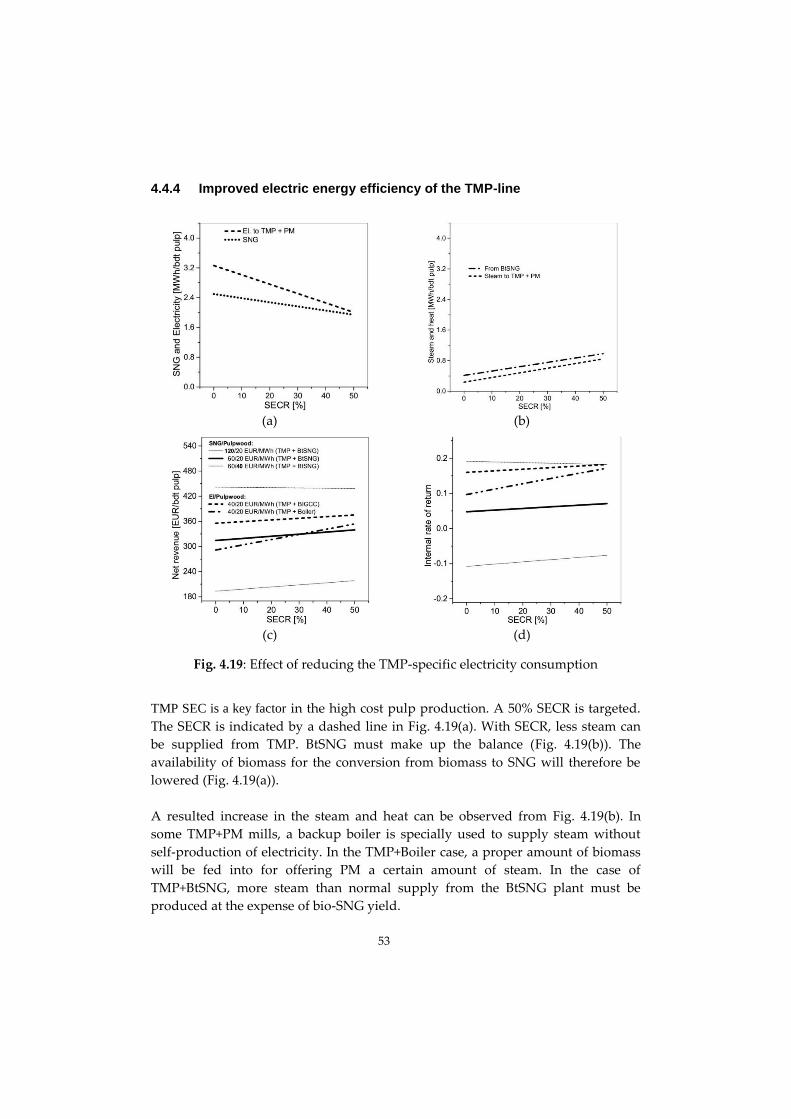
53
4.4.4 Improved electric energy efficiency of the TMP-line
(a)
(b)
(c)
(d)
Fig. 4.19: Effect of reducing the TMP-specific electricity consumption
TMP SEC is a key factor in the high cost pulp production. A 50% SECR is targeted.
The SECR is indicated by a dashed line in Fig. 4.19(a). With SECR, less steam can
be supplied from TMP. BtSNG must make up the balance (Fig. 4.19(b)). The
availability of biomass for the conversion from biomass to SNG will therefore be
lowered (Fig. 4.19(a)).
A resulted increase in the steam and heat can be observed from Fig. 4.19(b). In
some TMP+PM mills, a backup boiler is specially used to supply steam without
self-production of electricity. In the TMP+Boiler case, a proper amount of biomass
will be fed into for offering PM a certain amount of steam. In the case of
TMP+BtSNG, more steam than normal supply from the BtSNG plant must be
produced at the expense of bio-SNG yield.

54
As shown in Fig. 4.19(c) and (d), lower TMP SEC leads to higher economic profit in
both NR and IRR. For NR, TMP+BIGCC > TMP+BtSNG > TMP+Boiler, but for IRR,
TMP+BIGCC > TMP+Boiler > TMP+BtSNG.
Markets like Sweden, where bio-methane is highly valued, the natural gas price is
relatively high, and the feedstock supply is good, are likely to see the first
installation of commercial S&M scale bio-SNG production. However, since the bio-
methane market in Sweden is far from mature, it is still heavily dependent on
political ambitions and associated instruments, as well as regional and local
initiatives and the relatively high natural gas price.

55
5 CONCLUSIONS
Gasification
A mathematic model is established to simulate biomass gasification in the DFBGs.
The model predicts that the content of char transferred from the gasifier to the
combustor decreases from 22.5 wt.% of the dry and ash-free biomass at gasification
temperature 750 ℃ to 11.5 wt.% at 950 ℃ , but is insensitive to S/B. The H2
concentration is higher than that of CO under the normal DFBG operation
conditions, but they will change positions when the gasification temperature is too
high above about 950 ℃, or the S/B ratio is too low under about 0.15. The biomass
moisture content is a key parameter for a DFBG to be operated and maintained at a
high gasification temperature. The model suggests that the gasification
temperature is difficult to be kept above 850 ℃ when the biomass moisture content
is higher than 15.0 wt.%. Thus, a certain amount of biomass needs to be added in
the combustor to provide sufficient heat for biomass devolatilization and steam
reforming. Tar content in the syngas can also be predicted from the model, which
shows a decreasing trend of the tar with the gasification temperature and the S/B
ratio. The tar content in the syngas decreases significantly with gasification
residence time which is a key parameter.
Biomass-to-Ethanol
A mathematic model for a techno-economic assessment of the thermo-chemical
biomass-to-ethanol process has been developed. The assessment is made in terms
of carbon and CO conversion efficiencies, ethanol yield, synthesis selectivity, and
ethanol production cost.
Calculated results show that major contributions to the production cost are from
syngas cleaning and biomass feedstock. A biomass-to-ethanol plant should be built
at around 200 MW as the biomass input, which gives the ethanol production cost
of 0.33 €/l in the context of a typical developed country. The capital investment is
much higher than the operation cost and dominates the total ethanol production
cost for small- and medium scale plants. This suggests that the first huge capital
investment with technological risk is a big barrier to the commercialization of a
thermo-chemical biomass-to-ethanol process. The costs of biomass raw material
and syngas cleaning are the two biggest shares of the total production cost. As the
ethanol plant becomes larger, the raw material cost makes up a larger share of the
total production cost. This can be off-set to a certain extent by the higher alcohols
credit, which might reduce the ethanol production cost from 0.31 €/l to about 0.19
e/l when the higher alcohols are used as valuable chemicals.
56
TMP+BIGCC
A TMP+BIGCC mathematical model is developed to make the techno-economic
analysis of the TMP+BIGCC mill in comparison with a TMP+CHP and TMP+Boiler
mills.
The electricity yield of BIGCC has been more than double that of CHP. BIGCC has
a lower specific capital investment than CHP, which results in a shorter discount
payback period and higher IRR. It is more profitable to invest in BIGCC than in
CHP when more biomass is used for heat and power production and when the
market electricity price is higher. The economic profitability of a TMP mill is more
sensitive to the electricity price than the pulpwood price in today’s TMP industry
when the SEC is high, and no BIGCC is used to provide TMP electricity. The
profitability will be dominated by the pulpwood price when the SEC is low, and a
great part of electricity to TMP is produced by an associated BIGCC plant. The
plant scale and market electricity price are two strong factors determining the
implementation of BIGCC in a TMP mill.
Both the net revenue and the IRR increase with the amount of the reject fibres,
since more electricity is self-produced on-site, the TMP SEC is reduced, and the
paper output is held constant while more pulpwood is added. Rejection of low-
quality pulp fibres and their reuse in BIGCC for self-production of electricity, and
electricity certificate are highly attractive measures to raise the profitability of a
TMP mill.
The TMP+PM electricity consumption cannot be fully made up by the electricity
supply from a BIGCC plant, even if the TMP SEC goes down by 50%. But the gap
becomes fairly small, and much smaller in comparison with the case of a CHP
plant. Lower TMP SEC leads to higher economic profit in both the net revenue and
the IRR. The profits are ranked as: TMP+BIGCC > TMP+CHP > TMP+Boiler.
57
TMP+BtSNG
A TMP+BtSNG mathematical model is developed based on the economical
conditions in Sweden. The profitability of the TMP+BtSNG mill is evaluated in
comparison with the TMP+BIGCC mill. The model prediction can be concluded
below:
The scale of the TMP+BtSNG mill and SNG price are two strong factors for the
implementation of BtSNG in a TMP mill. A BtSNG plant associated to a TMP mill
should be built at a scale above 100 MW in biomass thermal input.
Comparing to the case of TMP+BIGCC, the NR and IRR of TMP+BtSNG are much
lower. This is attributed to 3 reasons, 1) the specific investment cost is much higher
for BtSNG, 2) The electricity certificate instrument in Sweden has added a credit to
the electricity production, and 3) Much more DH is produced by BIGCC, and DH
has a price unusually high (higher than electricity), in Sweden. Political
instruments to support commercialization of bio-transport fuel are necessary.

58
6 FUTURE RESEARCH
The simulation can be extended to the following fields.
Fuel cell
The energy efficiency of a fuel cell is generally between 40–60%, or up to 85% if
waste heat is captured for use. It is also important to take losses due to fuel
production, transportation, storage and distribution into account. The maximum
theoretical energy efficiency of a fuel cell is 83%. Comparatively, an internal
combustion engine has a maximum theoretical efficiency of 58%, as indicated by
the World Energy Council. The typical internal combustion engine of a car is about
25% energy efficient. While fuel cells are efficient relative to combustion engines,
they are not as efficient as batteries.
The link-up of wood gasification with high temperature solid oxide fuel cells
(BIGFC) is a promising approach to reach high electrical efficiencies in small-scale
biomass fuelled CHP plants.
BtDME
An evaluation can be performed on converting biomass to DME via a gasification–
synthesis route. This route has obvious advantages: production flexibility,
environmental friendliness, economic feasibility and application versatility. Low
temperature and high pressure will be advantageous for DME production.
Generally, the conditions are: H2 : CO ≈ 1–2, 240–275 ℃, 5.0–5.5 MPa.

59
7 ACKNOWLEDGEMENTS
To my father Xing-gong HE
To my mother Cai-xia LIU
To my father-in-law Quan-sheng LIU
To my mother-in-law Feng-lan LIU
To my wife Li-hua LIU
To my sister Li HE
To my sister Jiao HE
To my little daughter Zong-shu HE
To my little niece Ling-yao Chen
To my little nephew Lu-teng HUO
To my other relatives, and all teachers and friends!
I would like to acknowledge the project support of EU Regional Development
Fund, Toyota, Å F Foundation for Research and Development, LKAB,
Länsstyrelsen Västernorrland, Swedish Gasification Centre (SFC), SCA BioNorr AB,
Härnösand. Fokusera Utveckling Sundsvall AB, Suntib Mekaniska Verkstad AB,
Härnösand Energi & Miljö (HEMAB), Sundsvall Energi, Härnösand kommun och
Elkompaniet i Sundsvall AB.
This thesis would not have come to be without the tireless work of Wennan Zhang,
Per Engstrand, and Olof Björkqvist, my supervisors. I am very grateful to them for
support, inspiration, and encouragement. I greatly appreciate the support from our
colleagues, Ulf Söderlind, Ph.D. student and research engineer, Kristina Göransson,
Ph.D. student, and Lars Strömmer (in memory of), a Mechanic.
Thanks to Anna Haeggström, Anne Å hlin, Jan-Erik Berg, Anders Lindberg,
Christina Olsson, Viktoria Lilja, Sinke Henshaw and other colleagues at Mid
Sweden University.

60
8 REFERENCES
Agersborg, J. and E. Lingehed (2013). Integration of Power-to-Gas in Gasendal and
GoBiGas. Göteborg, Department of Energy and Environment, Chalmers
University of Technology.
Baeck, R., O. Danielsson, et al. (1994). A method of producing mechanical and
chemi-mechanical pulp, WO 1994016139 A1.
Balat, M. and H. Balat (2009). "Recent trends in global production and utilization
of bio-ethanol fuel." Applied Energy 86(11): 2273-2282.
Berglin, N. and T. Berntsson (1998). "CHP in the pulp industry using black liquor
gasification: thermodynamic analysis." Applied thermal engineering 18(11):
947-961.
Brown, J. W., Ed. (2006). Biomass gasification: fast internal circulating fluidised
bed gasifier characterisation and comparison. Canterbury, Chemical and
Process Engineering, University of Canterbury.
Corella, J. and A. Sanz (2005). "Modeling circulating fluidized bed biomass
gasifiers. A pseudo-rigorous model for stationary state." Fuel Processing
Technology 86(9): 1021-1053.
Doherty, W., A. Reynolds, et al. (2009). "The effect of air preheating in a biomass
CFB gasifier using ASPEN Plus simulation." Biomass and Bioenergy 33(9):
1158-1167.
Dry, M. E. (2002). "High quality diesel via the Fischer–Tropsch process – a review."
Journal of Chemical Technology & Biotechnology 77(1): 43-50.
Emun, F., M. Gadalla, et al. (2010). "Integrated gasification combined cycle (IGCC)
process simulation and optimization." Computers & chemical engineering
34(3): 331-338.
Engstrand, P., J. Jonsson, et al. (2002). Method of producing bleached
thermomechanical pulp (TMP) or bleached chemithermomechanical pulp
(CTMP), WO Patent WO/2003/000,982.
Engstrand, P. O., L. A. Hammar, et al. (1991). Method of reducing the energy
consumption at the refining of cellulose containing material, US 5007985 A.
Eriksson, G. and B. Kjellström (2010). "Assessment of combined heat and power
(CHP) integrated with wood-based ethanol production." Applied Energy
87(12): 3632-3641.
Eriksson, H. and S. Harvey (2004). "Black liquor gasification—consequences for
both industry and society." Energy 29(4): 581-612.
Fagbemi, L., L. Khezami, et al. (2001). "Pyrolysis products from different
biomasses: application to the thermal cracking of tar." Applied Energy
69(4): 293-306.

61
Fercher, E., H. Hofbauer, et al. (1998). Two years experience with the FICFB-
gasification process. Proc. 10th European Conference and Technology
Exhibition, Würzburg. Germany.
Fletcher, T. H. "http://www.et.byu.edu/~tom/."
Foscolo, P. U. (2007). Biomass: a sustainable energy source. The ICTP Experts
Meeting on "Science and Renewable Energy", Trieste.
Gassner, M. and F. Marechal (2012). "Thermo-economic optimisation of the
polygeneration of synthetic natural gas (SNG), power and heat from
lignocellulosic biomass by gasification and methanation." Energy &
Environmental Science 5(2): 5768-5789.
Göransson, K. (2014). INTERNAL TAR/CH4 REFORMING IN BIOMASS DUAL
FLUIDISED BED GASIFIERS TOWARDS FUEL SYNTHESIS. Mid Sweden
University. Sundsvall, Sweden, Mid Sweden University. Ph.D.
Göransson, K., U. Söderlind, et al. (2011). "Review of syngas production via
biomass DFBGs." Renewable and Sustainable Energy Reviews 15(1): 482-
492.
Göransson, K., U. Söderlind, et al. (2011). "Experimental test on a novel dual
fluidised bed biomass gasifier for synthetic fuel production." Fuel 90(4):
1340-1349.
Gorski, D., J. Hill, et al. (2010). "Review: Reduction of energy consumption in TMP
refining through mechanical pre-treatment of wood chips." Nordic Pulp &
Paper Research Journal 25(2): 156-161.
Hamelinck, C. N., G. v. Hooijdonk, et al. (2005). "Ethanol from lignocellulosic
biomass: techno-economic performance in short-, middle-and long-term."
Biomass and Bioenergy 28(4): 384-410.
Harvey, S. and B. Facchini (2004). "Predicting black liquor gasification combined
cycle powerhouse performance accounting for off-design gas turbine
operation." Applied thermal engineering 24(1): 111-126.
He, J., P. Engstrand, et al. (2013). "Techno-economic evaluation of a mechanical
pulp mill with gasification." Nordic Pulp & Paper Research Journal 28(3):
349-357.
He, J., K. Göransson, et al. (2012). "Simulation of biomass gasification in a dual
fluidized bed gasifier." Biomass Conversion and Biorefinery 2(1): 1-10.
Held, J. (2013). Small and medium scale technologies for bio-SNG production.
Heyne, S. (2010). Process integration opportunities for synthetic natural gas (SNG)
production by thermal gasification of biomass, Chalmers University of
Technology.
Heyne, S. (2013). Bio-SNG from Thermal Gasification-Process Synthesis,
Integration and Performance, Chalmers University of Technology.
Hofbauer, H., G. Veronik, et al. (1997). The FICFB—gasification process.
Developments in thermochemical biomass conversion, Springer: 1016-1025.

62
Holmberg, J. M. and L. Gustavsson (2007). "Biomass use in chemical and
mechanical pulping with biomass-based energy supply." Resources,
Conservation and Recycling 52(2): 331-350.
Kiel, J., S. Van Paasen, et al. (2004). Primary measures to reduce tar formation in
fluidised-bed biomass gasifiers. ECN, ECN-C-04-014, ECN, Energy
Research Centre of the Netherlands,
http://www.ecn.nl/docs/library/report/2004/c04014.pdf.
Kumabe, K., S. Fujimoto, et al. (2008). "Environmental and economic analysis of
methanol production process via biomass gasification." Fuel 87(7): 1422-
1427.
Lee, J. M., Y. J. Kim, et al. (1998). "Coal-gasification kinetics derived from pyrolysis
in a fluidized-bed reactor." Energy 23(6): 475-488.
Muhic, D., L. Sundström, et al. (2010). "Influence of temperature on energy
efficiency in double disc chip refining." Nordic Pulp & Paper Research
Journal 25(4): 420-427.
Murphy, J. and K. McCarthy (2005). "Ethanol production from energy crops and
wastes for use as a transport fuel in Ireland." Applied Energy 82(2): 148-
166.
Naqvi, M., J. Yan, et al. (2010). "Black liquor gasification integrated in pulp and
paper mills: A critical review." Bioresource technology 101(21): 8001-8015.
Naqvi, M., J. Yan, et al. (2012). "Synthetic gas production from dry black liquor
gasification process using direct causticization with CO2 capture." Applied
Energy 97: 49-55.
Nikoo, M. B. and N. Mahinpey (2008). "Simulation of biomass gasification in
fluidized bed reactor using ASPEN PLUS." Biomass and Bioenergy 32(12):
1245-1254.
Norgren, S. and H. Höglund (2009). "Irreversible long fibre collapse at high
temperature refining in a TMP system: Effects on fibre and surface
properties." Nordic Pulp & Paper Research Journal 24(1): 19-24.
Ong'iro, A., V. Ugursal, et al. (1995). "Simulation of combined cycle power plants
using the ASPEN PLUS shell." Heat Recovery Systems and CHP 15(2): 105-
113.
Ong'iro, A., V. I. Ugursal, et al. (1996). "Thermodynamic simulation and
evaluation of a steam CHP plant using ASPEN Plus." Applied thermal
engineering 16(3): 263-271.
Paisley, M. A., R. Corley, et al. (2007). Advanced biomass gasification for the
economical production of biopower, fuels, and hydrogen—
implementation in Montgomery, New York. 15th Biomass Conference and
Exhibition, Berlin.

63
Pettersson, J. (2005). "Energikartläggning för energiledningssystem-Holmen Paper,
Hallsta (energy survey for energy management-Holmen Paper, Hallsta)."
from http://epubl.ltu.se/1402-1617/2005/109/LTU-EX-05109-SE.pdf.
Pfeifer, C., R. Rauch, et al. (2004). "In-bed catalytic tar reduction in a dual fluidized
bed biomass steam gasifier." Industrial & engineering chemistry research
43(7): 1634-1640.
Phillips, S., A. Aden, et al. (2007). "Thermochemical ethanol via indirect
gasification and mixed alcohol synthesis of lignocellulosic biomass."
NREL/TP-510-41168 2007(April).
Piccolo, C. and F. Bezzo (2009). "A techno-economic comparison between two
technologies for bioethanol production from lignocellulose." Biomass and
Bioenergy 33(3): 478-491.
Porubova, J., G. Bazbauers, et al. (2012). "Modeling of the Adiabatic and
Isothermal Methanation Process." Scientific Journal of Riga Technical
University. Environmental and Climate Technologies 6(1): 79-84.
Qiu, H., J. Huang, et al. (2010). "Bioethanol development in China and the
potential impacts on its agricultural economy." Applied Energy 87(1): 76-
83.
Rajagopalan, S., R. P Datar, et al. (2002). "Formation of ethanol from carbon
monoxide via a new microbial catalyst." Biomass and Bioenergy 23(6): 487-
493.
Ruohonen, P. and P. Ahtila (2011). "Qualitative analysis of a thermo mechanical
pulp and paper mill using advanced composite curves." Energy 36(6):
3871-3877.
Sabourin, M. J. (1999). Method of pretreating lignocellulose fiber-containing
material for the pulp making process, WO1999007935 A1.
Sassner, P., M. Galbe, et al. (2008). "Techno-economic evaluation of bioethanol
production from three different lignocellulosic materials." Biomass and
Bioenergy 32(5): 422-430.
Seemann, M. and H. Thunman (2009). The new Chalmers research-gasifier.
Proceedings of the 20th International Conference on Fluidized Bed
Combustion, Xi'an.
Sotudeh-Gharebaagh, R., R. Legros, et al. (1998). "Simulation of circulating
fluidized bed reactors using ASPEN PLUS." Fuel 77(4): 327-337.
Starfelt, F., E. Thorin, et al. (2010). "Performance evaluation of adding ethanol
production into an existing combined heat and power plant." Bioresource
technology 101(2): 613-618.
Stridsberg, A. and O. Lindgren (2010). Möjlighet till ökad elproduktion vid
Ortviken pappersbruk. Sundsvall, Mid Sweden University.
64
Subramani, V. and S. K. Gangwal (2008). "A review of recent literature to search
for an efficient catalytic process for the conversion of syngas to ethanol."
Energy & Fuels 22(2): 814-839.
Sundholm, J., S. P.-i. Yhdistys, et al. (1999). Mechanical pulping, Published in
cooperation with the Finnish Paper Engineers' Association and TAPPI.
Tarka, T. J., J. G. Wimer, et al. (2009). Affordable, low-carbon diesel fuel from
domestic coal and biomass. Proc. 25th Annual Pittsburgh Coal Conf.,
Pittsburgh, PA.
Thunman H., Alamia A., et al. (2014). Beyond 0.8 Efficiency for Standalone
Production of Bio-Methane from Wet Biomass, Chalmers University of
Technology.
Tunå, P. and S. G. Center (2008). Substitute natural gas from biomass gasification,
Svenskt gastekniskt center (SGC).
van der Meijden, C., P. Bergman, et al. (2010). Preparations for a 10 MWth Bio-
CHP demonstration based on the MILENA gasification technology. 18th
European Biomass Conference and Exhibition, Lyon.
Westermark, U. and G. Capretti (1988). "Influence of ray cells on the bleachability
and properties of CTMP and kraft pulps." Nordic Pulp and Paper Research
Journal 3.
Wetterlund, E. and M. Söderström (2010). "Biomass gasification in district heating
systems–the effect of economic energy policies." Applied Energy 87(9):
2914-2922.
Younesi, H., G. Najafpour, et al. (2005). "Ethanol and acetate production from
synthesis gas via fermentation processes using anaerobic bacterium,
Clostridium ljungdahlii." Biochemical Engineering Journal 27(2): 110-119.
Yu, S. and J. Tao (2009). "Economic, energy and environmental evaluations of
biomass-based fuel ethanol projects based on life cycle assessment and
simulation." Applied Energy 86: S178-S188.
Zhang, W. (2010). "Automotive fuels from biomass via gasification." Fuel
Processing Technology 91(8): 866-876.
Zhang W, Forsman B, et al. (2005). Biofuels in Sweden. 7th World Congress on
Recovery, Recycling and Re-integration. Beijing, China.
Zhang, W., U. Söderlind, et al. (2007). Coal Gasification - for LKAB Pelletizing
Furnace, Dept. of Engineering, Physics and Mathematics, Mid Sweden
University.
Zheng, Y., Z. Pan, et al. (2009). "Enzymatic saccharification of dilute acid
pretreated saline crops for fermentable sugar production." Applied Energy
86(11): 2459-2465.
Zwart, R., H. Boerrigter, et al. (2006). "Production of synthetic natural gas (SNG)
from biomass." Energy Research Centre of the Netherlands (ECN).
Available at: https://www.ecn.nl/publications.

65
Zwart, R., S. van der Heijden, et al. (2010). Tar removal from low-temperature
gasifiers, ECN Petten,
http://www.ecn.nl/docs/library/report/2010/e10008.pdf.