Embed Size (px)
Citation preview
Gas Decarbonisation Pathways 2020–2050April 2020
Gas for Climate

Imprint
Date: April 2020
Contact: GuidehouseStadsplateau 15, 3521 AZ UtrechtThe Netherlands +31 30 662 3300guidehouse.com
Copyright: © 2020 Guidehouse
Authors: Daan Peters, Kees van der Leun, Wouter Terlouw, Juriaan van Tilburg, Tom Berg, Matthias Schimmel, Irina van der Hoorn, Maud Buseman, Maarten Staats, Mark Schenkel and Goher Ur Rehman Mir
Photo credits (title): © zaikina / Adobe Stock
Design: Meike Naumann Visuelle Kommunikation
Gas Decarbonisation Pathways 2020–2050April 2020
Gas for Climate
Dear reader,
The Gas for Climate consortium is glad to present to you our new study, which analyses decarbonisation pathways from 2020 to 2050. The pathways target the Optimised Gas 2050 energy system as described in our earlier study, Gas for Climate. The optimal role for gas in a net-zero emissions energy system, published in 2019. During the past year, we have had many discussions with EU stakeholders on the 2019 Gas for Climate study, giving rise to one central question: How do we transition from today’s energy system to the 2050 net-zero emissions system? This new study answers this question by analysing and mapping out decarbonisation pathways for different sectors and implications for gas infrastructure.
The central decarbonisation pathway of our new study is called the Accelerated Decarbonisation Pathway. It shows how a step-wise approach, seizing investment opportunities in the coming decade, can put Europe on course towards a faster and more cost-effective decarbonisation of its energy system compared to current EU trends. This does require the European Green Deal to accelerate investments by improving business cases and providing a stable framework.
In this time of unprecedented public health challenges and economic pressure, climate change mitigation and economic recovery must go hand in hand. In the aftermath of the current health crisis, the required EU and national stimulus packages should also be seen as a three-fold opportunity for Europe. Beyond creating economic growth, stimulus packages can drive forward the energy transition and create sustainable jobs. Building up European hydrogen and biomethane value chains as described in these pathways has major economic and industrial benefits and creates large numbers of new sustainable jobs in globally relevant sectors.1
Our new study offers a pathway towards cost-effective and resilient energy system integration. We support the transition to a fully renewable energy system in which biomethane and green hydrogen play a major role in a smart combination with renewable electricity and Europe’s well-developed existing infrastructure. We also recognise that blue hydrogen can accelerate decarbonisation efforts and highlight the ability of biomethane combined with CCS to create negative emissions.
Message from the Gas for Climate consortium
1 The Gas for Climate study Job creation by scaling up renewable gas in Europe (Navigant, 2019), showed that scaling up biomethane and hydrogen production in Europe can create 600,000 to 850,000 direct jobs plus over a million indirect jobs. See: https://gasforclimate2050.eu/files/files/Navigant_Gas_for_Climate_Job_creation_by_scaling_up_renewable_gas_in_Europe.pdf
EU policy must be strengthened to effectively foster a fully integrated energy system. Gas for Climate would like policymakers to acknowledge that electricity and gas are not in competition with each other but are both needed and can reinforce each other. The Gas for Climate consortium is fully convinced that coupling the sectors electricity, gas and heat – by linking their markets and their respective infrastructures in a better coordinated and integrated way – provides the greatest overall benefits for the European energy system. The consortium therefore endorses the reports recommended cross-sectoral policy measures for inclusion in the European Green Deal:
1. Adapt the EU regulatory framework to make gas infrastructure future proof in an integrated energy system. It will be a key asset for the sustainable and cost-efficient decarbonisation of the European economy.
2. Stimulate the production of biomethane and hydrogen by a binding mandate for 10% gas from renewable sources by 2030.
3. Foster cross-border trade of hydrogen and biomethane, by amongst others a well-functioning Guarantee of Origin system. Clarify market rules for green and blue hydrogen including for hydrogen transport.
4. Incentivise demand for hydrogen and biomethane by strengthening and broadening the EU Emissions Trading System (ETS) combined with targeted and time-bound Contracts for Difference.
The consortium was supported by Guidehouse (formerly known as Navigant Consulting) in the development of this report.
We look forward to discussing these pathways and recommendations with you in the coming weeks and months!
The Gas for Climate CEOs:
Piero GattoniConsorzio Italiano Biogas
Harm GrobrüggeEuropean Biogas Association
Marcelino Oreja ArburúaEnagás
Torben Brabo Energinet
Pascal De BuckFluxys Belgium
Han FennemaGasunie
Thierry TrouvéGRTgaz
Ralph BahkeONTRAS
Jörg BergmannOGE
Marco AlveràSnam
Hans KreiselSwedegas
Dominique MocklyTeréga
The EU has embraced the target to make Europe a climate-neutral continent by 2050, and the European Commission proposed an EU Climate Law that would make this a legally binding objective. In the Commission’s EU Green Deal communication, it concluded that greenhouse gas emission reduction goals for 2030 need to be increased from 40% to either 50% or 55% to achieve this goal. The European Parliament has indicated a preference for the latter target. The European Green Deal’s ambition needs to translate into significant public and private investments in energy efficiency, renewable energy, new low carbon technologies, and grid infrastructure. Such investments are made for a period of 20–60 years, which means that in many cases only one investment cycle remains between now and 2050. Companies, investors, and policy makers need to understand what types of investments are needed, at what scale and by when. For the EU to achieve a 55% greenhouse gas emission reduction by 2030 and climate neutrality by mid-century, renewable molecules, renewable electricity, and a more integrated use of the electricity grids and the gas grids are required. Renewable and low carbon gases and gas infrastructure have an important role to play to cost-effectively achieve a reliable net-zero EU energy system by 2050.
Hydrogen and biomethane can be used for almost all energy end use. In some cases, such as for heavy industry, full decarbonisation is difficult to achieve without the use of gas. In power generation, using hydrogen and biomethane for the dispatchable electricity that complements large shares of wind and solar power avoids an overly expensive climate
transition and assures security of supply at all times. Elsewhere, such as in heating buildings, the combined use of gas and electricity reduces societal cost and increases optionality, and therefore the likelihood that Europe can achieve climate neutrality by mid-century. A smart energy system integration means that renewable and low carbon gases are transported, stored, and distributed through gas infrastructure and are used in a smart combination with the electric grid to transport increasing amounts of renewable electricity.
This new Gas for Climate study develops gas decarbonisation pathways from 2020 to 2050, and identifies what investments and actions are needed across the energy system along the way. The central pathway in this study achieves the 2050 Optimised Gas end state, as analysed in the Gas for Climate 2019 study.
The Gas for Climate study published in 2019 showed that a smart combination of renewable electricity and gas can fully decarbonise the EU energy system at the lowest societal costs.2 It concluded that it is
2 Navigant, 2019. Gas for Climate. The optimal role for gas in a net-zero emissions energy system. Available at: https://www.gasforclimate2050.eu/files/files/Navigant_Gas_for_Climate_The_optimal_role_for_gas_in_a_net_zero_emissions_ energy_system_March_2019.pdf
Executive summary
A smart energy system integration increases the likelihood that the EU can meet its climate goals
possible to scale-up the deployment of biomethane and hydrogen to 2,900 TWh (net calorific value),3 which is equivalent to 270 bcm of natural gas. It also showed that renewable electricity should be scaled up sevenfold by 2050 (to almost 7,000 TWh) to enable full decarbonisation. The study concluded that, compared to a Minimal Gas scenario, the Optimised Gas scenario leads to societal cost savings of over €200 billion annually by 2050.4
The present study analyses individual decarbonisation pathways for the demand side (buildings, industry, transport, power generation) that are matched with scale-up pathways for biomethane and hydrogen. The specific pathways are blended in three overall pathway scenarios that also include implications for gas infrastructure:
→ Current EU Trends Pathway: Expected developments during the period from 2020 to 2030 based on full implementation of the existing EU 2030 climate and energy policies. It concludes that current climate and energy policy falls short of what is needed to achieve timely and cost-efficient full decarbonisation; developments would be too slow to enable a scale-up of renewable and low carbon gas in line with the Gas for Climate 2050 Optimised Gas end state.
→ Accelerated Decarbonisation Pathway: The supply and demand of renewable electricity, hydrogen, and biomethane will accelerate by grasping innovations and investment opportunities. Gas infrastructure will increasingly diversify to facilitate flows of hydrogen and biomethane. This pathway leads to proposals
for the European Green Deal, which can be a great accelerator of low carbon investments by improving business cases and by providing a stable framework.
→ Global Climate Action Pathway: The rest of the world follows Europe’s example in reducing greenhouse gas emissions in line with climate science and the Paris Agreement. This optimistic scenario spurs innovation in clean technologies globally and achieves even faster decarbonisation including an accelerated deployment of renewable and low carbon gases and international trade in renewable energy carriers.
EU policy must be strengthened to effectively foster the decarbonisation of the European gas sector. We recommend the EU Green Deal include the following cross-sectoral policy measures:
1. Adapt the EU regulatory framework to make gas infrastructure future proof in an integrated energy system. It will be a key asset for the sustainable and cost-efficient decarbonisation of the European economy.
2. Stimulate the production of biomethane and hydrogen by a binding mandate for 10% gas from renewable sources by 2030.
3. Foster cross-border trade of hydrogen and biomethane, by amongst others a well-functioning Guarantee of Origin system. Clarify market rules for green and blue hydrogen including for hydrogen transport.
4. Incentivise demand for hydrogen and biomethane by strengthening and broadening the EU Emissions Trading System (ETS) combined with targeted and time-bound Contracts for Difference.
Additional sector-specific policy recommendations are detailed in Chapter 4. 2020: Gas infrastructure serves natural gas and renewable and low carbon gases in their infancy
Gas infrastructure is essential to providing energy security as it transports and stores large volumes of natural gas. Biomethane and hydrogen still play
3 Energy supply and demand throughout the report are reported on a net calorific value (NCV) value basis. The NCV, or lower heating value (LHV), is the total heat produced by burning a fuel, minus the heat needed to evaporate the water present in the fuel or produced during its combustion. Definition based on OECD/IEA, 2014. Energy Statistics Manual. Available at: https://ec.europa.eu/eurostat/ramon/statmanuals/files/Energy_statistics_manual_2004_EN.pdf. Specifically for natural gas, the NCV is 90% of the gross calorific value (GCV), or higher heating value (HHV).
4 Costs throughout the report are reported as real costs in €2020.
This study develops gas decarbonisation pathways from today towards an optimal climate neutral energy system by 2050
Gas Decarbonisation Pathways 2020–2050II
a minor role today. So far, the energy transition has mainly been an electricity transition. While there is increased awareness about the valuable role hydrogen and biomethane will play in the future, the potential of renewable and low carbon gases has yet to be unleashed. A noticeable amount of biogas (around 170 TWh/year) is already being produced; however, this is mostly in the form of locally produced biogas that is used to produce baseload electricity and heat. Green hydrogen production is virtually non-existent today, although an impressive number of pilot projects are ongoing and in development. The first large-scale blue hydrogen projects are under development and can be expected during the next 5 years.
The previous Gas for Climate study identified that biomethane and hydrogen will have a valuable role in several parts of the future energy system, as it can:
→ Provide storable and dispatchable renewable electricity alongside wind and solar PV
→ Heat buildings that have gas grid connections with hybrid heating solutions
→ Provide high temperature heat and feedstock in energy-intensive heavy industry
→ Provide an energy-dense fuel to heavy and long-distance road transport and shipping
→ Provide the feedstock for synthetic kerosene for aviation
However, blue and green hydrogen and biomethane are not available in large quantities today and must be scaled up. Not enough buildings are being insulated today to decrease their energy demand or to make them suitable for hybrid heating solutions. While hybrid heat pumps consist of well-known components, this combination of a gas-fired boiler and an electric heat pump has not made its way to European buildings yet. Heavy industry has just begun to assess its options for full decarbonisation. Electric passenger cars have started to ramp up, but it is still early days for the decarbonisation of heavy road transport, shipping, and aviation.
Power generation is already decarbonising rapidly, mainly by growing the share of renewable electricity and by natural gas replacing coal. Even in a business as usual scenario, the share of renewable electricity will continue increasing because of rapidly decreasing costs. A rapid increase in wind power and solar PV will increase the need for energy storage. Energy storage can be delivered by batteries for several days, and battery costs decrease rapidly. However, batteries
are not suitable for storage that is longer or seasonal. Gas storage can provide longer-term energy storage at low costs.
Current EU climate and energy policies enable a limited scale-up of renewable and low carbon gas
Europe’s current energy and climate policies and national energy and climate plans (NECP) are largely based on the EU Clean Energy Package, launched in November 2016. The policies aim to achieve a greenhouse gas emission reduction of 40% by 2030, compared to 1990 levels. The energy efficiency and renewable energy targets were revised upwards in 2018, effectively raising the resulting overall greenhouse gas reduction by 2030 from 40% to 46%. Existing policies continue to drive the effort to green electricity supply. Renewable electricity is expected to reach a share of around 55% in 2030, which is a significant achievement.
Yet, the same policies and subsidy schemes that drive a rapid decarbonisation of electricity production were not designed to decarbonise gas. Current EU climate and energy policies do not provide structural drivers for the increase of biomethane supply to the gas grid. During the 2020s, production of green hydrogen will mainly be restricted to pilot and demonstration projects, as almost all renewable electricity will still be needed to satisfy the growing demand for direct electricity. The expected 2030 CO2 price (around €35/tCO2 based on the current EU ETS, broadly in line with IEA WEO 2019) is not enough to introduce blue hydrogen as a large-scale replacement of grey hydrogen produced without carbon capture and storage (CCS), which requires a CO2 price of around €50/tCO2. Nor will there be sufficient incentives to accelerate the development and scale-up of green hydrogen techniques.
On the energy demand side, current policies provide little long-term certainty and too low a carbon price for heavy industry to invest in deep
EU climate policies that led to a record-speed decarbonisation of electricity production are not designed to decarbonise gas
Executive summaryIII
decarbonisation technologies during major reinvestment moments in the 2020s. In buildings, Europe will not see a significant acceleration of energy renovations. In transport, current policies stimulate the decarbonisation of light road transport, while EVs become cheaper and driving ranges increase. However, it is difficult to see current policies and available technologies leading to deep decarbonisation in shipping and aviation, which both require renewable molecules.
As a result, the Current EU Trends Pathway shows that developments in the 2020s will be too slow to scale-up renewable and low carbon gas in line with the Gas for Climate 2050 Optimised Gas end state.
In this scenario, existing gas infrastructure continues to be used for the import, transport, and storage of natural gas, with some increased grid injection of biomethane and some relatively short, dedicated hydrogen pipelines to transport hydrogen point-to-point, mainly within industrial clusters.
Much more is possible: Accelerated Decarbonisation Pathway
Because current EU climate and energy policies and NECPs fall short of achieving net-zero emissions by 2050, this study analyses two pathways that go beyond current policies and achieve net-zero emissions by 2050. The Accelerated Decarbonisation Pathway is based on the emerging EU Green Deal, which was announced by the European Commission in December 2019. It is our central scenario and explores what is needed to deliver a greenhouse gas reduction of 55% by 2030 compared to 1990 levels, and to get on track for net-zero emissions by 2050. The scenario includes necessary actions by the energy, industry, buildings, and transportation sectors to decarbonise rapidly with the help of renewable and low carbon gases.
In the Accelerated Decarbonisation Pathway, the scale-up of private investments is driven by a more ambitious political and regulatory framework, providing long-term policy certainty. This results in energy renovations for buildings ramping up much faster, and hybrid heating solutions being actively brought to the market. Heavy industry would get long-term policy certainty and an assumed higher EU ETS price of around €55/tCO2 in 2030, gradually increasing to €150/tCO2 by mid-century to allow deep decarbonisation in all industrial processes. Accompanied by additional support measures, this would enable strong developments in the coming decade:
→ Heavy industry uses natural reinvestment cycles to convert industrial facilities into net-zero emissions industrial sites from the 2020s onwards, based on using hydrogen and biomethane alongside renewable electricity.
→ Heavy road transport starts to decarbonise with a rapidly growing role for hydrogen fuel cell trucks, as well as electric trucks, and trucks running on bio-LNG (liquefied biomethane) or bio-CNG.
→ Ocean shipping rapidly moves towards the use of LNG (liquefied natural gas) as a fuel, paving the way for bio-LNG and possibly ammonia.
→ Aviation starts taking up substantial quantities of biokerosene and synthetic kerosene, based on green hydrogen.
→ The share of renewable electricity in power generation increases to 60%-70% by 2030, including 40%-50% from intermittent renewable sources. The remaining 20% comes from dispatchable hydropower plants and bio-based power plants.
Increasing the share of intermittent renewable electricity after 2030 should be combined with flexible, dispatchable electricity, requiring large-scale production of green hydrogen, which can benefit from reduced electrolyser costs. Large blue hydrogen projects at industrial clusters are enabled by the higher CO2 price and improved long-term policy security. These projects will start to replace grey hydrogen as industrial feedstock. Green hydrogen is ramped up to take on a major role in the 2030s and to gradually overtake and replace blue hydrogen. Some of the installations that initially produce blue hydrogen can later be fed with part of available biomethane to create much-needed negative emissions (climate positive hydrogen). These installations could be relevant beyond 2050.
The scenario includes a rapid increase in the deployment of sustainable biomethane based on the responsible use of biomass waste and residues plus an increase in the sustainable supply of biomass from sequential cropping and carbon farming, mainly in the southern half of the EU. Large biomethane gasification units emerge at industrial locations and biogas digesters become a common sight in the European countryside. Ultimately, by 2050, biomethane supply will be constrained by the supply of sustainable biomass with low indirect land-use change (ILUC) risks. Green hydrogen is in principle demand constrained by 2050, given that a cheap supply of renewable electricity as feedstock will be abundantly available.
Gas Decarbonisation Pathways 2020–2050IV
Policy recommendations
1 Adapt the EU regulatory framework to make gas infrastructure future proof in an integrated energy system. It will be a key asset for the sustainable and cost-efficient decarbonisation of the European economy.
2 Stimulate the production of biomethane and hydrogen by a binding mandate for 10% gas from renewable sources by 2030.
3 Foster cross-border trade of hydrogen and biomethane, by amongst others a well-functioning Guarantee of Origin system. Clarify market rules for green and blue hydrogen including for hydrogen transport.
4 Incentivise demand for hydrogen and biomethane by strengthening and broadening the EU Emissions Trading System (ETS) combined with targeted and time-bound Contracts for Difference.
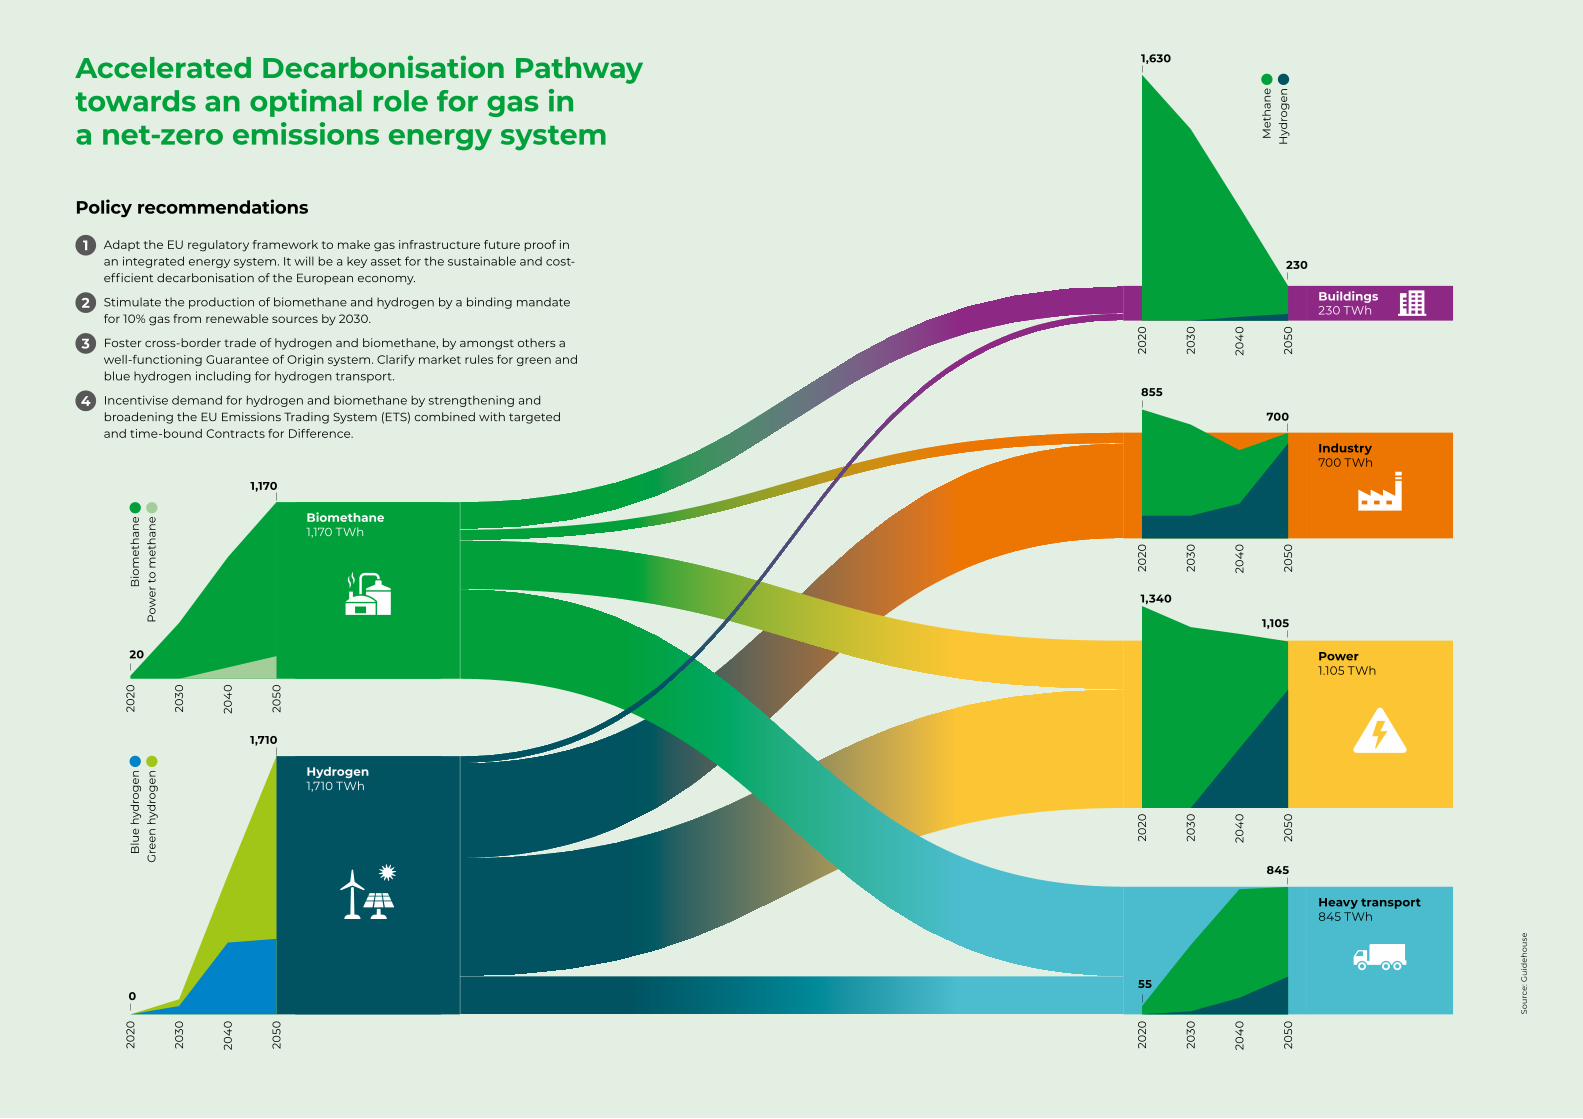
Accelerated Decarbonisation Pathway towards an optimal role for gas in a net-zero emissions energy system
700
855
2020
2030
204
0
2050
Met
han
e
Hyd
rog
en
230
1,630
2020
2030
204
0
2050
Hydrogen1,710 TWh
Biomethane1,170 TWh
Heavy transport 845 TWh
Buildings 230 TWh
Industry700 TWh
Power 1.105 TWh
2020
2030
204
0
2050
Blu
e h
ydro
gen
G
reen
hyd
rog
en
0
1,105
1,340
2020
2030
204
0
2050
1,710
2020
2030
204
0
2050
Bio
met
han
e P
ower
to
met
han
e
20
1,170
Sou
rce:
Gu
ideh
ouse
845
55
2020
2030
204
0
2050
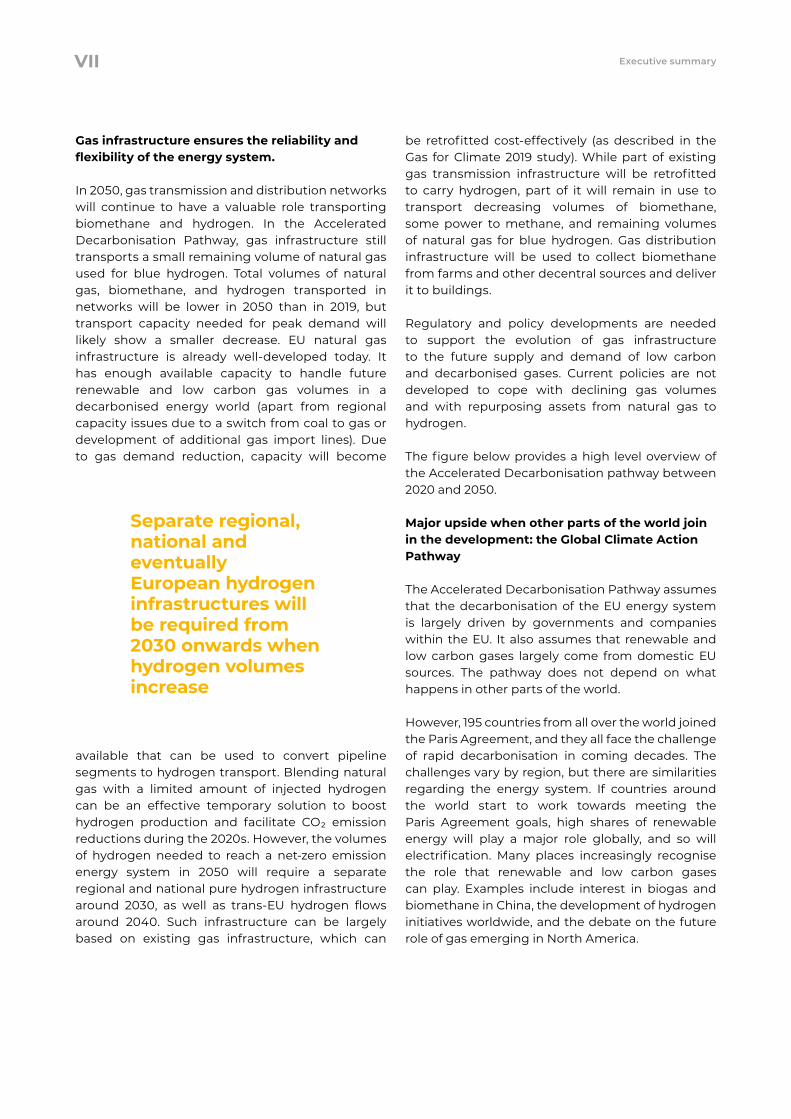
Gas infrastructure ensures the reliability and flexibility of the energy system.
In 2050, gas transmission and distribution networks will continue to have a valuable role transporting biomethane and hydrogen. In the Accelerated Decarbonisation Pathway, gas infrastructure still transports a small remaining volume of natural gas used for blue hydrogen. Total volumes of natural gas, biomethane, and hydrogen transported in networks will be lower in 2050 than in 2019, but transport capacity needed for peak demand will likely show a smaller decrease. EU natural gas infrastructure is already well-developed today. It has enough available capacity to handle future renewable and low carbon gas volumes in a decarbonised energy world (apart from regional capacity issues due to a switch from coal to gas or development of additional gas import lines). Due to gas demand reduction, capacity will become
available that can be used to convert pipeline segments to hydrogen transport. Blending natural gas with a limited amount of injected hydrogen can be an effective temporary solution to boost hydrogen production and facilitate CO2 emission reductions during the 2020s. However, the volumes of hydrogen needed to reach a net-zero emission energy system in 2050 will require a separate regional and national pure hydrogen infrastructure around 2030, as well as trans-EU hydrogen flows around 2040. Such infrastructure can be largely based on existing gas infrastructure, which can
be retrofitted cost-effectively (as described in the Gas for Climate 2019 study). While part of existing gas transmission infrastructure will be retrofitted to carry hydrogen, part of it will remain in use to transport decreasing volumes of biomethane, some power to methane, and remaining volumes of natural gas for blue hydrogen. Gas distribution infrastructure will be used to collect biomethane from farms and other decentral sources and deliver it to buildings.
Regulatory and policy developments are needed to support the evolution of gas infrastructure to the future supply and demand of low carbon and decarbonised gases. Current policies are not developed to cope with declining gas volumes and with repurposing assets from natural gas to hydrogen.
The figure below provides a high level overview of the Accelerated Decarbonisation pathway between 2020 and 2050.
Major upside when other parts of the world join in the development: the Global Climate Action Pathway
The Accelerated Decarbonisation Pathway assumes that the decarbonisation of the EU energy system is largely driven by governments and companies within the EU. It also assumes that renewable and low carbon gases largely come from domestic EU sources. The pathway does not depend on what happens in other parts of the world.
However, 195 countries from all over the world joined the Paris Agreement, and they all face the challenge of rapid decarbonisation in coming decades. The challenges vary by region, but there are similarities regarding the energy system. If countries around the world start to work towards meeting the Paris Agreement goals, high shares of renewable energy will play a major role globally, and so will electrification. Many places increasingly recognise the role that renewable and low carbon gases can play. Examples include interest in biogas and biomethane in China, the development of hydrogen initiatives worldwide, and the debate on the future role of gas emerging in North America.
Separate regional, national and eventually European hydrogen infrastructures will be required from 2030 onwards when hydrogen volumes increase
Executive summaryVII
The Global Climate Action Pathway assumes that, if other continents increase climate mitigation actions, the speed, scale, and cost of renewable and low carbon gas developments will benefit the EU’s energy transition. Overall, technology costs will decrease faster on the demand side (e.g. hybrid heating solutions and hydrogen trucks) and the supply side (e.g. in biomethane from gasification and
imported green and blue hydrogen). Opportunities for importing cheap renewable energy will also arise, such as methanol and synthetic kerosene produced from hydrogen outside Europe. As a result, the energy transition will go faster and at lower societal costs. This provides a major upside for the societal costs of the energy transition compared to the Accelerated Decarbonisation Pathway.
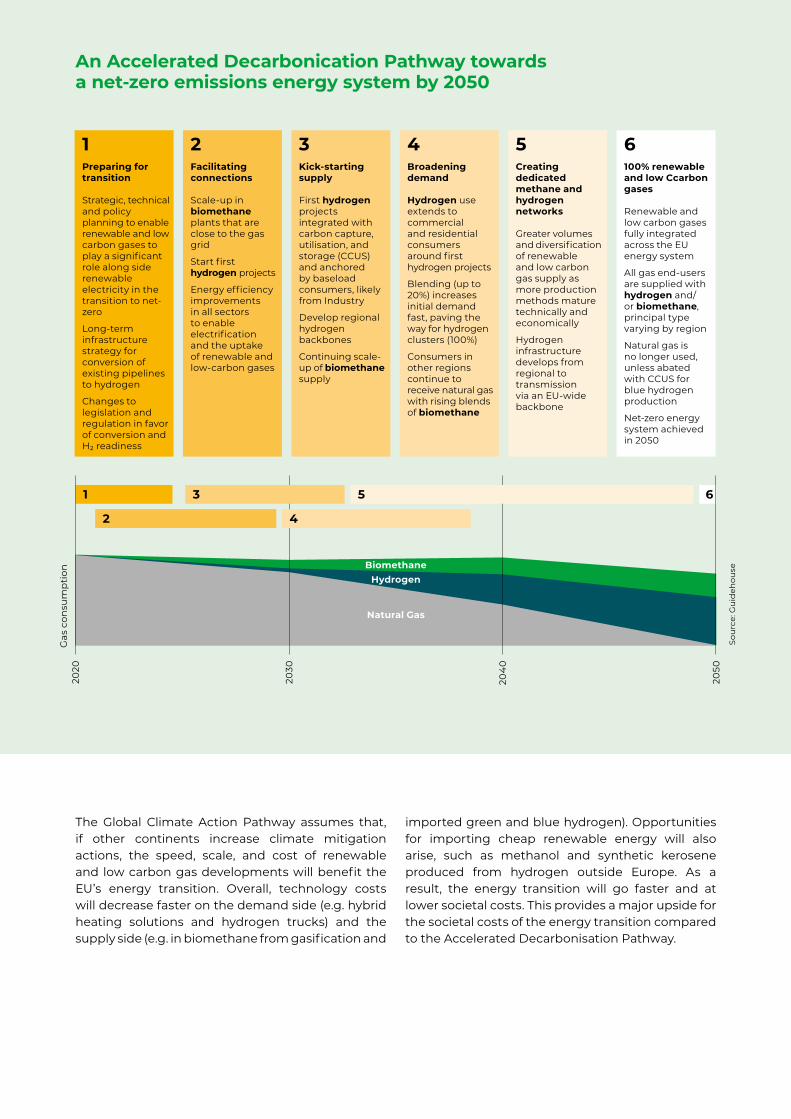
An Accelerated Decarbonication Pathway towards a net-zero emissions energy system by 2050
1 Preparing for transition
Strategic, technical and policy planning to enable renewable and low carbon gases to play a significant role along side renewable electri city in the transition to net-zero
Long-term infrastructure strategy for conversion of existing pipelines to hydrogen
Changes to legislation and regulation in favor of conversion and H2 readiness
2 Facilitating connections
Scale-up in biomethane plants that are close to the gas grid
Start first hydrogen projects
Energy efficiency improvements in all sectors to enable electrification and the uptake of renewable and low-carbon gases
3 Kick-starting supply
First hydrogen projects integrated with carbon capture, utilisation, and storage (CCUS) and anchored by baseload consumers, likely from Industry
Develop regional hydrogen backbones
Continuing scale-up of biomethane supply
4 Broadening demand
Hydrogen use extends to commercial and residential consumers around first hydrogen projects
Blending (up to 20%) increases initial demand fast, paving the way for hydrogen clusters (100%)
Consumers in other regions continue to receive natural gas with rising blends of biomethane
5 Creating dedicated methane and hydrogen networks
Greater volumes and diversification of renewable and low carbon gas supply as more production methods mature technically and economically
Hydrogen infrastructure develops from regional to transmission via an EU-wide backbone
6 100% renewable and low Ccarbon gases
Renewable and low carbon gases fully integrated across the EU energy system
All gas end-users are supplied with hydrogen and/or biomethane, principal type varying by region
Natural gas is no longer used, unless abated with CCUS for blue hydrogen production
Net-zero energy system achieved in 2050
1 6
2020
2050
204
0
2030
Gas
con
sum
pti
on
BiomethaneHydrogen
Natural Gas
3 5
2 4
Sou
rce:
Gu
ideh
ouse
Content
1. Introduction
1.1 Gas for Climate
1.2 Study aim and scope
1.3 Reading guide
2. An Accelerated Decarbonisation Pathway to speed up the energy transition
2.1 Supply of renewable and low carbon gases
2.1.1 Biomethane deployment pathway
2.1.2 Hydrogen deployment pathway
1
2
4
7
8
11
12
17
2.2 Decarbonisation of EU energy demand
2.2.1 Buildings decarbonisation pathway
2.2.2 Industry decarbonisation pathway
2.2.3 Transport decarbonisation pathway
2.3 Decarbonisation of the EU power sector
2.4 Gas infrastructure developments 2020 to 2050
2.4.1 The role of gas grids in Europe today and in the future
2.4.2 Gas infrastructure developments 2020 to 2030 under Accelerated Decarbonisation
2.4.3 Gas infrastructure developments 2030 to 2050
21
21
26
30
34
39
41
43
48
3. How do current EU policies help to decarbonise EU gas supply?
4. Gas for Climate proposals for the EU Green Deal
4.1 Enable the construction of thousands of new biomethane plants
4.2 Develop a solid business case for hydrogen in the next decade
4.3 Make existing gas grids ready for renewable and low carbon gas
4.4 Apply hybrid heating solutions in 100 million older buildings
4.5 Ensure that EU industry opts for deep decarbonisation investments
4.6 Set the transition towards carbon neutral transport
4.7 Ensure continuous power supply with gas-fired power plants
5. What if the future develops differently: Alternatives to the central pathway
51
61
66
68
70
71
73
75
77
79
Abbreviations
A ASU Air separation unit
ATR Autothermal reforming
B BAU Business as usual
bcm Billion cubic meters*
BECCS Bio-energy with carbon capture and storage
BEV Battery electric vehicle
C CAPEX Capital expenditure
CCGT Combined cycle gas turbine
CCS Carbon capture and storage
CCU Carbon capture and utilisation
CfD Contracts for Difference
CH4 Methane
CHP Combined heat and power
CNG Compressed natural gas
CO2 Carbon dioxide
D DRI Direct reduction of iron ore
DSO Distribution system operator
E EED Energy Efficiency Directive
EPBD Energy Performance for Buildings Directive
EU ETS EU Emission Trading Scheme
EUA European Emission Allowance
EV Electric vehicle
F FCV Fuel cell vehicle
G GCV** Gross calorific value
GW Gigawatt
H H2 Hydrogen
HHV** Higher heating value
HVC High value chemical
I ICAO International Civil Aviation Organisation
ICE Internal combustion engine
IEA International Energy Agency
ILUC Indirect land-use change
IMO International Maritime Organisation
K km Kilometre
kWh Kilowatt-hour
L LCOE Levelised cost of energy
LHV** Lower heating value
LNG Liquefied natural gas
LTRS Long-Term Renovation Strategies
M MaaS Mobility as a service
MTO Methanol to olefins
MWh Megawatt-hour
N NCV** Net calorific value
NECP National energy and climate plan
NGO Nongovernmental organisation
NH3 Ammonia
NOAK Nth of a kind
O OCGT Open cycle gas turbine
OPEX Operational expenditure
P PV Photovoltaic
R RED Renewable Energy Directive
S SMR Steam methane reforming
SNG Synthetic natural gas
T TCO Total cost of ownership
TSO Transmission system operators
TWh Terawatt hour
TYNDP Ten Year Network Development Plans
5 Definition based on OECD/IEA, 2014. Energy Statistics Manual. Available at: https://ec.europa.eu/eurostat/ramon/statmanuals/files/Energy_statistics_manual_2004_EN.pdf.
* When energy supply and demand is provided in bcm natural gas equivalent, energy in TWh is converted to bcm based on a lower heating value (LHV) for natural gas of 38.2 MJ/m3 (EU high calorific natural gas). 1 bcm natural gas equivalent equals 10.61 TWh.
** Energy supply and demand throughout the report are reported on a net calorific value (NCV) value basis. The NCV, or LHV, is the total heat produced by burning a fuel, minus the heat needed to evaporate the water present in the fuel or produced during its combustion.5 Specifically for natural gas, the NCV is 90% of the gross calorific value (GCV) or higher heating value (HHV).
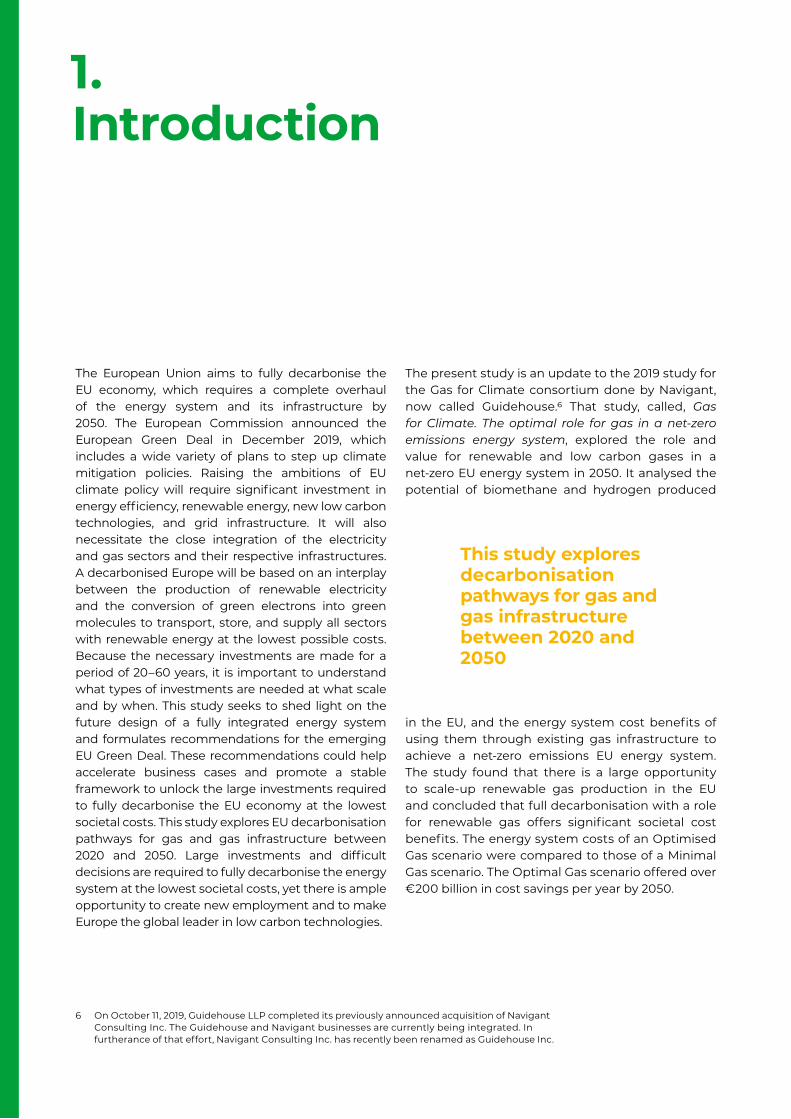
The European Union aims to fully decarbonise the EU economy, which requires a complete overhaul of the energy system and its infrastructure by 2050. The European Commission announced the European Green Deal in December 2019, which includes a wide variety of plans to step up climate mitigation policies. Raising the ambitions of EU climate policy will require significant investment in energy efficiency, renewable energy, new low carbon technologies, and grid infrastructure. It will also necessitate the close integration of the electricity and gas sectors and their respective infrastructures. A decarbonised Europe will be based on an interplay between the production of renewable electricity and the conversion of green electrons into green molecules to transport, store, and supply all sectors with renewable energy at the lowest possible costs. Because the necessary investments are made for a period of 20–60 years, it is important to understand what types of investments are needed at what scale and by when. This study seeks to shed light on the future design of a fully integrated energy system and formulates recommendations for the emerging EU Green Deal. These recommendations could help accelerate business cases and promote a stable framework to unlock the large investments required to fully decarbonise the EU economy at the lowest societal costs. This study explores EU decarbonisation pathways for gas and gas infrastructure between 2020 and 2050. Large investments and difficult decisions are required to fully decarbonise the energy system at the lowest societal costs, yet there is ample opportunity to create new employment and to make Europe the global leader in low carbon technologies.
The present study is an update to the 2019 study for the Gas for Climate consortium done by Navigant, now called Guidehouse.6 That study, called, Gas for Climate. The optimal role for gas in a net-zero emissions energy system, explored the role and value for renewable and low carbon gases in a net-zero EU energy system in 2050. It analysed the potential of biomethane and hydrogen produced
in the EU, and the energy system cost benefits of using them through existing gas infrastructure to achieve a net-zero emissions EU energy system. The study found that there is a large opportunity to scale-up renewable gas production in the EU and concluded that full decarbonisation with a role for renewable gas offers significant societal cost benefits. The energy system costs of an Optimised Gas scenario were compared to those of a Minimal Gas scenario. The Optimal Gas scenario offered over €200 billion in cost savings per year by 2050.
6 On October 11, 2019, Guidehouse LLP completed its previously announced acquisition of Navigant Consulting Inc. The Guidehouse and Navigant businesses are currently being integrated. In furtherance of that effort, Navigant Consulting Inc. has recently been renamed as Guidehouse Inc.
1. Introduction
This study explores decarbonisation pathways for gas and gas infrastructure between 2020 and 2050
The current study analyses the road towards 2050. It explores EU energy system decarbonisation pathway scenarios between 2020 and 2050, focussing on the role of gas and gas infrastructure. Three pathway scenarios are described, including a central Accelerated Decarbonisation Pathway. This pathway assumes that the recently announced EU Green Deal can accelerate the decarbonisation of the EU gas demand, enabling Europe to decarbonise at the lowest possible costs as described in the Gas for Climate 2019 Optimised Gas scenario. In addition, two alternative pathways are being analysed as well as several sensitivities to the central Accelerated Decarbonisation Pathway.
1.1 Gas for Climate
In June 2017, a group of European gas transmission system operators (TSOs) and biogas associations convened to explore the future role and value of gas and gas infrastructure in a fully integrated and decarbonised EU energy system. This became
the Gas for Climate initiative. Gas for Climate is committed to achieving net-zero greenhouse gas emissions in the EU by 2050, mainly through renewable energy. The group sees an important
role for existing gas infrastructure to the transport, storage, and distribution of biomethane and hydrogen in a smart combination with a large increase of renewable electricity. The group consists of ten TSOs (Enagás, Energinet, Fluxys Belgium, Gasunie, GRTgaz, ONTRAS, OGE, Snam, Swedegas, and Teréga) and two biomethane associations (EBA and Consorzio Italiano Biogas). Members are based in eight EU member states.
Gas for Climate consists of ten leading European gas TSOs and two biomethane associations
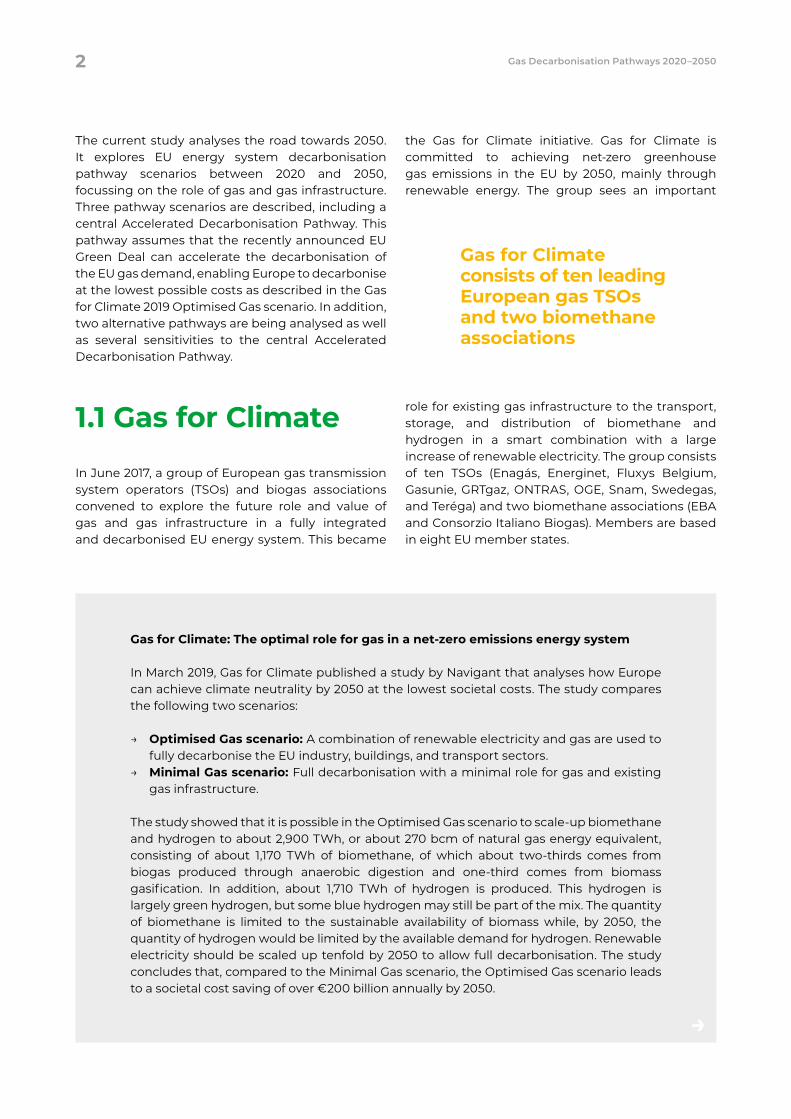
Gas for Climate: The optimal role for gas in a net-zero emissions energy system
In March 2019, Gas for Climate published a study by Navigant that analyses how Europe can achieve climate neutrality by 2050 at the lowest societal costs. The study compares the following two scenarios:
→ Optimised Gas scenario: A combination of renewable electricity and gas are used to fully decarbonise the EU industry, buildings, and transport sectors.
→ Minimal Gas scenario: Full decarbonisation with a minimal role for gas and existing gas infrastructure.
The study showed that it is possible in the Optimised Gas scenario to scale-up biomethane and hydrogen to about 2,900 TWh, or about 270 bcm of natural gas energy equivalent, consisting of about 1,170 TWh of biomethane, of which about two-thirds comes from biogas produced through anaerobic digestion and one-third comes from biomass gasification. In addition, about 1,710 TWh of hydrogen is produced. This hydrogen is largely green hydrogen, but some blue hydrogen may still be part of the mix. The quantity of biomethane is limited to the sustainable availability of biomass while, by 2050, the quantity of hydrogen would be limited by the available demand for hydrogen. Renewable electricity should be scaled up tenfold by 2050 to allow full decarbonisation. The study concludes that, compared to the Minimal Gas scenario, the Optimised Gas scenario leads to a societal cost saving of over €200 billion annually by 2050.
2 Gas Decarbonisation Pathways 2020–2050
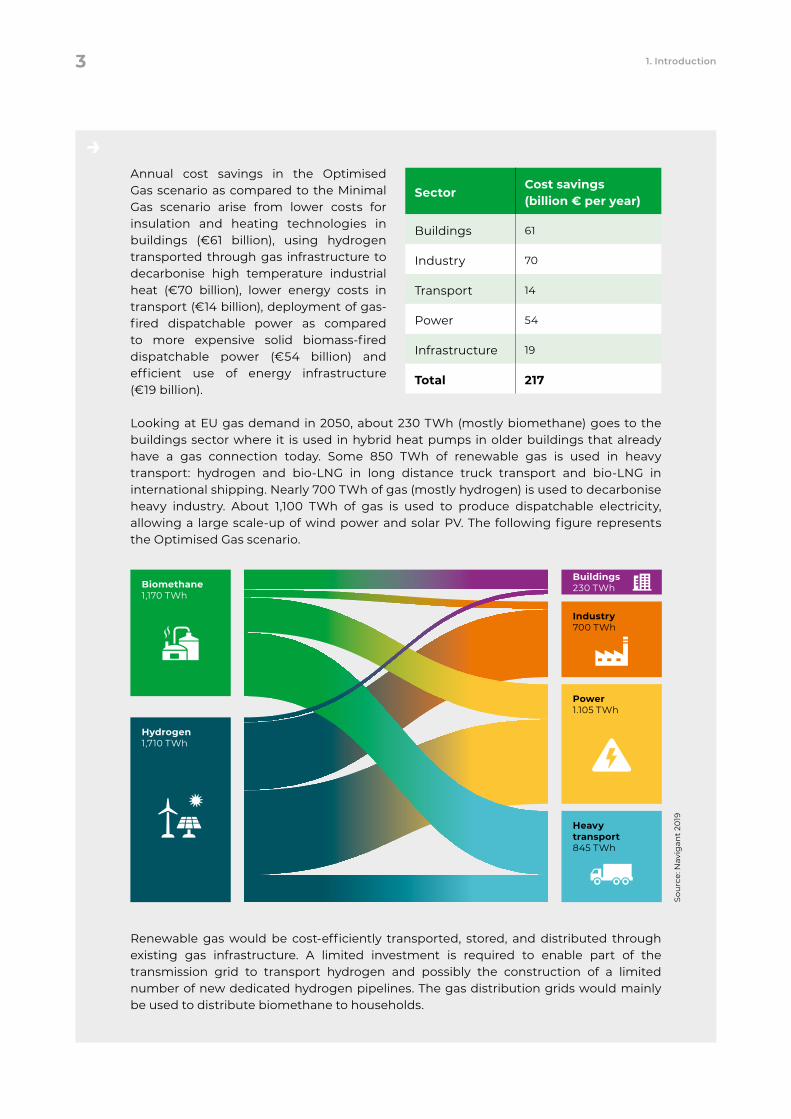
Annual cost savings in the Optimised Gas scenario as compared to the Minimal Gas scenario arise from lower costs for insulation and heating technologies in buildings (€61 billion), using hydrogen transported through gas infrastructure to decarbonise high temperature industrial heat (€70 billion), lower energy costs in transport (€14 billion), deployment of gas-fired dispatchable power as compared to more expensive solid biomass-fired dispatchable power (€54 billion) and efficient use of energy infrastructure (€19 billion).
Looking at EU gas demand in 2050, about 230 TWh (mostly biomethane) goes to the buildings sector where it is used in hybrid heat pumps in older buildings that already have a gas connection today. Some 850 TWh of renewable gas is used in heavy transport: hydrogen and bio-LNG in long distance truck transport and bio-LNG in international shipping. Nearly 700 TWh of gas (mostly hydrogen) is used to decarbonise heavy industry. About 1,100 TWh of gas is used to produce dispatchable electricity, allowing a large scale-up of wind power and solar PV. The following figure represents the Optimised Gas scenario.
Renewable gas would be cost-efficiently transported, stored, and distributed through existing gas infrastructure. A limited investment is required to enable part of the transmission grid to transport hydrogen and possibly the construction of a limited number of new dedicated hydrogen pipelines. The gas distribution grids would mainly be used to distribute biomethane to households.
SectorCost savings (billion € per year)
Buildings 61
Industry 70
Transport 14
Power 54
Infrastructure 19
Total 217
Hydrogen1,710 TWh
Biomethane1,170 TWh
Heavy transport 845 TWh
Buildings 230 TWh
Industry700 TWh
Power 1.105 TWh
Sou
rce:
Nav
igan
t 20
19
3 1. Introduction
1.2 Study aim and scope
The 2019 Gas for Climate study informed the European debate on how the EU energy system can be fully decarbonised in a cost-effective way. There is increasing consensus across Europe regarding the need to fully decarbonise by 2050 and the notion that this will require a complete overhaul of the current fossil fuel-dominated energy system and a large scale-up of renewable electricity. Moreover, an energy system based on intermittent wind and solar requires substantial storage and transport capacity to handle fluctuations in supply and demand.
Coupling the sectors electricity, gas, and heat—by linking their markets and their respective infrastructure in a better coordinated and integrated way—provides the greatest overall benefits for the European energy system. A fully integrated system creates additional flexibility, in terms of storage and transport capacity, and thus makes the best possible use of the advantages of Europe’s well-developed existing infrastructure. This coupled energy system is based on renewable electricity and combined with large quantities of renewable gas, ensuring a cost-efficient decarbonisation of industry, heavy transport, and the buildings sector.
The 2019 Gas for Climate study focused on the optimal decarbonised energy system in 2050. The 2020 study describes how to get there. The 2020 study’s pathways focus on the increased supply and demand of renewable and low carbon gas and describe the development of gas infrastructures and the continued increase in renewable electricity. To ensure specific sector needs are considered, Gas for Climate developed pathways for seven topics: biomethane (anaerobic digestion and gasification), hydrogen (blue and green hydrogen), buildings, industry, transport, power, and gas infrastructure (Figure 1).
This study benefits from the thorough reviews of Gas for Climate member organisations. Industry and NGO stakeholders also provided valuable feedback and input on the pathways and their underlying assumptions.
This study describes three pathways:
1. Current EU Trends Pathway
The Current EU Trends Pathway describes how a renewable and low carbon gas pathway develops without the EU Green Deal measures. To determine if reaching the 2050 end state is realistic, the pathway assumes similar efforts in the period 2030−2050 as in the period 2020−2030.
The Current EU Trends Pathway includes all EU policy through 2030, including EU policies that still need to be transposed into national policies; for example, as part of the national energy and climate plans (NECPs). It is not a business as usual scenario since not all EU policies and targets are transposed into national policies; with current developments, the EU targets might not be reached.
2. Accelerated Decarbonisation Pathway
The Accelerated Decarbonisation Pathway shows the accelerated deployment of renewable and low carbon gas as a result of current EU policies and additional policies that could be included in the emerging EU Green Deal, which will be detailed
in legislation and a number of strategies, e.g. on EU industry and a circular economy. The pathway is in line with the Paris Agreement’s ambition to limit global temperature increase to well below 2°C. As such, the scenario results in 55% emission reductions by 2030 compared to 1990 levels, as included as an ambition for the EU Green Deal.
The Accelerated Decarbonation Pathway showcases how we can reach an affordable and reliable EU energy system
4 Gas Decarbonisation Pathways 2020–2050
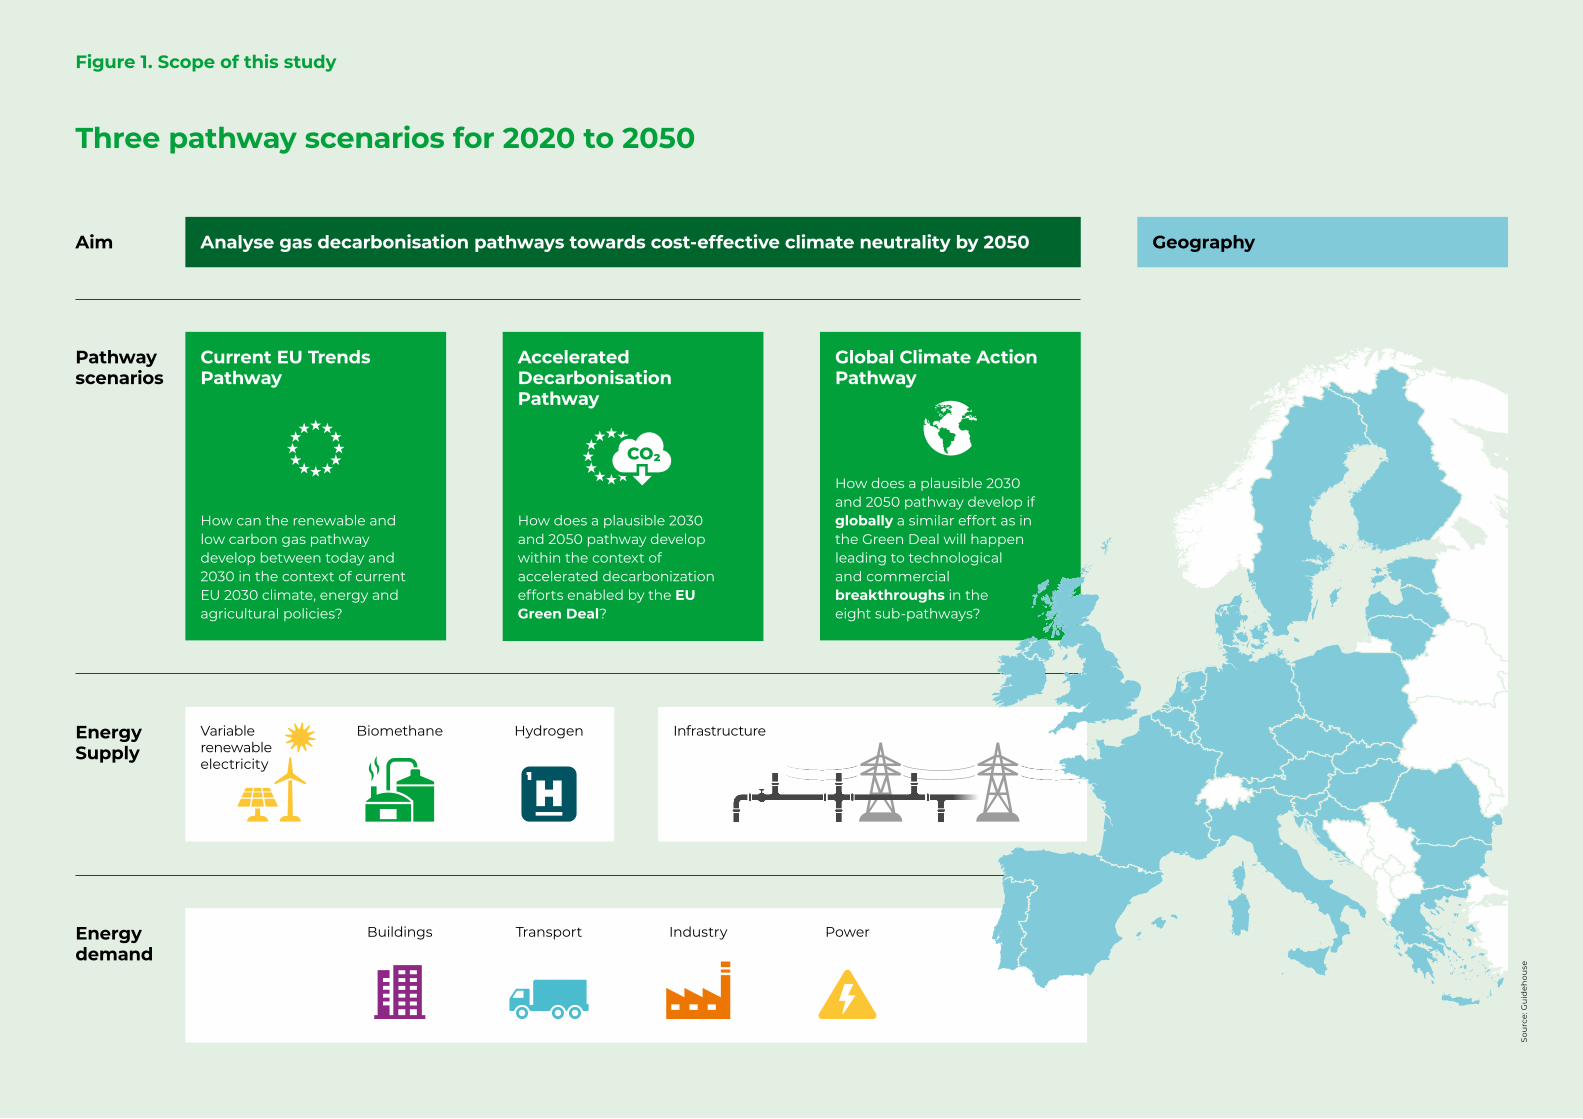
Aim Analyse gas decarbonisation pathways towards cost-effective climate neutrality by 2050 Geography
Pathway scenarios
Current EU Trends Pathway
How can the renewable and low carbon gas pathway develop between today and 2030 in the context of current EU 2030 climate, energy and agricultural policies?
Accelerated Decarbonisation Pathway
How does a plausible 2030 and 2050 pathway develop within the context of accelerated decarbonization efforts enabled by the EU Green Deal?
Global Climate Action Pathway
How does a plausible 2030 and 2050 pathway develop if globally a similar effort as in the Green Deal will happen leading to technological and commercial breakthroughs in the eight sub-pathways?
Energy Supply
Variable renewable electricity
HydrogenBiomethane Infrastructure
Energy demand
Buildings PowerIndustryTransport
Three pathway scenarios for 2020 to 2050
Figure 1. Scope of this study
Sou
rce:
Gu
ideh
ouse
Until 2030, policy-driven developments in the Accelerated Decarbonisation Pathway will get the European Union on track towards the Gas for Climate 2050 Optimised Gas end state. The Accelerated Decarbonisation Pathway describes developments already proposed under the EU Green Deal in addition to the Current EU Trends Pathway, as well as what additions are required. The Accelerated Decarbonisation Pathway will result in policy recommendations for the EU Green Deal.
3. Global Climate Action Pathway
The Global Climate Action Pathway showcases what happens if countries around the world adopt similar climate change mitigation and renewable energy ambitions as the EU. Just like the Accelerated Decarbonisation Pathway, the Global Climate Action Pathway describes a pathway in line with the Paris Agreement’s goals.
Global climate policy leads to accelerated technological development. As such, the developments in the Global Climate Action Pathway are technology driven. Compared to the Accelerated Decarbonisation Pathway, the Global Climate Action Pathway showcases these technologies have the potential to decarbonise the energy system at a higher speed, with lower cost, and with higher renewable and low carbon gas volumes. It may even show potential on top of the Gas for Climate 2050 Optimised Gas end state.
How the Pathways are described in this study
Out of the three pathways, the Accelerated Decarbonisation Pathway is central and features the most prominently in the main study report. The Current EU Trends Pathway is described briefly in Chapter 3 and more extensively in the appendices. Global Climate Action is summarised in Chapter 5 and described in more detail in the appendices.
How the analysis is done
The Gas for Climate 2019 study analysed the 2050 Optimised Gas end state, which resulted from a least-cost optimisation modelling analysis. The pathways described in this study are not modelled as optimised or least-cost scenarios. Instead, the pathways result from logical analysis combined with calculated 2030 energy and technology costs to ensure that the Accelerated Decarbonisation Pathway meets the EU’s 55% greenhouse gas reduction target by 2030.
1.3 Reading guide
The study consists of two parts. The first (Chapter 2–5) focusses on the overall study results, with a special focus on the Accelerated Decarbonisation Pathway. The second (appendices) provides specific findings for the seven topics (biomethane, hydrogen, buildings, industry, transport, power and gas infrastructure) and describes all three pathways in detail. Chapter 2 starts with the Accelerated Decarbonisation Pathway, which is our central scenario leading in 2030 to the 55% reduction ambition of the EU Green Deal and to the Gas for Climate Optimised Gas end state in 2050. We first describe accelerated biomethane and hydrogen supply pathways, followed by energy demand decarbonisation pathways, and finally detail the implications for gas infrastructure over time of increased supply and demand of hydrogen and biomethane.
To enable the developments described in Chapter 2, several EU policies are needed. This study first analyses the effect of the current EU energy and climate policies in Chapter 3. We identify that current climate and energy policies are insufficient to drive the required scale-up of hydrogen and biomethane. This subsequently leads to a series of policy recommendations described in Chapter 4. Finally, Chapter 5 summarises the Global Climate Action Pathway and includes a sensitivity analysis on the effect if developments for the different sectors are moving at a different speed or in a different direction, including a description of what could happen if the rest of the world accelerates decarbonisation efforts. The appendices cover the pathway details and contains seven chapters. They can also be read as standalone sections. The descriptions of the Accelerated Decarbonisation Pathway as included in the main study report are duplicated in the appendices to ensure that the appendices contain the full descriptions of all pathways organised by topic.
7 1. Introduction
Key takeaways → Renewable and low carbon gases are still in their infancy. There is significant biogas production today, but it largely has not been upgraded to biomethane. The first green and blue hydrogen investments have been announced.
→ The future European energy system will require renewable electricity and the scale-up of renewable and decarbonised gases. The EU Green Deal and its envisaged gas market reform can accelerate an effective decarbonisation of the European gas sector and help facilitate the transformation of Europe’s gas infrastructure in the 2020s and to create a more integrated European energy system.
→ With the right incentives in place, the energy sector will be able to massively scale-up the production of biomethane and green and blue hydrogen, initially to 10% of total gas demand by 2030 and to 100% renewable and low carbon gas by 2050.
→ Gradually, hydrogen production will become renewable based on green hydrogen from renewable electricity. Biomethane used in blue hydrogen installations can create negative emissions also after 2050, which are necessary to compensate for remaining emissions.
→ Gas infrastructure can transport, store, and distribute biomethane and hydrogen in a cost-effective way. Around 2030 dedicated hydrogen networks will emerge, gradually leading to separate hydrogen and methane infrastructures.
2. An Accelerated Decarbonisation Pathway to speed up the energy transition
In the future integrated energy system, electricity and gas fulfil complementary roles. Wind and solar power are the major primary sources of renewable energy. The advantage of transporting electricity directly to sectors where electrification is technically and economically feasible avoids energy conversion losses. Renewable and decarbonised gases will accommodate decarbonisation in sectors that are hard to electrify and can easily be transported in the existing infrastructure. Hence, their role will significantly increase compared to today.
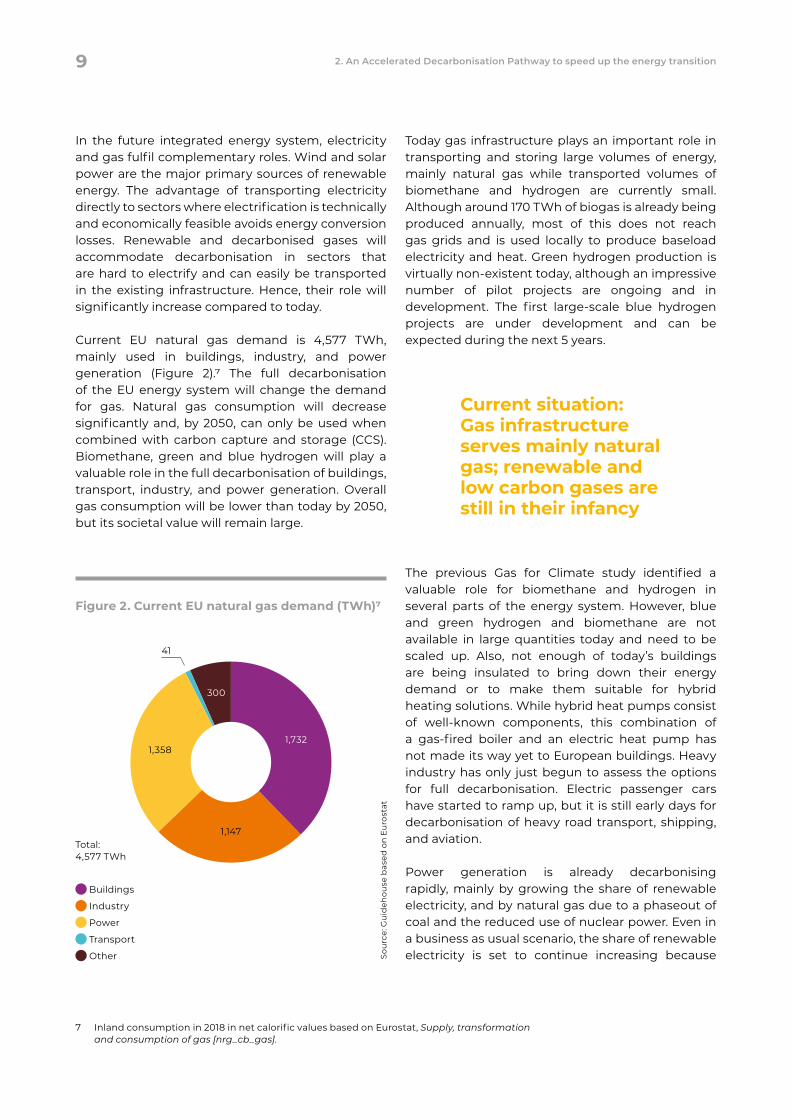
Current EU natural gas demand is 4,577 TWh, mainly used in buildings, industry, and power generation (Figure 2).7 The full decarbonisation of the EU energy system will change the demand for gas. Natural gas consumption will decrease significantly and, by 2050, can only be used when combined with carbon capture and storage (CCS). Biomethane, green and blue hydrogen will play a valuable role in the full decarbonisation of buildings, transport, industry, and power generation. Overall gas consumption will be lower than today by 2050, but its societal value will remain large.
Today gas infrastructure plays an important role in transporting and storing large volumes of energy, mainly natural gas while transported volumes of biomethane and hydrogen are currently small. Although around 170 TWh of biogas is already being produced annually, most of this does not reach gas grids and is used locally to produce baseload electricity and heat. Green hydrogen production is virtually non-existent today, although an impressive number of pilot projects are ongoing and in development. The first large-scale blue hydrogen projects are under development and can be expected during the next 5 years.
The previous Gas for Climate study identified a valuable role for biomethane and hydrogen in several parts of the energy system. However, blue and green hydrogen and biomethane are not available in large quantities today and need to be scaled up. Also, not enough of today’s buildings are being insulated to bring down their energy demand or to make them suitable for hybrid heating solutions. While hybrid heat pumps consist of well-known components, this combination of a gas-fired boiler and an electric heat pump has not made its way yet to European buildings. Heavy industry has only just begun to assess the options for full decarbonisation. Electric passenger cars have started to ramp up, but it is still early days for decarbonisation of heavy road transport, shipping, and aviation.
Power generation is already decarbonising rapidly, mainly by growing the share of renewable electricity, and by natural gas due to a phaseout of coal and the reduced use of nuclear power. Even in a business as usual scenario, the share of renewable electricity is set to continue increasing because
7 Inland consumption in 2018 in net calorific values based on Eurostat, Supply, transformation and consumption of gas [nrg_cb_gas].
Figure 2. Current EU natural gas demand (TWh)7
Buildings
Industry
Power
Transport
Other
Total:4,577 TWh
41
300
1,732
1,147
1,358
Current situation: Gas infrastructure serves mainly natural gas; renewable and low carbon gases are still in their infancy
Sou
rce:
Gu
ideh
ouse
bas
ed o
n E
uro
stat
9 2. An Accelerated Decarbonisation Pathway to speed up the energy transition
of rapidly decreasing costs. A rapid increase in wind power and solar PV will amplify the need for energy storage. Energy storage can be delivered by batteries for several days. While battery costs decrease rapidly, they are not suitable for longer, seasonal storage. Gas storage can provide longer-term energy storage at low costs.
Europe’s energy and climate policies and NECPs today are largely based on the EU Clean Energy Package launched in November 2016 and aim to achieve a greenhouse gas emission reduction of 40% by 2030, compared to 1990 levels. The energy efficiency and renewable energy targets were revised upwards in 2018, effectively already raising the resulting overall greenhouse gas reduction by 2030 from 40% to 46%.8
Chapter 3 includes analysis demonstrating that current EU climate and energy policies and NECPs fall short of achieving net-zero emissions by 2050. Therefore, this study developed the Accelerated Decarbonisation Pathway. This pathway is based on the emerging EU Green Deal, as announced
in December 2019 by the incoming European Commission. The scenario explores what is needed on top of the proposed EU Green Deal measures to deliver 55% greenhouse gas reduction by 2030 compared to 1990 levels. The scenario analyses what (private) actions are needed in the energy, industry, buildings, and transportation sectors to more rapidly scale-up the deployment of renewable and low carbon gases. Following from this scenario,
several policy recommendations emerge that can help the private sector scale-up the European gas transition, which are described in Chapter 4.
In the Accelerated Decarbonisation Pathway, energy renovations for buildings ramp up much faster, and hybrid heating solutions are brought to the market and actively propagated. Heavy industry is assumed to get long-term policy certainty and an assumed higher EU ETS price of around €55/tCO2 in 2030, which gradually increases via €100/tCO2 by 2040 to €150/tCO2 by mid-century, to allow deep decarbonisation in all industrial processes. Accompanied by additional support measures, this would enable the following:
→ Heavy industry uses natural reinvestment cycles to convert industrial facilities into net-zero emissions industrial sites from the 2020s onwards, based on using hydrogen and biomethane alongside renewable electricity.
→ Heavy road transport is decarbonised with a rapidly growing role for hydrogen fuel cell trucks as well as electric trucks and trucks running on bio-LNG.
→ Ocean shipping rapidly moves towards the use of liquefied natural gas (LNG) as a fuel, paving the way for bio-LNG and possibly ammonia.
→ Aviation starts taking up substantial quantities of biokerosene and synthetic kerosene, based on green hydrogen.
→ The share of renewable electricity in power generation increases to 60%-70% by 2030: 40%-50% of all electricity comes from intermittent renewable sources, and 20% from dispatchable hydropower plants and bio-based power plants.
Increasing the share of intermittent renewable electricity after 2030 also increases the need for dispatchable electricity and will push large-scale production of green hydrogen. Combined with reduced electrolyser costs and the emergence of large CCS projects, this will accelerate the scale-up of hydrogen. Large blue hydrogen projects at industrial clusters are enabled by the higher CO2 price and the improved long-term policy security and will initially replace grey hydrogen as industrial
8 Ecofys, 2018. The 35% renewable energy and 35% energy efficiency targets voted for by the European Parliament enable greenhouse gas emission reductions of 50% in 2030. Available at: https://guidehouse.com/-/media/www/site/downloads/energy/2018/ecofysanavigantcompanya-stepclosertoparisupdatejune.pdf
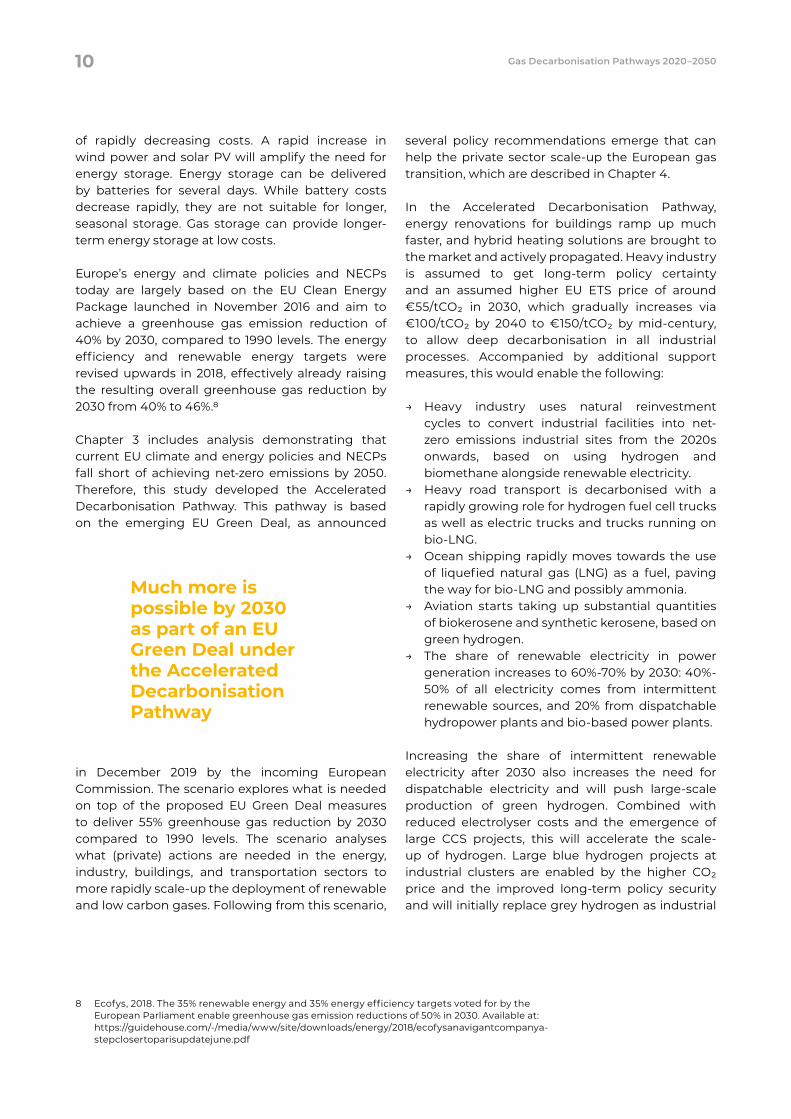
Much more is possible by 2030 as part of an EU Green Deal under the Accelerated Decarbonisation Pathway
10 Gas Decarbonisation Pathways 2020–2050
feedstock and will bridge the shortage of green hydrogen during the 2020s and early 2030s. Green hydrogen is ramped up to take on a major role in the 2030s and to gradually overtake and replace blue hydrogen. Some of the installations that initially produce blue hydrogen can later be fed with part of available biomethane to create much-needed negative emissions. These installations could be relevant even beyond 2050.
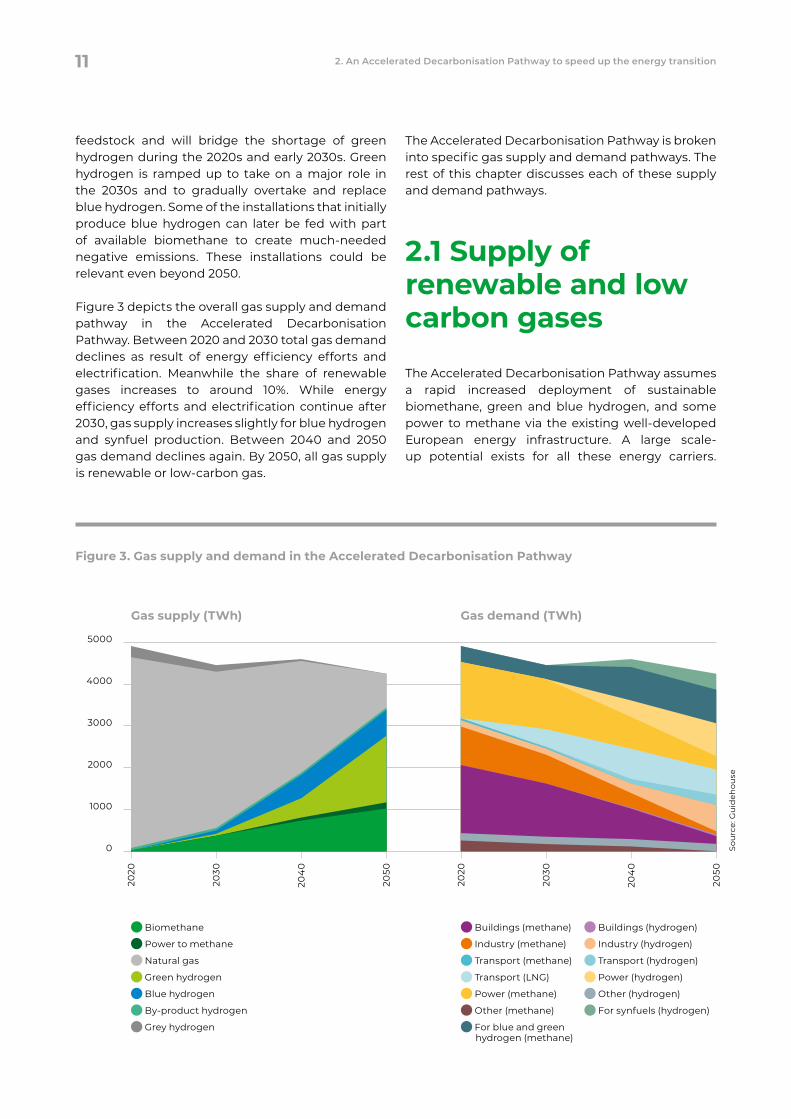
Figure 3 depicts the overall gas supply and demand pathway in the Accelerated Decarbonisation Pathway. Between 2020 and 2030 total gas demand declines as result of energy efficiency efforts and electrification. Meanwhile the share of renewable gases increases to around 10%. While energy efficiency efforts and electrification continue after 2030, gas supply increases slightly for blue hydrogen and synfuel production. Between 2040 and 2050 gas demand declines again. By 2050, all gas supply is renewable or low-carbon gas.
The Accelerated Decarbonisation Pathway is broken into specific gas supply and demand pathways. The rest of this chapter discusses each of these supply and demand pathways.
2.1 Supply of renewable and low carbon gases
The Accelerated Decarbonisation Pathway assumes a rapid increased deployment of sustainable biomethane, green and blue hydrogen, and some power to methane via the existing well-developed European energy infrastructure. A large scale-up potential exists for all these energy carriers.
Figure 3. Gas supply and demand in the Accelerated Decarbonisation Pathway
Sou
rce:
Gu
ideh
ouse
Biomethane
Power to methane
Natural gas
Green hydrogen
Blue hydrogen
By-product hydrogen
Grey hydrogen
Buildings (methane)
Industry (methane)
Transport (methane)
Transport (LNG)
Power (methane)
Other (methane)
For blue and green hydrogen (methane)
Buildings (hydrogen)
Industry (hydrogen)
Transport (hydrogen)
Power (hydrogen)
Other (hydrogen)
For synfuels (hydrogen)
Gas supply (TWh) Gas demand (TWh)
5000
4000
3000
2000
1000
0
2020
2050
204
0
2030
2020
2050
204
0
2030
11 2. An Accelerated Decarbonisation Pathway to speed up the energy transition
Ultimately, biomethane potentials are supply constrained, depending on the available supply of sustainable biomass. Ultimately, hydrogen will be demand constrained, depending on how much hydrogen will be required in the net-zero emissions energy system.
2.1.1 Biomethane deployment pathway
Europe has seen a steady growth in the number of biogas plants over the past decade. Most biogas plants are used to produce electricity and heat while a growing share is used to generate biomethane. In 2018, about 18,000 biogas plants and 610 biomethane plants were in operation across Europe. The installed electricity capacity from biogas plants reached a total of just over 11,000 MW in 2018, at an average of 0.6 MWe per plant.9 The electricity generated by these plants amounted to 65 TWhe. With average electrical efficiency of 38%, this means an input of 171 TWh biogas (16 bcm in natural gas equivalent). Biomethane increased to 19 TWh (2 bcm natural gas equivalent) in 2017.
The cost of producing biomethane from anaerobic digestion largely depends on feedstocks used and plant size; it varies between €70/MWh and €90/MWh (€0.65/m3 to €0.90/m3) on average in 2020. Thermal gasification for biomethane synthesis is in the early commercial stage of development. Currently, some 50 to 100 biomass or waste gasifiers are in operation globally, but none (or hardly any) produce biomethane.10 In the EU, there are a few pilots on gasification-based biomethane. The GoBiGas project (20 MWth), was the first ever large-scale demonstration gasification plant and went on-stream in Sweden in 2013. However, the project was terminated in 2018 because it was outcompeted by cheaper biomethane from anaerobic digestion.11 Other biomass-to-biomethane gasification processes
are being pilot tested as well, including supercritical water gasification and hydrothermal gasification. Production costs are relatively high today, estimated to be around €100/MWh (€1.0/m3).12, 13 Costs could come down if large facilities are deployed. For large-scale production, forestry residues, waste wood, and solid wastes are the most relevant feedstock types.
A large sustainable biomethane scale-up potential exists. The Gas for Climate 2019 study included a bottom-up biomass and biomethane potential analysis, plus analysed power to methane production. The study concluded that a quantity of 1,170 TWh can be produced by 2050, consisting of 1,020 TWh of biomethane and 150 TWh power to methane. This requires 30,000 large biogas producers, feeding into even larger biomethane upgrading plants, plus 228 large (200 MW) biomass
gasification plants. Such scale-up will only be possible if production costs decrease, climate benefits are maximised and a sustainable feedstock supply is ensured. Navigant’s analysis shows that all biomethane can be zero emissions renewable gas by 2050, and any remaining life cycle emissions can be compensated by negative emissions created in agriculture on farms producing biomethane. It is important to properly map and mitigate methane leakage risks in biomethane production.
9 EBA Annual Report 2019. https://www.europeanbiogas.eu/wp-content/uploads/2020/01/EBA-AR-2019-digital-version.pdf
10 Global Syngas Technologies Council, The Gasification Industry, https://www.globalsyngas.org/resources/the-gasification-industry.
11 Bioenergy International, Göteborg Energi winds down GoBiGas 1 project in advance, 2018, https://bioenergyinternational.com/research-development/goteborg-energi-winds-gobi-gas-1-project-advance.
12 Chalmers University of Technology, 2018. GoBiGas demonstration – a vital step for a large-scale transition from fossil fuels to advanced biofuels and electro fuels. https://www.chalmers.se/SiteCollectionDocuments/SEE/News/Popularreport_GoBiGas_results_highres.pdf
13 The cost figures are slightly lower than what is reported in the cited reference because these costs are recalibrated using a social discount rate of 5%.
Biomethane can be used as feedstock to produce hydrogen and create negative emissions. This hydrogen could be called ‘climate positive hydrogen’
12 Gas Decarbonisation Pathways 2020–2050
Biomethane has multiple benefits, including its ability to foster sustainable and more circular agriculture. One significant benefit of biomethane is its ability to generate negative emissions. Biomethane can be fed to blue hydrogen production facilities (steam methane reformers or autothermal reformers with CCS) to produce hydrogen and generate negative carbon emissions. To differentiate it from blue hydrogen that uses natural gas as feedstock, this hydrogen could be called climate positive hydrogen. The ability of biomethane to create negative emissions is significant because the most authoritative climate change scenarios show that the world needs significant negative emissions to keep global temperature increase well below 2°C.14 Negative emissions are needed not just during the coming decades but will still be needed after 2050. In terms of the scale-up pathway for climate positive hydrogen, it can be assumed that biomethane production needs to be scaled up during the 2020s and 2030s to satisfy direct demand for biomethane such as for the heating of buildings. Depending on the extent to which valuable direct biomethane uses are supplied, and the willingness of society to pay for various options to create negative emissions, climate positive hydrogen can start to play a meaningful role during the 2040s and continue after 2050.
In addition to ensuring sustainable production and minimising life cycle emissions, another necessary enabler of biomethane scale-up is a reduction in production costs. The Gas for Climate 2019 study concluded that significant cost reductions are possible. Production costs in both production routes can decrease from the current €70–€90/MWh to €47–€57/MWh in 2050. An assessment of the feasibility of increasing renewable methane production by methanation of CO2 captured in biogas upgrading showed that this technology could increase the renewable methane potential; however, costs will remain higher than biomethane or hydrogen costs.
The Accelerated Decarbonisation Pathway envisions a higher ambition level in climate and energy policy and a greater overall societal momentum to combat climate change. In this context, biomethane from anaerobic digestion, a mature form of renewable energy, can be scaled up
much more rapidly. Investments in large biomass-to-biomethane gasification plants will also increase more rapidly. This could lead to a situation in which the Accelerated Decarbonisation Pathway could generate 370 TWh or 35 bcm of biomethane per year by 2030 through:
→ Converting 12 bcm of biogas that is already produced today for local electricity and heat towards grid-injected biomethane.
→ Constructing 6,000 new digesters, each with an average production of 500 m3/h and 3,000 new centralised biogas upgrading units that will each convert biogas from two digesters to biomethane. All these installations in total produce 15 bcm of biomethane.
→ Constructing 500 new integrated biogas-biomethane plants that each produce 2,000 m3/h biogas into biomethane and jointly produce 5 bcm of biomethane.
→ Getting 2,000 farmers and biogas producers, mainly in Italy and France, to adopt Biogasdoneright.15
→ Constructing 21 large 200 MW gasification plants that jointly produce 3 bcm of biomethane.
14 Chapter 2 of the IPPC Special Report on Global Warming of 1.5° (2018), shows that significant negative emissions are require in most climate change mitigation scenarios to reach well below 2 degrees an 1.5 degrees. See: https://www.ipcc.ch/site/assets/uploads/sites/2/2019/05/SR15_Chapter2_Low_Res.pdf
15 Biogasdoneright is an innovative concept of sustainable farming and biogas production developed in Italy. It applies sequential cropping meaning that two crops are cultivated on a plot in constant rotation during the year. This increases the agricultural productivity of existing farmland without negative environmental impacts and without direct or indirect land use change. Biogasdoneright leads to co-benefits such as decreasing soil erosion risks, an increase in on-farm biodiversity and a potential increase of the soil carbon content by leaving more agricultural residues on the land.
With additional EU climate and energy policies, biomethane supply could reach 370 TWh by 2030
13 2. An Accelerated Decarbonisation Pathway to speed up the energy transition
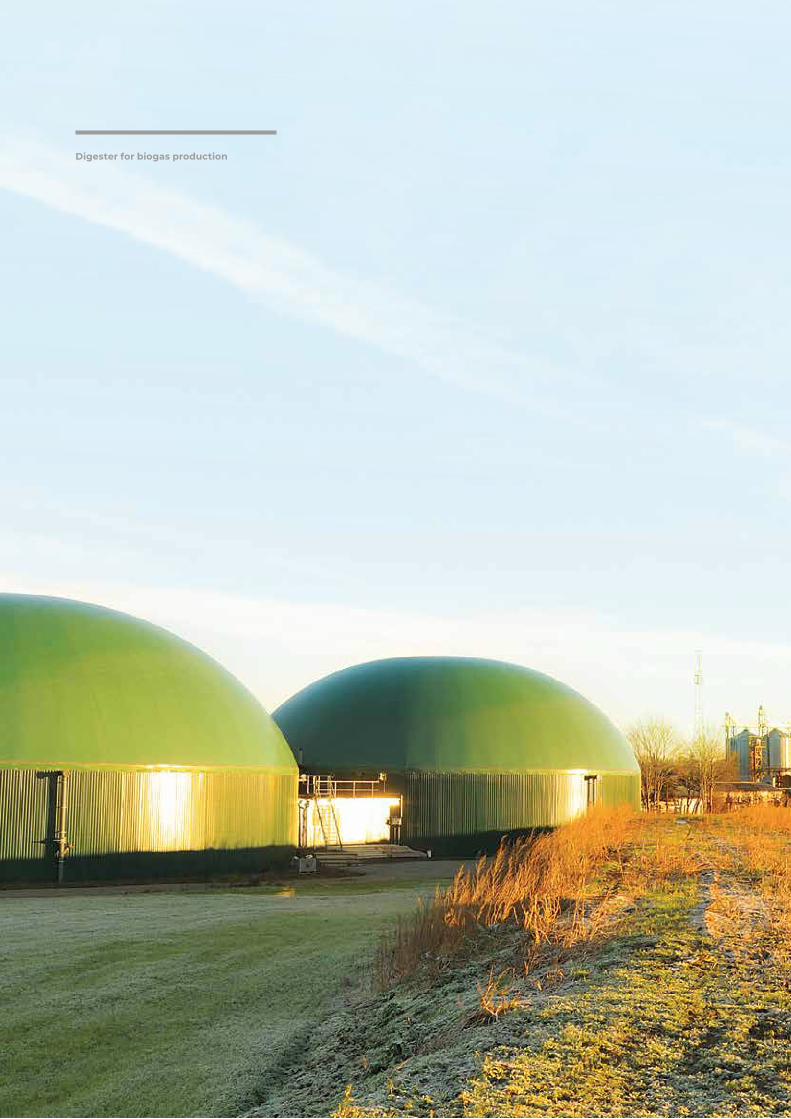
Digester for biogas production
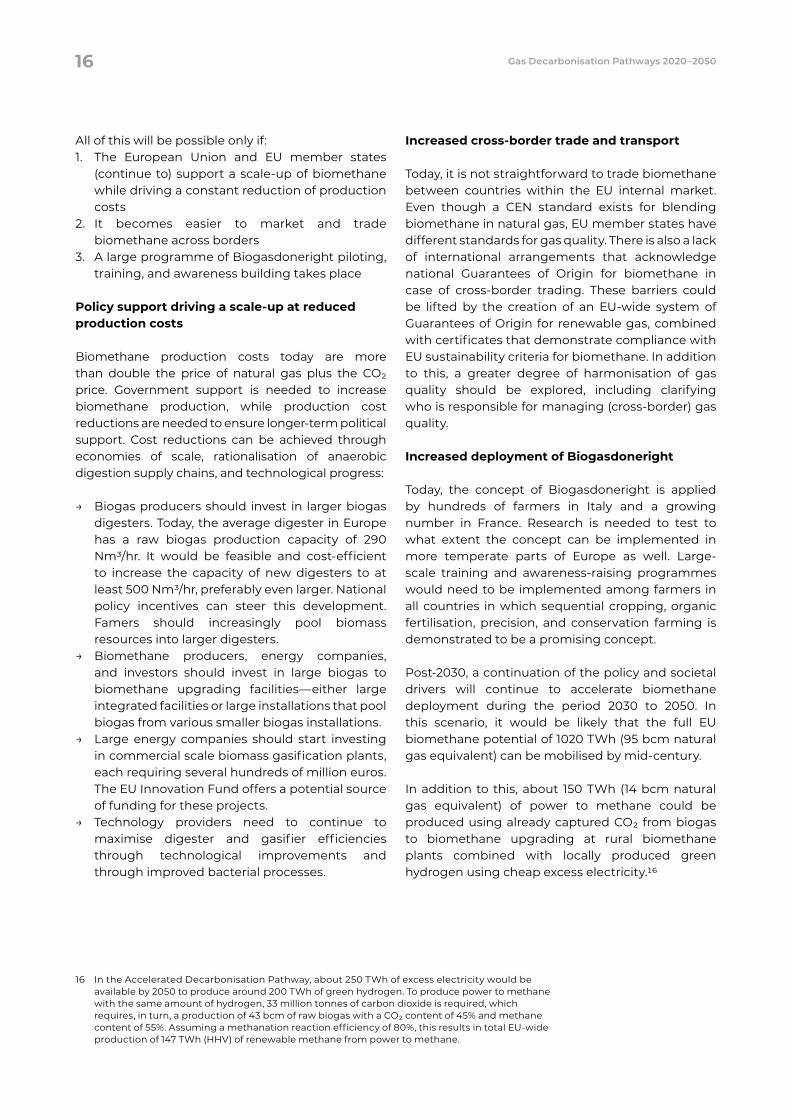
Fertilisation of the field during winter crop cultivation, with digestate recovered at the farm’s biogas plant.
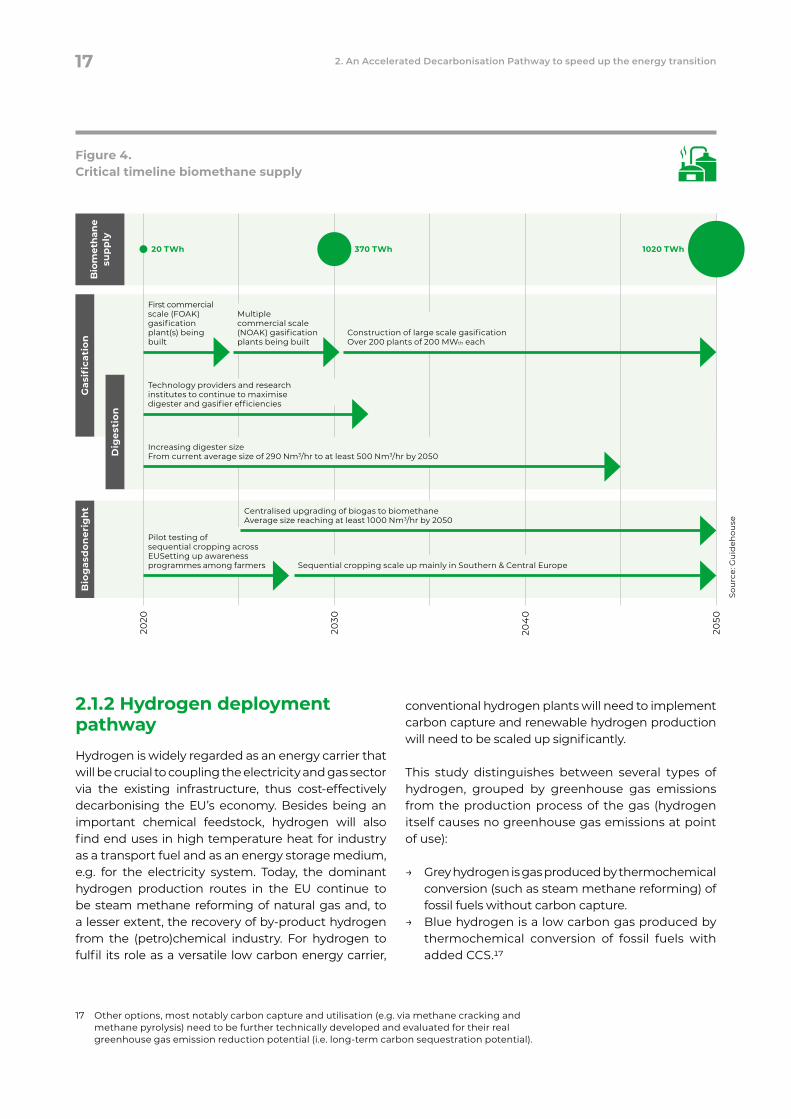
Benas biogas demonstration plant in North Germany, member of EBA, with a capacity of 174 kt/y, distributed over 4 digesters and 2 storage tanks.
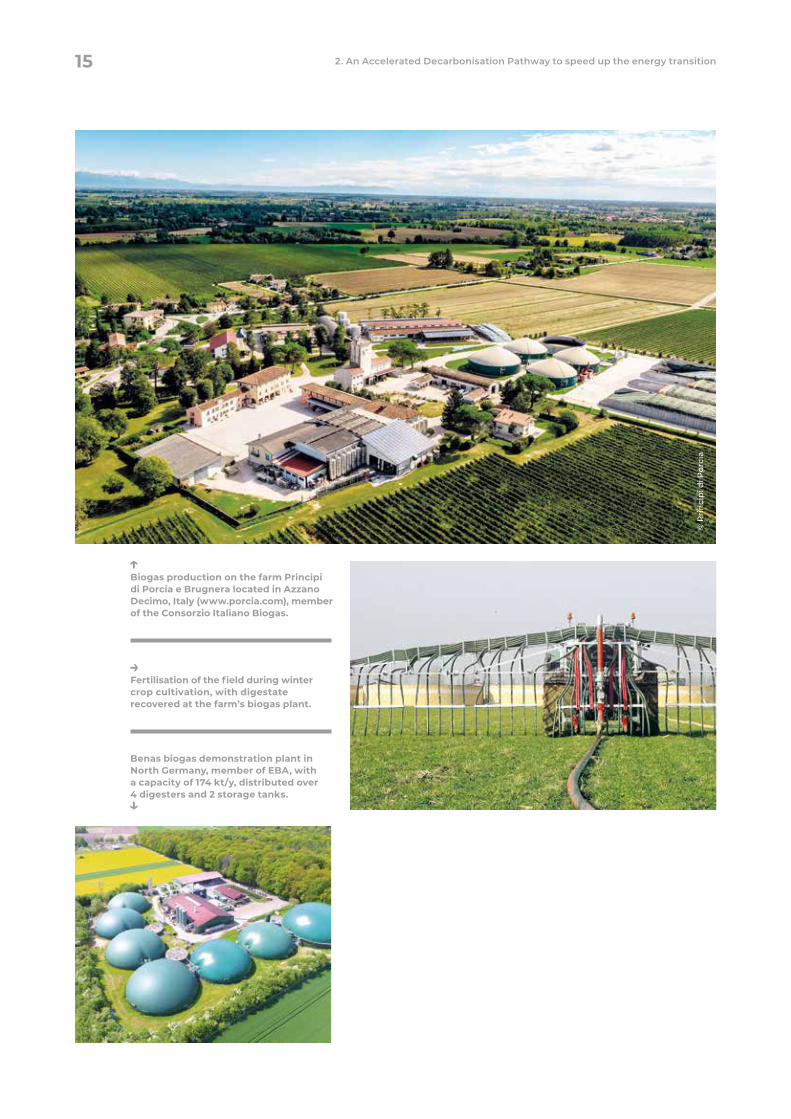
Biogas production on the farm Principi di Porcia e Brugnera located in Azzano Decimo, Italy (www.porcia.com), member of the Consorzio Italiano Biogas.
© P
rin
cip
i di P
orci
a
15 2. An Accelerated Decarbonisation Pathway to speed up the energy transition
All of this will be possible only if: 1. The European Union and EU member states
(continue to) support a scale-up of biomethane while driving a constant reduction of production costs
2. It becomes easier to market and trade biomethane across borders
3. A large programme of Biogasdoneright piloting, training, and awareness building takes place
Policy support driving a scale-up at reduced production costs
Biomethane production costs today are more than double the price of natural gas plus the CO2 price. Government support is needed to increase biomethane production, while production cost reductions are needed to ensure longer-term political support. Cost reductions can be achieved through economies of scale, rationalisation of anaerobic digestion supply chains, and technological progress:
→ Biogas producers should invest in larger biogas digesters. Today, the average digester in Europe has a raw biogas production capacity of 290 Nm3/hr. It would be feasible and cost-efficient to increase the capacity of new digesters to at least 500 Nm3/hr, preferably even larger. National policy incentives can steer this development. Famers should increasingly pool biomass resources into larger digesters.
→ Biomethane producers, energy companies, and investors should invest in large biogas to biomethane upgrading facilities—either large integrated facilities or large installations that pool biogas from various smaller biogas installations.
→ Large energy companies should start investing in commercial scale biomass gasification plants, each requiring several hundreds of million euros. The EU Innovation Fund offers a potential source of funding for these projects.
→ Technology providers need to continue to maximise digester and gasifier efficiencies through technological improvements and through improved bacterial processes.
Increased cross-border trade and transport
Today, it is not straightforward to trade biomethane between countries within the EU internal market. Even though a CEN standard exists for blending biomethane in natural gas, EU member states have different standards for gas quality. There is also a lack of international arrangements that acknowledge national Guarantees of Origin for biomethane in case of cross-border trading. These barriers could be lifted by the creation of an EU-wide system of Guarantees of Origin for renewable gas, combined with certificates that demonstrate compliance with EU sustainability criteria for biomethane. In addition to this, a greater degree of harmonisation of gas quality should be explored, including clarifying who is responsible for managing (cross-border) gas quality.
Increased deployment of Biogasdoneright
Today, the concept of Biogasdoneright is applied by hundreds of farmers in Italy and a growing number in France. Research is needed to test to what extent the concept can be implemented in more temperate parts of Europe as well. Large-scale training and awareness-raising programmes would need to be implemented among farmers in all countries in which sequential cropping, organic fertilisation, precision, and conservation farming is demonstrated to be a promising concept.
Post-2030, a continuation of the policy and societal drivers will continue to accelerate biomethane deployment during the period 2030 to 2050. In this scenario, it would be likely that the full EU biomethane potential of 1020 TWh (95 bcm natural gas equivalent) can be mobilised by mid-century.
In addition to this, about 150 TWh (14 bcm natural gas equivalent) of power to methane could be produced using already captured CO2 from biogas to biomethane upgrading at rural biomethane plants combined with locally produced green hydrogen using cheap excess electricity.16
16 In the Accelerated Decarbonisation Pathway, about 250 TWh of excess electricity would be available by 2050 to produce around 200 TWh of green hydrogen. To produce power to methane with the same amount of hydrogen, 33 million tonnes of carbon dioxide is required, which requires, in turn, a production of 43 bcm of raw biogas with a CO2 content of 45% and methane content of 55%. Assuming a methanation reaction efficiency of 80%, this results in total EU-wide production of 147 TWh (HHV) of renewable methane from power to methane.
16 Gas Decarbonisation Pathways 2020–2050
2.1.2 Hydrogen deployment pathwayHydrogen is widely regarded as an energy carrier that will be crucial to coupling the electricity and gas sector via the existing infrastructure, thus cost-effectively decarbonising the EU’s economy. Besides being an important chemical feedstock, hydrogen will also find end uses in high temperature heat for industry as a transport fuel and as an energy storage medium, e.g. for the electricity system. Today, the dominant hydrogen production routes in the EU continue to be steam methane reforming of natural gas and, to a lesser extent, the recovery of by-product hydrogen from the (petro)chemical industry. For hydrogen to fulfil its role as a versatile low carbon energy carrier,
conventional hydrogen plants will need to implement carbon capture and renewable hydrogen production will need to be scaled up significantly.
This study distinguishes between several types of hydrogen, grouped by greenhouse gas emissions from the production process of the gas (hydrogen itself causes no greenhouse gas emissions at point of use):
→ Grey hydrogen is gas produced by thermochemical conversion (such as steam methane reforming) of fossil fuels without carbon capture.
→ Blue hydrogen is a low carbon gas produced by thermochemical conversion of fossil fuels with added CCS.17
17 Other options, most notably carbon capture and utilisation (e.g. via methane cracking and methane pyrolysis) need to be further technically developed and evaluated for their real greenhouse gas emission reduction potential (i.e. long-term carbon sequestration potential).
Bio
gas
don
e rig
ht
Bio
met
han
e su
pp
ly
Sou
rce:
Gu
ideh
ouse
Figure 4. Critical timeline biomethane supply
Gas
ifica
tion
Dig
esti
on
2020
2030
204
0
2050
20 TWh 370 TWh 1020 TWh
Increasing digester sizeFrom current average size of 290 Nm3/hr to at least 500 Nm3/hr by 2050
Technology providers and research institutes to continue to maximise digester and gasifier efficiencies
First commercial scale (FOAK) gasification plant(s) being built
Multiple commercial scale (NOAK) gasification plants being built
Construction of large scale gasification Over 200 plants of 200 MWth each
Pilot testing of sequential cropping across EUSetting up awareness programmes among farmers Sequential cropping scale up mainly in Southern & Central Europe
Centralised upgrading of biogas to biomethaneAverage size reaching at least 1000 Nm3/hr by 2050
17 2. An Accelerated Decarbonisation Pathway to speed up the energy transition
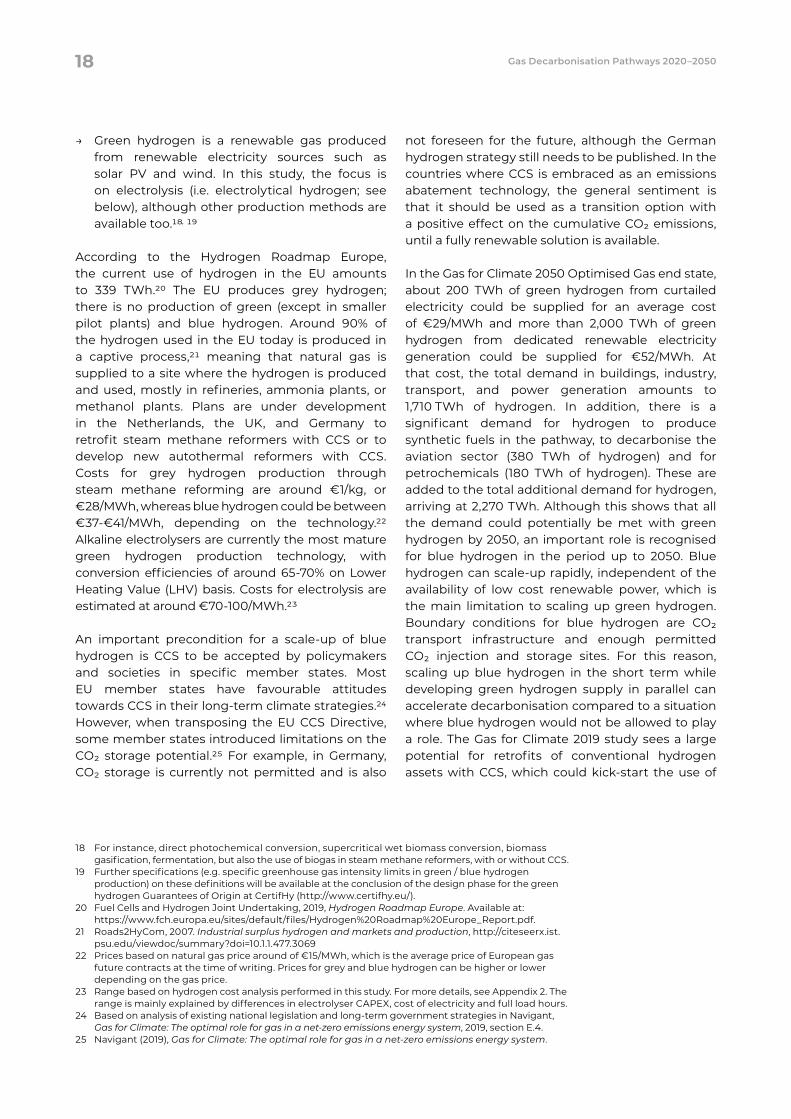
→ Green hydrogen is a renewable gas produced from renewable electricity sources such as solar PV and wind. In this study, the focus is on electrolysis (i.e. electrolytical hydrogen; see below), although other production methods are available too.18, 19
According to the Hydrogen Roadmap Europe, the current use of hydrogen in the EU amounts to 339 TWh.20 The EU produces grey hydrogen; there is no production of green (except in smaller pilot plants) and blue hydrogen. Around 90% of the hydrogen used in the EU today is produced in a captive process,21 meaning that natural gas is supplied to a site where the hydrogen is produced and used, mostly in refineries, ammonia plants, or methanol plants. Plans are under development in the Netherlands, the UK, and Germany to retrofit steam methane reformers with CCS or to develop new autothermal reformers with CCS. Costs for grey hydrogen production through steam methane reforming are around €1/kg, or €28/MWh, whereas blue hydrogen could be between €37-€41/MWh, depending on the technology.22 Alkaline electrolysers are currently the most mature green hydrogen production technology, with conversion efficiencies of around 65-70% on Lower Heating Value (LHV) basis. Costs for electrolysis are estimated at around €70-100/MWh.23
An important precondition for a scale-up of blue hydrogen is CCS to be accepted by policymakers and societies in specific member states. Most EU member states have favourable attitudes towards CCS in their long-term climate strategies.24 However, when transposing the EU CCS Directive, some member states introduced limitations on the CO2 storage potential.25 For example, in Germany, CO2 storage is currently not permitted and is also
not foreseen for the future, although the German hydrogen strategy still needs to be published. In the countries where CCS is embraced as an emissions abatement technology, the general sentiment is that it should be used as a transition option with a positive effect on the cumulative CO2 emissions, until a fully renewable solution is available.
In the Gas for Climate 2050 Optimised Gas end state, about 200 TWh of green hydrogen from curtailed electricity could be supplied for an average cost of €29/MWh and more than 2,000 TWh of green hydrogen from dedicated renewable electricity generation could be supplied for €52/MWh. At that cost, the total demand in buildings, industry, transport, and power generation amounts to 1,710 TWh of hydrogen. In addition, there is a significant demand for hydrogen to produce synthetic fuels in the pathway, to decarbonise the aviation sector (380 TWh of hydrogen) and for petrochemicals (180 TWh of hydrogen). These are added to the total additional demand for hydrogen, arriving at 2,270 TWh. Although this shows that all the demand could potentially be met with green hydrogen by 2050, an important role is recognised for blue hydrogen in the period up to 2050. Blue hydrogen can scale-up rapidly, independent of the availability of low cost renewable power, which is the main limitation to scaling up green hydrogen. Boundary conditions for blue hydrogen are CO2 transport infrastructure and enough permitted CO2 injection and storage sites. For this reason, scaling up blue hydrogen in the short term while developing green hydrogen supply in parallel can accelerate decarbonisation compared to a situation where blue hydrogen would not be allowed to play a role. The Gas for Climate 2019 study sees a large potential for retrofits of conventional hydrogen assets with CCS, which could kick-start the use of
18 For instance, direct photochemical conversion, supercritical wet biomass conversion, biomass gasification, fermentation, but also the use of biogas in steam methane reformers, with or without CCS.
19 Further specifications (e.g. specific greenhouse gas intensity limits in green / blue hydrogen production) on these definitions will be available at the conclusion of the design phase for the green hydrogen Guarantees of Origin at CertifHy (http://www.certifhy.eu/).
20 Fuel Cells and Hydrogen Joint Undertaking, 2019, Hydrogen Roadmap Europe. Available at: https://www.fch.europa.eu/sites/default/files/Hydrogen%20Roadmap%20Europe_Report.pdf.
21 Roads2HyCom, 2007. Industrial surplus hydrogen and markets and production, http://citeseerx.ist.psu.edu/viewdoc/summary?doi=10.1.1.477.3069
22 Prices based on natural gas price around of €15/MWh, which is the average price of European gas future contracts at the time of writing. Prices for grey and blue hydrogen can be higher or lower depending on the gas price.
23 Range based on hydrogen cost analysis performed in this study. For more details, see Appendix 2. The range is mainly explained by differences in electrolyser CAPEX, cost of electricity and full load hours.
24 Based on analysis of existing national legislation and long-term government strategies in Navigant, Gas for Climate: The optimal role for gas in a net-zero emissions energy system, 2019, section E.4.
25 Navigant (2019), Gas for Climate: The optimal role for gas in a net-zero emissions energy system.
18 Gas Decarbonisation Pathways 2020–2050
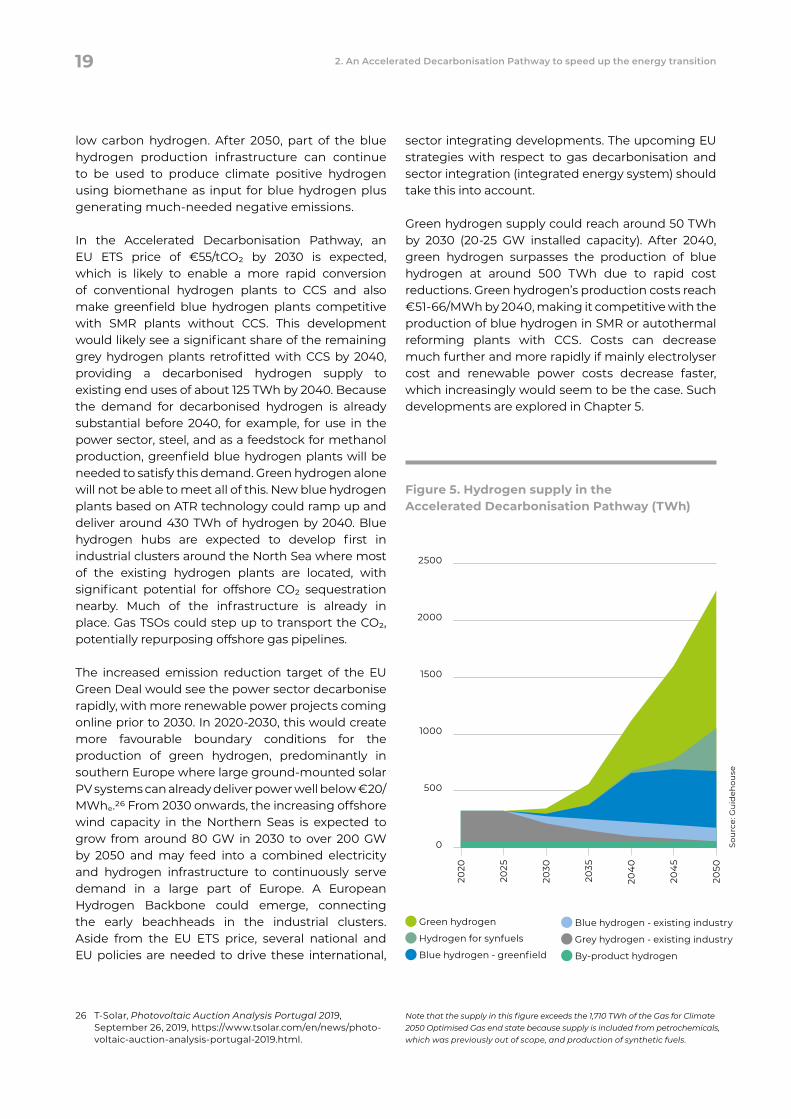
low carbon hydrogen. After 2050, part of the blue hydrogen production infrastructure can continue to be used to produce climate positive hydrogen using biomethane as input for blue hydrogen plus generating much-needed negative emissions.
In the Accelerated Decarbonisation Pathway, an EU ETS price of €55/tCO2 by 2030 is expected, which is likely to enable a more rapid conversion of conventional hydrogen plants to CCS and also make greenfield blue hydrogen plants competitive with SMR plants without CCS. This development would likely see a significant share of the remaining grey hydrogen plants retrofitted with CCS by 2040, providing a decarbonised hydrogen supply to existing end uses of about 125 TWh by 2040. Because the demand for decarbonised hydrogen is already substantial before 2040, for example, for use in the power sector, steel, and as a feedstock for methanol production, greenfield blue hydrogen plants will be needed to satisfy this demand. Green hydrogen alone will not be able to meet all of this. New blue hydrogen plants based on ATR technology could ramp up and deliver around 430 TWh of hydrogen by 2040. Blue hydrogen hubs are expected to develop first in industrial clusters around the North Sea where most of the existing hydrogen plants are located, with significant potential for offshore CO2 sequestration nearby. Much of the infrastructure is already in place. Gas TSOs could step up to transport the CO2, potentially repurposing offshore gas pipelines.
The increased emission reduction target of the EU Green Deal would see the power sector decarbonise rapidly, with more renewable power projects coming online prior to 2030. In 2020-2030, this would create more favourable boundary conditions for the production of green hydrogen, predominantly in southern Europe where large ground-mounted solar PV systems can already deliver power well below €20/MWhe.26 From 2030 onwards, the increasing offshore wind capacity in the Northern Seas is expected to grow from around 80 GW in 2030 to over 200 GW by 2050 and may feed into a combined electricity and hydrogen infrastructure to continuously serve demand in a large part of Europe. A European Hydrogen Backbone could emerge, connecting the early beachheads in the industrial clusters. Aside from the EU ETS price, several national and EU policies are needed to drive these international,
sector integrating developments. The upcoming EU strategies with respect to gas decarbonisation and sector integration (integrated energy system) should take this into account.
Green hydrogen supply could reach around 50 TWh by 2030 (20-25 GW installed capacity). After 2040, green hydrogen surpasses the production of blue hydrogen at around 500 TWh due to rapid cost reductions. Green hydrogen’s production costs reach €51-66/MWh by 2040, making it competitive with the production of blue hydrogen in SMR or autothermal reforming plants with CCS. Costs can decrease much further and more rapidly if mainly electrolyser cost and renewable power costs decrease faster, which increasingly would seem to be the case. Such developments are explored in Chapter 5.
26 T-Solar, Photovoltaic Auction Analysis Portugal 2019, September 26, 2019, https://www.tsolar.com/en/news/photo-voltaic-auction-analysis-portugal-2019.html.
Note that the supply in this figure exceeds the 1,710 TWh of the Gas for Climate 2050 Optimised Gas end state because supply is included from petrochemicals, which was previously out of scope, and production of synthetic fuels.
Figure 5. Hydrogen supply in the Accelerated Decarbonisation Pathway (TWh)
Green hydrogen
Hydrogen for synfuels
Blue hydrogen - greenfield
Blue hydrogen - existing industry
Grey hydrogen - existing industry
By-product hydrogen
2500
2000
1500
1000
500
0
2020
2050
2030
2035
204
0
204
5
2025
Sou
rce:
Gu
ideh
ouse
19 2. An Accelerated Decarbonisation Pathway to speed up the energy transition
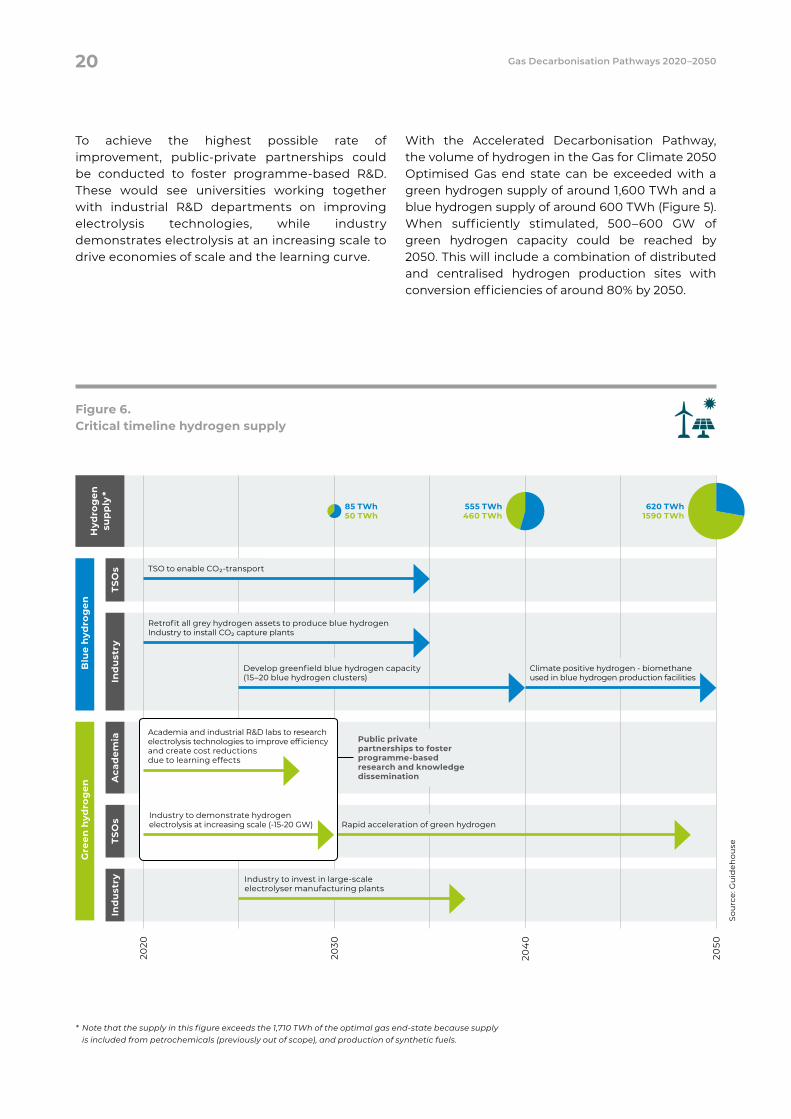
With the Accelerated Decarbonisation Pathway, the volume of hydrogen in the Gas for Climate 2050 Optimised Gas end state can be exceeded with a green hydrogen supply of around 1,600 TWh and a blue hydrogen supply of around 600 TWh (Figure 5). When sufficiently stimulated, 500–600 GW of green hydrogen capacity could be reached by 2050. This will include a combination of distributed and centralised hydrogen production sites with conversion efficiencies of around 80% by 2050.
To achieve the highest possible rate of improvement, public-private partnerships could be conducted to foster programme-based R&D. These would see universities working together with industrial R&D departments on improving electrolysis technologies, while industry demonstrates electrolysis at an increasing scale to drive economies of scale and the learning curve.
* Note that the supply in this figure exceeds the 1,710 TWh of the optimal gas end-state because supply is included from petrochemicals (previously out of scope), and production of synthetic fuels.
Figure 6. Critical timeline hydrogen supply
Ind
ust
ryIn
du
stry
Blu
e h
ydro
gen
Gre
en h
ydro
gen
Rapid acceleration of green hydrogen
Industry to invest in large-scale electrolyser manufacturing plants
Aca
dem
iaTS
Os
TSO
s
2020
2030
204
0
2050
TSO to enable CO2-transport
Industry to demonstrate hydrogen electrolysis at increasing scale (-15-20 GW)
Academia and industrial R&D labs to research electrolysis technologies to improve efficiency and create cost reductions due to learning effects
Public private partnerships to foster programme-based research and knowledge dissemination
Sou
rce:
Gu
ideh
ouse
Hyd
rog
en
sup
ply
*
85 TWh50 TWh
555 TWh460 TWh
620 TWh1590 TWh
Develop greenfield blue hydrogen capacity (15–20 blue hydrogen clusters)
Climate positive hydrogen - biomethane used in blue hydrogen production facilities
Retrofit all grey hydrogen assets to produce blue hydrogen Industry to install CO2 capture plants
20 Gas Decarbonisation Pathways 2020–2050
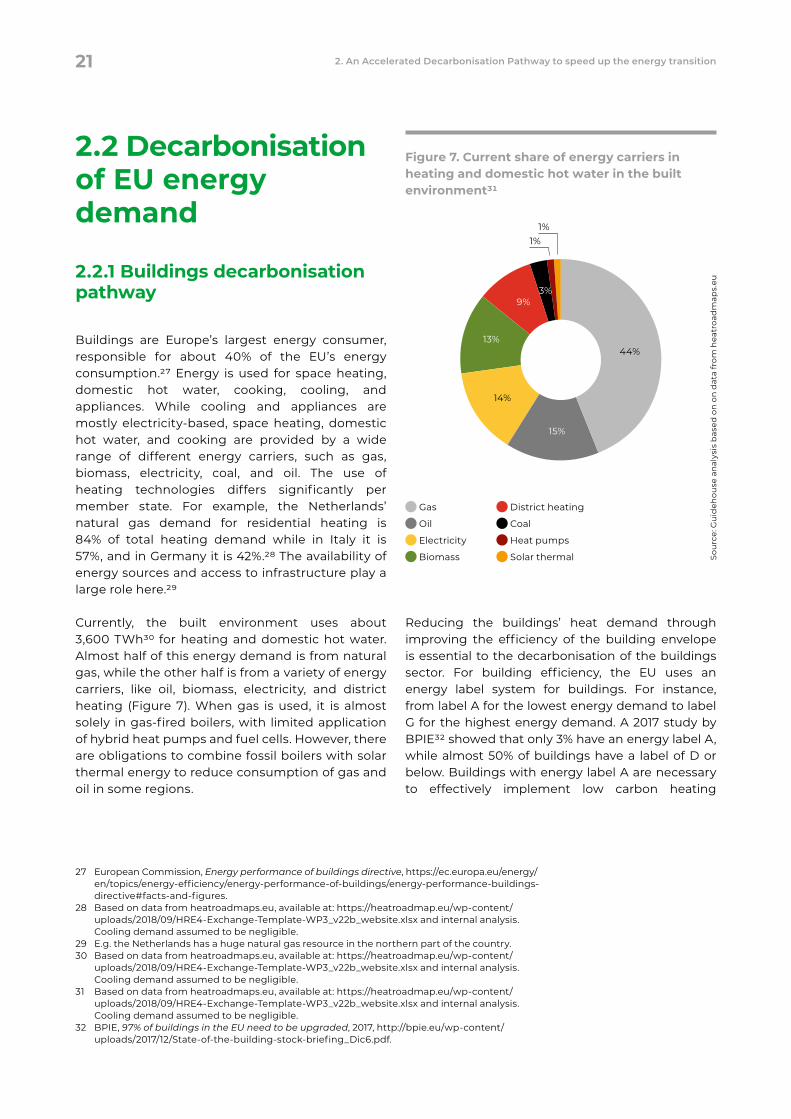
2.2 Decarbonisation of EU energy demand
2.2.1 Buildings decarbonisation pathway
Buildings are Europe’s largest energy consumer, responsible for about 40% of the EU’s energy consumption.27 Energy is used for space heating, domestic hot water, cooking, cooling, and appliances. While cooling and appliances are mostly electricity-based, space heating, domestic hot water, and cooking are provided by a wide range of different energy carriers, such as gas, biomass, electricity, coal, and oil. The use of heating technologies differs significantly per member state. For example, the Netherlands’ natural gas demand for residential heating is 84% of total heating demand while in Italy it is 57%, and in Germany it is 42%.28 The availability of energy sources and access to infrastructure play a large role here.29
Currently, the built environment uses about 3,600 TWh30 for heating and domestic hot water. Almost half of this energy demand is from natural gas, while the other half is from a variety of energy carriers, like oil, biomass, electricity, and district heating (Figure 7). When gas is used, it is almost solely in gas-fired boilers, with limited application of hybrid heat pumps and fuel cells. However, there are obligations to combine fossil boilers with solar thermal energy to reduce consumption of gas and oil in some regions.
Reducing the buildings’ heat demand through improving the efficiency of the building envelope is essential to the decarbonisation of the buildings sector. For building efficiency, the EU uses an energy label system for buildings. For instance, from label A for the lowest energy demand to label G for the highest energy demand. A 2017 study by BPIE32 showed that only 3% have an energy label A, while almost 50% of buildings have a label of D or below. Buildings with energy label A are necessary to effectively implement low carbon heating
27 European Commission, Energy performance of buildings directive, https://ec.europa.eu/energy/en/topics/energy-efficiency/energy-performance-of-buildings/energy-performance-buildings- directive#facts-and-figures.
28 Based on data from heatroadmaps.eu, available at: https://heatroadmap.eu/wp-content/uploads/2018/09/HRE4-Exchange-Template-WP3_v22b_website.xlsx and internal analysis. Cooling demand assumed to be negligible.
29 E.g. the Netherlands has a huge natural gas resource in the northern part of the country.30 Based on data from heatroadmaps.eu, available at: https://heatroadmap.eu/wp-content/
uploads/2018/09/HRE4-Exchange-Template-WP3_v22b_website.xlsx and internal analysis. Cooling demand assumed to be negligible.
31 Based on data from heatroadmaps.eu, available at: https://heatroadmap.eu/wp-content/uploads/2018/09/HRE4-Exchange-Template-WP3_v22b_website.xlsx and internal analysis. Cooling demand assumed to be negligible.
32 BPIE, 97% of buildings in the EU need to be upgraded, 2017, http://bpie.eu/wp-content/uploads/2017/12/State-of-the-building-stock-briefing_Dic6.pdf.
Figure 7. Current share of energy carriers in heating and domestic hot water in the built environment31
Gas
Oil
Electricity
Biomass
District heating
Coal
Heat pumps
Solar thermal Sou
rce:
Gu
ideh
ouse
an
alys
is b
ased
on
on
dat
a fr
om h
eatr
oad
map
s.eu
1%
3%
44%
15%
13%
1%
14%
9%
21 2. An Accelerated Decarbonisation Pathway to speed up the energy transition
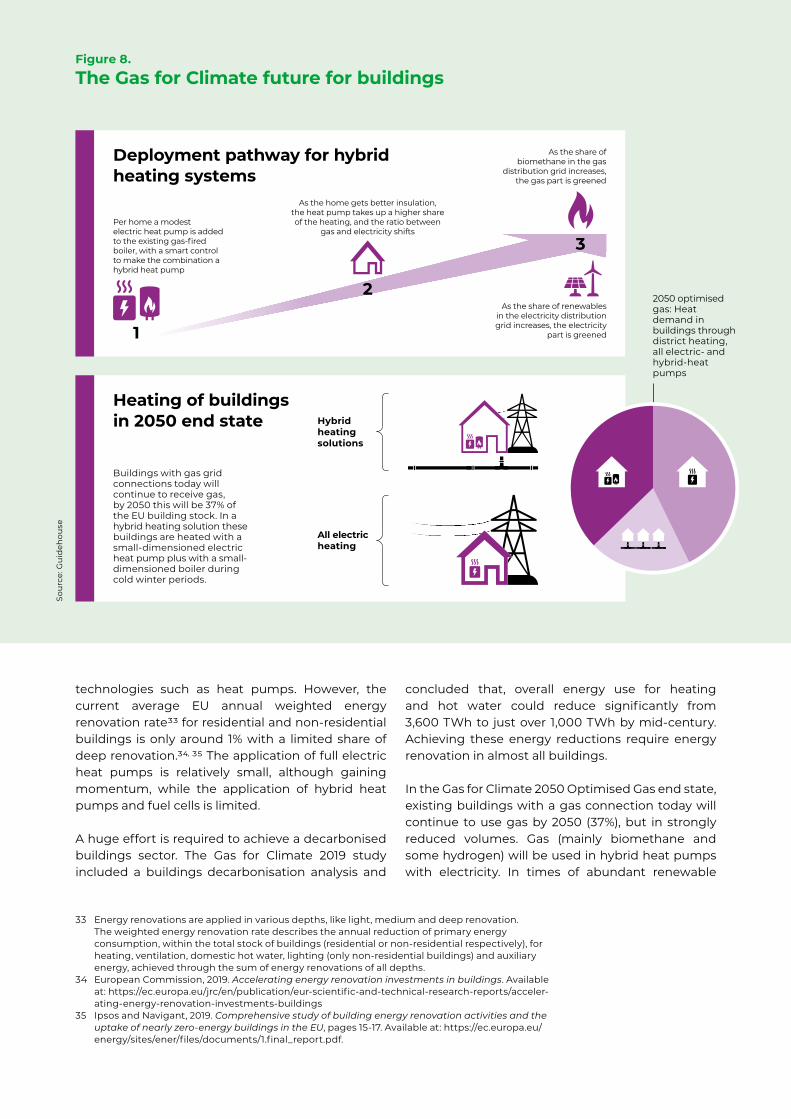
technologies such as heat pumps. However, the current average EU annual weighted energy renovation rate33 for residential and non-residential buildings is only around 1% with a limited share of deep renovation.34, 35 The application of full electric heat pumps is relatively small, although gaining momentum, while the application of hybrid heat pumps and fuel cells is limited.
A huge effort is required to achieve a decarbonised buildings sector. The Gas for Climate 2019 study included a buildings decarbonisation analysis and
concluded that, overall energy use for heating and hot water could reduce significantly from 3,600 TWh to just over 1,000 TWh by mid-century. Achieving these energy reductions require energy renovation in almost all buildings.
In the Gas for Climate 2050 Optimised Gas end state, existing buildings with a gas connection today will continue to use gas by 2050 (37%), but in strongly reduced volumes. Gas (mainly biomethane and some hydrogen) will be used in hybrid heat pumps with electricity. In times of abundant renewable
33 Energy renovations are applied in various depths, like light, medium and deep renovation. The weighted energy renovation rate describes the annual reduction of primary energy consumption, within the total stock of buildings (residential or non-residential respectively), for heating, ventilation, domestic hot water, lighting (only non-residential buildings) and auxiliary energy, achieved through the sum of energy renovations of all depths.
34 European Commission, 2019. Accelerating energy renovation investments in buildings. Available at: https://ec.europa.eu/jrc/en/publication/eur-scientific-and-technical-research-reports/acceler-ating-energy-renovation-investments-buildings
35 Ipsos and Navigant, 2019. Comprehensive study of building energy renovation activities and the uptake of nearly zero-energy buildings in the EU, pages 15-17. Available at: https://ec.europa.eu/energy/sites/ener/files/documents/1.final_report.pdf.
Figure 8.
The Gas for Climate future for buildings
Deployment pathway for hybrid heating systems
Heating of buildings in 2050 end state
2050 optimised gas: Heat demand in buildings through district heating, all electric- and hybrid-heat pumps
Sou
rce:
Gu
ideh
ouse
As the home gets better insulation, the heat pump takes up a higher share of the heating, and the ratio between
gas and electricity shifts
As the share of bio methane in the gas
distribution grid increases, the gas part is greened
1
Buildings with gas grid connections today will continue to receive gas, by 2050 this will be 37% of the EU building stock. In a hybrid heating solution these buildings are heated with a small-dimensioned electric heat pump plus with a small-dimensioned boiler during cold winter periods.
Hybrid heating solutions
All electric heating
Per home a modest electric heat pump is added to the existing gas-fired boiler, with a smart control to make the combination a hybrid heat pump
2
3
As the share of renew ables in the electricity distribution grid increases, the electricity
part is greened
electricity and not too low temperatures, heat will be provided by the electric heat pump, in times of low temperatures or limited availability of renewable electricity, gas will provide flexible peak capacity (Box 1). Buildings without a gas connection in 2050 will be heated by all-electric heat pumps (43%) or through district heating (20% of all buildings).
Since deep renovations are essential for heating buildings at low temperatures by all-electric technologies, significant renovation efforts are needed for buildings without gas connections. If renovation efforts stay behind, this hinders the deployment of all-electric and (to a lesser extent) hybrid heat pumps. In this case, it will be important to keep considering possible alternatives: to focus less on insulation and more on other renewable heating technologies, like hydrogen fuel cells, gas heat pumps, or boilers (see Chapter 5).
District heating already covers a significant share of the current mix for heating and has the potential to provide a considerable part of the
built environment with renewable heat,36 but is still largely based on (waste) energy from fossil-fuelled processes. In the future energy system, district heating networks play an important role in integrating the electricity, gas, and heating energy systems. Through the deployment of multiple heat supply technologies together, heat can be provided in a cost-effective and flexible way. Potential sources for district heating include geothermal heat plants, boilers, heat pumps, combined heat and power (CHP) plants, or fuel cells. CHP plants could use various types of inputs including hydrogen.
Cooling of buildings will be based on electric cooling appliances. As opposed to demand for heating, demand for cooling correlates well with the availability of renewable electricity for solar PV. In moments of cooling demand with less availability of electricity form solar PV, for example, in the evening, short-term electricity storage can be applied to bridge the peaks in a diurnal cycle.
36 In the Gas for Climate 2019 study we envision an increase in district heating from around 10% nowadays towards 20% in 2050. According the Heat Roadmap Europe district heating could increase from today’s level of 10% up to 50% by 2050. Heat Roadmap Europe, 2019. About the Project. Available at: https://heatroadmap.eu/project/.
Box 1. The value of hybrid heating solutions
Hybrid heating solutions are a key factor in achieving a cost-effective, zero-carbon built environment in the Gas for Climate study. Hybrid heat pumps are a combination of a small heat pump and a gas boiler. This combination reduces insulation costs (no need for very deep renovation of the building envelope) and heating technology costs (application of smaller heat pumps and no need for low temperature floor heating), while requiring only a small amount of renewable gas. It also reduces stress on the electricity infrastructure: at low temperatures the efficiency of electric heat pumps reduces by up to 75%, which can be counterbalanced by use of renewable gas.
Hybrid heat pumps enable a robust pathway, since insulation, installing the heat pump, and decarbonising electricity and gas can take place independently, gradually reducing emissions. When installed, they provide system operators with increased resiliency by allowing shifting demand from electricity to gas and vice versa.
There is currently a limited application of this combination, and specific policy support is required for this technology to scale-up. Examples of policy support include focussing on information and knowledge dissemination, standardising the application of this combination, and ensuring the option is considered when developing renovation plans.
23 2. An Accelerated Decarbonisation Pathway to speed up the energy transition
The Accelerated Decarbonisation Pathway envisions an increase in energy renovation rates to 2.5%-3% per year, at deep renovation levels, towards 2030. Only then it is possible to achieve a fully decarbonised built environment by 2050. Gas demand for heating and hot domestic water is currently about 1,600 TWh (almost all natural gas)
and this will reduce to around 1,300 TWh in 2030. By 2030, buildings would already receive 5%-10% biomethane on average, in regions with a more rapid scale-up of biomethane this percentage would be higher by 2030. While the share of renewable and low carbon gases will be limited in 2030, developments in the built environment will enable the transition towards a decarbonised gas supply in buildings by 2050. In achieving the higher renovation rates needed, three elements should be addressed:37
→ Increase renovation speed of all buildings, with a substantial energy improvement component.
→ Improve the depth of renovation, going from light and medium renovations to medium and deep renovations.
→ Organise decarbonisation renovations as a chain of step-by-step smaller renovations (e.g., light and medium) in individual renovation roadmaps where lost opportunities and lock-in effects are avoided.
This will require extensive policy support and the development of new approaches to speed innovation, reduce cost, and make energy renovations a more logical go-to option for building owners, especially in the next 5 to 10 years (Figure 9).
Start a renovation wave
Decarbonising the built environment affects a broad variety of stakeholders. Private house owners, building corporations, and commercial real estate owners need to invest in increasing the building stock’s energy efficiency. Local governments need to provide the vision and strategy on how areas should develop. Energy distribution companies and energy companies could play an organising and facilitating role in this as well. For serialised scale-up of renovation by housing corporations and commercial real estate owners, it is key that the building industry realises industrial innovation and standardisation to drive cost reduction. Extensive energy efficiency measures are best timed at natural investment moments, such as a change in building owners or tenants, or when investments in the building energy system are necessary. The energy and buildings industry need to offer approaches to unburden building owners through standardised solutions, renovation roadmaps, guarantees, and financing options.
Long-term renovation targets and increasing the required minimal energy performance levels of existing buildings are examples of focused policies that could help buildings reach higher renovation rates. One of the EU Green Deal’s objectives is to start a renovation wave. An example of a policy that addresses the elements above is the Renovation Accelerator as included in the Dutch Climate Agreement.38
Increasing knowledge around low carbon buildings, reducing hassle for building owners, and supporting financing options are required to create the right environment. A more focused push to switch to low carbon heating technologies in well-insulated buildings is necessary to get to the right pathway. The full renovation system must be in place and doing the right renovation at high enough renovation rates by 2030.
37 Ipsos and Navigant, 2019. Comprehensive study of building energy renovation activities and the uptake of nearly zero-energy buildings in the EU, pages 79-80. Available at: https://ec.europa.eu/energy/sites/ener/files/documents/1.final_report.pdf.
38 Klimaatakkoord, 2019. Klimaatakkoord, ‘Renovatieversneller’ mentioned multiple times in pages 19-34. Available at: https://www.klimaatakkoord.nl/klimaatakkoord/documenten/publicaties/2019/06/28/klimaatakkoord.
The Accelerated Decarbonisation Pathway requires a renovation rate of 2.5%–3% per year
24 Gas Decarbonisation Pathways 2020–2050
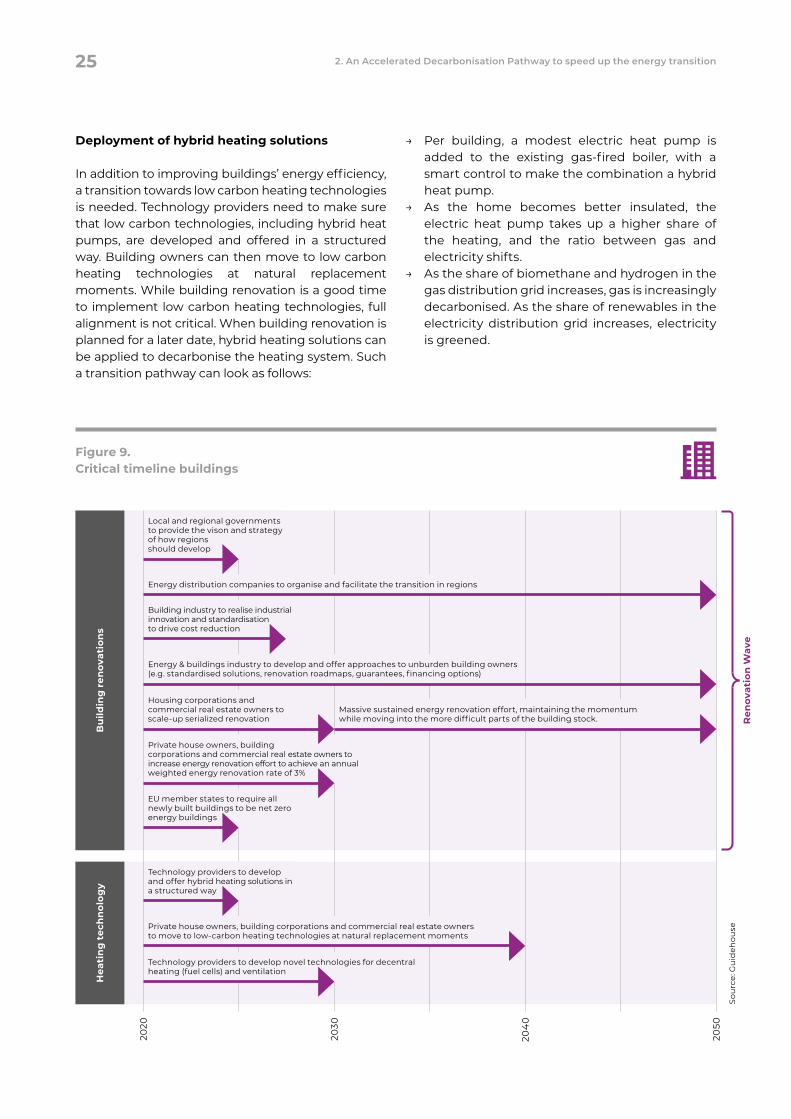
Deployment of hybrid heating solutions
In addition to improving buildings’ energy efficiency, a transition towards low carbon heating technologies is needed. Technology providers need to make sure that low carbon technologies, including hybrid heat pumps, are developed and offered in a structured way. Building owners can then move to low carbon heating technologies at natural replacement moments. While building renovation is a good time to implement low carbon heating technologies, full alignment is not critical. When building renovation is planned for a later date, hybrid heating solutions can be applied to decarbonise the heating system. Such a transition pathway can look as follows:
→ Per building, a modest electric heat pump is added to the existing gas-fired boiler, with a smart control to make the combination a hybrid heat pump.
→ As the home becomes better insulated, the electric heat pump takes up a higher share of the heating, and the ratio between gas and electricity shifts.
→ As the share of biomethane and hydrogen in the gas distribution grid increases, gas is increasingly decarbonised. As the share of renewables in the electricity distribution grid increases, electricity is greened.
Bu
ildin
g r
enov
atio
ns
Figure 9. Critical timeline buildings
Hea
tin
g t
ech
no
log
y
Building industry to realise industrial innovation and standardisation to drive cost reduction
Private house owners, building corporations and commercial real estate owners to increase energy renovation effort to achieve an annual weighted energy renovation rate of 3%
Massive sustained energy renovation effort, maintaining the momentum while moving into the more difficult parts of the building stock.
Local and regional govern ments to provide the vison and strategy of how regions should develop
EU member states to require all newly built buildings to be net zero energy buildings
Technology providers to develop and offer hybrid heating solutions in a structured way
Energy distribution companies to organise and facilitate the transition in regions
Energy & buildings industry to develop and offer approaches to unburden building owners (e.g. standardised solutions, renovation roadmaps, guarantees, financing options)
2020
2030
204
0
2050
Housing corporations and commercial real estate owners to scale-up serialized renovation
Private house owners, building corporations and commercial real estate owners to move to low-carbon heating technologies at natural replacement moments
Technology providers to develop novel technologies for decentral heating (fuel cells) and ventilation
Ren
ovat
ion
Wav
eSo
urc
e: G
uid
ehou
se
25 2. An Accelerated Decarbonisation Pathway to speed up the energy transition
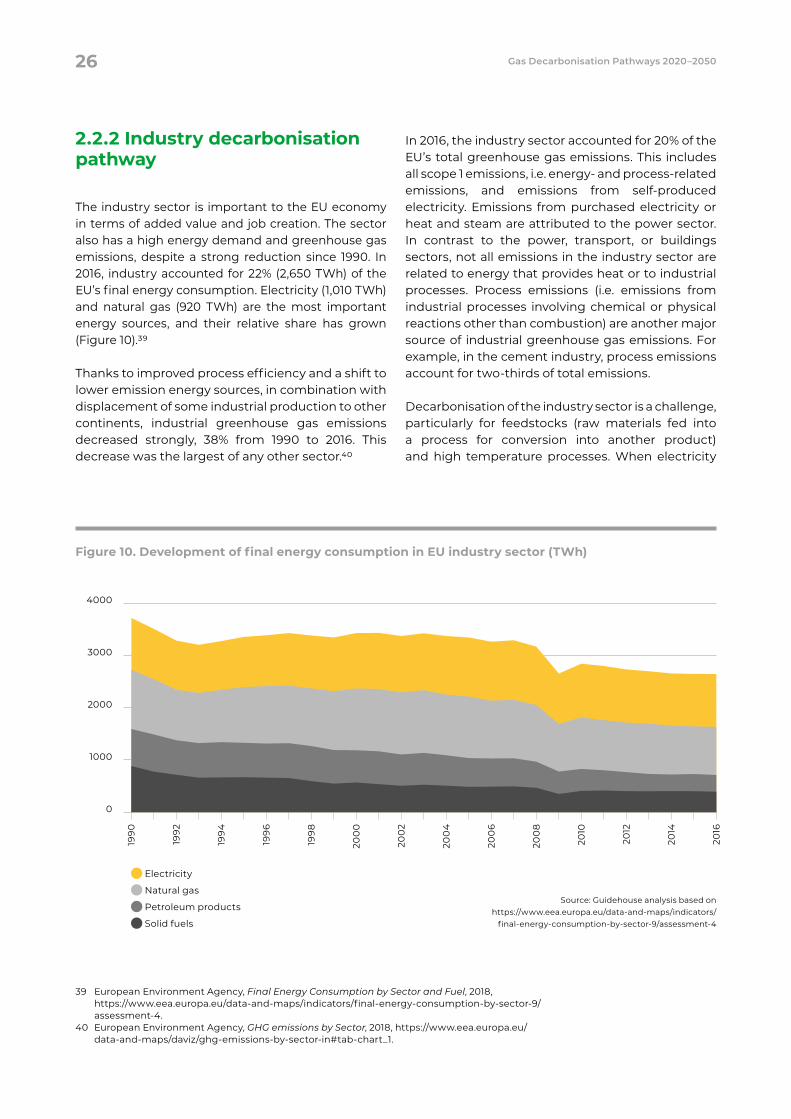
2.2.2 Industry decarbonisation pathway
The industry sector is important to the EU economy in terms of added value and job creation. The sector also has a high energy demand and greenhouse gas emissions, despite a strong reduction since 1990. In 2016, industry accounted for 22% (2,650 TWh) of the EU’s final energy consumption. Electricity (1,010 TWh) and natural gas (920 TWh) are the most important energy sources, and their relative share has grown (Figure 10).39
Thanks to improved process efficiency and a shift to lower emission energy sources, in combination with displacement of some industrial production to other continents, industrial greenhouse gas emissions decreased strongly, 38% from 1990 to 2016. This decrease was the largest of any other sector.40
In 2016, the industry sector accounted for 20% of the EU’s total greenhouse gas emissions. This includes all scope 1 emissions, i.e. energy- and process-related emissions, and emissions from self-produced electricity. Emissions from purchased electricity or heat and steam are attributed to the power sector. In contrast to the power, transport, or buildings sectors, not all emissions in the industry sector are related to energy that provides heat or to industrial processes. Process emissions (i.e. emissions from industrial processes involving chemical or physical reactions other than combustion) are another major source of industrial greenhouse gas emissions. For example, in the cement industry, process emissions account for two-thirds of total emissions.
Decarbonisation of the industry sector is a challenge, particularly for feedstocks (raw materials fed into a process for conversion into another product) and high temperature processes. When electricity
39 European Environment Agency, Final Energy Consumption by Sector and Fuel, 2018, https://www.eea.europa.eu/data-and-maps/indicators/final-energy-consumption-by-sector-9/assessment-4.
40 European Environment Agency, GHG emissions by Sector, 2018, https://www.eea.europa.eu/data-and-maps/daviz/ghg-emissions-by-sector-in#tab-chart_1.
Figure 10. Development of final energy consumption in EU industry sector (TWh)
Source: Guidehouse analysis based on https://www.eea.europa.eu/data-and-maps/indicators/
final-energy-consumption-by-sector-9/assessment-4
Electricity
Natural gas
Petroleum products
Solid fuels
4000
3000
2000
1000
0
1990
2016
1994
1996
1998
200
0
200
2
200
4
200
6
200
8
2010
2012
2014
1992
26 Gas Decarbonisation Pathways 2020–2050
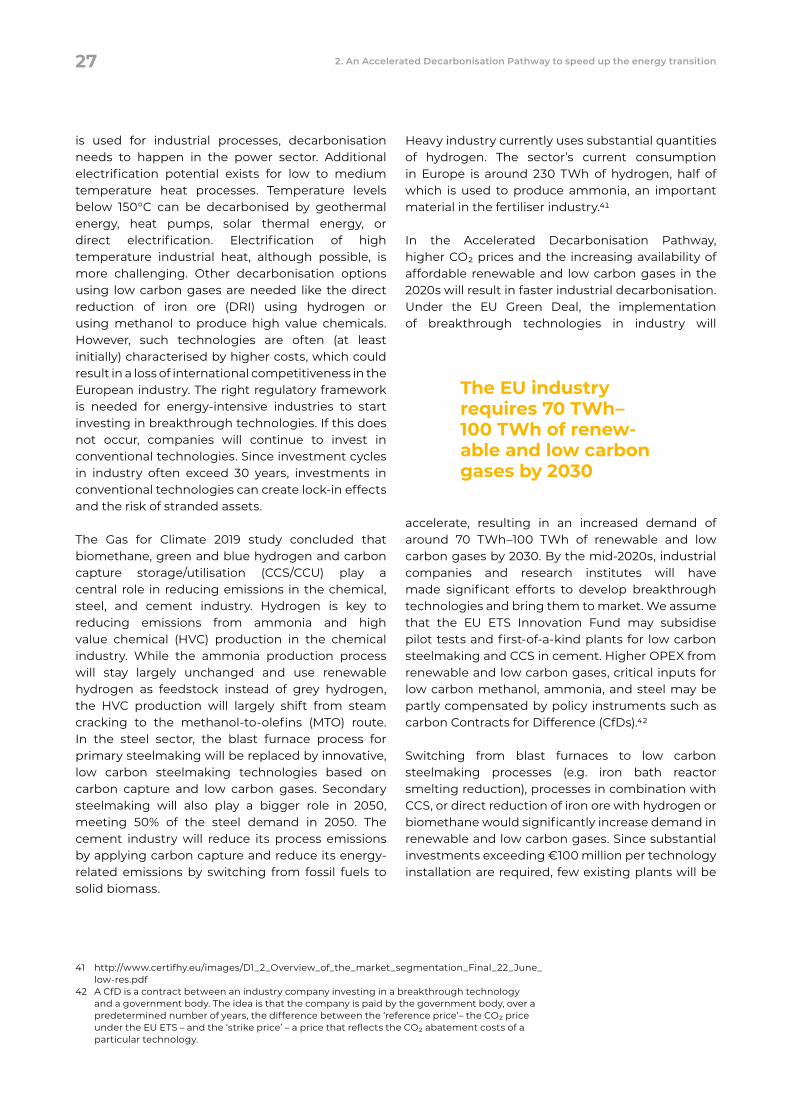
is used for industrial processes, decarbonisation needs to happen in the power sector. Additional electrification potential exists for low to medium temperature heat processes. Temperature levels below 150°C can be decarbonised by geothermal energy, heat pumps, solar thermal energy, or direct electrification. Electrification of high temperature industrial heat, although possible, is more challenging. Other decarbonisation options using low carbon gases are needed like the direct reduction of iron ore (DRI) using hydrogen or using methanol to produce high value chemicals. However, such technologies are often (at least initially) characterised by higher costs, which could result in a loss of international competitiveness in the European industry. The right regulatory framework is needed for energy-intensive industries to start investing in breakthrough technologies. If this does not occur, companies will continue to invest in conventional technologies. Since investment cycles in industry often exceed 30 years, investments in conventional technologies can create lock-in effects and the risk of stranded assets.
The Gas for Climate 2019 study concluded that biomethane, green and blue hydrogen and carbon capture storage/utilisation (CCS/CCU) play a central role in reducing emissions in the chemical, steel, and cement industry. Hydrogen is key to reducing emissions from ammonia and high value chemical (HVC) production in the chemical industry. While the ammonia production process will stay largely unchanged and use renewable hydrogen as feedstock instead of grey hydrogen, the HVC production will largely shift from steam cracking to the methanol-to-olefins (MTO) route. In the steel sector, the blast furnace process for primary steelmaking will be replaced by innovative, low carbon steelmaking technologies based on carbon capture and low carbon gases. Secondary steelmaking will also play a bigger role in 2050, meeting 50% of the steel demand in 2050. The cement industry will reduce its process emissions by applying carbon capture and reduce its energy-related emissions by switching from fossil fuels to solid biomass.
Heavy industry currently uses substantial quantities of hydrogen. The sector’s current consumption in Europe is around 230 TWh of hydrogen, half of which is used to produce ammonia, an important material in the fertiliser industry.41
In the Accelerated Decarbonisation Pathway, higher CO2 prices and the increasing availability of affordable renewable and low carbon gases in the 2020s will result in faster industrial decarbonisation. Under the EU Green Deal, the implementation of breakthrough technologies in industry will
accelerate, resulting in an increased demand of around 70 TWh–100 TWh of renewable and low carbon gases by 2030. By the mid-2020s, industrial companies and research institutes will have made significant efforts to develop breakthrough technologies and bring them to market. We assume that the EU ETS Innovation Fund may subsidise pilot tests and first-of-a-kind plants for low carbon steelmaking and CCS in cement. Higher OPEX from renewable and low carbon gases, critical inputs for low carbon methanol, ammonia, and steel may be partly compensated by policy instruments such as carbon Contracts for Difference (CfDs).42
Switching from blast furnaces to low carbon steelmaking processes (e.g. iron bath reactor smelting reduction), processes in combination with CCS, or direct reduction of iron ore with hydrogen or biomethane would significantly increase demand in renewable and low carbon gases. Since substantial investments exceeding €100 million per technology installation are required, few existing plants will be
41 http://www.certifhy.eu/images/D1_2_Overview_of_the_market_segmentation_Final_22_June_low-res.pdf
42 A CfD is a contract between an industry company investing in a breakthrough technology and a government body. The idea is that the company is paid by the government body, over a predetermined number of years, the difference between the ‘reference price’– the CO2 price under the EU ETS – and the ‘strike price’ – a price that reflects the CO2 abatement costs of a particular technology.
The EU industry requires 70 TWh– 100 TWh of renew-able and low carbon gases by 2030
27 2. An Accelerated Decarbonisation Pathway to speed up the energy transition
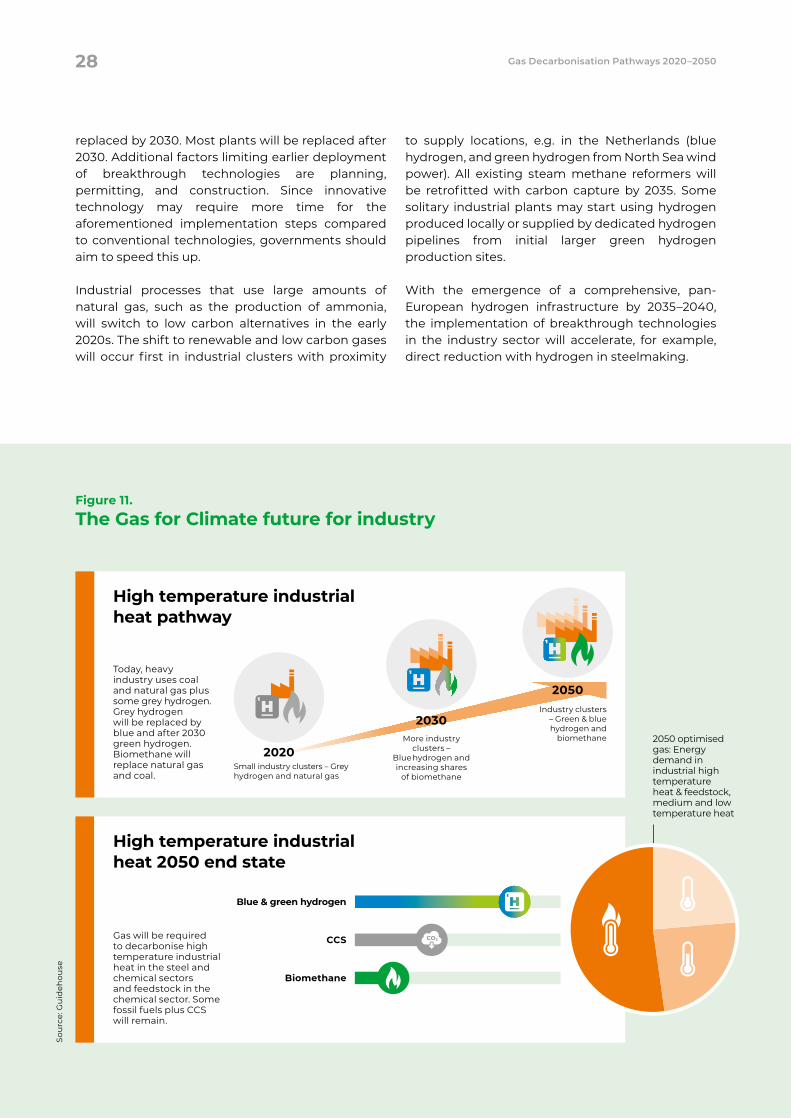
replaced by 2030. Most plants will be replaced after 2030. Additional factors limiting earlier deployment of breakthrough technologies are planning, permitting, and construction. Since innovative technology may require more time for the aforementioned implementation steps compared to conventional technologies, governments should aim to speed this up.
Industrial processes that use large amounts of natural gas, such as the production of ammonia, will switch to low carbon alternatives in the early 2020s. The shift to renewable and low carbon gases will occur first in industrial clusters with proximity
to supply locations, e.g. in the Netherlands (blue hydrogen, and green hydrogen from North Sea wind power). All existing steam methane reformers will be retrofitted with carbon capture by 2035. Some solitary industrial plants may start using hydrogen produced locally or supplied by dedicated hydrogen pipelines from initial larger green hydrogen production sites.
With the emergence of a comprehensive, pan-European hydrogen infrastructure by 2035–2040, the implementation of breakthrough technologies in the industry sector will accelerate, for example, direct reduction with hydrogen in steelmaking.
High temperature industrial heat pathway
Today, heavy industry uses coal and natural gas plus some grey hydrogen. Grey hydrogen will be replaced by blue and after 2030 green hydrogen. Biomethane will replace natural gas and coal.
Figure 11.
The Gas for Climate future for industry
High temperature industrial heat 2050 end state
Gas will be required to decarbonise high temperature industrial heat in the steel and chemical sectors and feedstock in the chemical sector. Some fossil fuels plus CCS will remain.
2050 optimised gas: Energy demand in industrial high temperature heat & feedstock, medium and low temperature heat
Sou
rce:
Gu
ideh
ouse
CCS
Biomethane
Blue & green hydrogen
2050
2030
2020More industry
clusters – Blue hydrogen and increasing shares
of biomethaneSmall industry clusters – Grey hydrogen and natural gas
Industry clusters – Green & blue hydrogen and
biomethane
28 Gas Decarbonisation Pathways 2020–2050
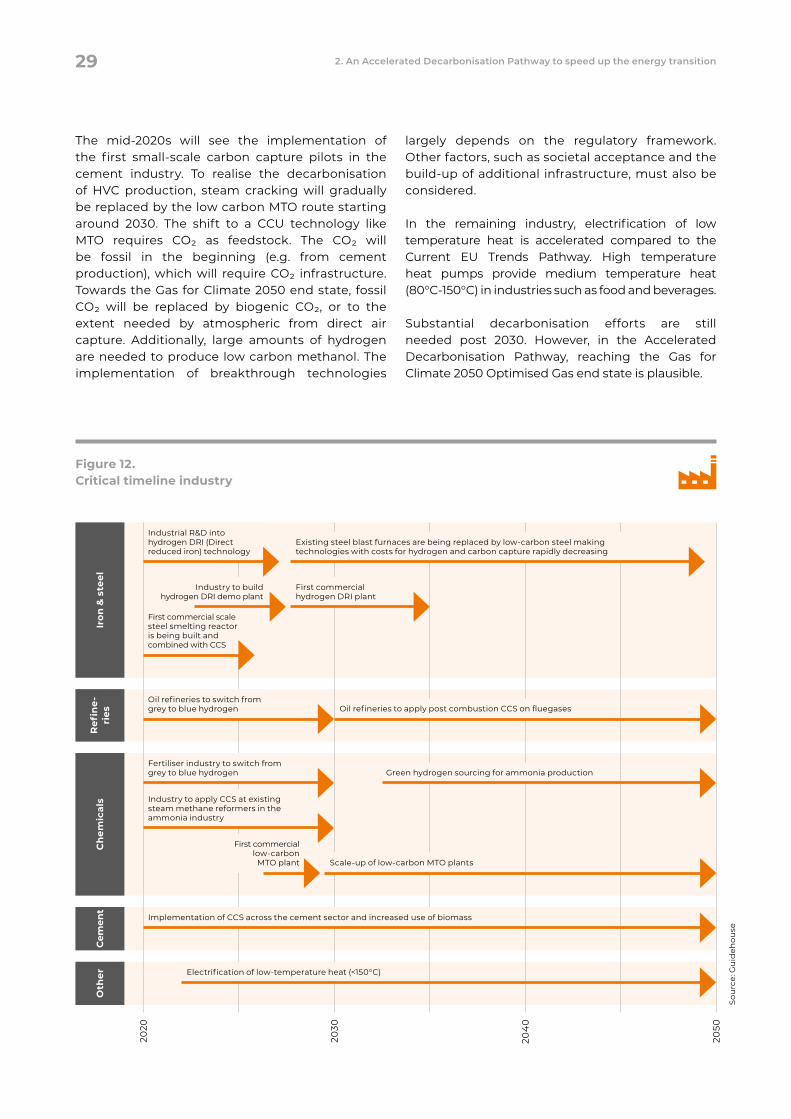
Figure 12. Critical timeline industry
Iron
& s
teel
Refi
ne-
ries
C
hem
ical
sC
emen
tO
ther
First commercial scale steel smelting reactor is being built and combined with CCS
Industrial R&D into hydrogen DRI (Direct reduced iron) technology
Existing steel blast furnaces are being replaced by low-carbon steel making technologies with costs for hydrogen and carbon capture rapidly decreasing
First commercial hydrogen DRI plant
Industry to build hydrogen DRI demo plant
Oil refineries to switch from grey to blue hydrogen
Fertiliser industry to switch from grey to blue hydrogen
Industry to apply CCS at existing steam methane reformers in the ammonia industry
Green hydrogen sourcing for ammonia production
Implementation of CCS across the cement sector and increased use of biomass
Electrification of low-temperature heat (<150°C)
2020
2030
204
0
2050
First commercial low-carbon
MTO plant Scale-up of low-carbon MTO plants
Oil refineries to apply post combustion CCS on fluegases
Sou
rce:
Gu
ideh
ouse
The mid-2020s will see the implementation of the first small-scale carbon capture pilots in the cement industry. To realise the decarbonisation of HVC production, steam cracking will gradually be replaced by the low carbon MTO route starting around 2030. The shift to a CCU technology like MTO requires CO2 as feedstock. The CO2 will be fossil in the beginning (e.g. from cement production), which will require CO2 infrastructure. Towards the Gas for Climate 2050 end state, fossil CO2 will be replaced by biogenic CO2, or to the extent needed by atmospheric from direct air capture. Additionally, large amounts of hydrogen are needed to produce low carbon methanol. The implementation of breakthrough technologies
largely depends on the regulatory framework. Other factors, such as societal acceptance and the build-up of additional infrastructure, must also be considered.
In the remaining industry, electrification of low temperature heat is accelerated compared to the Current EU Trends Pathway. High temperature heat pumps provide medium temperature heat (80°C-150°C) in industries such as food and beverages.
Substantial decarbonisation efforts are still needed post 2030. However, in the Accelerated Decarbonisation Pathway, reaching the Gas for Climate 2050 Optimised Gas end state is plausible.
29 2. An Accelerated Decarbonisation Pathway to speed up the energy transition
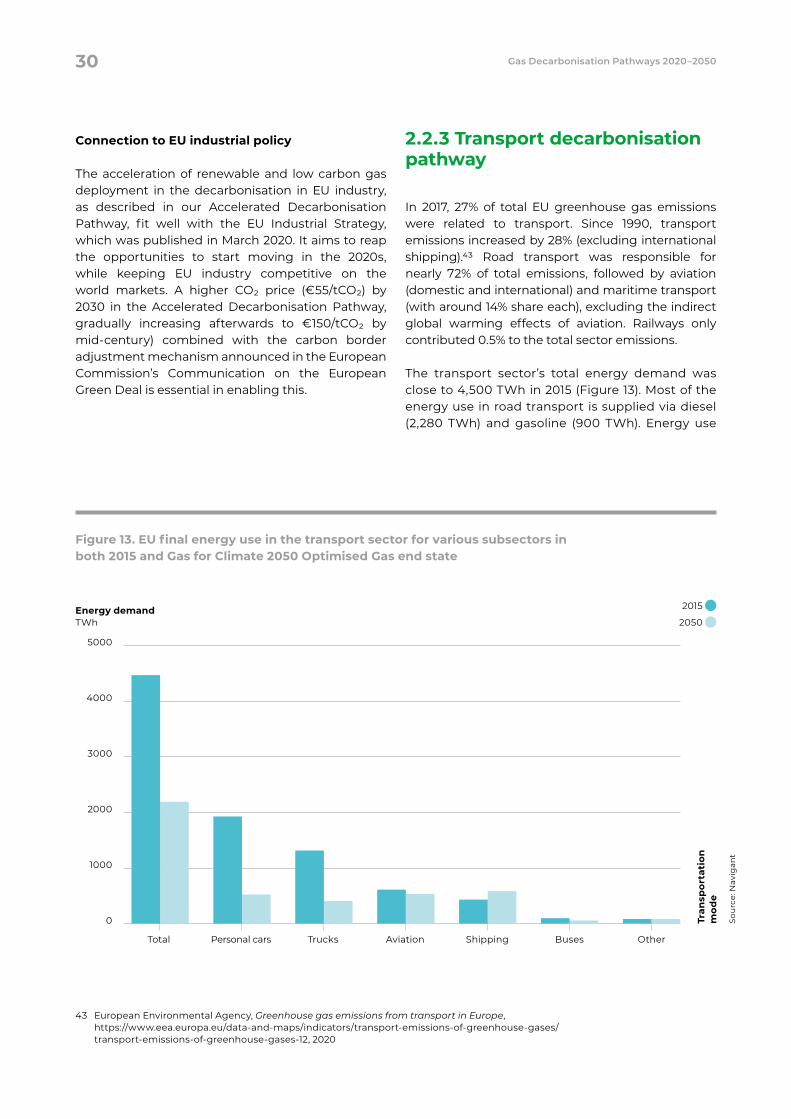
Connection to EU industrial policy
The acceleration of renewable and low carbon gas deployment in the decarbonisation in EU industry, as described in our Accelerated Decarbonisation Pathway, fit well with the EU Industrial Strategy, which was published in March 2020. It aims to reap the opportunities to start moving in the 2020s, while keeping EU industry competitive on the world markets. A higher CO2 price (€55/tCO2) by 2030 in the Accelerated Decarbonisation Pathway, gradually increasing afterwards to €150/tCO2 by mid-century) combined with the carbon border adjustment mechanism announced in the European Commission’s Communication on the European Green Deal is essential in enabling this.
2.2.3 Transport decarbonisation pathway
In 2017, 27% of total EU greenhouse gas emissions were related to transport. Since 1990, transport emissions increased by 28% (excluding international shipping).43 Road transport was responsible for nearly 72% of total emissions, followed by aviation (domestic and international) and maritime transport (with around 14% share each), excluding the indirect global warming effects of aviation. Railways only contributed 0.5% to the total sector emissions.
The transport sector’s total energy demand was close to 4,500 TWh in 2015 (Figure 13). Most of the energy use in road transport is supplied via diesel (2,280 TWh) and gasoline (900 TWh). Energy use
Figure 13. EU final energy use in the transport sector for various subsectors in both 2015 and Gas for Climate 2050 Optimised Gas end state
2015
2050 Energy demand TWh
Tran
spor
tati
on
mo
de
5000
4000
3000
2000
1000
0
Personal cars Trucks Aviation Shipping Buses OtherTotal
Sou
rce:
Nav
igan
t
43 European Environmental Agency, Greenhouse gas emissions from transport in Europe, https://www.eea.europa.eu/data-and-maps/indicators/transport-emissions-of-greenhouse-gases/transport-emissions-of-greenhouse-gases-12, 2020
30 Gas Decarbonisation Pathways 2020–2050
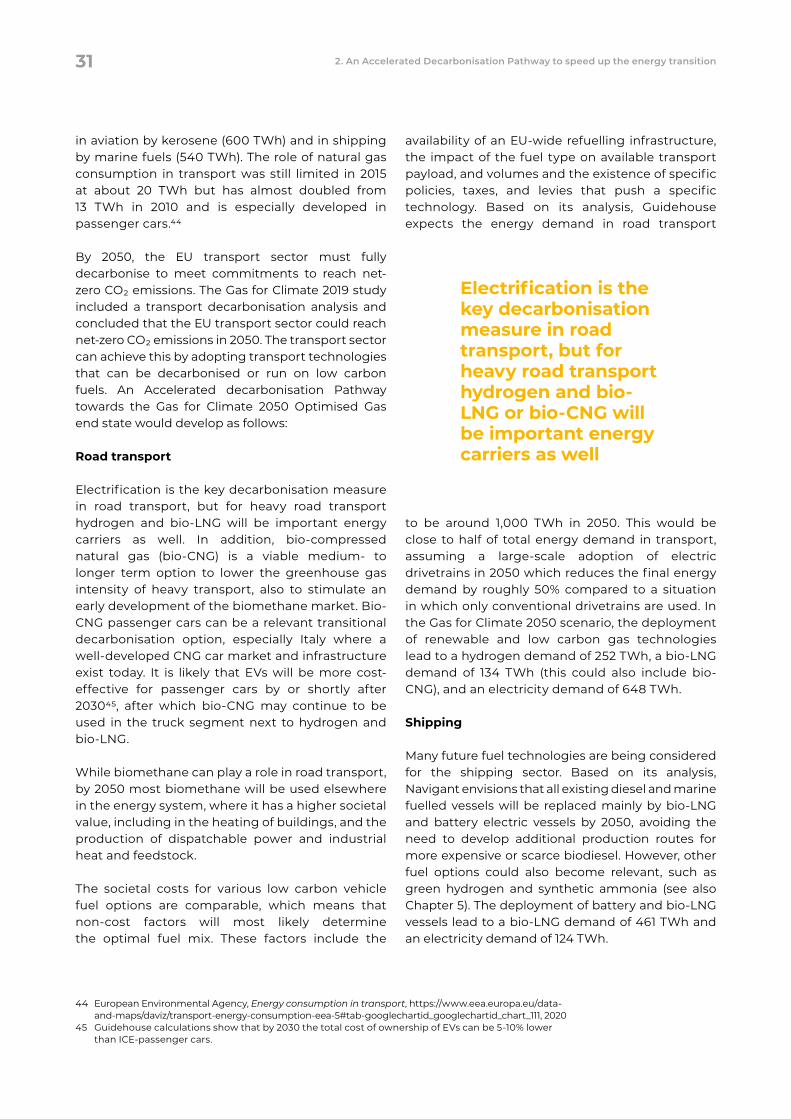
in aviation by kerosene (600 TWh) and in shipping by marine fuels (540 TWh). The role of natural gas consumption in transport was still limited in 2015 at about 20 TWh but has almost doubled from 13 TWh in 2010 and is especially developed in passenger cars.44
By 2050, the EU transport sector must fully decarbonise to meet commitments to reach net-zero CO2 emissions. The Gas for Climate 2019 study included a transport decarbonisation analysis and concluded that the EU transport sector could reach net-zero CO2 emissions in 2050. The transport sector can achieve this by adopting transport technologies that can be decarbonised or run on low carbon fuels. An Accelerated decarbonisation Pathway towards the Gas for Climate 2050 Optimised Gas end state would develop as follows:
Road transport
Electrification is the key decarbonisation measure in road transport, but for heavy road transport hydrogen and bio-LNG will be important energy carriers as well. In addition, bio-compressed natural gas (bio-CNG) is a viable medium- to longer term option to lower the greenhouse gas intensity of heavy transport, also to stimulate an early development of the biomethane market. Bio-CNG passenger cars can be a relevant transitional decarbonisation option, especially Italy where a well-developed CNG car market and infrastructure exist today. It is likely that EVs will be more cost-effective for passenger cars by or shortly after 203045, after which bio-CNG may continue to be used in the truck segment next to hydrogen and bio-LNG.
While biomethane can play a role in road transport, by 2050 most biomethane will be used elsewhere in the energy system, where it has a higher societal value, including in the heating of buildings, and the production of dispatchable power and industrial heat and feedstock.
The societal costs for various low carbon vehicle fuel options are comparable, which means that non-cost factors will most likely determine the optimal fuel mix. These factors include the
availability of an EU-wide refuelling infrastructure, the impact of the fuel type on available transport payload, and volumes and the existence of specific policies, taxes, and levies that push a specific technology. Based on its analysis, Guidehouse expects the energy demand in road transport
to be around 1,000 TWh in 2050. This would be close to half of total energy demand in transport, assuming a large-scale adoption of electric drivetrains in 2050 which reduces the final energy demand by roughly 50% compared to a situation in which only conventional drivetrains are used. In the Gas for Climate 2050 scenario, the deployment of renewable and low carbon gas technologies lead to a hydrogen demand of 252 TWh, a bio-LNG demand of 134 TWh (this could also include bio-CNG), and an electricity demand of 648 TWh.
Shipping
Many future fuel technologies are being considered for the shipping sector. Based on its analysis, Navigant envisions that all existing diesel and marine fuelled vessels will be replaced mainly by bio-LNG and battery electric vessels by 2050, avoiding the need to develop additional production routes for more expensive or scarce biodiesel. However, other fuel options could also become relevant, such as green hydrogen and synthetic ammonia (see also Chapter 5). The deployment of battery and bio-LNG vessels lead to a bio-LNG demand of 461 TWh and an electricity demand of 124 TWh.
44 European Environmental Agency, Energy consumption in transport, https://www.eea.europa.eu/data- and- maps/daviz/transport-energy-consumption-eea-5#tab-googlechartid_googlechartid_chart_111, 2020
45 Guidehouse calculations show that by 2030 the total cost of ownership of EVs can be 5-10% lower than ICE-passenger cars.
Electrification is the key decarbonisation measure in road transport, but for heavy road transport hydrogen and bio-LNG or bio-CNG will be important energy carriers as well
31 2. An Accelerated Decarbonisation Pathway to speed up the energy transition
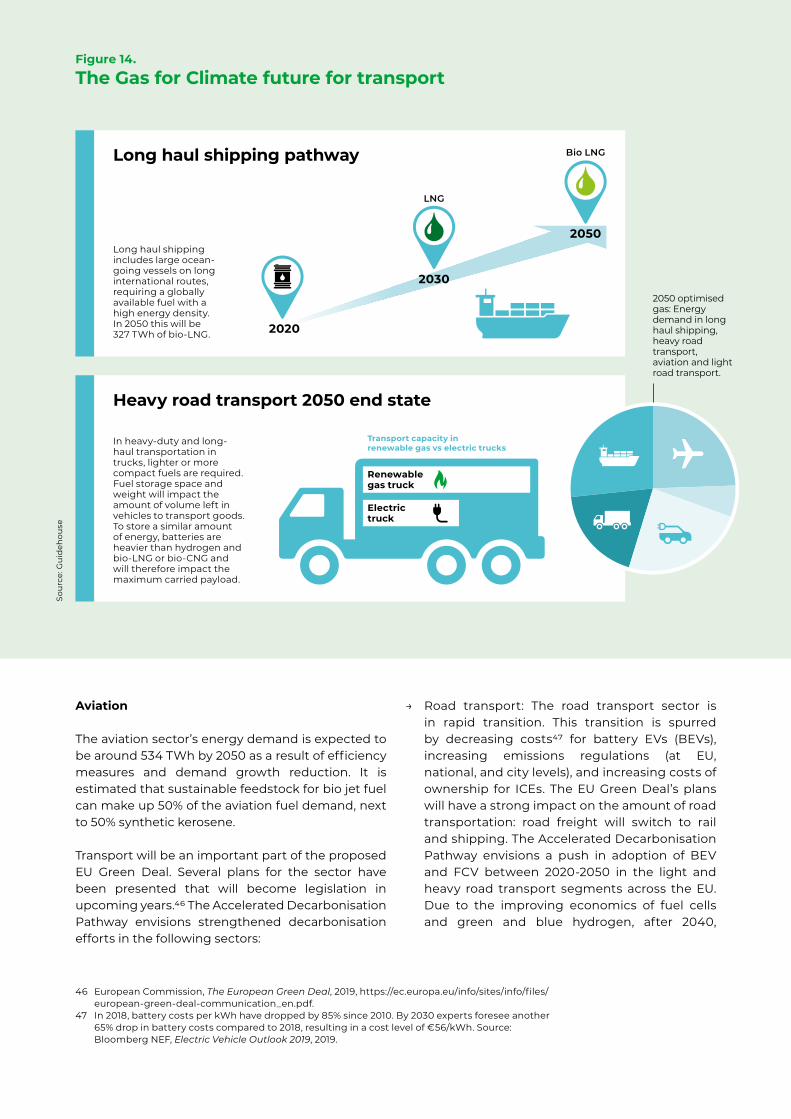
Aviation
The aviation sector’s energy demand is expected to be around 534 TWh by 2050 as a result of efficiency measures and demand growth reduction. It is estimated that sustainable feedstock for bio jet fuel can make up 50% of the aviation fuel demand, next to 50% synthetic kerosene. Transport will be an important part of the proposed EU Green Deal. Several plans for the sector have been presented that will become legislation in upcoming years.46 The Accelerated Decarbonisation Pathway envisions strengthened decarbonisation efforts in the following sectors:
→ Road transport: The road transport sector is in rapid transition. This transition is spurred by decreasing costs47 for battery EVs (BEVs), increasing emissions regulations (at EU, national, and city levels), and increasing costs of ownership for ICEs. The EU Green Deal’s plans will have a strong impact on the amount of road transportation: road freight will switch to rail and shipping. The Accelerated Decarbonisation Pathway envisions a push in adoption of BEV and FCV between 2020-2050 in the light and heavy road transport segments across the EU. Due to the improving economics of fuel cells and green and blue hydrogen, after 2040,
46 European Commission, The European Green Deal, 2019, https://ec.europa.eu/info/sites/info/files/european-green-deal-communication_en.pdf.
47 In 2018, battery costs per kWh have dropped by 85% since 2010. By 2030 experts foresee another 65% drop in battery costs compared to 2018, resulting in a cost level of €56/kWh. Source: Bloomberg NEF, Electric Vehicle Outlook 2019, 2019.
Figure 14.
The Gas for Climate future for transport
Long haul shipping pathway
Long haul shipping includes large ocean-going vessels on long international routes, requiring a globally available fuel with a high energy density. In 2050 this will be 327 TWh of bio-LNG.
2050
Bio LNG
2030
LNG
2020
Heavy road transport 2050 end state
In heavy-duty and long-haul transportation in trucks, lighter or more compact fuels are required. Fuel storage space and weight will impact the amount of volume left in vehicles to transport goods. To store a similar amount of energy, batteries are heavier than hydrogen and bio-LNG or bio-CNG and will therefore impact the maximum carried payload.
Transport capacity in renewable gas vs electric trucks
Electric truck
Renewable gas truck
2050 optimised gas: Energy demand in long haul shipping, heavy road transport, aviation and light road transport.
Sou
rce:
Gu
ideh
ouse
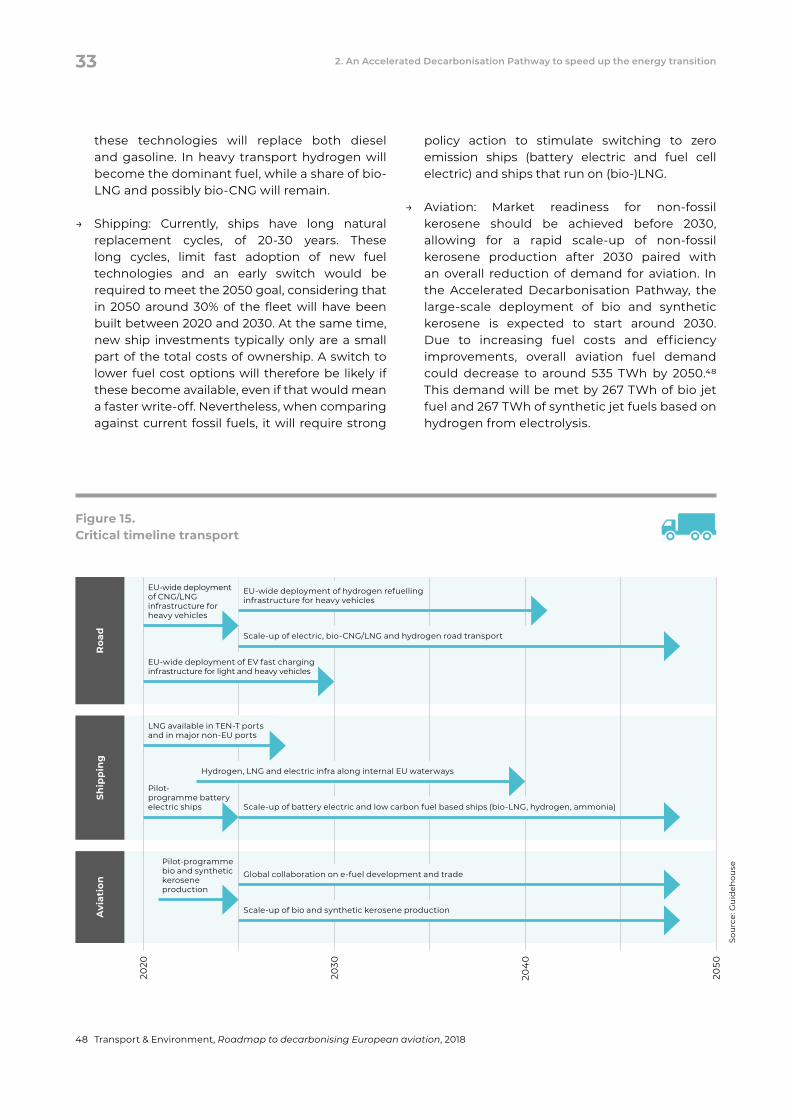
these technologies will replace both diesel and gasoline. In heavy transport hydrogen will become the dominant fuel, while a share of bio-LNG and possibly bio-CNG will remain.
→ Shipping: Currently, ships have long natural replacement cycles, of 20-30 years. These long cycles, limit fast adoption of new fuel technologies and an early switch would be required to meet the 2050 goal, considering that in 2050 around 30% of the fleet will have been built between 2020 and 2030. At the same time, new ship investments typically only are a small part of the total costs of ownership. A switch to lower fuel cost options will therefore be likely if these become available, even if that would mean a faster write-off. Nevertheless, when comparing against current fossil fuels, it will require strong
policy action to stimulate switching to zero emission ships (battery electric and fuel cell electric) and ships that run on (bio-)LNG.
→ Aviation: Market readiness for non-fossil kerosene should be achieved before 2030, allowing for a rapid scale-up of non-fossil kerosene production after 2030 paired with an overall reduction of demand for aviation. In the Accelerated Decarbonisation Pathway, the large-scale deployment of bio and synthetic kerosene is expected to start around 2030. Due to increasing fuel costs and efficiency improvements, overall aviation fuel demand could decrease to around 535 TWh by 2050.48 This demand will be met by 267 TWh of bio jet fuel and 267 TWh of synthetic jet fuels based on hydrogen from electrolysis.
48 Transport & Environment, Roadmap to decarbonising European aviation, 2018
Figure 15. Critical timeline transport
2020
2030
204
0
2050
Roa
d
EU-wide deployment of EV fast charging infrastructure for light and heavy vehicles
EU-wide deployment of CNG/LNG infrastructure for heavy vehicles
Scale-up of electric, bio-CNG/LNG and hydrogen road transport
EU-wide deployment of hydrogen refuelling infrastructure for heavy vehicles
Avi
atio
n
Pilot-programme bio and synthetic kerosene production
Scale-up of bio and synthetic kerosene production
Global collaboration on e-fuel development and trade
Ship
pin
g
LNG available in TEN-T ports and in major non-EU ports
Hydrogen, LNG and electric infra along internal EU waterways
Scale-up of battery electric and low carbon fuel based ships (bio-LNG, hydrogen, ammonia)
Pilot- programme battery electric ships
Sou
rce:
Gu
ideh
ouse
33 2. An Accelerated Decarbonisation Pathway to speed up the energy transition
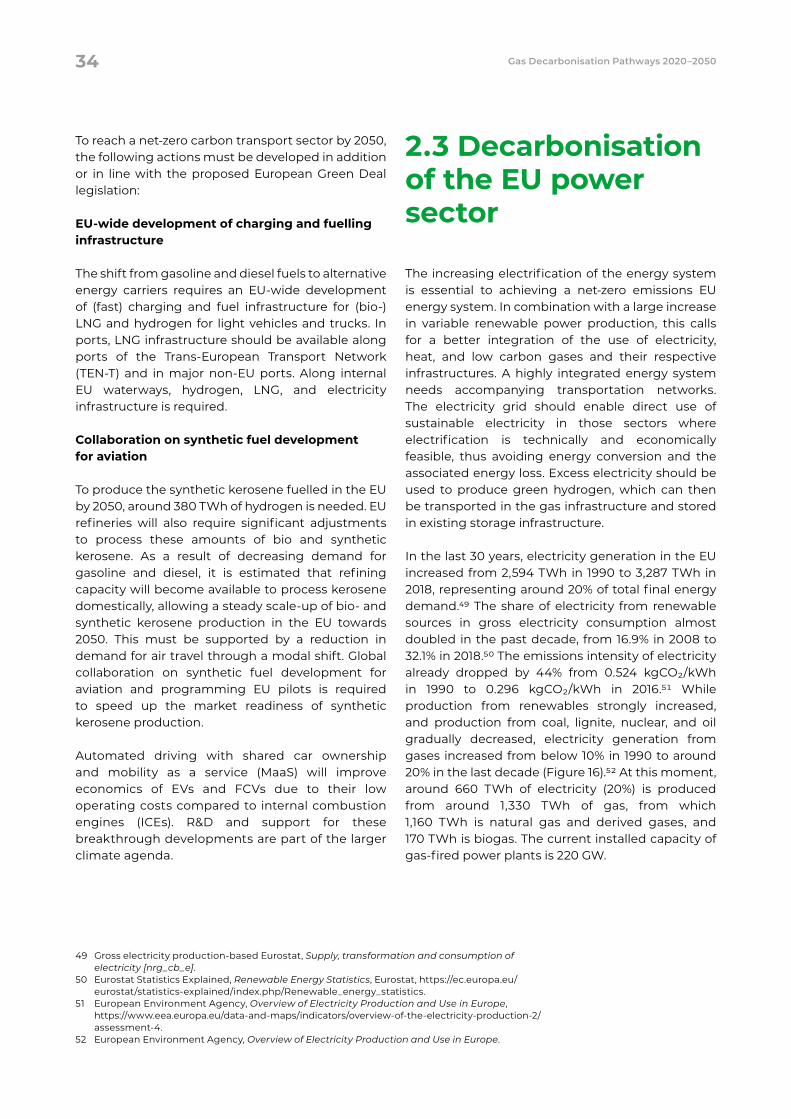
To reach a net-zero carbon transport sector by 2050, the following actions must be developed in addition or in line with the proposed European Green Deal legislation:
EU-wide development of charging and fuelling infrastructure
The shift from gasoline and diesel fuels to alternative energy carriers requires an EU-wide development of (fast) charging and fuel infrastructure for (bio-)LNG and hydrogen for light vehicles and trucks. In ports, LNG infrastructure should be available along ports of the Trans-European Transport Network (TEN-T) and in major non-EU ports. Along internal EU waterways, hydrogen, LNG, and electricity infrastructure is required.
Collaboration on synthetic fuel development for aviation
To produce the synthetic kerosene fuelled in the EU by 2050, around 380 TWh of hydrogen is needed. EU refineries will also require significant adjustments to process these amounts of bio and synthetic kerosene. As a result of decreasing demand for gasoline and diesel, it is estimated that refining capacity will become available to process kerosene domestically, allowing a steady scale-up of bio- and synthetic kerosene production in the EU towards 2050. This must be supported by a reduction in demand for air travel through a modal shift. Global collaboration on synthetic fuel development for aviation and programming EU pilots is required to speed up the market readiness of synthetic kerosene production.
Automated driving with shared car ownership and mobility as a service (MaaS) will improve economics of EVs and FCVs due to their low operating costs compared to internal combustion engines (ICEs). R&D and support for these breakthrough developments are part of the larger climate agenda.
2.3 Decarbonisation of the EU power sector
The increasing electrification of the energy system is essential to achieving a net-zero emissions EU energy system. In combination with a large increase in variable renewable power production, this calls for a better integration of the use of electricity, heat, and low carbon gases and their respective infrastructures. A highly integrated energy system needs accompanying transportation networks. The electricity grid should enable direct use of sustainable electricity in those sectors where electrification is technically and economically feasible, thus avoiding energy conversion and the associated energy loss. Excess electricity should be used to produce green hydrogen, which can then be transported in the gas infrastructure and stored in existing storage infrastructure.
In the last 30 years, electricity generation in the EU increased from 2,594 TWh in 1990 to 3,287 TWh in 2018, representing around 20% of total final energy demand.49 The share of electricity from renewable sources in gross electricity consumption almost doubled in the past decade, from 16.9% in 2008 to 32.1% in 2018.50 The emissions intensity of electricity already dropped by 44% from 0.524 kgCO2/kWh in 1990 to 0.296 kgCO2/kWh in 2016.51 While production from renewables strongly increased, and production from coal, lignite, nuclear, and oil gradually decreased, electricity generation from gases increased from below 10% in 1990 to around 20% in the last decade (Figure 16).52 At this moment, around 660 TWh of electricity (20%) is produced from around 1,330 TWh of gas, from which 1,160 TWh is natural gas and derived gases, and 170 TWh is biogas. The current installed capacity of gas-fired power plants is 220 GW.
49 Gross electricity production-based Eurostat, Supply, transformation and consumption of electricity [nrg_cb_e].
50 Eurostat Statistics Explained, Renewable Energy Statistics, Eurostat, https://ec.europa.eu/eurostat/statistics-explained/index.php/Renewable_energy_statistics.
51 European Environment Agency, Overview of Electricity Production and Use in Europe, https://www.eea.europa.eu/data-and-maps/indicators/overview-of-the-electricity-production-2/assessment-4.
52 European Environment Agency, Overview of Electricity Production and Use in Europe.
34 Gas Decarbonisation Pathways 2020–2050
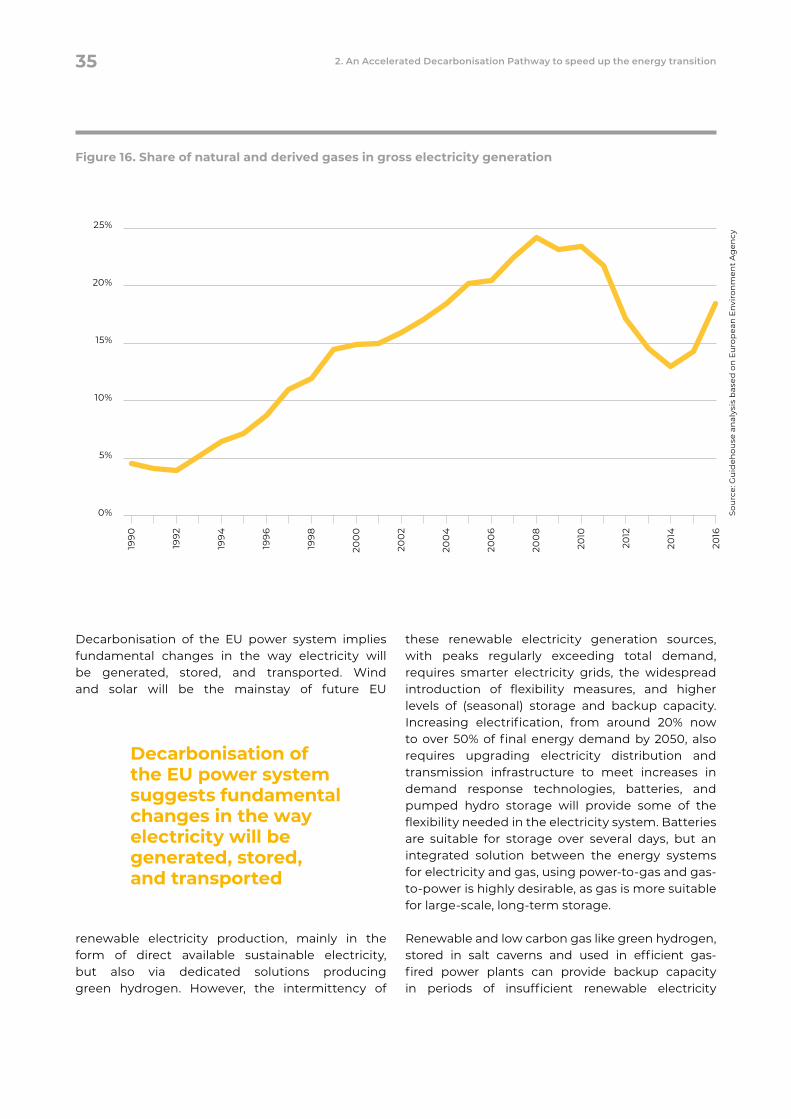
Decarbonisation of the EU power system implies fundamental changes in the way electricity will be generated, stored, and transported. Wind and solar will be the mainstay of future EU
renewable electricity production, mainly in the form of direct available sustainable electricity, but also via dedicated solutions producing green hydrogen. However, the intermittency of
these renewable electricity generation sources, with peaks regularly exceeding total demand, requires smarter electricity grids, the widespread introduction of flexibility measures, and higher levels of (seasonal) storage and backup capacity. Increasing electrification, from around 20% now to over 50% of final energy demand by 2050, also requires upgrading electricity distribution and transmission infrastructure to meet increases in demand response technologies, batteries, and pumped hydro storage will provide some of the flexibility needed in the electricity system. Batteries are suitable for storage over several days, but an integrated solution between the energy systems for electricity and gas, using power-to-gas and gas-to-power is highly desirable, as gas is more suitable for large-scale, long-term storage.
Renewable and low carbon gas like green hydrogen, stored in salt caverns and used in efficient gas-fired power plants can provide backup capacity in periods of insufficient renewable electricity
Figure 16. Share of natural and derived gases in gross electricity generation
Sou
rce:
Gu
ideh
ouse
an
alys
is b
ased
on
Eu
rop
ean
En
viro
nm
ent
Ag
ency
25%
20%
15%
10%
5%
0%
1990
2016
1994
1996
1998
200
0
200
2
200
4
200
6
200
8
2010
2012
2014
1992
Decarbonisation of the EU power system suggests fundamental changes in the way electricity will be generated, stored, and transported
35 2. An Accelerated Decarbonisation Pathway to speed up the energy transition
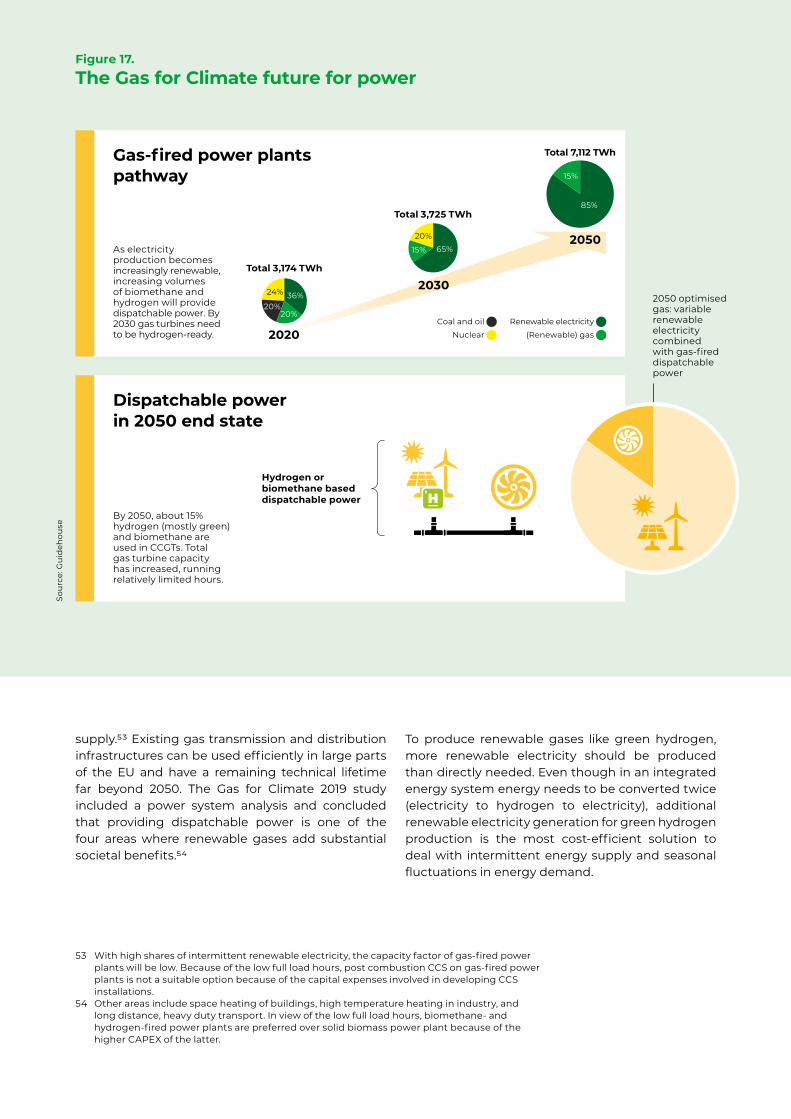
supply.53 Existing gas transmission and distribution infrastructures can be used efficiently in large parts of the EU and have a remaining technical lifetime far beyond 2050. The Gas for Climate 2019 study included a power system analysis and concluded that providing dispatchable power is one of the four areas where renewable gases add substantial societal benefits.54
To produce renewable gases like green hydrogen, more renewable electricity should be produced than directly needed. Even though in an integrated energy system energy needs to be converted twice (electricity to hydrogen to electricity), additional renewable electricity generation for green hydrogen production is the most cost-efficient solution to deal with intermittent energy supply and seasonal fluctuations in energy demand.
53 With high shares of intermittent renewable electricity, the capacity factor of gas-fired power plants will be low. Because of the low full load hours, post combustion CCS on gas-fired power plants is not a suitable option because of the capital expenses involved in developing CCS installations.
54 Other areas include space heating of buildings, high temperature heating in industry, and long distance, heavy duty transport. In view of the low full load hours, biomethane- and hydrogen-fired power plants are preferred over solid biomass power plant because of the higher CAPEX of the latter.
Gas-fired power plants pathway
2050
2030
2020
Figure 17.
The Gas for Climate future for power
Dispatchable power in 2050 end state
2050 optimised gas: variable renewable electricity combined with gas-fired dispatchable power
Sou
rce:
Gu
ideh
ouse
As electricity production becomes increasingly renewable, increasing volumes of biomethane and hydrogen will provide dispatchable power. By 2030 gas turbines need to be hydrogen-ready.
By 2050, about 15% hydrogen (mostly green) and biomethane are used in CCGTs. Total gas turbine capacity has increased, running relatively limited hours.
Hydrogen or biomethane based dispatchable power
Total 7,112 TWh
Total 3,725 TWh
Total 3,174 TWh
Renewable electricity (Renewable) gas
Coal and oil Nuclear
36%
20%20%
24%
65%15%
20%
85%
15%
In the Gas for Climate 2050 Optimised Gas end state, electricity generation from gas decreases slightly from around 660 TWh in 2020 to around 500 TWh in 2050. However, installed capacity increases from around 220 GW to around 600 GW by 2050. The need for dispatchable power generation is in line with the Eurelectric’s Decarbonisation Scenarios, with around 500 GW gas-fired and nuclear power plants.55 Where generation is mainly based on natural gas, in 2050 this will be a mix of hydrogen (490 GW) and biomethane (120 GW). As gas-fired power is solely used as flexible dispatchable power generation by 2050, full load hours decrease but the required capacity increases significantly. Because of the reduced running hours, newly constructed methane- and hydrogen-fired power plants will be primarily open cycle gas turbines (OCGTs). OCGTs have a relatively low CAPEX compared to the higher efficiency combined cycle gas turbines (CCGTs).
To realise strong emission reductions in the next decades (as envisioned in the Accelerated Decarbonisation Pathway) actions are required on all possible levels:
→ The major contribution to emission reductions in the power sector should come from the increased deployment of renewable electricity generation to 60%-70% of total electricity generation in 2030 and the full decarbonisation of the power sector around 2045.
→ Other measures are needed to reduce emissions. Accelerating the coal phaseout to realise emission reductions (in addition to those resulting from renewable electricity deployment) as well as deployment of blue hydrogen for power generation, can put Europe on a steep emission reduction curve.
In the Accelerated Decarbonisation Pathway, 60%-70% of electricity in 2030 will be generated by renewables. The remaining 30%–40% will be primarily covered by nuclear (around 20%) and gas (around 15%). Gas demand in the power sector amounts to around 1,200 TWh by 2030. While gas demand is reducing slightly, gas-fired power plant capacity increases from around 220 GW in 2020 to 275 GW by 2030 due to increasing shares
of intermittent renewable electricity and the phaseout of coal-based power production. Initially, there will be an increase in installed capacity of power plants running on methane. However, because of the switch towards hydrogen in the longer term, these new plants should be hydrogen-ready.
Plants located in industrial clusters where blue hydrogen will be developed will be the first to move from methane to hydrogen in the coming decade. More solitary gas-fired power plants outside hydrogen clusters have three options:
1. Delay shifting from methane to hydrogen until they get connected to the hydrogen network or the existing gas grid connection is converted to hydrogen
2. Get natural gas through their existing grid connection and produce blue hydrogen onsite56
3. Get a private company to invest in a dedicated hydrogen pipe to supply them
Developing new capacity requires overall energy system planning that considers the future layout and build-up of dedicated hydrogen networks and the future development of regional electricity demand.
Accelerating decarbonisation of power generation through coal phaseout and blue hydrogen deployment
Actions on all levels are required to realise strong emission reductions in the next decades. In the power sector, the increased deployment of
55 Eurelectric, 2018. Decarbonisation Pathways – Full study results. Slide 53. Available at: https://www.eurelectric.org/decarbonisation-pathways/
56 Also referred to as pre-combustion CCS.
In the Accelerated Decarbonisation Pathway, 60%–70% of electricity will be generated by renewables in 2030
37 2. An Accelerated Decarbonisation Pathway to speed up the energy transition
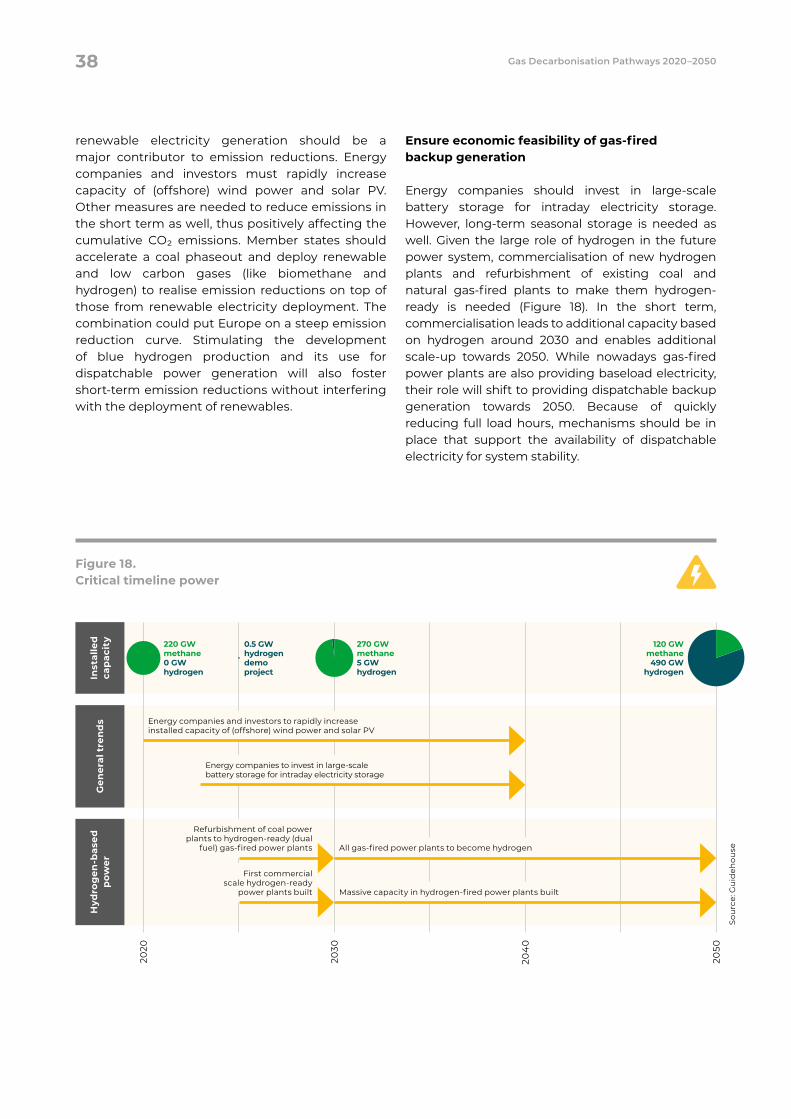
renewable electricity generation should be a major contributor to emission reductions. Energy companies and investors must rapidly increase capacity of (offshore) wind power and solar PV. Other measures are needed to reduce emissions in the short term as well, thus positively affecting the cumulative CO2 emissions. Member states should accelerate a coal phaseout and deploy renewable and low carbon gases (like biomethane and hydrogen) to realise emission reductions on top of those from renewable electricity deployment. The combination could put Europe on a steep emission reduction curve. Stimulating the development of blue hydrogen production and its use for dispatchable power generation will also foster short-term emission reductions without interfering with the deployment of renewables.
Ensure economic feasibility of gas-fired backup generation
Energy companies should invest in large-scale battery storage for intraday electricity storage. However, long-term seasonal storage is needed as well. Given the large role of hydrogen in the future power system, commercialisation of new hydrogen plants and refurbishment of existing coal and natural gas-fired plants to make them hydrogen-ready is needed (Figure 18). In the short term, commercialisation leads to additional capacity based on hydrogen around 2030 and enables additional scale-up towards 2050. While nowadays gas-fired power plants are also providing baseload electricity, their role will shift to providing dispatchable backup generation towards 2050. Because of quickly reducing full load hours, mechanisms should be in place that support the availability of dispatchable electricity for system stability.
Gen
eral
tre
nd
sH
ydro
gen
-bas
ed
pow
er
Figure 18. Critical timeline power
Inst
alle
d
cap
acit
y
2020
2030
204
0
2050
220 GW methane0 GW hydrogen
270 GW methane5 GW hydrogen
120 GW methane490 GW
hydrogen
0.5 GW hydrogen demo project
Sou
rce:
Gu
ideh
ouse
Refurbishment of coal power plants to hydrogen-ready (dual
fuel) gas-fired power plants
First commercial scale hydrogen-ready
power plants built
All gas-fired power plants to become hydrogen
Massive capacity in hydrogen-fired power plants built
Energy companies to invest in large-scale battery storage for intraday electricity storage
Energy companies and investors to rapidly increase installed capacity of (offshore) wind power and solar PV
38 Gas Decarbonisation Pathways 2020–2050
2.4 Gas infrastructure developments 2020 to 2050
The energy system of the future is expected to require strong electricity networks as well as a strong gas infrastructure, including storage facilities, to secure supply of renewable energy in the form of both molecules and electrons. The respective infrastructures for gas, electricity, and heating will need to be coordinated and planned in a more integrated way to make use of all their offered advantages through sector coupling. Furthermore, integrated network planning for electricity and gas networks is essential to prevent inefficient and costly bias towards one form of network or the other.57
ENTSOG and ENTSO-E have already started co-ordinating their respective Ten Year Network Development Plans (TYNDP) by creating joint scenarios capturing the existing interlinkages between both sectors and the long-term development of integrated infrastructure. In the future, further benefits could be realised in ensuring greater coordination between electricity and gas TSOs (and DSOs) on the member states level.
In the Accelerated Decarbonisation Pathway, biomethane and hydrogen volumes make up 10% of total gas consumption in the EU by 2030, followed by a rapid and accelerated scale-up between 2030 and 2050. Electricity demand will increase from around 3,200 TWh in 2020 to around 3,700 TWh in 2030 and almost 7,000 TWh in 2050. At the same time, it will become more volatile due to an increase in the use of electricity for heating of buildings. Electricity supply will also increasingly fluctuate. In 2030, 40%–50% of all electricity comes from intermittent sources, increasing to over 80% in 2050.
Up to 2030, gas infrastructure will mainly be used to transport, store, and distribute biomethane, yet volumes of grid-injected biomethane and hydrogen will increase gradually. Biomethane is injected mainly in low and medium pressure grids yet also in higher pressure grids. Biomethane will often be used locally to heat buildings with gas connections yet will increasingly be injected in into the high pressure grid facilitated by reverse flow technology to be transported to different regions and across borders through transmission grids. Between 2040 and 2050 a notable production of power to methane could be expected, using biogenic CO2 captured in large biogas digesters and green hydrogen produced onsite. This methane will be injected in existing gas grids. Pure hydrogen will initially be used mainly in industrial clusters that already use hydrogen today. Up to 2030, only a limited quantity of hydrogen will flow through gas grids, often blended with natural gas.
Electricity infrastructure will be adapted to cope with increased volumes of centrally and locally produced sustainable electricity. Fluctuations in electricity supply will still mainly be absorbed by the electricity sector themselves. The need for dispatchable electricity from gas-fired power plants will increase, but as the total demand for methane decreases, no major adaptions to gas infrastructure will be needed. For the same reason, demand for gas as in terms of backup for heat networks in colder periods will not lead to major adaptions in the gas infrastructure.
Around 2030, the scale-up of green and blue hydrogen and its increased consumption in industrial sites outside industrial clusters will require the creation of dedicated regional or national hydrogen infrastructures. Gradually, around 2035, national hydrogen backbones, as already proposed for the Netherlands58 and Germany59, can be connected to create a dedicated European hydrogen backbone infrastructure. Such infrastructure would use existing natural gas pipelines, especially at routes with parallel pipes and in regions where natural gas infrastructure becomes available due to
57 For further details on the regulatory barriers, see European Commission (DG ENER) Study Potentials of sector coupling for decarbonisation – assessing regulatory barriers in linking the gas and electricity sectors in the EU, Frontier Economics, CE Delft, Thema Consulting Group (2019).
58 Gasunie, Moving towards 2030 and 2050 with hydrogen, https://www.gasunie.nl/en/news/meet-the-gasunie-hydrogen-team-at-e-world-in-essen/$4392/$4393
59 FNB-Gas, https://www.fnb-gas.de/fnb-gas/veroeffentlichungen/pressemitteilungen/fernleitungs-netzbetreiber-veroeffentlichen-karte-fuer-visionaeres-wasserstoffnetz-h2-netz/ (in German)
39 2. An Accelerated Decarbonisation Pathway to speed up the energy transition
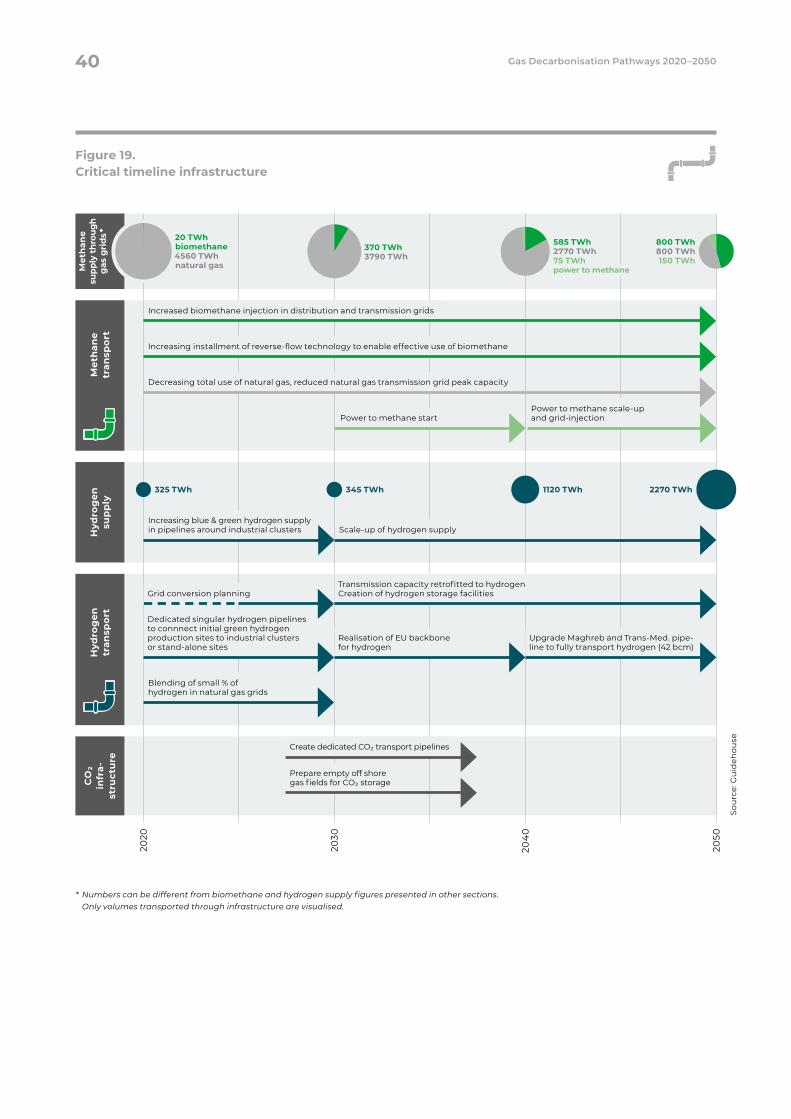
* Numbers can be different from biomethane and hydrogen supply figures presented in other sections. Only volumes transported through infrastructure are visualised.
Scale-up of hydrogen supply Increasing blue & green hydrogen supply in pipelines around industrial clusters
Figure 19. Critical timeline infrastructure
2020
2030
204
0
2050
Met
han
e
supp
ly th
roug
h
gas
gri
ds *
Hyd
rog
en
sup
ply
CO
2
infr
a-st
ruct
ure
20 TWh biomethane4560 TWhnatural gas
370 TWh3790 TWh
800 TWh800 TWh150 TWh
Increased biomethane injection in distribution and transmission grids
Increasing installment of reverse-flow technology to enable effective use of biomethane
Power to methane scale-up and grid-injectionPower to methane start
Decreasing total use of natural gas, reduced natural gas transmission grid peak capacity
Transmission capacity retrofitted to hydrogen Creation of hydrogen storage facilities
Upgrade Maghreb and Trans-Med. pipe-line to fully transport hydrogen (42 bcm)
Blending of small % of hydrogen in natural gas grids
Create dedicated CO2 transport pipelines
Prepare empty off shore gas fields for CO2 storage
Hyd
rog
en
tran
spor
tM
eth
ane
tr
ansp
ort
Sou
rce:
Gu
ideh
ouse
345 TWh325 TWh 1120 TWh 2270 TWh
585 TWh2770 TWh75 TWhpower to methane
Grid conversion planning
Realisation of EU backbone for hydrogen
Dedicated singular hydrogen pipelines to connnect initial green hydrogen production sites to industrial clusters or stand-alone sites
40 Gas Decarbonisation Pathways 2020–2050
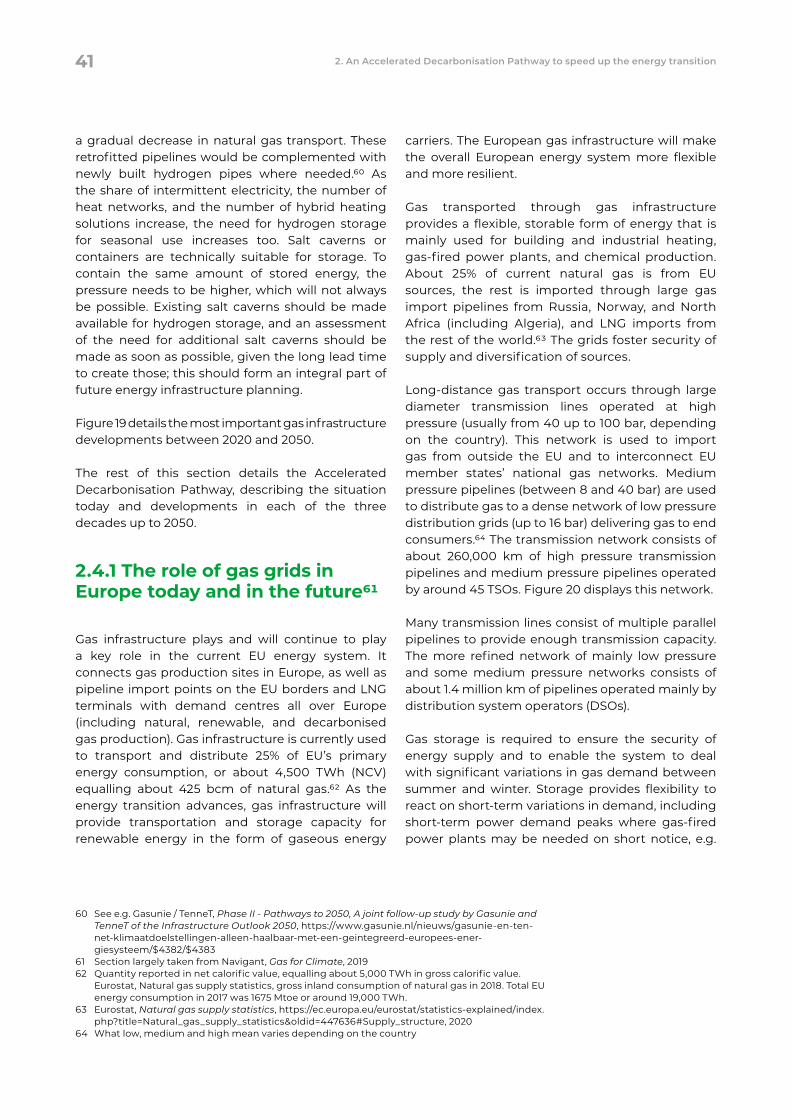
a gradual decrease in natural gas transport. These retrofitted pipelines would be complemented with newly built hydrogen pipes where needed.60 As the share of intermittent electricity, the number of heat networks, and the number of hybrid heating solutions increase, the need for hydrogen storage for seasonal use increases too. Salt caverns or containers are technically suitable for storage. To contain the same amount of stored energy, the pressure needs to be higher, which will not always be possible. Existing salt caverns should be made available for hydrogen storage, and an assessment of the need for additional salt caverns should be made as soon as possible, given the long lead time to create those; this should form an integral part of future energy infrastructure planning.
Figure 19 details the most important gas infrastructure developments between 2020 and 2050.
The rest of this section details the Accelerated Decarbonisation Pathway, describing the situation today and developments in each of the three decades up to 2050.
2.4.1 The role of gas grids in Europe today and in the future61
Gas infrastructure plays and will continue to play a key role in the current EU energy system. It connects gas production sites in Europe, as well as pipeline import points on the EU borders and LNG terminals with demand centres all over Europe (including natural, renewable, and decarbonised gas production). Gas infrastructure is currently used to transport and distribute 25% of EU’s primary energy consumption, or about 4,500 TWh (NCV) equalling about 425 bcm of natural gas.62 As the energy transition advances, gas infrastructure will provide transportation and storage capacity for renewable energy in the form of gaseous energy
carriers. The European gas infrastructure will make the overall European energy system more flexible and more resilient.
Gas transported through gas infrastructure provides a flexible, storable form of energy that is mainly used for building and industrial heating, gas-fired power plants, and chemical production. About 25% of current natural gas is from EU sources, the rest is imported through large gas import pipelines from Russia, Norway, and North Africa (including Algeria), and LNG imports from the rest of the world.63 The grids foster security of supply and diversification of sources.
Long-distance gas transport occurs through large diameter transmission lines operated at high pressure (usually from 40 up to 100 bar, depending on the country). This network is used to import gas from outside the EU and to interconnect EU member states’ national gas networks. Medium pressure pipelines (between 8 and 40 bar) are used to distribute gas to a dense network of low pressure distribution grids (up to 16 bar) delivering gas to end consumers.64 The transmission network consists of about 260,000 km of high pressure transmission pipelines and medium pressure pipelines operated by around 45 TSOs. Figure 20 displays this network.
Many transmission lines consist of multiple parallel pipelines to provide enough transmission capacity. The more refined network of mainly low pressure and some medium pressure networks consists of about 1.4 million km of pipelines operated mainly by distribution system operators (DSOs).
Gas storage is required to ensure the security of energy supply and to enable the system to deal with significant variations in gas demand between summer and winter. Storage provides flexibility to react on short-term variations in demand, including short-term power demand peaks where gas-fired power plants may be needed on short notice, e.g.
60 See e.g. Gasunie / TenneT, Phase II - Pathways to 2050, A joint follow-up study by Gasunie and TenneT of the Infrastructure Outlook 2050, https://www.gasunie.nl/nieuws/gasunie-en-ten-net-klimaatdoelstellingen-alleen-haalbaar-met-een-geintegreerd-europees-ener-giesysteem/$4382/$4383
61 Section largely taken from Navigant, Gas for Climate, 201962 Quantity reported in net calorific value, equalling about 5,000 TWh in gross calorific value.
Eurostat, Natural gas supply statistics, gross inland consumption of natural gas in 2018. Total EU energy consumption in 2017 was 1675 Mtoe or around 19,000 TWh.
63 Eurostat, Natural gas supply statistics, https://ec.europa.eu/eurostat/statistics-explained/index.php?title=Natural_gas_supply_statistics&oldid=447636#Supply_structure, 2020
64 What low, medium and high mean varies depending on the country
41 2. An Accelerated Decarbonisation Pathway to speed up the energy transition
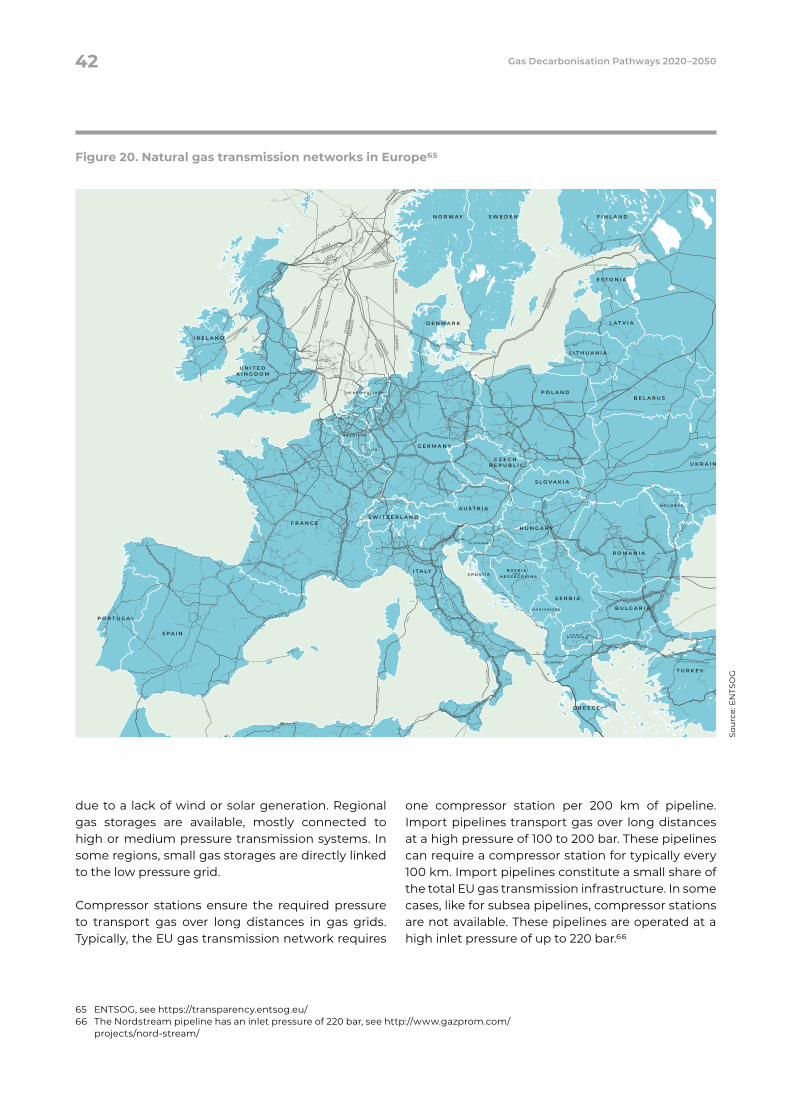
due to a lack of wind or solar generation. Regional gas storages are available, mostly connected to high or medium pressure transmission systems. In some regions, small gas storages are directly linked to the low pressure grid.
Compressor stations ensure the required pressure to transport gas over long distances in gas grids. Typically, the EU gas transmission network requires
one compressor station per 200 km of pipeline. Import pipelines transport gas over long distances at a high pressure of 100 to 200 bar. These pipelines can require a compressor station for typically every 100 km. Import pipelines constitute a small share of the total EU gas transmission infrastructure. In some cases, like for subsea pipelines, compressor stations are not available. These pipelines are operated at a high inlet pressure of up to 220 bar.66
65 ENTSOG, see https://transparency.entsog.eu/66 The Nordstream pipeline has an inlet pressure of 220 bar, see http://www.gazprom.com/
projects/nord-stream/
Sou
rce:
EN
TSO
G
Figure 20. Natural gas transmission networks in Europe65
BALTIC PIPE
LAP
OLA
GUE
EuRoPoL
EuRoPoL
GIP
L
GIP
L
EuRoPoL
KKP
Kyiv - Western Ukraine
NEL
AEU
GA
LO
PAL
LGU
EL
PO
II EP
IPOR
UE
NO
RPIPEEU
ROPIPE
DEU
DA
N
STEGAL
MID
AL
MID
AL
NEL
NELRHG
WED
AL
ZEELINK
TENP
TENPMEGAL MEGAL
LSF
MEGAL
GDLux
NORD
SCHWARZW
ALD
LEITUNG
JAGAL
NE
TRA
II EP
IPOR
UE
CATS
SEA
L
ZEEP
IPE
FRA
NP
IPE
LAN
GEL
ED S
OU
TH
INTER
CO
NN
ECTO
R
BBL
NO
GAT
STATPIPE
ZEEPIPE IIA
ZEEPIPE IIB
STATPIPE
FUKA
VESTERLED
SAGE
MILLER
OGT
FLAGS NLGP
UTSIRA
SLEIPNER CONDENSATE
LAN
GEL
ED N
ORT
H
SOUTH
LANGELE
D
FULMAR
BRITANNIA
LANGELED
TRAN
SPO
RT
ASGARD
NORTH
EPPNETLAHI
POLA
RLED
GRIS
MEOR
WOSPS
E
TROLLOL
NE
AVM
INTERCONNECTOR 2
INTE
RCONNECTOR 1
SNIP
STEP
MIDCAT
GASCOGNE MIDI
ER
IDA
N
AR
C L
YON
NA
IS
MIDCAT
ARTERE DE L’ADOUR
PEST
ENI
LEIP
AC
NP
GA
LSI
ADRIATICAPIPELINE
IER
RIT
)ISLAG( YT
- AINIDRAS - AIREGA
TRANSMED
GR
EEN
STR
EAM
LAI
GAZODUC ENRICO MATTEI
MEDGAZ
GZ0-G
Z5
MED
GAZ
GG
1-G
G2
GK1-GK4
MED
GAZ
MEG
MAGREB-EUROPE GAS (MEG)
EAST MED
Egypt Gas Pipeline (AGP)Trans-Sinai Gasline
Arab Gas Pipeline (AG
P)
AGP A
rab
Gas
Pip
elin
e (
AGP
)
AGP
PGA
AGP
AGP
A
EMG Pipeline
TURKSTREAM
WHITE STREAM(option 1)
AGRI
PG
Trans-Anatolian Pipeline (TANAP)
PIP
ELIN
E
TRA
NS-
BA
LKA
N
ATI, S
DKRI, A
I
IGB
Trans-Anatolian Pipeline (TANAP)
EASTRING
EASTRING
ITB
IBR
EASTRING
POSEID
ON
TAP
TAP
POSEIDON
IGI
IAP
EAST M
ED
PAI
TAP
POSEIDONTAP
EASTRING
TRG
AN
SE
I
MONACO
MEGAL
LFF
WAG
Penta
Wes
t
BALTIC PIPE
(Urengoy-Pomary-Uzhgorod)UPU
Progress
ATI
SDKRI
SDKRI
EKKR
Soyuz
Ananyiv
- Kre
men
chuk
UPUPro
gress
NO
RD S
TREA
M 2
NO
RD S
TREA
M
BALTIC CONNECTOR
YAMAL
A
N O R W A Y S W E D E N F I N L A N D
I R E L A N D
U N I T E DK I N G D O M
S W I T Z E R L A N D
S L O V A K I A
C Z E C HR E P U B L I C
G E R M A N Y
A U S T R I A
F R A N C E
B E L G I U M
T H E N E T H E R L A N D S
L U X .
D E N M A R K
B E L A R U S
U K R A I N E
L A T V I A
E S T O N I A
P O L A N D
L I T H U A N I A
H U N G A R Y
R O M A N I A
B O S N I A A N D
H E R Z E G O V I N AI T A L Y
M O L D O V A
C R O A T I A
A L B A N I A
S E R B I A
M O N T E N E G R O B U L G A R I A
C Y P R U S
M A L T A
T U R K E Y
G R E E C E
E G Y P T
J O R D A N
I S R A E L
L E B A N O N
S Y R I A
S P A I N
P O R T U G A L
M O R O C C O
A L G E R I A
T U N I S I A
L I B Y A
S L O V E N I A
N O R T H M A C E D O N I A
42 Gas Decarbonisation Pathways 2020–2050
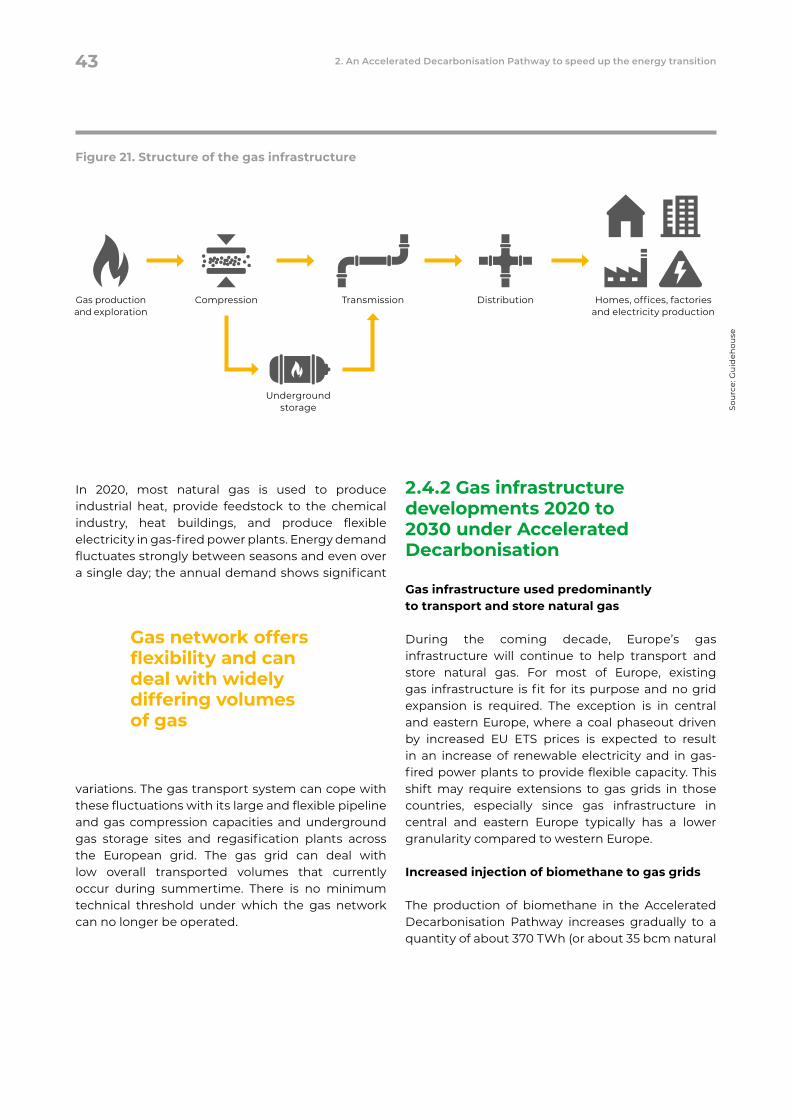
Figure 21. Structure of the gas infrastructure
Sou
rce:
Gu
ideh
ouse
Gas production and exploration
Compression Transmission Distribution Homes, offices, factories and electricity production
Underground storage
In 2020, most natural gas is used to produce industrial heat, provide feedstock to the chemical industry, heat buildings, and produce flexible electricity in gas-fired power plants. Energy demand fluctuates strongly between seasons and even over a single day; the annual demand shows significant
variations. The gas transport system can cope with these fluctuations with its large and flexible pipeline and gas compression capacities and underground gas storage sites and regasification plants across the European grid. The gas grid can deal with low overall transported volumes that currently occur during summertime. There is no minimum technical threshold under which the gas network can no longer be operated.
2.4.2 Gas infrastructure developments 2020 to 2030 under Accelerated Decarbonisation
Gas infrastructure used predominantly to transport and store natural gas
During the coming decade, Europe’s gas infrastructure will continue to help transport and store natural gas. For most of Europe, existing gas infrastructure is fit for its purpose and no grid expansion is required. The exception is in central and eastern Europe, where a coal phaseout driven by increased EU ETS prices is expected to result in an increase of renewable electricity and in gas-fired power plants to provide flexible capacity. This shift may require extensions to gas grids in those countries, especially since gas infrastructure in central and eastern Europe typically has a lower granularity compared to western Europe.
Increased injection of biomethane to gas grids
The production of biomethane in the Accelerated Decarbonisation Pathway increases gradually to a quantity of about 370 TWh (or about 35 bcm natural
Gas network offers flexibility and can deal with widely differing volumes of gas
43 2. An Accelerated Decarbonisation Pathway to speed up the energy transition
gas equivalent) by 2030. Most of this by far will be produced via anaerobic digestion, which takes place in relatively small installations often dispersed throughout rural locations. Biomethane can be blended with natural gas without requiring any gas grid modifications. In many cases, grid injection will take place in low or medium pressure distribution grids, simply because biomethane plants will want to inject into the nearest possible gas pipeline, which will often be distribution grids. If relatively large biomethane plants feed into small gas distribution pipes in areas with little local gas demand, there will be a need to ensure that biomethane can flow upwards towards medium or even high pressure grids using reverse flow technology. This is a marked change compared to current flows, which are always from high to medium to low pressure grids. Reverse flow is in the process of being implemented today67 and requires limited investments. Biomethane grid connection costs can be significant when small biomethane plants are connected to grids. It would be cost-optimal to build larger biomethane plants as close as possible to gas grids.
As described in the text box in Appendix 1, most biomethane production (this study estimates two-thirds of biomethane produced through anaerobic digestion) can be expected to be injected into gas grids. The larger the size of biomethane plants, the greater the share of the total biomethane potential that could be injected to gas grids. However, a share of remote biogas digesters located far from gas grids is unlikely to produce biomethane that can be injected into gas grids. Alternative solutions need to be developed, such as biomethane transport as bio-CNG or bio-LNG via truck to local fuel stations.
In addition to digestion-based biomethane, several large 200 MW biomass-to-biomethane gasification plants can be expected to be built at port locations with a direct connection to existing gas grids. These plants deliver biomethane at a pressure of 40 bar, meaning it can easily be injected in medium or high pressure gas grids.
Existing gas distribution networks used to supply biomethane to older buildings.
Gas infrastructure will continue to be used to distribute gas to heat buildings. Gradually, due to increased building insulation, gas demand for buildings will decrease. In parallel, natural gas will be gradually replaced by biomethane. Also, gas boilers could be gradually replaced by hybrid heat pumps, as described in section 2.2.1. Navigant expects that each EU member state can produce sufficient biomethane to meet demand in existing buildings with existing gas grid connections by 2050. This means that distribution grids in 2050 will be used for biomethane, and regional transport pipes will still be required to transport biomethane supply from the agricultural regions to the cities.
Blue hydrogen in industrial clusters use existing H2 networks and new CO2 pipelines.
In the coming decade, the existing production of grey hydrogen will turn blue by adding carbon capture to existing hydrogen production assets, transporting captured CO2 to storage locations.
Existing grey hydrogen is produced and consumed mostly in large industrial clusters in north western Europe where the majority of hydrogen is consumed today. These clusters are well-connected to existing gas grids. Hydrogen production either takes place onsite (e.g. at refineries) or production and industrial consumption is connected through dedicated, privately operated hydrogen networks.
67 For example, the ONTRAS gas network in Germany already has six reverse-flow facilities installed. See: https://www.ontras.com/en/company/ontras-going-green/our-projects/. Also, GRTgaz operates several reverse-flow facilities such as Pouzauges and Noyal-Pontivy
Blue hydrogen in industrial clusters uses existing H2 networks and new CO2 pipelines
44 Gas Decarbonisation Pathways 2020–2050
These pipelines have a limited capacity yet can be used to transport blue hydrogen within industrial clusters up to 2030, with natural gas being delivered via the existing gas grids like today. It would be optimal if there is third-party access to these privately operated hydrogen networks. Large industrial hydrogen projects will require a solution to transport CO2 to storage locations. In cases where industrial clusters are located close to depleted gas fields below seabeds, e.g. below the North Sea, it makes sense to construct new, dedicated CO2 pipes. A possibly more costly alternative could be to transport CO2 per ship to storage locations.
Industrial clusters close to below seabed CO2 storage locations are favourable options for future additional blue hydrogen capacity. This could result in hydrogen hubs that could feed a future hydrogen backbone infrastructure to supply hydrogen to other clusters, power plants, and truck transport.
Green hydrogen supplied to local customers could require regional hydrogen pipelines
Green hydrogen developments will initially be clustered to specific regions because of low cost production (mainly solar power in south of EU and offshore wind at the North Sea).
Up to 2030, the initial large-scale green hydrogen projects are likely to produce quantities that can be absorbed as feedstock and as sources of heat in local industries and as a road fuel in transport. In cases where quantities of green hydrogen are small, it may make sense to blend hydrogen with natural gas (see below for a more detailed description of blending). Where larger quantities of green hydrogen would already be produced in 2030, local or regional dedicated hydrogen pipelines may be needed. Around 2030, it is expected that a larger scale-up of green hydrogen will require the gradual construction of regional and national hydrogen backbone infrastructures which
during the 2030s would be connected into a European Hydrogen Backbone infrastructure, primarily based on existing gas infrastructure.
Hydrogen blending in gas grids mainly a solution for initial green hydrogen production
Blending hydrogen in the existing gas grid is often considered as a way to quickly scale-up hydrogen supply, while limiting the need for hydrogen pipeline and end-user investments. Studies report blending percentages of between 5% and 20% to be technically feasible in current grids with minimal investments.68 Blending-ready networks can also connect production sites where biomethane is produced with a small percentage of hydrogen, e.g. pyro gasification units. However, the actual feasibility of blending depends on the hydrogen tolerance at end uses, including the ability to deal with varying blends. Moving to higher blending percentages, changes need to be made to the infrastructure and typically also to the end-user equipment (e.g. different burners). Furthermore, a downstream separation of the hydrogen from the blended gas stream through separation membranes for instance could in the future become a possible option to adapt to purity demands of sensitive customers.
The expected scale-up of blue hydrogen production at industrial clusters to replace existing grey hydrogen does not involve blending but does dedicated point-to-point hydrogen transport and dedicated CO2-transport. Blending part of the blue hydrogen produced at industrial clusters could be considered when supply is greater than demand. Green hydrogen would mainly be used locally and regionally up to 2030. Blending hydrogen in gas grids may be an effective temporary solution during the 2020s. The creation of a hydrogen Guarantee of Origin system would ensure that the value of blended green hydrogen could be marketed.69
68 GRTgaz et al. Technical and economic conditions for injecting hydrogen into natural gas networks, http://www.grtgaz.com/fileadmin/plaquettes/en/2019/Technical-economic-condi-tions-for-injecting-hydrogen-into-natural-gas-networks-report2019.pdf, 2019 & Melaina, Antonio and Penev, Blending Hydrogen into Natural Gas Pipeline Networks: A Review of Key Issues, https://www.nrel.gov/docs/fy13osti/51995.pdf, 2013
69 For further details on the impact of biomethane and hydrogen in the European gas infrastructure, see European Commission (DG ENER) Study Impact of the use of the biomethane and hydrogen potential on trans-European infrastructure, Trinomics B.V (2019)
45 2. An Accelerated Decarbonisation Pathway to speed up the energy transition
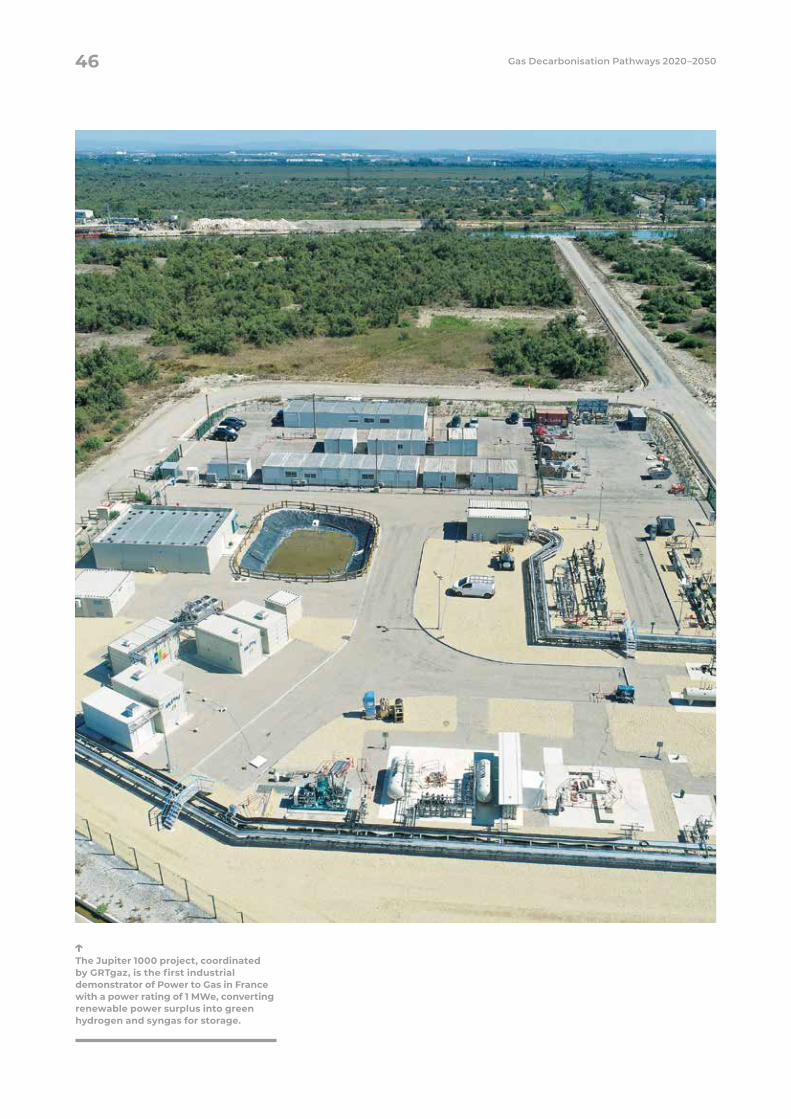
The Jupiter 1000 project, coordinated by GRTgaz, is the first industrial demonstrator of Power to Gas in France with a power rating of 1 MWe, converting renewable power surplus into green hydrogen and syngas for storage.
46 Gas Decarbonisation Pathways 2020–2050
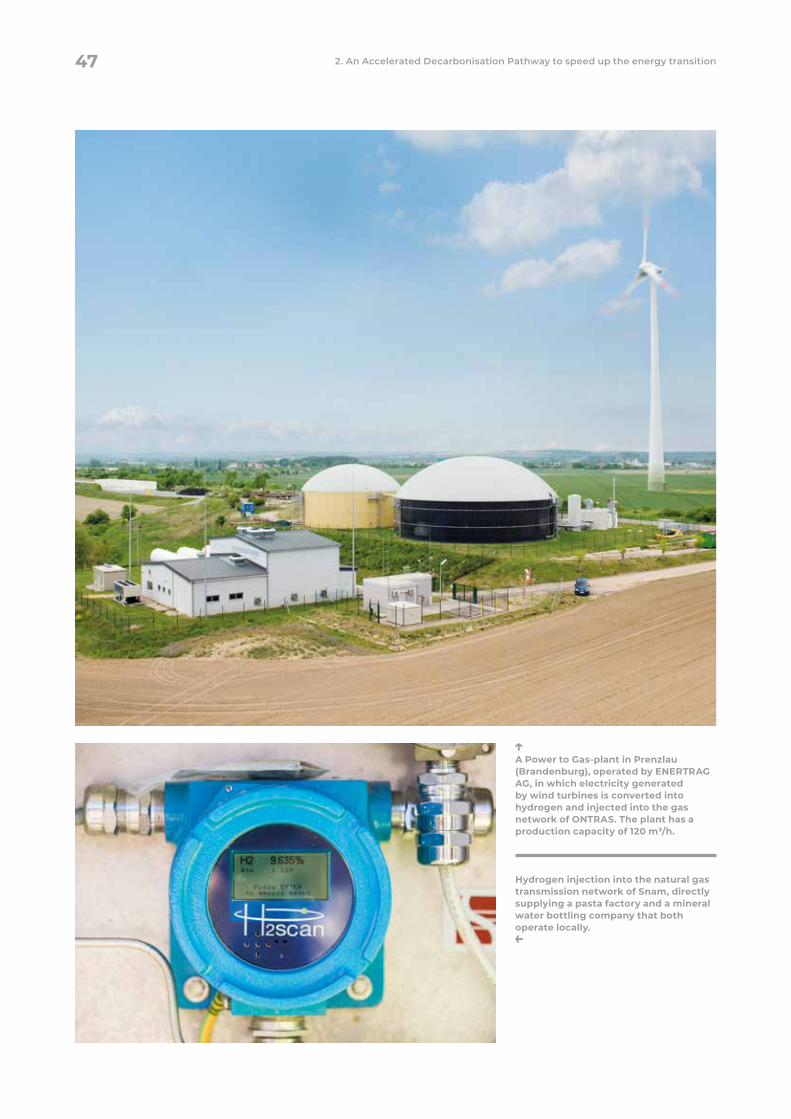
Hydrogen injection into the natural gas transmission network of Snam, directly supplying a pasta factory and a mineral water bottling company that both operate locally.
A Power to Gas-plant in Prenzlau (Brandenburg), operated by ENERTRAG AG, in which electricity generated by wind turbines is converted into hydrogen and injected into the gas network of ONTRAS. The plant has a production capacity of 120 m³/h.
47 2. An Accelerated Decarbonisation Pathway to speed up the energy transition
Storing hydrogen
Due to the relatively low energy density of hydrogen when compared to natural gas, more storage space is needed to store the same amount of energy. Storing hydrogen in large quantities will be a large challenge up to 2050, when as much as 2,270 TWh of hydrogen could be in our energy system in the Accelerated Decarbonisation Pathway. To achieve the same level of energy security as we have currently with natural gas, roughly 1.5 times the amount of storage would be needed compared to today, only considering hydrogen storage needs.70 Adding storage needs for biomethane this figure would be larger.
Currently, salt caverns are an accepted method to balance the gas demand in our energy system and are filled and emptied in cycles of weeks to months. These salt caverns would also be well suited to store hydrogen.71 The level of storage that would be needed is further influenced by the differences in production across the years, and whether this coincides with demand. When most of the hydrogen production in Europe is solar PV-based, more storage will be needed compared to balance the supply side with the demand pattern over the year. Depleted gas fields and aquifers could also play a role as large scale storage options for hydrogen but are significantly more costly than salt caverns.72 Liquid storage options like ammonia or liquid organic hydrogen carriers can also be considered, but these storage costs are estimated to be higher than the production cost of hydrogen itself and may only be sensible in combination with large-distance transport.
2.4.3 Gas infrastructure developments 2030 to 2050
National hydrogen infrastructures emerge, joined into a European Hydrogen Backbone
Around 2030, hydrogen demand will have accelerated, and an increasing number of industrial clusters will use more and more quantities of hydrogen. This will initially occur in clusters in north western Europe, and then will move to other parts of the continent as well. Green hydrogen supply will start to ramp up fast. This leads to a need to connect industrial clusters with large new green hydrogen production locations close to large offshore wind power production and at large solar PV production locations. Also, gradually more standalone industrial sites will move to hydrogen in line with their natural investment cycle. Around 2030 regional or national hydrogen backbone infrastructures start to emerge, possibly somewhat earlier in north western Europe and somewhat later in other parts of Europe. The planning of these infrastructures should start in the early 2020s. Around 2035 these national backbones will increasingly be connected into a European Hydrogen Backbone, which would be completed by around 2040. Also, larger dedicated hydrogen storage facilities in salt caverns will start to be created around 2030, partly through repurposing from methane to hydrogen.
By 2050, just over 1,700 TWh would flow through the hydrogen grid. The transport of this quantity of hydrogen requires more pipeline capacity per unit of energy compared to natural gas because an
70 Currently, there is about 5,000 TWh of natural gas in the EU’s energy system. Due to the energy density of hydrogen being about three times lower, three times more space is needed to store the same amount of energy as natural gas. Because there is already enough storage space in the EU to balance the 5,000 TWh of demand for natural gas (roughly twice the amount of H2 in 2050 in our AD Pathway), the amount of storage needed will be about 1.5 times higher. Bloomberg NEF (2020). Hydrogen Economy Outlook: Key Messages. https://data.bloomberglp.com/professional/sites/24/BNEF-Hydrogen-Economy-Outlook-Key-Messages-30-Mar-2020.pdf
71 Bloomberg NEF (2020). Hydrogen Economy Outlook: Key Messages. https://data.bloomberglp.com/professional/sites/24/BNEF-Hydrogen-Economy-Outlook-Key-Messages-30-Mar-2020.pdf
72 Gas fields are more expensive compared to storage in salt caverns because not all infrastructure is in place yet to facilitate the storage operations; gas platforms will first need to be redeveloped to make it suitable for large scale hydrogen storage. Garcia et al. (2016). Expert Opinion Analysis on Renewable Hydrogen Storage Systems Potential in Europe, Energies 2016, 9, 963; doi:10.3390/en9110963.
48 Gas Decarbonisation Pathways 2020–2050
energy unit of hydrogen has about 3 times more volume than methane. However, hydrogen flows much faster through gas grids. The net effect of both elements is that transport of hydrogen requires at least 20% more pipeline capacity per unit of energy compared to natural gas.
To repurpose part of the EU gas grid towards hydrogen, regulatory frameworks should be adjusted to consider hydrogen-ready components when TSOs extend the existing grid or apply for reinvestment projects. A general political recognition of the existing gas infrastructure to efficiently decarbonise a part of the European economy is advisable.
Most biomethane is transported and distributed through existing gas infrastructure
All new biomethane gasification plants are connected to gas grids. All new digestion-based biomethane plants will initially be connected to gas grids as well. Once most of the locations close to gas grids are occupied, locations further away will need to have a much larger size to still be able to be connected. It may still be possible to cost-effectively connect large digesters and biomethane plants that produce up to 3,000 m3/hr to gas grids even if they are located more than 10 km away from gas grids. This means that the extent to which the full EU biomethane potential can be produced and injected into gas grids can depend on whether the biomethane sector manages to increase the overall size of biomethane plants, especially in countries where the gas grid is less dense, such as Denmark. It is also worthwhile to explore whether biomethane pipeline costs could be decreased. The text box as included in Appendix 1 that follows explores the quantity of EU-produced biomethane that could be transported through gas grids. Determining this precisely would require a detailed analysis of how the dispersed EU biomethane (feedstock) potential compares to the topology of gas grids in most relevant EU member states. In our Accelerated Decarbonisation Pathway we assume that 75 bcm biomethane plus an additional 14 bcm of power to methane could be injected into gas grids by 2050.
Gradual phaseout of natural gas means the gas grid is split between hydrogen and methane.
Substantial quantities of natural gas will remain to be transported through Europe’s gas grids, but after 2030 the role for natural gas dwindles rapidly. Industrial consumers and the buildings sector will significantly reduce their natural gas consumption. This means that gas transmission capacity will become increasingly available for hydrogen transport while gas distribution grids will largely continue to carry gas to existing buildings, initially natural gas but increasingly biomethane to hybrid heating systems. The increase in biomethane and hydrogen does not make up for the reduced natural gas consumption, even though the transport of an energy unit of hydrogen requires more pipeline capacity compared to natural gas. Beyond 2030, a substantial capacity of gas is required to provide dispatchable power. With coal being phased out and the share of wind power and solar PV increasing, gas-fired power plants will run relatively limited hours, yet their peak gas demand is significant.
The figure below illustrates the main gas grid developments during 2020 and 2050.
49 2. An Accelerated Decarbonisation Pathway to speed up the energy transition
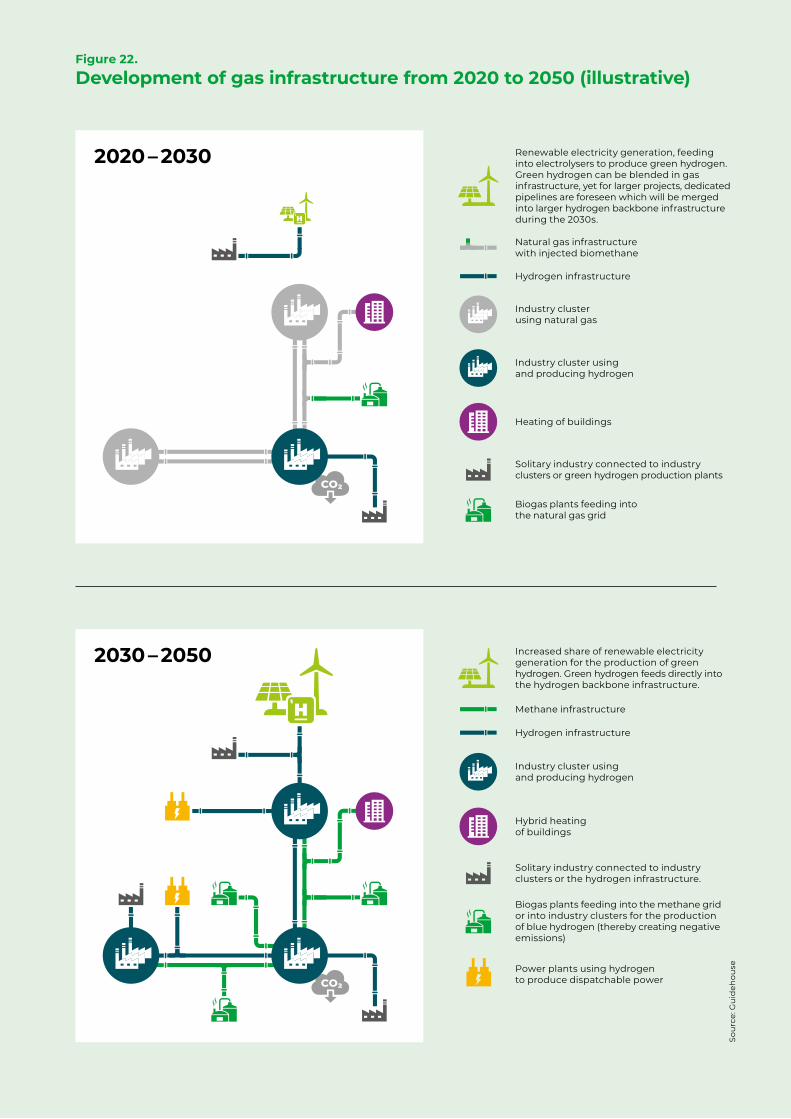
Sou
rce:
Gu
ideh
ouse
2020 – 2030 Renewable electricity generation, feeding into electrolysers to produce green hydrogen. Green hydrogen can be blended in gas infrastructure, yet for larger projects, dedicated pipelines are foreseen which will be merged into larger hydrogen backbone infrastructure during the 2030s.
Hydrogen infrastructure
Biogas plants feeding into the natural gas grid
Heating of buildings
Solitary industry connected to industry clusters or green hydrogen production plants
Natural gas infrastructure with injected biomethane
Industry cluster using and producing hydrogen
Industry cluster using natural gas
2030 – 2050 Increased share of renewable electricity generation for the production of green hydrogen. Green hydrogen feeds directly into the hydrogen backbone infrastructure.
Methane infrastructure
Hydrogen infrastructure
Power plants using hydrogen to produce dispatchable power
Biogas plants feeding into the methane grid or into industry clusters for the production of blue hydrogen (thereby creating negative emissions)
Hybrid heating of buildings
Solitary industry connected to industry clusters or the hydrogen infrastructure.
Industry cluster using and producing hydrogen
Figure 22.
Development of gas infrastructure from 2020 to 2050 (illustrative)
3. How do current EU policies help to decarbonise EU gas supply?
Key takeaways → Current EU climate and energy policies and NECPs do not provide structural drivers at the EU level for a fully integrated energy system, the increase of biomethane and green hydrogen supply to gas grids or their subsequent use in the relevant sectors.
→ Private investments in renewable and low carbon gases and gas infrastructure require long-term certainty and sufficient incentives to energy using sectors, investors, and project developers. Current EU policies fall short in providing such a framework, even though the Innovation Fund and the increasing EU ETS price can make a difference.
Chapter 2 mapped out the potential and the value of renewable gas and gas infrastructure for a fully integrated energy system in Europe. The next step is to scale-up renewable and low carbon gas. In the European Union, biomethane as well as green and blue hydrogen production needs to scale-up rapidly and massively to minimise cumulative CO2 emissions and to cost-effectively achieve a net-zero carbon energy system by 2050. This requires many different stakeholders to act. The Gas for Climate consortium is committed to supporting decarbonisation by facilitating an effective sector coupling that integrates the electricity and gas markets and their relevant infrastructures in the best possible way. Furthermore, Gas for Climate is committed to the scale-up of production of renewable and low carbon gases and ensuring that the infrastructure is ready to store and transport these in a cost-efficient manner. It also sees a need for improved renewable methane and hydrogen business cases with lower production costs. Consortium members are already acting on this in demonstration projects on green and blue hydrogen, by scaling up biomethane production across Europe and by being active in national stakeholder dialogues (see examples in the Gas for Climate Action Plan73).
This chapter analyses how current EU climate and energy policies facilitate the decarbonisation of the EU economy. These policies are largely in place until 2030 and are currently being transposed into national legislation. Member states also NECPs that outlines how member states intend to address energy efficiency, renewables, greenhouse gas emissions reductions, interconnections, and research and innovation.74 Our Current EU Trends Pathway analyses the expected impact of current 2030 climate and energy policies on the deployment of renewable and low carbon gases and considers the major policies impacting this analysis, which are included below.
→ EU Clean Energy package (launched in November 2016) was meant to drive development towards an emission reduction of 40%, compared to 1990 levels, by 2030. The targets for energy efficiency and renewable energy were revised upwards in 2018, effectively raising the resulting 2030 greenhouse gas reduction to 45.6% compared to 1990 levels.
→ The new Renewable Energy Directive (RED II) introduced a legally binding, EU-wide target of 32% renewable energy consumption by 2030. It also includes a 14% sub-target for renewable energy in road transport. The RED II stimulates that member states extend existing Guarantees of Origin schemes to include renewable gases.
→ The EU ETS is a cornerstone of the EU’s policy to combat climate change and is the key tool for reducing greenhouse gases in the industry and power sector. It is the world’s first major carbon market and remains the biggest. The system operates in all EU member states plus Iceland, Liechtenstein, and Norway. It limits emissions from more than 11,000 heavy energy -using installations (power stations and industrial plants) and airlines operating between these countries. The system covers around 45% of the EU’s greenhouse gas emissions, and the EU ETS sectors will have to cut emissions by 43% in 2030 (compared to 2005). Under the EU ETS, the price of CO2 has quadrupled in the past two years from around €5/tonne of CO2 to about €25/tonne of CO2 on average in 2019.75 This increase is mainly caused by postponing the auctioning of allowances (back-loading), the introduction of a market stability reserve, and the overhaul of the EU ETS directive for 2021–2030, which is already resulting in a reduction in the number of CO2 certificates on the market. Higher CO2 prices increase the production costs for the energy-intensive industry and consequently the investment decision in breakthrough technologies.
73 Gas for Climate, 2019. Action Plan 2030 (Update 2019): How can gas help to achieve the Paris Agreement target in an affordable way. Available at: https://gasforclimate2050.eu/files/files/Gas_for_Climate_Action_Plan_Update_2019.pdf.
74 European Commission, National energy and climate plans (NECPs), https://ec.europa.eu/energy/topics/energy-strategy/national-energy-climate-plans_en
75 SENDECO2, Precios CO2, https://www.sendeco2.com/es/precios-co2; Sandbag, Carbon Price Viewer, https://sandbag.org.uk/carbon-price-viewer/.
52 Gas Decarbonisation Pathways 2020–2050
→ The EU ETS also provides revenue to the world’s largest funding programmes for demonstration of innovative low carbon technologies—the EU Innovation Fund. The Fund may amount to about €10 billion until 2030, depending on the carbon price, to support innovation for energy-intensive industry, renewables, energy storage, and CCS/CCU. The Innovation Fund focusses on the demonstration of the next generation of low carbon technologies and processes needed for the EU low carbon transition.
This study concludes that existing EU climate and energy policies, even when fully implemented by member states, and NECPs are insufficient to achieve a meaningful deployment of renewable and low carbon gas by 2030 and 2050. This scenario is not business as usual since not all EU policies and targets have been transposed into national policies; with current developments, the EU 2030 targets will probably not be reached, and reaching the 2050 target will become highly unrealistic.
The sections that follow describe the extent to which current EU climate and energy policies can expect to foster the deployment of renewable and low carbon gases including their uses in key parts of the energy system.
Biomethane scale-up under current EU policies
The EU policies that affect the uptake of biomethane are the RED, the Gas Directive, the Innovation Fund, and CEN standards. The RED specifies the
way in which biomethane can be counted against the 14% target for renewables in road transport and specifies that biomethane used to produce power and heat can count towards the overall 32% renewables target. The Gas Directive specifies that biomethane is treated in the same way as natural gas when it comes to the EU market regulation. The Innovation Fund could provide funding for innovative, industrial scale biomass-to-biomethane gasification plants. In 2016, the European Standard setting body CEN published two standards, one on natural gas and biomethane for use in transport and another on biomethane for injection in the natural gas network. CEN is currently working to improve parts of these standards.
France uses the transposition of the RED to introduce a binding mandate for 10% biomethane in the French gas grid by 2030. Italy introduced a biomethane subsidy scheme that supports the production of 1 bcm of biomethane destined to the transport sector by 2022.
These existing policies lead to a visible increase in EU biomethane production. In France, a new biomethane facility was opened every week during 2019. Italy will see a large increase in coming years as well. Denmark has financed the building of several dozens of large biomethane plants with a production of well over 1,000 m3/hr each, going up to 2,000 m3/hr. Such installations are about seven times larger than the current EU average and they source their biomass and distribute digestate back to the fields within a range of 25 km. In addition to such newly installed installations, expanding biomethane by adding methanation units to already existing biogas plants represents an easy opportunity through 2030. Today, about 16 bcm of biogas is produced in Europe that does not make it to gas grids and is mainly used to produce baseload electricity, which is nonflexible and expensive to store electricity. For example, a project is in development in Bitburg to upgrade existing biogas production to biomethane. For this project, seven existing biogas plants, both small and big, are connected with a biogas pipeline that transports biogas to a centralised biomethane plant close to the gas grid.76
76 See: https://www.kne-web.de/verbundsystem/zukuenftige_produkte/
Existing EU climate and energy policies are insufficient to achieve a meaningful deployment of renewable and low carbon gas
53 3. How do current EU policies help to decarbonise EU gas supply?
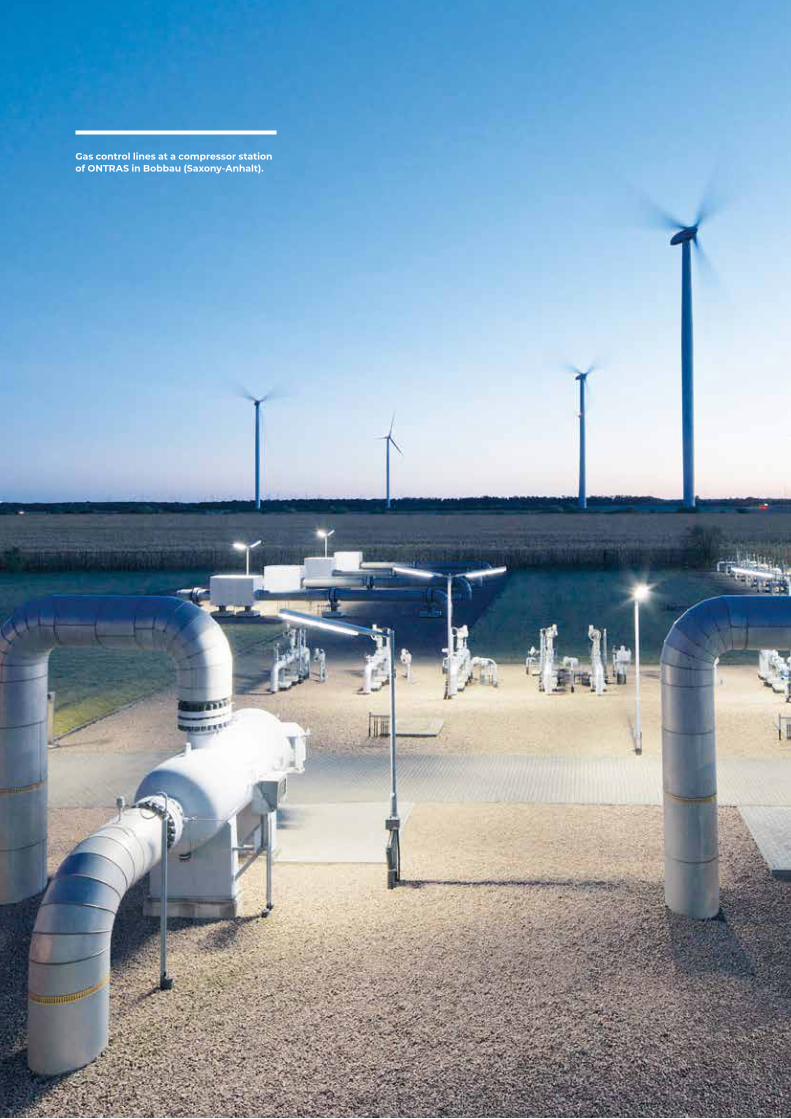
Gas control lines at a compressor station of ONTRAS in Bobbau (Saxony-Anhalt).
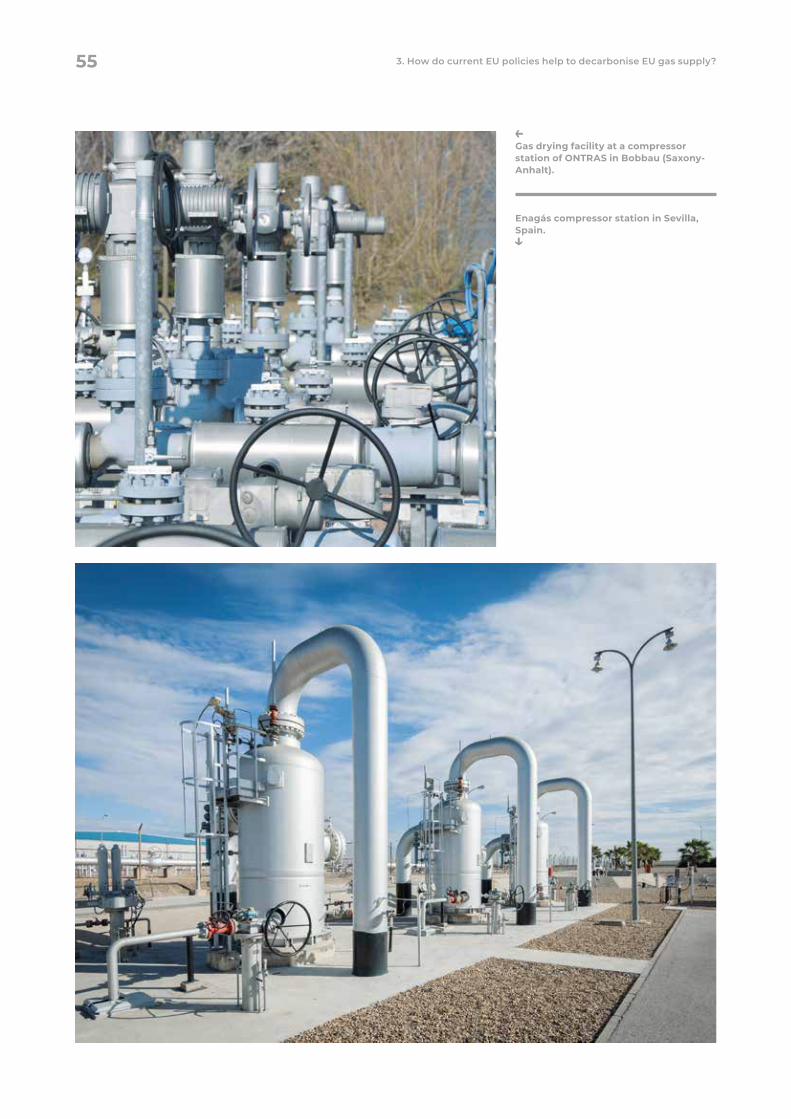
Gas drying facility at a compressor station of ONTRAS in Bobbau (Saxony-Anhalt).
Enagás compressor station in Sevilla, Spain.
55 3. How do current EU policies help to decarbonise EU gas supply?
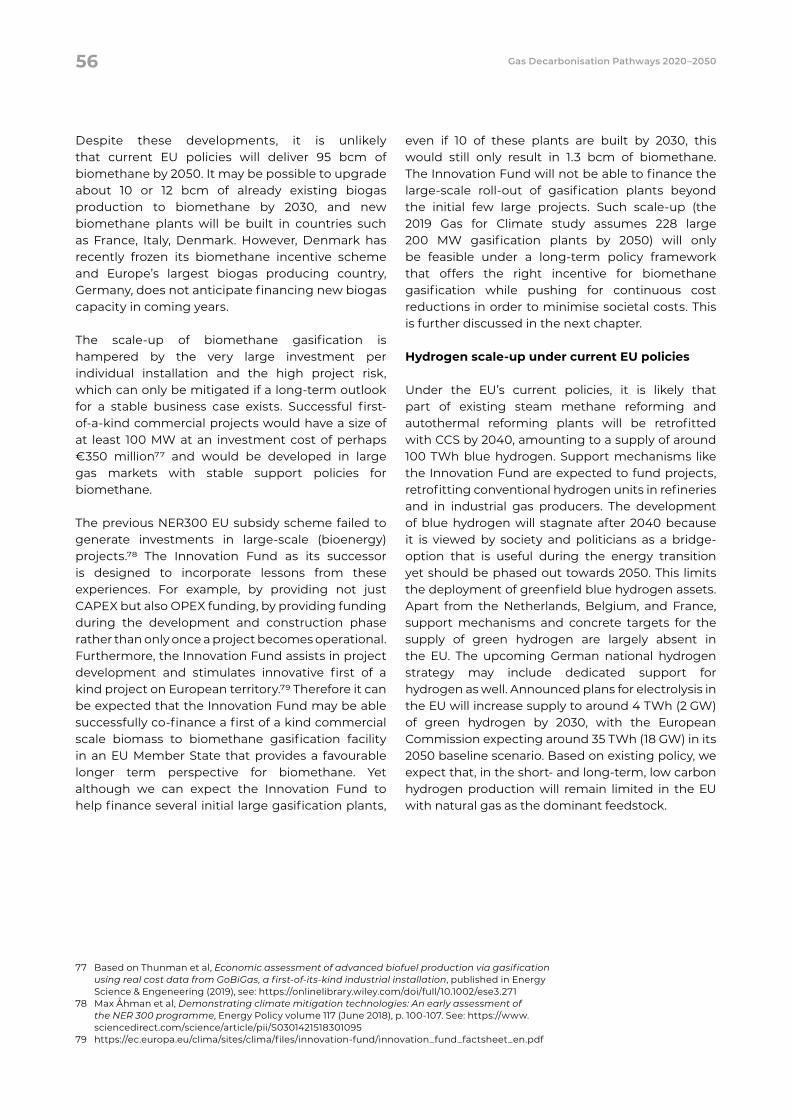
Despite these developments, it is unlikely that current EU policies will deliver 95 bcm of biomethane by 2050. It may be possible to upgrade about 10 or 12 bcm of already existing biogas production to biomethane by 2030, and new biomethane plants will be built in countries such as France, Italy, Denmark. However, Denmark has recently frozen its biomethane incentive scheme and Europe’s largest biogas producing country, Germany, does not anticipate financing new biogas capacity in coming years.
The scale-up of biomethane gasification is hampered by the very large investment per individual installation and the high project risk, which can only be mitigated if a long-term outlook for a stable business case exists. Successful first-of-a-kind commercial projects would have a size of at least 100 MW at an investment cost of perhaps €350 million77 and would be developed in large gas markets with stable support policies for biomethane.
The previous NER300 EU subsidy scheme failed to generate investments in large-scale (bioenergy) projects.78 The Innovation Fund as its successor is designed to incorporate lessons from these experiences. For example, by providing not just CAPEX but also OPEX funding, by providing funding during the development and construction phase rather than only once a project becomes operational. Furthermore, the Innovation Fund assists in project development and stimulates innovative first of a kind project on European territory.79 Therefore it can be expected that the Innovation Fund may be able successfully co-finance a first of a kind commercial scale biomass to biomethane gasification facility in an EU Member State that provides a favourable longer term perspective for biomethane. Yet although we can expect the Innovation Fund to help finance several initial large gasification plants,
even if 10 of these plants are built by 2030, this would still only result in 1.3 bcm of biomethane. The Innovation Fund will not be able to finance the large-scale roll-out of gasification plants beyond the initial few large projects. Such scale-up (the 2019 Gas for Climate study assumes 228 large 200 MW gasification plants by 2050) will only be feasible under a long-term policy framework that offers the right incentive for biomethane gasification while pushing for continuous cost reductions in order to minimise societal costs. This is further discussed in the next chapter.
Hydrogen scale-up under current EU policies
Under the EU’s current policies, it is likely that part of existing steam methane reforming and autothermal reforming plants will be retrofitted with CCS by 2040, amounting to a supply of around 100 TWh blue hydrogen. Support mechanisms like the Innovation Fund are expected to fund projects, retrofitting conventional hydrogen units in refineries and in industrial gas producers. The development of blue hydrogen will stagnate after 2040 because it is viewed by society and politicians as a bridge-option that is useful during the energy transition yet should be phased out towards 2050. This limits the deployment of greenfield blue hydrogen assets. Apart from the Netherlands, Belgium, and France, support mechanisms and concrete targets for the supply of green hydrogen are largely absent in the EU. The upcoming German national hydrogen strategy may include dedicated support for hydrogen as well. Announced plans for electrolysis in the EU will increase supply to around 4 TWh (2 GW) of green hydrogen by 2030, with the European Commission expecting around 35 TWh (18 GW) in its 2050 baseline scenario. Based on existing policy, we expect that, in the short- and long-term, low carbon hydrogen production will remain limited in the EU with natural gas as the dominant feedstock.
77 Based on Thunman et al, Economic assessment of advanced biofuel production via gasification using real cost data from GoBiGas, a first-of-its-kind industrial installation, published in Energy Science & Engeneering (2019), see: https://onlinelibrary.wiley.com/doi/full/10.1002/ese3.271
78 Max Åhman et al, Demonstrating climate mitigation technologies: An early assessment of the NER 300 programme, Energy Policy volume 117 (June 2018), p. 100-107. See: https://www.sciencedirect.com/science/article/pii/S0301421518301095
79 https://ec.europa.eu/clima/sites/clima/files/innovation-fund/innovation_fund_factsheet_en.pdf
56 Gas Decarbonisation Pathways 2020–2050
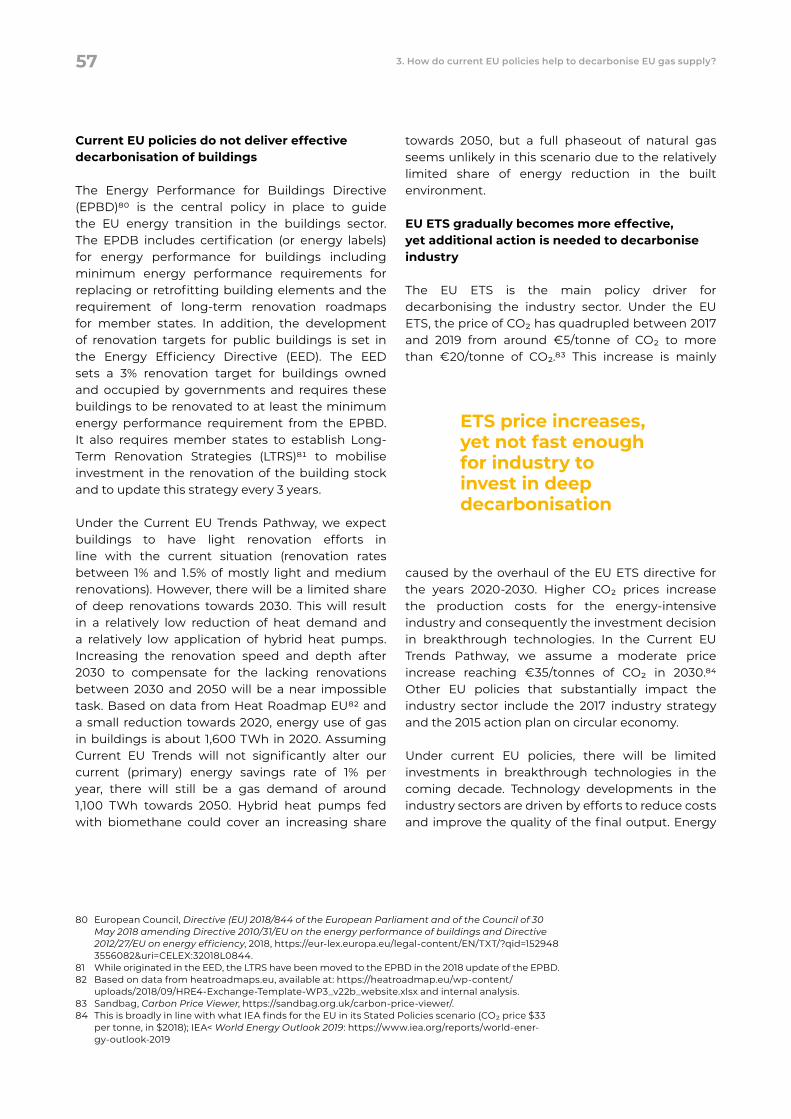
Current EU policies do not deliver effective decarbonisation of buildings
The Energy Performance for Buildings Directive (EPBD)80 is the central policy in place to guide the EU energy transition in the buildings sector. The EPDB includes certification (or energy labels) for energy performance for buildings including minimum energy performance requirements for replacing or retrofitting building elements and the requirement of long-term renovation roadmaps for member states. In addition, the development of renovation targets for public buildings is set in the Energy Efficiency Directive (EED). The EED sets a 3% renovation target for buildings owned and occupied by governments and requires these buildings to be renovated to at least the minimum energy performance requirement from the EPBD. It also requires member states to establish Long-Term Renovation Strategies (LTRS)81 to mobilise investment in the renovation of the building stock and to update this strategy every 3 years.
Under the Current EU Trends Pathway, we expect buildings to have light renovation efforts in line with the current situation (renovation rates between 1% and 1.5% of mostly light and medium renovations). However, there will be a limited share of deep renovations towards 2030. This will result in a relatively low reduction of heat demand and a relatively low application of hybrid heat pumps. Increasing the renovation speed and depth after 2030 to compensate for the lacking renovations between 2030 and 2050 will be a near impossible task. Based on data from Heat Roadmap EU82 and a small reduction towards 2020, energy use of gas in buildings is about 1,600 TWh in 2020. Assuming Current EU Trends will not significantly alter our current (primary) energy savings rate of 1% per year, there will still be a gas demand of around 1,100 TWh towards 2050. Hybrid heat pumps fed with biomethane could cover an increasing share
towards 2050, but a full phaseout of natural gas seems unlikely in this scenario due to the relatively limited share of energy reduction in the built environment.
EU ETS gradually becomes more effective, yet additional action is needed to decarbonise industry
The EU ETS is the main policy driver for decarbonising the industry sector. Under the EU ETS, the price of CO2 has quadrupled between 2017 and 2019 from around €5/tonne of CO2 to more than €20/tonne of CO2.83 This increase is mainly
caused by the overhaul of the EU ETS directive for the years 2020-2030. Higher CO2 prices increase the production costs for the energy-intensive industry and consequently the investment decision in breakthrough technologies. In the Current EU Trends Pathway, we assume a moderate price increase reaching €35/tonnes of CO2 in 2030.84 Other EU policies that substantially impact the industry sector include the 2017 industry strategy and the 2015 action plan on circular economy.
Under current EU policies, there will be limited investments in breakthrough technologies in the coming decade. Technology developments in the industry sectors are driven by efforts to reduce costs and improve the quality of the final output. Energy
80 European Council, Directive (EU) 2018/844 of the European Parliament and of the Council of 30 May 2018 amending Directive 2010/31/EU on the energy performance of buildings and Directive 2012/27/EU on energy efficiency, 2018, https://eur-lex.europa.eu/legal-content/EN/TXT/?qid=1529483556082&uri=CELEX:32018L0844.
81 While originated in the EED, the LTRS have been moved to the EPBD in the 2018 update of the EPBD.82 Based on data from heatroadmaps.eu, available at: https://heatroadmap.eu/wp-content/
uploads/2018/09/HRE4-Exchange-Template-WP3_v22b_website.xlsx and internal analysis.83 Sandbag, Carbon Price Viewer, https://sandbag.org.uk/carbon-price-viewer/.84 This is broadly in line with what IEA finds for the EU in its Stated Policies scenario (CO2 price $33
per tonne, in $2018); IEA< World Energy Outlook 2019: https://www.iea.org/reports/world-ener-gy-outlook-2019
ETS price increases, yet not fast enough for industry to invest in deep decarbonisation
57 3. How do current EU policies help to decarbonise EU gas supply?
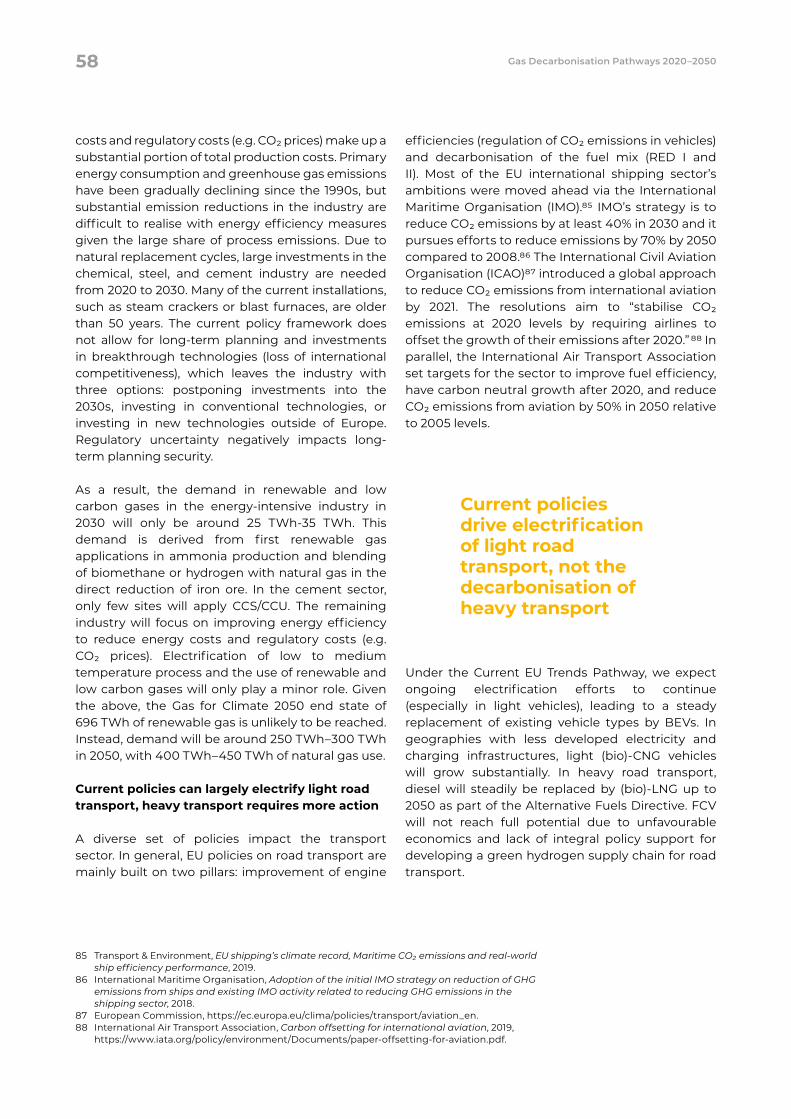
costs and regulatory costs (e.g. CO2 prices) make up a substantial portion of total production costs. Primary energy consumption and greenhouse gas emissions have been gradually declining since the 1990s, but substantial emission reductions in the industry are difficult to realise with energy efficiency measures given the large share of process emissions. Due to natural replacement cycles, large investments in the chemical, steel, and cement industry are needed from 2020 to 2030. Many of the current installations, such as steam crackers or blast furnaces, are older than 50 years. The current policy framework does not allow for long-term planning and investments in breakthrough technologies (loss of international competitiveness), which leaves the industry with three options: postponing investments into the 2030s, investing in conventional technologies, or investing in new technologies outside of Europe. Regulatory uncertainty negatively impacts long-term planning security.
As a result, the demand in renewable and low carbon gases in the energy-intensive industry in 2030 will only be around 25 TWh-35 TWh. This demand is derived from first renewable gas applications in ammonia production and blending of biomethane or hydrogen with natural gas in the direct reduction of iron ore. In the cement sector, only few sites will apply CCS/CCU. The remaining industry will focus on improving energy efficiency to reduce energy costs and regulatory costs (e.g. CO2 prices). Electrification of low to medium temperature process and the use of renewable and low carbon gases will only play a minor role. Given the above, the Gas for Climate 2050 end state of 696 TWh of renewable gas is unlikely to be reached. Instead, demand will be around 250 TWh–300 TWh in 2050, with 400 TWh–450 TWh of natural gas use.
Current policies can largely electrify light road transport, heavy transport requires more action
A diverse set of policies impact the transport sector. In general, EU policies on road transport are mainly built on two pillars: improvement of engine
efficiencies (regulation of CO2 emissions in vehicles) and decarbonisation of the fuel mix (RED I and II). Most of the EU international shipping sector’s ambitions were moved ahead via the International Maritime Organisation (IMO).85 IMO’s strategy is to reduce CO2 emissions by at least 40% in 2030 and it pursues efforts to reduce emissions by 70% by 2050 compared to 2008.86 The International Civil Aviation Organisation (ICAO)87 introduced a global approach to reduce CO2 emissions from international aviation by 2021. The resolutions aim to “stabilise CO2 emissions at 2020 levels by requiring airlines to offset the growth of their emissions after 2020.” 88 In parallel, the International Air Transport Association set targets for the sector to improve fuel efficiency, have carbon neutral growth after 2020, and reduce CO2 emissions from aviation by 50% in 2050 relative to 2005 levels.
Under the Current EU Trends Pathway, we expect ongoing electrification efforts to continue (especially in light vehicles), leading to a steady replacement of existing vehicle types by BEVs. In geographies with less developed electricity and charging infrastructures, light (bio)-CNG vehicles will grow substantially. In heavy road transport, diesel will steadily be replaced by (bio)-LNG up to 2050 as part of the Alternative Fuels Directive. FCV will not reach full potential due to unfavourable economics and lack of integral policy support for developing a green hydrogen supply chain for road transport.
85 Transport & Environment, EU shipping’s climate record, Maritime CO2 emissions and real-world ship efficiency performance, 2019.
86 International Maritime Organisation, Adoption of the initial IMO strategy on reduction of GHG emissions from ships and existing IMO activity related to reducing GHG emissions in the shipping sector, 2018.
87 European Commission, https://ec.europa.eu/clima/policies/transport/aviation_en. 88 International Air Transport Association, Carbon offsetting for international aviation, 2019,
https://www.iata.org/policy/environment/Documents/paper-offsetting-for-aviation.pdf.
Current policies drive electrification of light road transport, not the decarbonisation of heavy transport
58 Gas Decarbonisation Pathways 2020–2050
BEVs will penetrate the light vehicle market under current policies. BloombergNEF predicts sales levels of 65% BEV passenger cars in 2040 based on current trends; however, these sales would not be enough to create a completely decarbonised passenger car sector in 2050.89 Because of this, gasoline will remain part of the fuel mix in light vehicles in 2050. Diesel will remain the dominant fuel option in heavy and long-distance transport in 2050, with a much smaller market size for (bio)-LNG.
FCVs are not expected to play an important role in road transport after 2030. Under current policies, the Fuel Cell and Hydrogen Joint Undertaking expects adoption rates to remain less than 1% for passenger cars and less than 5% for buses and trucks in 2050, largely because of the lack of cost reductions in fuel cell technologies.90 The transformation of the shipping and aviation sectors is slow due to the low rate of unit replacement. Under the Current EU Trends Pathway, limited developments are expected in the sectors before 2030. After 2030, achieving net-zero emissions in 2050 will only be feasible through tremendous upscaling of low carbon fuels, such as bio and synthetic kerosene and marine fuels, especially considering the strong growth of these sectors towards 2050.
In aviation, CO2 emissions will be reduced up to around 10% through the blending of biokerosene in 2050 (95 TWh).91 There will be no role (or a limited role) for synthetic kerosene in this scenario due to high costs for the production of green hydrogen, and the limited role of greenfield blue hydrogen plants to supply new demand. Support schemes for synthetic fuels are also absent. In shipping, fleets will continue to shift to using (bio)-LNG when it becomes available in locations at enough volumes. However, in this scenario, due to the long lifetimes a partial switch to (bio)-LNG can be expected at best, fossil ship fuel oils likely will remain the dominant fuel type.
Europe’s electricity sector rapidly goes renewable, yet more is possible
RED and EU ETS are the main policy drivers for decarbonising the power sector. The revised RED (RED II) established a new binding renewable energy target of at least 32% for 2030. The EU ETS established price levels of €20/tonne CO2 in 2019,92 increased the development of renewable and low carbon electricity generation and promoted a shift from coal-based towards natural gas-based electricity generation.
Under the Current EU Trends Pathway, renewable electricity shares increase towards 55% by 2030. We expect electricity demand to be stable towards 2030 because of limited electrification efforts and ongoing efficiency improvements that offset the additional demand. When renewable electricity shares increase towards 55% by 2030, the result is a reduction in gas demand and other fuels. Installed gas-fired power generation capacities remain stable around 220 GW, thereby reducing full load hours of gas-fired power plants. No power generation based on hydrogen is developed until 2030.
Current EU climate and energy policies do not provide structural drivers at the EU level for the increase of biomethane and green hydrogen supply to gas grids. By 2030, production of green hydrogen would be restricted to pilot plants since almost all
89 Bloomberg NEF, Electric vehicle outlook 2019, 201990 Fuel cell and Hydrogen Joint Undertaking, Hydrogen roadmap Europe, 2019, https://www.FCEV.
europa.eu/sites/default/files/Hydrogen%20Roadmap%20Europe_Report.pdf 91 Transport & Environment, Roadmap to decarbonising European aviation, 2018 92 Carbon Price Viewer, EUA Price, Sandbag: Smarter Climate Policy, https://sandbag.org.uk/
carbon-price-viewer/.
Renewable electricity can scale-up even more than the current predicted 55% by 2030
59 3. How do current EU policies help to decarbonise EU gas supply?
renewable electricity can still be delivered to the electricity grid directly. The expected CO2 price in 2030 (around €35/tCO2) is not sufficient to introduce blue hydrogen as a large-scale replacement of grey hydrogen (hydrogen produced without CCS), which requires a CO2 price of around €50/tCO2. Nor will there be enough incentives to accelerate the development and scale-up of green hydrogen techniques. As a result, the Current EU Trends Pathway shows that developments in the 2020s will occur too slowly to enable a scale-up of renewable and low carbon gas in line with the Gas for Climate 2050 Optimised Gas end state.
Current EU climate and energy policies result in insufficient acceleration of energy renovations in homes and other buildings and they give heavy industry too little long-term certainty to grasp the conversion opportunities emerging in the 2020s to move towards full decarbonisation. In transport, current policies do not deliver enough momentum in decarbonising heavy road transport, shipping, and aviation. Renewable electricity reaches a share of around 55% in 2030, but the share of variable wind and solar PV will still only be around 35%, which does not provide a driver for the development of decarbonised dispatchable power via low carbon gases. The remaining 20% comes from dispatchable hydropower plants and bio-based power plants.
Private investments in renewable and low carbon gases can only be scaled up within a political and regulatory framework that provides long-term certainty and enough incentives to energy-intensive sectors, investors, and project developers. Even though the Innovation Fund is already an important driver of renewable gas demonstration and commercial projects, and while the increasing EU ETS price improves the business case for large-scale biomethane and blue and green hydrogen, the current EU climate and energy policies fall short in providing such framework.
Gas infrastructure mainly used for natural gas, yet becoming more diverse
Gas infrastructure plays an important role in the EU energy system. However, this role is not sufficiently reflected in the long-term strategy of the EU Energy Union. At present, the EU Energy Union strategy aims to remove technical and regulatory barriers to energy flowing freely throughout the EU. The Energy Union also stimulates international collaboration in the Energy Infrastructure Forum and in high level groups. Development of the infrastructure is facilitated via the Trans-European Networks for Energy and Projects of Common Interest.93 Under current EU policies, by 2030 and 2050, gas infrastructure will mainly be used to transport natural gas in gradually decreasing amounts. Current policies do not explicitly stimulate the development of large international hydrogen pipelines or backbones, nor do they support (preparations for) retrofitting existing transport pipelines. The existing international hydrogen connections were developed and are owned by integrated hydrogen production and sales companies that produce hydrogen and supply it to industrial clusters in Northern France, Belgium, and the Netherlands. However, they have insufficient capacity to support a massive scale-up and cost decrease of hydrogen technologies to date. An effective mechanism in the long-term strategy of the EU Energy Union is crucial to ensure the most efficient use of the gas infrastructure in the energy transition.
93 European Commission, www.europa.ec (2019)
60 Gas Decarbonisation Pathways 2020–2050
4. Gas for Climate proposals for the EU Green Deal
Key takeaways → Binding 2030 mandate for gas from renewable sources would help to scale-up supply of bio-methane and green hydrogen.
→ The trade and transport of biomethane, green hydrogen, and blue hydrogen needs to be improved and the market rules for hydrogen and its transportation are to be clarified.
→ In parallel, the EU ETS must be strengthened and broadened to ensure accelerated decarbonisation in energy demand sectors, plus temporary additional support is needed to ensure that heavy industry chooses deep decarbonisation in natural reinvestment moments during the 2020s.
→ The European gas infrastructure should be recognised within the regulatory framework as a key asset for the decarbonisation of the European economy providing a sustainable and cost-efficient solution to the transport and storage challenges of a future decarbonised energy system.
→ Planning of energy infrastructure should be more integrated considering the overall energy system and the advantages offered by existing infrastructure.
→ TEN-E and CEF regulations should facilitate and support the integration of renewable gas.
This chapter explores how EU policy can help accelerate the production of biomethane and green and blue hydrogen making the best possible use to the entire energy system of the existing infrastructure. It also identifies where biomethane, green hydrogen, and blue hydrogen use can add the most value in energy demand segments, in a smart combination with increasing levels of renewable electricity.
Becoming the world’s first climate-neutral continent requires Europe to implement low carbon technologies now. As analysed in the Gas for Climate’s 2019 study, balancing the use of renewable gas and renewable electricity saves society over €200 billion annually by 2050, compared to an energy system that uses a minimal amount of gas. Today, the EU biogas sector represents 71,000 jobs in Europe that are difficult to outsource.94 The Gas for Climate employment study shows that scaling up renewable gases in the EU can create 1.7 million to 2.4 million jobs by 2050, of which 600,000 to 850,000 would be direct jobs.95
Achieving a large-scale deployment of renewable and low carbon gas requires action from many different stakeholders, starting today. Substantial additional climate action is needed by 2030 to reach the Gas for Climate 2050 Optimised Gas end state. The Accelerated Decarbonisation Pathway highlights the actions required of the private sector in the energy, industry, buildings, and transportation sectors to achieve an energy transition that allows Europe to fully decarbonise at the lowest societal costs. The Gas for Climate consortium members all support full decarbonisation and want to ensure that gas infrastructure can transport and store renewable and low carbon gas in the most cost-effective way, largely based on existing gas infrastructure. The Gas for Climate consortium also
sees the need to improve renewable methane and hydrogen business cases with lower production costs. Planning of new energy infrastructure should be designed in an integrated way and be based on the overall needs of a future energy system.
The section below describes the main bottlenecks to scaling-up hydrogen and biomethane and discusses how policy can help overcome them.
The main bottlenecks that prevent investments in blue hydrogen in the 2020s are:
→ Insufficiently high CO2 prices; no outlook on the roughly €50/tCO2 that could build the business case.
→ CO2 storage is not currently permitted in many EU member states, as not all policymakers and stakeholders support CCS as an instrument to mitigate climate change.
→ Ambiguity exists on whether TSOs can transport CO2 for storage in offshore formations, both domestically and internationally.96 In the Netherlands, Norway and the UK, authorities have provided regulatory certainty on this, the same should be arranged EU-wide.
→ No clarity on liabilities around CO2 storage.
94 IRENA, 2018. Renewable energy and jobs – Annual review 2018. Available at: https://www.irena.org/publications/2018/May/Renewable-Energy-and-Jobs-Annual-Review-2018; EurObserv’ER (2018). The state of renewable energies in Europe edition 2018 - 18th Eu8 EurObserv’ER (2018).
95 Navigant, 2019. Gas for Climate. Job creation by scaling up renewable gas in Europe. Available at: https://gasforclimate2050.eu/files/files/Navigant_Gas_for_Climate_Job_creation_by_scaling_up_renewable_gas_in_Europe.pdf
96 Article 6 of the London Protocol, a treaty under the International Maritime Organization (IMO), implicitly prohibits the cross-boundary transport of CO2 prior to sequestration under the seabed as this would classify as “waste dumping or incineration at sea”. An amendment to this treaty was already written in 2009, but only six countries had ratified so far, failing to reach the two-third majority needed to pass. As a temporary solution, Norway and the Netherlands developed a proposal asking for the amendment to be implemented for those countries who had ratified it and was approved in October 2019. This means that currently Norway, the United Kingdom, the Netherlands, Iran, Finland and Estonia can exchange CO2 amongst each other for CCS projects. Source: NCLOS (2019), Provisional Application of an Amendment to the London Protocol to Facilitate Collaborative CCS Projects. https://site.uit.no/nclos/2019/12/11/provisional-applica-tion-of-an-amendment-to-the-london-protocol-to-facilitate-collaborative-ccs-projects/x
Much more is possible by 2030 as part of an EU Green Deal under the Accelerated Decarbonisation Pathway
62 Gas Decarbonisation Pathways 2020–2050
Solutions could be found in: → Strengthening the EU ETS leading to at least
€55/tCO2 by 2030 plus dedicated and time-bound national subsidies, like Contracts for Difference (CfD), to kickstart blue hydrogen production during the 2020s.
→ Investors focusing on member states where CO2 storage is currently allowed, while policymakers work on spreading that to more member states.
→ The political debate, which should detail the conditions under which CCS could be a more widely accepted instrument to mitigate climate change.
→ For example, a condition could be that any CCS project must have a phaseout clause by 2050 unless it is used to generate negative emissions afterwards, i.e. by producing climate positive hydrogen. Using CCS as a tool to create negative emissions can help to create longer-term support for the technology.
→ The EU and national regulators providing clarity for gas TSOs on being allowed to transport CO2 and provide best practices on how long-term liabilities could be clarified so energy companies and investors will have confidence to invest in CCS.
The main bottlenecks that prevent investments in green hydrogen during the 2020s are:
→ High costs. While the cost of green hydrogen is declining rapidly, it is still prohibitively expensive today and current production units are too small.
→ For large-scale application during the 2020s, there is:
→ Insufficient wind and solar generation capacity beyond what is needed to serve direct electricity demand
→ No clarity on whether gas TSOs are allowed to transport hydrogen
→ Hydrogen used for energy storage can face double taxation on the basis of electricity used as input when hydrogen is stored97
Solutions could be found in: → The EU Innovation Fund to co-fund initial large
electrolyser projects during the 2020s. → Longer-term investor certainty and positive
business case provided by a mandatory target for gas from renewable sources in 2030.
→ Production costs to decrease through economies of scale and learning effects, subsidy regimes can be designed to accelerate this.
→ Double taxation on electrolysers to be removed, requiring a modification of the Energy Tax Directive.
→ Certificate-trading of hydrogen should become possible both within EU Member States and across borders. This requires a set of harmonised rules on defining green hydrogen and setting up certificate-schemes. The voluntary development of CertifHy98 is a positive initiative.
→ TSOs should be allowed to invest in dedicated hydrogen pipelines and should be allowed to blend a limited amount of hydrogen in natural gas.
The main bottlenecks that prevent investments in biomethane during the 2020s are:
→ High production costs compared to natural gas plus the current CO2 price
→ An increased EU ETS price of €55/tCO2 by 2030 is likely to be insufficient to create a positive business case for biomethane using in industry and power production.
→ Limited political and societal support for a long-term valuable role for biomethane to decarbonise the energy system.
→ Limited possibilities for cross-border trade of biomethane.
→ High investment costs for biomethane gasification projects, which must be large-scale to be economically viable (see Chapter 3).
Solutions could be found in: → A further increase of the ETS price beyond 2030
from €55/tCO2 to €100/tCO2 by and €150/tCO2 by 2040 and €150 by 2050 would help to bridge the gap. For the 2020s and 2030s additional incentives are needed.
97 The European Commission writes in SWD(2019)329 (2019), Commission staff working, evaluation of the Energy Tax Directive, p.36: ‘The ETD states that electricity is taxed when released for consumption but does not define whether electricity is released for consumption when supplied to storage facilities. This opens the possibility of double taxation of electricity that is stored and re-sold.’ See: https://ec.europa.eu/taxation_customs/sites/taxation/files/energy-tax-report-2019.pdf
98 https://www.certifhy.eu/
63 4. Gas for Climate proposals for the EU Green Deal
→ EU Member States should (continue to) support biomethane through subsidy regimes up to 2030.
→ EU Innovation Fund to co-finance the first large-scale biomethane gasification projects during the 2020s.
→ Longer-term investor certainty and positive business case provided by a mandatory target for gas from renewable sources in 2030.
→ Production costs to decrease through economies of scale and learning effects. Subsidy regimes can be designed to accelerate this.
→ Facilitate the trading to include cross-border trading of biomethane and further harmonise gas quality standards to facilitate blending of biomethane in natural gas.
The analysis above leads to three key recommendations for policy measures to be included in the EU Green Deal. To stimulate an integrated approach on gas and electricity that achieves the goals of the energy transition, it would be necessary to:1. Stimulate the supply of hydrogen and
biomethane by a binding mandate for 10% gas from renewable sources by 2030.
2. Foster cross-border trade and transport of hydrogen and biomethane and clarify market rules for green and blue hydrogen including for hydrogen transport.
3. Incentivise demand for hydrogen and biomethane in EU industry and production of dispatchable electricity by strengthening and broadening the EU Emissions Trading System (ETS) combined with targeted and time-bound Contracts for Difference.
4. Adapt the EU regulatory framework to deploy the gas infrastructure, integrated in the energy system, as a key asset for the sustainable and cost-efficient decarbonisation of the European economy.
Binding mandate of 10% renewable gas by 2030
The RED should be amended to include a binding target of 10% gas from renewable sources by 2030. Such a target would also cover green hydrogen, although it is expected that most of the target would be met by biomethane up to 2030, since in 2030, the green electricity needed for green hydrogen will mostly be needed to decarbonise electricity use in the power sector. Like the renewable fuels target as part of the RED II, EU Member States would obligate national suppliers of gas to ensure the target is met. They can do this by starting to produce renewable
gas themselves, by sourcing renewable gas from others, or by purchasing renewable gas certificates to green their supply. Certificates should ensure that for each quantity of renewable gas that counts towards the target somewhere in the EU a corresponding quantity of renewable gas is fed into gas grids, like the certification system currently in place for green electricity. Physical imports of biomethane and green hydrogen should be able to count towards the target, similar to the already existing possibility in the EU RED to count physical imports of renewable electricity towards the target. This provides additional assurance that obligated parties will be able to fulfil the mandate.
Member States could either set a mandatory target for 10% gas from renewable sources for the year 2030 or could introduce binding intermediate targets for the years 2020 to 2030 that provide a pathway towards the 10% target. The first option would provide member states the possibility to continue feed-in subsidy support for biomethane until and including the year 2029. Such support could be targeted towards green hydrogen, biomethane from digestion and biomethane from gasification specifically. The second option could include intermediate sub-targets for various types of renewable gases.
A binding target for renewable gas for 2030, with a clear indication that this target would be continued and increased after 2030, would help to scale up of green hydrogen and biomethane, including from gasification. A binding mandate alone will however be insufficient, especially for biomethane. Equally important is the political messaging on the long-term outlook for bioenergy in the EU energy system. The experience of the EU RED biofuels mandate since 2008, which has been constantly subject to fierce debate shows that investors will shy away from large investments in bioenergy unless unambiguous political support is provided that ‘bioenergy done right’ can, under the right sustainability conditions, be a valuable contribution to the decarbonisation of the EU energy system.
Strengthening the role and effectiveness in deploying climate-neutral innovation of the EU ETS
The EU ETS is the primary instrument for reducing emissions in European energy industries and related industries. The EU ETS aims to control
64 Gas Decarbonisation Pathways 2020–2050
emissions from power generation, district heating (above a certain size, i.e. combustion plants above 20 MW), and several energy-intensive industries. As stated in the European Commission’s Green Deal communication in December 2019, the Commission will revise the EU ETS within the Green Deal. Plans include extending the EU ETS to the maritime sector, reducing the EU ETS allowances allocation for free to airlines, and reviewing the role of Innovation and Modernisation Funds.99
To reach the required emission reduction within the Accelerated Decarbonisation Pathway, the annual emissions ceiling should be increased from the current 2.2% towards approximately 4% annually.100 This could translate in a carbon price of €55/tCO2 by 2030. In the steel sector an ETS price of around €60–€80/tCO2 already enables investments in breakthrough technologies. This could include investments in ammonia and cement production, and carbon capture can be realised at an even lower carbon price.101 To switch from steam methane reforming
to renewable hydrogen to produce ammonia and from steam cracking to MTO to produce high value chemicals, a carbon price exceeding €150/tCO2 is required.102 This means that an additional policy instrument is needed to help decarbonise industry until the moment when the ETS price is sufficiently high. An effective policy instrument can be a programme of targeted and time-bound CfDs. A CfD is a contract between an industry company investing in a breakthrough technology and a government body. The idea is that the company is paid by the government body, over a predetermined
number of years, the difference between the reference price (the CO2 price under the EU ETS) and the strike price (a price that reflects the CO2 abatement costs of a particular technology).
Facilitate the trade and transport of renewable and low carbon gas
Renewable methane and hydrogen need to be transported, stored, and traded. Gas for Climate sees a need for the following improvements:
→ Grid access for renewable gas → Cross-border trade of all forms of renewable and
decarbonised gas → Transport of hydrogen and the coupling and
integration of gas and electricity sectors
In addition, political and regulatory support is needed for the creation of a European Hydrogen Backbone infrastructure using where possible existing gas infrastructure. This would help to create a European hydrogen market initially with sources within Europe. This market would trigger additional investments internationally because hydrogen imports would meet security of demand in an existing market.
Cross-border trade should be enabled by the harmonisation of the national registers and setting up an EU-wide connected green gas register that is facilitated by TSOs. An EU-wide, harmonised renewable gas trading platform needs to be set up.
The creation of a cross-EU biomethane certificate scheme would also enable front-running companies with voluntary decarbonisation targets, such as many food and beverage producers that set science-based climate targets, to start sourcing biomethane at a premium price.103
Adapt the EU regulatory framework to facilitate a fully integrated energy system and its infrastructures
Clear guidance on gas decarbonisation pathways is needed to reduce uncertainty for investment. Planning of new energy infrastructure should take a holistic view and be based on a future energy
99 European Commission (2019) The European Green Deal, retrieved from: https://ec.europa.eu/info/sites/info/files/european-green-deal-communication_en.pdf
100 Carbon Tracker, 2018, Carbon Clampdown: Closing the Gap to a Paris-compliant EU-ETS. Available at: https://www.carbontracker.org/reports/carbon-clampdown/.
101 Guidehouse calculation based on confidential industry data.102 Ibid103 https://sciencebasedtargets.org/companies-taking-action/
In the steel sector an ETS price of €60-€80/tCO2 can enable investments in breakthrough technologies
65 4. Gas for Climate proposals for the EU Green Deal
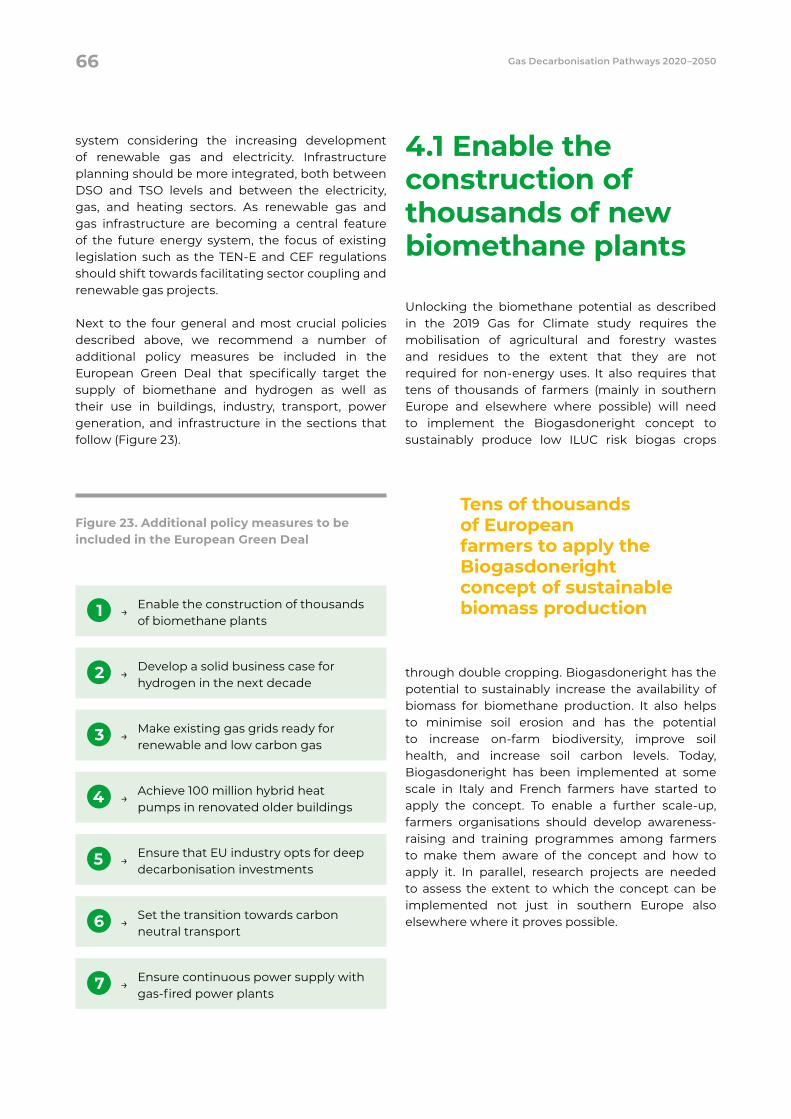
system considering the increasing development of renewable gas and electricity. Infrastructure planning should be more integrated, both between DSO and TSO levels and between the electricity, gas, and heating sectors. As renewable gas and gas infrastructure are becoming a central feature of the future energy system, the focus of existing legislation such as the TEN-E and CEF regulations should shift towards facilitating sector coupling and renewable gas projects.
Next to the four general and most crucial policies described above, we recommend a number of additional policy measures be included in the European Green Deal that specifically target the supply of biomethane and hydrogen as well as their use in buildings, industry, transport, power generation, and infrastructure in the sections that follow (Figure 23).
4.1 Enable the construction of thousands of new biomethane plants
Unlocking the biomethane potential as described in the 2019 Gas for Climate study requires the mobilisation of agricultural and forestry wastes and residues to the extent that they are not required for non-energy uses. It also requires that tens of thousands of farmers (mainly in southern Europe and elsewhere where possible) will need to implement the Biogasdoneright concept to sustainably produce low ILUC risk biogas crops
through double cropping. Biogasdoneright has the potential to sustainably increase the availability of biomass for biomethane production. It also helps to minimise soil erosion and has the potential to increase on-farm biodiversity, improve soil health, and increase soil carbon levels. Today, Biogasdoneright has been implemented at some scale in Italy and French farmers have started to apply the concept. To enable a further scale-up, farmers organisations should develop awareness-raising and training programmes among farmers to make them aware of the concept and how to apply it. In parallel, research projects are needed to assess the extent to which the concept can be implemented not just in southern Europe also elsewhere where it proves possible.
1 →Enable the construction of thousands of biomethane plants
2 →Develop a solid business case for hydrogen in the next decade
3 →Make existing gas grids ready for renewable and low carbon gas
4 →Achieve 100 million hybrid heat pumps in renovated older buildings
5 →Ensure that EU industry opts for deep decarbonisation investments
6 →Set the transition towards carbon neutral transport
7 →Ensure continuous power supply with gas-fired power plants
Figure 23. Additional policy measures to be included in the European Green Deal
Tens of thousands of European farmers to apply the Biogasdoneright concept of sustainable biomass production
66 Gas Decarbonisation Pathways 2020–2050
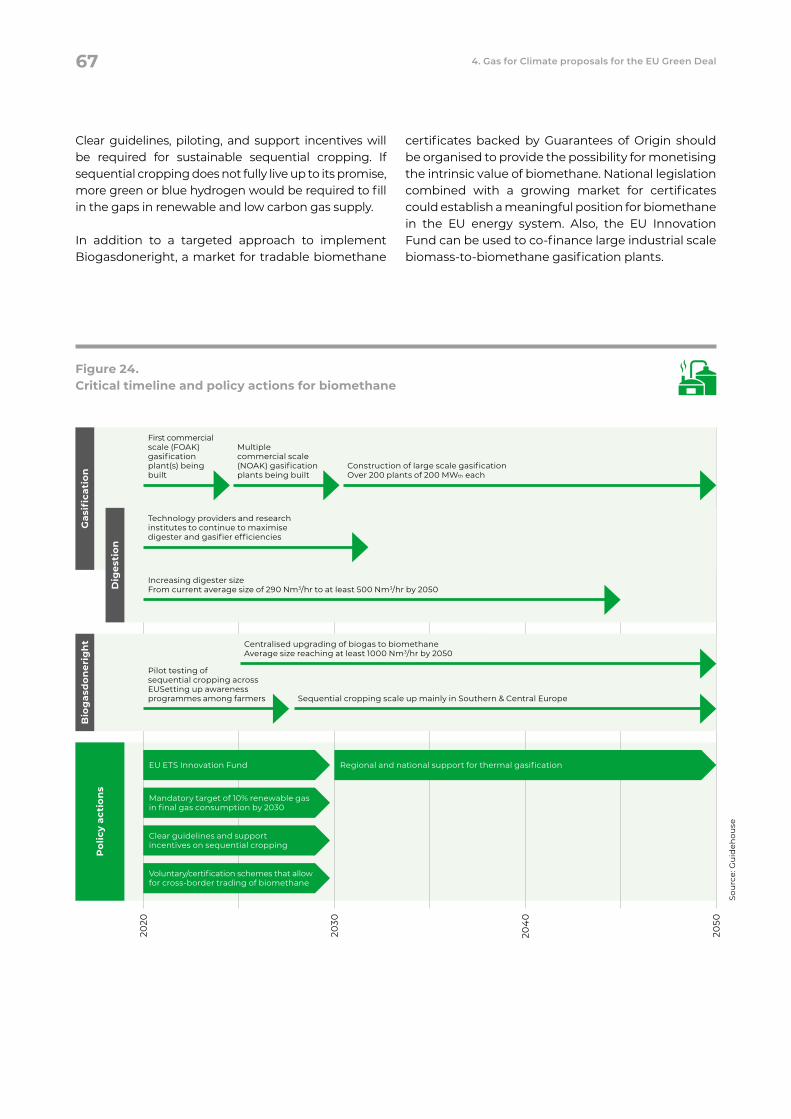
Clear guidelines, piloting, and support incentives will be required for sustainable sequential cropping. If sequential cropping does not fully live up to its promise, more green or blue hydrogen would be required to fill in the gaps in renewable and low carbon gas supply.
In addition to a targeted approach to implement Biogasdoneright, a market for tradable biomethane
certificates backed by Guarantees of Origin should be organised to provide the possibility for monetising the intrinsic value of biomethane. National legislation combined with a growing market for certificates could establish a meaningful position for biomethane in the EU energy system. Also, the EU Innovation Fund can be used to co-finance large industrial scale biomass-to-biomethane gasification plants.
Figure 24. Critical timeline and policy actions for biomethane
2020
2030
204
0
2050
Po
licy
acti
ons
EU ETS Innovation Fund
Mandatory target of 10% renewable gas in final gas consumption by 2030
Clear guidelines and support incentives on sequential cropping
Voluntary/certification schemes that allow for cross-border trading of biomethane
Regional and national support for thermal gasification
Sou
rce:
Gu
ideh
ouse
Bio
gas
don
e rig
ht
Gas
ifica
tion
Dig
esti
on
Increasing digester sizeFrom current average size of 290 Nm3/hr to at least 500 Nm3/hr by 2050
First commercial scale (FOAK) gasification plant(s) being built
Multiple commercial scale (NOAK) gasification plants being built
Construction of large scale gasification Over 200 plants of 200 MWth each
Technology providers and research institutes to continue to maximise digester and gasifier efficiencies
Pilot testing of sequential cropping across EUSetting up awareness programmes among farmers Sequential cropping scale up mainly in Southern & Central Europe
Centralised upgrading of biogas to biomethaneAverage size reaching at least 1000 Nm3/hr by 2050
67 4. Gas for Climate proposals for the EU Green Deal
4.2 Develop a solid business case for hydrogen in the next decade
With only 339 TWh hydrogen currently produced in the EU and no production of green (except in smaller pilot plants) and blue hydrogen, we are still a long way from the suggested 1,710 TWh in the Gas for Climate 2050 end state. The Accelerated Decarbonisation Pathway as described in section 2.1.2 can lead to the sustainable production of around 200 TWh by 2030 and 2,270 TWh by 2050: 1,710 TWh for the demand in scope of the Gas for Climate report 2019 plus 180 TWh for petrochemicals plus 380 TWh for synthetic fuels. In the coming decade, both blue and green hydrogen projects need to scale-up and improve. All conventional hydrogen assets should be retrofitted with CCS and developing greenfield blue hydrogen capacity should be started, paving the way for future use of green hydrogen. Green hydrogen electrolysis needs to be proven at scale with a total needed capacity of 15 GW-20 GW by 2030. Plants need to improve in efficiency, installation size, and cost, and renewable electricity should become available at very low cost and reasonable full load hours to get the cost of green hydrogen at a competitive level.
The main policies affecting the uptake of hydrogen are the Renewable Energy Directive, the Innovation Fund, and the Fuel Cells and Hydrogen Joint Undertaking programme. Member state policies and strategies such as the Flemish Hydrogen Roadmap (Belgium), the Hydrogen Deployment Plan (France), and the SDE++ and the Climate Agreement (Netherlands) are also impacting hydrogen uptake. However, these are not enough to reach the Accelerated Decarbonisation Pathway.
To increase the uptake of blue hydrogen, public and political attitudes towards CCS need to permit the large scale-up of greenfield blue hydrogen plants. Blue hydrogen is needed as a transitory solution to pave the way for green hydrogen, to reduce cumulative emissions and to help meet 2030 emissions targets by a fast start to emission
reductions. Furthermore, the blue hydrogen infrastructure creates an option to achieve much-needed negative emissions by feeding biomethane. This enables (part of) blue hydrogen production assets to continue to be used also after 2050. Strengthening of the EU ETS to achieve a CO2 price of at least €55/tCO2 should provide the business case for blue hydrogen projects.
To increase the deployment of green hydrogen in the short term, we need to support significant technology development and associated cost reductions. In current policies, the boundary conditions are not in place to promote the rapid growth of green hydrogen, as the deployment of renewable power sources is limited in the short term and investment costs remain high due to absent policy schemes for green hydrogen.
The recommended 10% binding mandate for renewable gas by 2030 (as described in the previous section) will be instrumental to accelerate the deployment of hydrogen, although due to costs and technology maturity this will mostly be met by the production of biomethane. A strengthening of
the EU ETS would also help; however, it will not be enough as green hydrogen requires a CO2 price of well above €55/tCO2 today. To improve the green hydrogen business case, policies need to avoid the current double taxation of green hydrogen
A change in CCS attitudes is required to increase the uptake of blue hydrogen
Green hydrogen upscale requires significant technology learning and associated cost reductions
68 Gas Decarbonisation Pathways 2020–2050
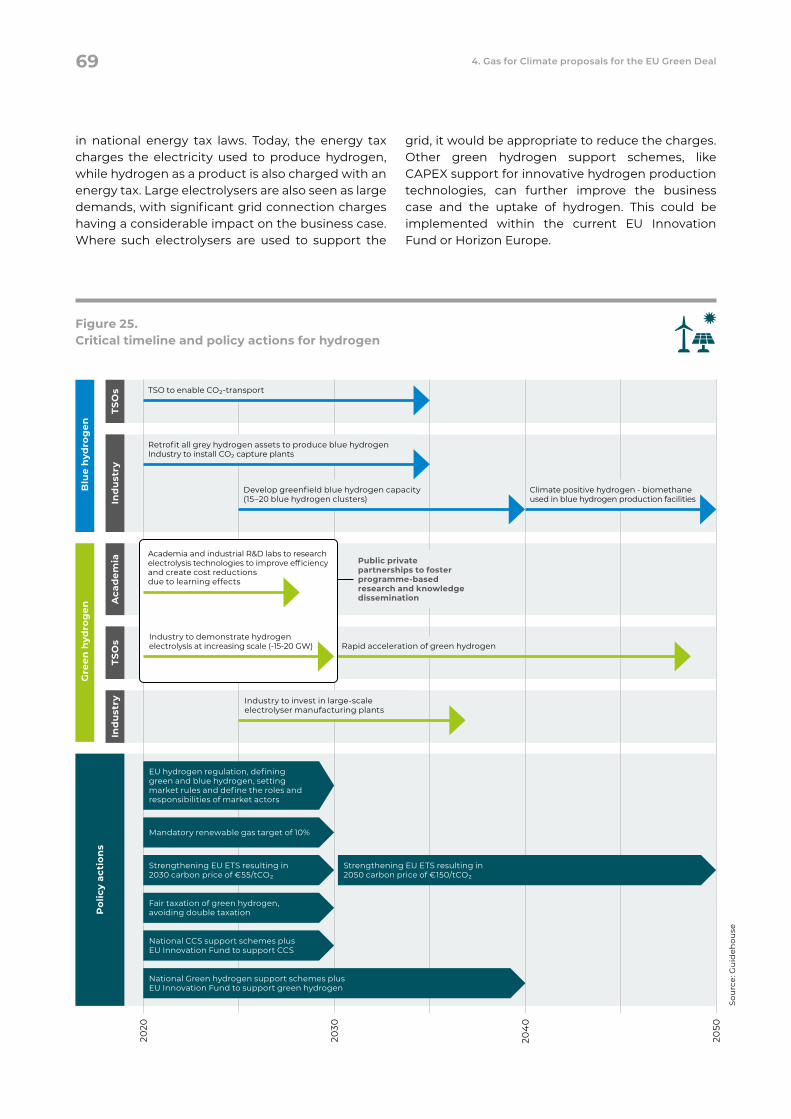
in national energy tax laws. Today, the energy tax charges the electricity used to produce hydrogen, while hydrogen as a product is also charged with an energy tax. Large electrolysers are also seen as large demands, with significant grid connection charges having a considerable impact on the business case. Where such electrolysers are used to support the
grid, it would be appropriate to reduce the charges. Other green hydrogen support schemes, like CAPEX support for innovative hydrogen production technologies, can further improve the business case and the uptake of hydrogen. This could be implemented within the current EU Innovation Fund or Horizon Europe.
Figure 25. Critical timeline and policy actions for hydrogen
2020
2030
204
0
2050
Po
licy
acti
ons
EU hydrogen regulation, defining green and blue hydrogen, setting market rules and define the roles and responsibilities of market actors
Mandatory renewable gas target of 10%
Fair taxation of green hydrogen, avoiding double taxation
National CCS support schemes plus EU Innovation Fund to support CCS
National Green hydrogen support schemes plus EU Innovation Fund to support green hydrogen
Strengthening EU ETS resulting in 2030 carbon price of €55/tCO2
Strengthening EU ETS resulting in 2050 carbon price of €150/tCO2
Sou
rce:
Gu
ideh
ouse
Ind
ust
ryIn
du
stry
Blu
e h
ydro
gen
Gre
en h
ydro
gen
Rapid acceleration of green hydrogen
Industry to invest in large-scale electrolyser manufacturing plants
Aca
dem
iaTS
Os
TSO
s
TSO to enable CO2-transport
Academia and industrial R&D labs to research electrolysis technologies to improve efficiency and create cost reductions due to learning effects
Public private partnerships to foster programme-based research and knowledge dissemination
Develop greenfield blue hydrogen capacity (15–20 blue hydrogen clusters)
Climate positive hydrogen - biomethane used in blue hydrogen production facilities
Retrofit all grey hydrogen assets to produce blue hydrogen Industry to install CO2 capture plants
Industry to demonstrate hydrogen electrolysis at increasing scale (-15-20 GW)
69 4. Gas for Climate proposals for the EU Green Deal
4.3 Make existing gas grids ready for renewable and low carbon gas
The current gas infrastructure plays an important role in the EU energy system. During the coming decade, it will continue to be used to transport and store natural gas. For most of Europe, existing gas infrastructure is fit for use and no grid expansion is required (as explained in section 2.4). Also, biomethane can be blended with natural gas without requiring significant gas grid modifications. The large scale-up of hydrogen (as foreseen in the Accelerated Decarbonisation Pathway) requires regional and national hydrogen backbone infrastructures around 2030, which will soon be connected to create a European hydrogen backbone during the 2030s. While the EU Energy Union strategy aims to remove technical and regulatory barriers to energy flowing freely throughout the EU, current policies do not explicitly stimulate the development of large international hydrogen pipelines or backbones.
To be in line with the Accelerated Decarbonisation Pathway, various policies are needed:1. Connecting biomethane installations to gas
grids, investing in reverse flow technology, enabling the uploading of renewable gases to the high pressure grid, the repurposing of parts of gas infrastructure to create dedicated hydrogen infrastructure and investments in new hydrogen infrastructure including hydrogen
and CO2 infrastructure should be classified as sustainable investments under the EU taxonomy rules. National policies should keep flexibility in reusing gas assets by removing potential hurdles for reuse of infrastructure for hydrogen transport.
2. Although several NECPs already foresee a role for hydrogen in 2030, current regulation does not yet facilitate the transport of pure hydrogen in gas infrastructure, similar to the transport of natural gas today.104 This means that hydrogen transport would be limited to integrated company infrastructure initiatives, mainly focused on captive customers in industries and transport, or through (modest) blending in regulated gas infrastructure. To enable further adoption of hydrogen, as an integral part of the future EU energy system, a regulatory framework for hydrogen needs to be developed, either through an update of the EU Gas Directive or by new legislation. This should allow for investments in hydrogen transport and storage infrastructure, including the retrofitting of existing gas assets, and recouping the cost involved. As for natural gas, a mature and open market for hydrogen requires grids that have third-party access and allow cross-national trading. There should be flexibility in legislation with those parameters to allow for a regime compatible with geography, age, and ownership of the existing grids.
3. Harmonise gas quality standards and standards for biomethane injection in gas grids and set standards and definitions for hydrogen and blended gases to enable their transport through gas infrastructure and across borders. This should consider a current state blend level and variability in blend levels during the year or a ramp up towards the future. Several working groups are examining standards for hydrogen blending (e.g. HyReady and HIPS-Net).105
New policy measures must not harm the security of the supply of current gas networks, which are urgently needed for hydrogen or biomethane transport in a future with lots of intermittent electricity. The gradual disruption of security of supply of gas infrastructure by fiscal, financial, or legal measures would remove an essential building block for the future integrated energy system.
104 In Germany, TSOs have proposed to include a green gas scenario focussing on hydrogen transport as part of the Network Development Plan. The regulator has approved such additional perspective – which is unique in Europe as of today – but without any consequences for infrastructure decision to date.
105 IEA, The future of hydrogen, 2019
Investments to create dedicated hydrogen grids are sustainable investments
70 Gas Decarbonisation Pathways 2020–2050
4.4 Apply hybrid heating solutions in 100 million older buildings
In the Accelerated Decarbonisation Pathway, all European buildings will be insulated well in the period 2020 to 2050 and older (pre-2020) buildings with gas grid connections will be heated through hybrid heating technology, which is a combination of a small electric heat pump and a small gas boiler. Such a pathway yields considerable societal cost benefits that result from preventing that the whole building stock should undergo very
deep renovations, using existing gas distribution infrastructure and minimising peaks in heating energy while reducing overall energy demand through insulation. However, this can only be implemented if hybrid heating technologies are promoted and if the speed and intensity of building renovation is dramatically increased.
Current EU policies that drive decarbonisation in the EU buildings stock (EPBD, EED, and LTRS) fall short in delivering the necessary renovation speed. Also, limited incentives for hybrid heating solutions exist.106 In policy studies and scenarios, the option is often overlooked: by 2050, buildings are assumed to be heated either with (all-)electric heat pumps or by district heating or using renewable gas. Consumers are largely unaware of the option of hybrid heating, and installers have insufficient knowledge of how to change an existing gas-fired heating system into a hybrid one.
The following policy changes should be considered as part of the European Green Deal:1. Kick off the announced Renovation Wave by
setting ambitious binding targets for energy renovations of buildings, both in terms of the depth of renovations and the speed of their implementation in member states. This will accelerate the improvement of buildings’ energy performance.
2. Take up the option of hybrid heating systems in policy studies, scenarios, and in plans for the Renovation Wave.
3. Foster increased awareness of hybrid heating systems through EU political support and by programmes initiated by member states, installers, and consumers.
4. Create a sustainable market environment for hybrid heating systems, and
5. Actively propagate the installation of hybrid heat pumps in older buildings that have gas connections today.
106 An example is a subsidy of €800 in Flanders, Belgium (https://www.vlaanderen.be/premie-van-de-netbeheerder-voor-een-warmtepomp) and €1,500-€1,800 in the Netherlands (https://www.milieucentraal.nl/energie-besparen/energiezuinig-huis/financiering-energie-besparen/subsi-die-warmtepompen/).
100 million hybrid heat pumps in renovated older buildings are needed to decarbonise the building sector
71 4. Gas for Climate proposals for the EU Green Deal
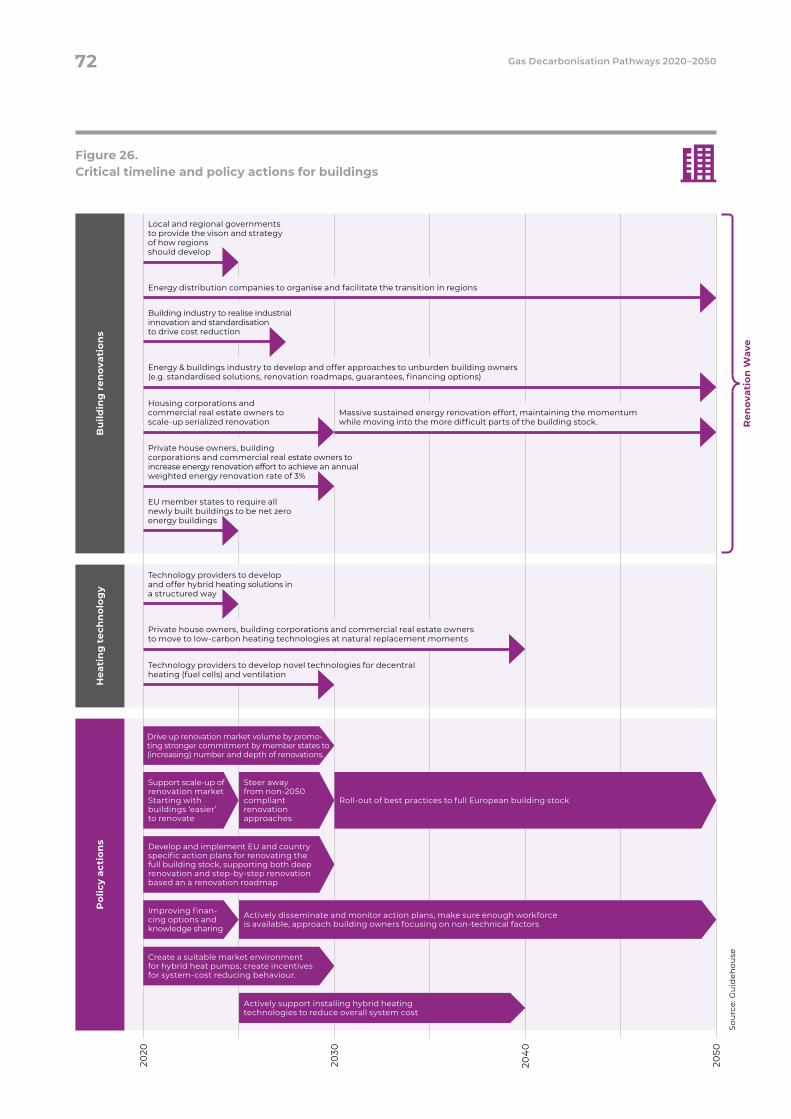
Bu
ildin
g r
enov
atio
ns
Figure 26. Critical timeline and policy actions for buildings
Hea
tin
g t
ech
no
log
y
Building industry to realise industrial innovation and standardisation to drive cost reduction
Private house owners, building corporations and commercial real estate owners to increase energy renovation effort to achieve an annual weighted energy renovation rate of 3%
Massive sustained energy renovation effort, maintaining the momentum while moving into the more difficult parts of the building stock.
Local and regional govern ments to provide the vison and strategy of how regions should develop
EU member states to require all newly built buildings to be net zero energy buildings
Technology providers to develop and offer hybrid heating solutions in a structured way
Energy distribution companies to organise and facilitate the transition in regions
Energy & buildings industry to develop and offer approaches to unburden building owners (e.g. standardised solutions, renovation roadmaps, guarantees, financing options)
2020
2030
204
0
2050
Housing corporations and commercial real estate owners to scale-up serialized renovation
Private house owners, building corporations and commercial real estate owners to move to low-carbon heating technologies at natural replacement moments
Technology providers to develop novel technologies for decentral heating (fuel cells) and ventilation
Ren
ovat
ion
Wav
e
Po
licy
acti
ons
Drive up renovation market volume by promo-ting stronger commitment by member states to (increasing) number and depth of renovations.
Create a suitable market environment for hybrid heat pumps; create incentives for system-cost reducing behaviour.
Develop and implement EU and country specific action plans for renovating the full building stock, supporting both deep renovation and step-by-step renovation based an a renovation roadmap
Support scale-up of renovation marketStarting with buildings ‘easier’ to renovate
Improving finan-cing options and knowledge sharing
Actively disseminate and monitor action plans, make sure enough workforce is available, approach building owners focusing on non-technical factors
Steer away from non-2050 compliant renovation approaches
Roll-out of best practices to full European building stock
Actively support installing hybrid heating technologies to reduce overall system cost
Sou
rce:
Gu
ideh
ouse
72 Gas Decarbonisation Pathways 2020–2050
4.5 Ensure that EU industry opts for deep decarbonisation investments
Efforts are needed to avoid industry relocation outside the EU as the European industry faces international competition. Without protective measures, increased energy and regulatory costs can be a competitive disadvantage. To maintain integrated value chains from basic materials (e.g. steel, chemicals, cement) to finished products (e.g. cars, electronics) measures such as carbon border adjustments need to be put in place to compensate for the costs ensuing from EU policies.
As explained in section 2.2.2, further decarbonisation of the industry is a challenge, particularly for feedstocks and high temperature processes. The Gas for Climate Optimised Gas end state requires major changes. In the steel sector, the current blast furnace process for primary steelmaking must be replaced by innovative, low carbon steelmaking technologies based on carbon capture and low carbon gases. Secondary steelmaking will also play a bigger role in 2050, meeting 50% of the steel demand. The cement industry should reduce its process emissions by applying carbon capture and reduce its energy-related emissions by switching from fossil fuels to solid biomass.
While in the chemical sector the ammonia production process will stay largely unchanged using renewable hydrogen as feedstock instead of grey hydrogen, the production of high value chemicals (HVC) should shift from steam cracking to the MTO route.
Almost all steel plants in Europe began production between 1960 to 1980 and will reach the end of their lifetime in the coming 5 to15 years. In that timeframe, steel companies will have to decide
whether to invest in the modernisation of existing plants, which constitutes a significant financial commitment given the age of the plants, or in breakthrough technologies. The situation is similar in the chemical industry. Most installations
are 30 years or older and will require substantial reinvestments in the next two decades. It is time to opt for deep decarbonisation investments. However, this requires clear incentives.
The EU ETS is the primary instrument for reducing emissions in industry. Strengthening the EU ETS carbon price in a stable wa should provide long-term planning security for an industry that considers long investment cycles. The ETS price for industry depends per sector; for the steel sector, an ETS price of €60-€80/tCO2 could enable investments in breakthrough technologies. In ammonia and in cement production, carbon capture can be realised at an even lower carbon price. On the other hand, to switch from steam methane reforming to renewable hydrogen to produce ammonia, and from steam cracking to MTO to produce high value chemicals, a carbon price exceeding €150/tCO2 is required.107 This means that additional policy instruments can help to decarbonise industry at a lower ETS price. One effective measure can be a targeted and time-bound Contract for Difference (CfD) scheme, as explained at the start of this Chapter. This could bridge the gap between the CO2 price trajectory and what is required to invest while the CO2 price is still insufficient. In addition, there will be a role for the Innovation Fund to support breakthrough technologies in industry. The establishment of a hydrogen infrastructure to industrial clusters will enable the uptake of hydrogen.
Almost the entire cement and steel industry will have natural re-investment moments during the next 5-15 years
107 Guidehouse calculation based on confidential industry data.
73 4. Gas for Climate proposals for the EU Green Deal
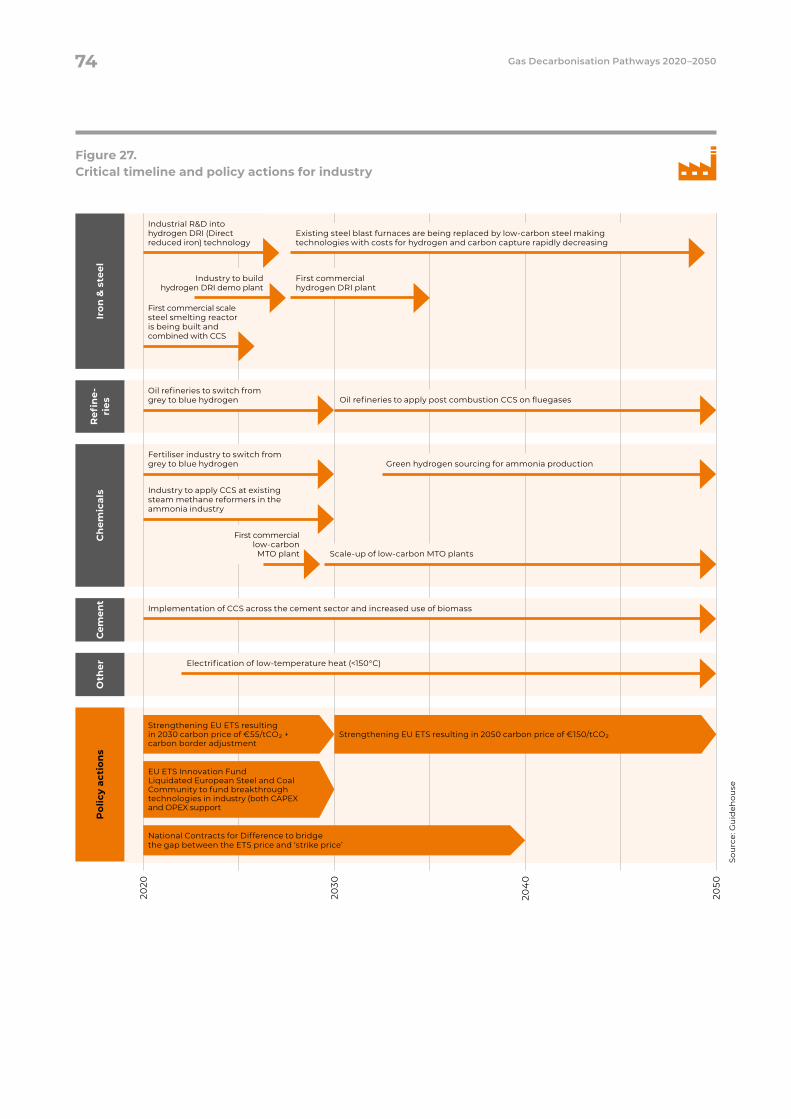
Figure 27. Critical timeline and policy actions for industry
Po
licy
acti
ons
Iron
& s
teel
Refi
ne-
ries
C
hem
ical
sC
emen
tO
ther
Oil refineries to switch from grey to blue hydrogen
Implementation of CCS across the cement sector and increased use of biomass
Electrification of low-temperature heat (<150°C)
Strengthening EU ETS resulting in 2030 carbon price of €55/tCO2 + carbon border adjustment
EU ETS Innovation FundLiquidated European Steel and Coal Community to fund breakthrough technologies in industry (both CAPEX and OPEX support
Strengthening EU ETS resulting in 2050 carbon price of €150/tCO2
National Contracts for Difference to bridge the gap between the ETS price and ‘strike price’
2020
2030
204
0
2050
Oil refineries to apply post combustion CCS on fluegases
Sou
rce:
Gu
ideh
ouse
First commercial scale steel smelting reactor is being built and combined with CCS
Industrial R&D into hydrogen DRI (Direct reduced iron) technology
Existing steel blast furnaces are being replaced by low-carbon steel making technologies with costs for hydrogen and carbon capture rapidly decreasing
First commercial hydrogen DRI plant
Industry to build hydrogen DRI demo plant
Fertiliser industry to switch from grey to blue hydrogen
Industry to apply CCS at existing steam methane reformers in the ammonia industry
Green hydrogen sourcing for ammonia production
First commercial low-carbon
MTO plant Scale-up of low-carbon MTO plants
74 Gas Decarbonisation Pathways 2020–2050
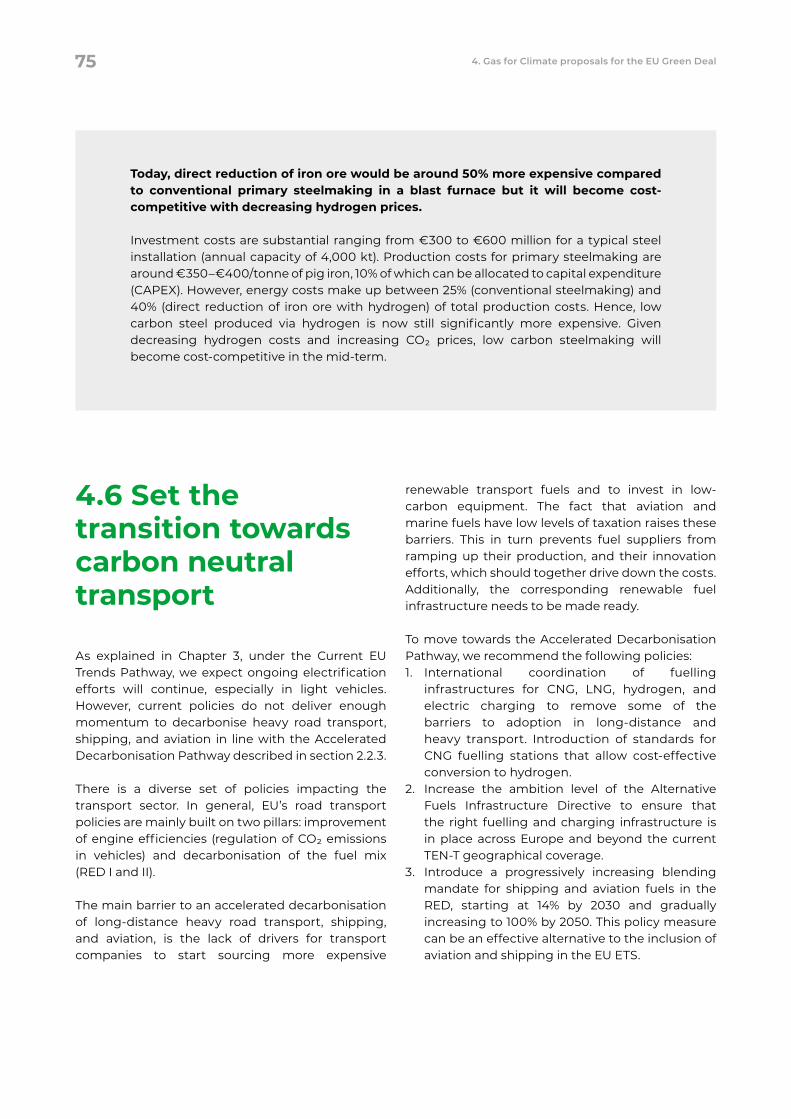
4.6 Set the transition towards carbon neutral transport
As explained in Chapter 3, under the Current EU Trends Pathway, we expect ongoing electrification efforts will continue, especially in light vehicles. However, current policies do not deliver enough momentum to decarbonise heavy road transport, shipping, and aviation in line with the Accelerated Decarbonisation Pathway described in section 2.2.3.
There is a diverse set of policies impacting the transport sector. In general, EU’s road transport policies are mainly built on two pillars: improvement of engine efficiencies (regulation of CO2 emissions in vehicles) and decarbonisation of the fuel mix (RED I and II).
The main barrier to an accelerated decarbonisation of long-distance heavy road transport, shipping, and aviation, is the lack of drivers for transport companies to start sourcing more expensive
renewable transport fuels and to invest in low-carbon equipment. The fact that aviation and marine fuels have low levels of taxation raises these barriers. This in turn prevents fuel suppliers from ramping up their production, and their innovation efforts, which should together drive down the costs. Additionally, the corresponding renewable fuel infrastructure needs to be made ready.
To move towards the Accelerated Decarbonisation Pathway, we recommend the following policies:1. International coordination of fuelling
infrastructures for CNG, LNG, hydrogen, and electric charging to remove some of the barriers to adoption in long-distance and heavy transport. Introduction of standards for CNG fuelling stations that allow cost-effective conversion to hydrogen.
2. Increase the ambition level of the Alternative Fuels Infrastructure Directive to ensure that the right fuelling and charging infrastructure is in place across Europe and beyond the current TEN-T geographical coverage.
3. Introduce a progressively increasing blending mandate for shipping and aviation fuels in the RED, starting at 14% by 2030 and gradually increasing to 100% by 2050. This policy measure can be an effective alternative to the inclusion of aviation and shipping in the EU ETS.
Today, direct reduction of iron ore would be around 50% more expensive compared to conventional primary steelmaking in a blast furnace but it will become cost-competitive with decreasing hydrogen prices.
Investment costs are substantial ranging from €300 to €600 million for a typical steel installation (annual capacity of 4,000 kt). Production costs for primary steelmaking are around €350–€400/tonne of pig iron, 10% of which can be allocated to capital expenditure (CAPEX). However, energy costs make up between 25% (conventional steelmaking) and 40% (direct reduction of iron ore with hydrogen) of total production costs. Hence, low carbon steel produced via hydrogen is now still significantly more expensive. Given decreasing hydrogen costs and increasing CO2 prices, low carbon steelmaking will become cost-competitive in the mid-term.
75 4. Gas for Climate proposals for the EU Green Deal
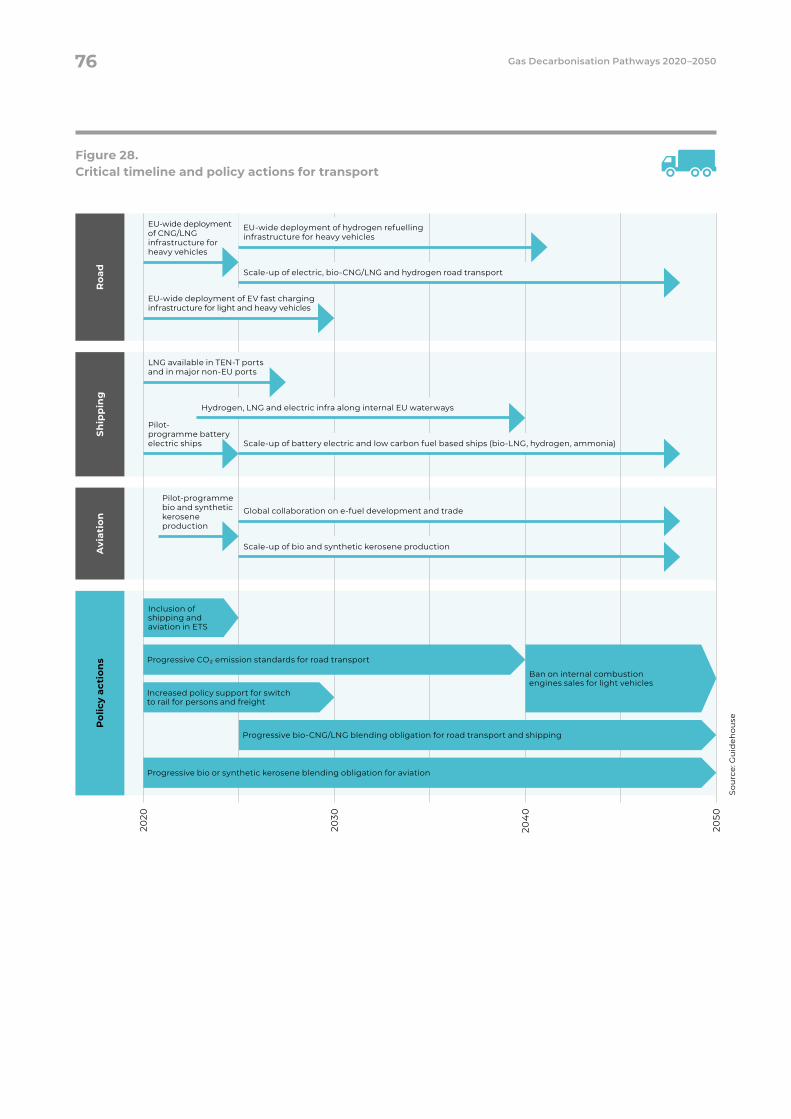
Figure 28. Critical timeline and policy actions for transport
2020
2030
204
0
2050
Roa
dA
viat
ion
Pilot-programme bio and synthetic kerosene production
Scale-up of bio and synthetic kerosene production
Global collaboration on e-fuel development and trade
Ship
pin
gP
olic
y ac
tion
s Progressive CO2 emission standards for road transport
Progressive bio or synthetic kerosene blending obligation for aviation
Increased policy support for switch to rail for persons and freight
Inclusion of shipping and aviation in ETS
Ban on internal combustion engines sales for light vehicles
Progressive bio-CNG/LNG blending obligation for road transport and shippingSo
urc
e: G
uid
ehou
se
EU-wide deployment of EV fast charging infrastructure for light and heavy vehicles
EU-wide deployment of CNG/LNG infrastructure for heavy vehicles
Scale-up of electric, bio-CNG/LNG and hydrogen road transport
EU-wide deployment of hydrogen refuelling infrastructure for heavy vehicles
LNG available in TEN-T ports and in major non-EU ports
Hydrogen, LNG and electric infra along internal EU waterways
Scale-up of battery electric and low carbon fuel based ships (bio-LNG, hydrogen, ammonia)
Pilot- programme battery electric ships
76 Gas Decarbonisation Pathways 2020–2050
4.7 Ensure continuous power supply with gas-fired power plants
Electrifying the energy system is essential to achieving a net-zero emissions EU energy system. As explained in section 2.3, the share of electricity from renewable sources is already increasing; however, the decarbonisation of the EU power system suggests fundamental changes in the way electricity will be generated, stored, and transported. With wind and solar as the mainstay of future EU renewable electricity production, the intermittency of these renewable electricity generation sources requires smarter electricity grids, widespread introduction of flexibility measures, and higher levels of (seasonal) storage and backup capacity. Increasing electrification also requires upgrading electricity distribution and transmission infrastructure to meet demand increase, and to cope with more frequent, less predictable, and higher peaks on the supply
side. However, demand response technologies, batteries, and pumped hydro storage will provide some of the flexibility needed in the electricity system for a short period. The Gas for Climate 2050 Optimised Gas end state sees a role for gas-fired backup generation for longer-term storage with a limited number of cycles.
In the power sector, the major contribution to emission reductions should come from the increased deployment of renewable electricity generation. The Accelerated Decarbonisation Pathway suggests an increase of renewable electricity generation to 60%-70% of total electricity generation in 2030 and full decarbonisation of the power sector around 2045.
Only an additional €60 is required to fly carbon neutral from Frankfurt to Rome
The distance from Frankfurt to Rome is about 1,000 km. For most Europeans, this is too far to travel by train. Since the aviation market is dealing with intense competition, the price for a ticket is important. The current ticket price is €230. With an ETS price for aviation of €150/tCO2 this ticket price will become around €275. Our analysis shows that switching to 100% bio jet will lead to an increased ticket price of €290 based on 2030 price levels. If we move towards 2050 to a 50% bio jet and 50% e-fuel situation, the ticket price will increase to €300. In other words, for about €60 euros extra compared to current price, the flight from Frankfurt to Rome can be carbon neutral in 2030. At current bio jet price levels, this would an additional cost of around €100.
In 2030 60%–70% of the electricity generation will come from renewable sources
77 4. Gas for Climate proposals for the EU Green Deal
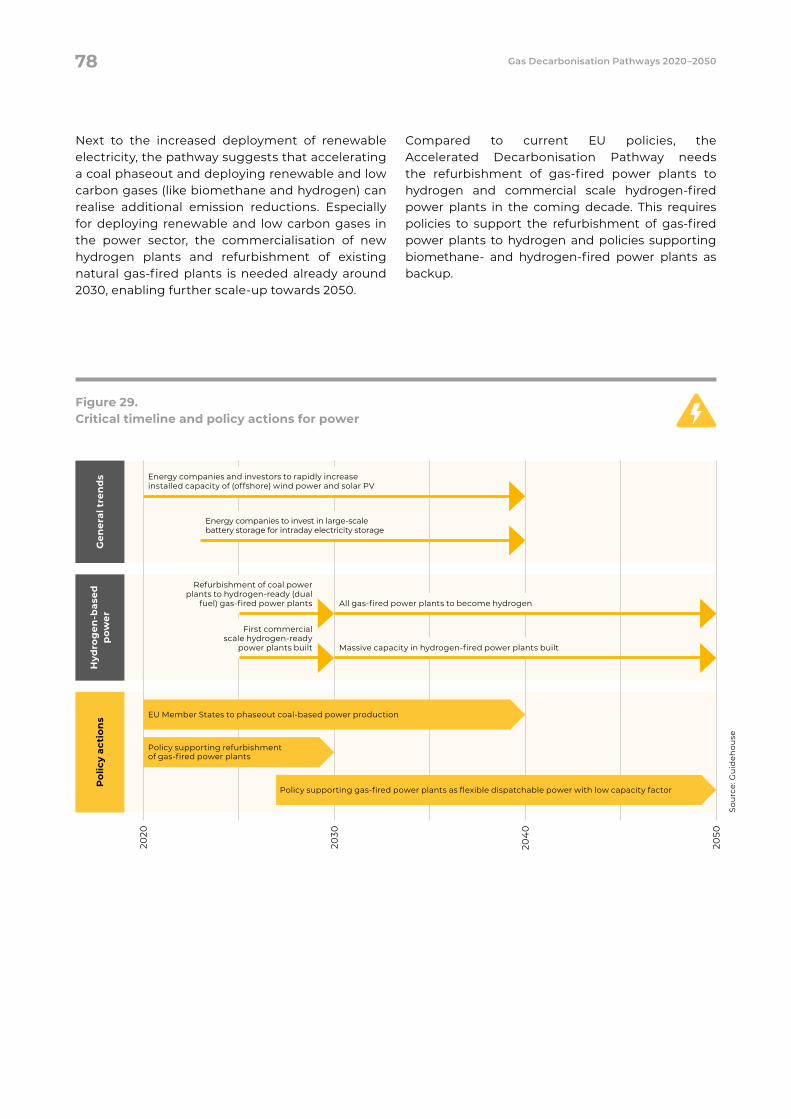
Next to the increased deployment of renewable electricity, the pathway suggests that accelerating a coal phaseout and deploying renewable and low carbon gases (like biomethane and hydrogen) can realise additional emission reductions. Especially for deploying renewable and low carbon gases in the power sector, the commercialisation of new hydrogen plants and refurbishment of existing natural gas-fired plants is needed already around 2030, enabling further scale-up towards 2050.
Compared to current EU policies, the Accelerated Decarbonisation Pathway needs the refurbishment of gas-fired power plants to hydrogen and commercial scale hydrogen-fired power plants in the coming decade. This requires policies to support the refurbishment of gas-fired power plants to hydrogen and policies supporting biomethane- and hydrogen-fired power plants as backup.
Figure 29. Critical timeline and policy actions for power
Po
licy
acti
ons
Gen
eral
tre
nd
sH
ydro
gen
-bas
ed
pow
er
Refurbishment of coal power plants to hydrogen-ready (dual
fuel) gas-fired power plants
First commercial scale hydrogen-ready
power plants built
All gas-fired power plants to become hydrogen
Massive capacity in hydrogen-fired power plants built
EU Member States to phaseout coal-based power production
Policy supporting refurbishment of gas-fired power plants
Policy supporting gas-fired power plants as flexible dispatchable power with low capacity factor
2020
2030
204
0
2050
Sou
rce:
Gu
ideh
ouse
Energy companies to invest in large-scale battery storage for intraday electricity storage
Energy companies and investors to rapidly increase installed capacity of (offshore) wind power and solar PV
78 Gas Decarbonisation Pathways 2020–2050
5. What if the future develops differently: Alternatives to the central pathway
Key takeaways → Reaching a net-zero emissions energy system by 2050 requires action across many levels. If developments stagnate in specific sectors, this places additional pressure on alternative technologies, different sectors, and the need to source renewable energy from outside Europe.
→ However, if countries around the world begin to work towards meeting the Paris Agreement goals, shares of renewable energy will become much higher much faster all over the world. Renewable electricity will become cheaper and more abundantly available, as will green hydrogen production and biomethane, including from gasification.
→ In the Global Climate Action Pathway, technology costs will decrease faster, both on the demand side (e.g. chemical industry decarbonisation and hydrogen trucks) and the supply side (e.g. in biomethane from gasification and imported green and blue hydrogen). This provides a major upside compared to the Accelerated Decarbonisation Pathway.
The Accelerated Decarbonisation Pathway is based on the assumptions that decarbonisation of the EU energy system is largely driven by governments and companies within the EU, and that renewable and low carbon gases almost exclusively come from domestic EU sources. However, developments for the different sectors can also go slower or move in different directions. If so, this increases the need for alternative technologies or poses additional pressure on other sectors.
This chapter describes the potentially different developments in the supply of biomethane and hydrogen, as well as in the decarbonisation of buildings, industry, transport, and power generation. Next, it provides insights in the Global Climate Action Pathway, which details how decarbonisation can be accelerated if countries around the world act towards meeting the Paris Agreement goals.
To unlock Europe’s full biomethane potential, tens of thousands of European farmers must adopt sustainable agricultural cultivation practices that enable sustainable sequential cropping of biogas feedstock. The technology development of thermal gasification plants is essential. When these developments fall behind, this will impact the amount of biomethane available in the system. The lower production of biomethane within the EU means that biomethane should be imported (e.g. from Ukraine and Belarus) or be compensated through other low carbon options, such as the increased deployment of hydrogen, stronger electrification, or increased use of other bio-energy carriers. Therefore, the resulting energy system must deal with higher import dependencies, more blue hydrogen for longer periods, stronger electrification, and likely increased energy system costs. The resilience and robustness of the overall pathway can be ensured by scaling up biomethane rapidly: if developments in energy efficiency and renewable electricity generation fall short, sufficient biomethane will ensure that no fossil energy is needed as alternative.
The hydrogen economy is in its infancy. The development of blue hydrogen in the current decade is key for reaching the 2030 target, limiting cumulative CO2 emissions, and the expansion of hydrogen technologies in the various demand sectors, thus paving the way for the use of green hydrogen in the 2030s. If deployment falls behind, this will hinder hydrogen’s role in the decarbonisation of the EU energy system. Future use of green hydrogen also depends on its availability. Scaling up of wind and solar in Europe
is of key importance: If sufficient capacity is not developed in addition to what is needed for direct electricity consumption, which already requires a jump in annual capacity additions, Europe will have to rely on importing green hydrogen or it will need to develop even more blue hydrogen production. Consequently, the transition towards a fully renewable energy system will take more time.
Achieving full decarbonisation of Europe’s buildings is challenging because of the long renovation cycle and a large number of individual actors. In the next decades, renovation rates should increase strongly. If such a renovation wave stays behind, this hinders the deployment of all-electric heat pumps in buildings without gas or district heating connection. It also lowers the potential benefits of the hybrid heat pump, because the share of heat that can be covered with electricity will be lower. In this case it will be important to keep attention on a possible alternative: to focus less on insulation and more on renewable heating technologies. For example, hydrogen fuel cells, gas heat pumps, or boilers could be applied in specific situations where (hybrid) heat pump application turns out to be difficult. These technologies could also be applied in combination with limited insulation, although this will put additional pressure on the supply of low carbon renewable gases and on the possibility to use them in other sectors.
Industry’s decarbonisation relies on the development of new, low carbon production technologies. Several investments in industry will happen in this decade. If new technologies are not ready at scale early enough, it means that there will be fewer deployments of low carbon production technologies until 2050, increasing the need to apply CCS across industry, decarbonise the fuel (such as using biofuels or synthetic fuels), or mitigate remaining emissions by additional negative emissions in other sectors, for example though bio-energy with carbon capture and storage (BECCS) and soil organic carbon accumulation.
Decarbonising road transport and shipping is possible through different energy carriers, such as electricity, bio-CNG, bio-LNG, ammonia, hydrogen, and even liquid biofuels. In case electrification of light transport, development of fuel cells in heavy transport, or the deployment of bio-LNG in heavy transport and shipping is slower than envisioned, this will increase the need for the other energy carriers, like the use of liquid biofuels or even more bio-CNG and bio-LNG in road transport, which puts pressure on the available biomass.
80 Gas Decarbonisation Pathways 2020–2050
For shipping, the extent to which bio-LNG is the most economical option depends on how alternative technologies (like ammonia fuel cells) develop, and to what extent existing LNG fuelling infrastructure is sufficient to meet demand in 2050. Ships invested in today will likely be part of the 2050 fleet. When new low carbon technologies come to market, ship owners may choose to accelerate write-off or retrofit their fleet. A sensitivity analysis included in Appendix 5 provides indications that, after BEV, bio-LNG may possibly not always be the most economic fuel to decarbonise a ship. Ammonia-based propulsion systems could be a way forward as well, depending on the size and operating conditions of the ship in question. However, other factors besides operating costs, such as safety of operation, NOx emissions, and toxicity and perception thereof, are critical for large-scale deployment. The global sector is undergoing a transformation to lower emitting fuels and is witnessing aggressive cost reductions of low carbon technologies. If ammonia fuel cells were to gain market share in long-distance shipping, this reduces the demand for bio-LNG in the shipping sector but increases the demand for hydrogen to produce ammonia within or outside Europe. A reduction in bio-LNG demand in shipping presents opportunities to use more renewable methane in other sectors, such as the buildings or power sectors, or gives robustness to the decarbonisation pathways in case renewable methane production does not reach its full potential by 2050.
Major upside when other parts of the world join in the development: The Global Climate Action Pathway
While developments can be slow and go in different directions, it should be noted that the Accelerated Decarbonisation Pathway does not depend directly on what happens in other parts of the world. However, 195 countries around the world joined the Paris Agreement, and they all face the challenge of rapid decarbonisation in coming decades. The challenges vary by region, but there are similarities regarding the energy system. If countries around the world work towards meeting the Paris Agreement goals, high shares of renewable energy will play a major role, and so will electrification. In many places, the role that renewable and low carbon
gases can play is increasingly recognised. Examples include interest in biogas and biomethane in China, hydrogen initiatives developing worldwide, and the debate on the future role of gas emerging in North America.
Decarbonisation efforts within the EU will create positive external effects such as knowledge transfer and economies of scale that are likely to accelerate global carbon action. The announced introduction of a carbon border adjustment mechanism, while motivated by the necessity to avoid carbon leakage despite elevated future carbon prices in the EU ETS, will also inevitably serve as an incentive to decarbonise economies outside the scheme, to the extent that these economies are exporting to countries participating in it.
The Global Climate Action Pathway explores how increased climate mitigation actions in other continents can be beneficial for the speed, scale, and cost of renewable and low carbon gas developments in the EU’s energy transition. Global innovation efforts speed up the market readiness of novel technologies. Technology costs will decrease faster on the demand side (e.g. MTO and hydrogen trucks) and the supply side (e.g. in biomethane from gasification and green and blue hydrogen). This provides a major upside for the societal costs of the energy transition compared to the Accelerated Decarbonisation Pathway. For example, with aggressive reductions in capital costs for electrolyser systems and renewable power, production costs for green hydrogen could fall to €14–€32/MWh by 2050, i.e. below €1/kg.108 Such steep reductions in
Developments can go significantly faster when other parts of the world join in the development of renewable and low carbon gas
108 For assumptions see Appendix 2. Estimates are in line with e.g. Bloomberg NEF (2020). Hydrogen Economy: Key Messages. https://data.bloomberglp.com/professional/sites/24/BNEF-Hydrogen-Economy-Outlook-Key-Messages-30-Mar-2020.pdf
81 5. What if the future develops differently: Alternatives to the central pathway
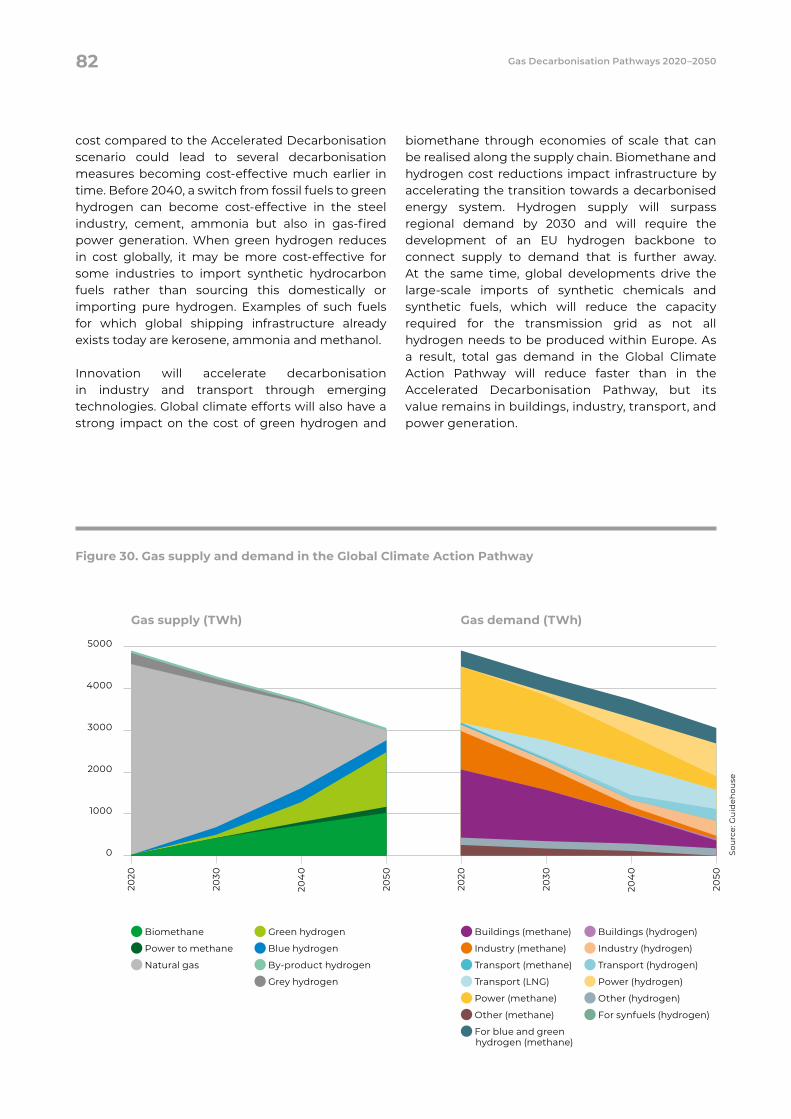
cost compared to the Accelerated Decarbonisation scenario could lead to several decarbonisation measures becoming cost-effective much earlier in time. Before 2040, a switch from fossil fuels to green hydrogen can become cost-effective in the steel industry, cement, ammonia but also in gas-fired power generation. When green hydrogen reduces in cost globally, it may be more cost-effective for some industries to import synthetic hydrocarbon fuels rather than sourcing this domestically or importing pure hydrogen. Examples of such fuels for which global shipping infrastructure already exists today are kerosene, ammonia and methanol.
Innovation will accelerate decarbonisation in industry and transport through emerging technologies. Global climate efforts will also have a strong impact on the cost of green hydrogen and
biomethane through economies of scale that can be realised along the supply chain. Biomethane and hydrogen cost reductions impact infrastructure by accelerating the transition towards a decarbonised energy system. Hydrogen supply will surpass regional demand by 2030 and will require the development of an EU hydrogen backbone to connect supply to demand that is further away. At the same time, global developments drive the large-scale imports of synthetic chemicals and synthetic fuels, which will reduce the capacity required for the transmission grid as not all hydrogen needs to be produced within Europe. As a result, total gas demand in the Global Climate Action Pathway will reduce faster than in the Accelerated Decarbonisation Pathway, but its value remains in buildings, industry, transport, and power generation.
Figure 30. Gas supply and demand in the Global Climate Action Pathway
Sou
rce:
Gu
ideh
ouse
Biomethane
Power to methane
Natural gas
Green hydrogen
Blue hydrogen
By-product hydrogen
Grey hydrogen
Buildings (methane)
Industry (methane)
Transport (methane)
Transport (LNG)
Power (methane)
Other (methane)
For blue and green hydrogen (methane)
Buildings (hydrogen)
Industry (hydrogen)
Transport (hydrogen)
Power (hydrogen)
Other (hydrogen)
For synfuels (hydrogen)
Gas supply (TWh) Gas demand (TWh)
5000
4000
3000
2000
1000
0
2020
2050
204
0
2030
2020
2050
204
0
2030
82 Gas Decarbonisation Pathways 2020–2050

Disclaimer
This report was prepared by Navigant Netherlands B.V.. Please note that per 11 October 2019 Navigant was acquired by Guidehouse. This new combination bolsters our capabilities to serve you even better. We continue operating without
changes to our company data, such as financial information and VAT-number, but we expect that in April 2020, we will change the name of our legal entity to Guidehouse Netherlands B.V.. For the avoidance of doubt, our name change
does not have any legal impact; from our side the same party remains a party to the contract with you, as only the name of our legal entity changes.
For more information, please contact the Gas for Climate member organisations:
CIB - Consorzio Italiano BiogasAlessandro Vitale+39 0371/4662633 [email protected]
EnagásAlexandra Issacovitch+34 [email protected]
EnerginetNicolai Sørensen+45 [email protected]
European Biogas AssociationAngela Sainz Arnau +32 4001089 [email protected]
Fluxys BelgiumRudy van Beurden+32 2 282 72 [email protected]
GasunieSebastian Kaemmer+32 2 234 [email protected]
GRTgazJean Marc Brimont+33 6 89 87 16 [email protected]
ONTRAS Gastransport GmbHJohannes Stolle+49 [email protected]
OGEChristian Page+49 201 3642–[email protected]
SnamSalvatore Ricco+39 335 770 [email protected]
SwedegasIgor Vlassiouk+46 70 560 18 [email protected]
TerégaMarie Claire Aoun+33 5 59 13 32 [email protected]
For questions about the study, please reach out to: Daan Peters – [email protected]

© 2020 Guidehouse
Gas for Climate Gas decarbonisation pathways 2020–2050 Appendix April 2020
Gas for Climate / Gas decarbonisation pathways appendix 2 2020–2050
Table of Contents
Biomethane Deployment Pathways ....................................................... 6
Introduction to Gas for Climate analysis ...................................................................................................... 7
1.1.1 Current situation of biomethane .................................................................................................................................... 7 1.1.2 Biomethane in 2050 based on the Gas for Climate Optimised Gas scenario ................................. 8
Biomethane pathway under current EU climate and energy policies ............................................. 10
1.2.1 EU policies ................................................................................................................................................................................... 10 1.2.2 Regional differences today ............................................................................................................................................... 11 1.2.3 Biomethane technology and price developments ......................................................................................... 12 1.2.4 Pathway towards 2050 ....................................................................................................................................................... 13
Accelerated Decarbonisation Pathway – biomethane .......................................................................... 13
1.3.1 The European Green Deal and related developments .................................................................................. 13 1.3.2 Technology and price development for biomethane.................................................................................... 17
Global Climate Action Pathway – biomethane ........................................................................................ 18
1.4.1 Expected technology and price development .................................................................................................. 18
Hydrogen Deployment Pathways ......................................................... 19
Introduction ........................................................................................................................................................ 20
2.1.1 Current situation .................................................................................................................................................................... 20 2.1.2 Gas for Climate 2050 Optimised Gas end state ................................................................................................. 21
Hydrogen pathway under current EU climate and energy policies ................................................. 21
2.2.1 EU Policies .................................................................................................................................................................................. 22 2.2.2 Regional differences ........................................................................................................................................................... 23 2.2.3 Technological and cost developments ................................................................................................................. 24 2.2.4 Societal acceptance ........................................................................................................................................................... 24 2.2.5 Pathway towards 2050 ..................................................................................................................................................... 25
Accelerated Decarbonisation Pathway – Hydrogen ............................................................................. 25
2.3.1 Technological and cost developments ................................................................................................................... 27 2.3.2 Societal acceptance ............................................................................................................................................................ 29 2.3.3 Pathway towards the 2050 Optimised Gas end state ................................................................................. 29 2.3.4 Critical timeline ....................................................................................................................................................................... 31
Global Climate Action Pathway – hydrogen ........................................................................................... 32
2.4.1 Technological and cost developments .................................................................................................................. 33 2.4.2 Societal acceptance ............................................................................................................................................................ 36 2.4.3 Pathway towards 2050 ..................................................................................................................................................... 36
Gas for Climate / Gas decarbonisation pathways appendix 3 2020–2050
Buildings Decarbonisation Pathways .................................................. 37
Introduction ........................................................................................................................................................ 38
3.1.1 Current situation ..................................................................................................................................................................... 39 3.1.2 Gas for Climate 2050 Optimised Gas end state ................................................................................................ 41
Buildings pathway under current EU climate and energy policies ................................................. 42
3.2.1 EU policies ................................................................................................................................................................................. 43 3.2.2 Regional differences .......................................................................................................................................................... 43 3.2.3 Technological developments ...................................................................................................................................... 44 3.2.4 Pathway towards 2050 .................................................................................................................................................... 46
Accelerated Decarbonisation Pathway – Buildings .............................................................................. 49
3.3.1 Implications of the European Green Deal for buildings ............................................................................ 49 3.3.2 Pathway towards the 2050 Optimised Gas end state ................................................................................ 50 3.3.3 Critical timeline ....................................................................................................................................................................... 51 3.3.4 Policy recommendations ................................................................................................................................................ 53
Global Climate Action Pathway .................................................................................................................. 56
3.4.1 Expected technological and cost developments ............................................................................................ 56 3.4.2 Pathway towards 2050 ..................................................................................................................................................... 57
Industry Decarbonisation Pathways ....................................................59
Introduction ......................................................................................................................................................... 61
4.1.1 Current situation......................................................................................................................................................................61 4.1.2 Gas for Climate 2050 Optimised Gas end state ................................................................................................ 63
Industry pathway under current EU climate and energy policies ................................................... 63
4.2.1 EU policies .................................................................................................................................................................................. 63 4.2.2 Regional differences ......................................................................................................................................................... 64 4.2.3 Technological and cost developments ................................................................................................................. 65 4.2.4 Pathway towards 2050 .................................................................................................................................................... 65
Accelerated Decarbonisation Pathway – Industry................................................................................ 66
4.3.1 Implication of the EU Green Deal for industry ................................................................................................. 66 4.3.2 Technological and cost developments ................................................................................................................ 67 4.3.3 Pathway towards the 2050 Optimised Gas end state................................................................................ 67 4.3.4 Critical timeline .................................................................................................................................................................... 68
Global Climate Action Pathway – industry .............................................................................................. 69
4.4.1 Global CO2 prices .................................................................................................................................................................. 69 4.4.2 Technological and cost developments ................................................................................................................ 69 4.4.3 Pathway towards 2050.................................................................................................................................................... 70
Transport Decarbonisation Pathways ................................................. 71
Gas for Climate / Gas decarbonisation pathways appendix 4 2020–2050
Introduction ........................................................................................................................................................ 74
5.1.1 Current situation .................................................................................................................................................................... 74 5.1.2 Gas for Climate 2050 Optimised Gas end state ............................................................................................... 74
Transport pathway under current EU climate and energy policies ................................................ 76
5.2.1 EU policies ................................................................................................................................................................................. 76 5.2.2 Regional differences today ........................................................................................................................................... 78 5.2.3 Pathway towards 2050 .................................................................................................................................................... 79
Accelerated Decarbonisation Pathway – Transport .............................................................................. 81
5.3.1 European Green Deal for transport ........................................................................................................................... 81 5.3.2 Pathway towards 2050 .................................................................................................................................................... 82 5.3.3 Critical timeline ..................................................................................................................................................................... 84 5.3.4 Policy recommendations ............................................................................................................................................... 86
Global Climate Action Pathway .................................................................................................................. 88
5.4.1 Global Action Pathway towards 2050 .................................................................................................................... 89
Additional background on transport ......................................................................................................... 90
5.5.1 Gas for Climate vision on transport in 2050........................................................................................................ 90 5.5.2 Current EU transport policies ........................................................................................................................................91 5.5.3 LNG and CNG use in transport .................................................................................................................................... 92 5.5.4 Fuel options in shipping .................................................................................................................................................. 93
Power Decarbonisation Pathways ....................................................... 98
Introduction ........................................................................................................................................................ 99
6.1.1 Current situation .................................................................................................................................................................... 99 6.1.2 Gas for Climate 2050 Optimised Gas end state ............................................................................................. 100
Electricity pathway under current EU climate and energy policies .............................................. 101
6.2.1 EU policies ................................................................................................................................................................................. 101 6.2.2 Regional differences today .......................................................................................................................................... 102 6.2.3 Pathway towards 2050 ................................................................................................................................................... 102
Accelerated Decarbonisation Pathway – Electricity .......................................................................... 103
6.3.1 The Green Deal’s implications for power ............................................................................................................ 103 6.3.2 Pathway towards 2050 Optimised Gas scenario ......................................................................................... 104 6.3.3 Critical timeline ................................................................................................................................................................... 104 6.3.4 Policy recommendations............................................................................................................................................. 106
Global Climate Action Pathway ................................................................................................................ 107
6.4.1 Pathway towards 2050 ....................................................................................................................................................107
Gas Infrastructure Pathways ................................................................. 108
Gas for Climate / Gas decarbonisation pathways appendix 5 2020–2050
Introduction ...................................................................................................................................................... 109
The role of gas grids in Europe today ...................................................................................................... 109
Gas infrastructure pathway under current EU policies ...................................................................... 112
7.3.1 Existing EU policies relevant for gas infrastructure ...................................................................................... 112 7.3.2 Gas infrastructure Pathway under current EU policies ............................................................................. 114
Accelerated decarbonisation pathway – gas infrastructure ............................................................ 116
7.4.1 EU Green Deal for infrastructure ............................................................................................................................... 118 7.4.2 Gas infrastructure developments from 2030 to 2050 ............................................................................... 120
Global Climate Action Pathway – gas infrastructure ......................................................................... 124
Hydrogen – methane blending .................................................................................................................. 124
EU natural gas consumption per member state .................................................................................. 125
Gas for Climate / Gas decarbonisation pathways appendix 6 2020–2050
Biomethane Deployment Pathways Key Takeaways
• EU biomethane production is small today, yet a significant sustainable potential exists for 2050. Current EU policies are insufficient to fully unlock this potential.
• Biomethane producers and energy companies should strive to bring down production costs, scale-up the size of biogas digesters, and invest in large-scale biomass gasification units. This requires additional policy incentives plus the creation of an international marketplace.
• Unlocking the full potential of sustainable biomethane depends on the extent to which investments in production capacity can be mobilised and the extent to which sustainable feedstock supply can be ensured, including through a scale-up of whether sequential cropping can be scaled up. Farming associations should pilot-test sequential cropping across Europe the Biogasdoneright concept outside of Italy and set up training and awareness raising programmes among farmers.
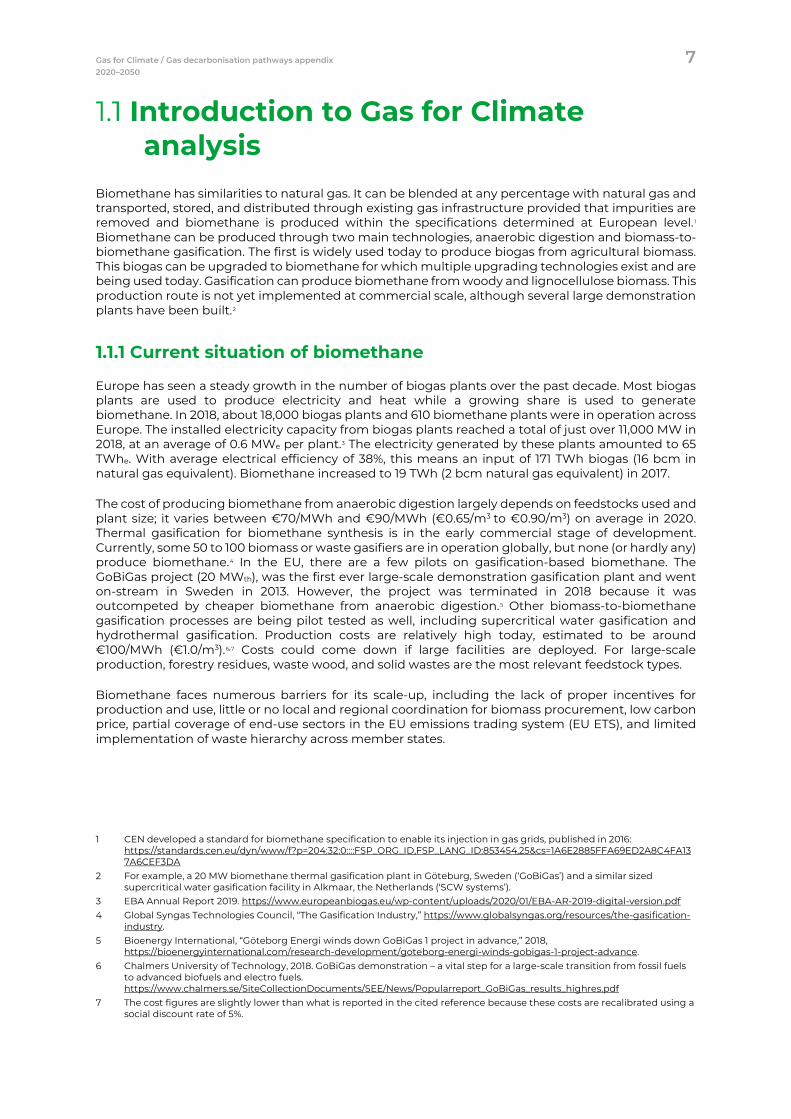
Gas for Climate / Gas decarbonisation pathways appendix 7 2020–2050
Introduction to Gas for Climate analysis
Biomethane has similarities to natural gas. It can be blended at any percentage with natural gas and transported, stored, and distributed through existing gas infrastructure provided that impurities are removed and biomethane is produced within the specifications determined at European level.1 Biomethane can be produced through two main technologies, anaerobic digestion and biomass-to-biomethane gasification. The first is widely used today to produce biogas from agricultural biomass. This biogas can be upgraded to biomethane for which multiple upgrading technologies exist and are being used today. Gasification can produce biomethane from woody and lignocellulose biomass. This production route is not yet implemented at commercial scale, although several large demonstration plants have been built.2
1.1.1 Current situation of biomethane
Europe has seen a steady growth in the number of biogas plants over the past decade. Most biogas plants are used to produce electricity and heat while a growing share is used to generate biomethane. In 2018, about 18,000 biogas plants and 610 biomethane plants were in operation across Europe. The installed electricity capacity from biogas plants reached a total of just over 11,000 MW in 2018, at an average of 0.6 MWe per plant.3 The electricity generated by these plants amounted to 65 TWhe. With average electrical efficiency of 38%, this means an input of 171 TWh biogas (16 bcm in natural gas equivalent). Biomethane increased to 19 TWh (2 bcm natural gas equivalent) in 2017.
The cost of producing biomethane from anaerobic digestion largely depends on feedstocks used and plant size; it varies between €70/MWh and €90/MWh (€0.65/m3 to €0.90/m3) on average in 2020. Thermal gasification for biomethane synthesis is in the early commercial stage of development. Currently, some 50 to 100 biomass or waste gasifiers are in operation globally, but none (or hardly any) produce biomethane.4 In the EU, there are a few pilots on gasification-based biomethane. The GoBiGas project (20 MWth), was the first ever large-scale demonstration gasification plant and went on-stream in Sweden in 2013. However, the project was terminated in 2018 because it was outcompeted by cheaper biomethane from anaerobic digestion.5 Other biomass-to-biomethane gasification processes are being pilot tested as well, including supercritical water gasification and hydrothermal gasification. Production costs are relatively high today, estimated to be around €100/MWh (€1.0/m3).6,7 Costs could come down if large facilities are deployed. For large-scale production, forestry residues, waste wood, and solid wastes are the most relevant feedstock types.
Biomethane faces numerous barriers for its scale-up, including the lack of proper incentives for production and use, little or no local and regional coordination for biomass procurement, low carbon price, partial coverage of end-use sectors in the EU emissions trading system (EU ETS), and limited implementation of waste hierarchy across member states.
1 CEN developed a standard for biomethane specification to enable its injection in gas grids, published in 2016:
https://standards.cen.eu/dyn/www/f?p=204:32:0::::FSP_ORG_ID,FSP_LANG_ID:853454,25&cs=1A6E2885FFA69ED2A8C4FA137A6CEF3DA
2 For example, a 20 MW biomethane thermal gasification plant in Göteburg, Sweden (‘GoBiGas’) and a similar sized supercritical water gasification facility in Alkmaar, the Netherlands (‘SCW systems’).
3 EBA Annual Report 2019. https://www.europeanbiogas.eu/wp-content/uploads/2020/01/EBA-AR-2019-digital-version.pdf 4 Global Syngas Technologies Council, “The Gasification Industry,” https://www.globalsyngas.org/resources/the-gasification-
industry. 5 Bioenergy International, “Göteborg Energi winds down GoBiGas 1 project in advance,” 2018,
https://bioenergyinternational.com/research-development/goteborg-energi-winds-gobigas-1-project-advance. 6 Chalmers University of Technology, 2018. GoBiGas demonstration – a vital step for a large-scale transition from fossil fuels
to advanced biofuels and electro fuels. https://www.chalmers.se/SiteCollectionDocuments/SEE/News/Popularreport_GoBiGas_results_highres.pdf
7 The cost figures are slightly lower than what is reported in the cited reference because these costs are recalibrated using a social discount rate of 5%.
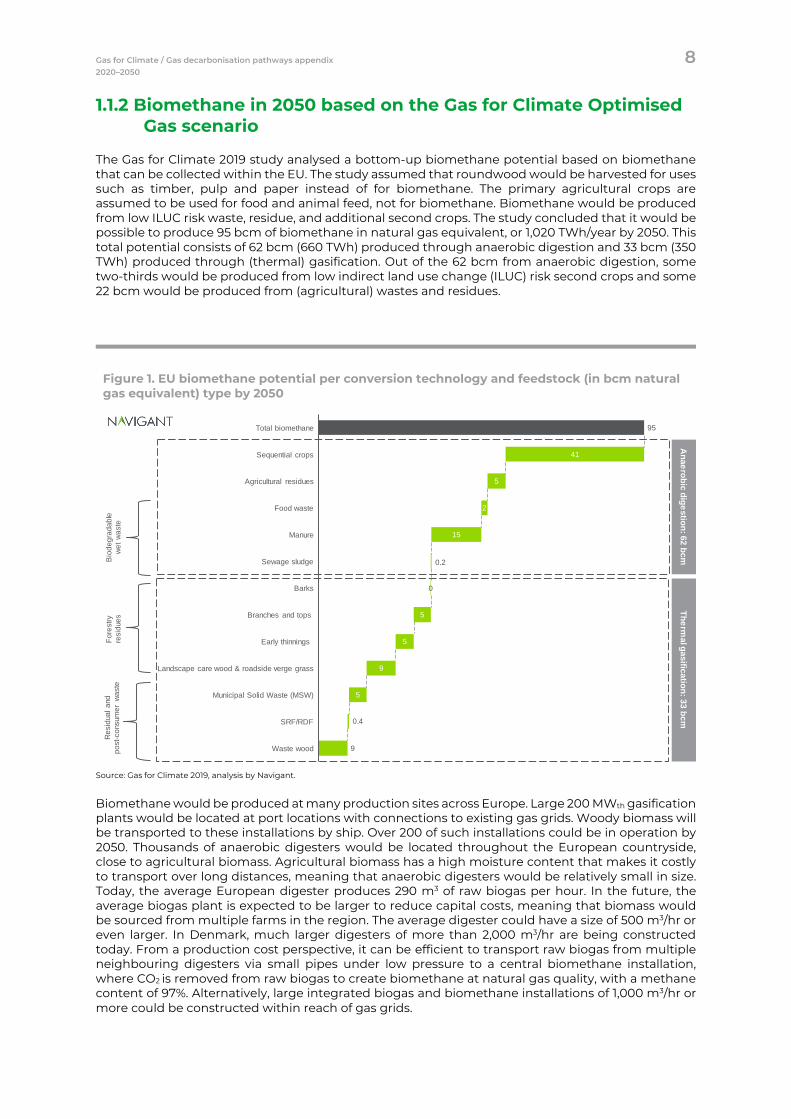
Gas for Climate / Gas decarbonisation pathways appendix 8 2020–2050
1.1.2 Biomethane in 2050 based on the Gas for Climate Optimised Gas scenario
The Gas for Climate 2019 study analysed a bottom-up biomethane potential based on biomethane that can be collected within the EU. The study assumed that roundwood would be harvested for uses such as timber, pulp and paper instead of for biomethane. The primary agricultural crops are assumed to be used for food and animal feed, not for biomethane. Biomethane would be produced from low ILUC risk waste, residue, and additional second crops. The study concluded that it would be possible to produce 95 bcm of biomethane in natural gas equivalent, or 1,020 TWh/year by 2050. This total potential consists of 62 bcm (660 TWh) produced through anaerobic digestion and 33 bcm (350 TWh) produced through (thermal) gasification. Out of the 62 bcm from anaerobic digestion, some two-thirds would be produced from low indirect land use change (ILUC) risk second crops and some 22 bcm would be produced from (agricultural) wastes and residues.
Figure 1. EU biomethane potential per conversion technology and feedstock (in bcm natural gas equivalent) type by 2050
Source: Gas for Climate 2019, analysis by Navigant.
Biomethane would be produced at many production sites across Europe. Large 200 MWth gasification plants would be located at port locations with connections to existing gas grids. Woody biomass will be transported to these installations by ship. Over 200 of such installations could be in operation by 2050. Thousands of anaerobic digesters would be located throughout the European countryside, close to agricultural biomass. Agricultural biomass has a high moisture content that makes it costly to transport over long distances, meaning that anaerobic digesters would be relatively small in size. Today, the average European digester produces 290 m3 of raw biogas per hour. In the future, the average biogas plant is expected to be larger to reduce capital costs, meaning that biomass would be sourced from multiple farms in the region. The average digester could have a size of 500 m3/hr or even larger. In Denmark, much larger digesters of more than 2,000 m3/hr are being constructed today. From a production cost perspective, it can be efficient to transport raw biogas from multiple neighbouring digesters via small pipes under low pressure to a central biomethane installation, where CO2 is removed from raw biogas to create biomethane at natural gas quality, with a methane content of 97%. Alternatively, large integrated biogas and biomethane installations of 1,000 m3/hr or more could be constructed within reach of gas grids.
95
9
41
5
2
15
5
5
9
5
Total biomethane
Sequential crops
Agricultural residues
Sewage sludge
Early thinnings
Manure
Food waste
0Barks
Branches and tops
Landscape care wood & roadside verge grass
Municipal Solid Waste (MSW)
SRF/RDF
Waste wood
Bio
degr
adab
le
wet
was
teFo
rest
ry
resi
dues
Res
idua
l and
po
st-c
onsu
mer
was
teA
naerobic digestion: 62 bcm
Thermal gasification: 33 bcm
0.2
0.4
Gas for Climate / Gas decarbonisation pathways appendix 9 2020–2050
Areas with a lot of animal husbandry can be interesting from a biomethane potential perspective, agricultural biomass is also available throughout the European countryside. Existing gas grids are particularly dense in some EU member states, while other countries have a more thinly spread gas pipeline network. It will not be possible to connect all the biomethane potential to gas grids. A certain share of digesters can be located far from existing gas grids and it would be costly to connect them to existing gas grids. Within the scope of the present study, no detailed analysis has been performed on this aspect; however, about two-thirds of the biomethane potential based on anaerobic digestion could find its way to Europe’s gas grids. This estimation could benefit from further in-depth analysis.
The large biomethane scale-up potential as described in the 2019 Gas for Climate study will Such scale-up will only be possible if production costs decrease, climate benefits are maximised and a sustainable feedstock supply is ensured. Navigant’s analysis shows that all biomethane can be zero emissions renewable gas by 2050, and any remaining life cycle emissions can be compensated by negative emissions created in agriculture on farms producing biomethane. It is important to properly map and mitigate methane leakage risks in biomethane production.
Biomethane has multiple benefits, including its ability to foster sustainable and more circular agriculture. One significant benefit of biomethane is its ability to generate negative emissions. Biomethane can be fed to blue hydrogen production facilities (steam methane reformers or autothermal reformers with CCS) to produce hydrogen and generate negative carbon emissions. To differentiate it from blue hydrogen that uses natural gas as feedstock, this hydrogen could be called climate positive hydrogen. The ability of biomethane to create negative emissions is significant because the most authoritative climate change scenarios show that the world needs significant negative emissions to keep global temperature increase well below 2°C.8 Negative emissions are needed not just during the coming decades but will still be needed after 2050. In terms of the scale-up pathway for climate positive hydrogen, it can be assumed that biomethane production needs to be scaled up during the 2020s and 2030s to satisfy direct demand for biomethane such as for the heating of buildings. Depending on the extent to which valuable direct biomethane uses are supplied, and the willingness of society to pay for various options to create negative emissions, climate positive hydrogen can start to play a meaningful role during the 2040s and continue after 2050.
In addition to ensuring sustainable production and minimising life cycle emissions, another necessary enabler of biomethane scale-up is a reduction in production costs. The Gas for Climate 2019 study concluded that significant cost reductions are possible. Production costs in both production routes can decrease from the current €70–€90/MWh to €47–€57/MWh in 2050. It is possible to use biomethane production sites to produce also power to methane by methanation of CO2 captured in biogas upgrading. The Gas for Climate 2019 potential showed a potential for this of about 150 TWh or 14 bcm natural gas equivalent, limited by the availability of cheap otherwise curtailed electricity to produce green hydrogen as feedstock. Even assuming cheap electricity as input, power to methane is a relatively expensive production route, yet it does enable a valorisation of otherwise emitted CO2 at biogas plants.
8 Chapter 2 of the IPPC Special Report on Global Warming of 1.5° (2018), shows that significant negative emissions are
required in most climate change mitigation scenarios to reach well below 2 degrees and 1.5 degrees. See: https://www.ipcc.ch/site/assets/uploads/sites/2/2019/05/SR15_Chapter2_Low_Res.pdf
Gas for Climate / Gas decarbonisation pathways appendix 10 2020–2050
Biomethane pathway under current EU climate and energy policies
Conclusion Current EU Trends
Current EU climate and energy policies can expect to drive an increase of biomethane production, especially in France, Italy, and Denmark where favourable biomethane support schemes exist. This could lead to a significant growth from the current 2 bcm of grid-injected biomethane to around 20 bcm by 2030. A continuation of today’s climate ambition towards 2050 (as stipulated in the EU Climate and Energy Package for 2030) is unlikely though to result in 95 bcm of biomethane by 2050, especially because building over 200 large gasification plants would require large capital investments which could only be mobilised with long-term policy stability and significant subsidies. While biomethane costs will decrease under current policies, it is unlikely that the low production cost levels as specified in the Gas for Climate 2019 study could be achieved.
1.2.1 EU policies
This pathway assumes that the current EU Climate and Energy Package for 2030 is fully implemented. This study expects that a full implementation of 2030 climate and energy framework could result in an increase in biomethane production volumes to roughly 20 bcm by 2030, this represents 4% of the current natural gas demand in the EU.9,10 Today, a quantity of 16 bcm of biogas is produced that is not upgraded to biomethane and injected to gas grids but is used locally to produce electricity and heat. Depending on how national subsidy schemes and mandates develop, it may be that an important part of this biogas production would be upgraded to biomethane. In addition, steady growth of new, larger integrated biogas-biomethane plants can be expected. On biogas to biomethane gasification, it is likely that the EU Innovation Fund will co-fund several large commercial-scale gasification projects before 2030. However, under current policies, no driver exists for the deployment of several dozens of those facilities, which cost several hundreds of million euros each.
Some of the key EU policies that could support this uptake of biomethane include the following:
• Renewable Energy Directive: The new Renewable Energy Directive (RED II) introduced a legally binding, EU-wide target of 32% renewable energy consumption by 2030 that includes specific targets for demand sectors. For the transport sector, RED II has a sub-target of 3.5% for advanced biofuels that would include biogas/biomethane produced through wastes and residues. The RED II has also capped the use of energy crops (only low indirect land-use change [ILUC] risk) to 2020 consumption levels, since the bulk of biofuels are currently produced through energy crops that are associated with sustainability concerns, including ILUC. The share of crop-based biofuels in each member state in 2020 will set the limit until 2030.11 RED II promotes the use of sustainably sourced biomass for energy production and requires that biogas and biomethane must reach 65%-80% greenhouse gas savings depending upon the demand sector, when measured against their fossil fuel comparators. RED II also requires member states to extend existing guarantees of origin schemes to include renewable gases such as biomethane and hydrogen. This would facilitate greater cross-border trade of such gases between member states.
9 Gross inland consumption of natural gas in the EU is around 18,100 PJ or 472 bcm in 2018,
https://appsso.eurostat.ec.europa.eu/nui/show.do?dataset=nrg_103m&lang=en. 10 This biomethane share is likely to originate from countries that are leading in biogas and/biomethane production and use.
The countries that are expected to significantly contribute towards achieving these production volumes are France, Italy, Netherlands, Germany, and the UK. These countries are responsible for 69% of the total EU natural gas consumption in 2018, see Appendix B for Gross Inland Natural Gas Consumption per EU member state.
11 The support to biofuels with a high risk of ILUC will be frozen at 2019 levels until 2023 and phased out completely in 2030. Through the adoption of a delegated act in March 2019, palm oil diesel is considered a high ILUC risk and will not count towards EU renewable energy targets by 2030.
Gas for Climate / Gas decarbonisation pathways appendix 11 2020–2050
Through these measures, there can be a reasonable demand for sustainably produced biomethane in the EU energy system from 2021 onwards.
• Innovation Fund: The Innovation Fund is one of the funding instruments under EU ETS that supports the European Commission’s strategic vision for a climate-neutral Europe by 2050. The Innovation Fund was established for 2021-2030 and is endowed with at least 450 million allowances that can amount to around 10 billion euro depending on the carbon price. It focuses on the demonstration of the next generation low carbon technologies and processes needed for the EU low carbon transition. The Innovation Fund can create the right incentives for companies and public authorities to invest in the commercialisation and upscale of thermal gasification technologies as these projects face funding issues for continuous operation and development. As a predecessor of the Innovation Fund, EU’s NER 300 initiative funded Verbio’s new technology, which uses 100% straw for biomethane production.12
With the transposition of EU legislation at a national level, we expect more countries to introduce specific targets on biomethane production and use (like France and Italy, see Section 1.2.2). These policies are likely to introduce a shift from electricity towards gas production, enabling the conversion of many existing biogas plants that are used for electricity to biomethane that can be injected into gas grids. With countries that lack similar support, the intrinsic value of biomethane could be realised in a free market. Organising a market of tradable biomethane certificates backed by guarantees of origin is a practical possibility for monetising the intrinsic value of biomethane. National legislation combined with growing market for certificates could establish a meaningful position of biomethane in the EU energy system.
1.2.2 Regional differences today
Many EU member states have already implemented policies supporting the production and use of biomethane. These policies encourage the deployment of biogas and biomethane plants and are expected to enable continued growth.
The number of biogas plants increased considerably. Germany has been the driving force for biogas development for many years and has the largest number of operational biogas plants (10,971), followed by Italy (1,655). France, Switzerland, the UK, and Czech Republic follow their lead with more than 500 plants each.
The number of biomethane plants increased from 187 plants in 2011 to around 550 plants in 2017. Germany had the highest number of biomethane plants (208)13, followed by the UK (92) and Sweden (70). In 2017, however, the number of biomethane plants had the fastest growth in France (+18),14 thanks to the introduction of favourable incentive schemes and renewable gas targets. France is followed by the Netherlands (+13) and Denmark (+8). Since 2019, Italy has seen a boost in new biomethane investments, with about 40 new plants expected to become operational during 2020.
12 Verbio press release, “New Verbio Plant for the Production of Biomethane from 100 Percent Straw Commissioned as
Scheduled,” 15 April, 2015, https://www.verbio.de/en/investor-relations/news-publications/press-releases/new-verbio-plant-for-the-production-of-biomethane-from-100-percent-straw/.
13 https://www.dena.de/fileadmin/dena/Dokumente/Veranstaltungen/EBC_2018/Praesentationen/11_Matthias_Edel_dena.pdf 14 The number of biomethane plants in France increased by 73% in 2018 to reach a total of 76 units,
https://www.biogasworld.com/news/biogas-biomethane-market-france/.
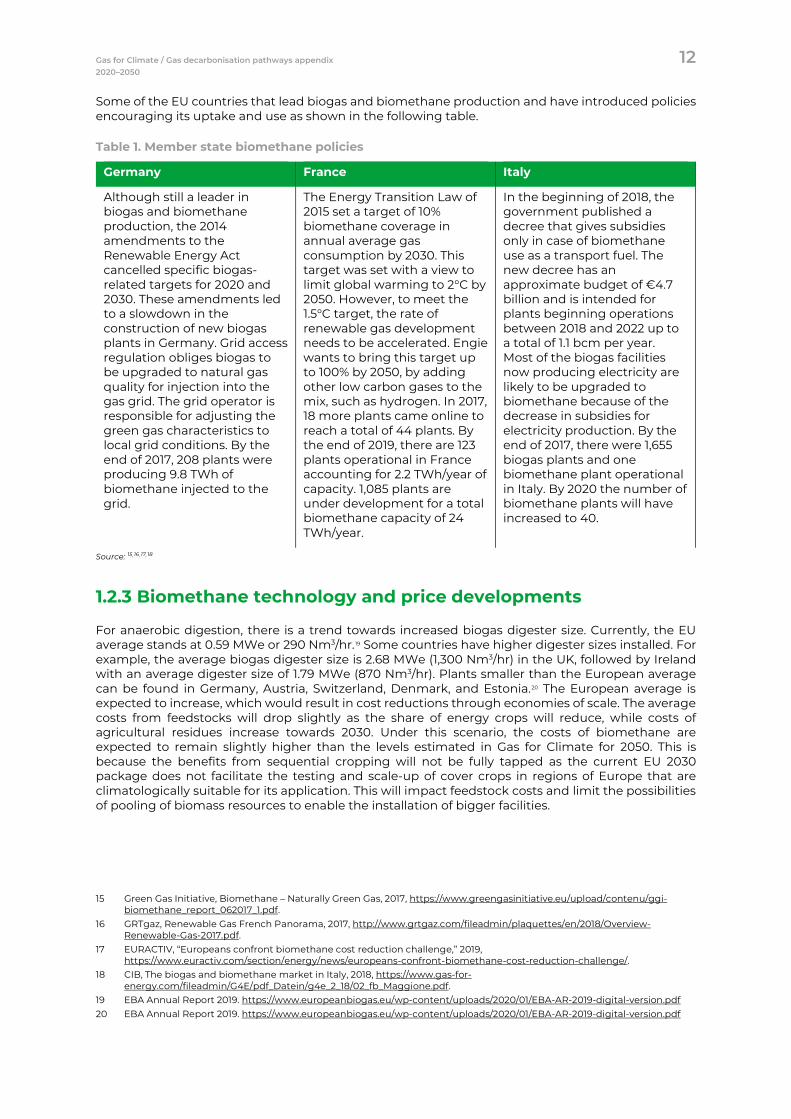
Gas for Climate / Gas decarbonisation pathways appendix 12 2020–2050
Some of the EU countries that lead biogas and biomethane production and have introduced policies encouraging its uptake and use as shown in the following table.
Table 1. Member state biomethane policies
Germany France Italy
Although still a leader in biogas and biomethane production, the 2014 amendments to the Renewable Energy Act cancelled specific biogas-related targets for 2020 and 2030. These amendments led to a slowdown in the construction of new biogas plants in Germany. Grid access regulation obliges biogas to be upgraded to natural gas quality for injection into the gas grid. The grid operator is responsible for adjusting the green gas characteristics to local grid conditions. By the end of 2017, 208 plants were producing 9.8 TWh of biomethane injected to the grid.
The Energy Transition Law of 2015 set a target of 10% biomethane coverage in annual average gas consumption by 2030. This target was set with a view to limit global warming to 2°C by 2050. However, to meet the 1.5°C target, the rate of renewable gas development needs to be accelerated. Engie wants to bring this target up to 100% by 2050, by adding other low carbon gases to the mix, such as hydrogen. In 2017, 18 more plants came online to reach a total of 44 plants. By the end of 2019, there are 123 plants operational in France accounting for 2.2 TWh/year of capacity. 1,085 plants are under development for a total biomethane capacity of 24 TWh/year.
In the beginning of 2018, the government published a decree that gives subsidies only in case of biomethane use as a transport fuel. The new decree has an approximate budget of €4.7 billion and is intended for plants beginning operations between 2018 and 2022 up to a total of 1.1 bcm per year. Most of the biogas facilities now producing electricity are likely to be upgraded to biomethane because of the decrease in subsidies for electricity production. By the end of 2017, there were 1,655 biogas plants and one biomethane plant operational in Italy. By 2020 the number of biomethane plants will have increased to 40.
Source: 15, 16, 17, 18
1.2.3 Biomethane technology and price developments
For anaerobic digestion, there is a trend towards increased biogas digester size. Currently, the EU average stands at 0.59 MWe or 290 Nm3/hr.19 Some countries have higher digester sizes installed. For example, the average biogas digester size is 2.68 MWe (1,300 Nm3/hr) in the UK, followed by Ireland with an average digester size of 1.79 MWe (870 Nm3/hr). Plants smaller than the European average can be found in Germany, Austria, Switzerland, Denmark, and Estonia.20 The European average is expected to increase, which would result in cost reductions through economies of scale. The average costs from feedstocks will drop slightly as the share of energy crops will reduce, while costs of agricultural residues increase towards 2030. Under this scenario, the costs of biomethane are expected to remain slightly higher than the levels estimated in Gas for Climate for 2050. This is because the benefits from sequential cropping will not be fully tapped as the current EU 2030 package does not facilitate the testing and scale-up of cover crops in regions of Europe that are climatologically suitable for its application. This will impact feedstock costs and limit the possibilities of pooling of biomass resources to enable the installation of bigger facilities.
15 Green Gas Initiative, Biomethane – Naturally Green Gas, 2017, https://www.greengasinitiative.eu/upload/contenu/ggi-
biomethane_report_062017_1.pdf. 16 GRTgaz, Renewable Gas French Panorama, 2017, http://www.grtgaz.com/fileadmin/plaquettes/en/2018/Overview-
Renewable-Gas-2017.pdf. 17 EURACTIV, “Europeans confront biomethane cost reduction challenge,” 2019,
https://www.euractiv.com/section/energy/news/europeans-confront-biomethane-cost-reduction-challenge/. 18 CIB, The biogas and biomethane market in Italy, 2018, https://www.gas-for-
energy.com/fileadmin/G4E/pdf_Datein/g4e_2_18/02_fb_Maggione.pdf. 19 EBA Annual Report 2019. https://www.europeanbiogas.eu/wp-content/uploads/2020/01/EBA-AR-2019-digital-version.pdf 20 EBA Annual Report 2019. https://www.europeanbiogas.eu/wp-content/uploads/2020/01/EBA-AR-2019-digital-version.pdf
Gas for Climate / Gas decarbonisation pathways appendix 13 2020–2050
For thermal gasification, first of a kind plants can be funded through the EU ETS Innovation Fund or through any unspent funds from the now terminated EU NER 300 subsidy programme. Countries like the Netherlands, Austria, the UK, and France have already built pilot scale plants and could be a front-runner in installation of first commercial-scale facilities. The plant construction and commissioning can take up to 4 years, which means that by 2025 there can be several commercial-scale facilities running across Europe. Continued deployment under current policies could lead to the construction of relatively large-scale standalone plants (Nth of a kind [NOAK]) with a production capacity of around 50 MWth by 2030. Costs for such commercial-scale facilities could come close to €80/MWh. The deployment would continue post-2030 resulting in further cost benefits from economies of scale and efficiency improvements. By 2050, the costs from (thermal) gasification will reach the Gas for Climate levels of €47/MWh under this scenario.
1.2.4 Pathway towards 2050
Presuming that current EU climate and energy ambition levels would continue up to 2050 it can be assumed that a moderate growth in biomethane will continue. This will most likely result in the mobilisation of far less than full EU biomethane potential by mid-century.
Especially anaerobic digestion from biomass cultivated through sequential cropping will not significantly grow without dedicated piloting, training, and awareness raising campaigns. Also, capital-intensive investments in biomass-to-biomethane gasification units are unlikely to scale-up to enable 200 large 200 MW gasification plants to be built.
As a consequence, the EU would inevitably continue to rely on natural gas even though volumes may decrease somewhat. The target of achieving a net-zero emissions EU energy system by mid-century would not be achieved.
Accelerated Decarbonisation Pathway – biomethane
Conclusion Accelerated Decarbonisation
The Accelerated Decarbonisation Pathway envisions that EU countries will implement higher targets on the production and use of biomethane as part of the EU Green Deal. There would be regional variation in targets and measures due to different gas supply demand characteristics per country, availability of feedstock resources, and existing infrastructure. Biomethane production could reach 10% of total EU gas consumption by 2030, or around 370 TWh, 35 bcm natural gas equivalent. In this scenario, a large uptake of sequential cropping could enable an accelerated biomethane production up to the level of 95 bcm as estimated in the Gas for Climate 2019 study. Significant biomethane production cost reductions can be expected.
1.3.1 The European Green Deal and related developments
The Accelerated Decarbonisation Pathway envisions a higher ambition level in climate and energy policy and a greater overall societal momentum to combat climate change. The Green Deal will revise the emission reduction target of 40% to a more ambitious 55% by 2030.21 This will probably lead to a more ambitious EU RED and EU ETS, which is likely to improve the relative business case of biomethane. In this context, biomethane from anaerobic digestion, can be scaled up much more rapidly.
21 The European Commission, “The European Green Deal,” 2019, https://ec.europa.eu/info/sites/info/files/european-green-
deal-communication_en.pdf.
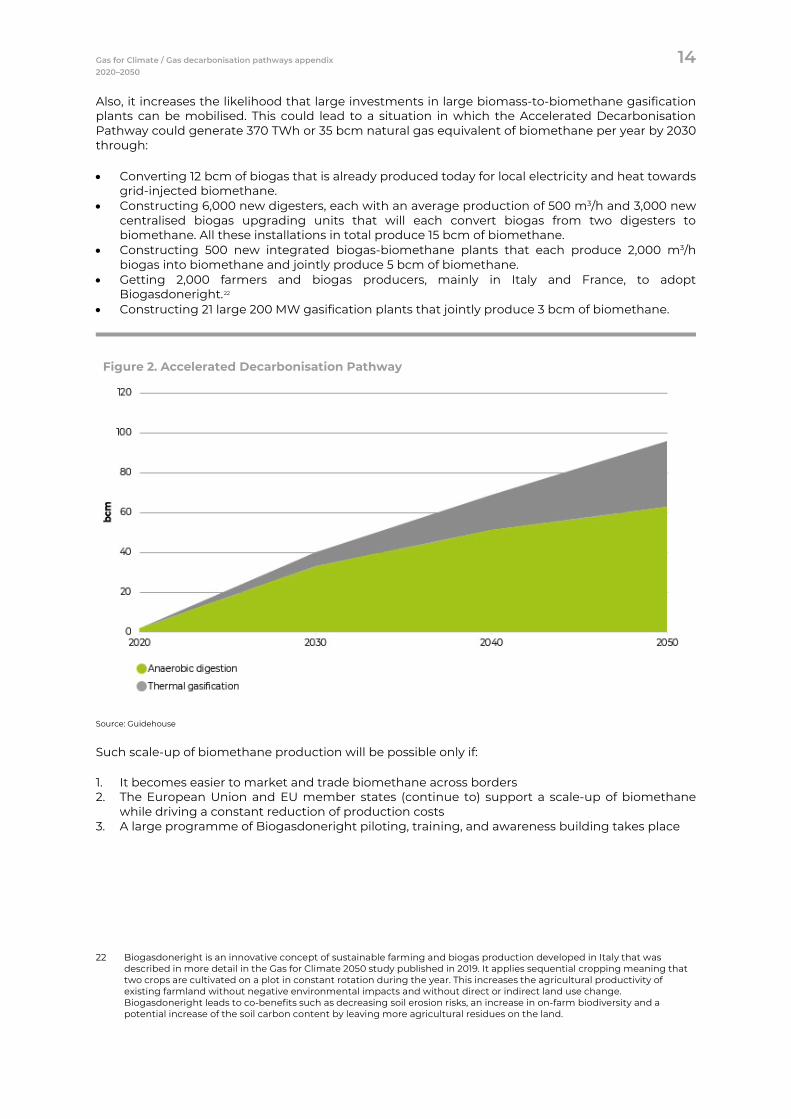
Gas for Climate / Gas decarbonisation pathways appendix 14 2020–2050
Also, it increases the likelihood that large investments in large biomass-to-biomethane gasification plants can be mobilised. This could lead to a situation in which the Accelerated Decarbonisation Pathway could generate 370 TWh or 35 bcm natural gas equivalent of biomethane per year by 2030 through:
• Converting 12 bcm of biogas that is already produced today for local electricity and heat towards grid-injected biomethane.
• Constructing 6,000 new digesters, each with an average production of 500 m3/h and 3,000 new centralised biogas upgrading units that will each convert biogas from two digesters to biomethane. All these installations in total produce 15 bcm of biomethane.
• Constructing 500 new integrated biogas-biomethane plants that each produce 2,000 m3/h biogas into biomethane and jointly produce 5 bcm of biomethane.
• Getting 2,000 farmers and biogas producers, mainly in Italy and France, to adopt Biogasdoneright.22
• Constructing 21 large 200 MW gasification plants that jointly produce 3 bcm of biomethane.
Figure 2. Accelerated Decarbonisation Pathway
Source: Guidehouse
Such scale-up of biomethane production will be possible only if:
1. It becomes easier to market and trade biomethane across borders 2. The European Union and EU member states (continue to) support a scale-up of biomethane
while driving a constant reduction of production costs 3. A large programme of Biogasdoneright piloting, training, and awareness building takes place
22 Biogasdoneright is an innovative concept of sustainable farming and biogas production developed in Italy that was
described in more detail in the Gas for Climate 2050 study published in 2019. It applies sequential cropping meaning that two crops are cultivated on a plot in constant rotation during the year. This increases the agricultural productivity of existing farmland without negative environmental impacts and without direct or indirect land use change. Biogasdoneright leads to co-benefits such as decreasing soil erosion risks, an increase in on-farm biodiversity and a potential increase of the soil carbon content by leaving more agricultural residues on the land.
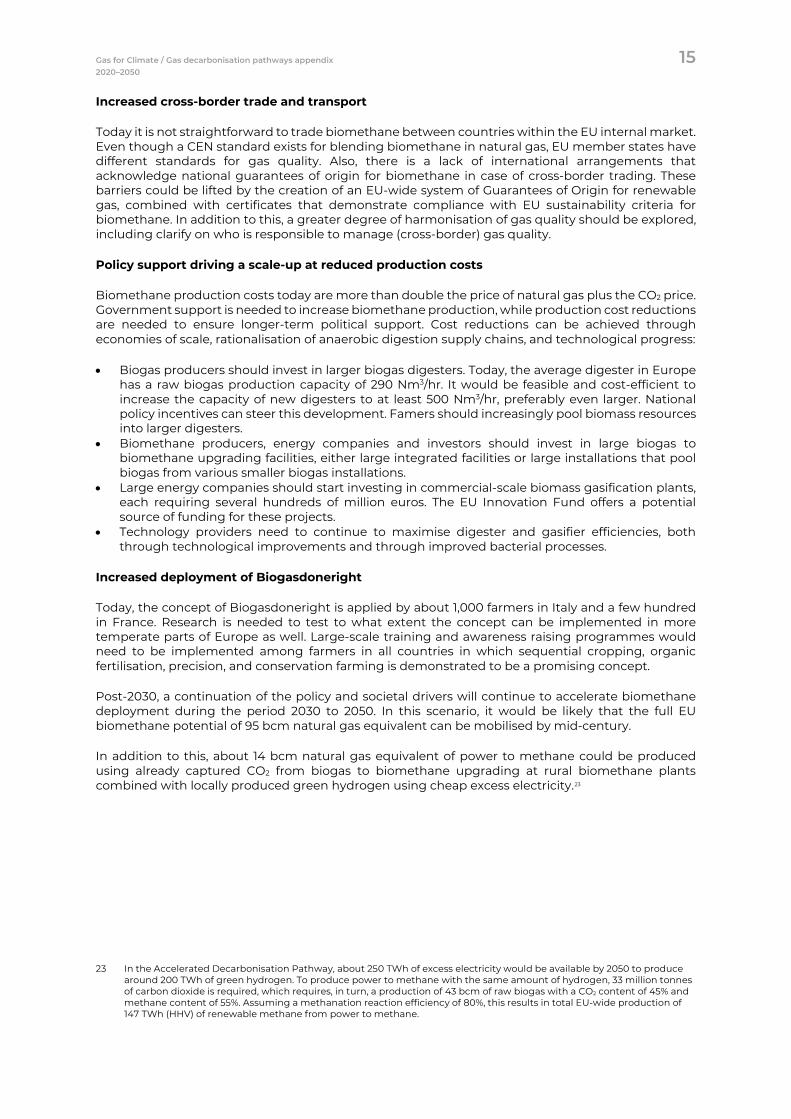
Gas for Climate / Gas decarbonisation pathways appendix 15 2020–2050
Increased cross-border trade and transport
Today it is not straightforward to trade biomethane between countries within the EU internal market. Even though a CEN standard exists for blending biomethane in natural gas, EU member states have different standards for gas quality. Also, there is a lack of international arrangements that acknowledge national guarantees of origin for biomethane in case of cross-border trading. These barriers could be lifted by the creation of an EU-wide system of Guarantees of Origin for renewable gas, combined with certificates that demonstrate compliance with EU sustainability criteria for biomethane. In addition to this, a greater degree of harmonisation of gas quality should be explored, including clarify on who is responsible to manage (cross-border) gas quality.
Policy support driving a scale-up at reduced production costs
Biomethane production costs today are more than double the price of natural gas plus the CO2 price. Government support is needed to increase biomethane production, while production cost reductions are needed to ensure longer-term political support. Cost reductions can be achieved through economies of scale, rationalisation of anaerobic digestion supply chains, and technological progress:
• Biogas producers should invest in larger biogas digesters. Today, the average digester in Europe has a raw biogas production capacity of 290 Nm3/hr. It would be feasible and cost-efficient to increase the capacity of new digesters to at least 500 Nm3/hr, preferably even larger. National policy incentives can steer this development. Famers should increasingly pool biomass resources into larger digesters.
• Biomethane producers, energy companies and investors should invest in large biogas to biomethane upgrading facilities, either large integrated facilities or large installations that pool biogas from various smaller biogas installations.
• Large energy companies should start investing in commercial-scale biomass gasification plants, each requiring several hundreds of million euros. The EU Innovation Fund offers a potential source of funding for these projects.
• Technology providers need to continue to maximise digester and gasifier efficiencies, both through technological improvements and through improved bacterial processes.
Increased deployment of Biogasdoneright
Today, the concept of Biogasdoneright is applied by about 1,000 farmers in Italy and a few hundred in France. Research is needed to test to what extent the concept can be implemented in more temperate parts of Europe as well. Large-scale training and awareness raising programmes would need to be implemented among farmers in all countries in which sequential cropping, organic fertilisation, precision, and conservation farming is demonstrated to be a promising concept.
Post-2030, a continuation of the policy and societal drivers will continue to accelerate biomethane deployment during the period 2030 to 2050. In this scenario, it would be likely that the full EU biomethane potential of 95 bcm natural gas equivalent can be mobilised by mid-century.
In addition to this, about 14 bcm natural gas equivalent of power to methane could be produced using already captured CO2 from biogas to biomethane upgrading at rural biomethane plants combined with locally produced green hydrogen using cheap excess electricity.23
23 In the Accelerated Decarbonisation Pathway, about 250 TWh of excess electricity would be available by 2050 to produce
around 200 TWh of green hydrogen. To produce power to methane with the same amount of hydrogen, 33 million tonnes of carbon dioxide is required, which requires, in turn, a production of 43 bcm of raw biogas with a CO2 content of 45% and methane content of 55%. Assuming a methanation reaction efficiency of 80%, this results in total EU-wide production of 147 TWh (HHV) of renewable methane from power to methane.
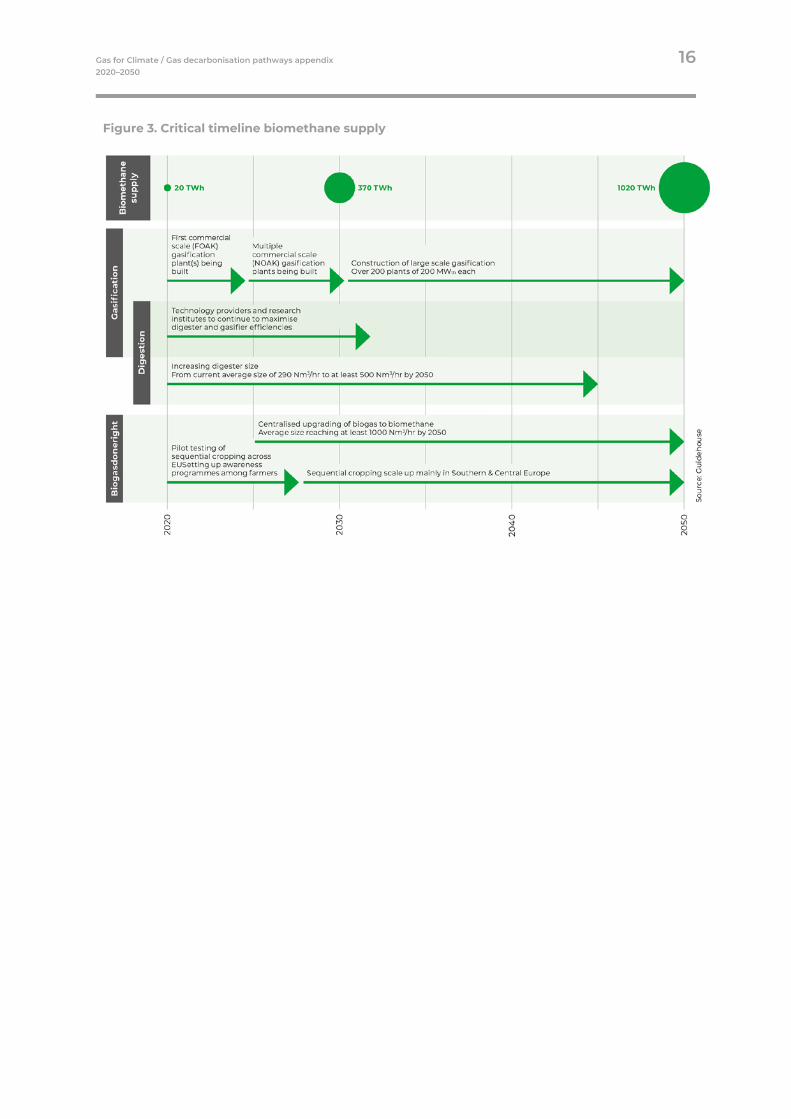
Gas for Climate / Gas decarbonisation pathways appendix 16 2020–2050
Figure 3. Critical timeline biomethane supply
Gas for Climate / Gas decarbonisation pathways appendix 17 2020–2050
1.3.2 Technology and price development for biomethane
Access to additional biomass and trained farmers enable improved biomass sourcing strategies through local and regional collaboration, making it possible to pool biomass feedstocks and move towards increased digester sizes to benefit from economies of scale. The expected cost reductions from feedstock, increased biogas yields, economies of scale (digester and upgrading), valorisation of digestate, and longer plant lifetimes would result in production cost levels of €57/MWh by 2050. These estimates depict around 30% cost reductions from today’s levels.24 Thermal gasification would also experience increased deployment, starting with first commercial-scale projects and later NOAK large-scale facilities with sizes reaching 100 MWh. The costs for such commercial-scale facilities could drop to €70/MWh by 2030. Countries with high volumes of municipal and industrial solid waste, forestry residues, and port locations can attract larger facilities, enabling considerable upscale of thermal gasification. The accelerated deployment would continue post-2030 resulting in further cost benefits from economies of scale and efficiency improvements. The costs from thermal gasification will reach the Gas for Climate levels of €47/MWh well before 2050 under the Accelerated Decarbonisation Pathway.
24 The estimated cost reductions (€94/MWh to €66/MWh) for a French industrial facility in the short to mid-term are around
30%, see page 6. http://www.enea-consulting.com/wp-content/uploads/2018/10/ENEA_Feuille_de_route_biom%C3%A9thane.pdf.
Box 1: Biogasdoneright and the circularity of carbon
A large part of the EU biomethane potential of 95 bcm as analysed in the 2019 Gas for Climate study is based on biomass from sequential cropping. This is a form of agricultural crop production in which two instead of one crop are produced on a to generate additional, low ILUC risk biomass. The 2019 Gas for Climate study assumes that by 2050 ten percent of the EU agricultural area would apply sequential cropping, with a focus on warmer areas in the south and a more limited potential in the temperate and cooler northern climate.
Navigant’s optimism about the potential for sequential cropping is based on a promising concept developed by farmers and biogas producers in Italy called Biogasdoneright. The concept is a departure from a traditional way of farming towards more innovative and sustainable farming practices. It increases the agricultural productivity of existing farmland without negative environmental impacts and without direct or indirect land use change. Biogasdoneright leads to co-benefits such as decreasing soil erosion risks, an increase in on-farm biodiversity and a potential increase of the soil carbon content by leaving more agricultural residues on the land and through the application of digestate. It could also result in negative carbon emissions. Navigant assessed the environmental sustainability of Biogasdoneright in Italy together with experts from Wageningen University during 2016 and could verify the concepts sustainability claims. Navigant did not yet evaluate the soil carbon accumulation as this would require multi-year carbon budget assessments.
The production of biomethane using the principles of Biogasdoneright enables the capture of additional carbon via photosynthesis for the purposes of energy. This agricultural intensification results in additional carbon being sequestered in soil via agroecological practices. High CO2 content in the soil causes soil fertility to enhance thereby offering a cheap and sustainable way to remove CO2 out of the atmosphere. The carbon that was once released from underground fossils returns to the ground – making it a closed carbon cycle.
Gas for Climate / Gas decarbonisation pathways appendix 18 2020–2050
Global Climate Action Pathway – biomethane
Conclusion Global Climate Action
Although the Gas for Climate 2050 Optimised Gas end state can be reached under the Accelerated Decarbonisation Pathway, biomethane developments can be further accelerated with breakthrough technologies and their widespread adoption in other parts of the world. Additional biomethane volumes would be available to the EU due to imports coming from Belarus, Ukraine, and Russia. Thermal gasification could be increasingly integrated with CCS (BECCS) to create negative emissions.
This pathway assumes that a global effort similar to what is envisioned in the European Green Deal will lead to new technological and commercial breakthroughs. The developments in the Global Climate Action Pathway are technology driven and are an addition to the Accelerated Decarbonisation Pathway.
Similar developments worldwide would mean that sequential cropping is also widely applied in other parts of the world. Since there are large quantities of agricultural land in Ukraine, Belarus, and Russia, these countries might produce considerable amounts of surplus biomethane that could be easily imported in the EU through the existing natural gas infrastructure.
1.4.1 Expected technology and price development
There is a possibility for further technological learning effects resulting from a greater global deployment of biomethane production technologies. This could result in additional production cost reductions. Navigant does expect the largest additional cost reductions to be possible for large-scale and CAPEX-heavy gasification technologies. Moreover, thermal gasification might experience additional avoided emission benefits through the integration of CCS. The application of CCS would result in additional costs but will increase the technology’s net benefits since negative emissions are generated in the energy system. 25
25 Ecofys & E4tech, 2018. Innovation Needs Assessment for Biomass Heat.
https://assets.publishing.service.gov.uk/government/uploads/system/uploads/attachment_data/file/699669/BE2_Innovation_Needs_Final_report_Jan18.pdf
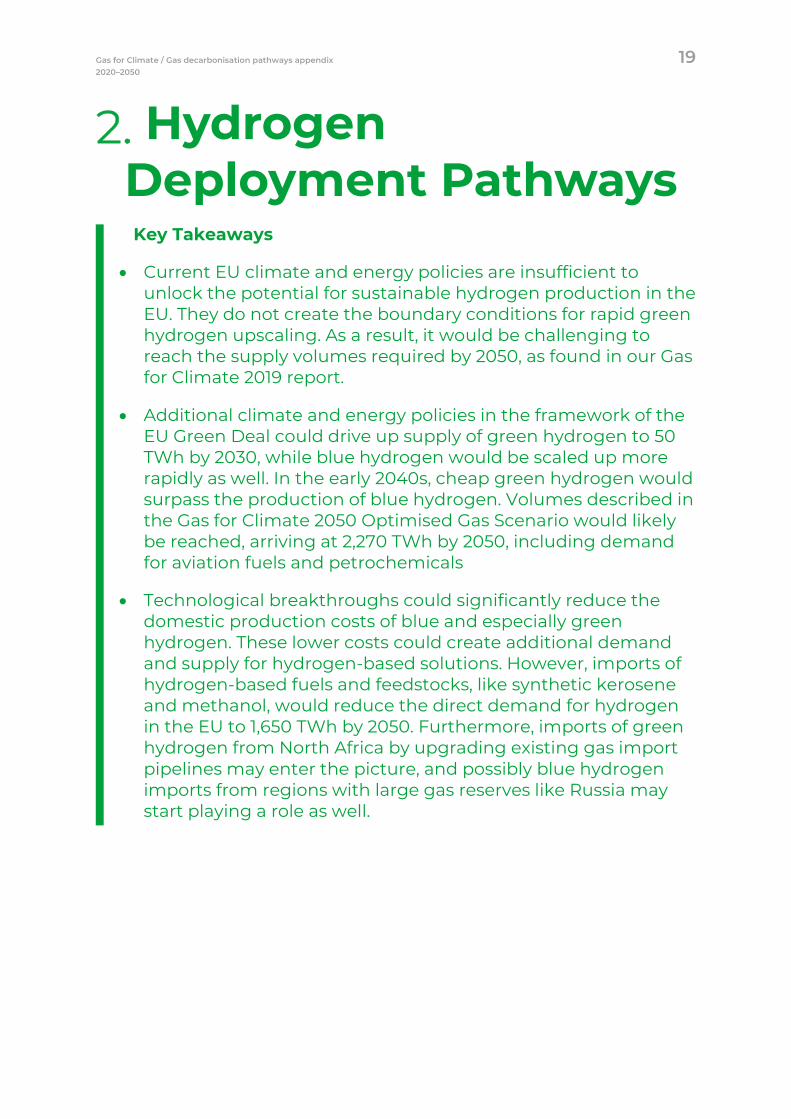
Gas for Climate / Gas decarbonisation pathways appendix 19 2020–2050
Hydrogen Deployment Pathways Key Takeaways
• Current EU climate and energy policies are insufficient to unlock the potential for sustainable hydrogen production in the EU. They do not create the boundary conditions for rapid green hydrogen upscaling. As a result, it would be challenging to reach the supply volumes required by 2050, as found in our Gas for Climate 2019 report.
• Additional climate and energy policies in the framework of the EU Green Deal could drive up supply of green hydrogen to 50 TWh by 2030, while blue hydrogen would be scaled up more rapidly as well. In the early 2040s, cheap green hydrogen would surpass the production of blue hydrogen. Volumes described in the Gas for Climate 2050 Optimised Gas Scenario would likely be reached, arriving at 2,270 TWh by 2050, including demand for aviation fuels and petrochemicals
• Technological breakthroughs could significantly reduce the domestic production costs of blue and especially green hydrogen. These lower costs could create additional demand and supply for hydrogen-based solutions. However, imports of hydrogen-based fuels and feedstocks, like synthetic kerosene and methanol, would reduce the direct demand for hydrogen in the EU to 1,650 TWh by 2050. Furthermore, imports of green hydrogen from North Africa by upgrading existing gas import pipelines may enter the picture, and possibly blue hydrogen imports from regions with large gas reserves like Russia may start playing a role as well.
Gas for Climate / Gas decarbonisation pathways appendix 20 2020–2050
Introduction Hydrogen is widely regarded as an energy carrier that will be crucial to coupling the electricity and gas sector via the existing infrastructure, thus cost-effectively decarbonising the EU’s economy. Besides being an important chemical feedstock, hydrogen will also find end uses in high temperature heat for industry as a transport fuel and as an energy storage medium, e.g. for the electricity system. Today, the dominant hydrogen production routes in the EU continue to be steam methane reforming of natural gas and, to a lesser extent, the recovery of by-product hydrogen from the (petro)chemical industry. For hydrogen to fulfil its role as a versatile low carbon energy carrier, conventional hydrogen plants will need to implement carbon capture and renewable hydrogen production will need to be scaled up significantly.
This study distinguishes between several types of hydrogen, grouped by greenhouse gas emissions from the production process of the gas (hydrogen itself causes no greenhouse gas emissions at point of use):
• Grey hydrogen is gas produced by thermochemical conversion (such as steam methane reforming) of fossil fuels without carbon capture.
• Blue hydrogen is a low carbon gas produced by thermochemical conversion of fossil fuels with added CCS.26
• Green hydrogen is a renewable gas produced from renewable electricity sources such as solar PV and wind. In this study, the focus is on electrolysis (i.e. electrolytical hydrogen; see below), although other production methods are available too.27,28
Also, this study introduces the concept of ‘climate positive hydrogen’, meaning hydrogen produced from biomethane in blue hydrogen production installations and creating negative emissions.
2.1.1 Current situation
According to the Hydrogen Roadmap Europe, the current use of hydrogen in the EU amounts to 339 TWh.29 The EU produces grey hydrogen; there is no production of green (except in smaller pilot plants) and blue hydrogen. Around 90% of the hydrogen used in the EU today is produced in a captive process,30 meaning that natural gas is supplied to a site where the hydrogen is produced and used, mostly in refineries, ammonia plants, or methanol plants. Plans are under development in the Netherlands, the UK, and Germany plan to retrofit steam methane reformers with CCS or to develop new autothermal reformers with CCS. Costs for grey hydrogen production through steam methane reforming are around €1/kg, or €28/MWh, whereas blue hydrogen could be between €37-€41/MWh, depending on the technology.31 Alkaline electrolysers are currently the most mature green hydrogen production technology, with conversion efficiencies of around 65-70% on Lower Heating Value (LHV) basis. Costs for electrolysis are estimated at around €70-100/MWh.32
26 Other options, most notably carbon capture and utilisation (e.g. via methane cracking and methane pyrolysis) need to be
further technically developed and evaluated for their real greenhouse gas emission reduction potential (i.e. long-term carbon sequestration potential).
27 For instance, direct photochemical conversion, supercritical wet biomass conversion, biomass gasification, fermentation, but also the use of biogas in steam methane reformers, with or without CCS.
28 Further specifications (e.g. specific greenhouse gas intensity limits in green / blue hydrogen production) on these definitions will be available at the conclusion of the design phase for the green hydrogen Guarantees of Origin at CertifHy (http://www.certifhy.eu/).
29 Fuel Cells and Hydrogen Joint Undertaking, 2019, Hydrogen Roadmap Europe. Available at: https://www.fch.europa.eu/sites/default/files/Hydrogen%20Roadmap%20Europe_Report.pdf.
30 Roads2HyCom, 2007. Industrial surplus hydrogen and markets and production, http://citeseerx.ist.psu.edu/viewdoc/summary?doi=10.1.1.477.3069
31 Prices based on natural gas price around of €15/MWh, which is the average price of European gas future contracts at the time of writing. Prices for grey and blue hydrogen can be higher or lower depending on the gas price.
32 Range based on hydrogen cost analysis performed in this study. For more details, see Appendix 2. The range is mainly explained by differences in electrolyser CAPEX, cost of electricity and full load hours.
Gas for Climate / Gas decarbonisation pathways appendix 21 2020–2050
2.1.2 Gas for Climate 2050 Optimised Gas end state
In the Gas for Climate 2050 Optimised Gas end state, about 200 TWh of green hydrogen from curtailed electricity could be supplied for an average cost of €29/MWh and more than 2,000 TWh of green hydrogen from dedicated renewable electricity generation could be supplied for €52/MWh. At that cost, the total demand in buildings, industry, transport, and power generation amounts to 1,710 TWh of hydrogen. In addition, there is a significant demand for hydrogen to produce synthetic fuels in the pathway, to decarbonise the aviation sector (380 TWh of hydrogen) and for petrochemicals (180 TWh of hydrogen). These are added to the total additional demand for hydrogen, arriving at 2,270 TWh.
Although this shows that all the demand could potentially be met with green hydrogen by 2050, an important role is recognised for blue hydrogen in the period up to 2050. Blue hydrogen can scale-up rapidly, independent of the availability of low-cost renewable power, which is the main limitation to scaling up green hydrogen. Boundary conditions for blue hydrogen are CO2 transport infrastructure and enough permitted CO2 injection and storage sites. For this reason, scaling up blue hydrogen in the short term while developing green hydrogen supply in parallel can accelerate decarbonisation compared to a situation where blue hydrogen would not be allowed to play a role. The Gas for Climate 2019 study sees a large potential for retrofits of conventional hydrogen assets with CCS, which could kick-start the use of low carbon hydrogen. After 2050, part of the blue hydrogen production infrastructure can continue to be used to produce climate positive hydrogen using biomethane as input for blue hydrogen plus generating much-needed negative emissions
The current analysis explores various pathways to scale-up hydrogen to achieve full decarbonisation of the EU economy in a cost-optimal way, as described in the Gas for Climate 2050 study. This chapter focuses on near- and mid-term developments of green and blue hydrogen while assessing the likelihood and possible scale of imports from outside the EU.
Hydrogen pathway under current EU climate and energy policies
Conclusion Current EU Trends
Under current EU policies, it is likely that part of existing hydrogen production will be retrofitted with CCS by 2040. The effect of this in the pathway amounts to a supply of around 40 TWh blue hydrogen by 2030 and 140 TWh by 2040. Support mechanisms such as the Innovation Fund are expected to finance projects that retrofit conventional hydrogen units in refineries, industrial gas producers and the ammonia and methanol industry. This pathway sees the development of new blue hydrogen projects stagnating after 2040 as a result of society and policymakers viewing CCS as a transition option, which limits the development of greenfield blue hydrogen plants with a lifetime reaching far beyond 2050. Support mechanisms and concrete targets for the supply of green hydrogen are largely absent in the EU at the moment, apart from the Netherlands, Belgium, and France. Announced plans for electrolysis in the EU will increase supply to around 4 TWh (2 GW) of green hydrogen by 2030, with this analysis estimating that still only around 260 TWh would be produced in 2050. Based on existing policy, we expect that both in the short- and long-term low carbon hydrogen production in the EU would remain limited, with a level of renewable and low carbon hydrogen production just above the current level of conventional hydrogen production in the EU. Additional policies will be needed in in 2020-2030 to reach an Optimised Gas end state in the EU energy system, estimated in the Gas for Climate 2019 report to require 1,710 TWh of hydrogen.
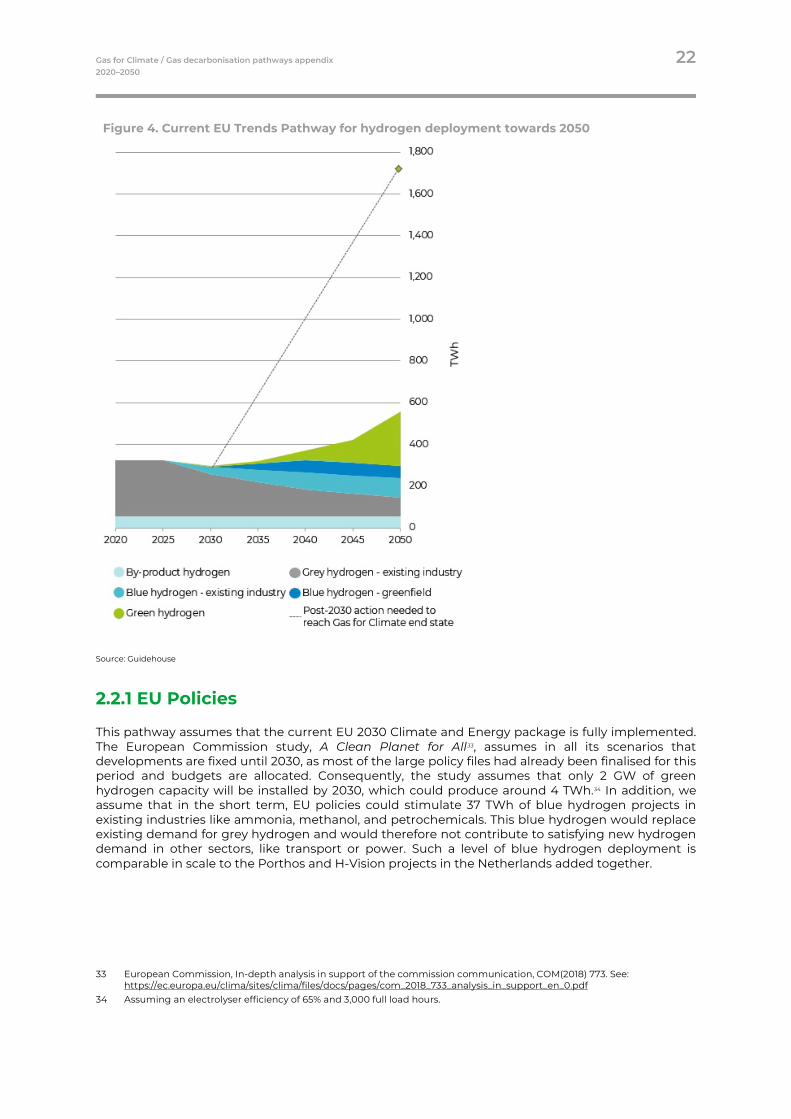
Gas for Climate / Gas decarbonisation pathways appendix 22 2020–2050
Figure 4. Current EU Trends Pathway for hydrogen deployment towards 2050
Source: Guidehouse
2.2.1 EU Policies
This pathway assumes that the current EU 2030 Climate and Energy package is fully implemented. The European Commission study, A Clean Planet for All33, assumes in all its scenarios that developments are fixed until 2030, as most of the large policy files had already been finalised for this period and budgets are allocated. Consequently, the study assumes that only 2 GW of green hydrogen capacity will be installed by 2030, which could produce around 4 TWh.34 In addition, we assume that in the short term, EU policies could stimulate 37 TWh of blue hydrogen projects in existing industries like ammonia, methanol, and petrochemicals. This blue hydrogen would replace existing demand for grey hydrogen and would therefore not contribute to satisfying new hydrogen demand in other sectors, like transport or power. Such a level of blue hydrogen deployment is comparable in scale to the Porthos and H-Vision projects in the Netherlands added together.
33 European Commission, In-depth analysis in support of the commission communication, COM(2018) 773. See:
https://ec.europa.eu/clima/sites/clima/files/docs/pages/com_2018_733_analysis_in_support_en_0.pdf 34 Assuming an electrolyser efficiency of 65% and 3,000 full load hours.
Gas for Climate / Gas decarbonisation pathways appendix 23 2020–2050
EU-wide support mechanisms that can contribute to achieving this 2 GW of installed electrolyser capacity and 37 TWh of blue hydrogen production include the following:
• Fuel Cells and Hydrogen Joint Undertaking: A public-private partnership focusing on the commercialisation of fuel cell and hydrogen technology. Since its inception, it has provided €418 million to projects related to green hydrogen production, distribution, and storage.35
• Innovation Fund: The Innovation Fund is an initiative embedded in the EU ETS aimed at stimulating the deployment of innovative low carbon technologies in EU industry. The fund is endowed with 450 million EU emission allowances (EUA), representing a value of over €11 billion at an EUA price of €25. Large-scale production of hydrogen for energy storage will be funded under this support mechanism, as well as the decarbonisation of conventional hydrogen plants through CCS and the conversion of industrial processes to hydrogen technology. By converting industries to use more hydrogen, demand will also be stimulated, leading to a larger supply of potentially both green and blue hydrogen.
• Important Projects of Common European Interest: Achieving an IPCEI status can relieve major projects from state aid limitations. In December 2019, this was achieved for a seven-country battery value chain project. Under coordination by Hydrogen Europe, a cluster of international hydrogen projects is aiming for the same, under the name of Hydrogen for Climate Action.36
• Renewable Energy Directive: Although not directly stimulating the production of green hydrogen, RED II stipulates that member states need to extend existing Guarantees of Origin schemes to include renewable gases. This puts a value on green hydrogen produced from renewable electricity compared to hydrogen produced from natural gas and can stimulate market development. However, green hydrogen does have a competitive disadvantage in the RED because renewable electricity and advanced biofuels are eligible for multiple counting towards the renewable energy targets.
2.2.2 Regional differences
Besides these EU schemes, only a few member states have proposed or introduced targets or support mechanisms for green or blue hydrogen production. Namely:
• Belgium, Flemish Hydrogen Roadmap: A government-approved hydrogen roadmap in 2018, with specific targets set for 2030 and 2050 and an associated €50 million regional investment plan for power-to-gas. The roadmap foresees a potential of 1 TWh and 14 TWh in 2030 and 2050, respectively.37
• France, Hydrogen Deployment Plan: France allocated €100 million for funding and set 2023 and 2028 targets for low carbon hydrogen in industry, transport, and renewable energy storage. The targets include 20%-40% low carbon hydrogen use in industrial applications of hydrogen and a reduction in electrolysis cost to €2/kg-€3/kg (60 to 90 €/MWh) by 2028. Targets are also defined in the energy planning regulation for power-to-gas pilot development up to 10 MW by 2023 and 100 MW by 2028.
• Netherlands: In February 2020, the Dutch government published a subsidy mechanism (SDE++) to stimulate industrial decarbonisation. This mechanism will also cover the production of green hydrogen. The goal of the SDE++ is to reduce CO2 emissions at the lowest costs. For green hydrogen, the most cost-effective subsidy amount is reached at 2,000 full load hours, which government estimates will give the lowest electricity costs and highest CO2-reduction. However, capping the subsidy at 2,000 full load hours means that the capital costs of the electrolyser are relatively high, resulting in a high “basisbedrag” (base amount), meaning the production cost under which it would be eligible for a grant. As the goal of the SDE++ mechanism is to realise CO2 reduction at the lowest costs, concern is that hydrogen will not receive the subsidies it needs to take off rapidly.38
35 Fuel Cells and Hydrogen Joint Undertaking (2019). FCH-JU presentation to the Hydrogen Energy Network (HyENet),
https://ec.europa.eu/energy/sites/ener/files/documents/3-0_fchju_biebuyck.pdf 36 Hydrogen4ClimateAction (2019), What’s an IPCEI, https://www.hydrogen4climateaction.eu/whats-an-ipcei 37 Waterstofnet & Hinicio (2018), Het potentieel voor groene waterstof in Vlaanderen,
https://www.energiesparen.be/sites/default/files/atoms/files/Rapport-Vlaams-potentieel-groene-waterstof.pdf 38 Dutch Government (2019), Beantwoording kamervragen over groene waterstof in SDE++,
https://www.rijksoverheid.nl/documenten/kamerstukken/2019/09/25/beantwoording-kamervragen-over-groene-waterstof-in-de-sde
Gas for Climate / Gas decarbonisation pathways appendix 24 2020–2050
Germany is expected to publish its national hydrogen strategy in the first half of 2020.
2.2.3 Technological and cost developments
Central questions to the development of green and blue hydrogen in the pathway are how competitive they are against each other in cost, and whether the boundary conditions are in place to allow for the rapid upscaling of green hydrogen.
The cost of green hydrogen production is sensitive to the electrolyser plant capital investment costs, electrolyser efficiency, electricity price, and the full load hours (capacity factor) at which the electrolyser can be operated. Alkaline electrolysers, currently the most mature electrochemical hydrogen production technology, are mainly used in the chlorine industry, but so far had few applications in electrolysis of water. Therefore, high costs were seen in the few projects that were done, with system costs of €1,000/kW or more. In the Gas for Climate 2019 study, we assumed a cost trajectory from that starting point. However, in the 12 months since its publication, we have seen rapid reductions in estimates for capital costs: according to the International Energy Agency (IEA) (2019), the lowest CAPEX today start at 450 €/kWe 39, and Bloomberg NEF reported a 2019 cost level of €1,100/kW for outside of China, but only €180/kW in China40. For consistency with the Gas for Climate 2019 report, we kept its electrolyser cost trajectory in the EU Current Trends and Accelerated Decarbonisation Pathways but explored much lower trajectories in the Global Climate Action Pathway, and in Chapter 5 (What if the future develops differently) of the core report.
Current alkaline electrolyser efficiencies are around 65%-70% and might increase further, although attaining efficiencies above 80% would likely require the introduction of proton exchange membrane electrolysers. However, such technological developments alone will not be responsible for significantly reducing production costs and making green hydrogen competitive with natural gas-based hydrogen from SMR or autothermal reformers (ATR) with CCS. Power costs need to come down significantly as well, with sufficient full load hours for the electrolyser. With the low natural gas prices of around €15/MWh that are seen today, hydrogen production with SMR and CCS would cost around €41/MWh versus €37/MWh for new build ATR.41 In absence of policies that aim at bringing down the cost of green hydrogen, such as governments providing a grid connection to offshore wind parks and reducing the risk of financing electrolyser projects, it may not be cost-competitive with blue hydrogen before 2050.
2.2.4 Societal acceptance
In the EU, most member states have favourable or neutral attitudes towards CCS in their long-term climate strategies.42 At the same time, in transposing the EU CCS Directive, some countries have introduced various limitations on the use of their CO2 storage potentials.43 In countries where CCS is embraced as an emissions abatement technology, the general understanding is that it should be used as a transition option until a fully renewable solution is available. This is expected to discourage investments in greenfield blue hydrogen plants that might have a lifetime beyond 2050. Therefore, on the longer term, additional hydrogen demand from end-use sectors is satisfied mostly with green hydrogen, in the Current EU Trends Pathway. Greenfield projects to produce blue hydrogen are needed to satisfy demand for low carbon hydrogen until 2040, but production levels would likely stagnate after that.
39 IEA (2019), The future of hydrogen 40 Bloomberg (2019), Hydrogen’s Plunging Price Boosts Role as Climate Solution,
https://www.bloomberg.com/news/articles/2019-08-21/cost-of-hydrogen-from-renewables-to-plummet-next-decade-bnef 41 Assuming a discount rate of 5%, an economic lifetime of 30 years, plant output of 500 t H2 per day and full load hours equal
to 347 days per year. 42 Navigant (2019), Gas for Climate: The optimal role for gas in a net-zero emissions energy system,
https://www.gasforclimate2050.eu/files/files/Navigant_Gas_for_Climate_The_optimal_role_for_gas_in_a_net_zero_emissions_energy_system_March_2019.pdf
43 Navigant (2019), Gas for Climate: The optimal role for gas in a net-zero emissions energy system, https://www.gasforclimate2050.eu/files/files/Navigant_Gas_for_Climate_The_optimal_role_for_gas_in_a_net_zero_emissions_energy_system_March_2019.pdf
Gas for Climate / Gas decarbonisation pathways appendix 25 2020–2050
2.2.5 Pathway towards 2050
In the Current EU Trends Pathway, the development of blue hydrogen starts in the 2020s. Because of a steadily increasing EU ETS CO2 allowance price from €20-25/tCO2 to €35 €/tCO2 by 2030, the gap to invest in CCS retrofits of SMR installations is reduced and increases the trust in the long-term business case. Modest national support (subsidy schemes) and EU funding (e.g. Innovation Fund) drive up the volume, reaching around 40 TWh of blue hydrogen by 2030 and 140 TWh and 150 TWh by 2040 and 2050, respectively. Such a development entails a conversion of all merchant hydrogen production facilities by 2040, 20% of the ammonia/methanol production and almost half of the hydrogen production in refineries by 2050.
Since almost all the expanded wind and solar electricity production in this pathway can still be used directly as electricity until 2030, the focus in green hydrogen developments is on reducing electrolyser cost by gradually increasing the scale, reaching 2 GWe of installed capacity by 2030. This development is supported by FCH-JU, the EU Innovation Fund, and national R&D programs.
The deployment of green and blue hydrogen by 2030 is moderate, but the real shortcoming of the pathway is visible post-2030 where growth stagnates due to unfavourable boundary conditions. Policies that specifically target the production of green hydrogen and incentivise demand are sparse, which results in limited upscaling and consequent cost reductions for electrochemical hydrogen production. This assumes that scaling up outside of the EU is also moderate, because cost reductions occur as technology deploys in other parts of the world. Figure 4 illustrates that post-2030 a large gap emerges between the production of renewable and low carbon hydrogen production under current policies and what is needed to reach the Gas for Climate Optimised Gas end state of 1,710 TWh by 2050. With a production of 410 TWh in 2050 in this pathway, the level of renewable and low carbon hydrogen production only just above the current level of conventional hydrogen production in the EU (339 TWh).
Accelerated Decarbonisation Pathway – Hydrogen
Conclusion
In the Accelerated Decarbonisation Pathway, an EU ETS price of €55/tCO2 by 2030 is foreseen, which is likely to enable a more rapid conversion of conventional hydrogen plants to CCS and could even make greenfield blue hydrogen plants competitive with SMR plants without CCS. This development would likely see about half of the total existing SMR/ATR capacity retrofitted by 2040, providing a decarbonised hydrogen supply to existing end-uses of about 125 TWh by 2040. Blue hydrogen hubs are expected to develop first in industrial clusters around the North Sea where most of the existing hydrogen plants are located, with significant potential for offshore CO2 sequestration nearby; here much of the infrastructure is already in place, including offshore gas pipelines which can potentially be repurposed to transport CO2.
Furthermore, the increased emission reduction target of the EU Green Deal would see a more rapid decarbonisation of the power sector with more renewable power projects coming online prior to 2030. In 2020-2030, this would create more favourable boundary conditions for the production of green hydrogen, predominantly in southern Europe where solar power can already deliver power well below €20/MWhe today. From 2030 onwards, the increasing offshore wind capacity on the North Sea may feed into a combined electricity and hydrogen infrastructure to continuously serve demand in a large part of Europe. A European hydrogen backbone could emerge, connecting the early ‘beachheads’ in the industrial clusters. Aside from the EU ETS price, several national and EU policies are needed to drive these international, sector integrating developments.
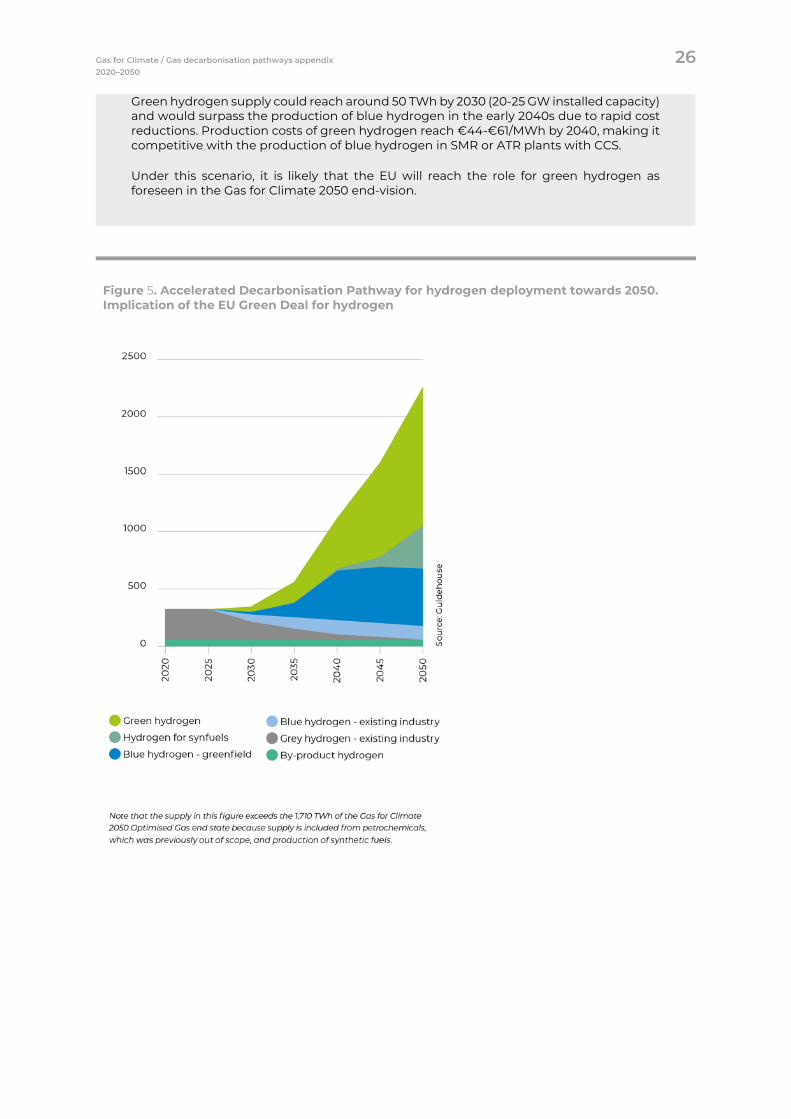
Gas for Climate / Gas decarbonisation pathways appendix 26 2020–2050
Green hydrogen supply could reach around 50 TWh by 2030 (20-25 GW installed capacity) and would surpass the production of blue hydrogen in the early 2040s due to rapid cost reductions. Production costs of green hydrogen reach €44-€61/MWh by 2040, making it competitive with the production of blue hydrogen in SMR or ATR plants with CCS.
Under this scenario, it is likely that the EU will reach the role for green hydrogen as foreseen in the Gas for Climate 2050 end-vision.
Figure 5. Accelerated Decarbonisation Pathway for hydrogen deployment towards 2050. Implication of the EU Green Deal for hydrogen
Gas for Climate / Gas decarbonisation pathways appendix 27 2020–2050
The implementation of the EU Green Deal would lead to a 55% reduction of greenhouse gas emissions by 2030 compared to 1990 levels. This kind of signal is expected to drive up the prices of EU emission allowances to a level of €55/tCO2.44 Such carbon price incentives would enable a more rapid conversion of conventional hydrogen plants to CCS and could even make greenfield blue hydrogen plants competitive with SMR plants without CCS. Capture, transport and storage from SMR plants is estimated at between €50-60/tCO2 to break even.45 With such an incentive and in combination with other forms of support around permitting, several proposed projects like H-vision, H21 North England, Porthos, and H2M could be fully operational by 2035.
At the same time, the EU Green Deal would see a more rapid decarbonisation of the power sector with more renewable power projects coming online up to 2030. From 2020-2030, this would create more favourable boundary conditions to produce green hydrogen, because in combination with other renewable sources, solar and wind power start to reach the limits of electricity demands for more hours in more places. After covering direct electricity demand, southern Europe, where solar power can already deliver power in the range of €0.015-€0.02/kWh, has a good starting position for ramping up green hydrogen production.
To decrease pressure to aggressively add more renewable power in the EU to produce hydrogen, imports of hydrogen from North Africa could also gradually increase from 2030 to 2050, as suggested by EVP Timmermans in his hearing in the European Parliament.46 Driven by the need to rapidly decarbonise and the limitations to ramping up wind and solar within the EU at the required speed, the transmission gas pipelines connecting South Europe and North Africa could be gradually converted to hydrogen-only carriers. Starting from 2030, hydrogen imports from North Africa could potentially provide up to a quarter of the total hydrogen supply by 2050, or around 450 TWh/year.
2.3.1 Technological and cost developments
Rapid upscaling of green hydrogen in the Accelerated Decarbonisation Pathway leads to a production cost of €44-61/MWh by 2050,47 making it competitive with the production of blue hydrogen in SMR or ATR plants with CCS. This reduction in cost of green hydrogen production is driven by the declining costs of renewable power, increasing electrolyser efficiency and declining CAPEX due to economies of scale and technology learning. Researchers from Linz University found a learning rate for alkaline electrolysers of 11-13%, meaning a cost reduction of roughly 12% per doubling of installed capacity globally.48 In the Accelerated Decarbonisation Pathway this is expected to drive down CAPEX for electrolysers from €715/kW in 2020 to €420/kW in 2050.49
The outlined development is expected to lead to green hydrogen starting to become cost-competitive with blue hydrogen just after 2040, since production costs for blue hydrogen are expected to increase from the current production cost of €37-42/MWh. These costs are expected to increase towards 2050 under the influence of carbon pricing50 and increasing natural gas prices. Natural gas prices are historically low today, with European future contracts selling at around €15/MWh.51 In line with the 2019 Gas for Climate study we maintain an assumption for the natural gas price of €30/MWh by 2050.
44 Carbon Tracker Initiative estimates that an increased EU climate target of minus 55% by 2030 would translate into an EU
ETS price of about €55 per tonne of CO2e by 2030, see: https://carbontracker.org/reports/carbon-clampdown/ 45 Navigant (2019), Gas for Climate: The optimal role for gas in a net-zero emissions energy system, based on IEA (2013) and
GCCSI (2017). 46 https://www.europarl.europa.eu/resources/library/media/20191009RES63850/20191009RES63850.pdf 47 Depreciation period: 30 years; Societal discount rate: 5%; OPEX (Including replacement, maintenance and labour costs): 3%
of CAPEX per annum; system energy efficiency: 80% (LHV). 48 This excludes costs of transporting the hydrogen. Source: McKinsey (2019), The hydrogen challenge: The potential of
hydrogen in Italy, SNAM 49 Navigant (2019), Gas for Climate: The optimal role for gas in a net-zero emissions energy system. 50 Even through SMR and ATR plants capture most of the produced CO2, in practice this is up to 90-95% of the total. This
means that these facilities will continue to be influenced by an increasing carbon price, although the effect is small. If the process would produce 8 tonnes of CO2 per tonne of hydrogen and the capture equipment removes 90% of the CO2, at a carbon price of €100/tCO2 this would be €80 per tonne H2 or €2.5/MWh.
51 EEX (2020), Natural Gas Market Data, https://www.eex.com/en/market-data/natural-gas/spot-market
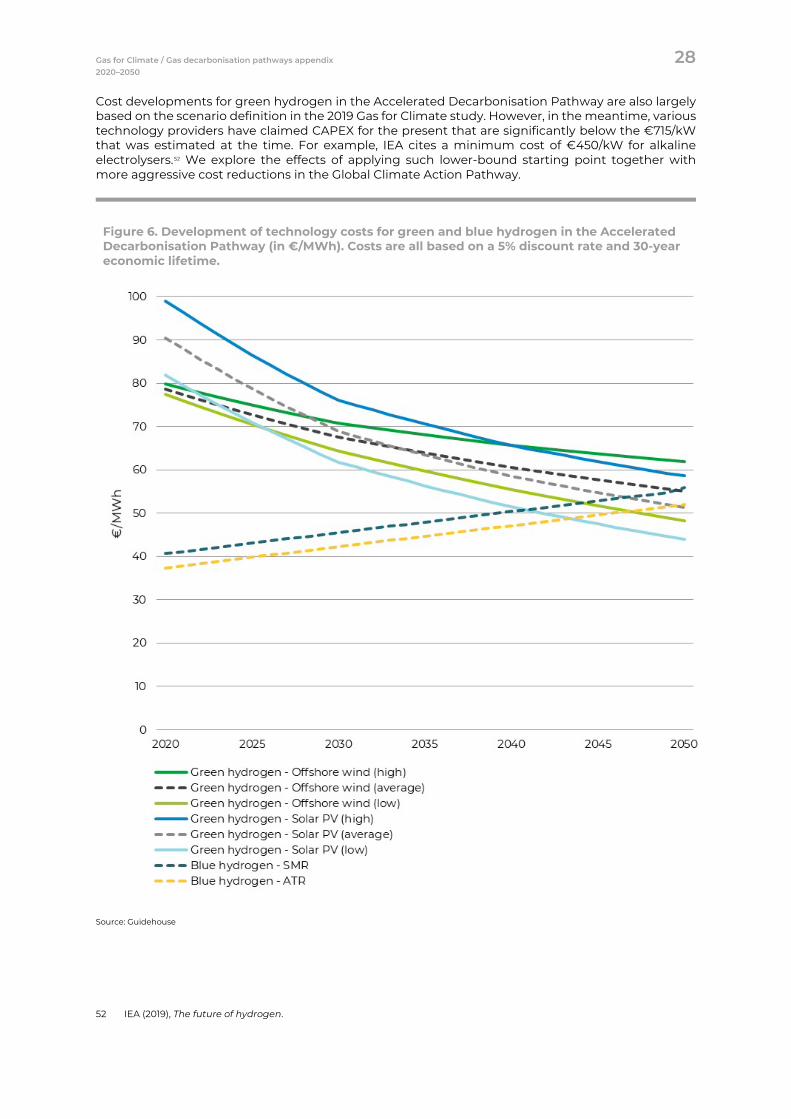
Gas for Climate / Gas decarbonisation pathways appendix 28 2020–2050
Cost developments for green hydrogen in the Accelerated Decarbonisation Pathway are also largely based on the scenario definition in the 2019 Gas for Climate study. However, in the meantime, various technology providers have claimed CAPEX for the present that are significantly below the €715/kW that was estimated at the time. For example, IEA cites a minimum cost of €450/kW for alkaline electrolysers.52 We explore the effects of applying such lower-bound starting point together with more aggressive cost reductions in the Global Climate Action Pathway.
Figure 6. Development of technology costs for green and blue hydrogen in the Accelerated Decarbonisation Pathway (in €/MWh). Costs are all based on a 5% discount rate and 30-year economic lifetime.
Source: Guidehouse
52 IEA (2019), The future of hydrogen.
Gas for Climate / Gas decarbonisation pathways appendix 29 2020–2050
2.3.2 Societal acceptance
It may be challenging to achieve societal acceptance of this pathway due to the significant amount of CO2 sequestration required from blue hydrogen assets, as well as an increase in natural gas demand for hydrogen production compared to current levels. This natural gas is converted to hydrogen and decarbonised, but concerns exist around methane leakage in the upstream production and distribution of natural gas; these will need to be addressed.
However, the benefit of this pathway in terms of social acceptance is that it demonstrates that all the hydrogen demand in the EU end-use sectors can be satisfied with domestic production, meaning that jobs and value added remain in the EU.
2.3.3 Pathway towards the 2050 Optimised Gas end state
With the Accelerated Decarbonisation Pathway, the Gas for Climate 2050 Optimised Gas end state comes into reach, with a green hydrogen supply of around 1,600 TWh and a blue hydrogen supply of around 600 TWh (Figure 5). When sufficiently stimulated, we believe that 20–25 GW of green hydrogen capacity could be reached by 2030 and 500-600 GW by 2050. This will be a combination of distributed and centralised hydrogen production sites with conversion efficiencies approaching 80% by 2050. Simultaneously, existing grey hydrogen plants would be rapidly retrofitted with CCS and greenfield blue hydrogen plants would be developed in a relatively short timeframe of 5-10 years.
Due to the significant demand for low carbon hydrogen in this scenario, already in the 2030-2040 timeframe, a significant scale-up of blue hydrogen is required because the energy system is not fully decarbonised yet by this period. Only when demand for direct use of low carbon electricity in end-use sectors is largely satisfied does it make sense to convert renewable electricity on a large scale to hydrogen. For this reason, the supply of blue hydrogen from greenfield plants in this pathway increases to 430 TWh by 2040 with moderate growth to around 500 TWh in 2050. This could, however, be lower or higher depending on the availability of green hydrogen at competing cost. In addition, the petrochemical industry and merchant hydrogen plants would see a full conversion to CCS, enabling a decarbonised supply for existing demand of around 120 TWh.
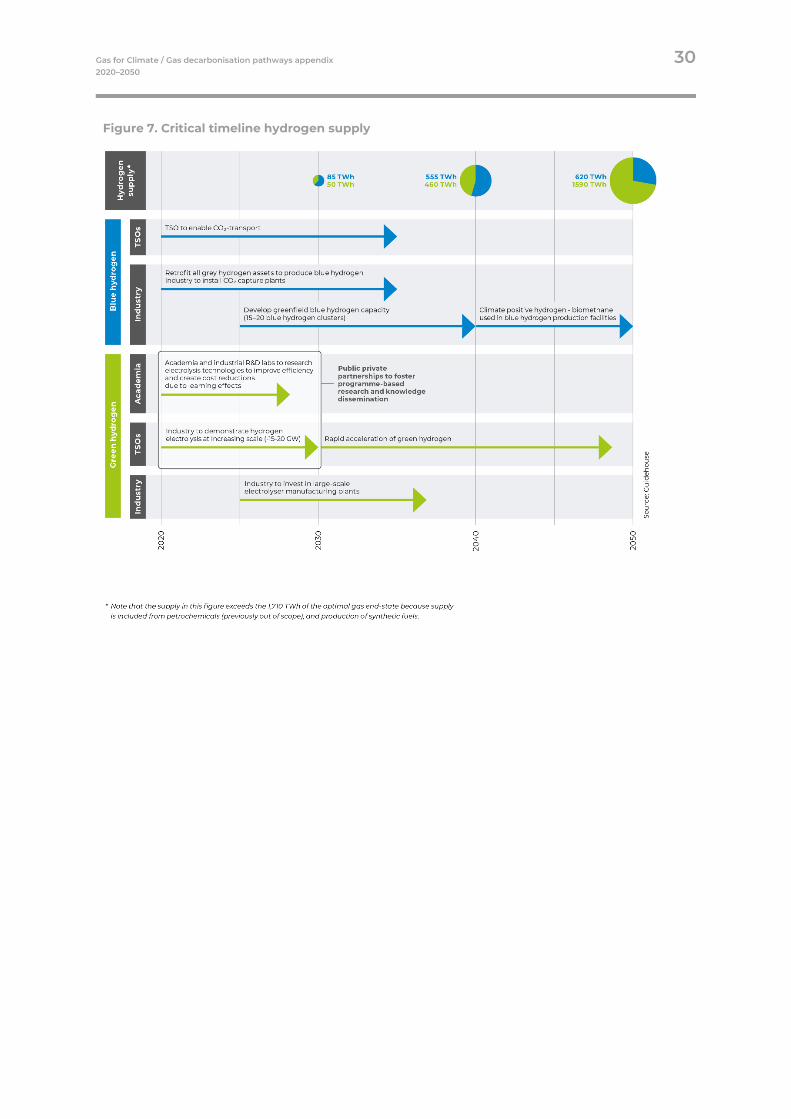
Gas for Climate / Gas decarbonisation pathways appendix 30 2020–2050
Figure 7. Critical timeline hydrogen supply
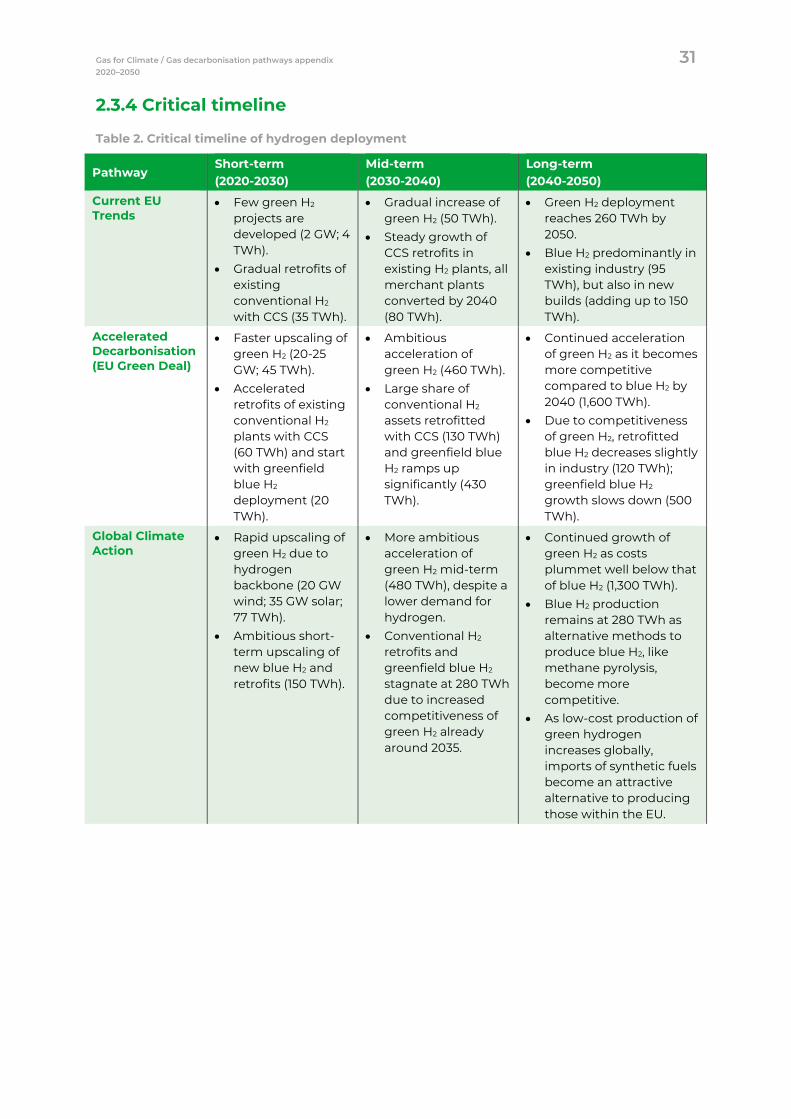
Gas for Climate / Gas decarbonisation pathways appendix 31 2020–2050
2.3.4 Critical timeline
Table 2. Critical timeline of hydrogen deployment
Pathway Short-term (2020-2030)
Mid-term (2030-2040)
Long-term (2040-2050)
Current EU Trends
• Few green H2 projects are developed (2 GW; 4 TWh).
• Gradual retrofits of existing conventional H2 with CCS (35 TWh).
• Gradual increase of green H2 (50 TWh).
• Steady growth of CCS retrofits in existing H2 plants, all merchant plants converted by 2040 (80 TWh).
• Green H2 deployment reaches 260 TWh by 2050.
• Blue H2 predominantly in existing industry (95 TWh), but also in new builds (adding up to 150 TWh).
Accelerated Decarbonisation (EU Green Deal)
• Faster upscaling of green H2 (20-25 GW; 45 TWh).
• Accelerated retrofits of existing conventional H2 plants with CCS (60 TWh) and start with greenfield blue H2 deployment (20 TWh).
• Ambitious acceleration of green H2 (460 TWh).
• Large share of conventional H2 assets retrofitted with CCS (130 TWh) and greenfield blue H2 ramps up significantly (430 TWh).
• Continued acceleration of green H2 as it becomes more competitive compared to blue H2 by 2040 (1,600 TWh).
• Due to competitiveness of green H2, retrofitted blue H2 decreases slightly in industry (120 TWh); greenfield blue H2 growth slows down (500 TWh).
Global Climate Action
• Rapid upscaling of green H2 due to hydrogen backbone (20 GW wind; 35 GW solar; 77 TWh).
• Ambitious short-term upscaling of new blue H2 and retrofits (150 TWh).
• More ambitious acceleration of green H2 mid-term (480 TWh), despite a lower demand for hydrogen.
• Conventional H2 retrofits and greenfield blue H2 stagnate at 280 TWh due to increased competitiveness of green H2 already around 2035.
• Continued growth of green H2 as costs plummet well below that of blue H2 (1,300 TWh).
• Blue H2 production remains at 280 TWh as alternative methods to produce blue H2, like methane pyrolysis, become more competitive.
• As low-cost production of green hydrogen increases globally, imports of synthetic fuels become an attractive alternative to producing those within the EU.
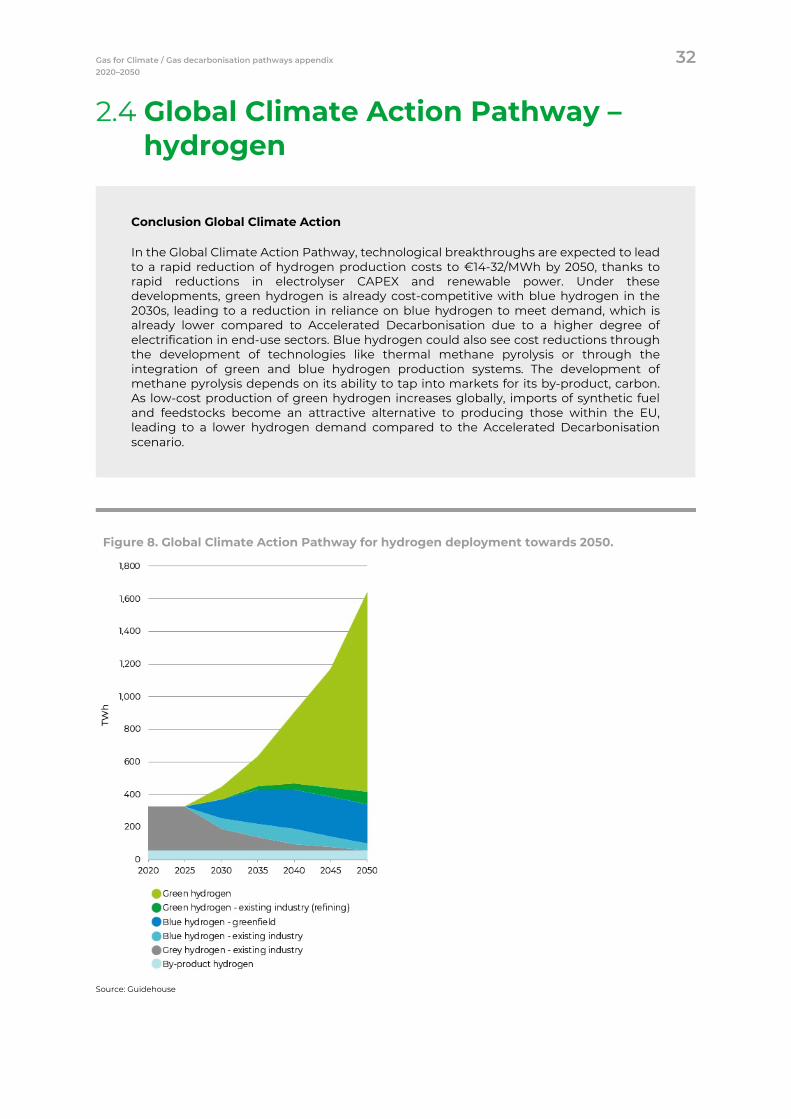
Gas for Climate / Gas decarbonisation pathways appendix 32 2020–2050
Global Climate Action Pathway – hydrogen
Conclusion Global Climate Action
In the Global Climate Action Pathway, technological breakthroughs are expected to lead to a rapid reduction of hydrogen production costs to €14-32/MWh by 2050, thanks to rapid reductions in electrolyser CAPEX and renewable power. Under these developments, green hydrogen is already cost-competitive with blue hydrogen in the 2030s, leading to a reduction in reliance on blue hydrogen to meet demand, which is already lower compared to Accelerated Decarbonisation due to a higher degree of electrification in end-use sectors. Blue hydrogen could also see cost reductions through the development of technologies like thermal methane pyrolysis or through the integration of green and blue hydrogen production systems. The development of methane pyrolysis depends on its ability to tap into markets for its by-product, carbon. As low-cost production of green hydrogen increases globally, imports of synthetic fuel and feedstocks become an attractive alternative to producing those within the EU, leading to a lower hydrogen demand compared to the Accelerated Decarbonisation scenario.
Figure 8. Global Climate Action Pathway for hydrogen deployment towards 2050.
Source: Guidehouse
Gas for Climate / Gas decarbonisation pathways appendix 33 2020–2050
Table 3. Key findings in the Global Climate Action Pathway
Pathway
Imports 267 TWh of synthetic kerosene imports, meaning an embedded hydrogen demand of between 330-380 TWh, depending on conversion efficiency.
Green hydrogen Production rapidly scales up to 1,300 TWh by 2050
Blue hydrogen Due to competitiveness of green hydrogen, production stagnates at 280 TWh in 2040
Source: Guidehouse
2.4.1 Technological and cost developments
The production of green and blue hydrogen in the EU sees significant cost reductions compared to the €44-€61/MWh range for 2050 that is figure cited in the Accelerated Decarbonisation Pathway. Green hydrogen production costs in the EU plunge to a range of €14-€32/MWh (Figure 9). Cost reductions are achieved through four key developments:
• Much lower electrolyser costs: Based on recent insights, it appears that alkaline electrolysers can be built for much lower costs than was known when the Gas for Climate 2019 report was published, a year ago. This leads to a much lower potential electrolyser system cost across the 2020-2050 period: • IEA53 has lower bounds of its cost ranges for electrolyser systems dropping from €450/kW in
2020, via €360/kW in 2030, to €180/kW in the long term, which for the Global Climate Action Pathway we will interpret as 2050.
• BloombergNEF54 sees a convergence between prices in China (which they say are already around €180/kW) and those outside China, dropping from €105/kW in 2030 to €70/kW in 2050.
• CAPEX per unit of hydrogen produced is further reduced due to increasing full load hours. It is expected that due to improved wind turbine technologies, deployment of higher hub heights and longer blades with larger swept areas the capacity factor for offshore wind will increase from the current average of 43% to 52% in 2050.55
• More rapid reduction of renewable power production costs: The Accelerated Decarbonisation Pathway showed only moderate cost reductions for renewable power towards 2050. The Global Climate Action Pathway explores more aggressive cost reductions as e.g. cited by Energinet for offshore wind and a study by Vartiainen et al. for solar PV. Energinet estimates that LCOEs for offshore wind could drop from €47/MWh in 2020 to €30/MWh by 2050, which includes the network connection costs that many governments facilitate. Excluding these costs yields an LCOE reduction of €37/MWh in 2020 to €20/MWh in 2050.56 Solar PV LCOEs of €20/MWh are already common in southern Europe. The Global Climate Action Pathway assumes a reduction to €6/MWh by 2050 for southern Europe.57
• Integration of green and blue hydrogen production systems: ATRs generally use methane, pure oxygen, and steam to produce syngas. Operating independently, these plants need an air separation unit to supply oxygen to the process. Air separation to obtain oxygen is capital intensive and requires on average 200 kWh power to obtain 1 tonne of oxygen.58 However, electrochemical production of green hydrogen produces a by-product stream of oxygen that can be used by the ATR. This leads to system cost savings and can reduce the cost of blue hydrogen production by €0.15/kg or around €5/MWh, leading to an upper-bound cost of €47/MWh in 2050 for ATR-based hydrogen production.59
53 IEA (2019), Future of Hydrogen 54 Bloomberg, 21 August 2019, Hydrogen’s Plunging Price Boosts Role as Climate Solution,
https://www.bloomberg.com/news/articles/2019-08-21/cost-of-hydrogen-from-renewables-to-plummet-next-decade-bnef 55 IRENA (2019), Future of Wind. 56 Energinet (2018), Note on technology costs for offshore wind farms and the background for updating CAPEX and OPEX in
the technology catalogue datasheets, https://ens.dk/sites/ens.dk/files/Analyser/havvindsnotat_translation_eng_final.pdf 57 Vartiainen et al. (2019), Impact of weighted average cost of capital, capital expenditure, and other parameters on future
utility‐scale PV levelised cost of electricity, https://onlinelibrary.wiley.com/doi/epdf/10.1002/pip.3189 58 Darde (2009), Air separation and flue gas compression and purification units for oxy-coal combustion systems, Air Liquide,
https://doi.org/10.1016/j.egypro.2009.01.070 59 Derived from Jakobsen & Atland (2016).
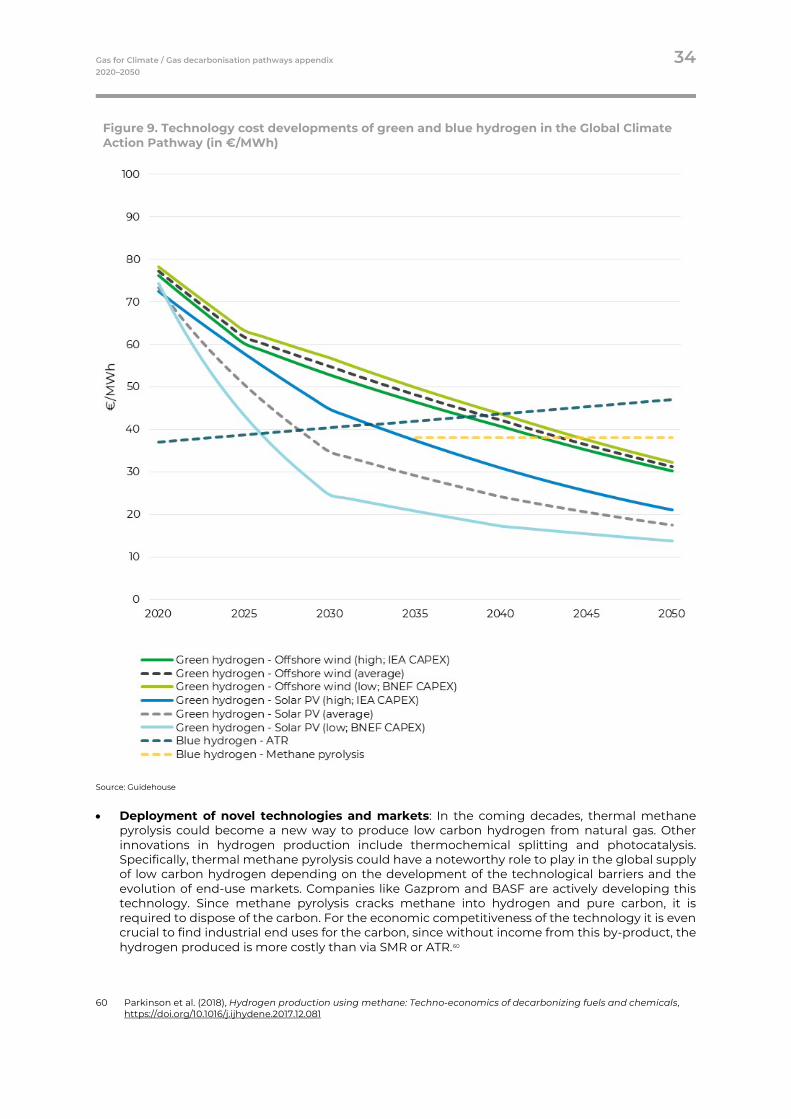
Gas for Climate / Gas decarbonisation pathways appendix 34 2020–2050
Figure 9. Technology cost developments of green and blue hydrogen in the Global Climate Action Pathway (in €/MWh)
Source: Guidehouse
• Deployment of novel technologies and markets: In the coming decades, thermal methane pyrolysis could become a new way to produce low carbon hydrogen from natural gas. Other innovations in hydrogen production include thermochemical splitting and photocatalysis. Specifically, thermal methane pyrolysis could have a noteworthy role to play in the global supply of low carbon hydrogen depending on the development of the technological barriers and the evolution of end-use markets. Companies like Gazprom and BASF are actively developing this technology. Since methane pyrolysis cracks methane into hydrogen and pure carbon, it is required to dispose of the carbon. For the economic competitiveness of the technology it is even crucial to find industrial end uses for the carbon, since without income from this by-product, the hydrogen produced is more costly than via SMR or ATR.60
60 Parkinson et al. (2018), Hydrogen production using methane: Techno-economics of decarbonizing fuels and chemicals,
https://doi.org/10.1016/j.ijhydene.2017.12.081
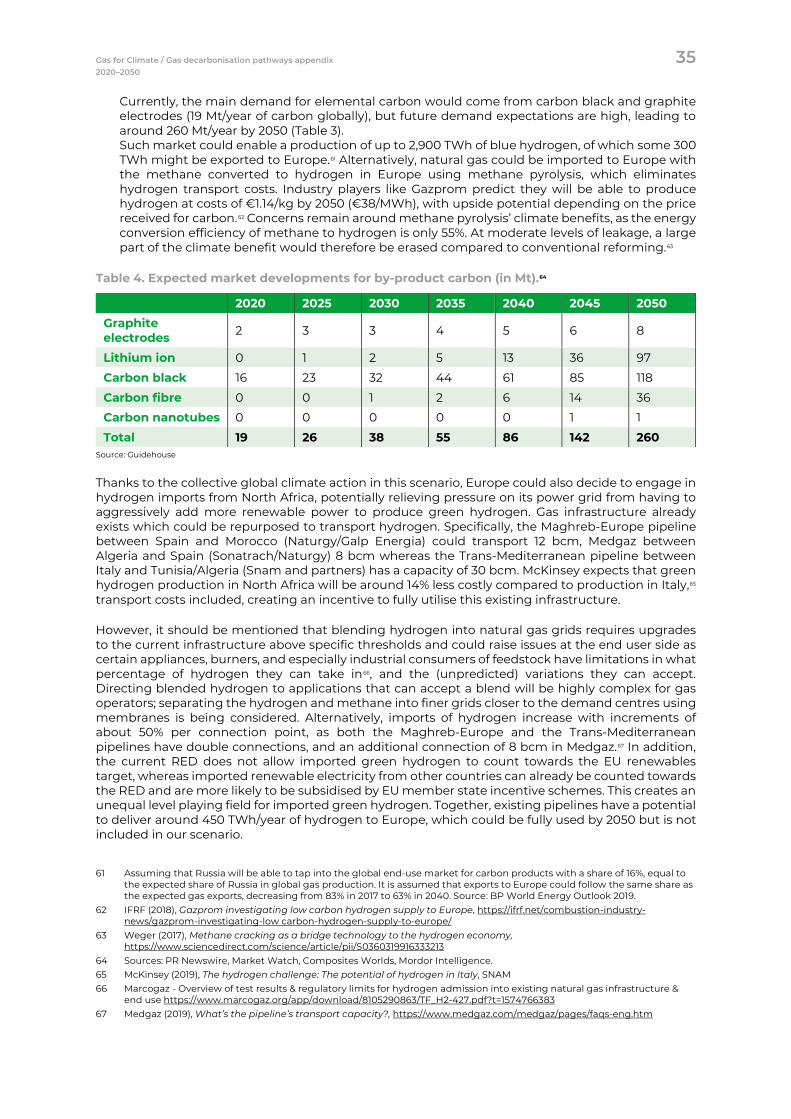
Gas for Climate / Gas decarbonisation pathways appendix 35 2020–2050
Currently, the main demand for elemental carbon would come from carbon black and graphite electrodes (19 Mt/year of carbon globally), but future demand expectations are high, leading to around 260 Mt/year by 2050 (Table 3). Such market could enable a production of up to 2,900 TWh of blue hydrogen, of which some 300 TWh might be exported to Europe.61 Alternatively, natural gas could be imported to Europe with the methane converted to hydrogen in Europe using methane pyrolysis, which eliminates hydrogen transport costs. Industry players like Gazprom predict they will be able to produce hydrogen at costs of €1.14/kg by 2050 (€38/MWh), with upside potential depending on the price received for carbon.62 Concerns remain around methane pyrolysis’ climate benefits, as the energy conversion efficiency of methane to hydrogen is only 55%. At moderate levels of leakage, a large part of the climate benefit would therefore be erased compared to conventional reforming.63
Table 4. Expected market developments for by-product carbon (in Mt).64
2020 2025 2030 2035 2040 2045 2050 Graphite electrodes 2 3 3 4 5 6 8
Lithium ion 0 1 2 5 13 36 97
Carbon black 16 23 32 44 61 85 118
Carbon fibre 0 0 1 2 6 14 36
Carbon nanotubes 0 0 0 0 0 1 1
Total 19 26 38 55 86 142 260 Source: Guidehouse
Thanks to the collective global climate action in this scenario, Europe could also decide to engage in hydrogen imports from North Africa, potentially relieving pressure on its power grid from having to aggressively add more renewable power to produce green hydrogen. Gas infrastructure already exists which could be repurposed to transport hydrogen. Specifically, the Maghreb-Europe pipeline between Spain and Morocco (Naturgy/Galp Energia) could transport 12 bcm, Medgaz between Algeria and Spain (Sonatrach/Naturgy) 8 bcm whereas the Trans-Mediterranean pipeline between Italy and Tunisia/Algeria (Snam and partners) has a capacity of 30 bcm. McKinsey expects that green hydrogen production in North Africa will be around 14% less costly compared to production in Italy,65 transport costs included, creating an incentive to fully utilise this existing infrastructure.
However, it should be mentioned that blending hydrogen into natural gas grids requires upgrades to the current infrastructure above specific thresholds and could raise issues at the end user side as certain appliances, burners, and especially industrial consumers of feedstock have limitations in what percentage of hydrogen they can take in66, and the (unpredicted) variations they can accept. Directing blended hydrogen to applications that can accept a blend will be highly complex for gas operators; separating the hydrogen and methane into finer grids closer to the demand centres using membranes is being considered. Alternatively, imports of hydrogen increase with increments of about 50% per connection point, as both the Maghreb-Europe and the Trans-Mediterranean pipelines have double connections, and an additional connection of 8 bcm in Medgaz.67 In addition, the current RED does not allow imported green hydrogen to count towards the EU renewables target, whereas imported renewable electricity from other countries can already be counted towards the RED and are more likely to be subsidised by EU member state incentive schemes. This creates an unequal level playing field for imported green hydrogen. Together, existing pipelines have a potential to deliver around 450 TWh/year of hydrogen to Europe, which could be fully used by 2050 but is not included in our scenario.
61 Assuming that Russia will be able to tap into the global end-use market for carbon products with a share of 16%, equal to
the expected share of Russia in global gas production. It is assumed that exports to Europe could follow the same share as the expected gas exports, decreasing from 83% in 2017 to 63% in 2040. Source: BP World Energy Outlook 2019.
62 IFRF (2018), Gazprom investigating low carbon hydrogen supply to Europe, https://ifrf.net/combustion-industry-news/gazprom-investigating-low carbon-hydrogen-supply-to-europe/
63 Weger (2017), Methane cracking as a bridge technology to the hydrogen economy, https://www.sciencedirect.com/science/article/pii/S0360319916333213
64 Sources: PR Newswire, Market Watch, Composites Worlds, Mordor Intelligence. 65 McKinsey (2019), The hydrogen challenge: The potential of hydrogen in Italy, SNAM 66 Marcogaz - Overview of test results & regulatory limits for hydrogen admission into existing natural gas infrastructure &
end use https://www.marcogaz.org/app/download/8105290863/TF_H2-427.pdf?t=1574766383 67 Medgaz (2019), What’s the pipeline’s transport capacity?, https://www.medgaz.com/medgaz/pages/faqs-eng.htm
Gas for Climate / Gas decarbonisation pathways appendix 36 2020–2050
2.4.2 Societal acceptance
Societal acceptance of this pathway may be challenging due to the significant scale-up of blue hydrogen in the short term, and the related CO2 sequestration that would be required.
2.4.3 Pathway towards 2050
The Global Climate Action Pathway is characterised by a significantly lower long-term demand for renewable and low carbon hydrogen mainly due to imports of synthetic fuels and feedstocks (such as methanol) from outside the EU, and a rapidly decreasing cost for green hydrogen.
In the short term, demand for decarbonised hydrogen in end-use sectors increases rapidly, which means that both green and blue hydrogen production need to significantly ramp-up. Green hydrogen production is significantly higher by 2030 compared to Accelerated Decarbonisation at 77 TWh, with the majority coming from cheap solar PV in southern Europe. Because green hydrogen remains constrained by the power grid, blue hydrogen needs to meet the rest of the demand leading to a ramp-up to 150 TWh, of which 60 TWh retrofits of existing SMR installations in, e.g. refineries and ammonia/methanol plants.
Because green hydrogen production costs are already competitive with blue hydrogen in the 2030s, most of the subsequent growth comes from green hydrogen, leading to 480 TWh of supply in 2040. This is higher than in the Accelerated Decarbonisation Pathway, despite a lower demand from end-use sectors and synthetic fuels being imported in Global Climate Action. The low cost of green hydrogen in this pathway even enables the replacement of hydrogen plants in refineries to decentralised electrolysers, making up 78 TWh of the 1,300 TWh green hydrogen.
Gas for Climate / Gas decarbonisation pathways appendix 37 2020–2050
Buildings Decarbonisation Pathways Key Takeaways
• Under the Current EU Trends Pathway, we expect light renovation efforts of buildings in line with the current situation (renovation rates between 1% and 1.5% of mostly light and medium renovations), but a limited share of deep renovations towards 2030. Increasing the renovation speed and depth after 2030 to compensate for the lack of renovations between 2030 and 2050 will be a near impossible, task. Without the right insulation levels, the needed low carbon heating technologies are more difficult to apply at a level in line with the Gas for Climate 2050 Optimised Gas end state. Full electric heat pumps are unlikely to be applied on the expected level due to a limited amount of deep renovated buildings, and hybrid heating solutions will require more energy use and produce a higher stress on energy infrastructure if the buildings are poorly insulated.
• The Accelerated Decarbonisation Pathway envisions a significant increase in energy renovation rates towards 2030 (to between 2.5% and 3% per year) to reach net-zero emissions, as in the Gas for Climate 2050 Optimised Gas end state. Focused policies such as long-term renovation targets and increasing required minimal energy performance levels of existing buildings could help reach this goal. In addition, increasing knowledge build-up around low carbon buildings, reducing hassle for building owners, and supporting financing options are required to create the right environment. A more focused push to switch to low carbon heating technologies in well-insulated buildings is necessary to get to the right pathway.

Gas for Climate / Gas decarbonisation pathways appendix 38 2020–2050
• The Global Climate Action Pathway includes significant cost reductions to insulation and heating technologies could speed up the renovation process by creating a situation in which energy renovations occur outside of normal renovation cycles. Faster and more convenient renovations and a wider range of renovation options enables a rapid scale-up towards the Gas for Climate Optimised Gas 2050 end state. Introduction
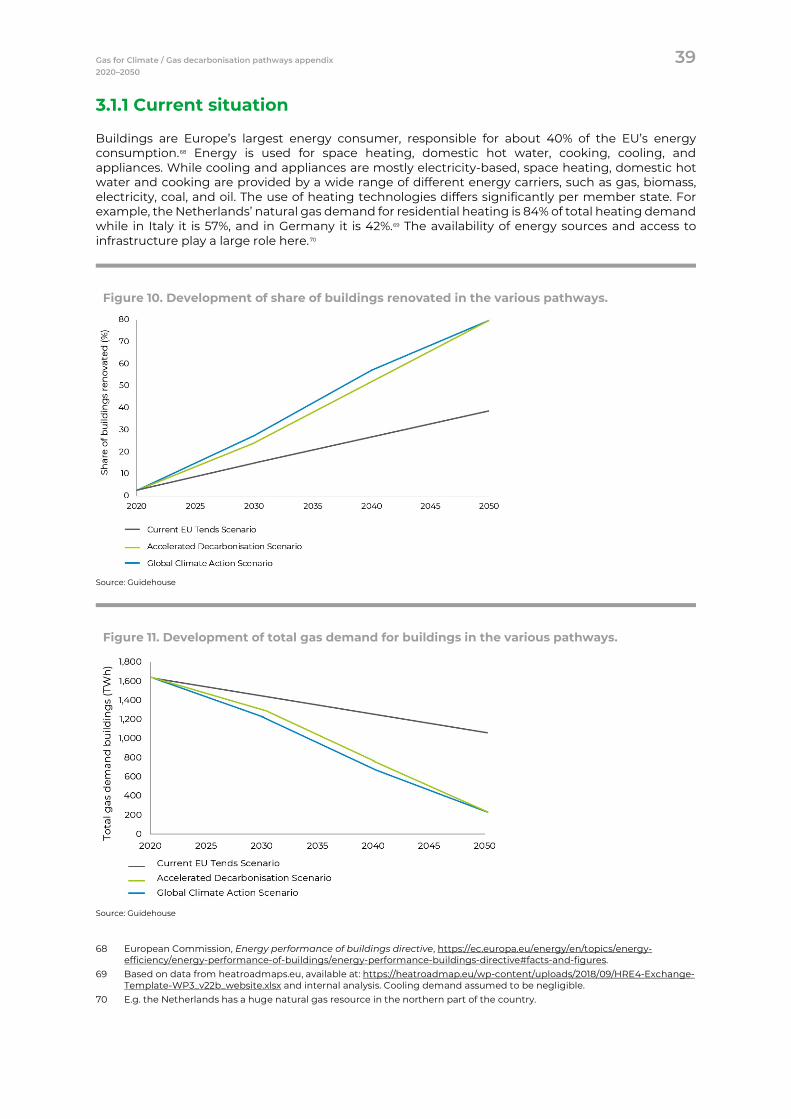
Gas for Climate / Gas decarbonisation pathways appendix 39 2020–2050
3.1.1 Current situation
Buildings are Europe’s largest energy consumer, responsible for about 40% of the EU’s energy consumption.68 Energy is used for space heating, domestic hot water, cooking, cooling, and appliances. While cooling and appliances are mostly electricity-based, space heating, domestic hot water and cooking are provided by a wide range of different energy carriers, such as gas, biomass, electricity, coal, and oil. The use of heating technologies differs significantly per member state. For example, the Netherlands’ natural gas demand for residential heating is 84% of total heating demand while in Italy it is 57%, and in Germany it is 42%.69 The availability of energy sources and access to infrastructure play a large role here.70
Figure 10. Development of share of buildings renovated in the various pathways.
Source: Guidehouse
Figure 11. Development of total gas demand for buildings in the various pathways.
Source: Guidehouse
68 European Commission, Energy performance of buildings directive, https://ec.europa.eu/energy/en/topics/energy-
efficiency/energy-performance-of-buildings/energy-performance-buildings-directive#facts-and-figures. 69 Based on data from heatroadmaps.eu, available at: https://heatroadmap.eu/wp-content/uploads/2018/09/HRE4-Exchange-
Template-WP3_v22b_website.xlsx and internal analysis. Cooling demand assumed to be negligible. 70 E.g. the Netherlands has a huge natural gas resource in the northern part of the country.
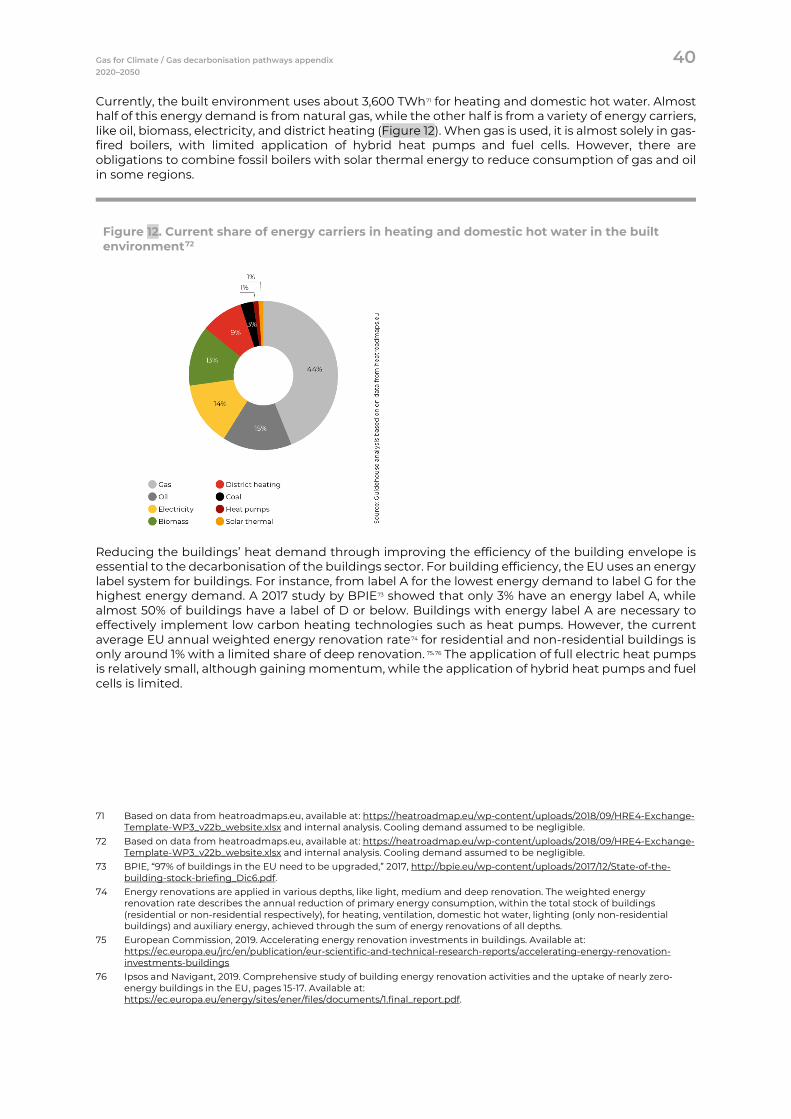
Gas for Climate / Gas decarbonisation pathways appendix 40 2020–2050
Currently, the built environment uses about 3,600 TWh71 for heating and domestic hot water. Almost half of this energy demand is from natural gas, while the other half is from a variety of energy carriers, like oil, biomass, electricity, and district heating (Figure 12). When gas is used, it is almost solely in gas-fired boilers, with limited application of hybrid heat pumps and fuel cells. However, there are obligations to combine fossil boilers with solar thermal energy to reduce consumption of gas and oil in some regions.
Figure 12. Current share of energy carriers in heating and domestic hot water in the built environment72
Reducing the buildings’ heat demand through improving the efficiency of the building envelope is essential to the decarbonisation of the buildings sector. For building efficiency, the EU uses an energy label system for buildings. For instance, from label A for the lowest energy demand to label G for the highest energy demand. A 2017 study by BPIE73 showed that only 3% have an energy label A, while almost 50% of buildings have a label of D or below. Buildings with energy label A are necessary to effectively implement low carbon heating technologies such as heat pumps. However, the current average EU annual weighted energy renovation rate74 for residential and non-residential buildings is only around 1% with a limited share of deep renovation. 75,76 The application of full electric heat pumps is relatively small, although gaining momentum, while the application of hybrid heat pumps and fuel cells is limited.
71 Based on data from heatroadmaps.eu, available at: https://heatroadmap.eu/wp-content/uploads/2018/09/HRE4-Exchange-
Template-WP3_v22b_website.xlsx and internal analysis. Cooling demand assumed to be negligible. 72 Based on data from heatroadmaps.eu, available at: https://heatroadmap.eu/wp-content/uploads/2018/09/HRE4-Exchange-
Template-WP3_v22b_website.xlsx and internal analysis. Cooling demand assumed to be negligible. 73 BPIE, “97% of buildings in the EU need to be upgraded,” 2017, http://bpie.eu/wp-content/uploads/2017/12/State-of-the-
building-stock-briefing_Dic6.pdf. 74 Energy renovations are applied in various depths, like light, medium and deep renovation. The weighted energy
renovation rate describes the annual reduction of primary energy consumption, within the total stock of buildings (residential or non-residential respectively), for heating, ventilation, domestic hot water, lighting (only non-residential buildings) and auxiliary energy, achieved through the sum of energy renovations of all depths.
75 European Commission, 2019. Accelerating energy renovation investments in buildings. Available at: https://ec.europa.eu/jrc/en/publication/eur-scientific-and-technical-research-reports/accelerating-energy-renovation-investments-buildings
76 Ipsos and Navigant, 2019. Comprehensive study of building energy renovation activities and the uptake of nearly zero-energy buildings in the EU, pages 15-17. Available at: https://ec.europa.eu/energy/sites/ener/files/documents/1.final_report.pdf.
Gas for Climate / Gas decarbonisation pathways appendix 41 2020–2050
3.1.2 Gas for Climate 2050 Optimised Gas end state
A huge effort is required to achieve a decarbonised buildings sector. Changing to low carbon heating technologies requires a big increase in energy efficiency. The application of heat pumps benefits from low heat distribution temperatures within a building. This is only economically feasible if buildings have enough insulation to reduce heat demand, allowing for low temperature heating distribution to provide enough heat to the building. Applying proper insulation will also help reduce renewable energy demand in the building sector. Energy renovations are the first step to a low carbon, built environment.
These renovations are often combined with regular renovation activities such as replacement of roof, windows, or the heating installation, where energy efficiency is improved at the same time. In most cases, this is also required because reducing energy use is rarely cost-effective (compared to adding energy saving measures on an already planned renovation). It is estimated that 97%77 of the buildings will require a partial or full renovation to achieve the 2050 decarbonisation vision.
A huge effort is required to achieve a decarbonised buildings sector. The Gas for Climate 2019 study included a buildings decarbonisation analysis and concluded that, overall energy use for heating and hot water could reduce significantly from 3,600 TWh to just over 1,000 TWh by mid-century. Achieving these energy reductions require energy renovation in almost all buildings. In the Gas for Climate 2050 Optimised Gas end state, existing buildings with a gas connection today will continue to use gas by 2050 (37%), but in strongly reduced volumes. Gas (mainly biomethane and some hydrogen) will be used in hybrid heat pumps with electricity.
Hybrid heat pumps provide a lot of flexibility with their combination of efficient electric and gas heating and could significantly reduce stress on the electricity grid during winter peak demand times. The application of heat pumps currently is almost solely focused on full electric heat pumps. Towards 2050, it will be important to actively support the hybrid heat pump as logical alternative to full electric heat pumps to prevent electricity grid issues in a low carbon future and to ensure a cost-efficient decarbonization of buildings with existing gas grid connections (Box 3). Buildings without a gas connection in 2050 will be heated by all-electric heat pumps (43%) or through district heating (20% of all buildings).
Since deep renovations are essential for heating buildings at low temperatures by all-electric technologies, significant renovation efforts are needed for buildings without gas connections. If renovation efforts stay behind, this hinders the deployment of all-electric and (to a lesser extent) hybrid heat pumps. In this case, it will be important to keep considering possible alternatives: to focus less on insulation and more on other renewable heating technologies, like hydrogen fuel cells, gas heat pumps, or boilers.
District heating already covers a significant share of the current mix for heating and has the potential to provide a considerable part of the built environment with renewable heat,78 but is still largely based on (waste) energy from fossil-fuelled processes. In the future energy system, district heating networks play an important role in integrating the electricity, gas, and heating energy systems. Through the deployment of multiple heat supply technologies together, heat can be provided in a cost-effective and flexible way. Potential sources for district heating include geothermal heat plants, boilers, heat pumps, combined heat and power (CHP) plants, or fuel cells. CHP plants could use various types of inputs including hydrogen.
Cooling of buildings will be based on electric cooling appliances. As opposed to demand for heating, demand for cooling correlates well with the availability of renewable electricity for solar PV. In moments of cooling demand with less availability of electricity form solar PV, for example, in the evening, short-term electricity storage can be applied to bridge the peaks in a diurnal cycle.
77 BPIE, “97% of buildings in the EU need to be upgraded,” 2017, http://bpie.eu/wp-content/uploads/2017/12/State-of-the-
building-stock-briefing_Dic6.pdf. 78 In the Gas for Climate 2019 study we envision an increase in district heating from around 10% nowadays towards 20% in
2050. According the Heat Roadmap Europe district heating could increase from today’s level of 10% up to 50% by 2050. Heat Roadmap Europe, 2019. About the Project. Available at: https://heatroadmap.eu/project/.
Gas for Climate / Gas decarbonisation pathways appendix 42 2020–2050
Box 3. The value of hybrid heating solutions
Hybrid heating solutions are a key factor in achieving a cost-effective, zero-carbon built environment in the Gas for Climate study. Hybrid heat pumps are a combination of a small heat pump and a gas boiler. This combination reduces insulation costs (no need for very deep renovation of the building envelope) and heating technology costs (application of smaller heat pumps and no need for low temperature floor heating), while requiring only a small amount of renewable gas. It also reduces stress on the electricity infrastructure: at low temperatures the efficiency of electric heat pumps reduces by up to 75%, which can be counterbalanced by use of renewable gas.
Hybrid heat pumps enable a robust pathway, since insulation, installing the heat pump, and decarbonising electricity and gas can take place independently, gradually reducing emissions. When installed, they provide system operators with increased resiliency by allowing shifting demand from electricity to gas and vice versa.
There is currently a limited application of this combination, and specific policy support is required for this technology to scale-up. Examples of policy support include focusing on information and knowledge dissemination, standardising the application of this combination, and ensuring the option is considered when developing renovation plans.
Buildings pathway under current EU climate and energy policies
Conclusion Current EU Trends
Under the Current EU Trends Pathway, we expect light renovation efforts of buildings in line with the current situation (renovation rates between 1% and 1.5% of mostly light and medium renovations), but a limited share of deep renovations towards 2030. After 2030, increasing the renovation speed and depth to compensate for the lacking renovations between 2030 and 2050 will be a near impossible, task. Without the right insulation levels, the needed low carbon heating technologies are more difficult to apply at a level in line with the Gas for Climate 2050 Optimised Gas end state. Full electric heat pumps are unlikely to be applied on the expected level due to a limited amount of deep renovated buildings, and hybrid heat pumps will require more energy use and produce a higher stress on energy infrastructure if the buildings are poorly insulated.
Gas for Climate / Gas decarbonisation pathways appendix 43 2020–2050
3.2.1 EU policies
The EPBD79 is the central policy in place to guide the EU energy transition in the built environment. The main aspects of this directive are:
• Requires member states to develop energy performance certificates (or energy labels) that are required for the sale of rental of buildings.
• Requires member states to set minimum energy performance requirements for building elements that are replaced or retrofitted, considering the cost-optimality of the requirements (Article 4).
• Sets strict requirements around new buildings, to reduce energy demand and increase renewable energy production in and around buildings (nearly net-zero energy buildings).
• Requires a smart readiness indicator that assesses the capability of the building to adapt to needs of the occupant, while optimising energy efficiency and overall performance and adapting to grid requirements.
However, the EPBD does not set mandatory targets for improving the energy performance of existing buildings.80 Instead, some legislation supporting the development of renovation targets is set in the Energy Efficiency Directive (EED):
• The EED sets a 3% renovation target for buildings owned and occupied by governments and requires these buildings to be renovated to at least the minimum energy performance requirement from the EPBD.
• It requires member states to establish Long-Term Renovation Strategies (LTRS)81 to mobilise investment in the renovation of the building stock and to update this strategy every 3 years.
A recent review82 of the 2017 LTRSs of each member state showed that 90% of the strategies were considered compliant with the EED, but only about half of the strategies have long-term targets towards 2050.
3.2.2 Regional differences
There are large differences between countries in Europe in how buildings are heated. While gas provides the highest share of heating demand in western and southern Europe, in the southeast there is more focus on biomass. There is a significant share of coal in the northeast; in northern Europe, district heating is the largest heating demand technology. The current situation and available infrastructure will guide the required legislation towards a low carbon, built environment.83
79 European Council, “Directive (EU) 2018/844 of the European Parliament and of the Council of 30 May 2018 amending
Directive 2010/31/EU on the energy performance of buildings and Directive 2012/27/EU on energy efficiency,” 2018, https://eur-lex.europa.eu/legal-content/EN/TXT/?qid=1529483556082&uri=CELEX:32018L0844.
80 European Council for an Energy Efficient Economy (ECEEE), “Frequently Asked Questions on the Recast of the Energy Performance of Buildings Directive,” https://www.eceee.org/policy-areas/Buildings/faqs-on-the-epbd/.
81 While originated in the EED, the LTRS have been moved to the EPBD in the 2018 update of the EPBD. 82 Joint Research Center, Assessment of second long-term renovation strategies under the Energy Efficiency Directive, 2019,
https://op.europa.eu/en/publication-detail/-/publication/e04473ed-2daf-11e9-8d04-01aa75ed71a1/language-en/format-PDF/source-86607487.
83 Based on data from heatroadmaps.eu, available at: https://heatroadmap.eu/wp-content/uploads/2018/09/HRE4-Exchange-Template-WP3_v22b_website.xlsx and internal analysis. Cooling demand assumed to be negligible.
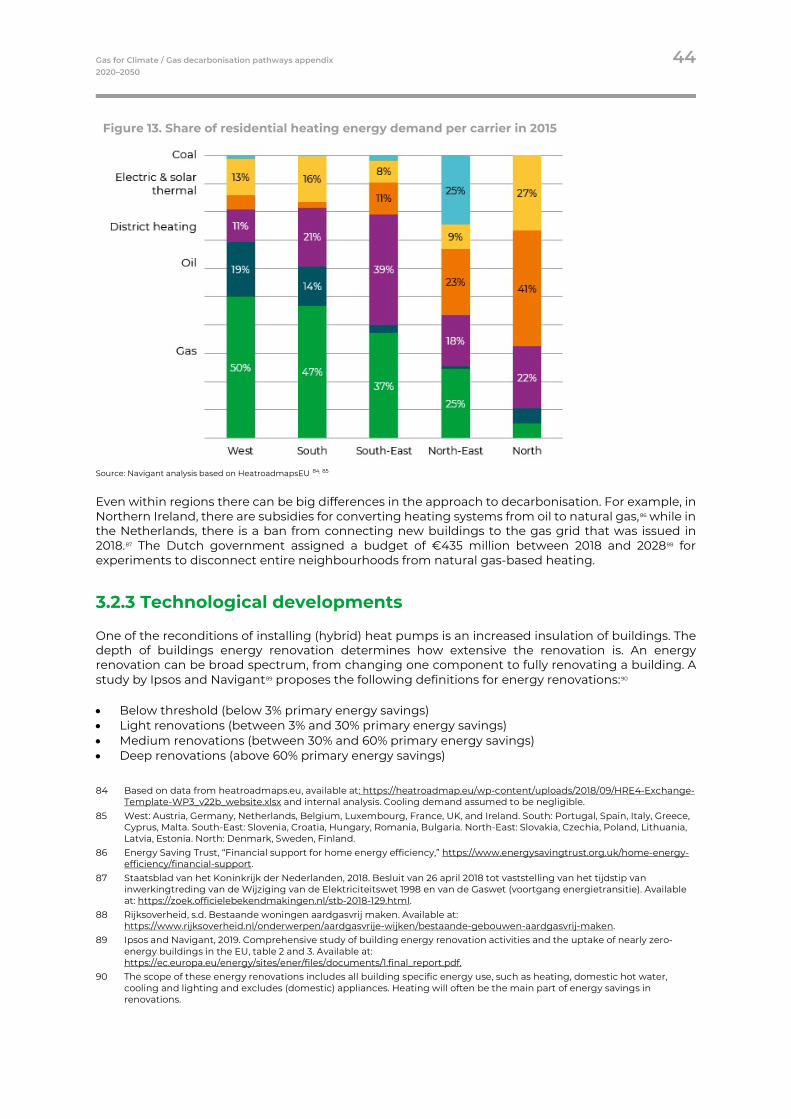
Gas for Climate / Gas decarbonisation pathways appendix 44 2020–2050
Figure 13. Share of residential heating energy demand per carrier in 2015
Source: Navigant analysis based on HeatroadmapsEU 84, 85
Even within regions there can be big differences in the approach to decarbonisation. For example, in Northern Ireland, there are subsidies for converting heating systems from oil to natural gas,86 while in the Netherlands, there is a ban from connecting new buildings to the gas grid that was issued in 2018.87 The Dutch government assigned a budget of €435 million between 2018 and 202888 for experiments to disconnect entire neighbourhoods from natural gas-based heating.
3.2.3 Technological developments
One of the reconditions of installing (hybrid) heat pumps is an increased insulation of buildings. The depth of buildings energy renovation determines how extensive the renovation is. An energy renovation can be broad spectrum, from changing one component to fully renovating a building. A study by Ipsos and Navigant89 proposes the following definitions for energy renovations:90
• Below threshold (below 3% primary energy savings) • Light renovations (between 3% and 30% primary energy savings) • Medium renovations (between 30% and 60% primary energy savings) • Deep renovations (above 60% primary energy savings)
84 Based on data from heatroadmaps.eu, available at: https://heatroadmap.eu/wp-content/uploads/2018/09/HRE4-Exchange-
Template-WP3_v22b_website.xlsx and internal analysis. Cooling demand assumed to be negligible. 85 West: Austria, Germany, Netherlands, Belgium, Luxembourg, France, UK, and Ireland. South: Portugal, Spain, Italy, Greece,
Cyprus, Malta. South-East: Slovenia, Croatia, Hungary, Romania, Bulgaria. North-East: Slovakia, Czechia, Poland, Lithuania, Latvia, Estonia. North: Denmark, Sweden, Finland.
86 Energy Saving Trust, “Financial support for home energy efficiency,” https://www.energysavingtrust.org.uk/home-energy-efficiency/financial-support.
87 Staatsblad van het Koninkrijk der Nederlanden, 2018. Besluit van 26 april 2018 tot vaststelling van het tijdstip van inwerkingtreding van de Wijziging van de Elektriciteitswet 1998 en van de Gaswet (voortgang energietransitie). Available at: https://zoek.officielebekendmakingen.nl/stb-2018-129.html.
88 Rijksoverheid, s.d. Bestaande woningen aardgasvrij maken. Available at: https://www.rijksoverheid.nl/onderwerpen/aardgasvrije-wijken/bestaande-gebouwen-aardgasvrij-maken.
89 Ipsos and Navigant, 2019. Comprehensive study of building energy renovation activities and the uptake of nearly zero-energy buildings in the EU, table 2 and 3. Available at: https://ec.europa.eu/energy/sites/ener/files/documents/1.final_report.pdf.
90 The scope of these energy renovations includes all building specific energy use, such as heating, domestic hot water, cooling and lighting and excludes (domestic) appliances. Heating will often be the main part of energy savings in renovations.
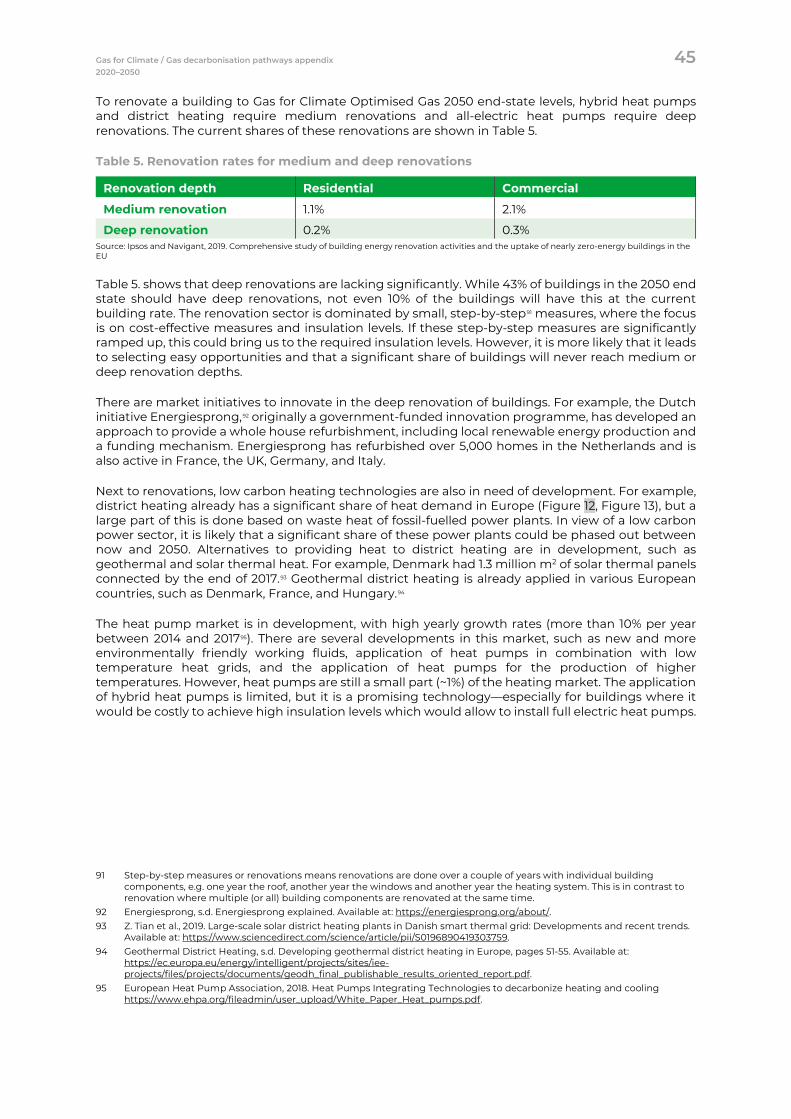
Gas for Climate / Gas decarbonisation pathways appendix 45 2020–2050
To renovate a building to Gas for Climate Optimised Gas 2050 end-state levels, hybrid heat pumps and district heating require medium renovations and all-electric heat pumps require deep renovations. The current shares of these renovations are shown in Table 5.
Table 5. Renovation rates for medium and deep renovations
Renovation depth Residential Commercial
Medium renovation 1.1% 2.1%
Deep renovation 0.2% 0.3% Source: Ipsos and Navigant, 2019. Comprehensive study of building energy renovation activities and the uptake of nearly zero-energy buildings in the EU
Table 5. shows that deep renovations are lacking significantly. While 43% of buildings in the 2050 end state should have deep renovations, not even 10% of the buildings will have this at the current building rate. The renovation sector is dominated by small, step-by-step91 measures, where the focus is on cost-effective measures and insulation levels. If these step-by-step measures are significantly ramped up, this could bring us to the required insulation levels. However, it is more likely that it leads to selecting easy opportunities and that a significant share of buildings will never reach medium or deep renovation depths.
There are market initiatives to innovate in the deep renovation of buildings. For example, the Dutch initiative Energiesprong,92 originally a government-funded innovation programme, has developed an approach to provide a whole house refurbishment, including local renewable energy production and a funding mechanism. Energiesprong has refurbished over 5,000 homes in the Netherlands and is also active in France, the UK, Germany, and Italy.
Next to renovations, low carbon heating technologies are also in need of development. For example, district heating already has a significant share of heat demand in Europe (Figure 12, Figure 13), but a large part of this is done based on waste heat of fossil-fuelled power plants. In view of a low carbon power sector, it is likely that a significant share of these power plants could be phased out between now and 2050. Alternatives to providing heat to district heating are in development, such as geothermal and solar thermal heat. For example, Denmark had 1.3 million m2 of solar thermal panels connected by the end of 2017.93 Geothermal district heating is already applied in various European countries, such as Denmark, France, and Hungary.94
The heat pump market is in development, with high yearly growth rates (more than 10% per year between 2014 and 201795). There are several developments in this market, such as new and more environmentally friendly working fluids, application of heat pumps in combination with low temperature heat grids, and the application of heat pumps for the production of higher temperatures. However, heat pumps are still a small part (~1%) of the heating market. The application of hybrid heat pumps is limited, but it is a promising technology—especially for buildings where it would be costly to achieve high insulation levels which would allow to install full electric heat pumps.
91 Step-by-step measures or renovations means renovations are done over a couple of years with individual building
components, e.g. one year the roof, another year the windows and another year the heating system. This is in contrast to renovation where multiple (or all) building components are renovated at the same time.
92 Energiesprong, s.d. Energiesprong explained. Available at: https://energiesprong.org/about/. 93 Z. Tian et al., 2019. Large-scale solar district heating plants in Danish smart thermal grid: Developments and recent trends.
Available at: https://www.sciencedirect.com/science/article/pii/S0196890419303759. 94 Geothermal District Heating, s.d. Developing geothermal district heating in Europe, pages 51-55. Available at:
https://ec.europa.eu/energy/intelligent/projects/sites/iee-projects/files/projects/documents/geodh_final_publishable_results_oriented_report.pdf.
95 European Heat Pump Association, 2018. Heat Pumps Integrating Technologies to decarbonize heating and cooling https://www.ehpa.org/fileadmin/user_upload/White_Paper_Heat_pumps.pdf.
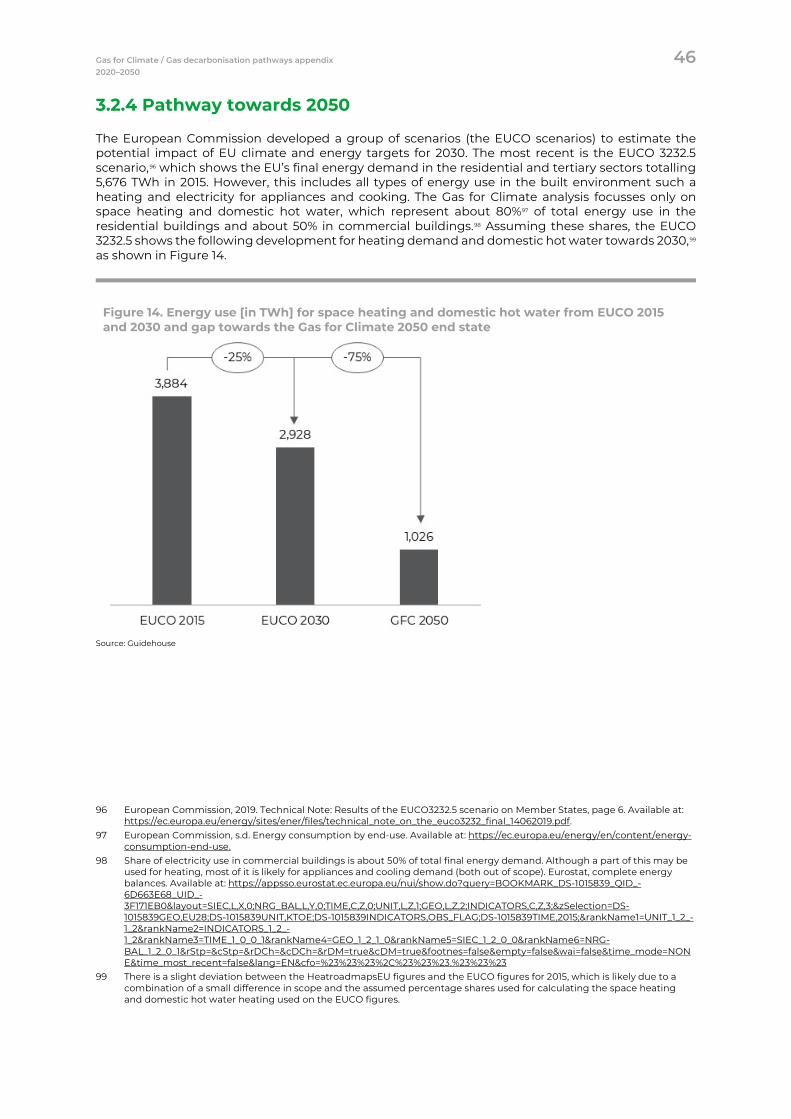
Gas for Climate / Gas decarbonisation pathways appendix 46 2020–2050
3.2.4 Pathway towards 2050
The European Commission developed a group of scenarios (the EUCO scenarios) to estimate the potential impact of EU climate and energy targets for 2030. The most recent is the EUCO 3232.5 scenario,96 which shows the EU’s final energy demand in the residential and tertiary sectors totalling 5,676 TWh in 2015. However, this includes all types of energy use in the built environment such a heating and electricity for appliances and cooking. The Gas for Climate analysis focusses only on space heating and domestic hot water, which represent about 80%97 of total energy use in the residential buildings and about 50% in commercial buildings.98 Assuming these shares, the EUCO 3232.5 shows the following development for heating demand and domestic hot water towards 2030,99 as shown in Figure 14.
Figure 14. Energy use [in TWh] for space heating and domestic hot water from EUCO 2015 and 2030 and gap towards the Gas for Climate 2050 end state
Source: Guidehouse
96 European Commission, 2019. Technical Note: Results of the EUCO3232.5 scenario on Member States, page 6. Available at:
https://ec.europa.eu/energy/sites/ener/files/technical_note_on_the_euco3232_final_14062019.pdf. 97 European Commission, s.d. Energy consumption by end-use. Available at: https://ec.europa.eu/energy/en/content/energy-
consumption-end-use. 98 Share of electricity use in commercial buildings is about 50% of total final energy demand. Although a part of this may be
used for heating, most of it is likely for appliances and cooling demand (both out of scope). Eurostat, complete energy balances. Available at: https://appsso.eurostat.ec.europa.eu/nui/show.do?query=BOOKMARK_DS-1015839_QID_-6D663E68_UID_-3F171EB0&layout=SIEC,L,X,0;NRG_BAL,L,Y,0;TIME,C,Z,0;UNIT,L,Z,1;GEO,L,Z,2;INDICATORS,C,Z,3;&zSelection=DS-1015839GEO,EU28;DS-1015839UNIT,KTOE;DS-1015839INDICATORS,OBS_FLAG;DS-1015839TIME,2015;&rankName1=UNIT_1_2_-1_2&rankName2=INDICATORS_1_2_-1_2&rankName3=TIME_1_0_0_1&rankName4=GEO_1_2_1_0&rankName5=SIEC_1_2_0_0&rankName6=NRG-BAL_1_2_0_1&rStp=&cStp=&rDCh=&cDCh=&rDM=true&cDM=true&footnes=false&empty=false&wai=false&time_mode=NONE&time_most_recent=false&lang=EN&cfo=%23%23%23%2C%23%23%23.%23%23%23
99 There is a slight deviation between the HeatroadmapsEU figures and the EUCO figures for 2015, which is likely due to a combination of a small difference in scope and the assumed percentage shares used for calculating the space heating and domestic hot water heating used on the EUCO figures.
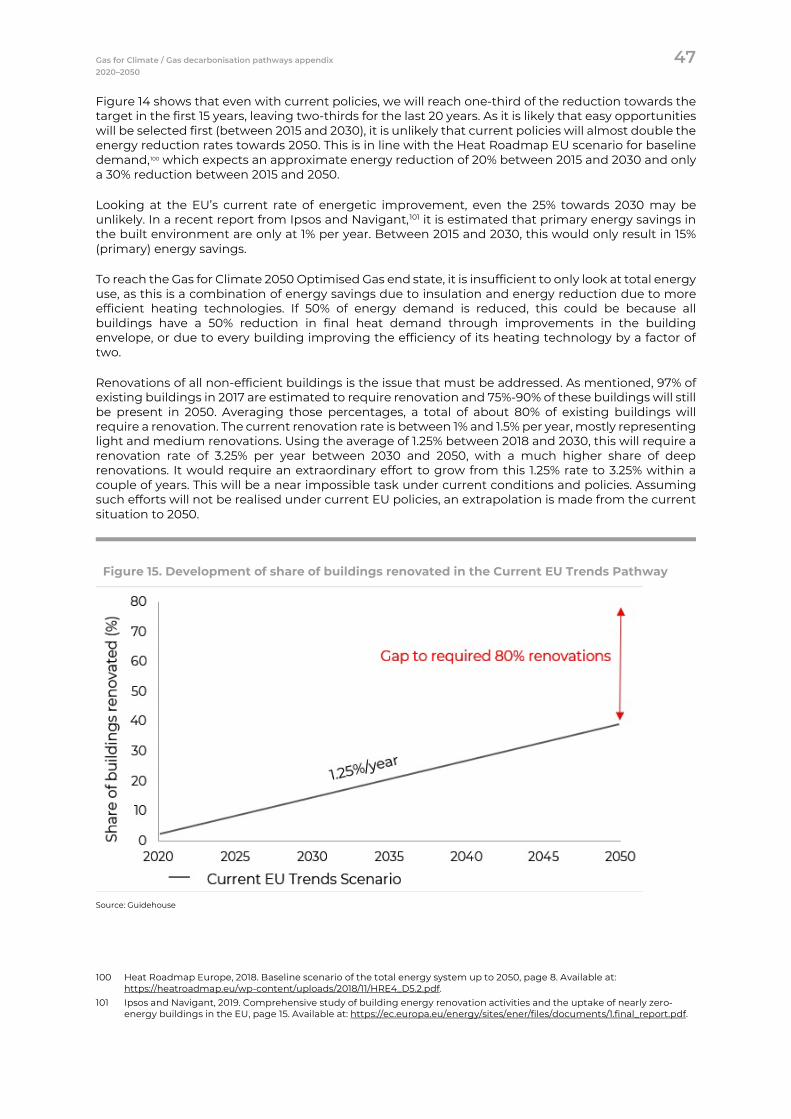
Gas for Climate / Gas decarbonisation pathways appendix 47 2020–2050
Figure 14 shows that even with current policies, we will reach one-third of the reduction towards the target in the first 15 years, leaving two-thirds for the last 20 years. As it is likely that easy opportunities will be selected first (between 2015 and 2030), it is unlikely that current policies will almost double the energy reduction rates towards 2050. This is in line with the Heat Roadmap EU scenario for baseline demand,100 which expects an approximate energy reduction of 20% between 2015 and 2030 and only a 30% reduction between 2015 and 2050.
Looking at the EU’s current rate of energetic improvement, even the 25% towards 2030 may be unlikely. In a recent report from Ipsos and Navigant,101 it is estimated that primary energy savings in the built environment are only at 1% per year. Between 2015 and 2030, this would only result in 15% (primary) energy savings.
To reach the Gas for Climate 2050 Optimised Gas end state, it is insufficient to only look at total energy use, as this is a combination of energy savings due to insulation and energy reduction due to more efficient heating technologies. If 50% of energy demand is reduced, this could be because all buildings have a 50% reduction in final heat demand through improvements in the building envelope, or due to every building improving the efficiency of its heating technology by a factor of two.
Renovations of all non-efficient buildings is the issue that must be addressed. As mentioned, 97% of existing buildings in 2017 are estimated to require renovation and 75%-90% of these buildings will still be present in 2050. Averaging those percentages, a total of about 80% of existing buildings will require a renovation. The current renovation rate is between 1% and 1.5% per year, mostly representing light and medium renovations. Using the average of 1.25% between 2018 and 2030, this will require a renovation rate of 3.25% per year between 2030 and 2050, with a much higher share of deep renovations. It would require an extraordinary effort to grow from this 1.25% rate to 3.25% within a couple of years. This will be a near impossible task under current conditions and policies. Assuming such efforts will not be realised under current EU policies, an extrapolation is made from the current situation to 2050.
Figure 15. Development of share of buildings renovated in the Current EU Trends Pathway
Source: Guidehouse
100 Heat Roadmap Europe, 2018. Baseline scenario of the total energy system up to 2050, page 8. Available at:
https://heatroadmap.eu/wp-content/uploads/2018/11/HRE4_D5.2.pdf. 101 Ipsos and Navigant, 2019. Comprehensive study of building energy renovation activities and the uptake of nearly zero-
energy buildings in the EU, page 15. Available at: https://ec.europa.eu/energy/sites/ener/files/documents/1.final_report.pdf.
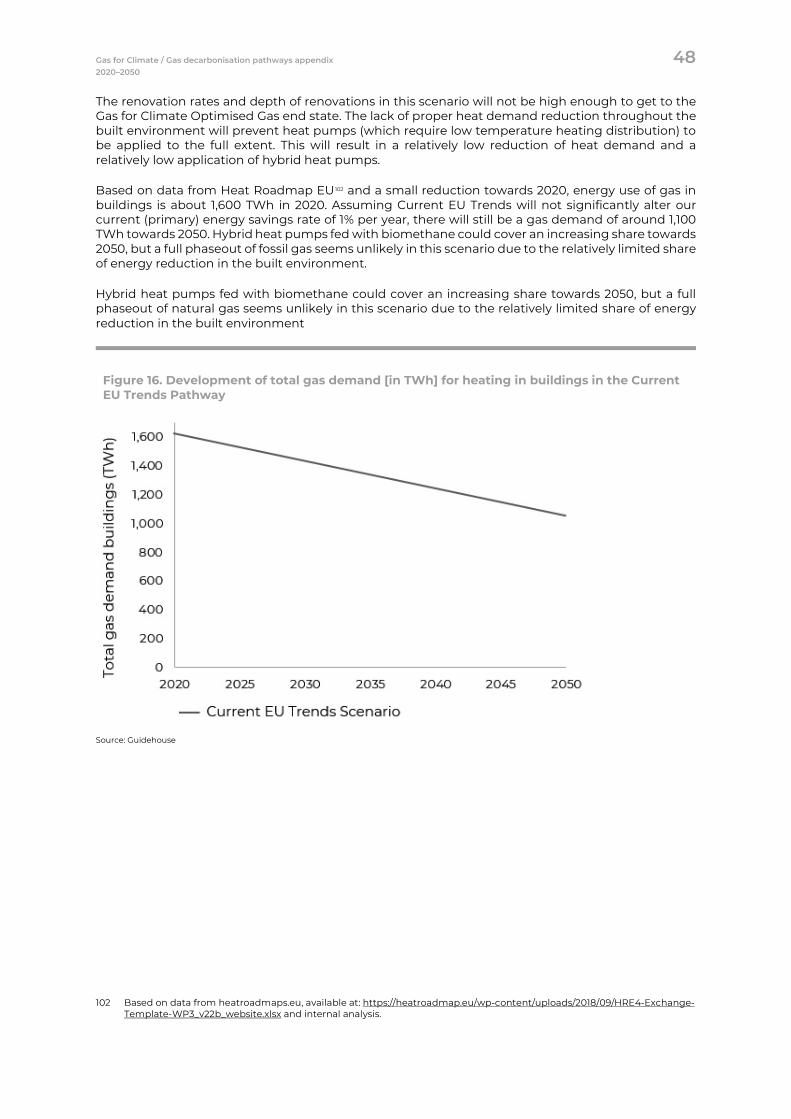
Gas for Climate / Gas decarbonisation pathways appendix 48 2020–2050
The renovation rates and depth of renovations in this scenario will not be high enough to get to the Gas for Climate Optimised Gas end state. The lack of proper heat demand reduction throughout the built environment will prevent heat pumps (which require low temperature heating distribution) to be applied to the full extent. This will result in a relatively low reduction of heat demand and a relatively low application of hybrid heat pumps.
Based on data from Heat Roadmap EU102 and a small reduction towards 2020, energy use of gas in buildings is about 1,600 TWh in 2020. Assuming Current EU Trends will not significantly alter our current (primary) energy savings rate of 1% per year, there will still be a gas demand of around 1,100 TWh towards 2050. Hybrid heat pumps fed with biomethane could cover an increasing share towards 2050, but a full phaseout of fossil gas seems unlikely in this scenario due to the relatively limited share of energy reduction in the built environment.
Hybrid heat pumps fed with biomethane could cover an increasing share towards 2050, but a full phaseout of natural gas seems unlikely in this scenario due to the relatively limited share of energy reduction in the built environment
Figure 16. Development of total gas demand [in TWh] for heating in buildings in the Current EU Trends Pathway
Source: Guidehouse
102 Based on data from heatroadmaps.eu, available at: https://heatroadmap.eu/wp-content/uploads/2018/09/HRE4-Exchange-
Template-WP3_v22b_website.xlsx and internal analysis.
Gas for Climate / Gas decarbonisation pathways appendix 49 2020–2050
Accelerated Decarbonisation Pathway – Buildings
Conclusion Accelerated Decarbonisation
The Accelerated Decarbonisation Pathway envisions a significant increase in energy renovation rates towards 2030 (to between 2.5% and 3% per year) to reach net-zero emissions, as in the Gas for Climate 2050 Optimised Gas end state. Focused policies such as long-term renovation targets and increasing required minimal energy performance levels of existing buildings could help reach this challenging goal. In addition, increasing knowledge build-up around low carbon buildings, reducing hassles for building owners, and supporting financing options are required to create the right environment. A more focused push to switch to low carbon heating technologies in well-insulated buildings is necessary to get to the right pathway.
Current gas used for heating and hot domestic water is about 1,600 TWh (almost all natural gas), which would reduce towards around 1,300 TWh in 2030 before reaching the Gas for Climate Optimised Gas end state of 400 TWh biomethane and (a small share of) hydrogen in 2050, all in hybrid heat pumps by then.
3.3.1 Implications of the European Green Deal for buildings
The European Commission’s strategy, A Clean Planet for All,103 acknowledges that almost the full building stock requires renovation to meet the 2050 targets. The communication on the European Green Deal of December 2019104 indicates a more focused and rigorous approach to energy efficiency and renewable energy production in the built environment, although details and specific legislation and actions are still to be defined.
A rigorous and successful approach to decarbonise the EU building stock should aim to lift the barriers as discussed in the previous section: the low renovation rate and insufficient renovation depth of the EU building stock. A comprehensive policy design and implementation should also address societal barriers:105
• (Perceived) lack of business case or benefit from energy renovations • Too expensive or difficult to finance • Lack of knowledge and information at stakeholders • Administrative/regulatory barriers • Unavailability of installers
103 European Commission 2018. In-depth analysis in support of the commission communication, page 90. Available at:
https://ec.europa.eu/clima/sites/clima/files/docs/pages/com_2018_733_analysis_in_support_en_0.pdf. 104 European Commission, 2019, Communication from the commission to the European Parliament, the European Council,
The Council, The European Economic and Social Committee and the Committee of the Regions, page 9-10. Available at: https://ec.europa.eu/info/sites/info/files/european-green-deal-communication_en.pdf.
105 Ipsos & Navigant, 2019. Comprehensive study of building energy renovation activities and the uptake of nearly zero-energy buildings in the EU, pages 56-62. Available at: https://ec.europa.eu/energy/sites/ener/files/documents/1.final_report.pdf.
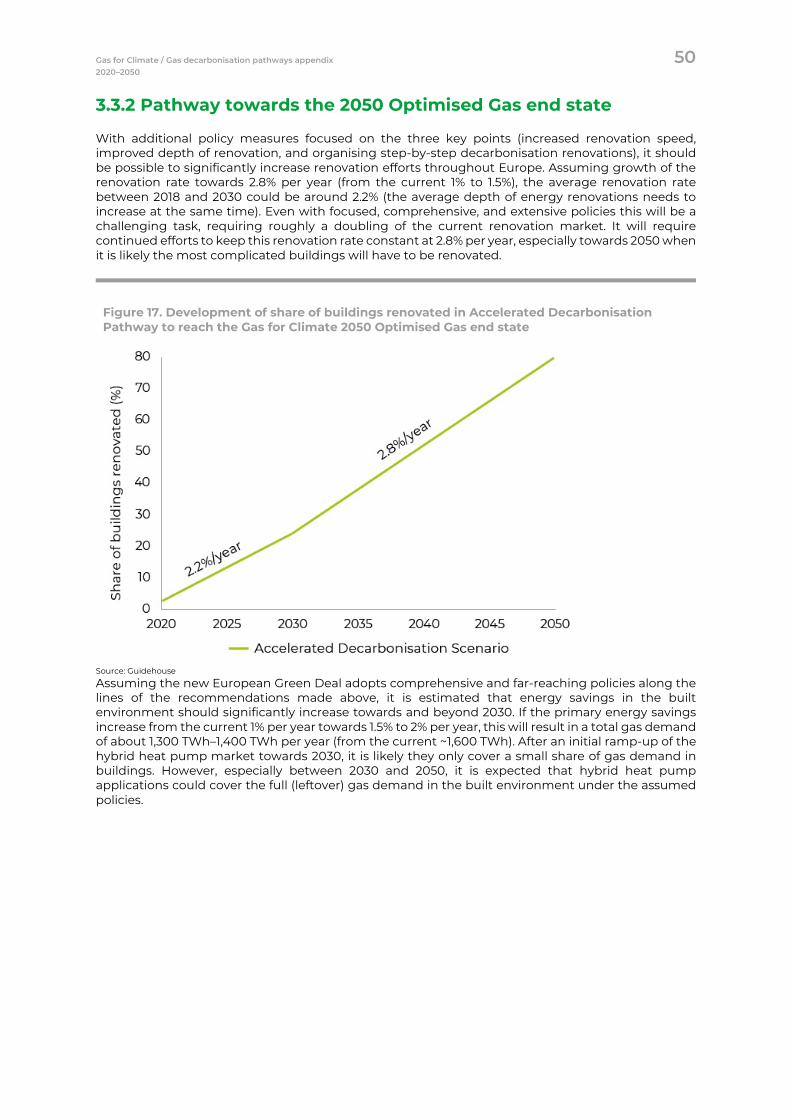
Gas for Climate / Gas decarbonisation pathways appendix 50 2020–2050
3.3.2 Pathway towards the 2050 Optimised Gas end state
With additional policy measures focused on the three key points (increased renovation speed, improved depth of renovation, and organising step-by-step decarbonisation renovations), it should be possible to significantly increase renovation efforts throughout Europe. Assuming growth of the renovation rate towards 2.8% per year (from the current 1% to 1.5%), the average renovation rate between 2018 and 2030 could be around 2.2% (the average depth of energy renovations needs to increase at the same time). Even with focused, comprehensive, and extensive policies this will be a challenging task, requiring roughly a doubling of the current renovation market. It will require continued efforts to keep this renovation rate constant at 2.8% per year, especially towards 2050 when it is likely the most complicated buildings will have to be renovated.
Figure 17. Development of share of buildings renovated in Accelerated Decarbonisation Pathway to reach the Gas for Climate 2050 Optimised Gas end state
Source: Guidehouse
Assuming the new European Green Deal adopts comprehensive and far-reaching policies along the lines of the recommendations made above, it is estimated that energy savings in the built environment should significantly increase towards and beyond 2030. If the primary energy savings increase from the current 1% per year towards 1.5% to 2% per year, this will result in a total gas demand of about 1,300 TWh–1,400 TWh per year (from the current ~1,600 TWh). After an initial ramp-up of the hybrid heat pump market towards 2030, it is likely they only cover a small share of gas demand in buildings. However, especially between 2030 and 2050, it is expected that hybrid heat pump applications could cover the full (leftover) gas demand in the built environment under the assumed policies.
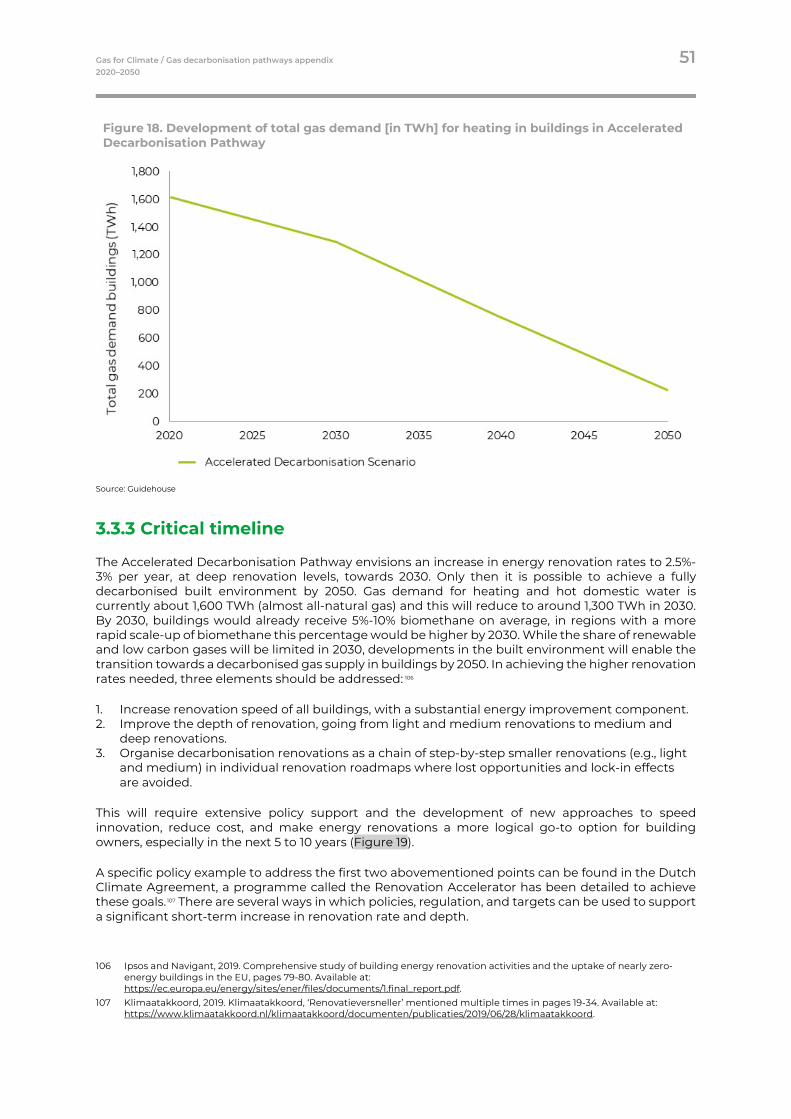
Gas for Climate / Gas decarbonisation pathways appendix 51 2020–2050
Figure 18. Development of total gas demand [in TWh] for heating in buildings in Accelerated Decarbonisation Pathway
Source: Guidehouse
3.3.3 Critical timeline
The Accelerated Decarbonisation Pathway envisions an increase in energy renovation rates to 2.5%-3% per year, at deep renovation levels, towards 2030. Only then it is possible to achieve a fully decarbonised built environment by 2050. Gas demand for heating and hot domestic water is currently about 1,600 TWh (almost all-natural gas) and this will reduce to around 1,300 TWh in 2030. By 2030, buildings would already receive 5%-10% biomethane on average, in regions with a more rapid scale-up of biomethane this percentage would be higher by 2030. While the share of renewable and low carbon gases will be limited in 2030, developments in the built environment will enable the transition towards a decarbonised gas supply in buildings by 2050. In achieving the higher renovation rates needed, three elements should be addressed: 106
1. Increase renovation speed of all buildings, with a substantial energy improvement component. 2. Improve the depth of renovation, going from light and medium renovations to medium and
deep renovations. 3. Organise decarbonisation renovations as a chain of step-by-step smaller renovations (e.g., light
and medium) in individual renovation roadmaps where lost opportunities and lock-in effects are avoided.
This will require extensive policy support and the development of new approaches to speed innovation, reduce cost, and make energy renovations a more logical go-to option for building owners, especially in the next 5 to 10 years (Figure 19).
A specific policy example to address the first two abovementioned points can be found in the Dutch Climate Agreement, a programme called the Renovation Accelerator has been detailed to achieve these goals.107 There are several ways in which policies, regulation, and targets can be used to support a significant short-term increase in renovation rate and depth.
106 Ipsos and Navigant, 2019. Comprehensive study of building energy renovation activities and the uptake of nearly zero-
energy buildings in the EU, pages 79-80. Available at: https://ec.europa.eu/energy/sites/ener/files/documents/1.final_report.pdf.
107 Klimaatakkoord, 2019. Klimaatakkoord, ‘Renovatieversneller’ mentioned multiple times in pages 19-34. Available at: https://www.klimaatakkoord.nl/klimaatakkoord/documenten/publicaties/2019/06/28/klimaatakkoord.
Gas for Climate / Gas decarbonisation pathways appendix 52 2020–2050
For example:
• Create strong and binding long-term renovation targets. • Support build-up in expertise, knowledge dissipation, and policy support for further development
of the renovation market. • Phaseout newly installed fossil-only heating systems towards 2040. • Focus on soft non-technical factors such as improving health, reducing hassles for building
owners, and improving building quality and looks. • Embed these measures in a comprehensive approach to focus on decarbonisation such as
increasing CO2 prices or trading mechanics, increasing availability of low rent long-term green loans, and supporting taxation and subsidy schemes.
Start a renovation wave
Decarbonising the built environment affects a broad variety of stakeholders. Private house owners, building corporations, and commercial real estate owners need to invest in increasing the building stock’s energy efficiency. Local governments need to provide the vision and strategy on how areas should develop. Energy distribution companies and energy companies could play an organising and facilitating role in this as well. For serialised scale-up of renovation by housing corporations and commercial real estate owners, it is key that the building industry realises industrial innovation and standardisation to drive cost reduction. Extensive energy efficiency measures are best timed at natural investment moments, such as a change in building owners or tenants, or when investments in the building energy system are necessary. The energy and buildings industry need to offer approaches to unburden building owners through standardised solutions, renovation roadmaps, guarantees, and financing options.
Long-term renovation targets and increasing the required minimal energy performance levels of existing buildings are examples of focused policies that could help buildings reach higher renovation rates. One of the EU Green Deal’s objectives is to start a renovation wave. An example of a policy that addresses the elements above is the Renovation Accelerator as included in the Dutch Climate Agreement.108
Increasing knowledge around low carbon buildings, reducing hassle for building owners, and supporting financing options are required to create the right environment. A more focused push to switch to low carbon heating technologies in well-insulated buildings is necessary to get to the right pathway. The full renovation system must be in place and doing the right renovation at high enough renovation rates by 2030.
Deployment of hybrid heating solutions
In addition to improving buildings’ energy efficiency, a transition towards low carbon heating technologies is needed. Technology providers need to make sure that low carbon technologies, including hybrid heat pumps, are developed and offered in a structured way. Building owners can then move to low carbon heating technologies at natural replacement moments. While building renovation is a good time to implement low carbon heating technologies, full alignment is not critical. When building renovation is planned for a later date, hybrid heating solutions can be applied to decarbonise the heating system. Such a transition pathway can look as follows:
• Per building, a modest electric heat pump is added to the existing gas-fired boiler, with a smart control to make the combination a hybrid heat pump.
• As the home becomes better insulated, the electric heat pump takes up a higher share of the heating, and the ratio between gas and electricity shifts.
As the share of biomethane and hydrogen in the gas distribution grid increases, gas is increasingly decarbonised. As the share of renewables in the electricity distribution grid increases, electricity is greened.
108 Klimaatakkoord, 2019. Klimaatakkoord, ‘Renovatieversneller’ mentioned multiple times in pages 19-34. Available at:
https://www.klimaatakkoord.nl/klimaatakkoord/documenten/publicaties/2019/06/28/klimaatakkoord.
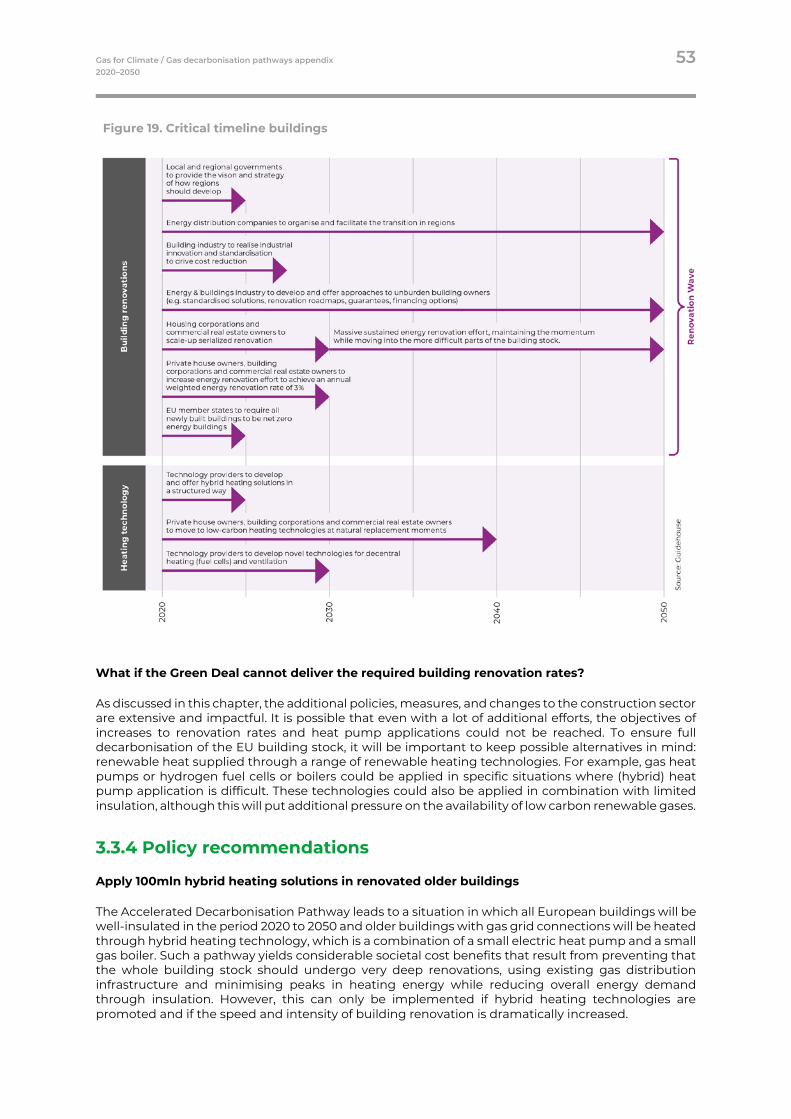
Gas for Climate / Gas decarbonisation pathways appendix 53 2020–2050
Figure 19. Critical timeline buildings
What if the Green Deal cannot deliver the required building renovation rates?
As discussed in this chapter, the additional policies, measures, and changes to the construction sector are extensive and impactful. It is possible that even with a lot of additional efforts, the objectives of increases to renovation rates and heat pump applications could not be reached. To ensure full decarbonisation of the EU building stock, it will be important to keep possible alternatives in mind: renewable heat supplied through a range of renewable heating technologies. For example, gas heat pumps or hydrogen fuel cells or boilers could be applied in specific situations where (hybrid) heat pump application is difficult. These technologies could also be applied in combination with limited insulation, although this will put additional pressure on the availability of low carbon renewable gases.
3.3.4 Policy recommendations
Apply 100mln hybrid heating solutions in renovated older buildings
The Accelerated Decarbonisation Pathway leads to a situation in which all European buildings will be well-insulated in the period 2020 to 2050 and older buildings with gas grid connections will be heated through hybrid heating technology, which is a combination of a small electric heat pump and a small gas boiler. Such a pathway yields considerable societal cost benefits that result from preventing that the whole building stock should undergo very deep renovations, using existing gas distribution infrastructure and minimising peaks in heating energy while reducing overall energy demand through insulation. However, this can only be implemented if hybrid heating technologies are promoted and if the speed and intensity of building renovation is dramatically increased.
Gas for Climate / Gas decarbonisation pathways appendix 54 2020–2050
The main EU policies that drive decarbonisation in the EU buildings stock (EPBD, EED, and LTRS) fall short in delivering the necessary renovation speed. Today, limited incentives for hybrid heating solutions exist.109 In policy studies and scenarios, the option is often overlooked: by 2050, buildings are assumed to be heated either with (all-)electric heat pumps or by district heating or using renewable gas. Consumers are largely unaware of the option of hybrid heating, and installers have insufficient knowledge of how to change an existing gas-fired heating system into a hybrid one.
The following policy changes should be considered as part of the EU Green Deal:
1. Set ambitious binding targets for energy renovations of buildings, both in terms of the depth of renovations and the speed of their implementation in member states. These targets should create a renovation wave that drives the improvement of buildings’ energy performance.
2. Take up the option of hybrid heating systems in policy studies, scenarios, and in plans for the announced Renovation Wave.
3. Foster increased awareness of hybrid heating systems through EU political support and by programmes initiated by member states, installers, and consumers.
4. Create a sustainable market environment for hybrid heating systems, and
Actively propagate the installation of hybrid heat pumps in older buildings that have gas connections today.
109 An example is a subsidy of €800 in Flanders, Belgium (https://www.vlaanderen.be/premie-van-de-netbeheerder-voor-een-
warmtepomp) and €1,500-€1,800 in the Netherlands (https://www.milieucentraal.nl/energie-besparen/energiezuinig-huis/financiering-energie-besparen/subsidie-warmtepompen/).
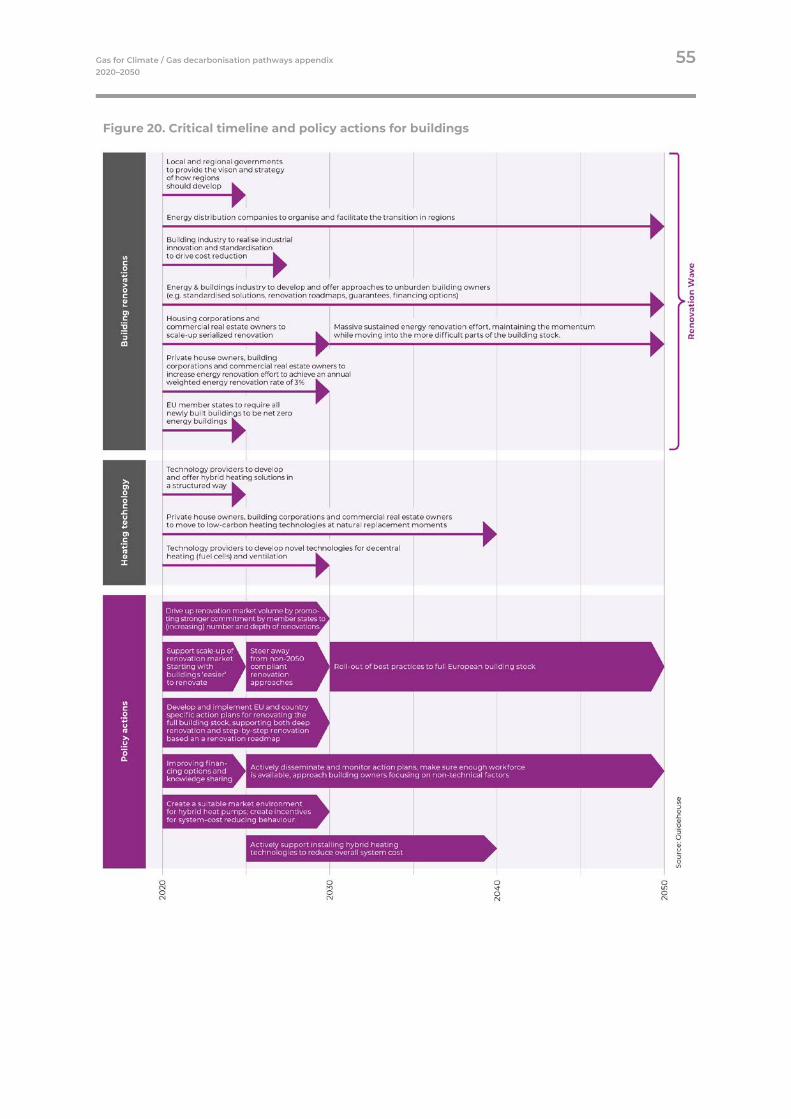
Gas for Climate / Gas decarbonisation pathways appendix 55 2020–2050
Figure 20. Critical timeline and policy actions for buildings
Gas for Climate / Gas decarbonisation pathways appendix 56 2020–2050
Global Climate Action Pathway
Conclusion Global Climate Action
The Global Climate Action Pathway indicates that significant cost reductions to insulation and heating technologies could speed up the renovation process by opening the possibility to perform significant energy renovations outside of normal renovation cycles. In addition, faster, more convenient renovations and a wider range of renovation options enables a faster scale-up towards net-zero emissions, as in the Gas for Climate 2050 Optimised Gas end state.
The current natural gas for heating and hot domestic water of about 1,600 TWh will reduce towards around 1,200 TWh in 2030 under these assumptions, and the Gas for Climate end vision of 400 TWh in 2050. The share of gas use for hybrid heat pumps will be limited, but all gas use in 2050 is expected to be for hybrid heat pumps.
3.4.1 Expected technological and cost developments
The basic components of a deep energy renovation are already widely available in the market: insulation materials and heat pumps have been implemented for years in many buildings. However, applying these two components at a significantly higher implementation speed will be crucial. In this scenario, we assumed several technology developments could provide solutions to further decarbonise the buildings sector:
• More standardising of renovations: Serialised renovations or industrial renovations where whole streets of similar houses are renovated at the same time.
• Involvement of pre-fabrication industry: In this industry, components are made on-demand and site-specific to improve the renovation time. This can significantly reduce labour requirements, which means companies can renovate more buildings.110
• The establishment of companies that work as process leaders: These companies will reduce the hassle for building owners by proposing a plan, taking care of selecting providers, and financing and making sure planning and quality are in order.
• Improvements in heat pump technology: Improvements include soundwave-based heat pumps or room-specific air-to-air installations including ventilation. Another possibility is a combination of heat pumps with infrared heating for rarely used rooms.
Like technology developments, global action can also affect costs for insulation materials, heat pumps and standardised (serial/industrial) renovations. It is likely that significant price developments could speed the process of renovation by providing a more compelling business case. New insulation materials, heat distribution technologies, and non-material price reductions (e.g. more efficient installation) could provide for cost reductions. Such cost reductions can increase the energetic component of regular renovations and could even provide the possibility of deeper renovations outside of normal renovation cycles.
Many of the elements listed above are developments that also occur as part of the Accelerated Decarbonisation Pathway, yet global action and sharing of best practices may lead to better, cheaper solutions.
110 ING, 2018. [Dutch] ConTech: Technologie in de bouw. Bouw digitaliseert volop maar industrialiseert nauwelijks. Available at:
https://www.ing.nl/media/ING_EBZ_ConTech_Bouw-digitaliseert-volop-maar-industrialiseert-nauwelijks_Nov-2018_tcm162-157771.pdf.
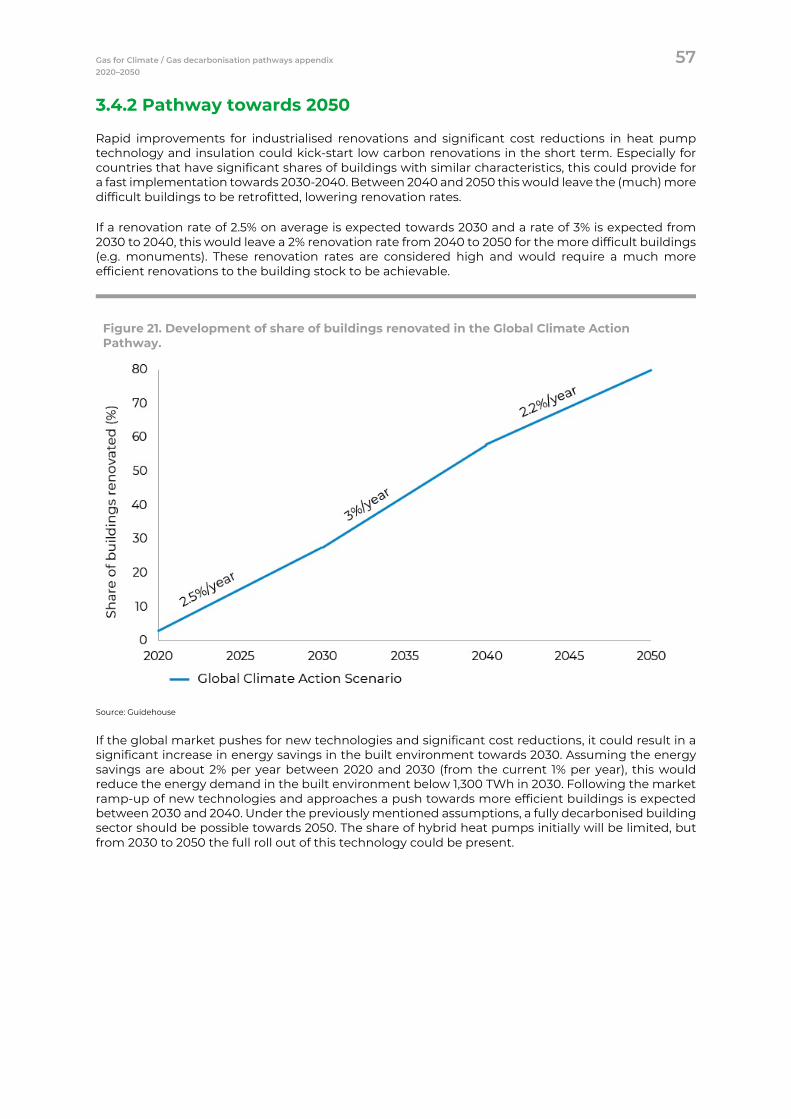
Gas for Climate / Gas decarbonisation pathways appendix 57 2020–2050
3.4.2 Pathway towards 2050
Rapid improvements for industrialised renovations and significant cost reductions in heat pump technology and insulation could kick-start low carbon renovations in the short term. Especially for countries that have significant shares of buildings with similar characteristics, this could provide for a fast implementation towards 2030-2040. Between 2040 and 2050 this would leave the (much) more difficult buildings to be retrofitted, lowering renovation rates.
If a renovation rate of 2.5% on average is expected towards 2030 and a rate of 3% is expected from 2030 to 2040, this would leave a 2% renovation rate from 2040 to 2050 for the more difficult buildings (e.g. monuments). These renovation rates are considered high and would require a much more efficient renovations to the building stock to be achievable.
Figure 21. Development of share of buildings renovated in the Global Climate Action Pathway.
Source: Guidehouse
If the global market pushes for new technologies and significant cost reductions, it could result in a significant increase in energy savings in the built environment towards 2030. Assuming the energy savings are about 2% per year between 2020 and 2030 (from the current 1% per year), this would reduce the energy demand in the built environment below 1,300 TWh in 2030. Following the market ramp-up of new technologies and approaches a push towards more efficient buildings is expected between 2030 and 2040. Under the previously mentioned assumptions, a fully decarbonised building sector should be possible towards 2050. The share of hybrid heat pumps initially will be limited, but from 2030 to 2050 the full roll out of this technology could be present.
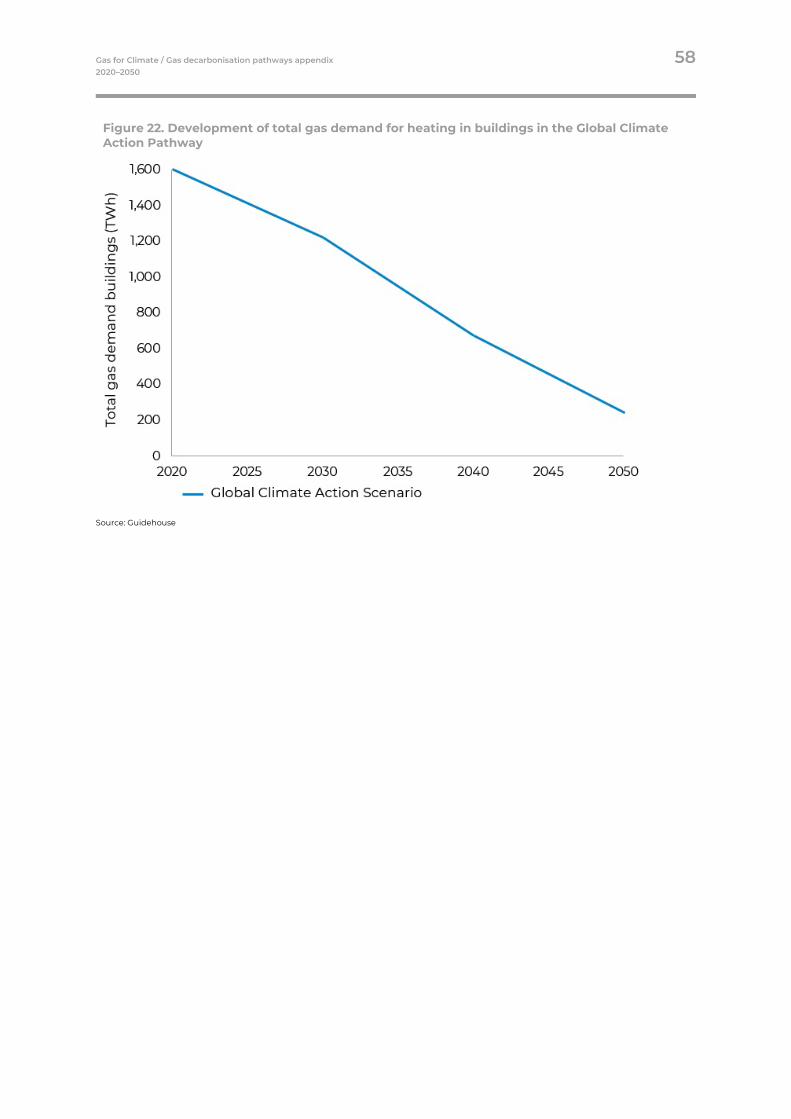
Gas for Climate / Gas decarbonisation pathways appendix 58 2020–2050
Figure 22. Development of total gas demand for heating in buildings in the Global Climate Action Pathway
Source: Guidehouse
Gas for Climate / Gas decarbonisation pathways appendix 59 2020–2050
Industry Decarbonisation Pathways Key Takeaways
• The Gas for Climate 2050 end state is extremely difficult to reach under the Current EU Trends Pathway. Investments in breakthrough technologies will likely be postponed due to the lack of a supporting regulatory framework or go into conventional technologies, creating long-term lock-in effects. The uptake of renewable and low carbon gases is limited to around 25 TWh-35 TWh in 2030.
• A more ambitious Accelerated Decarbonisation Pathway would result in a carbon price that allows for investments in breakthrough technologies. Biomethane would partly replace natural gas in the 2020s. First large-scale hydrogen applications in steel and ammonia production would be initiated towards the end of the 2020s. The demand for renewable and low carbon gas would increase to 70 TWh-100 TWh in 2030.
• Global climate action supported by a global carbon price of €55/t CO2 by 2030 would lead to the rapid phaseout of fossil fuels, including natural gas. Biomethane and hydrogen would already make up one-third of final energy consumption in industry by 2030. An international market for synthetic fuels would emerge, partly replacing European hydrogen demand, in particular for methanol.
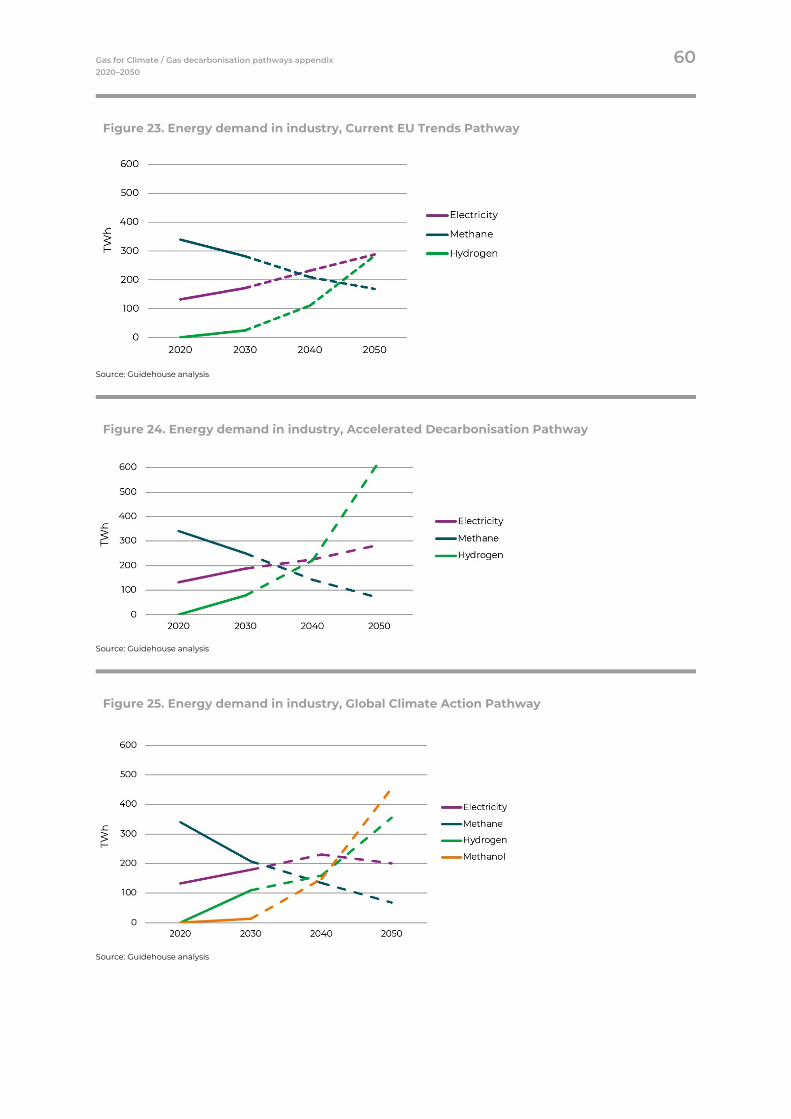
Gas for Climate / Gas decarbonisation pathways appendix 60 2020–2050
Figure 23. Energy demand in industry, Current EU Trends Pathway
Source: Guidehouse analysis
Figure 24. Energy demand in industry, Accelerated Decarbonisation Pathway
Source: Guidehouse analysis
Figure 25. Energy demand in industry, Global Climate Action Pathway
Source: Guidehouse analysis
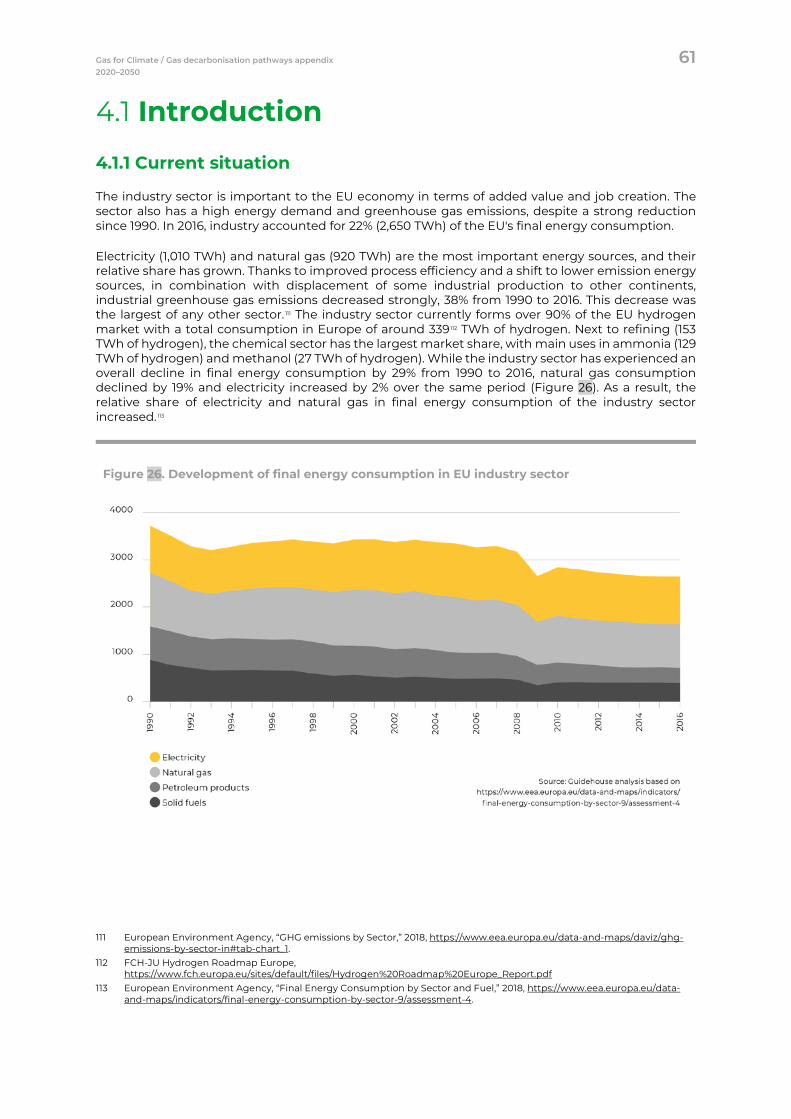
Gas for Climate / Gas decarbonisation pathways appendix 61 2020–2050
Introduction
4.1.1 Current situation
The industry sector is important to the EU economy in terms of added value and job creation. The sector also has a high energy demand and greenhouse gas emissions, despite a strong reduction since 1990. In 2016, industry accounted for 22% (2,650 TWh) of the EU's final energy consumption.
Electricity (1,010 TWh) and natural gas (920 TWh) are the most important energy sources, and their relative share has grown. Thanks to improved process efficiency and a shift to lower emission energy sources, in combination with displacement of some industrial production to other continents, industrial greenhouse gas emissions decreased strongly, 38% from 1990 to 2016. This decrease was the largest of any other sector.111 The industry sector currently forms over 90% of the EU hydrogen market with a total consumption in Europe of around 339112 TWh of hydrogen. Next to refining (153 TWh of hydrogen), the chemical sector has the largest market share, with main uses in ammonia (129 TWh of hydrogen) and methanol (27 TWh of hydrogen). While the industry sector has experienced an overall decline in final energy consumption by 29% from 1990 to 2016, natural gas consumption declined by 19% and electricity increased by 2% over the same period (Figure 26). As a result, the relative share of electricity and natural gas in final energy consumption of the industry sector increased.113
Figure 26. Development of final energy consumption in EU industry sector
111 European Environment Agency, “GHG emissions by Sector,” 2018, https://www.eea.europa.eu/data-and-maps/daviz/ghg-
emissions-by-sector-in#tab-chart_1. 112 FCH-JU Hydrogen Roadmap Europe,
https://www.fch.europa.eu/sites/default/files/Hydrogen%20Roadmap%20Europe_Report.pdf 113 European Environment Agency, “Final Energy Consumption by Sector and Fuel,” 2018, https://www.eea.europa.eu/data-
and-maps/indicators/final-energy-consumption-by-sector-9/assessment-4.
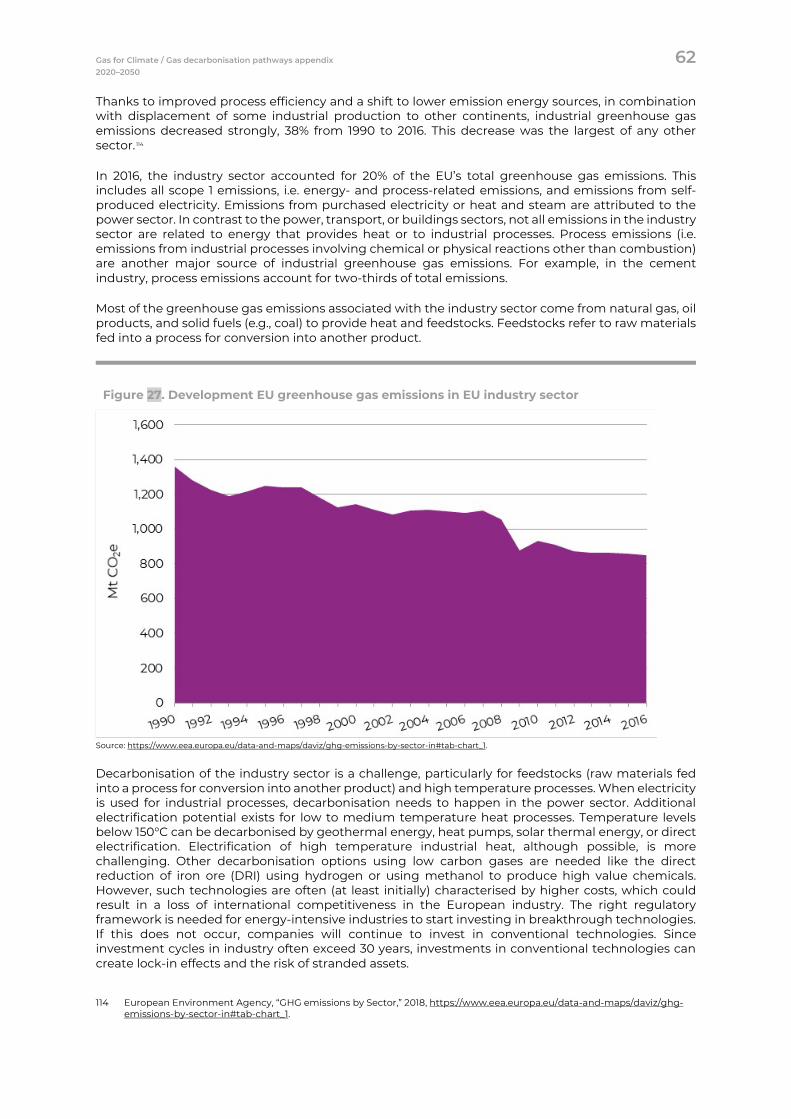
Gas for Climate / Gas decarbonisation pathways appendix 62 2020–2050
Thanks to improved process efficiency and a shift to lower emission energy sources, in combination with displacement of some industrial production to other continents, industrial greenhouse gas emissions decreased strongly, 38% from 1990 to 2016. This decrease was the largest of any other sector.114
In 2016, the industry sector accounted for 20% of the EU’s total greenhouse gas emissions. This includes all scope 1 emissions, i.e. energy- and process-related emissions, and emissions from self-produced electricity. Emissions from purchased electricity or heat and steam are attributed to the power sector. In contrast to the power, transport, or buildings sectors, not all emissions in the industry sector are related to energy that provides heat or to industrial processes. Process emissions (i.e. emissions from industrial processes involving chemical or physical reactions other than combustion) are another major source of industrial greenhouse gas emissions. For example, in the cement industry, process emissions account for two-thirds of total emissions.
Most of the greenhouse gas emissions associated with the industry sector come from natural gas, oil products, and solid fuels (e.g., coal) to provide heat and feedstocks. Feedstocks refer to raw materials fed into a process for conversion into another product.
Figure 27. Development EU greenhouse gas emissions in EU industry sector
Source: https://www.eea.europa.eu/data-and-maps/daviz/ghg-emissions-by-sector-in#tab-chart_1.
Decarbonisation of the industry sector is a challenge, particularly for feedstocks (raw materials fed into a process for conversion into another product) and high temperature processes. When electricity is used for industrial processes, decarbonisation needs to happen in the power sector. Additional electrification potential exists for low to medium temperature heat processes. Temperature levels below 150°C can be decarbonised by geothermal energy, heat pumps, solar thermal energy, or direct electrification. Electrification of high temperature industrial heat, although possible, is more challenging. Other decarbonisation options using low carbon gases are needed like the direct reduction of iron ore (DRI) using hydrogen or using methanol to produce high value chemicals. However, such technologies are often (at least initially) characterised by higher costs, which could result in a loss of international competitiveness in the European industry. The right regulatory framework is needed for energy-intensive industries to start investing in breakthrough technologies. If this does not occur, companies will continue to invest in conventional technologies. Since investment cycles in industry often exceed 30 years, investments in conventional technologies can create lock-in effects and the risk of stranded assets.
114 European Environment Agency, “GHG emissions by Sector,” 2018, https://www.eea.europa.eu/data-and-maps/daviz/ghg-
emissions-by-sector-in#tab-chart_1.
Gas for Climate / Gas decarbonisation pathways appendix 63 2020–2050
As in the Gas for Climate 2050 study published in 2019, the analysis below focuses on the most emissions-intensive and hard to decarbonise industry sectors: chemicals (production of ammonia and high value chemicals), iron and steel, and cement. Those three sectors represent just over half of industrial greenhouse gas emissions in Europe.
4.1.2 Gas for Climate 2050 Optimised Gas end state
The Gas for Climate 2019 study concluded that biomethane, green and blue hydrogen and carbon capture storage/utilisation (CCS/CCU) play a central role in reducing emissions in the chemical, steel, and cement industry. Hydrogen is key to reducing emissions from ammonia and high value chemical (HVC) production in the chemical industry. While the ammonia production process will stay largely unchanged and use renewable hydrogen as feedstock instead of grey hydrogen, the HVC production will largely shift from steam cracking to the methanol-to-olefins (MTO) route. In the steel sector, the blast furnace process for primary steelmaking will be replaced by innovative, low carbon steelmaking technologies based on carbon capture and low carbon gases. Secondary steelmaking will also play a bigger role in 2050, meeting 50% of the steel demand in 2050. The cement industry will reduce its process emissions by applying carbon capture and reduce its energy-related emissions by switching from fossil fuels to solid biomass.
Industry pathway under current EU climate and energy policies
Conclusion Current EU Trends
There will be limited decarbonisation efforts up until 2030 under the Current EU Trends Pathway. The focus is on improved energy efficiency of existing processes to meet the current 2030 greenhouse gas reduction targets. We project a slow uptake in renewable gases in 2020-2030 (around 25-35 TWh) and the postponement of investments in breakthrough technologies until after 2030, missing the major natural replacement moments occurring in this decade. Alternatively, investments may be made in conventional technologies, causing the risk for long-term lock-ins and stranded assets. Hence, the Gas for Climate 2050 Optimised Gas end state is unlikely to be reached under the Current EU Trends Pathway.
4.2.1 EU policies
Current policies are aligned under the EU 2030 Climate and Energy framework, which sets the target to cut greenhouse gas emissions by at least 40% in 2030 compared to 1990 levels. The revised framework also aims to increase the share of renewable energy to at least 32% and achieve an energy efficiency improvement of at least 32.5% by 2030.
EU ETS is a cornerstone of the EU's policy to combat climate change and is the key tool for reducing greenhouse gas emissions in the industry sector. It was the world's first major carbon market and remains the biggest. The system operates in all EU countries, in addition to Iceland, Liechtenstein, and Norway. It limits emissions from more than 11,000 heavy energy-using installations (power stations and industrial plants) and airlines operating between these countries. The system covers around 45% of the EU's greenhouse gas emissions, and the EU ETS sectors will have to cut emissions by 43% in 2030 (compared to 2005). The EU ETS also provides revenue to the world’s largest funding programme for demonstration of innovative low carbon technologies—the EU Innovation Fund. Depending on the carbon price, the fund may amount to about €10 billion until 2030, to support innovation for energy-intensive industry, renewables, energy storage, and CCS/CCU.
Gas for Climate / Gas decarbonisation pathways appendix 64 2020–2050
Under the EU ETS, the price of CO2 has quadrupled in the past 3 years from around €5/tCO2 to more than €20/t CO2.115 This increase is mainly caused by the overhaul of the EU ETS Directive for the years 2021-2030, which has already resulted in a reduction in the number of CO2 certificates on the market. Higher CO2 prices increase the production costs for the energy-intensive industry and consequently influence decisions on investing in breakthrough technologies. In the Current EU Trends Pathway, we use a moderate price increase reaching €35/t CO2 in 2030.116
Other EU policies that substantially impact the industry sector include the 2017 industry strategy and the 2015 action plan on circular economy. In September 2017, the European Commission adopted its communication on Investing in a Smart, Innovative and Sustainable Industry – An Industrial Strategy for Europe. This outlined the main priorities and key actions for strengthening Europe's industrial base, including: a deeper and fairer single market, upgrading industry for the digital age, building on Europe's leadership in a low carbon and circular economy, investing in infrastructure and new technologies to drive industrial transformation, supporting industrial innovation on the ground, promoting open and rules-based trade, and empowering regions and cities to address challenges. The EU Action Plan for the Circular Economy, published in 2015, aims to stimulate Europe's transition towards a circular economy, boost global competitiveness, foster sustainable economic growth, and generate new jobs.
4.2.2 Regional differences
Industry is typically organised in clusters, resulting in industrial sites being concentrated in specific geographies across Europe. Germany is the main industrial centre in the EU; other countries with a significant industry sector include Italy, the Netherlands, Spain, and France. While the previously mentioned EU policies affect industry regardless of location, member states also have implemented policies to reduce energy consumption in and greenhouse gas emissions from the industry sector. Germany and the Netherlands have specific strategies on the role of hydrogen.
Germany
Germany accounts for 26% of crude steel production and 29% of EU chemical sales.117, 118 In 2018, the German industry sector was responsible for 196 million tonnes of greenhouse gas emissions (one-quarter of total greenhouse gas emissions in Germany), down from 284 million tonnes in 1990.119 In December 2019, the government adopted a climate policy package (Klimaschutzprogramm 2030) to meet its 2030 targets. For the industry sector, the programme focuses on energy efficiency, resource efficiency and substitution, and the use of renewable fuels for process heat. It also includes financial aid for demonstration projects of breakthrough technologies.
The German government began drafting its national hydrogen strategy in 2019. Reports suggest that the use of hydrogen will be prioritised in sectors with limited alternative options for decarbonisation (such as steel and chemicals). Levies for electricity should also change to allow for the cheaper production of green hydrogen. The draft strategy is reported to aim for the integration of electricity, heat, and gas infrastructure, the use of existing infrastructure for hydrogen transport, and energy partnerships with EU and non-EU countries.
The Netherlands
The Netherlands accounts for 4% of EU steel production and 10% of chemical sales. In June 2019, the Dutch government published its Climate Agreement, which details how the reduction target of 49% greenhouse gas emissions in 2030 (compared to 1990 levels) should be achieved.
115 Sandbag, “Carbon Price Viewer”, https://sandbag.org.uk/carbon-price-viewer/. 116 In line with the EU CO2 price in IEA’s WEO 2019 117 Eurofer, “European Steel in Figures 2019”, http://www.eurofer.org/201907-
SteelFigures.pdf?wtd=aZO7VePBb33NWwWF&request=resource&resource=ok3819r&rand=2 118 Cefic, “2020 Facts & Figures of the European chemical industry”, https://cefic.org/app/uploads/2019/01/The-European-
Chemical-Industry-Facts-And-Figures-2020.pdf 119 Umwelt Bundesamt, “Germany’s Climate Protection Goals,” May 6, 2019
https://www.umweltbundesamt.de/daten/klima/klimaschutzziele-deutschlands.
Gas for Climate / Gas decarbonisation pathways appendix 65 2020–2050
For the industry sector, the Dutch Climate Agreement focusses on several elements including a national hydrogen programme, a robust regional cluster approach, the circular economy, and innovation programmes. As part of its national hydrogen programme, the Dutch government wants to accelerate the development of green hydrogen and the hydrogen economy. Hydrogen is seen as the principal decarbonisation solution for reducing process emissions and providing heat above 600°C.
4.2.3 Technological and cost developments
Uncertainty around the long-term investment climate for breakthrough technologies will lead to stagnating industrial research and development in low carbon technologies. As a result, we do not foresee accelerated cost decreases and technological improvements under current EU policies.
4.2.4 Pathway towards 2050
In the Current EU Trends Pathway, we expect limited investments in breakthrough technologies in the coming decade. Due to natural replacement cycles, large investments in the chemical, steel, and cement industry are expected from 2020 to 2030. Many of the current installations, such as steam crackers or blast furnaces, are older than 50 years. The current policy framework does not allow for long-term planning and investments in breakthrough technologies (loss of international competitiveness) leaving the industry with three options:
1. Postponing investments into the 2030s 2. Investing in conventional technologies 3. Investing outside of the EU
Option 1 would see the industry sector investing in maintenance of assets that would normally be replaced by new, more efficient ones. This additional maintenance effort would result in additional costs and conflicts with established investment cycles; it entails the risk of the industry leaving the site after the extended lifetime of the assets. Option 2 would eventually lead to lock-in effects or stranded assets given the long-term nature of investments in industrial plants (>30 years, so reaching beyond 2050). In option 3, regulatory uncertainty would negatively impact long-term planning security. Hence, investments in new technologies that increase demand for low carbon or renewable gases may be carried out outside of Europe.
As a result, the demand for renewable and low carbon gases in 2030 will only be around 25-35 TWh120. This demand is derived from first renewable gas applications in ammonia production and blending of biomethane or hydrogen with natural gas in the direct reduction of iron ore, provided there would be dedicated financial support for this, since the CO2 price is insufficient in the cement sector, only few sites will apply CCS/CCU. Production of low carbon methanol will only be around 2.1 Mt in 2030 (compared to 74.1 Mt in the Gas for Climate 2050 end state) resulting in limited renewable hydrogen demand.
In the remaining industry, the focus will be on improving energy efficiency to reduced energy costs and regulatory costs (e.g., CO2 prices). Electrification of low to medium temperature process and the use of renewable and low carbon gases will only play a minor role.
Given the above, the Gas for Climate 2050 end state is unlikely to be reached under the Current EU Trends Pathway.
120 The 25-35TWh reflects externally sourced low-carbon gases only. It does not include on-site production of blue hydrogen
in industry. In that case, natural gas is the energy carrier sourced by the industry.
Gas for Climate / Gas decarbonisation pathways appendix 66 2020–2050
Accelerated Decarbonisation Pathway – Industry
Conclusion Accelerated Decarbonisation
In the Accelerated Decarbonisation Pathway, an EU Green Deal, higher CO2 prices, and the availability of affordable renewable and low carbon gases in the 2020s will accelerate industrial decarbonisation. We expect around 70-100 TWh of demand in renewable and low carbon gases by 2030. In the mid-2020s, the steel industry will start investing in low carbon steelmaking technologies. The cement industry will implement carbon capture and increase the share of biomass. First large-scale applications of breakthrough technologies will be realised by the end of the 2020s. A large demand for renewable and low carbon hydrogen will arise from ammonia production. Following 2030, the demand will further increase as steam cracking (to produce HVCs) is gradually replaced by the low carbon MTO121 process. Substantial decarbonisation efforts are still needed post 2030; however, reaching the Gas for Climate 2050 Optimised Gas end state with around 700 TWh of renewable gas is plausible.
4.3.1 Implication of the EU Green Deal for industry
The Accelerated Decarbonisation Pathway assumes that European Green Deal will upwardly revise the greenhouse gas emission reduction target of 40% by 2030 to a more ambitious target of 55%. It can be expected that the EU ETS will become more stringent as a result of this more ambitious climate target. Smaller industrial plants not yet covered by the EU ETS may be included after revising the current legislation in 2025. A strengthening of the EU ETS to achieve 55% emission reduction by 2030 may result in an increased CO2 price of €55/tonne in 2030 and a high share of renewables in the energy system.122
The EU Green Deal includes an EU industrial strategy to be adopted by the European Commission in March 2020. In its Communication on the EU Green Deal, the European Commission wrote: “EU industry needs ‘climate and resource front-runners’ to develop the first commercial applications of breakthrough technologies in key industrial sectors by 2030. Priority areas include clean hydrogen, fuel cells and other alternative fuels, energy storage, and carbon capture, storage and utilisation. As an example, the Commission will support clean steel breakthrough technologies leading to a zero-carbon steel making process by 2030 [..].”123
The Green Deal will also encompass a new Circular Economy Action Plan.124 It is also expected to expand the EU ETS Innovation Fund and to initiate a new eco-design working plan. These measures will lead to faster decarbonisation towards 2030.
121 MTO (methanol-to-olefins) is a low carbon production of high value chemical alternative to conventional steam cracking.
Hydrogen and CO2 is used to produce methanol. In the last process step, methanol is synthesised to propylene or ethylene using electricity and steam.
122 Carbon Tracker, 2018, “Carbon Clampdown: Closing the Gap to a Paris-compliant EU-ETS. Available at: https://www.carbontracker.org/reports/carbon-clampdown/
123 EC, Dec 2019, Communication The European Green Deal: https://ec.europa.eu/info/sites/info/files/european-green-deal-communication_en.pdf
124 EU, 6 Jan 2020: New Circular Economy Action Plan – Consultation on the Roadmap open https://circulareconomy.europa.eu/platform/en/news-and-events/all-news/new-circular-economy-action-plan-consultation-roadmap-open
Gas for Climate / Gas decarbonisation pathways appendix 67 2020–2050
4.3.2 Technological and cost developments
More ambitious energy and climate policies and an increased CO2 price will accelerate research and development in breakthrough technologies across industry sectors. Consequently, such technologies will mature quicker entering the market at an early stage resulting in a higher demand for low carbon gases. A growing market for low carbon gases will create incentives for investments on the energy supply side bringing down the costs of low carbon gases due to economies of scale.
4.3.3 Pathway towards the 2050 Optimised Gas end state
In the Accelerated Decarbonisation Pathway, higher CO2 prices and the increasing availability of affordable renewable and low carbon gases in the 2020s will result in faster industrial decarbonisation. Under the EU Green Deal, the implementation of breakthrough technologies in industry will accelerate, resulting in an increased demand of around 70 TWh–100 TWh of renewable and low carbon gases by 2030. By the mid-2020s, industrial companies and research institutes will have made significant efforts to develop breakthrough technologies and bring them to market. We assume that the EU ETS Innovation Fund may subsidise pilot tests and first-of-a-kind plants for low carbon steelmaking and CCS in cement. Higher OPEX from renewable and low carbon gases, critical inputs for low carbon methanol, ammonia, and steel may be partly compensated by policy instruments such as carbon Contracts for Difference (CfDs).125
Switching from blast furnaces to low carbon steelmaking processes (e.g. iron bath reactor smelting reduction), processes in combination with CCS, or direct reduction of iron ore with hydrogen or biomethane would significantly increase demand in renewable and low carbon gases. Since substantial investments exceeding €100 million per technology installation are required, few existing plants will be replaced by 2030. Most plants will be replaced after 2030. Additional factors limiting earlier deployment of breakthrough technologies are planning, permitting, and construction. Since innovative technology may require more time for the aforementioned implementation steps compared to conventional technologies, governments should aim to speed this up.
Industrial processes that use large amounts of natural gas, such as the production of ammonia, will switch to low carbon alternatives in the early 2020s. The shift to renewable and low carbon gases will occur first in industrial clusters with proximity to supply locations, e.g. in the Netherlands (blue hydrogen, and green hydrogen from North Sea wind power). All existing steam methane reformers will be retrofitted with carbon capture by 2035. Some solitary industrial plants may start using hydrogen produced locally or supplied by dedicated hydrogen pipelines from initial larger green hydrogen production sites.
With the emergence of a comprehensive, pan-European hydrogen infrastructure by 2035-2040, the implementation of breakthrough technologies in the industry sector will accelerate, for example, direct reduction with hydrogen in steelmaking.
The mid-2020s will see the implementation of the first small-scale carbon capture pilots in the cement industry. To realise the decarbonisation of HVC production, steam cracking will gradually be replaced by the low carbon MTO route starting around 2030. The shift to a CCU technology like MTO requires CO2 as feedstock. The CO2 will be fossil in the beginning (e.g. from cement production), which will require CO2 infrastructure. Towards the Gas for Climate 2050 end state, fossil CO2 will be replaced by biogenic CO2, or to the extent needed by atmospheric from direct air capture. Additionally, large amounts of hydrogen are needed to produce low carbon methanol. The implementation of breakthrough technologies largely depends on the regulatory framework. Other factors, such as societal acceptance and the build-up of additional infrastructure, must also be considered.
In the remaining industry, electrification of low temperature heat is accelerated compared to the Current EU Trends Pathway. High temperature heat pumps provide medium temperature heat (80°C-150°C) in industries such as food and beverages.
125 A CfD is a contract between an industry company investing in a breakthrough technology and a government body. The
idea is that the company is paid by the government body, over a predetermined number of years, the difference between the ‘reference price’– the CO2 price under the EU ETS – and the ‘strike price’ – a price that reflects the CO2 abatement costs of a particular technology.
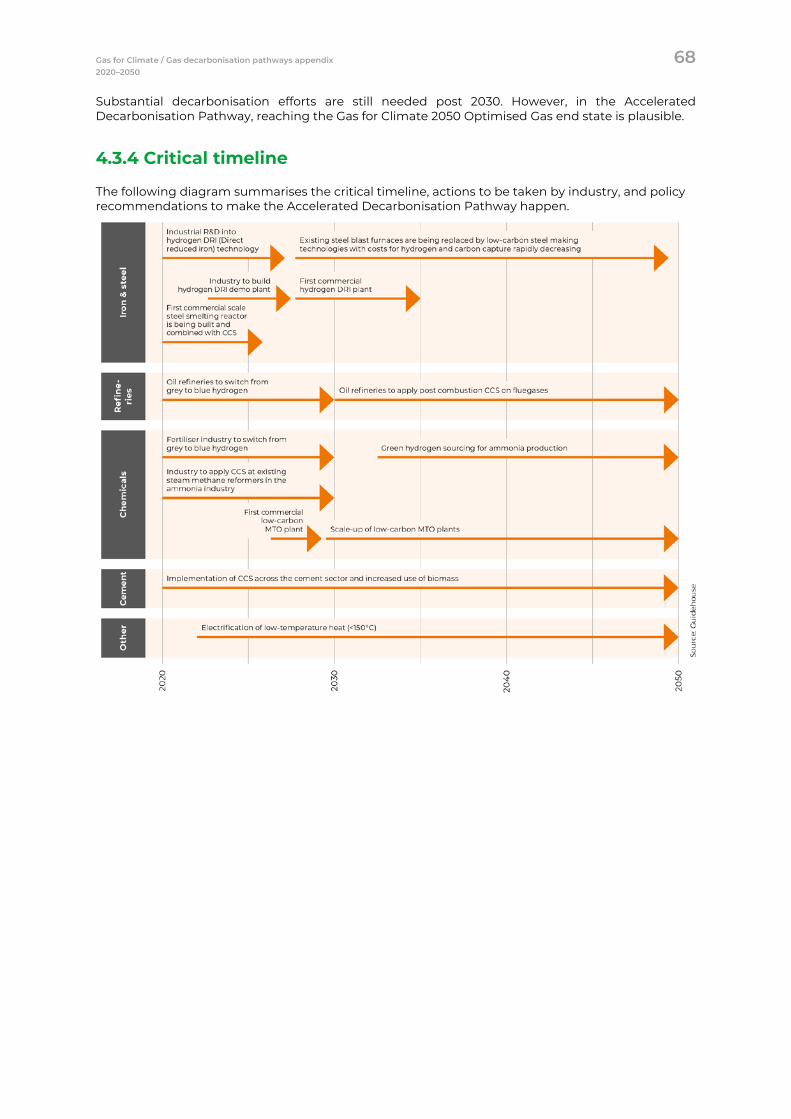
Gas for Climate / Gas decarbonisation pathways appendix 68 2020–2050
Substantial decarbonisation efforts are still needed post 2030. However, in the Accelerated Decarbonisation Pathway, reaching the Gas for Climate 2050 Optimised Gas end state is plausible.
4.3.4 Critical timeline
The following diagram summarises the critical timeline, actions to be taken by industry, and policy recommendations to make the Accelerated Decarbonisation Pathway happen.
Gas for Climate / Gas decarbonisation pathways appendix 69 2020–2050
Global Climate Action Pathway – industry
Conclusion Global Climate Action
An ambitious global carbon pricing system would lead to the rapid phaseout of fossil fuels, including natural gas. Biomethane and hydrogen would make up one-third of final energy consumption in industry by 2030.
Already by 2030, all existing steam methane reformers will be retrofitted with CCS. Additionally, large-scale greenfield electrolysers will provide substantial amounts of hydrogen to the industry sectors. In the steel sector, most existing plants will be replaced by direct reduction of iron with hydrogen by 2035. Globally, the fossil fuel industry will gradually switch to producing synthetic fuels from green hydrogen. By 2030, there will be a growing international market for synthetic fuels that are produced and transported at competitive prices as existing transport infrastructure can be repurposed. Due to the emergence of an international market for synthetic fuels, methanol will mostly not be produced from European hydrogen but instead imported at lower costs. Because methanol we be mainly produced outside Europe, EU hydrogen demand is lower in the Global Climate Action Pathway.
4.4.1 Global CO2 prices
The Global Climate Action Pathway is an evolution of the Accelerated Decarbonisation Pathway. In the early 2020s, countries around the world implement the Paris Agreement by taking ambitious climate action. Converging carbon pricing schemes lead to a global CO2 price that reaches €55/tCO2 in 2030. Revenues from this global ETS provide funding for R&D efforts in and implementation at scale of breakthrough technologies.
4.4.2 Technological and cost developments
Global action on decarbonisation will substantially increase R&D efforts on breakthrough technologies. Technological progress and cost reductions will be realised even quicker than in the Accelerated Decarbonisation Pathway. Implementation of pilots will happen inside and outside of Europe, creating best practices and lessons learned which will streamline and accelerate the industrywide deployment of breakthrough technologies
Gas for Climate / Gas decarbonisation pathways appendix 70 2020–2050
4.4.3 Pathway towards 2050
As fossil fuels become increasingly expensive, a global CO2 price and the availability of funding will drastically impact the business case for renewable and low carbon gases and for breakthrough technologies. We expect rapid technological advancements related to hydrogen, biomethane, and new industrial technologies. The deployment of breakthrough technologies will increase due to rapid cost reductions of producing renewable and low carbon gas and some technology cost reductions.
By 2030, all existing steam methane reformers will be retrofitted with carbon capture. Additional, large-scale greenfield electrolysers will provide substantial amounts of hydrogen to the industry sectors. In the steel sector, most existing plants will be replaced by direct reduction of iron with hydrogen by 2035. Globally, the fossil fuel industry will gradually switch to producing synthetic fuels from green hydrogen. By 2030, there will be a growing international market for synthetic fuels produced and transported at competitive prices as existing transport infrastructure can be repurposed. Due to the emergence of an international market for synthetic fuels, methanol largely will not be produced from European hydrogen but imported at lower costs. As a result, hydrogen demand in the Global Climate Action Pathway is lower. As a hydrogen infrastructure develops in Europe, we also see that onsite production of hydrogen is gradually being replaced by sourcing of green hydrogen from the hydrogen grid. As a result, electricity demand is decreasing in industry, especially after 2040.
Gas for Climate / Gas decarbonisation pathways appendix 71 2020–2050
Transport Decarbonisation Pathways
Key Takeaways for Road transport
• Under the Current EU Trends Pathway, we expect that ongoing electrification efforts will continue (especially in light vehicles), leading to a steady replacement of existing vehicle types by battery electric vehicles (BEVs). In geographies with less developed electricity and charging infrastructures, light (bio)-compressed natural gas (CNG) vehicles may grow substantially. In heavy road transport, diesel will steadily be replaced by (bio)-LNG up to 2050 as part of the Alternative Fuels Directive. Fuel cell vehicles (FCVs) will not reach full potential due to unfavourable economics and lack of integral policy support for developing a green hydrogen supply chain for road transport.
• Adoption of the European Green Deal in the Accelerated Decarbonisation Pathway will push adoption of BEVs and FCVs between 2020 and 2050 in the light and heavy road transport segments. After 2040, the improving economics of fuel cells and (green and blue) hydrogen will lead to replacing both diesel and gasoline. bio-LNG and bio-CNG are likely to play a role in heavy road transport as well.
• In the Global Climate Action Pathway, global cost reductions in fuel cell and battery technologies results in stronger and early adoption of these technologies.
Gas for Climate / Gas decarbonisation pathways appendix 72 2020–2050
Key Takeaways for shipping and aviation
• Under Current EU Trends Pathway, limited developments are foreseen in both sectors by 2030. Reaching net-zero emissions by 2050 will be challenging, also given the expected strong growth in energy demand.
• In the Accelerated Decarbonisaton pathway, ship owners start to purchase new vessels from the 2020s onwards that are compatible to use renewable fuels. It will require strong policy action to stimulate early switching to battery electric vessels, bio-LNG, and other renewable marine fuels.
• In the Accelerated Decarbonisation Pathway, market readiness for biokerosene and synthetic kerosene will be achieved before 2030. This will allow a steady scale-up of renewable aviation fuels towards 2050. To increase the likelihood of reaching full decarbonisation in aviation it is necessary to curb demand growth in air travel.
• The Global Climate Action Pathway results in a larger global availability and reduced cost of renewable aviation and marine fuels. Imports of synthetic kerosene from countries with low renewable power costs and with available refinery capacity can be expected.
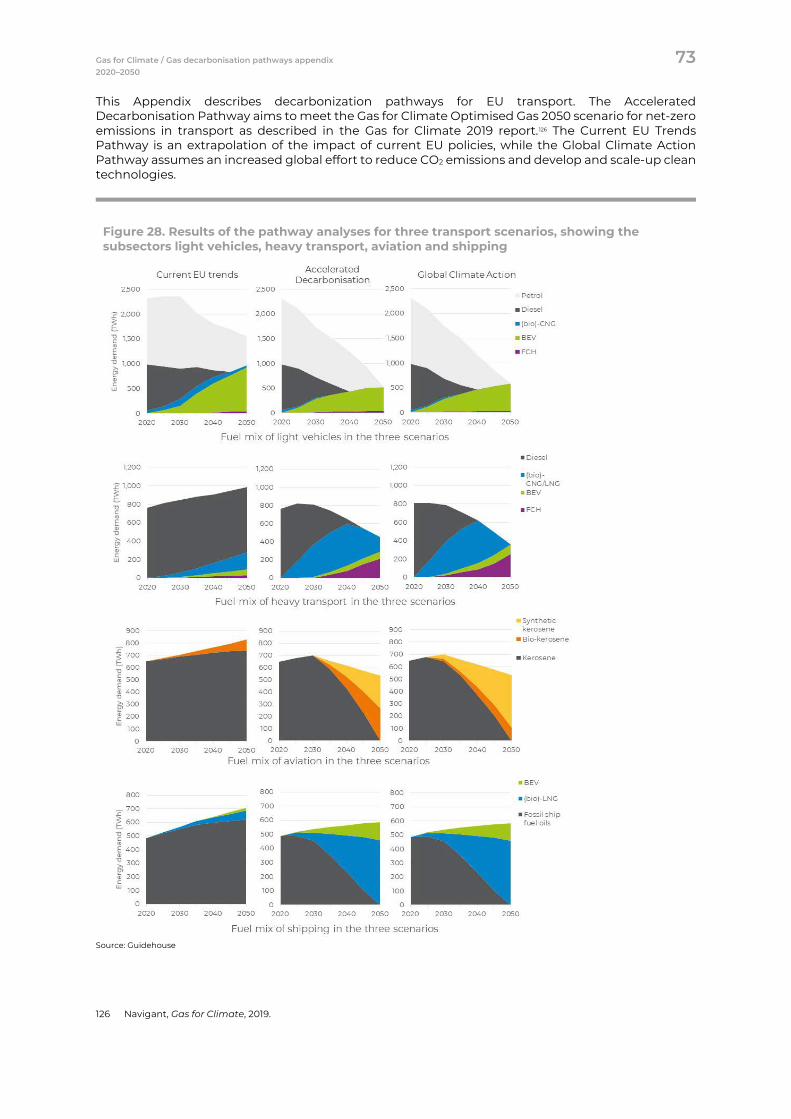
Gas for Climate / Gas decarbonisation pathways appendix 73 2020–2050
This Appendix describes decarbonization pathways for EU transport. The Accelerated Decarbonisation Pathway aims to meet the Gas for Climate Optimised Gas 2050 scenario for net-zero emissions in transport as described in the Gas for Climate 2019 report.126 The Current EU Trends Pathway is an extrapolation of the impact of current EU policies, while the Global Climate Action Pathway assumes an increased global effort to reduce CO2 emissions and develop and scale-up clean technologies.
Figure 28. Results of the pathway analyses for three transport scenarios, showing the subsectors light vehicles, heavy transport, aviation and shipping
Source: Guidehouse
126 Navigant, Gas for Climate, 2019.
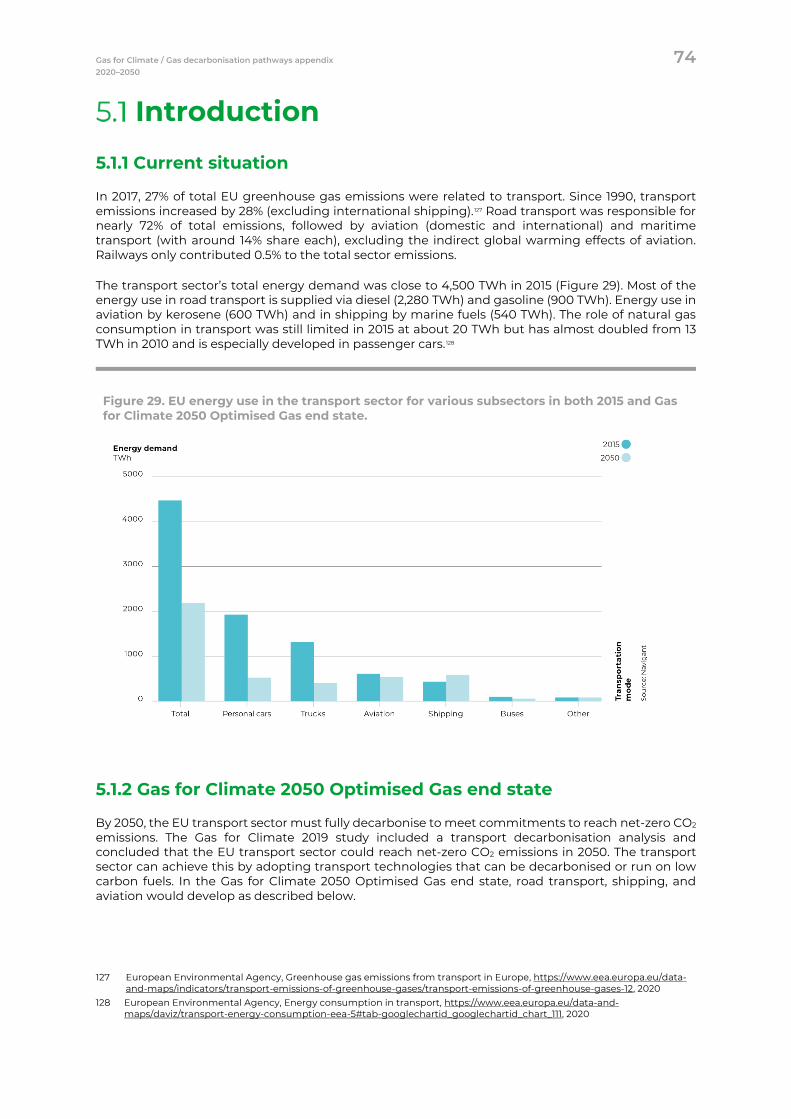
Gas for Climate / Gas decarbonisation pathways appendix 74 2020–2050
Introduction
5.1.1 Current situation
In 2017, 27% of total EU greenhouse gas emissions were related to transport. Since 1990, transport emissions increased by 28% (excluding international shipping).127 Road transport was responsible for nearly 72% of total emissions, followed by aviation (domestic and international) and maritime transport (with around 14% share each), excluding the indirect global warming effects of aviation. Railways only contributed 0.5% to the total sector emissions.
The transport sector’s total energy demand was close to 4,500 TWh in 2015 (Figure 29). Most of the energy use in road transport is supplied via diesel (2,280 TWh) and gasoline (900 TWh). Energy use in aviation by kerosene (600 TWh) and in shipping by marine fuels (540 TWh). The role of natural gas consumption in transport was still limited in 2015 at about 20 TWh but has almost doubled from 13 TWh in 2010 and is especially developed in passenger cars.128
Figure 29. EU energy use in the transport sector for various subsectors in both 2015 and Gas for Climate 2050 Optimised Gas end state.
5.1.2 Gas for Climate 2050 Optimised Gas end state
By 2050, the EU transport sector must fully decarbonise to meet commitments to reach net-zero CO2 emissions. The Gas for Climate 2019 study included a transport decarbonisation analysis and concluded that the EU transport sector could reach net-zero CO2 emissions in 2050. The transport sector can achieve this by adopting transport technologies that can be decarbonised or run on low carbon fuels. In the Gas for Climate 2050 Optimised Gas end state, road transport, shipping, and aviation would develop as described below.
127 European Environmental Agency, Greenhouse gas emissions from transport in Europe, https://www.eea.europa.eu/data-
and-maps/indicators/transport-emissions-of-greenhouse-gases/transport-emissions-of-greenhouse-gases-12, 2020 128 European Environmental Agency, Energy consumption in transport, https://www.eea.europa.eu/data-and-
maps/daviz/transport-energy-consumption-eea-5#tab-googlechartid_googlechartid_chart_111, 2020
Gas for Climate / Gas decarbonisation pathways appendix 75 2020–2050
Road transport
Electrification is the key decarbonisation measure in road transport, but for heavy road transport hydrogen and bio-LNG will be important energy carriers as well. The societal costs for various low carbon vehicle fuel options are comparable, which means that non-cost factors will most likely determine the optimal fuel mix. These factors include the availability of an EU-wide refuelling infrastructure, the impact of the fuel type on available transport payload, and volumes and the existence of specific policies, taxes, and levies that push a specific technology. Based on its analysis, Guidehouse expects the energy demand in road transport to be around 1,000 TWh in 2050. This would be close to half of total energy demand in transport, assuming a large-scale adoption of electric drivetrains in 2050 which reduces the final energy demand by roughly 50% compared to a situation in which only conventional drivetrains are used. In the Gas for Climate 2050 scenario, the deployment of renewable and low carbon gas technologies lead to a hydrogen demand of 252 TWh, a bio-LNG demand of 134 TWh (this could also include bio-CNG), and an electricity demand of 648 TWh.
Shipping
Many future fuel technologies are being considered for the shipping sector. Based on its analysis, Navigant envisions that all existing diesel and marine fuelled vessels will be replaced mainly by bio-LNG and battery electric vessels by 2050, avoiding the need to develop additional production routes for more expensive or scarce biodiesel. However, other fuel options could also become relevant, such as green hydrogen and synthetic ammonia (see also Chapter 5). The deployment of battery and bio-LNG vessels lead to a bio-LNG demand of 461 TWh and an electricity demand of 124 TWh.
Aviation
The aviation sector’s energy demand is expected to be around 534 TWh by 2050 as a result of efficiency measures and demand growth reduction. It is estimated that sustainable feedstock for bio jet fuel can make up 50% of the aviation fuel demand, next to 50% synthetic kerosene.
As the Gas for Climate 2019 report began with a net-zero emission sector in mind. This study analyses pathways towards 2050. This section discusses three pathways to reduce CO2 emissions in the EU transport sector by 2050:
1. The Current EU Trends Pathway considers the current state in the transport sector and the developments, steered by existing market conditions and policies. Current policies will have limited impact after 2030. A tremendous ramp-up of zero-carbon technologies is required after 2030 to reach a 2050 net-zero carbon target.
2. The Accelerated Decarbonisation Pathway considers the European Green Deal’s impact if it is adopted and translated into legislation. The pathway assumes that the EU will actively tackle CO2 emissions, while the rest of the world will be less ambitious in its efforts. From this scenario, we distil recommendations for the Green Deal to be effective in reducing CO2 emissions in transport and reaching the Gas for Climate Optimised Gas 2050 end state.
3. The Global Climate Action Pathway considers the impact of global climate action with strong cost reductions in zero-carbon technologies and developments in synthetic fuel production.
All scenarios cover the three major transport subsectors: road transport (light vehicles, including passenger vehicles and light commercial vehicles, and heavy road transport, including trucks and long-distance buses or coaches), shipping (domestic, intra-EU, and intercontinental), and aviation. Rail transport is not explicitly covered in our analysis because of its relatively low energy demand compared to the other transport modes. However, the impact of a future modal shift to rail transport predominantly originating in trucks and aviation is assessed. A large part of EU rail transport is already electrified. In the future, diesel powered trains will be electrified and on tracks that are (economically) difficult to electrify, hydrogen or (bio)-LNG could play a role.
Fuel use and its required infrastructure must be similar across Europe to ensure transport will be able to operate internationally. Intercontinental alignment is required for aviation and shipping. Our scenarios consider road transport on internal combustion engines (ICEs) fuelled by diesel, gasoline, CNG and LNG, and BEVs and FCVs. For aviation, we consider kerosene, biokerosene, and synthetic kerosene, and for shipping we consider electricity, diesel/marine fuel oil, and LNG as energy carriers.
Gas for Climate / Gas decarbonisation pathways appendix 76 2020–2050
The pathways focus solely on energy-related CO2 emissions, and indirect or non-CO2 related global warming effects are not accounted for in this analysis. Specifically, air travel has additional effects on global warming through the formation of contrails, ozone, and aerosols. These effects are significant and reported to be potentially twice the effect of CO2 alone.129 More precise scientific efforts to quantify these effects are ongoing. Switching to climate-neutral fuels will not address all non-CO2 warming effects. In addition, the impact of methane leakage in the application of CNG and LNG is not considered quantitatively. Due to the large emission factor of methane compared to CO2, methane slip in the supply chain can lead to additional global warming. Over the years, mitigating actions have been undertaken to reduce these methane emissions in gas production, and in its use in transport.
Transport pathway under current EU climate and energy policies
Conclusion Current EU Trends
Under the Current EU Trends Pathway, we expect ongoing electrification efforts to continue (especially in light vehicles), leading to a steady replacement of existing vehicle types by BEVs. In geographies with less developed electricity and charging infrastructures, light (bio)-CNG vehicles will grow substantially. In heavy road transport, diesel will steadily be replaced by (bio)-LNG up to 2050 as part of the Alternative Fuels Directive. FCV will not reach full potential due to unfavourable economics and lack of integral policy support for developing a green hydrogen supply chain for road transport.
The transformation of the shipping and aviation sectors is slow due to the low rate of unit replacement. Under the Current EU Trends Pathway, limited developments are expected in the sectors before 2030. After 2030, achieving net-zero emissions in 2050 will only be feasible through tremendous upscaling of low carbon fuels, such as bio and synthetic kerosene and marine fuels, especially considering the strong growth of these sectors towards 2050.
5.2.1 EU policies
5.2.1.1 Road transport
The road transport sector is in rapid transition, spurred by strongly decreasing costs130 for BEVs, increasing emission regulations (at EU, national, and city levels), and increasing costs of ownership for ICEs. EU policies on road transport are mainly built on two pillars:
• The improvement of engine efficiencies through the regulation of CO2 emissions in vehicles • The decarbonisation of the fuel mix, mainly through the RED I and II, which resulted in member
states forcing a blending percentage of biofuels with conventional fossil fuels
A more detailed list of relevant road transport policies is included in Section 5.5.2.
129 IPCC, Climate Change 2007, https://www.nature.com/articles/s41467-018-04068-0,
https://www.ipcc.ch/site/assets/uploads/2018/05/ar4_wg1_full_report-1.pdf. 130 In 2018, battery costs per kWh have dropped by 85% since 2010. By 2030 experts foresee another 65% drop in battery costs
compared to 2018, resulting in a cost level of €56/kWh. Source: Bloomberg NEF, Electric Vehicle Outlook 2019, 2019.
Gas for Climate / Gas decarbonisation pathways appendix 77 2020–2050
Biofuels are the largest contributor to decarbonisation in the fuel mix today, despite the public and policy attention for alternative fuel vehicles, BEVs, and FCVs. The use of natural gas in transport is supported as part of the EU’s Alternative Fuels Strategy. A more detailed discussion of the role of these fuel types is included in Section 5.5.3.
5.2.1.2 Shipping
Most of the EU international shipping sector ambitions previously were taken forward through the IMO.131 IMO’s strategy plans to reduce CO2 emissions by at least 40% in 2030 and pursues efforts to reduce emissions by 70% by 2050.132 The directive of 2018 reforming EU ETS states that “action from the IMO or the Union should start from 2023, including preparatory work on adoption and implementation and due consideration being given by all stakeholders.” Depending on IMO developments, the EU shipping sector could be included in the EU ETS as early as 2023. The European Commission will review the IMO’s progress annually to ensure that the sector contributes to the Paris Agreement.133
The only EU regulation currently applicable to international shipping requires large ships to report on annual fuel consumption and CO2 emissions.134 IMO is expected to develop legally binding measures on operational efficiency in ships and the adoption of low and zero-carbon fuels.135 Given the long lifetimes of ships, typically 25-30 years, it will be a while before operational efficiency measures in new ships start reducing the overall emissions in the sector. Most new ships are built and sold in East Asia, which could reduce the impact of European-only policies.136
5.2.1.3 Aviation
CO2 emissions from all airlines operating in Europe have been required to surrender CO2 emission allowances under the EU ETS since 2012.137 However, in expectance of a global measure by the International Civil Aviation Organisation (ICAO),138 the scope of the ETS was reduced to the European economic trading zone, which represents about 40% of total EU aviation emissions.139. Almost half of the ETS allowances140 are received by airlines for free, which, together with low ETS price levels, result in a limited impact of the ETS system on ticket prices and demand for aviation.141
131 Transport & Environment, EU shipping’s climate record, Maritime CO2 emissions and real-world ship efficiency
performance, 2019. 132 International Maritime Organisation, Adoption of the initial IMO strategy on reduction of GHG emissions from ships and
existing IMO activity related to reducing GHG emissions in the shipping sector, 2018. 133 European Commission 2018/410, Amending Directive 2003/87/EC to enhance cost-effective emission reductions and low
carbon investments, and Decision (EU) 2015/1814, 2018, https://eur-lex.europa.eu/legal-content/EN/TXT/PDF/?uri=CELEX:32018L0410&from=EN.
134 European Commission 2015/757, On the monitoring, reporting and verification of carbon dioxide emissions from maritime transport, and amending Directive 2009/16/EC, 2015, http://op.europa.eu/en/publication-detail/-/publication/c895b0b3-fdf7-11e4-a4c8-01aa75ed71a1/language-en.
135 Lloyd’s Register, “IMO Strategy – What does it mean?” 2018, https://www.lr.org/en/insights/articles/imo-ghg-strategy-what-does-it-mean/
136 BRS Group, Shipping and Shipbuilding Markets, Annual Review, 2019. 137 2008/101/EC, Amending Directive 2003/87/EC so as to include aviation activities in the scheme for greenhouse gas
emission allowance trading within the Community. 138 European Commission, https://ec.europa.eu/clima/policies/transport/aviation_en. 139 Transport & Environment, State of the aviation ETS, 2019, https://www.transportenvironment.org/state-aviation-ets. 140 The number of allowances for aviation (European Aviation allowances, EUAAs) has been capped to 95% of 2004-6
emissions. EUAAS can be traded within the aviation sector. Additional required allowances can be bought on the European Emission Allowances (EUAs) market. In contrast, sectors outside aviation cannot buy EUAAs. As the aviation sector is growing, there has always been a need for the sector to buy EUAs, resulting in similar price levels between EUAAs and EUAs.
141 Transport & Environment, State of the aviation ETS, 2019.
Gas for Climate / Gas decarbonisation pathways appendix 78 2020–2050
In 2016, ICAO introduced a global approach to reduce CO2 emissions from international aviation by 2021. The resolutions aim to “stabilise CO2 emissions at 2020 levels by requiring airlines to offset the growth of their emissions after 2020.”142 This approach largely builds on a global offsetting scheme called CORSIA. In parallel, the International Air Transport Association set targets for the sector to improve fuel efficiency, have carbon neutral growth after 2020, and reduce CO2 emissions from aviation by 50% in 2050 relative to 2005 levels. The strategy to reach these targets is based on improved operational efficiencies, deployment of sustainable low carbon fuels, and a global market-based measure.143 At point of writing, about 30 airline operators offer voluntary carbon offsetting schemes and small-scale blending of kerosene with low carbon options.144 According to the European Aviation Safety Agency, various initiatives are being deployed in Europe to increase the market penetration for biofuels. However, consumption is low and not expected to increase significantly over the next few years.145
5.2.2 Regional differences today
5.2.2.1 Road transport
Some member states and cities are developing policies that go beyond European legislation. The main driver is the ambition to reduce emissions in cities or to meet local climate targets. CO2 reduction targets go hand-in-hand with targets to improve city logistics and reduce other emissions, such as particulate matter, NOx and SOx. The Netherlands, Norway, France, the UK, Sweden, Ireland, and other member states have already announced plans to phaseout fossil-fuelled cars between 2025 and 2040 and cities (including London, Paris, Amsterdam, and Brussels) want to ban conventional cars in 2030-2035.146 Some member states oppose stricter emission reduction targets, specifically in Central and Eastern Europe due to the large markets for used cars.147
Another example of differences between member state policies is in the support for a switch to alternative fuels in road transport. This difference in support gives rise to remarkable differences in the fleet stock in countries, with Italy having a relatively large fleet of natural gas cars (CNG and LPG), while France, Sweden, Netherlands, and the UK have a larger percentage of BEVs in their alternative fuel markets.148 Of the CNG/LNG trucks that operate, over 80% are in Italy, Sweden, Spain, and France.149 The diverging national trends in vehicle fuel use is mainly due to national policies, regional specificities, and share of natural gas in the energy mix.150 Compared to other continents, the EU market for natural gas vehicles is less developed.
142 International Air Transport Association, Carbon offsetting for international aviation, 2019,
https://www.iata.org/policy/environment/Documents/paper-offsetting-for-aviation.pdf. 143 International Air Transport Association, Climate Change, 2019, https://www.iata.org/policy/environment/Pages/climate-
change.aspx. 144 International Air Transport Association, IATA Carbon Offset Program, 2019,
https://www.iata.org/whatwedo/environment/Pages/carbon-offset.aspx. 145 So far, only Germany reported the use of bio-based aviation fuels in 2016 under the framework of the Emissions Trading
Directive, Source: European Aviation Safety Agency, Sustainable Aviation Fuels, 2019, https://www.easa.europa.eu/eaer/climate-change/sustainable-aviation-fuels.
146 Navigant, Gas for Climate, 2019. 147 Transport & Environment, The end of the fossil fuel car is on the EU agenda, 2019,
https://www.transportenvironment.org/news/end-fossil-fuel-car-eu-agenda. 148 European observatory for alternative fuels, 2019, https://www.eafo.eu/alternative-fuels/overview. 149 EA, The future of trucks, 2017. 150 Trinomics, “The role of Trans-European gas infrastructure in the light of the 2050 decarbonisation targets,” 2019.
Gas for Climate / Gas decarbonisation pathways appendix 79 2020–2050
5.2.2.2 Aviation and shipping
Shipping and aviation activities are not equally distributed across the EU, not even across nations with a large shoreline. Based on reported activities, Transport & Environment identifies Western Europe, Italy, and Greece as the main contributors to shipping emissions.151 The growing LNG demand for shipping can be sourced from already existing LNG import facilities across Europe. Using existing LNG import assets can be a relatively cost-effective way to scale-up demand in the shipping sector as it can improve economics for underutilised LNG assets152 and it avoids regasification of imported LNG or natural gas liquefaction.
For aviation, large kerosene production facilities exist in Europe, mainly in Spain, Italy, the Netherlands, and the UK. However, due to market conditions and production capacities, around 16 Mt (around 200 TWh) of kerosene was imported from other parts of the world, mainly the Middle East in 2015.153
5.2.3 Pathway towards 2050
5.2.3.1 2020–2030
Road transport
Under current policies, the number of vehicles in the EU is expected to continue growing. We adopted a continued 13% growth per decade for light and heavy transport.154
BEVs and plug-in hybrid EVs demonstrate a strong increase in the number of registrations and have dominated the market for new registrations in alternative fuel driven cars since 2016.155 BloombergNEF forecasts around 55% of all passenger vehicle sales in the EU to be battery electric in 2030, which, considering the ramp-up of car sales, could result in a market share of 15%-20% for BEVs in the EU in 2030. Light and medium commercial vehicles will see adoption of BEVs, especially related to city logistics. Under current policies, limited scale is expected for BEVs in the long-haul, heavy transport segment. Under current policies, CNG use in light vehicles is expected to see a modest continued growth, mainly in countries that have specific policies in place to stimulate adoption, such as in Italy.156 We estimate that in the EU this could lead to about three times the current amount in light vehicles in 2030. Market share of natural gas (CNG/LNG) in the heavy transport segment shows much stronger growth, which could result in a tenfold growth towards 2030, in line with current growth figures. 157 This would lead to a EU CNG/LNG market share of about 5% for both light vehicle and heavy vehicle segments in 2030.158
The number of FCVs in Europe is still limited. However, developments in improved and cheaper fuel cell technologies are speeding up, mainly driven by market developments in Japan and China. In the Hydrogen Roadmap Europe, the first market uptake in Europe is expected between 2025 and 2030. This will occur in niche markets with specific demands on loads and ranges, such as taxis, coaches, and vans. Uptake in passenger cars and trucks is not expected at scale before 2030.159
151 Transport & Environment, EU shipping’s climate record, Maritime CO2 emissions and real-world ship efficiency
performance, 2019. 152 Trinomics, “The role of Trans-European gas infrastructure in the light of the 2050 decarbonisation targets.” 153 Fuels Europe, Statistical Report, 2017. 154 ACEA, “The automobil industry pocket guide,” 2019, https://www.acea.be/uploads/publications/ACEA_Pocket_Guide_2019-
2020.pdf. 155 European Alternative Fuel Observatory, 2019, https://www.eafo.eu/vehicles-and-fleet/m1. 156 European Alternative Fuel Observatory, 2019. https://www.eafo.eu/vehicles-and-fleet/m1. 157 European Alternative Fuel Observatory, 2019. https://www.eafo.eu/vehicles-and-fleet/m1. 158 The Oxford Institute for Energy Studies, A review of prospects for natural gas as a fuel in road transport, 2019,
https://www.oxfordenergy.org/wpcms/wp-content/uploads/2019/04/A-review-of-prospects-for-natural-gas-as-a-fuel-in-road-transport-Insight-50.pdf.
159 Fuel Cell and Hydrogen Joint Undertaking, Hydrogen roadmap Europe, 2019, https://www.FCEV.europa.eu/sites/default/files/Hydrogen%20Roadmap%20Europe_Report.pdf.
Gas for Climate / Gas decarbonisation pathways appendix 80 2020–2050
Aviation and shipping
Due to the relatively slow replacement rate of aircrafts and ships in the EU, (lifetime of 20-30 years and a long order time typically up to 5 years), incremental efficiency improvements will only have a small contribution to the overall net-zero emission goal up to 2030. This is especially the case considering the overall demand increase from the aviation sector’s growth. Transport & Environment estimates that around 10% of kerosene could be replaced by biokerosene through blending in 2050, which we adopted in our forecast.160 For 2030, it could be around 2% of kerosene demand.
Following the implementation of the Alternative Fuel Infrastructure Directive, LNG will be available in all EU TEN-T core ports161 by 2025, which will enable part of the shipping sector to shift to the use of LNG. LNG’s market share in the entire fleet will likely be around 3% in 2030, in line with the low scenario developed by TNO and CE Delft.162
Both sectors will continue to grow. For shipping, around 50% growth is assumed in 2050 compared to today and for aviation, we assume growth of 23% in energy demand.163, 164
5.2.3.2 2030–2050
Under current policies and considering the lifetime of passenger cars is a little over 10 years, BEVs will penetrate the light vehicle market. BloombergNEF predicts sales levels of 65% BEV passenger cars in 2040; however, these sales would not be enough to create a completely decarbonised passenger car sector in 2050.165 Because of this, gasoline will remain part of the fuel mix in light vehicles in 2050. Diesel will remain the dominant fuel option in heavy and long-distance transport in 2050, with a much smaller market size for (bio)-LNG.
FCVs are not expected to play an important role in road transport after 2030. Under current policies, the Fuel Cell and Hydrogen Joint Undertaking expects that adoption rates will remain less than 1% for passenger cars and 5% for buses and trucks in 2050, largely because of lack of cost reductions in fuel cell technologies.166
CO2 emissions will be reduced through blending in of biokerosene in aviation, up to around 10% in 2050.167 There will be no role or a very limited role for synthetic kerosene due to high costs and deployment barriers in the EU. In shipping, fleets will continue to shift to using (bio)-LNG when it becomes available in locations at sufficient volumes. However, due to the long lifetimes, in this scenario, a partial switch to (bio)-LNG can be expected at best and fossil ship fuel oils will remain the dominant fuel type.
160 Transport & Environment, Roadmap to decarbonising European aviation, 2018. 161 The overview of ports in the Trans-European Transportation Network (TEN-T) is available here:
http://ec.europa.eu/transport/infrastructure/tentec/tentec-portal/site/en/maps.html. 162 CE Delft, TNO, Study on the completion of an EU Framework on LNG-fueled ships and its relevant provision infrastructure,
Lot 3 Analysis of the LNG market development in the EU, 2017 https://ec.europa.eu/transport/sites/transport/files/2015-12-lng-lot3.pdf.
163 Transport & Environment, Roadmap to decarbonising European shipping, 2018. 164 Transport & Environment, Roadmap to decarbonising European aviation. 165 Bloomberg NEF, Electric vehicle outlook 2019, 2019 166 Fuel Cell and Hydrogen Joint Undertaking, Hydrogen roadmap Europe, 2019,
https://www.FCEV.europa.eu/sites/default/files/Hydrogen%20Roadmap%20Europe_Report.pdf. 167 Transport & Environment, Roadmap to decarbonising European aviation, 2018.
Gas for Climate / Gas decarbonisation pathways appendix 81 2020–2050
Accelerated Decarbonisation Pathway – Transport
Conclusion Accelerated Decarbonisation
Adoption of the European Green Deal in the Accelerated Decarbonisation Pathway will push adoption of BEVs and FCVs between 2020 and 2050 in the light and heavy road transport segments across the EU. After 2040, the improving economics of fuel cells and (green and blue) hydrogen will lead to replacing both diesel and gasoline, and for heavy transport bio-LNG and bio-CNG.
Due to long vessel lifetimes, using natural replacement cycles requires an early market switch to these vessel types, starting in 2025. To meet a net-zero emission goal in 2050 under the Accelerated Decarbonisation Pathway, only new vessels with engines that use or can be retrofitted to use fuels that can be decarbonised should be accepted in shipping, before 2025 or sooner if possible. It will require strong policy action to stimulate early switching to battery electric vessels, bio-LNG and other fuel low carbon fuel types.
Under the Accelerated Decarbonisation Pathway, the market readiness for bio and synthetic kerosene will be achieved before 2030, with a steady scale-up of low carbon fuels production in the EU in aviation towards 2050. This needs to be supported by a reduction in demand for air travel through modal shift.
5.3.1 European Green Deal for transport
5.3.1.1 Legislative plans
Transport will be an important part of the proposed European Green Deal. Several plans for the sector have been presented that will be translated into legislation in upcoming years. These plans include:168
• Revise relevant legislative measures, including the EU ETS Directive, Energy Efficiency Directive, RED, Alternative Fuels Infrastructure Directive, and the Trans European Network Transport Regulation, CO2 emissions performance standards for cars and vans, and the Directive on Combined Transport
• Policy support for deployment of public recharging and refuelling points • Create more stringent air pollutant emissions standards for combustion engine vehicles • Apply EU ETS to road transport and the maritime sector and reduce the allocation of free credits
to aviation • Shift a substantial part of the 75% of inland freight carried today by road onto rail and inland
waterways and seaways • Revise the Energy Taxation Directive, which would end current tax exemptions for aviation and
maritime fuels
These plans will be strengthened by proposals from individual or groups of member states, such as the call initiated by Denmark for an EU-wide ban on diesel and gasoline cars by 2040, which was backed by 10 member states.169
168 European Commission, The European Green Deal, 2019, https://ec.europa.eu/info/sites/info/files/european-green-deal-
communication_en.pdf. 169 Euronews, “Denmark calls for EU ban on all diesel and petrol cars by 2040,” 2019,
https://www.euronews.com/2019/10/04/denmark-calls-for-eu-ban-on-all-diesel-and-petrol-cars-by-2040.
Gas for Climate / Gas decarbonisation pathways appendix 82 2020–2050
5.3.2 Pathway towards 2050
5.3.2.1 2020–2030
Road transport
The increased ambitions in the European Green Deal will further accelerate the uptake of EVs across all segments. The Clean Energy Ministerial campaign (EV 30@30) in 2017 communicated an ambitious goal to speed up the deployment of EVs.170 In its EV Outlook, the IEA determined this would result in an EU BEV market share of 35% in 2030, which we will adopt for this scenario. The market share of BEV trucks will remain relatively low at around 3%.171
As BEV will see a breakthrough in the light vehicle market, the growth in CNG vehicles will focus on countries with established CNG markets and infrastructures172, possibly based on retrofitting petrol and diesel cars. New car owners will be more likely to choose the more cost-competitive BEV option. Current barriers related to limited charging infrastructure will be taken away by policy support and city bans on ICEs will also impact the adoption of CNG. As a result, automobile manufacturers and fuel station operators will increasingly focus more on BEVs.
In heavy road transport, CNG and LNG have seen a strong growth over the last ten years. This trend can be expected to continue. CNG and LNG vehicle technologies will have an important role in supporting the development of the biomethane market, especially in regions with limited gas pipeline infrastructure. In these regions the uptake of these technologies can be expected to be larger.
The Fuel Cell and Hydrogen Joint Undertaking foresees a potential of around 1.5% FCV passenger cars and less than 1% FCV trucks on the road in 2030.173 In this scenario, the remainder of the road transport market will be based on ICEs (65% of the total market in 2030).
At current price levels or at expected 2030 levels of around €55/tCO2, including the transport sector in ETS will have an impact on fuel costs and demand. However, implementation of fuel performance standards will have a larger potential impact. A significantly larger CO2 price (exceeding €200/tCO2) would be required to have an impact on the transport sector comparable to fuel performance standards.174 Future vehicle stock for road transport is based on the IEA Mobility Model. From the model, we take the forecast number of vehicles in Europe up to 2050 within the below 2°C scenario for the EU 27.175
Aviation and shipping
Due to the generally slow replacement rate of aircrafts and ships in the EU, (lifetime of 20-30 years and a long order time of typically up to 5 years), incremental efficiency improvements will only have a small contribution to the overall net-zero emissions goal up to 2030. This is particularly the case considering the overall demand increase from aviation sector growth up to 2030.
170 IEA, New CEM campaign aims for goal of 30% new electric vehicle sales by 2030, 2017, https://www.iea.org/news/new-
cem-campaign-aims-for-goal-of-30-new-electric-vehicle-sales-by-2030. 171 IEA, Global EV Outlook 2018, https://www.iea.org/reports/global-ev-outlook-2018. 172 EU Directive 2014/94/EU on alternative fuels infrastructure requires member states to draw up plans for scaling-up
alternative fuels infrastructure, see: https://ec.europa.eu/transport/themes/urban/cpt_en 173 Fuel Cells and Hydrogen Joint Undertaking, Hydrogen Roadmap Europe, 2019,
https://www.FCEV.europa.eu/sites/default/files/Hydrogen%20Roadmap%20Europe_Report.pdf. 174 Cambridge Economics, The Impact of Including the Road Transport Sector in the EU ETS, 2014,
https://www.ebb-eu.org/EBBpressreleases/Cambridge_ETS_transport_Study.pdf. 175 IEA, Mobility Model, https://www.iea.org/etp/etpmodel/transport/.
Gas for Climate / Gas decarbonisation pathways appendix 83 2020–2050
For aviation to have a sufficiently large supply of fossil-free kerosene to decarbonise the sector, pilot programmes need to be developed before 2030 to enable fast scale-up after 2030. Fuel blending targets can be effective to stimulate the market for non-fossil kerosene. Airports like Schiphol and Heathrow have already called for obligatory blending to stimulate market development.176
Following the implementation of the Alternative Fuel Infrastructure Directive, LNG will be available in all EU TEN-T core ports by 2025,177 which will enable part of the shipping sector to shift to LNG.178 Greenhouse gas reduction will only become substantial when bio-LNG is used, which is expected to reach scale after 2030.179 For domestic and parts of intra-EU shipping, we assumed a switch to battery electric ships in the Gas for Climate 2050 vision;180 however, it will require large battery cost reductions and development of fast charging or battery replacement infrastructure to make this an economically feasible option. In this segment, hydrogen powered ships could play an important role. 181 To meet the 2050 Gas for Climate vision, early adoption or retrofitting solutions of low carbon technologies must be promoted early to be able to use the natural replacement cycles.
5.3.2.2 2030–2050
Road transport
The market share of BEVs continues to increase, with sales figures reaching over 65% in the EU between 2030 and 2040.182 Following current proposals by member states, we assume that after 2040 the EU will completely ban the sales of fossil fuels and that BEV sales percentage increases to 100% for passenger and light commercial vehicles. This will result in an almost fully electrified light vehicle market in 2050.
The market for heavy trucks will become largely electrified, especially in the segment related to short distance logistics. As prices drop for fuel cells and hydrogen, trucks will also switch from diesel to hydrogen. A share of bio-LNG and possibly bio-CNG trucks will remain between 2040 and 2050. Market penetration for fuel cell electric trucks will increase from 3% in 2030 to 50% in 2050. This is in line with the potential of 1.7 million hydrogen trucks in 2050 by the Fuel Cell and Hydrogen Joint Undertaking,183 considering a decrease of the number of trucks due to modal shift to below 4 million in 2050.184
176 Noordhollands dagblad, Schiphol bepleit verplicht bijmengen biokerosine, 2019,
https://www.noordhollandsdagblad.nl/cnt/dmf20191206_34338840/schiphol-bepleit-verplicht-bijmengen-biokerosine?utm_source=www.rtlz.nl&utm_medium=referral&utm_content=/beurs/bedrijven/artikel/4947536/schiphol-baas-benschop-klimaatneutraal-vliegen-biobrandstof
177 The overview of ports in the Trans-European Transportation Network (TEN-T) is available here: http://ec.europa.eu/transport/infrastructure/tentec/tentec-portal/site/en/maps.html
178 CE Delft, TNO (2017). Study on the completion of an EU Framework on LNG-fueled ships and its relevant provision infrastructure, Lot 3 Analysis of the LNG market development in the EU.
179 In addition to fuel switching options in the shipping sector, there are some quick CO2 reduction opportunities in the shipping sector. A combination of moderate (10%-15%) speed reduction and switch to zero carbon fuels/energy for auxiliary engines/boilers could already result in a 40% CO2 emission reduction by 2030.This impact has not been taken into account in our pathway analysis. Source: Transport & Environment, European shipping's climate record, 2019, https://www.transportenvironment.org/publications/european-shippings-climate-record.
180 Navigant, Gas for Climate, 2019. 181 Marigreen, “Perspectives for the Use of Hydrogen as Fuel in Inland Shipping,” 2018,
http://marigreen.eu/wordpress_marigreen/wp-content/uploads/2018/11/Hydrogen-Feasibility-Study-MariGreen.pdf. 182 BloombergNEF, Electric vehicle outlook 2019, 2019. 183 Fuel Cells and Hydrogen Joint Undertaking, Hydrogen Roadmap Europe, 2019,
https://www.FCEV.europa.eu/sites/default/files/Hydrogen%20Roadmap%20Europe_Report.pdf. 184 Navigant, Gas for Climate, 2019.

Gas for Climate / Gas decarbonisation pathways appendix 84 2020–2050
Aviation and shipping
After 2030, scale-up developments are required in in the aviation sector to achieve the levels of bio and synthetic kerosene needed to avoid fossil fuel emissions. Compared to the Current EU Trends Pathway, demand for aviation is reduced from around 830 TWh to 530 TWh through increased ticket pricing, taxation, or further inclusion in ETS, and a modal shift to rail in line with an analysis from Transport & Environment.185 We assume that all fuel required for the sector is produced in the EU. It will require fast scale-up of bio-based or synthetic kerosene production facilities to meet the estimated 530 TWh of kerosene demand in the EU in 2050, which would still be about 20% higher than EU production of conventional kerosene in 2017.186 Synthetic kerosene would be half of the 2050 demand, for which large amounts of hydrogen are required.
In shipping, developments that began before 2030 will continue, steadily replacing the fleet by electric ships and by ships that run on (bio)-LNG. The development of the shipping sector depends on technology and fuel cost developments and their availability. Operating cost factors directly influence investment decisions. While this is true for all sectors, for the shipping sector such investment decisions are likely to be relevant for vessels that are still part of the fleet by 2050. Long vessel lifetimes mean that rapid developments in operating costs could result in increased write-off and replacements.
We assume that eventually all existing diesel and marine fuelled vessels will be replaced by battery electric and bio-LNG vessels in 2050, avoiding the need to develop additional production routes for more expensive and scarce biodiesel.187 However multiple fuel options are still being considered for the sector after 2030 (see section 5.5.4)
5.3.3 Critical timeline
Transport will be an important part of the proposed EU Green Deal. Several plans for the sector have been presented that will become legislation in upcoming years.188 The Accelerated Decarbonisation Pathway envisions strengthened decarbonisation efforts in the following sectors:
• Road transport: The road transport sector is in rapid transition. This transition is spurred by decreasing costs189 for battery EVs (BEVs), increasing emissions regulations (at EU, national, and city levels), and increasing costs of ownership for ICEs. The EU Green Deal’s plans will have a strong impact on the amount of road transportation: road freight will switch to rail and shipping. The Accelerated Decarbonisation Pathway envisions a push in adoption of BEV and FCV between 2020-2050 in the light and heavy road transport segments across the EU. Due to the improving economics of fuel cells and green and blue hydrogen, after 2040, these technologies will replace both diesel and gasoline. In heavy transport hydrogen will become the dominant fuel while a share of bio-LNG and possibly bio-CNG will remain
• Shipping: Currently, ships have long natural replacement cycles, of 20-30 years. These long cycles, limit fast adoption of new fuel technologies and an early switch would be required to meet the 2050 goal, considering that in 2050 around 30% of the fleet will have been built between 2020 and 2030. At the same time, new ship investments typically only are a small part of the total costs of ownership. A switch to lower fuel cost options will therefore be likely if these become available, even if that would mean a faster write-off. Nevertheless, when comparing against current fossil fuels, it will require strong policy action to stimulate switching to zero emission ships (battery electric and fuel cell electric) and ships that run on (bio-)LNG.
185 Transport & Environment, Roadmap to decarbonising European aviation, 2018,
https://www.transportenvironment.org/sites/te/files/publications/2018_10_Aviation_decarbonisation_paper_final.pdf. 186 Fuels Europe, Statistical report 2019, https://www.fuelseurope.eu/wp-content/uploads/FuelsEurope-Statistical-Report-
2019-2.pdf. 187 Navigant, Gas for Climate, 2019. 188 European Commission, The European Green Deal, 2019, https://ec.europa.eu/info/sites/info/files/european-green-deal-
communication_en.pdf. 189 In 2018, battery costs per kWh have dropped by 85% since 2010. By 2030 experts foresee another 65% drop in battery costs
compared to 2018, resulting in a cost level of €56/kWh. Source: Bloomberg NEF, Electric Vehicle Outlook 2019, 2019.
Gas for Climate / Gas decarbonisation pathways appendix 85 2020–2050
• Aviation: Market readiness for non-fossil kerosene should be achieved before 2030, allowing for a rapid scale-up of non-fossil kerosene production after 2030 paired with an overall reduction of demand for aviation. In the Accelerated Decarbonisation Pathway, the large-scale deployment of bio and synthetic kerosene is expected to start around 2030. Due to increasing fuel costs and efficiency improvements, overall aviation fuel demand could decrease to around 535 TWh by 2050.190 This demand will be met by 267 TWh of bio jet fuel and 267 TWh of synthetic jet fuels based on hydrogen from electrolysis.
To reach a net-zero carbon transport sector by 2050, the following actions must be developed in addition or in line with the proposed European Green Deal legislation:
• EU-wide development of charging and fuelling infrastructure for LNG, FCV, and BEV fast charging in road transport and shipping (both waterways and seaports).
• Global collaboration on synthetic fuel development for aviation and programming EU pilots to speed up market readiness of synthetic kerosene production.
• Increased emission regulation for road transport, including a ban on fossil fuel ICEs for light vehicles after 2040.
• Progressive regulation on blending biofuels or synthetic fuels with conventional fuels for the full transport sector including road transport, shipping, and aviation, to stimulate market demand for low carbon fuels.
• Standards for the delivery and use of CNG and LNG in vehicle engines and ships focused on reducing methane slip.
• Obligatory fuel use or engine retrofitting standards for specific types of new ships that operate in the EU to ensure the sector can transition to net-zero emissions in 2050 using natural replacement cycles with limited stranded assets.
EU-wide development of charging and fuelling infrastructure
The shift from gasoline and diesel fuels to alternative energy carriers requires an EU-wide development of (fast) charging and fuel infrastructure for (bio-)LNG and hydrogen for light vehicles and trucks. In ports, LNG infrastructure should be available along ports of the Trans-European Transport Network (TEN-T) and in major non-EU ports. Along internal EU waterways, hydrogen, LNG, and electricity infrastructure is required.
Collaboration on synthetic fuel development for aviation
To produce the synthetic kerosene fuelled in the EU by 2050, around 380 TWh of hydrogen is needed. EU refineries will also require significant adjustments to process these amounts of bio and synthetic kerosene. As a result of decreasing demand for gasoline and diesel, it is estimated that refining capacity will become available to process kerosene domestically, allowing a steady scale-up of bio- and synthetic kerosene production in the EU towards 2050. This must be supported by a reduction in demand for air travel through a modal shift. Global collaboration on synthetic fuel development for aviation and programming EU pilots is required to speed up the market readiness of synthetic kerosene production.
190 Transport & Environment, Roadmap to decarbonising European aviation, 2018
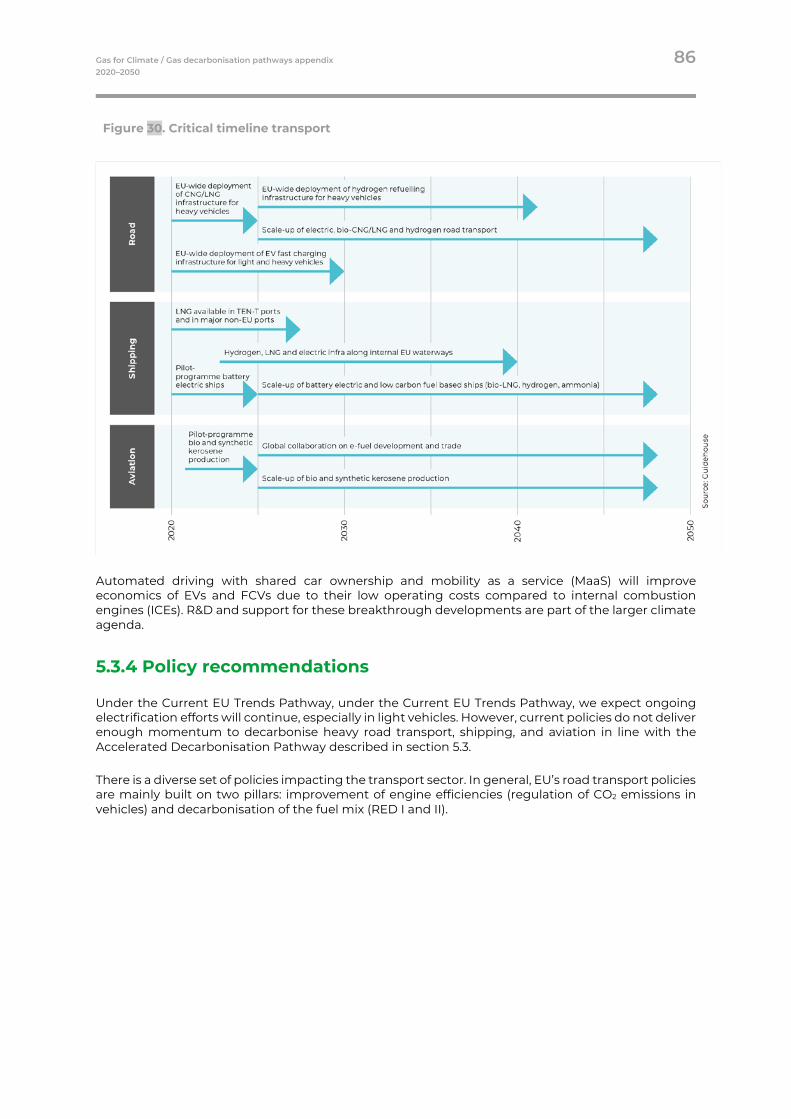
Gas for Climate / Gas decarbonisation pathways appendix 86 2020–2050
Figure 30. Critical timeline transport
Automated driving with shared car ownership and mobility as a service (MaaS) will improve economics of EVs and FCVs due to their low operating costs compared to internal combustion engines (ICEs). R&D and support for these breakthrough developments are part of the larger climate agenda.
5.3.4 Policy recommendations
Under the Current EU Trends Pathway, under the Current EU Trends Pathway, we expect ongoing electrification efforts will continue, especially in light vehicles. However, current policies do not deliver enough momentum to decarbonise heavy road transport, shipping, and aviation in line with the Accelerated Decarbonisation Pathway described in section 5.3.
There is a diverse set of policies impacting the transport sector. In general, EU’s road transport policies are mainly built on two pillars: improvement of engine efficiencies (regulation of CO2 emissions in vehicles) and decarbonisation of the fuel mix (RED I and II).
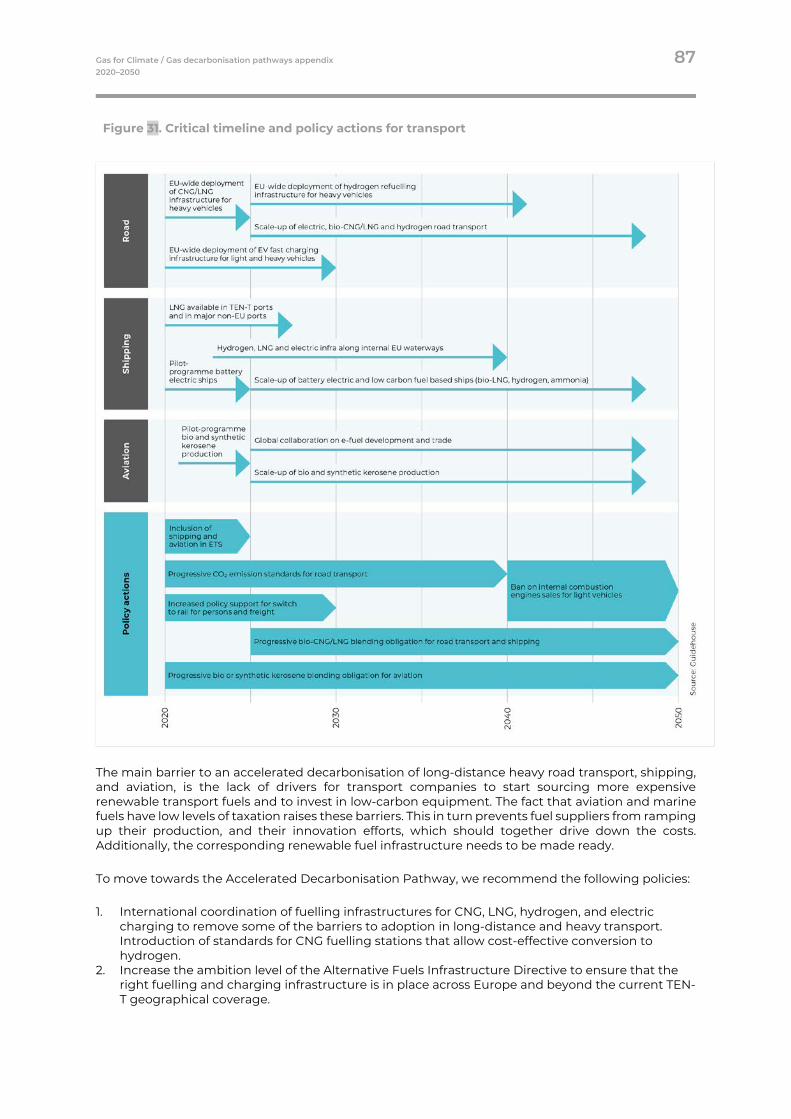
Gas for Climate / Gas decarbonisation pathways appendix 87 2020–2050
Figure 31. Critical timeline and policy actions for transport
The main barrier to an accelerated decarbonisation of long-distance heavy road transport, shipping, and aviation, is the lack of drivers for transport companies to start sourcing more expensive renewable transport fuels and to invest in low-carbon equipment. The fact that aviation and marine fuels have low levels of taxation raises these barriers. This in turn prevents fuel suppliers from ramping up their production, and their innovation efforts, which should together drive down the costs. Additionally, the corresponding renewable fuel infrastructure needs to be made ready.
To move towards the Accelerated Decarbonisation Pathway, we recommend the following policies:
1. International coordination of fuelling infrastructures for CNG, LNG, hydrogen, and electric charging to remove some of the barriers to adoption in long-distance and heavy transport. Introduction of standards for CNG fuelling stations that allow cost-effective conversion to hydrogen.
2. Increase the ambition level of the Alternative Fuels Infrastructure Directive to ensure that the right fuelling and charging infrastructure is in place across Europe and beyond the current TEN-T geographical coverage.
Gas for Climate / Gas decarbonisation pathways appendix 88 2020–2050
3. Introduce a progressively increasing blending mandate for shipping and aviation fuels in the RED, starting at 14% by 2030 and gradually increasing to 100% by 2050. This policy measure can be an effective alternative to the inclusion of aviation and shipping in the EU ETS.
Only an additional €60 is required to fly carbon neutral from Frankfurt to Rome
The distance from Frankfurt to Rome is about 1,000 km. For most Europeans, this is too far to travel by train. Since the aviation market is dealing with intense competition, the price for a ticket is important. The current ticket price is €230. With an ETS price for aviation of €150/tCO2 this ticket price will become around €275. Our analysis shows that switching to 100% bio jet will lead to an increased ticket price of €290 based on 2030 price levels. If we move towards 2050 to a 50% bio jet and 50% e-fuel situation, the ticket price will increase to €300. In other words, for about €60 euros extra compared to current price, the flight from Frankfurt to Rome can be carbon neutral in 2030. At current bio jet price levels, this would an additional cost of around €100.
Global Climate Action Pathway
Conclusion Global Climate Action
In the Global Climate Action Pathway, global cost reductions in fuel cell and battery technologies will result in stronger and early adoption of these technologies in road transport. Market uptake is supported by breakthrough innovations in automated transport and MaaS. The use of fuel cells and batteries in heavy road transport will scale-up before 2030, resulting in these technologies dominating the market in 2050.
Global Climate Action Pathway results in a larger global availability of low-cost synthetic fuels. For EU aviation, large-scale imports of synthetic kerosene produced in areas with low renewable power costs and availability of refinery capacity will result in an even stronger role for this fuel type in aviation.
Gas for Climate / Gas decarbonisation pathways appendix 89 2020–2050
5.4.1 Global Action Pathway towards 2050
Road transport
In the Global Climate Action Pathway, battery and fuel cell technologies are expected to develop faster. The rapid development of these technologies enables faster adoption in road transport. Breakthrough developments in this sector include automated transport and carsharing/MaaS. The combination of the two results in a much-reduced number of vehicles and a higher utilisation per vehicle. This favours the use of vehicles with high efficiencies and low operational costs (mainly BEVs and FCVs), and results in a faster adoption of BEVs in the light vehicles segment. The business case for electric transport is improved if vehicle-to-grid services are developed and implemented for the future, in which case the vehicle battery can act as storage to support matching demand response in the power market. The ICE is phased out quickly because of relatively high operational costs for fuel.
Developments in battery and fuel cell technologies stimulate faster adoption in trucks. Issues of limited driving range for battery electric trucks and buses could be reduced through the development of catenary lines along major European highways, resulting in improved vehicles efficiencies and the adoption of hybrid electric FCVs. Due to the fast development of BEVs and FCVs in the sector, there will not be a large role for (bio)-LNG as an intermediate fuel type towards 2050.
Aviation and shipping
Although breakthroughs in engine efficiency and new fuel technologies are important for both sectors, the long replacement period of vessels and planes will limit the penetration of these technologies in 2050. To reach a net-zero emission aviation and shipping sector in 2050, developments that support decarbonisation of fuels should be prioritised.
For shipping, natural replacement cycles should be maximised to adopt fuel types that can be decarbonised economically, such as electricity, hydrogen, ammonia and LNG. The pathway is assumed to be similar the Accelerated Decarbonisation Pathway.
For aviation, global action will result in greater availability of synthetic fuels produced from green hydrogen and captured CO2 around the world. EU imports of synthetic kerosene will likely be more economic than importing hydrogen to make synthetic kerosene in the EU. This is especially the case given the relatively large energy costs for producing and shipping liquified hydrogen and the fact that global infrastructure is already in place for kerosene trade with the EU already importing 30%-35% of its kerosene demand.191 Imports can be expected from areas of the world that have low cost renewable power, electrolysis capacity, and the availability of CCU/CCS and refinery infrastructures. This pathway assumes synthetic kerosene has similar or lower costs than biokerosene. We assume a share of 80% synthetic kerosene and 20% biokerosene in the 2050 aviation fuel mix.
191 Fuels Europe, Statistical report 2019, https://www.fuelseurope.eu/wp-content/uploads/FuelsEurope-Statistical-Report-2019-
2.pdf.
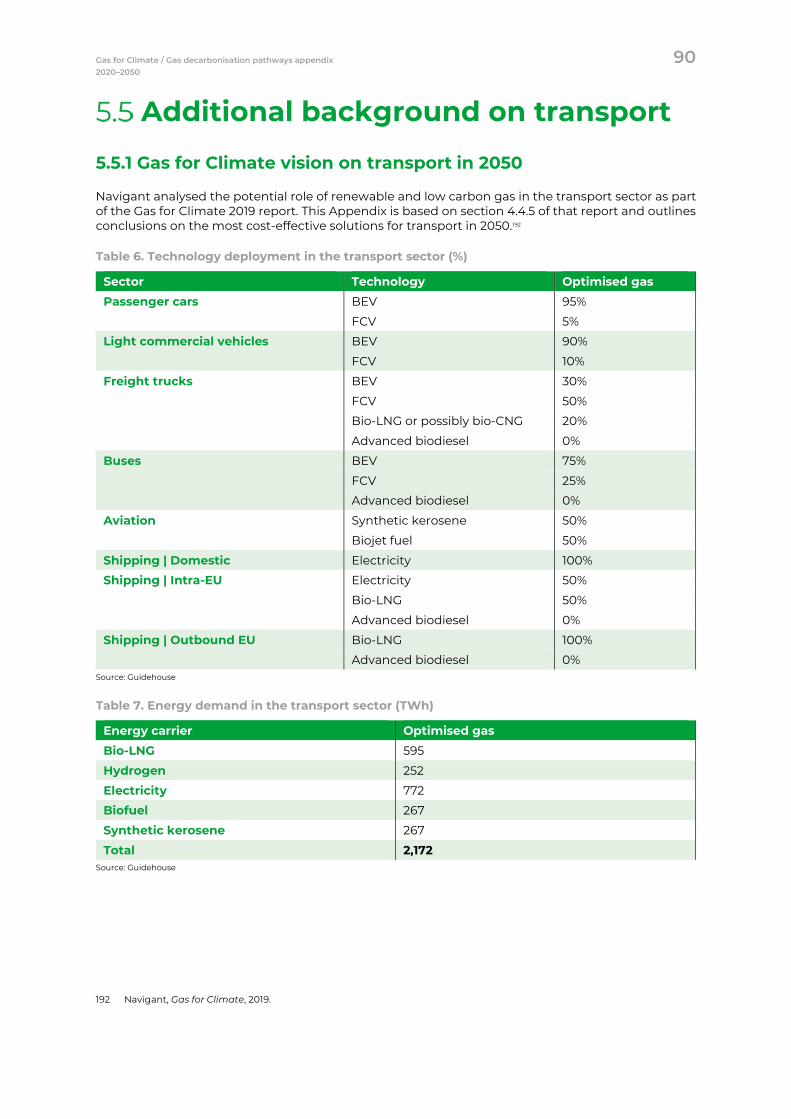
Gas for Climate / Gas decarbonisation pathways appendix 90 2020–2050
Additional background on transport
5.5.1 Gas for Climate vision on transport in 2050
Navigant analysed the potential role of renewable and low carbon gas in the transport sector as part of the Gas for Climate 2019 report. This Appendix is based on section 4.4.5 of that report and outlines conclusions on the most cost-effective solutions for transport in 2050.192
Table 6. Technology deployment in the transport sector (%)
Sector Technology Optimised gas Passenger cars BEV 95%
FCV 5%
Light commercial vehicles BEV 90%
FCV 10%
Freight trucks BEV 30%
FCV 50%
Bio-LNG or possibly bio-CNG 20%
Advanced biodiesel 0%
Buses BEV 75%
FCV 25%
Advanced biodiesel 0%
Aviation Synthetic kerosene 50%
Biojet fuel 50%
Shipping | Domestic Electricity 100%
Shipping | Intra-EU Electricity 50%
Bio-LNG 50%
Advanced biodiesel 0%
Shipping | Outbound EU Bio-LNG 100%
Advanced biodiesel 0% Source: Guidehouse
Table 7. Energy demand in the transport sector (TWh)
Energy carrier Optimised gas Bio-LNG 595
Hydrogen 252
Electricity 772
Biofuel 267
Synthetic kerosene 267
Total 2,172 Source: Guidehouse
192 Navigant, Gas for Climate, 2019.
Gas for Climate / Gas decarbonisation pathways appendix 91 2020–2050
5.5.2 Current EU transport policies
The European Commission developed a strategy that should bring the transport sector towards the target of a 60% reduction of CO2 emissions by 2050, as described in the Roadmap to a Single European Transport Area.193 The roadmap identifies goals for guiding policy action on various topics:
Fuel switch goals
• Reduce the use of petrol and diesel cars in cities by half by 2030, phasing them out completely by 2050 and achieve CO2-free city mobility by 2030.
• Increase the use of low carbon sustainable fuels in air transport to 40% by 2050. • Reduce EU CO2 emissions from ship fuels by 40% by 2050.
Modal shift goals
• Switch 30% of road freight travelling over 300 km to rail and waterborne transport by 2030, and over 50% by 2050.
• Triple the existing highspeed rail network by 2030. Most of the medium-distance passenger transport should go by rail by 2050.
Transport infrastructure integration goals
• Establish a fully functioning, EU-wide TEN-T core network integrating all forms of transport by 2030.
• Connect major airports to rail and core seaports and rail and inland waterways by 2050.
To achieve these goals, policies have been established that focus on specific parts of the transport sector:
• Directive for clean and energy efficient road transport vehicles: 194 Promotes and stimulates the development of a market for clean and energy efficient vehicles.
• General and CO2 emission performance standards for heavy duty vehicles:195, 196 After performance standards for NOX and particulate matter emissions, the first CO2 emission performance regulation for heavy trucks was adopted in 2019, setting targets for reducing the average emissions for new trucks for 2025 and 2030. The regulation also includes a mechanism to stimulate the uptake of zero and low emission vehicles.197
• CO2 emission performance standards for light commercial vehicles 198 and passenger cars: 199 These vehicles have been regulated from 2011 and 2009, respectively. However, the regulations do not set more stringent targets for light commercial vehicles beyond 2020 or for passenger cars beyond 2021.
193 European Commission, Roadmap to a single European transport area: Towards a competitive and resource-efficient
transport system, 2011, https://eur-lex.europa.eu/legal-content/EN/TXT/PDF/?uri=CELEX:52011DC0144&from=EN. 194 EC 2019/1161, “On the promotion of clean and energy-efficient road transport vehicles,” 2019, https://eur-lex.europa.eu/legal-
content/EN/TXT/PDF/?uri=OJ:L:2019:188:FULL&from=EN. 195 EC 582/2011, Implementing and amending Regulation (EC) No 595/2009 of the European Parliament and of the Council
with respect to emissions from heavy duty vehicles (Euro VI) and amending Annexes I and III to Directive 2007/46/EC of the European Parliament and of the Council, 2011, https://eur-lex.europa.eu/LexUriServ/LexUriServ.do?uri=OJ:L:2011:167:0001:0168:EN:PDF.
196 EC 2019/1242, Setting CO2 emission performance standards for new heavy duty vehicles and amending Regulations (EC) No 595/2009 and (EU) 2018/956 of the European Parliament and of the Council and Council Directive 96/53/EC, 2019, https://eur-lex.europa.eu/legal-content/EN/TXT/PDF/?uri=CELEX:32019R1242&from=EN.
197 European Commission, Reducing CO2 emissions from heavy-duty vehicles, 2019, https://ec.europa.eu/clima/policies/transport/vehicles/heavy_en.
198 EC 510/2011, Setting emission performance standards for new light commercial vehicles as part of the Union's integrated approach to reduce CO2 emissions from light-duty vehicles, 2011, https://eur-lex.europa.eu/legal-content/EN/TXT/PDF/?uri=CELEX:32011R0510&from=EN.
199 EC 443/2009, Setting emission performance standards for new passenger cars as part of the Community’s integrated approach to reduce CO2 emissions from light-duty vehicles, 2009, https://eur-lex.europa.eu/legal-content/EN/TXT/PDF/?uri=CELEX:32009R0443&from=EN.
Gas for Climate / Gas decarbonisation pathways appendix 92 2020–2050
• Combined Transport Directive:200 Promote a shift from road freight to other transportation modes (inland waterways, maritime transport, and rail). Over the last 25 years, the directive has helped shift a considerable amount of freight away from road. However, the European Commission is considering strengthening the directive to keep its impact high.201
• RED:202 Enforces that at least 10% of transportation fuels in the EU come from renewable sources by 2020 and at least a 14% share of renewable energy in transport in 2030. RED drives current blending of biofuels with petrol and diesel.
• Alternative Fuels Infrastructure Directive (AFID):203 Requires that EU members develop national policies to facilitate adoption of alternative fuels: e.g., CNG, LNG, electricity, and hydrogen for road transport. LNG and CNG adoption should be coordinated with the implementation of the Ten-T Core Network, which aims to have an appropriate number of refuelling points available in 2025. Electric charging infrastructure should be publicly accessible in suburban and urban conglomerates and in other densely populated areas.
• Road and fuel taxes: Such taxes are in place in many countries, which impacts the driving behaviour and economics of road transport. For trucks, changes in fuel taxes have directly affected the decisions made in the logistics system, for instance, increasing loads and reducing distances driven.204
5.5.3 LNG and CNG use in transport
Due to increasing tailpipe emission standards (NOX, particulate matter), CNG and LNG are a replacement option of diesel engines, in duel fuel or dedicated CNG or LNG trucks, and as LNG in the shipping sector. According to IEA, compared with China and the US, EU countries currently lack a clear competitive fuel price advantage, a comprehensive fuelling station network, and (until recently) government incentives. This is a reason for the EU’s relatively low market size for CNG/LNG trucks. Of trucks that operate, over 80% are in Italy, Sweden, Spain, and France.205 For cars, the main CNG sales are in Italy.206
The use of CNG in road transport directly competes with the use of electricity and hydrogen in BEVs and FCVs in the 2050 end state.207 Comparing total cost of ownership for these fuel types, BEVs and FCVs are more cost-competitive towards 2050. The role of CNG is mainly as an intermediate fuel, with a potential role as an accelerator of a biomethane market when used as bio-CNG. Part of the CNG fuel station infrastructure can be converted to hydrogen to accelerate the deployment of FCVs. Fuel station technical standards should be developed that facilitate this conversion.
In our Current EU Trends and Accelerated Decarbonisation Pathways, CNG/LNG will have a role for long haul heavy trucks in 2050. LNG is also considered as a potential alternative to the conventionally used heavy fuel oil and marine diesel oil, mostly because of its potential to reduce SOX and NOX emissions. A large push for LNG as a marine fuel came from the EU Alternative fuels directive,208 obligating member states to make bunkering infrastructure available in their territories and allowing funding through the Connecting Europe Facility.209
200 92/106/EEC, “On the establishment of common rules for certain types of combined transport of goods between Member
States,” 1992, https://eur-lex.europa.eu/legal-content/EN/TXT/PDF/?uri=CELEX:31992L0106&from=EN. 201 European Parliament, JD – Proposal for a directive on common rules for combined transport of goods, 2019
https://www.europarl.europa.eu/legislative-train/theme-resilient-energy-union-with-a-climate-change-policy/file-jd-combined-transport-directive-review.
202 EU 2018/2001, “On the promotion of the use of energy from renewable sources,’ 2018, https://eur-lex.europa.eu/legal-content/EN/TXT/PDF/?uri=CELEX:32018L2001&from=EN.
203 2014/94/EU, “On the deployment of alternative fuels infrastructure,” 2014, https://eur-lex.europa.eu/legal-content/EN/TXT/PDF/?uri=CELEX:32014L0094&from=en.
204 IEA, The future of trucks, 2017. 205 IEA, The future of trucks, 2017. 206 European observatory for alternative fuels, 2019, https://www.eafo.eu/alternative-fuels/overview. 207 Navigant, Gas for Climate, 2019 208 IEA, The future of hydrogen, 2019. 209 UMAS, LNG as a marine fuel in the EU, 2018.
Gas for Climate / Gas decarbonisation pathways appendix 93 2020–2050
Well-to-wheel CO2 emissions for CNG vehicles are typically slightly lower than petrol. For heavy diesel trucks, there could be a small advantage in using LNG. However, emissions remain relatively large due to the fundamental inefficiencies of ICEs and use of fossil fuel, unless bio-CNG and bio-LNG are used.210 In terms of greenhouse gas emissions, ICCT concludes that for some production routes, well-to-wheel CNG and LNG use in trucks and shipping can cause more greenhouse gas emissions than conventional fuels.211 Along the (bio-)methane supply chain, various actions are undertaken to avoid greenhouse gas emissions due to methane leakage and slip.212 With a reduction of methane slip during the production and use of bio-CNG/LNG, net-zero greenhouse gas emissions can be achieved.
5.5.4 Fuel options in shipping
Multiple fuel options are still being considered in the shipping sector
In 2019, the Gas for Climate analysis provided a low carbon 2050 end state for the shipping sector, ultimately selecting three fuel/engine types: biodiesel/ICE, bio-LNG/ICE and BEV. There are however many more options available in literature such as methanol, ammonia (NH3) or hydrogen in either ICE or fuel cell type engines. The sector sees pilots and technological advancements across these options, illustrating the need to explore such developments further. To test the robustness of this end state as well as to explore pathways of reaching this end state, we performed a sensitivity analysis on the Gas for Climate 2019 assessment by:
• A top-level operating cost reassessment of fuel/engine combinations in the projected 2050 end state, including ship CAPEX and infrastructure costs for LNG
• Qualitatively exploring the impact of accelerated retirement or retrofitting of ships in order to meet this 2050 end-state
Insights
CAPEX required for ship propulsion systems and auxiliary equipment can make up only a small fraction of total operating costs when discounted over a 30-year technical lifetime. Except for batteries and fuel cells in some cases, operating costs are dominated by fuel costs.
Low carbon fuel costs are highly influenced by conversion efficiencies. Fuel/engine combinations show variation in their specific fuel consumption, that is, the amount of fuel consumed for each unit of power output. Low carbon fuels have embedded efficiency losses on top of this. For example, it takes an estimated 2.29 MJ of electricity to produce 1 MJ of ammonia today, this is projected to improve to 1.85 MJ electricity per MJ ammonia by 2050.213 By connecting energy input costs as used in this study to energy output, we see the following cost estimates expressed as cost per unit energy output. Green methanol combustion and e-diesel combustion were not further explored as their energy conversions were too low to be realistically competitive to the other options.
Table 8. Fuel conversion efficiencies and energy output costs of fuel/engine combinations.
Fuel/Engine types:
Biodiesel/ICE BEV H2/FC H2/ICE NH3/FC NH3/IC
E Bio-LNG/ ICE
Primary energy input biodiesel electrici
ty hydrogen
hydrogen
hydrogen
hydrogen
biomethane
Energy output/input 0.42 0.81 0.41 0.32 0.41 0.32 0.42
Fuel costs 2050 (€ / MWh output)
202 131 225 290 157 203 226
Note: fuel costs include infrastructure costs except for biodiesel where sufficient infrastructure is assumed to be in place already.
210 The Oxford institute for energy studies, A review of prospects for natural gas as a fuel in road transport, 2019. 211 ICCT, Assessment of the fuel cycle impact of liquefied natural gas as used in international shipping, 2013. 212 TNO, Environmental and Economic aspects of using LNG as a ship fuel in the Netherlands, 2011. 213 T&E, Roadmap to decarbonising European shipping, November 2018
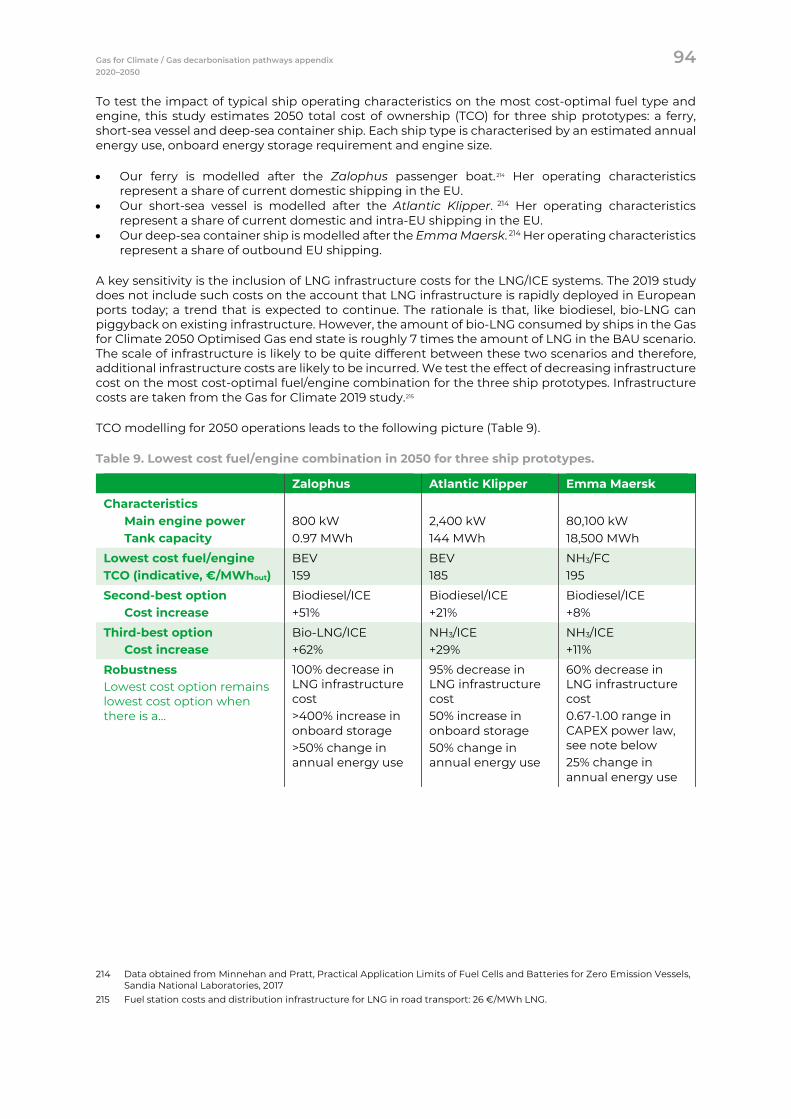
Gas for Climate / Gas decarbonisation pathways appendix 94 2020–2050
To test the impact of typical ship operating characteristics on the most cost-optimal fuel type and engine, this study estimates 2050 total cost of ownership (TCO) for three ship prototypes: a ferry, short-sea vessel and deep-sea container ship. Each ship type is characterised by an estimated annual energy use, onboard energy storage requirement and engine size.
• Our ferry is modelled after the Zalophus passenger boat.214 Her operating characteristics represent a share of current domestic shipping in the EU.
• Our short-sea vessel is modelled after the Atlantic Klipper. 214 Her operating characteristics represent a share of current domestic and intra-EU shipping in the EU.
• Our deep-sea container ship is modelled after the Emma Maersk. 214 Her operating characteristics represent a share of outbound EU shipping.
A key sensitivity is the inclusion of LNG infrastructure costs for the LNG/ICE systems. The 2019 study does not include such costs on the account that LNG infrastructure is rapidly deployed in European ports today; a trend that is expected to continue. The rationale is that, like biodiesel, bio-LNG can piggyback on existing infrastructure. However, the amount of bio-LNG consumed by ships in the Gas for Climate 2050 Optimised Gas end state is roughly 7 times the amount of LNG in the BAU scenario. The scale of infrastructure is likely to be quite different between these two scenarios and therefore, additional infrastructure costs are likely to be incurred. We test the effect of decreasing infrastructure cost on the most cost-optimal fuel/engine combination for the three ship prototypes. Infrastructure costs are taken from the Gas for Climate 2019 study.215
TCO modelling for 2050 operations leads to the following picture (Table 9).
Table 9. Lowest cost fuel/engine combination in 2050 for three ship prototypes.
Zalophus Atlantic Klipper Emma Maersk Characteristics
Main engine power Tank capacity
800 kW 0.97 MWh
2,400 kW 144 MWh
80,100 kW 18,500 MWh
Lowest cost fuel/engine TCO (indicative, €/MWhout)
BEV 159
BEV 185
NH3/FC 195
Second-best option Cost increase
Biodiesel/ICE +51%
Biodiesel/ICE +21%
Biodiesel/ICE +8%
Third-best option Cost increase
Bio-LNG/ICE +62%
NH3/ICE +29%
NH3/ICE +11%
Robustness Lowest cost option remains lowest cost option when there is a…
100% decrease in LNG infrastructure cost >400% increase in onboard storage >50% change in annual energy use
95% decrease in LNG infrastructure cost 50% increase in onboard storage 50% change in annual energy use
60% decrease in LNG infrastructure cost 0.67-1.00 range in CAPEX power law, see note below 25% change in annual energy use
214 Data obtained from Minnehan and Pratt, Practical Application Limits of Fuel Cells and Batteries for Zero Emission Vessels,
Sandia National Laboratories, 2017 215 Fuel station costs and distribution infrastructure for LNG in road transport: 26 €/MWh LNG.
Gas for Climate / Gas decarbonisation pathways appendix 95 2020–2050
Note: • WACC of 8% assumed • Investment cost for engines and other onboard equipment scale following a CAPEX power
law:
𝑪𝑪𝑪𝑪𝑪𝑪𝑪𝑪𝑪𝑪 = 𝑪𝑪𝑪𝑪𝑪𝑪𝑪𝑪𝑪𝑪𝒓𝒓𝒓𝒓𝒓𝒓𝒓𝒓𝒓𝒓𝒓𝒓𝒓𝒓𝒓𝒓𝒓𝒓 × �𝑪𝑪𝒓𝒓𝑬𝑬𝑬𝑬𝒓𝒓𝒓𝒓 𝒓𝒓𝒄𝒄𝒄𝒄𝒄𝒄𝒓𝒓𝑬𝑬𝒊𝒊𝒊𝒊𝑪𝑪𝒄𝒄𝒄𝒄𝒄𝒄𝒓𝒓𝑬𝑬𝒊𝒊𝒊𝒊𝒓𝒓𝒓𝒓𝒓𝒓𝒓𝒓𝒓𝒓𝒓𝒓𝒓𝒓𝒓𝒓𝒓𝒓
�𝟎𝟎.𝟖𝟖
• Tank capacity and energy consumption adjusted to specific fuel consumption per fuel/engine combination
• Underlying CAPEX cost estimates from Grahn et al.,216 Sea\LNG,217, De Vries,218 Tjalgegard et al.219
• This is a cost modelling exercise only, not a full feasibility assessment
This top-level modelling suggests BEV to be lowest TCO solution for the two smaller ship prototypes. By 2050, the Emma Maersk is best suited for an ammonia fuel cell. Battery electric is not an economic solution, even ignoring the practicality of fitting this much batteries on a ship of her size. The Atlantic Klipper is equipped with just enough batteries for a single trip in this modelling exercise. That seems impractical. Onboard battery capacity can be increased by roughly 50% before other options become more economic. In addition, novel technologies that are currently in development such as smaller, autonomous ships and modular battery replacement to reduce charging time can make the application more viable for a wider range of intra-EU ships in practice.
Biodiesel is the second option for all three ship prototypes. The 2019 study showed that biodiesel will be in high demand in other sectors and from a lowest cost system perspective, the available biodiesel is best deployed elsewhere.
Looking at the different types of fuel/engine combinations, ammonia fuel seems interesting for the longer distances, at the expense of hydrogen and LNG. A sensitivity analysis to equip all three ships with compressed hydrogen (avoiding the relatively expensive liquefaction) did not change this outcome. LNG/ICE is the fourth-best fuel/engine combination for the Emma Maersk prototype, roughly 20% more expensive in €/MWh output compared to ammonia fuel cells. With comparable well-to-wake conversion efficiency between NH3/FC and LNG/ICE (see Table 8), this operating cost difference is primarily driven by lower primary fuel costs.
The above all describes 2050 as an end state for the shipping sector. With ships invested in today still being part of the 2050 fleet, it is critical to see how (fast) the sector can move towards this end state. Intermediate years may show a very different picture for low carbon ships, and ship owners may choose to invest in different ships because of this. This study uses intermediate cost points for fuels, batteries and conversion efficiencies assess the lowest cost fuel/engine combinations for intermediate years 2030 and 2040.
Figure 32 provides an overview of the top-3 lowest cost fuel/engine combinations for the three vessel prototypes under analysis. This overview shows that BEV ships are already the most attractive option for low carbon shipping in 2030 for both the short-sea and ferry prototypes, limiting any accelerated write-off or retrofit costs to achieve the 2050 end state. For the deep see container ship, it seems biodiesel is the lowest cost option for 2030 and 2040, only to be overtaken by ammonia fuel cell technology in the final decade towards 2050. With limited biodiesel availability in the European system as described above, ship owners may look at the second option early, which is ammonia fuel cell or LNG. This could mean that even for this ship prototype, already in 2030, the most attractive option is the same as for 2050, limiting accelerated write-off or expensive retrofitting.
216 Grahn et al., Cost-effective choices of marine fuels under stringent carbon dioxide targets, Chalmers University, 2013 217 SEA\LNH, LNG as a marine fuel – the investment opportunity 218 De Vries, Safe and effective application of ammonia as a marine fuel, TU Delft, 2019 219 Tjalgegard et al., Electrofuels – a possibility for shipping in a low carbon future?, Chalmers University, 2015
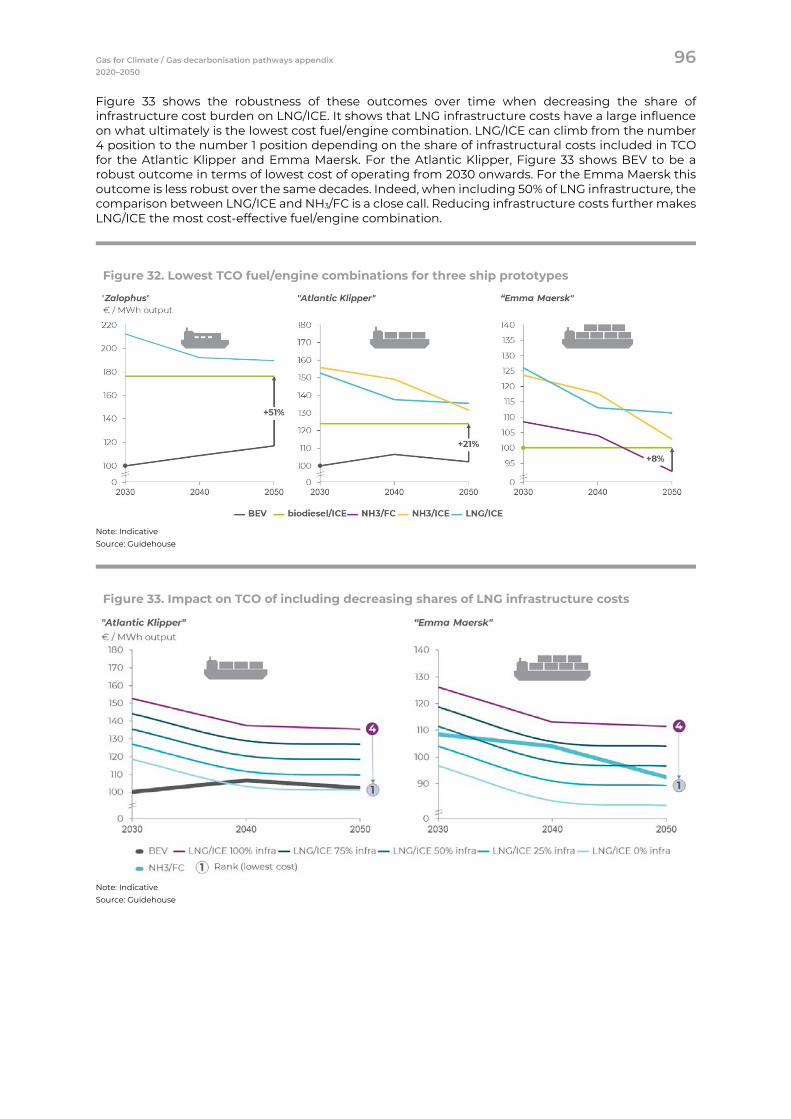
Gas for Climate / Gas decarbonisation pathways appendix 96 2020–2050
Figure 33 shows the robustness of these outcomes over time when decreasing the share of infrastructure cost burden on LNG/ICE. It shows that LNG infrastructure costs have a large influence on what ultimately is the lowest cost fuel/engine combination. LNG/ICE can climb from the number 4 position to the number 1 position depending on the share of infrastructural costs included in TCO for the Atlantic Klipper and Emma Maersk. For the Atlantic Klipper, Figure 33 shows BEV to be a robust outcome in terms of lowest cost of operating from 2030 onwards. For the Emma Maersk this outcome is less robust over the same decades. Indeed, when including 50% of LNG infrastructure, the comparison between LNG/ICE and NH3/FC is a close call. Reducing infrastructure costs further makes LNG/ICE the most cost-effective fuel/engine combination.
Figure 32. Lowest TCO fuel/engine combinations for three ship prototypes
Note: Indicative Source: Guidehouse
Figure 33. Impact on TCO of including decreasing shares of LNG infrastructure costs
Note: Indicative Source: Guidehouse
Gas for Climate / Gas decarbonisation pathways appendix 97 2020–2050
Both figures also show that relative TCO differences per fuel/engine combination are reduced with increasing ship size. The robustness of the lowest cost fuel/engine combination of deep-sea ships is lowest of the three vessel prototypes. At the same time, this ship prototype represents the largest share of total energy consumption of the shipping sector.220 It is therefore key to gain a better understanding of these differences and how this may affect fuel consumption for the shipping sector.
This top-level analysis provides indications that after BEV, bio-LNG might not always be the most economic pathway to decarbonise the shipping sector. Instead, ammonia-based propulsion systems could be the way forward, depending on the size and operating conditions of the ship in question. This conclusion seems robust under varying underlying assumptions such as energy consumption level, onboard energy storage capacity and the effect of economies of scale to capital requirements. However, this was a limited exercise on three shipping prototypes and on costs alone. Indeed, other factors besides operating costs, such as safety of operation, NOx emissions, toxicity and perception thereof, are critical for large-scale deployment. The global sector is undergoing a transformation to lower emitting fuels and witnesses aggressive cost reductions of low carbon technologies. More study is required on technology development, safety, capital costs and total operating costs for a wide range of ships to gain understanding on where the shipping sector ultimately might be heading.
220 The 2019 study showed that over half of all energy is consumed in outbound-EU shipping movements.
Gas for Climate / Gas decarbonisation pathways appendix 98 2020–2050
Power Decarbonisation Pathways Key Takeaways
• In the Current EU Trends Pathway, we expect limited electrification efforts and ongoing efficiency improvements to result in stable electricity demand towards 2030. When renewable electricity shares in the EU increase towards 55% by 2030, the result is a reduction in gas demand and other fuels. Installed gas-fired power generation capacities remain stable around 220 GW. No power generation based on hydrogen is developed until 2030. Current EU trends make it unlikely that we reach the Gas for Climate 2050 end state in terms of total electricity use and generation and, consequently, installed capacities of gas-fired dispatchable generation.
• In the Accelerated Decarbonisation Pathway, electricity demand starts to increase well before 2030 and renewable electricity shares reach 60%-70% by 2030. Gas-fired power plant capacity increases from around 220 GW in 2020 to 275 GW by 2030 due to increasing shares of intermittent renewable electricity and the phaseout of coal-based power production. Hydrogen-fired power plants will still have a small role by 2030. To meet the Gas for Climate 2050 end state, further scale-up is needed after 2030, in which installed capacities of gas-fired dispatchable generation running on hydrogen or methane should increase to over 600 GW.
• In the Global Climate Action Pathway, electricity demand grows even faster. Breakthrough technologies in buildings, industry, and power increase electricity demand by 2030 and electricity generation will be partly covered by hydrogen-fired power plants by 2030. Electricity generation increases from about 3,200 TWh in 2020 to over 3,800 TWh in 2030 and installed capacity of gas-fired power increase from about 200 GW in 2020 to 300 GW in 2030, out of which 25 GW uses hydrogen.
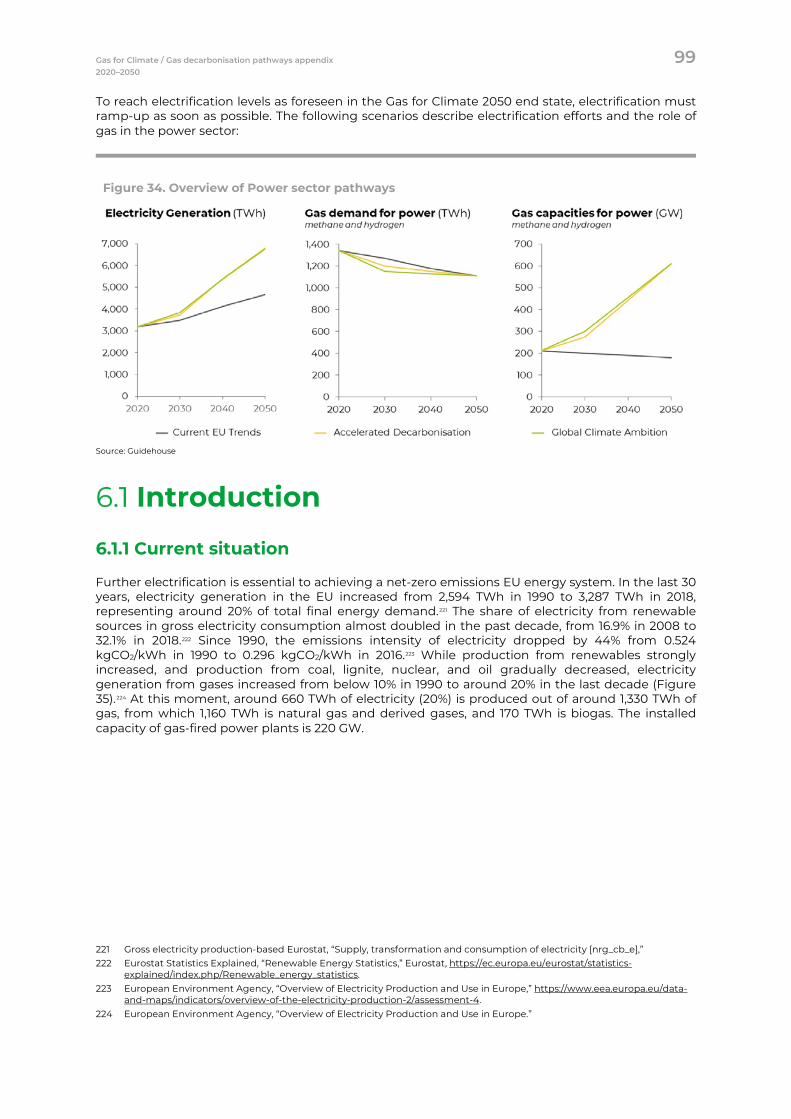
Gas for Climate / Gas decarbonisation pathways appendix 99 2020–2050
To reach electrification levels as foreseen in the Gas for Climate 2050 end state, electrification must ramp-up as soon as possible. The following scenarios describe electrification efforts and the role of gas in the power sector:
Figure 34. Overview of Power sector pathways
Source: Guidehouse
Introduction
6.1.1 Current situation
Further electrification is essential to achieving a net-zero emissions EU energy system. In the last 30 years, electricity generation in the EU increased from 2,594 TWh in 1990 to 3,287 TWh in 2018, representing around 20% of total final energy demand.221 The share of electricity from renewable sources in gross electricity consumption almost doubled in the past decade, from 16.9% in 2008 to 32.1% in 2018.222 Since 1990, the emissions intensity of electricity dropped by 44% from 0.524 kgCO2/kWh in 1990 to 0.296 kgCO2/kWh in 2016.223 While production from renewables strongly increased, and production from coal, lignite, nuclear, and oil gradually decreased, electricity generation from gases increased from below 10% in 1990 to around 20% in the last decade (Figure 35).224 At this moment, around 660 TWh of electricity (20%) is produced out of around 1,330 TWh of gas, from which 1,160 TWh is natural gas and derived gases, and 170 TWh is biogas. The installed capacity of gas-fired power plants is 220 GW.
221 Gross electricity production-based Eurostat, “Supply, transformation and consumption of electricity [nrg_cb_e],” 222 Eurostat Statistics Explained, “Renewable Energy Statistics,” Eurostat, https://ec.europa.eu/eurostat/statistics-
explained/index.php/Renewable_energy_statistics. 223 European Environment Agency, “Overview of Electricity Production and Use in Europe,” https://www.eea.europa.eu/data-
and-maps/indicators/overview-of-the-electricity-production-2/assessment-4. 224 European Environment Agency, “Overview of Electricity Production and Use in Europe.”
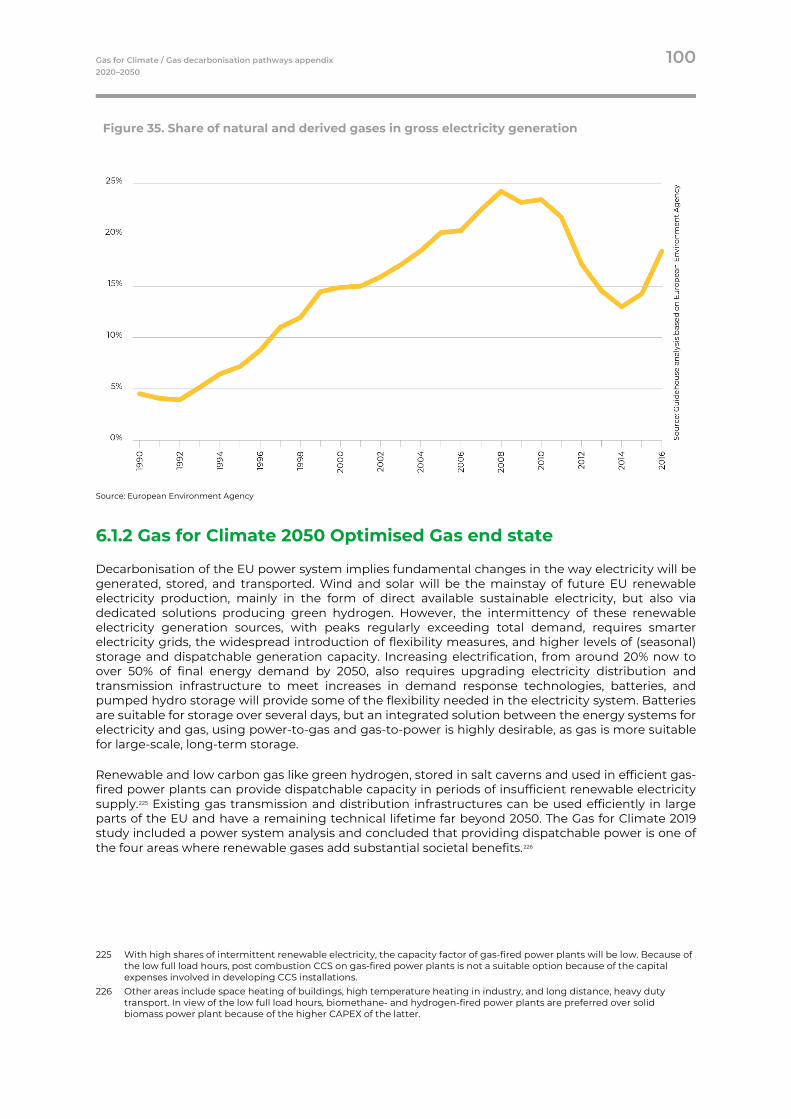
Gas for Climate / Gas decarbonisation pathways appendix 100 2020–2050
Figure 35. Share of natural and derived gases in gross electricity generation
Source: European Environment Agency
6.1.2 Gas for Climate 2050 Optimised Gas end state
Decarbonisation of the EU power system implies fundamental changes in the way electricity will be generated, stored, and transported. Wind and solar will be the mainstay of future EU renewable electricity production, mainly in the form of direct available sustainable electricity, but also via dedicated solutions producing green hydrogen. However, the intermittency of these renewable electricity generation sources, with peaks regularly exceeding total demand, requires smarter electricity grids, the widespread introduction of flexibility measures, and higher levels of (seasonal) storage and dispatchable generation capacity. Increasing electrification, from around 20% now to over 50% of final energy demand by 2050, also requires upgrading electricity distribution and transmission infrastructure to meet increases in demand response technologies, batteries, and pumped hydro storage will provide some of the flexibility needed in the electricity system. Batteries are suitable for storage over several days, but an integrated solution between the energy systems for electricity and gas, using power-to-gas and gas-to-power is highly desirable, as gas is more suitable for large-scale, long-term storage.
Renewable and low carbon gas like green hydrogen, stored in salt caverns and used in efficient gas-fired power plants can provide dispatchable capacity in periods of insufficient renewable electricity supply.225 Existing gas transmission and distribution infrastructures can be used efficiently in large parts of the EU and have a remaining technical lifetime far beyond 2050. The Gas for Climate 2019 study included a power system analysis and concluded that providing dispatchable power is one of the four areas where renewable gases add substantial societal benefits.226
225 With high shares of intermittent renewable electricity, the capacity factor of gas-fired power plants will be low. Because of
the low full load hours, post combustion CCS on gas-fired power plants is not a suitable option because of the capital expenses involved in developing CCS installations.
226 Other areas include space heating of buildings, high temperature heating in industry, and long distance, heavy duty transport. In view of the low full load hours, biomethane- and hydrogen-fired power plants are preferred over solid biomass power plant because of the higher CAPEX of the latter.
Gas for Climate / Gas decarbonisation pathways appendix 101 2020–2050
To produce renewable gases like green hydrogen, more renewable electricity should be produced than directly needed. Even though in an integrated energy system energy needs to be converted twice (electricity to hydrogen to electricity), additional renewable electricity generation for green hydrogen production is the most cost-efficient solution to deal with intermittent energy supply and seasonal fluctuations in energy demand.
In the Gas for Climate 2050 Optimised Gas end state, electricity generation from gas decreases slightly from around 660 TWh in 2020 to around 500 TWh in 2050. However, installed capacity increases from around 220 GW to around 600 GW by 2050. The need for dispatchable power generation is in line with the Eurelectric’s Decarbonisation Scenarios, with around 500 GW gas-fired and nuclear power plants.227 Where generation is mainly based on natural gas, in 2050 this will be a mix of hydrogen (490 GW) and biomethane (120 GW). As gas-fired power is solely used as firm dispatchable power generation by 2050, full load hours decrease but the required capacity increases significantly. Because of the reduced running hours, newly constructed methane- and hydrogen-fired power plants will be primarily open cycle gas turbines (OCGTs). OCGTs have a relatively low CAPEX compared the higher efficiency combined cycle gas turbines.
Electricity pathway under current EU climate and energy policies
Conclusion Current EU Trends
In the Current EU Trends Pathway, we expect limited electrification efforts and ongoing efficiency improvements to result in stable electricity demand towards 2030. When renewable electricity shares in the EU increase towards 55% by 2030, the result is a reduction in gas demand and other fuels. Installed gas-fired power generation capacities remain stable around 220 GW, thereby reducing full load hours of gas-fired power plants. No power generation based on hydrogen is developed until 2030. Current EU trends make it unlikely that we reach the Gas for Climate 2050 end state in terms of total electricity use and generation and, consequently installed capacities of gas-fired dispatchable generation.
6.2.1 EU policies
The main policy drivers for decarbonising the power sector are RED and EU ETS.
The revised RED (RED II) established a new binding renewable energy target for 2030 of at least 32% for the EU, with a clause for possible upwards revision by 2023.228 Member states were required to submit 10-year National Energy and Climate Plans (NECPs) by the end of 2019, outlining how they will meet the new 2030 targets for renewable energy and energy efficiency. Increasing the share of renewable electricity in the power mix is essential in meeting the overall renewable energy targets.
Large-scale electricity generation has been part of the EU ETS from its start in 2005. Price levels increased from early 2018 to above €20/tCO2 in 2019.229 This is a driver for the development of renewable and low carbon electricity generation and for a shift from coal-based towards natural gas-based electricity generation.
227 Eurelectric, 2018. Decarbonisation Pathways – Full study results. Slide 53. Available at:
https://www.eurelectric.org/decarbonisation-pathways/ 228 Energy, “Renewable energy directive,” European Commission https://ec.europa.eu/energy/en/topics/renewable-
energy/renewable-energy-directive/overview 229 Carbon Price Viewer, “EUA Price,” Sandbag: Smarter Climate Policy, https://sandbag.org.uk/carbon-price-viewer/.
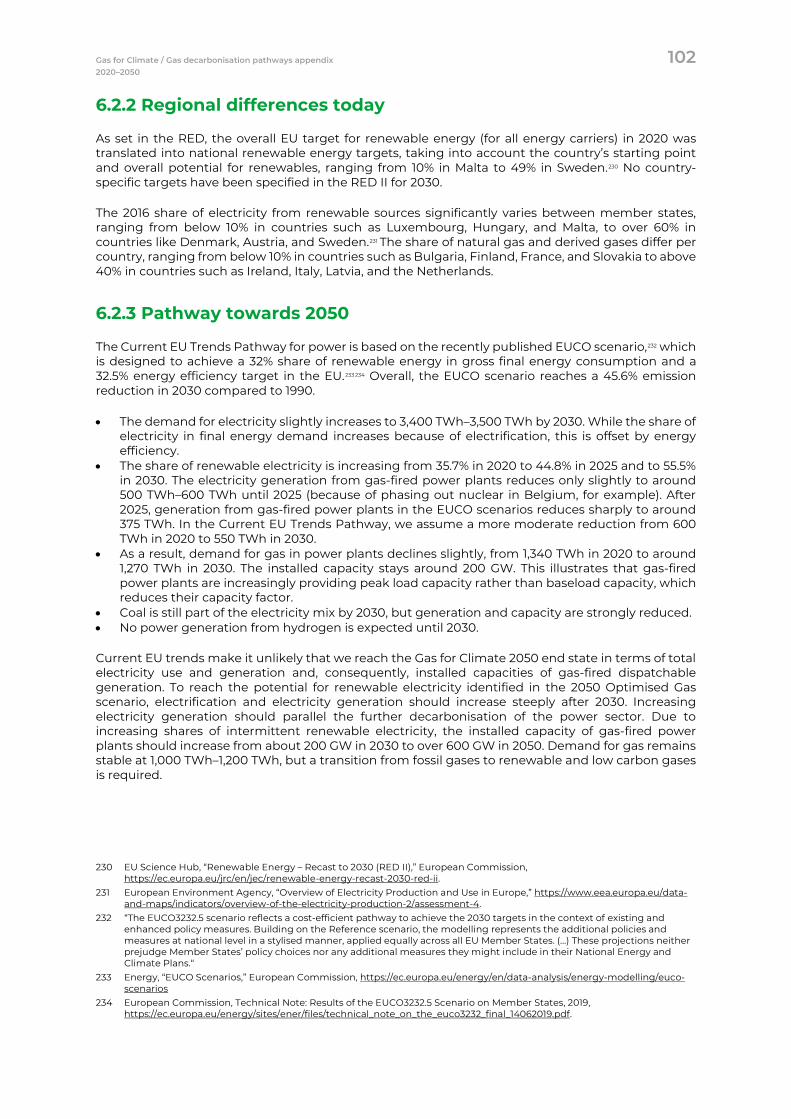
Gas for Climate / Gas decarbonisation pathways appendix 102 2020–2050
6.2.2 Regional differences today
As set in the RED, the overall EU target for renewable energy (for all energy carriers) in 2020 was translated into national renewable energy targets, taking into account the country’s starting point and overall potential for renewables, ranging from 10% in Malta to 49% in Sweden.230 No country-specific targets have been specified in the RED II for 2030.
The 2016 share of electricity from renewable sources significantly varies between member states, ranging from below 10% in countries such as Luxembourg, Hungary, and Malta, to over 60% in countries like Denmark, Austria, and Sweden.231 The share of natural gas and derived gases differ per country, ranging from below 10% in countries such as Bulgaria, Finland, France, and Slovakia to above 40% in countries such as Ireland, Italy, Latvia, and the Netherlands.
6.2.3 Pathway towards 2050
The Current EU Trends Pathway for power is based on the recently published EUCO scenario,232 which is designed to achieve a 32% share of renewable energy in gross final energy consumption and a 32.5% energy efficiency target in the EU.233 234 Overall, the EUCO scenario reaches a 45.6% emission reduction in 2030 compared to 1990.
• The demand for electricity slightly increases to 3,400 TWh–3,500 TWh by 2030. While the share of electricity in final energy demand increases because of electrification, this is offset by energy efficiency.
• The share of renewable electricity is increasing from 35.7% in 2020 to 44.8% in 2025 and to 55.5% in 2030. The electricity generation from gas-fired power plants reduces only slightly to around 500 TWh–600 TWh until 2025 (because of phasing out nuclear in Belgium, for example). After 2025, generation from gas-fired power plants in the EUCO scenarios reduces sharply to around 375 TWh. In the Current EU Trends Pathway, we assume a more moderate reduction from 600 TWh in 2020 to 550 TWh in 2030.
• As a result, demand for gas in power plants declines slightly, from 1,340 TWh in 2020 to around 1,270 TWh in 2030. The installed capacity stays around 200 GW. This illustrates that gas-fired power plants are increasingly providing peak load capacity rather than baseload capacity, which reduces their capacity factor.
• Coal is still part of the electricity mix by 2030, but generation and capacity are strongly reduced. • No power generation from hydrogen is expected until 2030.
Current EU trends make it unlikely that we reach the Gas for Climate 2050 end state in terms of total electricity use and generation and, consequently, installed capacities of gas-fired dispatchable generation. To reach the potential for renewable electricity identified in the 2050 Optimised Gas scenario, electrification and electricity generation should increase steeply after 2030. Increasing electricity generation should parallel the further decarbonisation of the power sector. Due to increasing shares of intermittent renewable electricity, the installed capacity of gas-fired power plants should increase from about 200 GW in 2030 to over 600 GW in 2050. Demand for gas remains stable at 1,000 TWh–1,200 TWh, but a transition from fossil gases to renewable and low carbon gases is required.
230 EU Science Hub, “Renewable Energy – Recast to 2030 (RED II),” European Commission,
https://ec.europa.eu/jrc/en/jec/renewable-energy-recast-2030-red-ii. 231 European Environment Agency, “Overview of Electricity Production and Use in Europe,” https://www.eea.europa.eu/data-
and-maps/indicators/overview-of-the-electricity-production-2/assessment-4. 232 “The EUCO3232.5 scenario reflects a cost-efficient pathway to achieve the 2030 targets in the context of existing and
enhanced policy measures. Building on the Reference scenario, the modelling represents the additional policies and measures at national level in a stylised manner, applied equally across all EU Member States. (…) These projections neither prejudge Member States’ policy choices nor any additional measures they might include in their National Energy and Climate Plans.“
233 Energy, “EUCO Scenarios,” European Commission, https://ec.europa.eu/energy/en/data-analysis/energy-modelling/euco-scenarios
234 European Commission, Technical Note: Results of the EUCO3232.5 Scenario on Member States, 2019, https://ec.europa.eu/energy/sites/ener/files/technical_note_on_the_euco3232_final_14062019.pdf.
Gas for Climate / Gas decarbonisation pathways appendix 103 2020–2050
Accelerated Decarbonisation Pathway – Electricity
Conclusion Accelerated Decarbonisation
To realise strong emission reductions in the next decades (as envisioned in the Accelerated Decarbonisation Pathway) actions are required on all possible levels:
• The major contribution to emission reductions in the power sector should come from the increased deployment of renewable electricity generation to 60%-70% of total electricity generation in 2030 and the full decarbonisation of the power sector around 2045.
• Other measures are needed to reduce emissions. Accelerating the coal phaseout to realise emission reductions (in addition to those resulting from renewable electricity deployment) as well as deployment of blue hydrogen for power generation, can put Europe on a steep emission reduction curve.
In the Accelerated Decarbonisation Pathway, 60%-70% of electricity in 2030 will be generated by renewables. The remaining 30%-40% will be primarily covered by nuclear (around 20%) and gas (around 15%). Gas demand in the power sector amounts to around 1,200 TWh by 2030. While gas demand is reducing slightly, gas-fired power plant capacity increases from around 220 GW in 2020 to 275 GW by 2030 due to increasing shares of intermittent renewable electricity and the phaseout of coal-based power production. Initially, there will be an increase in installed capacity of power plants running on methane. However, because of the switch towards hydrogen in the longer term, these new plants should be hydrogen-ready.
6.3.1 The Green Deal’s implications for power
The goal of the EU Green Deal is to get on track towards climate neutrality in 2050. It aims to increase the EU emission reduction target to 55% by 2030. If the European Commission’s long-term strategy is successful, 53% of Europe’s energy needs would be met by electricity by 2050.235 Accelerated decarbonisation can be achieved through various means—energy efficiency targets, renewable energy targets, lower ETS cap—but an increased level of electrification and faster deployment of renewables is likely part of the equation.236 In Eurelectric’s Decarbonisation Scenarios and in the European Commission’s pathway presented in A Clean Planet for All, the power sector should fully decarbonise and reach 0 g/kWh by 2045.237 As such, renewable electricity shares of up to 60%-70% by 2030 are required. In addition, a phaseout of coal-fired power plants can strengthen emission reductions in the short term. Increased electrification, faster deployment of renewables, and phaseout of coal-fired electricity generation increases the need for flexibility, including dispatchable generation, to deal with variability.
235 Dave Keating, “Europe Needs to Double Electricity Share to Meet Climate Goals – EU Official,” Euractive, November 7, 2019,
https://www.euractiv.com/section/electricity/news/europe-needs-to-double-electricity-share-to-meet-climate-goals-eu-official/.
236 Climate Action, “2050 Long-Term Strategy,” European Commission, https://ec.europa.eu/clima/policies/strategies/2050_en. 237 Eurelectric, 2018. Decarbonisation Pathways – Full study results. Slide 53. Available at:
https://www.eurelectric.org/decarbonisation-pathways/
Gas for Climate / Gas decarbonisation pathways appendix 104 2020–2050
6.3.2 Pathway towards 2050 Optimised Gas scenario
Compared to the Current EU Trends Pathway, the Accelerated Decarbonisation Pathway involves an increase of electricity demand as result of increased electrification efforts. Electricity generation and resulting gas demand are obtained from the 2030 snapshots in the European Commission’s long-term vision in its A Clean Planet for All. To achieve a decarbonised power sector by 2040, the renewable electricity share should be around 60%-65% by 2030 (as compared to 55% in the EUCO scenario). Like the Current EU Trends Pathway, the Accelerated Decarbonisation Pathway projects a larger role for gas in 2030, partly because of phasing out coal-fired electricity generation and partly because of required dispatchable generation capacity for increased shares of renewables.
• The demand for electricity increases from around 3,200 TWh in 2020 towards 3,700 TWh in 2030. • Electricity generation from gas-fired power plants reduces. As a result, gas demand reduces from
1,340 TWh in 2020 to around 1,200 TWh in 2030. Installed capacities increase from 220 GW in 2020 to 275 GW in 2030.
• Some of the additional capacity build towards 2030 can be based on hydrogen.
To reach the 2050 Optimised Gas Pathway, electrification and electricity generation should continue to increase steeply after 2030. Due to increasing shares of intermittent renewable electricity, the installed capacity of gas-fired dispatchable generation should increase from about 275 GW in 2030 to 600 GW in 2050. Demand for gas remains at levels ranging from 1,000 TWh–1,200 TWh. A transition from fossil gases to renewable and low carbon gases is also required.
6.3.3 Critical timeline
In the Accelerated Decarbonisation Pathway, 60%-70% of electricity in 2030 will be generated by renewables. The remaining 30%-40% will be primarily covered by nuclear (around 20%) and gas (around 15%). Gas demand in the power sector amounts to around 1,200 TWh by 2030. While gas demand is reducing slightly, gas-fired power plant capacity increases from around 220 GW in 2020 to 275 GW by 2030 due to increasing shares of intermittent renewable electricity and the phaseout of coal-based power production. Initially, there will be an increase in installed capacity of power plants running on methane. However, because of the switch towards hydrogen in the longer term, these new plants should be hydrogen ready.
Plants located in industrial clusters where blue hydrogen will be developed will be the first to move from methane to hydrogen in the coming decade. More solitary gas-fired power plants outside hydrogen clusters have three options:
1. Delay shifting from methane to hydrogen until they get connected to the hydrogen network or the existing gas grid connection is converted to hydrogen
2. Get natural gas through their existing grid connection and produce blue hydrogen onsite238 3. Get a private company to invest in a dedicated hydrogen pipe to supply them
Developing new capacity requires overall energy system planning that considers the future layout and build-up of dedicated hydrogen networks and the future development of regional electricity demand.
238 Also referred to as pre-combustion CCS.
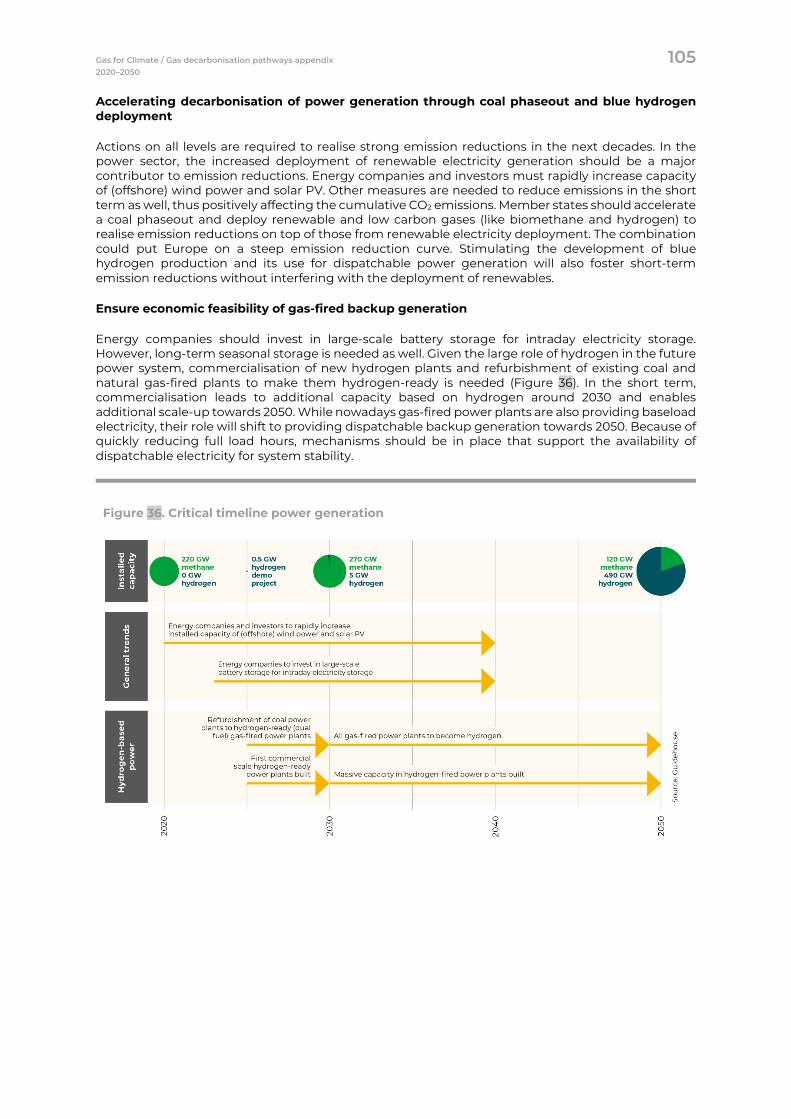
Gas for Climate / Gas decarbonisation pathways appendix 105 2020–2050
Accelerating decarbonisation of power generation through coal phaseout and blue hydrogen deployment
Actions on all levels are required to realise strong emission reductions in the next decades. In the power sector, the increased deployment of renewable electricity generation should be a major contributor to emission reductions. Energy companies and investors must rapidly increase capacity of (offshore) wind power and solar PV. Other measures are needed to reduce emissions in the short term as well, thus positively affecting the cumulative CO2 emissions. Member states should accelerate a coal phaseout and deploy renewable and low carbon gases (like biomethane and hydrogen) to realise emission reductions on top of those from renewable electricity deployment. The combination could put Europe on a steep emission reduction curve. Stimulating the development of blue hydrogen production and its use for dispatchable power generation will also foster short-term emission reductions without interfering with the deployment of renewables.
Ensure economic feasibility of gas-fired backup generation
Energy companies should invest in large-scale battery storage for intraday electricity storage. However, long-term seasonal storage is needed as well. Given the large role of hydrogen in the future power system, commercialisation of new hydrogen plants and refurbishment of existing coal and natural gas-fired plants to make them hydrogen-ready is needed (Figure 36). In the short term, commercialisation leads to additional capacity based on hydrogen around 2030 and enables additional scale-up towards 2050. While nowadays gas-fired power plants are also providing baseload electricity, their role will shift to providing dispatchable backup generation towards 2050. Because of quickly reducing full load hours, mechanisms should be in place that support the availability of dispatchable electricity for system stability.
Figure 36. Critical timeline power generation
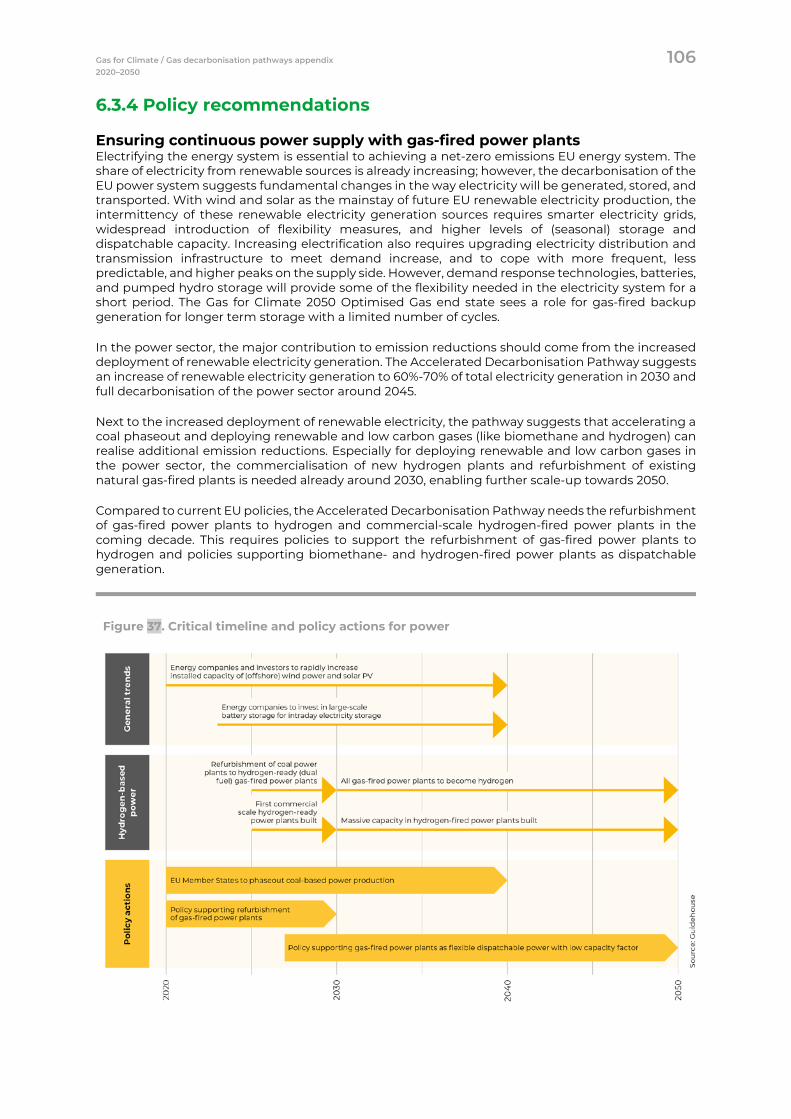
Gas for Climate / Gas decarbonisation pathways appendix 106 2020–2050
6.3.4 Policy recommendations
Ensuring continuous power supply with gas-fired power plants Electrifying the energy system is essential to achieving a net-zero emissions EU energy system. The share of electricity from renewable sources is already increasing; however, the decarbonisation of the EU power system suggests fundamental changes in the way electricity will be generated, stored, and transported. With wind and solar as the mainstay of future EU renewable electricity production, the intermittency of these renewable electricity generation sources requires smarter electricity grids, widespread introduction of flexibility measures, and higher levels of (seasonal) storage and dispatchable capacity. Increasing electrification also requires upgrading electricity distribution and transmission infrastructure to meet demand increase, and to cope with more frequent, less predictable, and higher peaks on the supply side. However, demand response technologies, batteries, and pumped hydro storage will provide some of the flexibility needed in the electricity system for a short period. The Gas for Climate 2050 Optimised Gas end state sees a role for gas-fired backup generation for longer term storage with a limited number of cycles.
In the power sector, the major contribution to emission reductions should come from the increased deployment of renewable electricity generation. The Accelerated Decarbonisation Pathway suggests an increase of renewable electricity generation to 60%-70% of total electricity generation in 2030 and full decarbonisation of the power sector around 2045.
Next to the increased deployment of renewable electricity, the pathway suggests that accelerating a coal phaseout and deploying renewable and low carbon gases (like biomethane and hydrogen) can realise additional emission reductions. Especially for deploying renewable and low carbon gases in the power sector, the commercialisation of new hydrogen plants and refurbishment of existing natural gas-fired plants is needed already around 2030, enabling further scale-up towards 2050.
Compared to current EU policies, the Accelerated Decarbonisation Pathway needs the refurbishment of gas-fired power plants to hydrogen and commercial-scale hydrogen-fired power plants in the coming decade. This requires policies to support the refurbishment of gas-fired power plants to hydrogen and policies supporting biomethane- and hydrogen-fired power plants as dispatchable generation.
Figure 37. Critical timeline and policy actions for power
Gas for Climate / Gas decarbonisation pathways appendix 107 2020–2050
Global Climate Action Pathway
Conclusion Global Climate Action
In the Global Climate Action Pathway, electricity demand grows even faster, and hydrogen-based power production emerges before 2030. Breakthrough technologies in buildings, industry, and power increase electricity demand by 2030. Electricity generation will be partly covered by hydrogen-fired power plants by 2030. Electricity generation increases from about 3,200 TWh in 2020 to over 3,800 TWh in 2030 and installed capacity of gas-fired power increase from about 200 GW in 2020 to 300 GW in 2030, out of which around 10 GW is hydrogen.
6.4.1 Pathway towards 2050
In the Global Climate Action Pathway, we envision even more electrification efforts up until 2030, resulting in higher uptake of electric vehicles, heat pumps, and more. Similar to the Accelerated Decarbonisation Pathway, by 2030, the Global Climate Action Pathway reaches a 60%-70% renewable electricity share of total electricity. Higher electricity demand combined with a coal phaseout by 2030 results in additional gas-fired capacity and gas demand towards 2030. Part of the additional demand is covered by retrofitted and newly built hydrogen-fired power plants.239 Stimulating the development of hydrogen production and its use for dispatchable power generation will foster short-term emission reductions without interfering with the deployment of renewables.
• The demand for electricity increases from around 3,200 TWh in 2020 towards over 3,800 TWh in 2030.
• Electricity generation from gas-fired power plants reduces. As a result, gas demand reduces from 1,340 TWh in 2020 to around 1,150 TWh in 2030. Capacity increases from 200 GW in 2020 to 300 GW in 2030.
• Of the additional capacity built towards 2030, around 10 GW is based on hydrogen.
After 2030, electrification and electricity generation increase steeply. Due to increasing shares of intermittent renewable electricity, the installed capacity of gas-fired power plants should increase from about 300 GW in 2030 to 500 GW in 2050. Demand for gas remains at levels ranging from 1,000 TWh–1,200 TWh. A transition from fossil gases to renewable and low carbon gases is required as well. The installed capacity of gas-fired dispatchable generation is lower than in the Accelerated Decarbonisation Pathway because of the expected breakthrough developments in batteries, making them suitable for energy storage over longer periods of time.
239 Because gas-fired power plants are increasingly used for backup generation only, open cycle gas turbines (OCGT) are
preferable because of their lower CAPEX compared to combined cycle gas turbines (CCGT). While CCGT plants have higher efficiencies, OCGT plants are more economical because of the low full load hours.
Gas for Climate / Gas decarbonisation pathways appendix 108 2020–2050
Gas Infrastructure Pathways Key Takeaways
• Gas infrastructure ensures the reliability and flexibility of the EU energy system.
• Under current EU climate and energy policies, gas grids will continue to transport, store and distribute decreasing quantities of natural gas in coming decades plus increasing quantities of biomethane and hydrogen.
• The Accelerated Decarbonisation Pathway would lead to the creation of a dedicated European Hydrogen Backbone infrastructure shortly after 2030, largely based on existing gas infrastructure.
• In the Accelerated Decarbonisation Pathway biomethane will gradually replace natural gas in the parts of the transmission grid that will not be converted to hydrogen. And gas distribution networks would increasingly be used to distribute biomethane to older buildings.
• Blending natural gas with a certain amount of hydrogen can—depending on region and customer base—facilitate a short-term market for hydrogen suppliers. Yet the hydrogen volumes needed to reach a net-zero emission energy system in 2050 will require a dedicated hydrogen infrastructure around 2030.
Gas for Climate / Gas decarbonisation pathways appendix 109 2020–2050
Introduction Gas infrastructure plays a key role in the current EU energy system, connecting European gas production sites, onshore pipeline, and LNG import entry points to demand centres across Europe. Gas transported through gas infrastructure provides a flexible, storable, and cost-efficient form of energy. Gas assets are an important tool in achieving a net-zero carbon economy by transporting renewable and low carbon gases. Most importantly, the large and flexible capacity of the gas grid can realise strong synergies with large-scale intermittent renewable power generation.
Transitioning towards a net-zero carbon economy will impact the role of gas grids as they exist today. This chapter outlines several pathways describing this transition at various speeds, related to future market conditions and policies to stimulate developments.
The Gas for Climate 2050 study conclusions
The Gas for Climate 2019 report drew important conclusions on the role of infrastructure in a net-zero carbon economy in 2050:
• The Optimised Gas scenario, based on electricity, (bio)methane, and hydrogen energy carriers, results in €19 billion of lower energy infrastructure costs compared to the Minimal Gas scenario annually by 2050 due to prolonged utilisation of gas infrastructure. In addition, much higher additional cost savings associated with the Optimised Gas scenario are achieved elsewhere in the energy system in energy end use and supply.
• Existing gas infrastructure will have a valuable role in transporting, storing, and distributing renewable and low carbon gases.
• The existing transmission grid will be used for inter-regional and cross-border transport of hydrogen and mainly intra-regional transport of renewable methane in parallel.
• The existing gas distribution grid will be used to distribute biomethane to buildings, mainly for heating during cold periods. This leads to high net system cost savings per cubic metre of gas.
• Quantities of gas transported in 2050 decrease compared to current volumes though transported peak demand will decrease much slower.
This pathway analysis focuses on how gas infrastructures will support the pathways to the Gas for Climate 2050 Optimised Gas end state.
The role of gas grids in Europe today240
Gas infrastructure plays and will continue to play a key role in the current EU energy system. It connects gas production sites in Europe, as well as pipeline import points on the EU borders and LNG terminals with demand centres all over Europe (including natural, renewable, and decarbonised gas production). Gas infrastructure is currently used to transport and distribute 25% of EU’s primary energy consumption, or about 4,500 TWh (NCV) equalling about 425 bcm of natural gas.241 As the energy transition advances, gas infrastructure will provide transportation and storage capacity for renewable energy in the form of gaseous energy carriers. The European gas infrastructure will make the overall European energy system more flexible and more resilient.
240 Section taken from Navigant, Gas for Climate, 2019 241 Quantity reported in net calorific value, equalling about 5,000 TWh in gross calorific value. Eurostat, Natural gas supply
statistics, gross inland consumption of natural gas in 2018. Total EU energy consumption in 2017 was 1675 Mtoe or around 19,000 TWh.
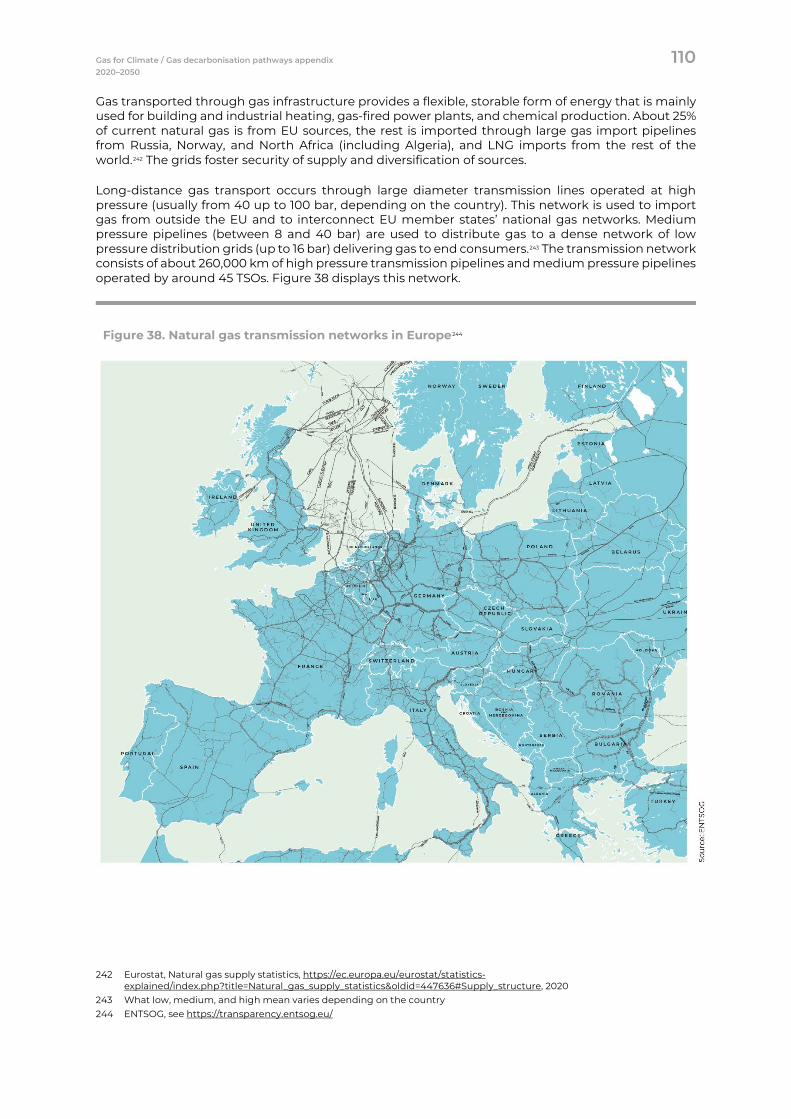
Gas for Climate / Gas decarbonisation pathways appendix 110 2020–2050
Gas transported through gas infrastructure provides a flexible, storable form of energy that is mainly used for building and industrial heating, gas-fired power plants, and chemical production. About 25% of current natural gas is from EU sources, the rest is imported through large gas import pipelines from Russia, Norway, and North Africa (including Algeria), and LNG imports from the rest of the world.242 The grids foster security of supply and diversification of sources.
Long-distance gas transport occurs through large diameter transmission lines operated at high pressure (usually from 40 up to 100 bar, depending on the country). This network is used to import gas from outside the EU and to interconnect EU member states’ national gas networks. Medium pressure pipelines (between 8 and 40 bar) are used to distribute gas to a dense network of low pressure distribution grids (up to 16 bar) delivering gas to end consumers.243 The transmission network consists of about 260,000 km of high pressure transmission pipelines and medium pressure pipelines operated by around 45 TSOs. Figure 38 displays this network.
Figure 38. Natural gas transmission networks in Europe244
242 Eurostat, Natural gas supply statistics, https://ec.europa.eu/eurostat/statistics-
explained/index.php?title=Natural_gas_supply_statistics&oldid=447636#Supply_structure, 2020 243 What low, medium, and high mean varies depending on the country 244 ENTSOG, see https://transparency.entsog.eu/
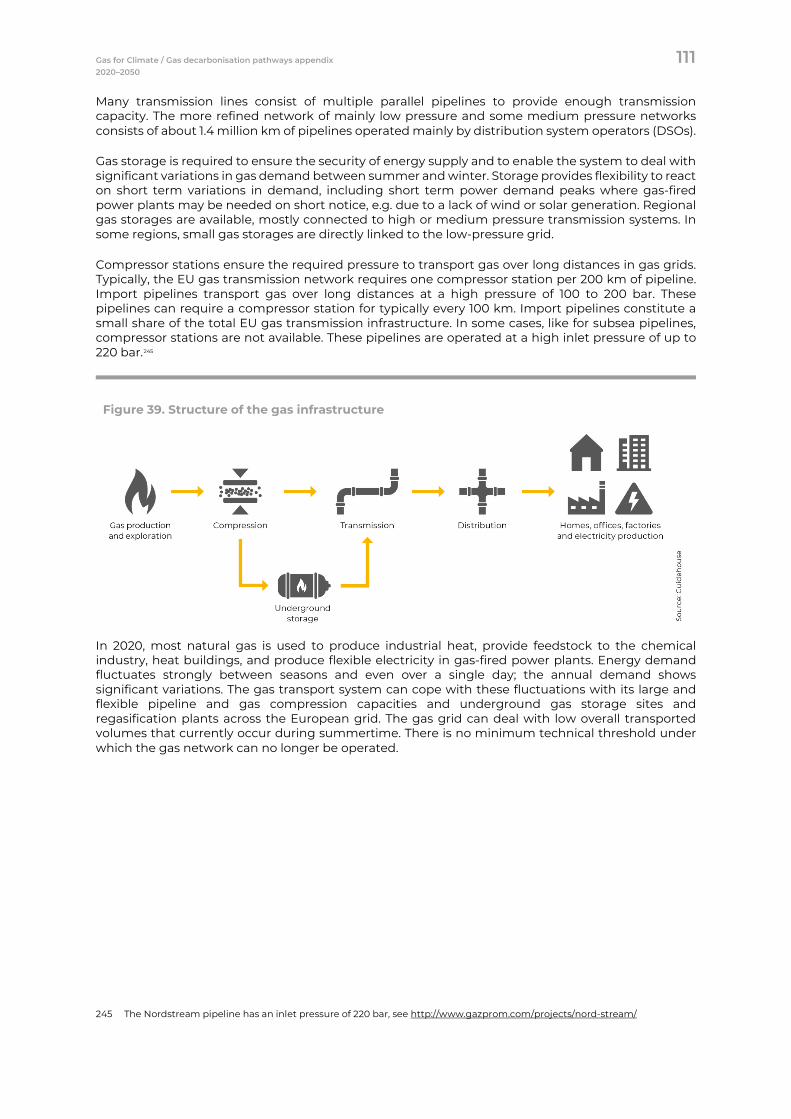
Gas for Climate / Gas decarbonisation pathways appendix 111 2020–2050
Many transmission lines consist of multiple parallel pipelines to provide enough transmission capacity. The more refined network of mainly low pressure and some medium pressure networks consists of about 1.4 million km of pipelines operated mainly by distribution system operators (DSOs).
Gas storage is required to ensure the security of energy supply and to enable the system to deal with significant variations in gas demand between summer and winter. Storage provides flexibility to react on short term variations in demand, including short term power demand peaks where gas-fired power plants may be needed on short notice, e.g. due to a lack of wind or solar generation. Regional gas storages are available, mostly connected to high or medium pressure transmission systems. In some regions, small gas storages are directly linked to the low-pressure grid.
Compressor stations ensure the required pressure to transport gas over long distances in gas grids. Typically, the EU gas transmission network requires one compressor station per 200 km of pipeline. Import pipelines transport gas over long distances at a high pressure of 100 to 200 bar. These pipelines can require a compressor station for typically every 100 km. Import pipelines constitute a small share of the total EU gas transmission infrastructure. In some cases, like for subsea pipelines, compressor stations are not available. These pipelines are operated at a high inlet pressure of up to 220 bar.245
Figure 39. Structure of the gas infrastructure
In 2020, most natural gas is used to produce industrial heat, provide feedstock to the chemical industry, heat buildings, and produce flexible electricity in gas-fired power plants. Energy demand fluctuates strongly between seasons and even over a single day; the annual demand shows significant variations. The gas transport system can cope with these fluctuations with its large and flexible pipeline and gas compression capacities and underground gas storage sites and regasification plants across the European grid. The gas grid can deal with low overall transported volumes that currently occur during summertime. There is no minimum technical threshold under which the gas network can no longer be operated.
245 The Nordstream pipeline has an inlet pressure of 220 bar, see http://www.gazprom.com/projects/nord-stream/
Gas for Climate / Gas decarbonisation pathways appendix 112 2020–2050
Gas infrastructure pathway under current EU policies
Conclusion Current EU Trends
The current gas infrastructure plays an important role in the EU energy system. Under current policies, gas demand will decrease to about 4,200 TWh or around 395 bcm by 2030, however gas peak demand would only decrease slightly, and the use of natural gas will remain an important part of the future energy mix.
Current capacities of the gas grid are sufficient to meet current and future demand; however, there can be regional considerations for transmission and distribution grid expansion, such as gas source diversification or a local switch from coal to natural gas.
To accommodate a slowly growing role of hydrogen in industries and transport up to 2030, local point-to-point pipelines and transport via trucks will be sufficient. In some cases, hydrogen could be blended into gas distribution grids to avoid the need for dedicated pipeline development.
This section describes a gas infrastructure pathway under current EU climate and energy policies.
7.3.1 Existing EU policies relevant for gas infrastructure
All EU policies as described in previous sections will impact the future consumption and supply of natural gas, biomethane, and hydrogen and will impact the way in which gas infrastructure will be used in the future. In addition to this, some EU policies specifically cover natural gas, most notably the gas directive246 and the security of supply directive.247
EU gas directive
The EU gas directive covers all gas grids in EU member states and between member states and third countries. The most important elements are the EU-rules for the gas market, such as unbundling network and production, third-party access, non-discriminatory tariffs, and requirements for transparency.
Security of Supply Directive
Requires the European Network for Transmission System Operators for Gas (ENTSOG) to perform an EU-wide gas supply and infrastructure disruption simulation to identify major supply risks for the EU.248 In addition, specific policies have been put forward to ensure that EU-wide infrastructure develops in alignment with specific priorities in security of supply such as defined in the Connecting Europe Facility249 (CEF) and the underlying Trans-European Network Energy programme (TEN-E).250
246 2009/73/EC, Concerning common rules for the internal market in natural gas and repealing Directive 2003/55/EC 247 2017/1938, Concerning measures to safeguard the security of gas supply and repealing Regulation (EU) No 994/2010 248 ec.europa.eu 249 1316/2013, Establishing the Connecting Europe Facility, amending Regulation (EU) No 913/2010 and repealing Regulations
(EC) No 680/2007 and (EC) No 67/2010 250 347/2013, On guidelines for trans-European energy infrastructure and repealing Decision No 1364/2006/EC and amending
Regulations (EC) No 713/2009, (EC) No 714/2009 and (EC) No 715/2009

Gas for Climate / Gas decarbonisation pathways appendix 113 2020–2050
Existing gas transmission pipelines transport natural gas and a small quantity of biomethane. Differences in gas quality are linked to the origin of the gas. The EU is working towards a more harmonised gas quality across Europe in collaboration with the European Association for the Streamlining of Energy Exchange (EASEE-gas).251
The EU Energy Union strategy aims to remove technical and regulatory barriers to energy flowing freely throughout the EU. This includes diversification of gas supply sources and routes. Transmission operators must secure bidirectionality on all cross-border capacity, unless exempted. The Energy Union also stimulates international collaboration in the Energy Infrastructure forum and in high level groups. Development of the infrastructure is facilitated via TEN-E and Projects of Common Interest (PCIs).252
CEF Energy, TEN-E, and PCIs
CEF Energy is an EU funding instrument to promote growth, jobs, and competitiveness in energy infrastructure investment at the European level and promote the development of TEN-E. Four priority gas corridors have been identified that should deliver more gas supply diversification and security of supply to member states. In addition, corridors will be developed that tackle short term integration between electricity and gas, smart grids to integrate renewable energy, cross-border CO2 grids, and electricity highways to connect renewable energy hotspots to demand sites and storage potential. PCIs facilitate development of cross-border infrastructures, including projects that enable countries to diversify their supply via LNG imported into the EU.
Source: Source: ec.europa.eu
The EU has undertaken efforts to enhance energy security by enabling the import of LNG to diversify gas supply. Interconnections will be predominantly bidirectional to allow flows from both directions to be used as gas source. This is especially relevant since LNG imports typically come from different coastal areas in Europe (Figure 40) compared to the imports of gas via mainly onshore pipelines in southern and eastern EU.
As the gas diversification strategy results in more imported LNG to be regasified and supplied to the grid, the direct use of LNG will also grow, mainly in maritime and truck transport. Growth of the direct demand for LNG is not expected to have a large impact on gas pipeline infrastructure, as maritime use will be close to shore, allowing the majority of LNG demand to be supplied via ships, partially using the same infrastructure as for LNG imports.253 For LNG demand in trucks, the LNG can be transported through supply trucks, or through local liquefaction of biomethane.
251 https://ec.europa.eu/energy/en/topics/markets-and-consumers/wholesale-market/gas-quality-harmonisation 252 European Commission, www.europa.ec (2019) 253 Trinomics, The role of Trans-European gas infrastructure in the light of the 2050 decarbonisation targets, 2018
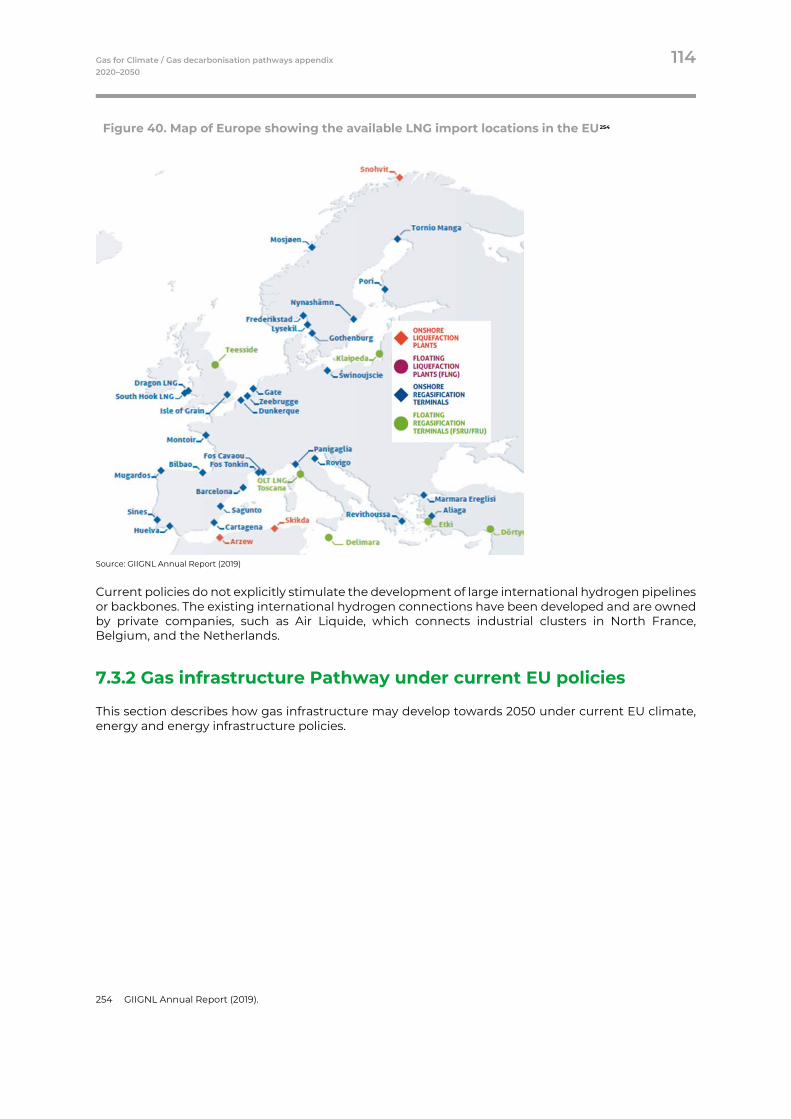
Gas for Climate / Gas decarbonisation pathways appendix 114 2020–2050
Figure 40. Map of Europe showing the available LNG import locations in the EU254
Source: GIIGNL Annual Report (2019)
Current policies do not explicitly stimulate the development of large international hydrogen pipelines or backbones. The existing international hydrogen connections have been developed and are owned by private companies, such as Air Liquide, which connects industrial clusters in North France, Belgium, and the Netherlands.
7.3.2 Gas infrastructure Pathway under current EU policies
This section describes how gas infrastructure may develop towards 2050 under current EU climate, energy and energy infrastructure policies.
254 GIIGNL Annual Report (2019).
Gas for Climate / Gas decarbonisation pathways appendix 115 2020–2050
7.3.2.1 Gas Infrastructure during 2020-2030
To understand the impact of the current EU 2030 policy package on the required EU gas infrastructure, we base ourselves on the plans made by the individual member states to meet the EU 2030 energy strategy targets, as set out in their NECPs255 and captured in the TYNDP National Trends scenario.256 According to the TYNDP scenario, the gas demand in the EU will drop towards 2030 by around 12% to around 4,200 TWh, resulting in a few percent drops in required peak capacity for gas transmission.257 Biomethane production under current EU policies could grow to about 200 TWh by 2030, or about 4% of the total gas demand. A large part of the biomethane will be fed into the distribution grids and are not expected to impact the available capacity of the grids
Regional market developments could result in local need for capacity increase due to the need to import more gas into Europe due to indigenous EU production decrease, e.g. the upcoming production stop in the Groningen field and growing regional demand due to coal-to-gas fuel switching in the power sector and switching from oil-based building heating to gas-based, mainly in Eastern Europe.
Under current policies, hydrogen will not play a major role in the European energy system in 2030, even in scenarios that have a large share of hydrogen in the final gas mix.258,259,260 The development of blue hydrogen mainly replaces already existing grey hydrogen production from natural gas and results only in a local need for CO2 transport infrastructure. In the period 2020 to 2030, green hydrogen production is tested in demonstration projects, closely linked to existing hydrogen assets or use. If required, in some regions, the already existing hydrogen infrastructure could be used to distribute hydrogen, such as in France, Belgium, Germany, and the Netherlands. Regions with CO2 storage locations and industries with hydrogen production and demand (such as along the North Sea coast and in the southern part of Europe) will be the first to develop new hydrogen infrastructures that service users beyond existing industrial markets.
Up to 2030, the available capacity of the current gas infrastructure will be sufficient to meet the natural gas and biomethane demand. Little impact is foreseen due to biomethane or hydrogen production and demand developments. Regional developments can introduce local capacity constraints. However, it will be possible to incorporate these organically as part of the regular grid planning cycle.
7.3.2.2 Gas Infrastructure during 2030-2050
Current EU climate and energy policies are unlikely to deliver a net-zero emissions energy system by 2050. In this scenario, natural gas consumption would somewhat decline over time, but it may be likely that by 2050 still significant volumes of natural gas would be used. This means that gas infrastructure would continue to carry natural gas. In this scenario, the use of hydrogen mostly will be limited to industries, which means that there will be limited need for dedicated hydrogen networks and that infrastructure will be limited to mainly local, point-to-point connections. Biomethane injection to grids would increase, but likely far below the EU biomethane potential. A decrease in natural gas volumes combined with a limited uptake of both hydrogen and biomethane can mean that between 2030 and 2050 parts of existing European gas grids may become obsolete and would be mothballed or decommissioned. This could be particularly true for routes with multiple parallel pipelines.
255 ENTSOG, ENTSOE, TYNDP 2020 Scenario report & TYNDP 2020 Scenario Methodology Report 2019. 256 Regulation (EU) 347/2013 requires that the ENTSOs use scenarios for their respective Ten-Year Network Development
Plans (TYNDPs). Final NECPs have been published in December 2019, which will result in a revised TYNDP National Trends scenario by February 2020. Although this scenario will not reach the COP21 climate target of full CO2 emission reduction, it provides a best possible effort to forecast the impact of current policies on the 2030 gas infrastructure.
257 ENTSOG, ENTSOE, TYNDP 2020 Scenario report. 258 Navigant, Gas for Climate, 2019. 259 Trinomics, The role of Trans-European gas infrastructure in the light of the 2050 decarbonisation targets, 2018. 260 International Energy Agency, The future of hydrogen, 2019.
Gas for Climate / Gas decarbonisation pathways appendix 116 2020–2050
Accelerated decarbonisation pathway – gas infrastructure
Conclusion Accelerated Decarbonisation
Natural gas consumption will decrease more rapidly while renewable and low carbon gases are scaled up rapidly in parallel. No gas grid capacity issues are foreseen in the current gas infrastructure. Biomethane and hydrogen make up 10% of total gas consumption in the EU by 2030, followed by a rapid and accelerated scale-up between 2030 and 2050.
Up to 2030, gas infrastructure will be mainly used to transport, store and distribute natural gas, yet volumes of grid-injected biomethane and hydrogen will increase gradually. Biomethane is injected mainly in low and medium pressure grids yet also in higher pressure grids. Biomethane will often be used locally to heat buildings with gas connections yet will increasingly also be transported to different regions and across borders through transmission grids, facilitated by reverse-flow technology. Between 2040 and 2050 a notable production of power to methane could be expected, using biogenic CO2 captured in large biogas digesters and green hydrogen produced onsite. This methane will be injected in existing gas grids. Up to 2030 only a limited quantity of hydrogen will flow through gas grids, often blended with natural gas. Hydrogen will initially mainly be used in industrial clusters that already use hydrogen today. Around 2030, the scale-up of green and blue hydrogen and its increased consumption in industrial sites outside industrial clusters will require the creation of dedicated regional or national hydrogen infrastructures. During the 2030s, the regional and national backbones are connected to create a European hydrogen backbone infrastructure. This hydrogen infrastructure will mainly be based on retrofitting existing natural gas transmission pipelines to dedicated hydrogen pipelines. For this reason, decommissioning of natural gas transmission pipelines should be avoided. Dedicated hydrogen storage facilities will be developed.
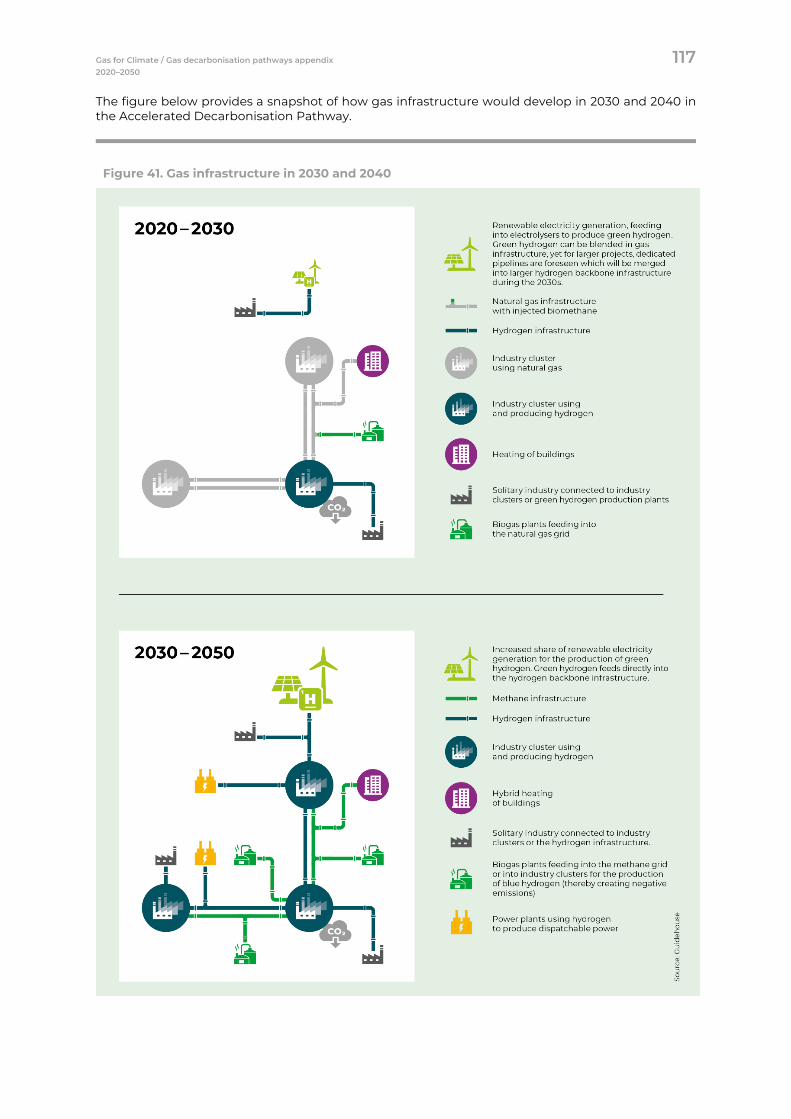
Gas for Climate / Gas decarbonisation pathways appendix 117 2020–2050
The figure below provides a snapshot of how gas infrastructure would develop in 2030 and 2040 in the Accelerated Decarbonisation Pathway.
Figure 41. Gas infrastructure in 2030 and 2040
Gas for Climate / Gas decarbonisation pathways appendix 118 2020–2050
The rest of this section will detail the Accelerated Decarbonisation Pathway, describing first the situation today, followed by developments in each of the three decades up to 2050.
7.4.1 EU Green Deal for infrastructure
One of the policy areas for the EU Green Deal is clean energy, which covers both the transition of the energy sector and energy infrastructure aspects. For infrastructure specifically, the Green Deal aims to promote cross-border and regional cooperation to achieve benefits of the clean energy transition at affordable prices. It aims to review the existing regulatory framework for energy infrastructure, including the TEN-E Regulation to ensure consistency with the climate neutrality objective. And it aims to facilitate development of new infrastructures, including hydrogen networks or CCS and CCU, and energy storage, as well as enabling sector integration.261 It is unclear what the scope and direction of these policy reviews will be.
In the Accelerated Decarbonisation Pathway, we assume that infrastructure developments will follow demand and supply as resulting from implementation of the EU Green Deal. Based on the pathway we will indicate what policy action can be taken to support timely and cost-efficient developments in the gas grids.
7.4.1.1 Gas infrastructure developments from 2020–2030
Gas infrastructure used predominantly to transport and store natural gas
During the coming decade, Europe’s gas infrastructure will continue to help transport and store natural gas. For most of Europe, existing gas infrastructure is fit for its purpose and no grid expansion is required. The exception is in Central and Eastern Europe, where a coal phaseout driven by increased EU ETS prices is expected to result in an increase of renewable electricity and in gas-fired power plants to provide flexible capacity. This shift may require extensions to gas grids in those countries, especially since gas infrastructure in Central and Eastern Europe typically has a lower granularity compared to Western Europe. Increased injection of biomethane to gas grids
The production of biomethane in the Accelerated Decarbonisation Pathway increases gradually to a quantity of about 370 TWh (or about 35 bcm) by 2030. Most of this by far will be produced via anaerobic digestion, which takes place in relatively small installations often dispersed throughout rural locations. Biomethane can be blended with natural gas without requiring any gas grid modifications. In many cases, grid injection will take place in low or medium pressure distribution grids, simply because biomethane plants will want to inject into the nearest possible gas pipeline, which will often be distribution grids. If relatively large biomethane plants feed into small gas distribution pipes in areas with little local gas demand, there will be a need to ensure that biomethane can flow upwards towards medium or even high-pressure grids using reverse-flow technology. This is a marked change compared to current flows, which are always from high to medium to low pressure grids. Reverse flow is in the process of being implemented today262 and requires limited investments. Biomethane grid connection costs can be significant when small biomethane plants are connected to grids. It would be cost-optimal to build larger biomethane plants as close as possible to gas grids.
As described in text box 4, most biomethane production can be expected to be injected into gas grids. The larger the size of biomethane plants, the greater the share of the total biomethane potential that could be injected to gas grids. However, a share of remote biogas digesters located far from gas grids is unlikely to produce biomethane that can be injected into gas grids. Alternative solutions need to be developed, such as biomethane transport as bio-CNG or bio-LNG via truck to local fuel stations.
261 European Commission, The EU Green Deal, https://ec.europa.eu/info/sites/info/files/european-green-deal-
communication_en.pdf, 2019 262 For example, the ONTRAS gas network in Germany already has six reverse-flow facilities installed. See:
https://www.ontras.com/en/company/ontras-going-green/our-projects/. Also, GRTgaz operates several reverse-flow facilities such as Pouzauges and Noyal-Pontivy
Gas for Climate / Gas decarbonisation pathways appendix 119 2020–2050
In addition to digestion-based biomethane, several large 200 MW biomass-to-biomethane gasification plants can be expected to be built at port locations or in forested regions close to existing gas grids. These plants deliver biomethane at a pressure of 40 bar, meaning it can easily be injected in medium or high-pressure gas grids.
Existing gas distribution networks used to supply biomethane to existing buildings.
Gas infrastructure will continue to be used to distribute gas to heat buildings. Gradually, due to increased building insulation, gas demand for buildings will decrease. In parallel, natural gas will be gradually replaced by biomethane. Also, gradually gas boilers could be replaced by hybrid heat pumps, as described in section 3.3 above. Navigant expects that by 2050 each EU member states can produce sufficient biomethane to meet demand in existing buildings with existing gas grid connections. This means that distribution grids in 2050 will be used for biomethane, and regional transport pipes are required to transport biomethane supply in the agricultural regions to the cities.
Blue hydrogen in industrial clusters use existing H2 networks and new CO2 pipelines.
In the coming decade, the existing production of grey hydrogen will turn blue by adding carbon capture to existing hydrogen production assets, transporting captured CO2 to storage locations. Existing grey hydrogen is produced and consumed mostly in large industrial clusters in north western Europe where the majority of hydrogen is consumed today. These clusters are well-connected to existing gas grids. Hydrogen production either takes place onsite (e.g. at refineries) or production and industrial consumption is connected through dedicated, privately operated hydrogen networks. These pipelines have a limited capacity yet can be used to transport blue hydrogen within industrial clusters up to 2030, with natural gas being delivered via the existing gas grids like today. Large industrial hydrogen projects will require a solution to transport CO2 to storage locations. In cases where industrial clusters are located close to empty gas fields below seabeds, e.g. below the North Sea, it makes sense to construct new, dedicated CO2 pipes. A possibly costlier alternative could be to transport CO2 per ship to storage locations.
Industrial clusters close to below seabed CO2 storage locations are favourable options for future additional blue hydrogen capacity. This could result in hydrogen hubs that could feed a future hydrogen backbone infrastructure to supply hydrogen to other clusters, power plants, and truck transport.
Green hydrogen supplied to local customers could require regional hydrogen pipelines
Green hydrogen developments will initially be clustered to specific regions because of low cost production (mainly solar power in south of EU and offshore wind at the North Sea).
Up to 2030, the initial large-scale green hydrogen projects are likely to produce quantities that can be absorbed as feedstock and as sources of heat in local industries and as a road fuel in transport. In cases where quantities of green hydrogen are small, it may make sense to blend hydrogen with natural gas (see below for a more detailed description of blending). In cases where larger quantities of green hydrogen are produced, local or regional dedicated hydrogen pipelines may be needed to get green hydrogen to customers. Such singular dedicated hydrogen pipelines would also be required to supply hydrogen to standalone industrial steel or chemical plants with a substantial natural investment cycle. Ideally, these pipelines would be based on existing gas pipelines, especially in cases where parallel gas pipelines exist. As described in the Gas for Climate 2019 study, provided current pressure levels are not significantly increased, carbon steel pipelines could carry hydrogen without suffering from hydrogen embrittlement or hydrogen stress cracking. The conversion of existing gas pipelines to enable hydrogen transport is inexpensive.
Around 2030, it is expected that a larger scale-up of green hydrogen will require the gradual construction of a European Hydrogen Backbone infrastructure, primarily based on existing gas infrastructure.
Gas for Climate / Gas decarbonisation pathways appendix 120 2020–2050
Hydrogen blending in gas grids mainly a solution for initial green hydrogen production
Blending hydrogen in the existing gas grid is often considered as a way to quickly scale-up hydrogen supply, while limiting the need for hydrogen pipeline and end-user investments. Studies report blending percentages of between 5% and 20% to be technically feasible in current grids with minimal investments.263 Blending can also connect biomethane production sites with small percentages of hydrogen to the grid, e.g. pyro gasification units. However, the actual feasibility of blending depends on the hydrogen tolerance at end-uses, including the ability to deal with varying blends. Moving to higher blending percentages, changes need to be made to the infrastructure and typically also to the end-user equipment (e.g. different burners).
The expected scale-up of blue hydrogen production at industrial clusters to replace replaces existing grey does not involve blending but does dedicated point-to-point hydrogen transport and dedicated CO2-transport. Blending part of the blue hydrogen produced at industrial clusters could be considered when supply is greater than demand. Green hydrogen would up to 2030 mainly be used locally and regionally and blending hydrogen in gas distribution grids may be an effective temporary solution during the 2020s. The creation of a hydrogen Guarantee of Origin system would ensure that the value of blended green hydrogen blending could be marketed.
Storing hydrogen
Storing hydrogen in (partially) empty gas fields needs further investigation; amongst other issues to be studied, it could result in an unpredictable blend of methane and hydrogen. Salt caverns or containers are technically suitable for storage. To contain the same amount of stored energy, the pressure needs to be higher, which will not always be possible.
7.4.2 Gas infrastructure developments from 2030 to 2050
National hydrogen infrastructures emerge, joined into a European Hydrogen Backbone
Around 2030, hydrogen demand will have accelerated, and an increasing number of industrial clusters will use more and more quantities of hydrogen. This will initially occur in industrial clusters in north western Europe, and then will move to other parts of the continent as well. Green hydrogen supply will start to ramp-up fast. This leads to a need to connect industrial clusters with large new green hydrogen production locations close to large offshore wind power production and at large solar PV production locations. Also, gradually more standalone industrial sites will move to hydrogen in line with their natural investment cycle. This means that around or shortly after 2030 regional or national hydrogen backbone infrastructures start to emerge. The planning of these infrastructures should start in the early 2020s. Around 2035 these national backbones will increasingly be connected into a European Hydrogen Backbone, which would be completed by around 2040. Also, larger dedicated hydrogen storage facilities in salt caverns will start to be created around 2030.
Initial research shows that long-distance networks could be repurposed to create regional “backbones for a hydrogen transmission system”264 265 and that natural gas distribution grids can be repurposed to distribute hydrogen; however, the costs and effort will be regionally dependent.266, 267
263 GRTgaz et al. Technical and economic conditions for injecting hydrogen into natural gas networks,
http://www.grtgaz.com/fileadmin/plaquettes/en/2019/Technical-economic-conditions-for-injecting-hydrogen-into-natural-gas-networks-report2019.pdf, 2019 & Melaina, Antonio and Penev, Blending Hydrogen into Natural Gas Pipeline Networks: A Review of Key Issues, https://www.nrel.gov/docs/fy13osti/51995.pdf, 2013.
264 See e.g. Gasunie / TenneT, “Phase II - Pathways to 2050, A joint follow-up study by Gasunie and TenneT of the Infrastructure Outlook 2050”, https://www.gasunie.nl/nieuws/gasunie-en-tennet-klimaatdoelstellingen-alleen-haalbaar-met-een-geintegreerd-europees-energiesysteem/$4382/$4383
265 Gasunie (2018): Hydrogen Coalition: concrete plans for a flying start of the hydrogen economy, https://www.gasunie.nl/nieuws/waterstof-coalitie-concrete-plannen-voor-een-vliegende-start-van.
266 Northern Gas Networks (2016). H21 Report, https://www.northerngasnetworks.co.uk/wp-content/uploads/2017/04/H21-Report-Interactive-PDF-July-2016.compressed.pdf.
267 The total costs to make the Dutch distribution networks usable for hydrogen were estimated at 700 million €, resulting in network cost increase per individual household of 10%-50%. Source: (In Dutch) Kiwa (2018). Toekomstbestendige gasdistributienetten, https://www.netbeheernederland.nl/_upload/RadFiles/New/Documents/Kiwa%20-Toekomstbestendige%20gasdistributienetten%20-%20GT170272%20-%202018-07-05%20-D.._.pdf.
Gas for Climate / Gas decarbonisation pathways appendix 121 2020–2050
The steps required to convert an existing distribution grid to hydrogen are well described in the proposal for the City of Leeds in the H21 report.268
By 2050, just over 1,700 TWh would flow through the hydrogen grid. The transport of this quantity of hydrogen requires more pipeline capacity per unit of energy compared to natural gas because hydrogen has about three times more volume than methane. On the other hand, hydrogen flows much faster through gas grids. The net effect of both elements is that hydrogen requires about 20% more capacity per unit of energy compared to natural gas. For example, 160 bcm of hydrogen requires gas pipelines that can transport just over 190 bcm of natural gas equivalent.
To repurpose part of the EU gas grid towards hydrogen, regulatory frameworks should be adjusted to consider hydrogen-ready components when TSOs extend the existing grid or apply for re-investment projects. A general political recognition of the existing gas infrastructure to efficiently decarbonise a part of the European economy is advisable.
Most biomethane flows through distribution and transmission grids
All new biomethane gasification plants are connected to gas grids. All new digestion-based biomethane plants will initially be connected to gas grids as well. Once most of the locations close to gas grids are occupied, locations further away will need to have a much larger size to still be able to be connected. It may still be possible to cost-effectively connect large digesters and biomethane plants that produce up to 3,000 m3/hr to gas grids even if they are located more than 10 km away from gas grids. This means that the extent to which the full EU biomethane potential can be produced and injected into gas grids can depend on whether the biomethane sector manages to increase the overall size of biomethane plants, especially in countries where the gas grid is less dense, such as Denmark. It is also worthwhile to explore whether biomethane pipeline costs could be decreased. The text box that follows explores the quantity of EU-produced biomethane that could be transported through gas grids. Determining this precisely would require a detailed analysis of how the dispersed EU biomethane (feedstock) potential compares to the topology of gas grids in most relevant EU member states. In our Accelerated Decarbonisation Pathway, we assume that 75 bcm biomethane plus an additional 14 bcm of power to methane could be injected into gas grids by 2050.
Box 4. How much of the EU biomethane potential could make its way to Europe’s gas grids?
The Gas for Climate 2019 study estimates that by 2050 the EU could produce 95 bcm of biomethane. Up to 30,000 digesters can produce 62 bcm through anaerobic digestion from waste. The agricultural biomass needed for this process is available dispersedly over the about 4.4 million km of the EU land area. How much of this production potential could finds its way to Europe’s gas grids?
Answering this question requires a country-specific comparison of the geographically explicit biogas potentials with the topology of national gas grids. This level of analysis was not part of the scope of this study. However, a high level analysis already provides an indication on the large potential of using Europe’s gas grids for the transportation of biomethane.
268 The H21 report assumes upfront conversion of the distribution network to a hydrogen-ready grid in course of a
modernization program that is due to be undertaken anyhow. See Northern Gas Networks (2016). H21 Report, https://www.northerngasnetworks.co.uk/wp-content/uploads/2017/04/H21-Report-Interactive-PDF-July-2016.compressed.pdf.
Gas for Climate / Gas decarbonisation pathways appendix 122 2020–2050
Simplifying the situation
Imagine that the part of the European gas grid that goes through rural areas would run through Europe as one long pipeline. This pipeline consists of the 260,000 km of TSO operated pipelines minus parallel pipelines, plus the share of the 1.4 million km DSO operated grids that runs through rural areas. We assume that 160,000 km out of 260,000 km of the TSO grid consists of parallel pipelines, meaning that there’s a total stretch of 100,000 km plus 80,000 km = 180,000 km of TSO pipelines. We also assume that 10% of the DSO grid runs through rural areas where biogas digesters could be connected to it, or 140,000 km. This means that in total a gas pipeline of 180,000 km plus 140,000 km = 320,000 km runs through non-urban areas.
Biomethane plants can be connected to gas grids using small pipes of up to 10 km
The Gas for Climate 2019 conclusion was based on biomethane costs that include 10 km of pipeline to connect biomethane plants to grids. Biomethane plants at the end of the pipe could still source biomass from at least 5 km further away. In our simplified situation, that means that there could be biomethane plants connected from 10 km at either side of the pipe at every part of the 460,000 km long pipeline, sourcing biomass from a distance of 15 km away from the pipeline. The total land area from which the pipeline could source biomethane is 320,000 x 30 = 9.6 million km. The total area in which the gas pipeline could source biomethane is twice as large as the total EU land area, meaning that (in theory) all the EU biomethane potential could be easily connected to gas grids.
The reality is more complex, feasible that 75 bcm could be injected
However, the gas grid is not equally dense in all EU member states. The future European Hydrogen Backbone will not consist of parallel TSO pipelines alone but also of converted singular natural gas pipelines, where in the future no biomethane can be connected. On the other hand, biogas digesters could potentially dramatically increase in size, similar to the installations being built in Denmark today that have a biomass sourcing circle of 25 km. Given the large uncertainties, a more conservative approach is fitting and Navigant assumes that one-third of the EU’s digestion-based biogas will not be upgraded to biomethane and injected into gas grids. This means that out of the 62 bcm of digestion-based biomethane, 20 bcm will be used locally in CHPs or liquefied to bio-LNG on-farm, whereas 42 bcm makes it to gas grids. In addition, all the 33 bcm of gasification-based biomethane is injected into gas grids. This means that by 2050, a total of 75 bcm of EU-produced biomethane could be injected into gas grids. In addition, 15 bcm of power-to-methane is expected to be produced at locations with gas grid connections, bringing the total of grid-connected renewable methane to 90 bcm or about 950 TWh. Biomethane imports from e.g. Belarus or Ukraine could potentially increase this further.
Gradual phaseout of natural gas means gas grid is split between hydrogen and methane
Substantial quantities of natural gas will remain to be transported through Europe’s gas grids, but after 2030 the role for natural gas dwindles rapidly. Industrial consumers and the buildings sector will significantly reduce their natural gas consumption. This means that gas transmission capacity will become increasingly available while gas distribution grids will largely continue to carry gas to existing buildings, initially natural gas but increasingly biomethane to hybrid heating systems. The increase in biomethane and hydrogen does not make up for the reduced natural gas consumption, even though the transport of a unit of hydrogen required more pipeline capacity compared to natural gas. Beyond 2030, a substantial capacity of gas is required to provide dispatchable power. With coal being phased out and the share of wind power and solar PV increasing, gas-fired power plants will run relatively limited hours, yet their peak gas demand is significant.
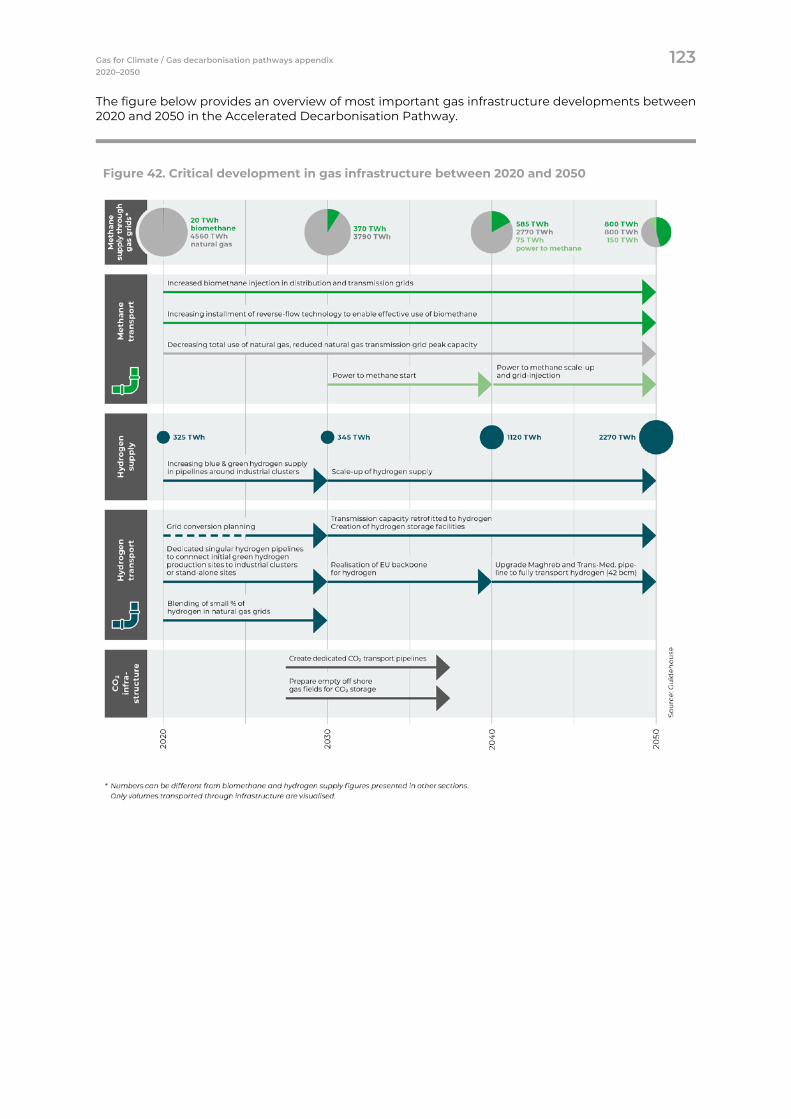
Gas for Climate / Gas decarbonisation pathways appendix 123 2020–2050
The figure below provides an overview of most important gas infrastructure developments between 2020 and 2050 in the Accelerated Decarbonisation Pathway.
Figure 42. Critical development in gas infrastructure between 2020 and 2050
Gas for Climate / Gas decarbonisation pathways appendix 124 2020–2050
Global Climate Action Pathway – gas infrastructure
Conclusion Global Climate Action
Global climate efforts will speed up the transition to biomethane and hydrogen use. Total gas demand will reduce faster than in the Accelerated Decarbonisation Pathway, while supply and demand for biomethane and hydrogen will grow faster.
Around 2030, the hydrogen supply will surpass regional demands and require development of an EU backbone to connect supply to demand further away.
As a result of global developments, large-scale imports of hydrogen and synthetic chemicals and fuels will reduce the capacity required for the transmission grid, compared to the Accelerated Decarbonisation Pathway. However, regional differences will lead to deviating grid requirements.
Global effort to decrease CO2 emissions will have a strong impact on the cost for green hydrogen and biomethane, through economies of scale that can be realised along the supply chains. The impact of these cost reductions on infrastructure is an increased transition speed compared to the Accelerated Decarbonisation Pathway: the use of natural gas will reduce faster, the share of biomethane in the gas mix will be larger and the demand and production of hydrogen will experience a large scale-up already before 2030.
The supply of green and blue hydrogen around or just after 2030 will be more than can be absorbed by the initial industrial hydrogen clusters. Dedicated hydrogen infrastructure, a hydrogen backbone, will need to be developed around 2030 to facilitate transmission to other demand in the EU.
As a result of global developments, areas around the world with low cost renewable power will have hydrogen available for export to the EU. This is specifically relevant for the import of synthetic chemicals and fuels, such as synthetic kerosene. Large-scale imports of synthetic fuels and chemicals could reduce the hydrogen demand in the EU by over and the required pipeline capacity for hydrogen transmission. The impact on the EU network topology will however greatly depend on regional differences in demand and supply as in the Accelerated Decarbonisation Pathway.
Hydrogen – methane blending Blending hydrogen to the existing gas grid is a way to quickly scale-up hydrogen supply, while limiting the need for hydrogen pipeline and end-user investments. Especially in situations where hydrogen is produced in volumes that exceed the demand for hydrogen, this can be a cost-effective solution. Studies report blending percentages of up to between 5% and 20% to be technically feasible in current grids with minimal investments.269 Blending can also be a solution to connect biomethane production sites with small percentages of hydrogen to the grid, e.g. pyrogasification units. Moving to higher blending percentages, changes need to be made to the infrastructure and typically also to the end-user equipment (e.g. different burners).
269 GRTgaz et al. Technical and economic conditions for injecting hydrogen into natural gas networks,
http://www.grtgaz.com/fileadmin/plaquettes/en/2019/Technical-economic-conditions-for-injecting-hydrogen-into-natural-gas-networks-report2019.pdf, 2019 & Melaina, Antonio and Penev, Blending Hydrogen into Natural Gas Pipeline Networks: A Review of Key Issues, https://www.nrel.gov/docs/fy13osti/51995.pdf, 2013.
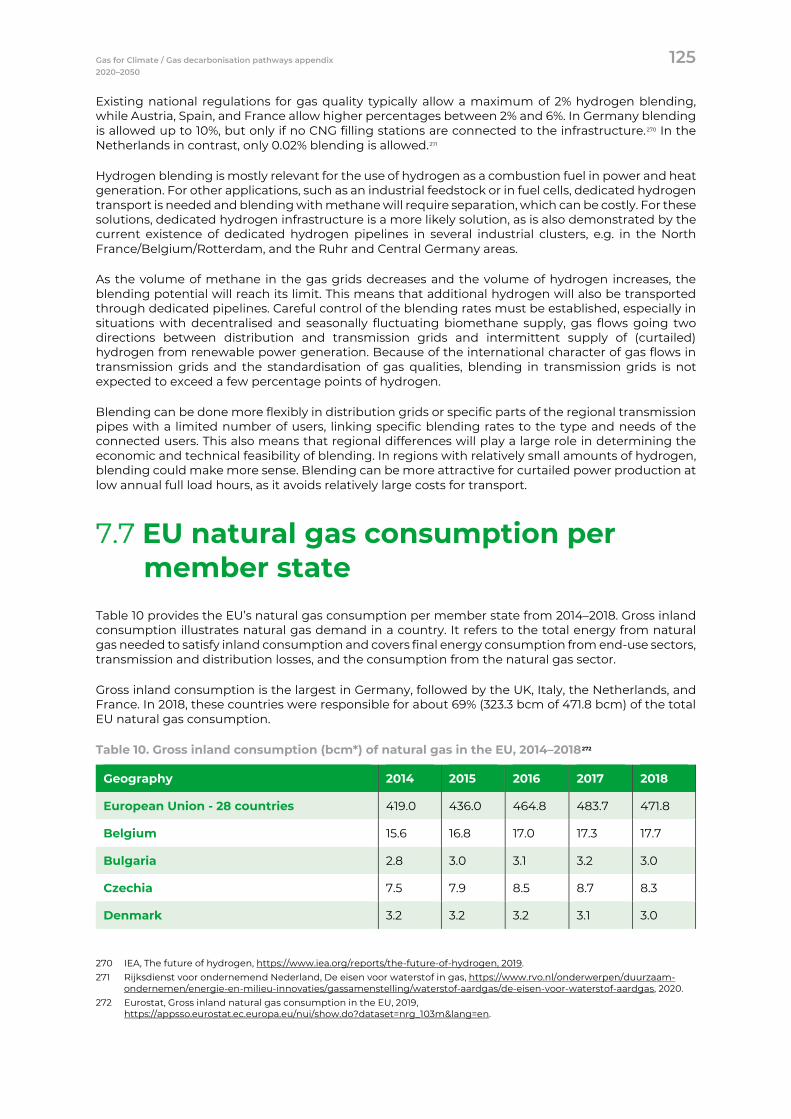
Gas for Climate / Gas decarbonisation pathways appendix 125 2020–2050
Existing national regulations for gas quality typically allow a maximum of 2% hydrogen blending, while Austria, Spain, and France allow higher percentages between 2% and 6%. In Germany blending is allowed up to 10%, but only if no CNG filling stations are connected to the infrastructure.270 In the Netherlands in contrast, only 0.02% blending is allowed.271
Hydrogen blending is mostly relevant for the use of hydrogen as a combustion fuel in power and heat generation. For other applications, such as an industrial feedstock or in fuel cells, dedicated hydrogen transport is needed and blending with methane will require separation, which can be costly. For these solutions, dedicated hydrogen infrastructure is a more likely solution, as is also demonstrated by the current existence of dedicated hydrogen pipelines in several industrial clusters, e.g. in the North France/Belgium/Rotterdam, and the Ruhr and Central Germany areas.
As the volume of methane in the gas grids decreases and the volume of hydrogen increases, the blending potential will reach its limit. This means that additional hydrogen will also be transported through dedicated pipelines. Careful control of the blending rates must be established, especially in situations with decentralised and seasonally fluctuating biomethane supply, gas flows going two directions between distribution and transmission grids and intermittent supply of (curtailed) hydrogen from renewable power generation. Because of the international character of gas flows in transmission grids and the standardisation of gas qualities, blending in transmission grids is not expected to exceed a few percentage points of hydrogen.
Blending can be done more flexibly in distribution grids or specific parts of the regional transmission pipes with a limited number of users, linking specific blending rates to the type and needs of the connected users. This also means that regional differences will play a large role in determining the economic and technical feasibility of blending. In regions with relatively small amounts of hydrogen, blending could make more sense. Blending can be more attractive for curtailed power production at low annual full load hours, as it avoids relatively large costs for transport.
EU natural gas consumption per member state
Table 10 provides the EU’s natural gas consumption per member state from 2014–2018. Gross inland consumption illustrates natural gas demand in a country. It refers to the total energy from natural gas needed to satisfy inland consumption and covers final energy consumption from end-use sectors, transmission and distribution losses, and the consumption from the natural gas sector.
Gross inland consumption is the largest in Germany, followed by the UK, Italy, the Netherlands, and France. In 2018, these countries were responsible for about 69% (323.3 bcm of 471.8 bcm) of the total EU natural gas consumption.
Table 10. Gross inland consumption (bcm*) of natural gas in the EU, 2014–2018272
Geography 2014 2015 2016 2017 2018
European Union - 28 countries 419.0 436.0 464.8 483.7 471.8
Belgium 15.6 16.8 17.0 17.3 17.7
Bulgaria 2.8 3.0 3.1 3.2 3.0
Czechia 7.5 7.9 8.5 8.7 8.3
Denmark 3.2 3.2 3.2 3.1 3.0
270 IEA, The future of hydrogen, https://www.iea.org/reports/the-future-of-hydrogen, 2019. 271 Rijksdienst voor ondernemend Nederland, De eisen voor waterstof in gas, https://www.rvo.nl/onderwerpen/duurzaam-
ondernemen/energie-en-milieu-innovaties/gassamenstelling/waterstof-aardgas/de-eisen-voor-waterstof-aardgas, 2020. 272 Eurostat, Gross inland natural gas consumption in the EU, 2019,
https://appsso.eurostat.ec.europa.eu/nui/show.do?dataset=nrg_103m&lang=en.
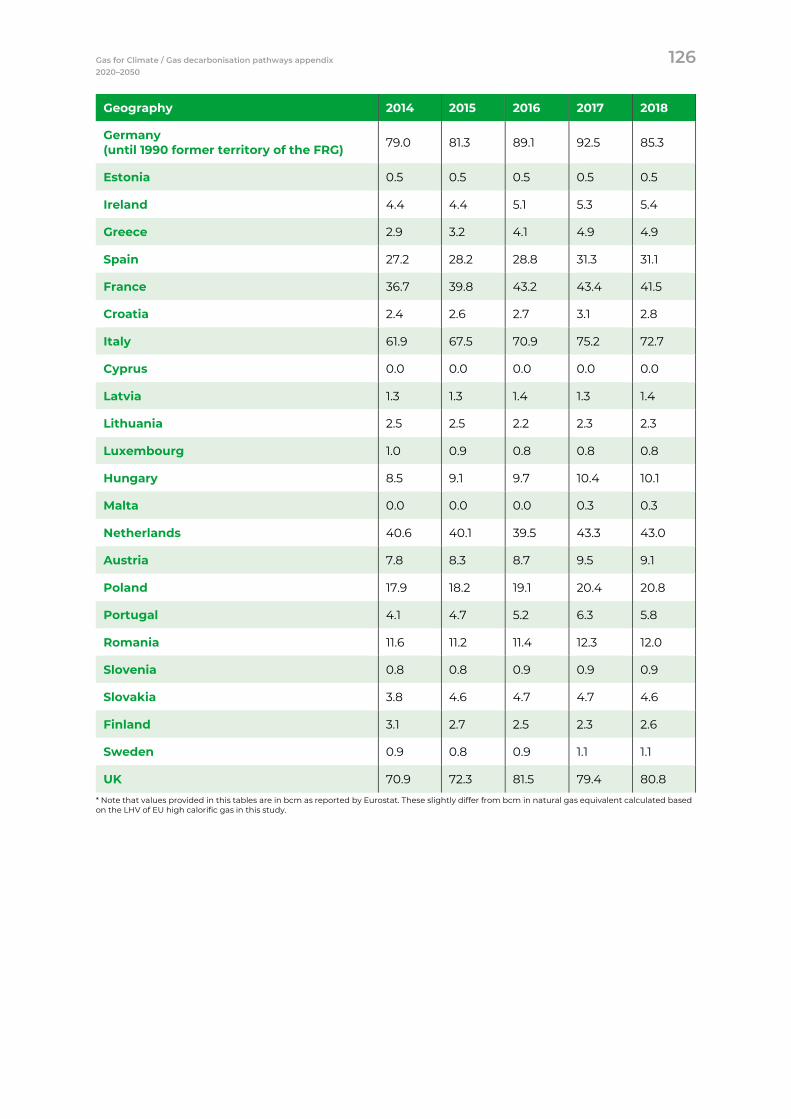
Gas for Climate / Gas decarbonisation pathways appendix 126 2020–2050
Geography 2014 2015 2016 2017 2018
Germany (until 1990 former territory of the FRG) 79.0 81.3 89.1 92.5 85.3
Estonia 0.5 0.5 0.5 0.5 0.5
Ireland 4.4 4.4 5.1 5.3 5.4
Greece 2.9 3.2 4.1 4.9 4.9
Spain 27.2 28.2 28.8 31.3 31.1
France 36.7 39.8 43.2 43.4 41.5
Croatia 2.4 2.6 2.7 3.1 2.8
Italy 61.9 67.5 70.9 75.2 72.7
Cyprus 0.0 0.0 0.0 0.0 0.0
Latvia 1.3 1.3 1.4 1.3 1.4
Lithuania 2.5 2.5 2.2 2.3 2.3
Luxembourg 1.0 0.9 0.8 0.8 0.8
Hungary 8.5 9.1 9.7 10.4 10.1
Malta 0.0 0.0 0.0 0.3 0.3
Netherlands 40.6 40.1 39.5 43.3 43.0
Austria 7.8 8.3 8.7 9.5 9.1
Poland 17.9 18.2 19.1 20.4 20.8
Portugal 4.1 4.7 5.2 6.3 5.8
Romania 11.6 11.2 11.4 12.3 12.0
Slovenia 0.8 0.8 0.9 0.9 0.9
Slovakia 3.8 4.6 4.7 4.7 4.6
Finland 3.1 2.7 2.5 2.3 2.6
Sweden 0.9 0.8 0.9 1.1 1.1
UK 70.9 72.3 81.5 79.4 80.8
* Note that values provided in this tables are in bcm as reported by Eurostat. These slightly differ from bcm in natural gas equivalent calculated based on the LHV of EU high calorific gas in this study.