Embed Size (px)
Citation preview

9
Gas Chromatography in Forensic Chemistry: Cannabinoids Content in Marijuana
Leaves (Cannabis sativa L.) from Colombia
N.M. Florian-Ramírez1, W.F. Garzón-Méndez2 and F. Parada-Alfonso3 1Scientific Lab, Criminalistic Group,
Departamento Administrativo de Seguridad-DAS, Bogotá, 2Criminalistic Chemistry Lab, Fiscalía General de la Nación, Bogotá,
3Chemistry Department, Science Faculty-Universidad Nacional de Colombia, Bogotá, Colombia
1. Introduction
Despite that the narcotics had generated a regrettable stigma for Colombia, our country does not have a deep knowledge about the narcotic chemistry. In this study it is show the analysis of cannabinoids in the Colombian illicit crops of Cannabis sativa L. using Gas Chromatography (GC), Figure 1. The main important cannabinoids from C. sativa were identified by Gas Chromatography-Mass Spectrometry (GC-MS). The conditions for extraction and quantification of these cannabinoids (cannabidiol (CBD), Δ9-tetrahydrocannabinol (THC) and cannabinol (CBN)) from C. sativa leaves were optimized by the response surface analysis-RSA, using as variables the extraction time and the extraction numbers. Then, the better sample amount and the best detection method were determined, after the validation of the GC analytic method was made. Additionally, the cannabinoids of samples of different Colombian geographic regions were analyzed, determining that the THC content vs THC/CBN content can serve as a discriminating factor to distinguish the geographic origin of the samples studied. Finally, it was showed that the GC is a good analytic tool for forensic chemistry in Colombia.
The study of extraction process was carried out using RSA, the best response and the less variability for the cannabinoids was obtained with three extraction steps, each one of 7.5 minutes with ethanol as solvent. The quantitative analysis was made by Gas Chromatography-Flame Ionization Detector (GC-FID) with diphenhydramine (DPH) as surrogate standard. In the GC method for quantification of CBD, THC and CBN were assessed their chromatographic parameters; selectivity, linearity, precision, accuracy, Limit of Detection (LOD) and Limit of Quantification (LOQ).
The cannabinoids samples from four different Colombian regions (North region (NR), at Magdalena department, South region (SR) at Cauca department, East region (ER) at Meta department and Central region (CR), at Caldas department) were determined. The content average THC in samples of the NR was 2.81% ± 1.72, in the SR was 10.98% ± 6.70, in the ER was 15.74% ± 2.92 and at the CR was 1.87% ± 1.25. The higher content of THC at cannabis
www.intechopen.com

Gas Chromatography – Biochemicals, Narcotics and Essential Oils 196
plants of the ER and SR could be indicative of the use of improved varieties, which creates a major concern in potential effects around of the health of drug consumers.
Fig. 1. Cannabis leave sample and a sample gas chromatogram of its extract.
It was established that the value of the Waller phenotype (Turner et al., 1979, 1980), equation 1, did not serve as a differentiation criterion on the geographical origin of the Colombian samples, due to overlapping ranges for three of the regions studied (NR, SR and ER). In order to establish a criterion to discriminate the geographic origin of the Colombian marijuana, different types of correlation among the CBD, THC and CBN were tested, finding that for the four groups of studied samples the ratio THC vs THC/CBN could be used.
Waller phenotype = (THC + CBN) / CBD (1)
2. Forensic chemistry of cannabinoids
GC analysis is a primary analytical technique. It is used in every forensic lab. GC is widely used by forensic scientists, from analysis of body fluids for the presence of illegal substances, for testing of fiber and blood from a crime scene, and to detect residue from explosives (Müller et al., 1999). In the next parts of the chapter cannabinoids works would be reference as well as some aspects of Colombian cannabis.
2.1 Cannabinoids analysis by chromatography techniques
Regarding on the cannabinoids analysis by chromatographic methods, it is worth to mention the following works:
Davis & Farmilo performed an analysis of cannabinoids in leaves and flowering of cannabis by thin layer chromatography and GC. From this analysis it was proposed that the relationship of the THC and CBN content based on the CBD content allowed cannabis differentiation of samples by geographical origin (1963).
www.intechopen.com

Gas Chromatography in Forensic Chemistry: Cannabinoids Content in Marijuana Leaves (Cannabis sativa L.) from Colombia 197
Hemphill et al. analyzed the cannabinoids content in different organs of cannabis plants selected from geographical regions by gas-liquid chromatography. The results showed quantitative variations in cannabinoid content in different parts of the plants belonging to the selected varieties. However, each part of the plant presented a profile of cannabinoids that characterized the phenotype of which it comes from chemical, in addition, the accumulation of a specific cannabinoid variety was not found and it was observed that factors such as degree of maturity of body, sex plant, the location of the organ in the plant and the sampling procedures influence the concentration of cannabinoids. Finally, cannabinoids were not detected in pollen grains and seeds (1980).
Gambaro et al. determined THC, CBD and CBN in cannabis preparations by GC-FID and High Performance Liquid Chromatography-Ultraviolet (HPLC-UV) (2002). De Meijer et al. studied the inheritance of chemical phenotype in cannabis varieties, for it they made four crosses between plants of C. sativa with CBDs and THCs pure chemotypes (2003).
Mechtler et al. analyzed the variation in the distribution of a population of THC in hemp, for it a number of plants from five well-known populations of hemp grown in regions of
Austria and Hungary were sampled (2004). ElSohly Slade reported the composition of the complex mixture of natural cannabinoids from cannabis (2005).
Pellegrini et al. developed a simple and rapid procedure for the determination of cannabinoids in hemp food products derived by GC-MS (2005). Lewis et al. determined the relative amounts of the three most abundant cannabinoids (THC, CBN and CBD) and other abundant compounds present in six compressed bars of cannabis resin by GC-MS analysis (2005).
A global scientific community has recently expressed concern over the detection in the illicit market in cannabis varieties with high content of THC. According to the National Coordination of Drug Policy, which is headquartered in Sweden, in 1961 the levels of THC, the more important psychoactive component, did not exceed 5%, today this number is above 20%.
Recently, De Backer et al. developed an High Performance Liquid Chromatography-Diode Array Detector (HPLC-DAD) method for the qualitative and quantitative determination of major cannabinoids in plant material of cannabis (2009). Then, the solubilities of some cannabinoids in supercritical carbon dioxide were determined (Perrotin-Brunel et al. 2010).
Milman et al. reported simultaneous quantification of cannabinoids in oral fluid by two dimensional GC-MS (2010). Tipparat et al. studied the cannabinoids composition of cannabis plants grown in Northern Thailand and its forensic application (2011).
2.2 Cannabis in Colombia
In Colombia, the introduction of marijuana in the Sierra Nevada de Santa Marta was conducted in the early seventeenth century, the use of hemp was quickly displaced by the twine. It is recognizes the uses as intoxicants of this plant since 1927, used by laborers and sailors from the Colombian Caribbean Coast. However, it was until 1945 went it was saw the first illegal cultivation of marijuana in this region.
With the completion of the Vietnam War in 1975, there was an increased cultivation of marijuana encouraged by the intoxicating veterans. Moreover marijuana was used until the
www.intechopen.com

Gas Chromatography – Biochemicals, Narcotics and Essential Oils 198
mid-twentieth century by the popular classes to relieve the pain associated with arthritis. It was common that the local police take a jar of alcohol and added seized marijuana to produce a medicinal poultice. Then the habit of smoking marijuana as a pain medication was spread, but this was a practice of alternative medicine without scientific studies and without institutional control (Fernandez-Alonso et al, 2007).
Currently the forensic study over confiscated samples of C. sativa L., is based on the
qualitative determination of THC, present in extracts obtained from plant samples, without
performing an quantitative level analysis of that component and some other cannabinoids
present in seized samples. As a result of the above at present there is no systematic
information to determine the content of THC present in plant samples of C. sativa illicitly
traded in Colombia, there is just an essential information for monitoring the potential levels
of THC present in plant samples who smoke marijuana consumers.
The Dirección Nacional de Estupefacientes (DNE) of Colombian government has reported
about the results achieved in Colombia in the fight against drug trafficking (2002, 2007).
Florian et al. reported higher content of THC in vegetable samples of Colombian cannabis
(2009).
This paper shows the GC as an important tool in the analysis of forensic samples,
specifically in the determination of cannabinoids. Leaf samples of C. sativa L. in four regions
of Colombia were analyzed by GC. The analyzed region were (i) Northern region (NR) at
Magdalena department, (ii) Southern region (SR) at Cauca department, (iii) Eastern region
(ER) at Meta department and (iv) Central region (CR) at Caldas department, see Figure 2.
The analysis revealed differences in the cannabinoid content of the samples under study
according to their origin region.
Fig. 2. Geographic origin of the C. sativa L. samples.
www.intechopen.com

Gas Chromatography in Forensic Chemistry: Cannabinoids Content in Marijuana Leaves (Cannabis sativa L.) from Colombia 199
3. Optimization of the cannabinoids analysis conditions
To optimize the analytic method cannabis leaves from NR were used. The first objective was
the optimization of the extraction method and the selection of the analysis method. Then,
the sample quantity and quantification method were defined. After, the analytic method
was validated.
3.1 Optimization of the extraction method and the selection of the analysis method
In order to obtain extracts of cannabinoids from plant material samples, De Meijer et al. method was taken as a based because of its quickness, efficiency and reproducibility, this method use extraction with ethylalcohol (EtOH), ultrasound and centrifugation at 4000 rpm (2003). The extraction time (t= 5, 10 and 15 min) and the number of extractions with EtOH (n= 1, 3 and 5) were considered as factors; for each extraction 750 μL were used and graduated to 5.00 mL. Using a 32 factorial model, cannabis leaves were subjected to each one of the extraction conditions, in triplicate, and at the central point (t= 10 min, n= 3) there were done five triplicates. The extracts obtained were analyzed by GC with different forms of detection: GC-FID, GC-MS scan mode and GC-MS Selected Ion Monitoring (SIM) mode. In all cases the response variable was the chromatographic area corresponding to each of the cannabinoids detected.
By comparing the coefficients of variation (C.V.) of the response surfaces for each analyte, based on the detection methods considered, we observed that the detection by GC-FID showed the lowest variation, see Table 1. Therefore, it was decided to use this method for quantitative analysis of cannabinoids, the GC-MS analysis was used for the qualitative identification of cannabinoids in the extracts.
Method CBD C.V. (%) THC C.V. (%)
GC-FID 9.36 7.89
GC-MS Scan 27.33 17.14
GC-MS SIM 15.51 11.58
Table 1. Coefficient of variation of the response surface for CBD and THC.
Based on the response obtained by GC-FID, the ANOVA for the quadratic regression model for each analyte, indicated that the difference was significant with a low probability value to a level of 0.05 (for the CBD pmodel = 0.0003 < α and the THC pmodel = 0.0105 < α). In that way, the models generated by the equations 2 and 3 explained satisfactorily the response in terms of the considered factors (time (t), number of extractions (n)), n being the most significant factor for the models.
Figure 3a shows the generated response surface to optimize the extraction conditions of THC, in it is observed that the response increased with the extraction time and the number of extractions. On the other hand, Figure 3b shows that the standard error associated with the analysis model, increased in the extreme values.
CBD area= 9050 + 169*t + 1944*n (2)
THC area= 31518 - 2200*t + 10177*n + 123*t2 - 1008*n2 - 35*t*n (3)
www.intechopen.com

Gas Chromatography – Biochemicals, Narcotics and Essential Oils 200
(a) Optimizing the extraction of THC, (b) Standard error associated with the THC RSA.
Fig. 3. Response surface analysis (RSA)
To maximize the response of each analyte with the lowest associated error, the model
suggested ten solutions, which found that the optimum conditions for extraction suggested
by the quadratic model based on response time (t) and the number of extractions (n) for the
analysis of CBD and THC by GC-FID were three extractions with ethanol for a period of 7.5
minutes, see Table 2. These conditions suggested by the model were experimentally verified
for ensuring that a fourth extraction does not provides betters detectable levels of CBD and
THC.
Solutions CBD THC
t n t n
1 7.53 2.83 6.42 4.16
2 6.21 1.71 7.48 3.01
3 13.45 1.76 9.25 2.99
4 9.83 1.99 12.68 2.18
5 12.29 3.52 14.94 1.93
6 10.05 3.46 8.03 4.41
7 5.50 2.90 5.60 1.91
8 12.83 3.24 7.26 4.27
9 11.11 1.08 8.43 3.26
10 5.55 1.71 9.38 1.03
Table 2. Solutions suggested by the model for the CBD and THC extractions.
3.2 Sample quantity and quantification method
Once the method of analysis, time and number of extractions were defined, we proceeded to
determine the mass of sample and the quantification method that would be used. For this
there was prepared by triplicate, two extract sets: i) internal standard and ii) surrogate
standard, using in each case 25.0, 50.0, 100.0 and 200.0 mg of vegetal material. For this series
www.intechopen.com

Gas Chromatography in Forensic Chemistry: Cannabinoids Content in Marijuana Leaves (Cannabis sativa L.) from Colombia 201
of experiments DPH at 100 ppm was used as internal and surrogate standards. In the
method of internal standard DPH was added to the extract obtained, while in the surrogate
standard method DPH was added to the vegetal sample.
The results were analyzed by ANOVA, evaluating for each of the quantifying methods the confidence interval and the response factor for each of the cannabinoids depending on the amount of sample, the results obtained for CBD and THC are presented in Figure 4.
The linear fit showed that there was a greater linearity in the results obtained by the method
of surrogate standard, Figures 4b and 4d (R2CBD = 0.9934; R2THC = 0.9941) compared against
the internal standard method, Figures 4a and 4c (R2CBD = 0.9843; R2THC = 0.8562). In addition,
the surrogate standard method for both CBD and THC showed less dispersion in the
response.
From this it could be concluded that the method of surrogate standard allows more accurate answers because it offers a lower confidence interval. Regarding the amount of sample to be extracted, it was found that using 100 mg of vegetal material minimized the error in the response for CBD and THC, as is evidenced in Figures 4b and 4d.
a) CBD internal standard method, b) CBD surrogate standard method, c) THC internal standard method, d) THC surrogate standard method.
Fig. 4. Linear fit for the chromatographic response depending on the quantity method of sample
www.intechopen.com

Gas Chromatography – Biochemicals, Narcotics and Essential Oils 202
Based on these arguments it was determined that the amount of sample to be used was of
100 mg and for quantification of cannabinoids by GC-FID was convenient to use the method
of surrogate standard.
3.3 Validation of analytic method
Regarding the validation of CBD, THC and CBN determination method by GC-FID: (i) it
was determined the repeatability of the retention times of the analytes and the standard, (ii)
there was calculated the chromatographic parameters (iii) the linearity was established for
each analyte, (iv) precision, (v) accuracy, (vi), Limit of Detection (LOD) and Limit of
Quantification (LOQ).
Retention times (tr) of DPH (compound used as surrogate standard) and the cannabinoids
CBD, THC and CBN, showed an excellent repeatability, the tr of these had C.V. less than
1%, see Table 3.
Compound Replicas of tr (min)
Avg SD C.V. (%) 1 2 3 4 5 6
DPH 2.04 2.02 2.04 2.05 2.03 2.04 2.04 0.010 0.507
CBD 3.93 3.91 3.90 3.95 3.91 3.93 3.92 0.018 0.468
THC 4.60 4.59 4.62 4.60 4.61 4.63 4.61 0.015 0.319
CBN 5.25 5.25 5.23 5.24 5.26 5.25 5.25 0.010 0.197
Table 3. Characterization of the retention time for DPH, CBD, THC and CBN injected into the mixture.
Table 4 shows the chromatographic parameters of the cannabinoids by GC-FID. The relative
tr (trr) were calculated regarding on the tr of THC.
The CBN has a response factor (RF) higher compared against the CBD and THC, compounds that exhibit relatively similar RF. Resolution (Rs) values obtained are higher than the acceptance criterion of 1.5, so the method can be considered as selective for the analytes considered. The CBN is the compound most congenial with the stationary phase and therefore it is more retained in this (K= 4.25) and the DPH has a lower retention (K= 1.04), being the compound with less affinity with the stationary phase. The highest number of theoretical plates (N) required for the separation correspond to CBN, followed in order by CBD, THC and DPH.
Compound tr Area RF Area/g Wb (s)
trr Rs K N
DPH 2.04 543.6 28810.0 0.112 0.44 14.06 1.54 1.04 5290.8
CBD 3.92 576.2 11019.0 0.156 0.85 3.89 2.60 2.92 10111.4
THC 4.61 347.1 12178.9 0.197 1.00 3.35 3.30 3.61 8755.4
CBN 5.25 897.8 29055.0 0.184 1.14 4.25 13009.2
Table 4. Validation of chromatographic parameters for DPH, CBD, THC y CBN.
To assess the linearity in the quantification of cannabinoids of interest, ten calibration curves in the linear range were prepared (approximately 15 to 300 ppm), each point on the line
www.intechopen.com
Gas Chromatography in Forensic Chemistry: Cannabinoids Content in Marijuana Leaves (Cannabis sativa L.) from Colombia 203
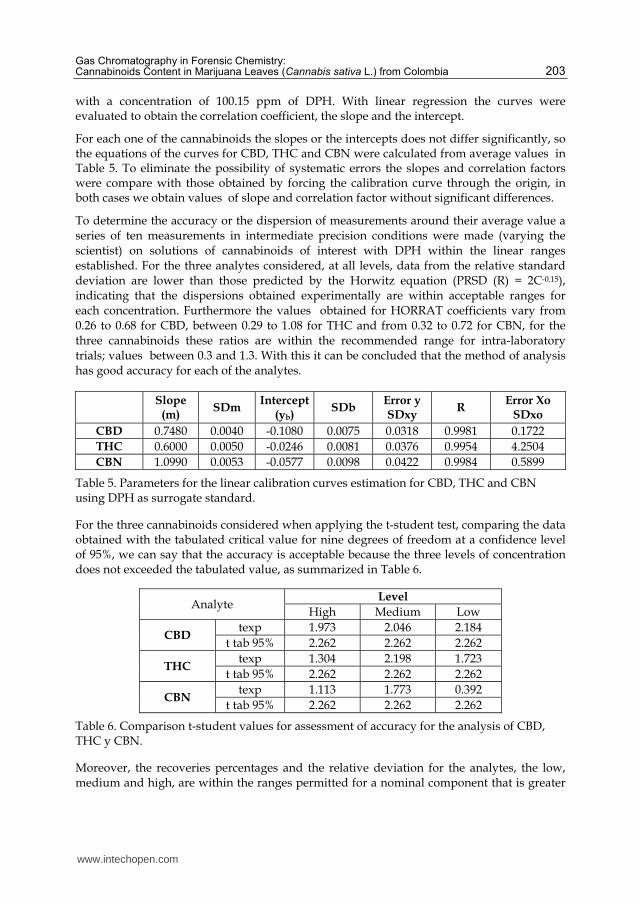
with a concentration of 100.15 ppm of DPH. With linear regression the curves were evaluated to obtain the correlation coefficient, the slope and the intercept.
For each one of the cannabinoids the slopes or the intercepts does not differ significantly, so the equations of the curves for CBD, THC and CBN were calculated from average values in Table 5. To eliminate the possibility of systematic errors the slopes and correlation factors were compare with those obtained by forcing the calibration curve through the origin, in both cases we obtain values of slope and correlation factor without significant differences.
To determine the accuracy or the dispersion of measurements around their average value a series of ten measurements in intermediate precision conditions were made (varying the scientist) on solutions of cannabinoids of interest with DPH within the linear ranges established. For the three analytes considered, at all levels, data from the relative standard deviation are lower than those predicted by the Horwitz equation (PRSD (R) = 2C-0.15), indicating that the dispersions obtained experimentally are within acceptable ranges for each concentration. Furthermore the values obtained for HORRAT coefficients vary from 0.26 to 0.68 for CBD, between 0.29 to 1.08 for THC and from 0.32 to 0.72 for CBN, for the three cannabinoids these ratios are within the recommended range for intra-laboratory trials; values between 0.3 and 1.3. With this it can be concluded that the method of analysis has good accuracy for each of the analytes.
Slope
(m) SDm
Intercept (yb)
SDb Error y SDxy
R Error Xo
SDxo
CBD 0.7480 0.0040 -0.1080 0.0075 0.0318 0.9981 0.1722
THC 0.6000 0.0050 -0.0246 0.0081 0.0376 0.9954 4.2504
CBN 1.0990 0.0053 -0.0577 0.0098 0.0422 0.9984 0.5899
Table 5. Parameters for the linear calibration curves estimation for CBD, THC and CBN using DPH as surrogate standard.
For the three cannabinoids considered when applying the t-student test, comparing the data obtained with the tabulated critical value for nine degrees of freedom at a confidence level of 95%, we can say that the accuracy is acceptable because the three levels of concentration does not exceeded the tabulated value, as summarized in Table 6.
Analyte Level
High Medium Low
CBD texp 1.973 2.046 2.184
t tab 95% 2.262 2.262 2.262
THC texp 1.304 2.198 1.723
t tab 95% 2.262 2.262 2.262
CBN texp 1.113 1.773 0.392
t tab 95% 2.262 2.262 2.262
Table 6. Comparison t-student values for assessment of accuracy for the analysis of CBD, THC y CBN.
Moreover, the recoveries percentages and the relative deviation for the analytes, the low, medium and high, are within the ranges permitted for a nominal component that is greater
www.intechopen.com

Gas Chromatography – Biochemicals, Narcotics and Essential Oils 204
than 10% in a recovery interval from 98 to 102%.These two tests allow us to conclude that the method has the accuracy required for low, medium and high ranges , for the analysis of these analytes, without evidence of systematic errors.
For each analyte, the linear range, the calibration curve, the LOD and the LOQ are presented
in Table 7. The detection limits have very similar values for the three cannabinoids,
however the lower sensitivity for the detection of THC is due because this compound has a
higher limit of quantification in relation to the CBD and CBN.
Regarding this part of the work we can conclude: (i) the optimal conditions for extraction suggested by the quadratic model based on response time (t) and the number of extractions (n) for the extraction of CBD and THC from a Cannabis plant sample; (ii) the method for quantification of CBD and THC, using DPH as a surrogate standard, showed an excellent repeatability (coefficient of variation for the retention time of all substances was less than 1%); (iii) in addition, linear behavior was observed for the quantification of CBD, THC and CBN using DPH as standard in the following ranges: CBD between 19.6 to 315.2 ppm, THC between 13.2 to 287.6 ppm and for CBN 16.4 to 313.7 ppm.
Parameter CBD THC CBN
Lineal Range ppm 19.6 – 315.2 13.2 – 287.6 16.4 – 313.7
Number of levels 7 7 7
Calibration curve y=0.7480x-0.1080 y=0.6000x-0.0246 y=1.0990x-0.0577
LOD (ng) 1.02 1.06 1.06
LOQ (ng) 1.68 2.44 1.76
Table 7. Detection and quantification limits for CBD, THC y CBN.
The results experimentally obtained allow to conclude that the analysis method for CBD,
THC and CBN had a very good accuracy and the required exactitude at different
concentration levels, with no systematic error evidence.
Otherwise, the detection limits using DPH as surrogate standard were of 1,02 ng for CBD,
1,06 ng for THC and 1,06 ng for CBN. The quantification limits were of 1,68 ng for CBD, 2,44
ng for THC y 1,76 ng for CBN.
4. Profile analysis of cannabinoids in samples collected in four areas of illicit cultivation of cannabis
In order to determine the profile of cannabinoids in samples from four different regions of
Colombia, were sampled four regions, in each region thirteen samples were taken, each was
analyzed by triplicate. The areas sampled were: (i) Northern region (NR), (ii) Southern
region (SR) , (iii) Eastern region (ER) and (iv) Central region (CR), see Figure 2.
In all samples of the four regions of the cannabinoid THC was the majority (NR 1.89-4.00%
average 2.81%, SR 6.72-15.48% avg 10.98%, ER 13.37-17.63% avg 15.74%, CR 1.11-3.17% avg
1.87%). In regions NR, SR and ER the minor cannabinoid was CBN (NR 0.04-0.06% avg
0.05%, SR 0.05-0.17% avg 0.11%, ER 0.56-0.80% 0.68% avg), with the CBD as the intermediate
(NR 0.29-2.40% avg 0.91%, SR 0.60-4.86% avg 2.52%, ER 0.92-4.14% 1.86% avg). Unlike the
three previous regions, in CR CBD was minority (0.01-0.06% avg 0.02%) and CBN was the
www.intechopen.com
Gas Chromatography in Forensic Chemistry: Cannabinoids Content in Marijuana Leaves (Cannabis sativa L.) from Colombia 205
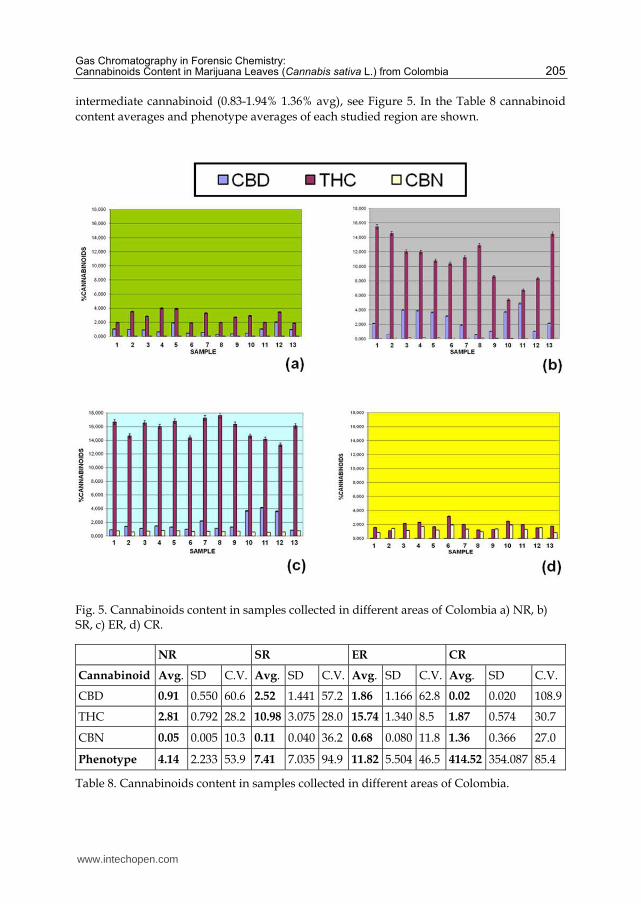
intermediate cannabinoid (0.83-1.94% 1.36% avg), see Figure 5. In the Table 8 cannabinoid
content averages and phenotype averages of each studied region are shown.
Fig. 5. Cannabinoids content in samples collected in different areas of Colombia a) NR, b) SR, c) ER, d) CR.
NR SR ER CR
Cannabinoid Avg. SD C.V. Avg. SD C.V. Avg. SD C.V. Avg. SD C.V.
CBD 0.91 0.550 60.6 2.52 1.441 57.2 1.86 1.166 62.8 0.02 0.020 108.9
THC 2.81 0.792 28.2 10.98 3.075 28.0 15.74 1.340 8.5 1.87 0.574 30.7
CBN 0.05 0.005 10.3 0.11 0.040 36.2 0.68 0.080 11.8 1.36 0.366 27.0
Phenotype 4.14 2.233 53.9 7.41 7.035 94.9 11.82 5.504 46.5 414.52 354.087 85.4
Table 8. Cannabinoids content in samples collected in different areas of Colombia.
www.intechopen.com
Gas Chromatography – Biochemicals, Narcotics and Essential Oils 206
With respect to THC, the substance which presents psychoactive effects and potentially can
generate dependence in consumers, samples from ER and SR showed the highest content
(15.74% and 10.98%, respectively), much higher than those reported for THC in samples
from Colombia (Baker et al., 1980). The NR (2.81%) and CR (1.87%) showed lower values of
THC.
The high content of THC in samples ER and SR regions could indicate the use of improved
varieties of cannabis, whereas worldwide are certified varieties without genetic
manipulation with less than 7% THC (Montero 2008), which comes great concern about the
higher drug potential effects among consumers (Licata et al., 2005).
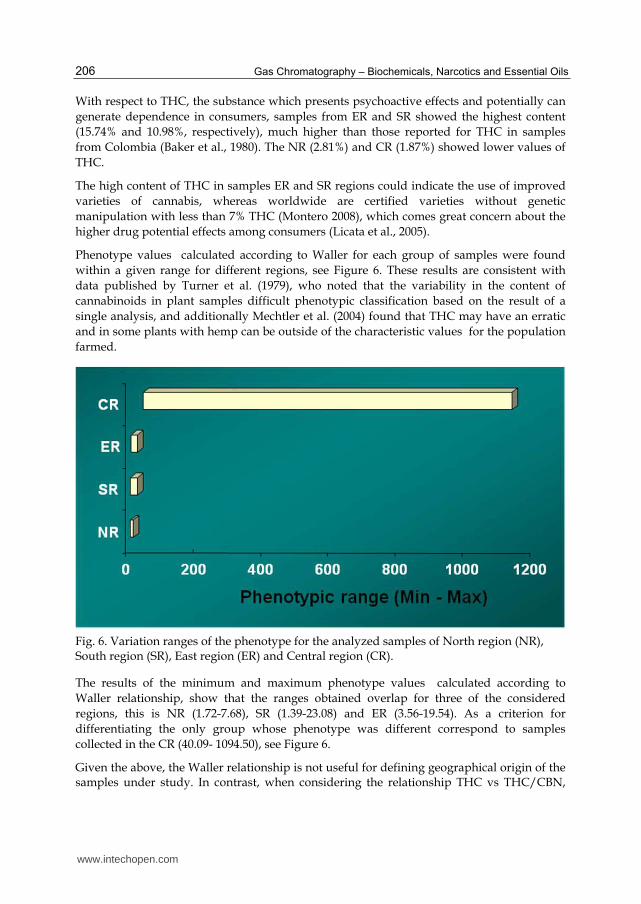
Phenotype values calculated according to Waller for each group of samples were found
within a given range for different regions, see Figure 6. These results are consistent with
data published by Turner et al. (1979), who noted that the variability in the content of
cannabinoids in plant samples difficult phenotypic classification based on the result of a
single analysis, and additionally Mechtler et al. (2004) found that THC may have an erratic
and in some plants with hemp can be outside of the characteristic values for the population
farmed.
Fig. 6. Variation ranges of the phenotype for the analyzed samples of North region (NR), South region (SR), East region (ER) and Central region (CR).
The results of the minimum and maximum phenotype values calculated according to
Waller relationship, show that the ranges obtained overlap for three of the considered
regions, this is NR (1.72-7.68), SR (1.39-23.08) and ER (3.56-19.54). As a criterion for
differentiating the only group whose phenotype was different correspond to samples
collected in the CR (40.09- 1094.50), see Figure 6.
Given the above, the Waller relationship is not useful for defining geographical origin of the samples under study. In contrast, when considering the relationship THC vs THC/CBN,
www.intechopen.com

Gas Chromatography in Forensic Chemistry: Cannabinoids Content in Marijuana Leaves (Cannabis sativa L.) from Colombia 207
this could have a greater discriminatory power as the criterion of origin of the samples under study. Through this relationship we obtain four distinct groups being the most appropriate criteria and discriminate source for the region of origin of the analyzed samples, this relationship is shown in Figure 7.
Fig. 7. THC vs THC/CBN diagram for the four analyzed regions.
By the way the ratio THC vs THC / CBN is obtain this could be an appropriate tool to
discriminate between the studied samples. SR was the most dispersed group, CR was the
less dispersed group, these samples had antagonistic behavior. NR and ER had antagonistic
behavior too, these were the medium dispersed groups. Through this relationship we obtain
four sample distinct groups, it could be the most appropriate criteria and discriminate
source of the region of origin of the samples analyzed.
5. Conclusions
The present study analyzed the cannabinoids content in samples of Cannabis sativa L.
cultivated illicitly in Colombia. The physicochemical conditions were optimized for the
extraction and quantification of cannabidiol (CBD), Δ9-tetrahidrocannabinol (THC) and
cannabinol (CBN) starting from a vegetable sample using gas chromatography with flame
ionization detector GC-FID, validating the respective analytic method.
www.intechopen.com
Gas Chromatography – Biochemicals, Narcotics and Essential Oils 208
The THC average content (% dry basis) in the East region (ER) and South region (SR)
samples showed very high concentrations of THC, 15.74% and 10.98%, respectively. The
higher content of THC in vegetable samples of cannabis from the ER and SR could be
indicative of the employment of improved varieties. This fact generates a great concern
about the potential effects produced by the drug in consumers.
Additionally, variation in the contents of CBD, THC and CBN in the thirteen samples
collected in each region implies that the value of the Waller phenotype for each group of
samples was not found around a value but becomes an interval for each source. The
numerical value of this phenotype, by itself, did not serve as a criterion for differentiation on
the geographical origin of the samples, due to overlapping ranges for three of the regions
concerned, this is North region (NR), SR and ER. The most appropriate criteria and
discriminate source for the region of origin of the four groups of samples analyzed was
plotting the ratio THC vs THC / CBN, as this allows to distinguish four distinct groups.
6. Acknowledgment
Grateful acknowledgements are expressed to the Dirección de Investigación sede Bogotá
(DIB) of the Universidad Nacional de Colombia for their financial support (DIB project No.
8003170) and the Departamento Administrativo de Seguridad (DAS) and the Fiscalía
General de la Nación for their technique support.
7. References
Baker, P.; Bagon, K. & Gough T. (1980). Variation in the THC content illicitly imported
Cannabis products. Bulletin on Narcotics, Vol. 32, pp. 31-40.
Davis, T. & Farmilo, C. (1963). Identification and origin determinations of Cannabis by gas
and paper chromatography. Analytical Chemistry, Vol. 35, pp. 751–755.
De Backer, B.; Debrus, B.; Lebrun, P.; Theunis, L.; Dubois, N.; Decock, L.; Verstraete, A.;
Hubert, P. & Charlier, C. (2009) Innovative development and validation of an
HPLC/DAD method for the qualitative and quantitative determination of major
cannabinoids in cannabis plant material. Journal of Chromatography B, Vol. 877 pp.
4115-4124.
De Meijer, E. ; Bagatta, M.; Carboni, A.; Crucitti, P.; Moliterni, V. & Mandolino, G. (2003).
The inheritance of chemical phenotype in Cannabis sativa L. Genetics, Vol. 163, pp.
335-346.
Dirección Nacional de Estupefacientes (2002). La Lucha de Colombia contra las Drogas
Ilícitas. Acciones y Resultados 2001. Ed.: Ministerio del Interior y de Justicia.
Bogotá-Colombia.
Dirección Nacional de Estupefacientes (2007). Observatorio de Drogas de Colombia.
Acciones y Resultados. Resultados Operativos 2006. Ed.: Ministerio del Interior y
de Justicia. Bogotá-Colombia.
ElSohly, M. & Slade, D. (2005). Chemical constituents of marijuana: The complex mixture of
natural cannabinoids. Life Sciences, Vol. 78, pp. 539 – 548.
www.intechopen.com

Gas Chromatography in Forensic Chemistry: Cannabinoids Content in Marijuana Leaves (Cannabis sativa L.) from Colombia 209
Fernandez-Alonso, J. ; Galindo, A. & Idrobo, J. (2007). Las plantas como Evidencia Legal:
Desarrollo de la Botánica Forense en Colombia. Rev. Acad. Colomb. Cienc., Vol. 31,
pp. 181-198.
Florian, N.M.; Parada, F. & Garzón, W.F. (2009). Study of cannabinoids content in
marihuana samples (Cannabis sativa L.) cultivated in several regions of Colombia.
Vitae, Vol. 16, pp. 237-244.
Gambaro, V.; Dell´Acqua, L.; Farè, F.; Froldi, R.; Saligari, E. & Tassoni, G. (2002).
Determination of primary active constituents in Cannabis preparations by high-
resolution gas chromatography/flame ionization detection and high-perfomance
liquid chromatography/UV detection. Analytica Chimica Acta, Vol. 468, pp. 245-
254.
Hemphill, J.; Turner, J. & Mahlberg, P. (1980). Cannabinoid content of individual plant
organs from different geographical strains of Cannabis sativa L. Journal of Natural
Products, Vol. 43, pp. 112-122.
Lewis, R.; Ward, S.; Johnson, R. & Thorburn, D. (2005). Distribution of the principal
cannabinoids within bars of compressed Cannabis resin. Analytica Chimica Acta,
Vol. 538, pp. 399–405.
Licata, M.; Verri, P. & Beduschi, G. (2005). δ9 THC content in illicit cannabis products over
the period 1997 – 2004 (first four months). Ann 1s Super Sanitù, Vol. 41, pp. 483 -485.
Mechtler, K.; Bailer, J. & de Hueber, K. (2004). Variations of ∆9-THC content in single plants
of hemp varieties. Industrial Crops and Products, Vol. 19, pp. 19-24.
Milman, G.; Barnes, A.J.; Lowe, R.H. & Huestis, M.A. (2010). Simultaneous quantification of
cannabinoids and metabolites in oral fluid by two-dimensional gas
chromatography mass spectrometry. Journal of Chromatography A, Vol. 1217, pp.
1513–1521.
Montero, D. 2008. Colombia de nuevo país exportador. In: El espectador, Reportaje : (15,
jun., 2008): 19, c. 1.
Müller, R.K.; Grosse, J.; Thieme, D.; Lang, R.; Teske, J. & Trauer, H. (1999). Introduction to
the application of capillary gas chromatography of performance-enhancing drugs
in doping control. Journal of Chromatography A, Vol. 843 pp. 275–285.
Pellegrini, M.; Marchei, E.; Pacifi, R. & Pichini, S. (2005). A rapid simple procedure for the
determination of cannabinoids in hemp food products by gas chromatography-
mass spectrometry. Journal of Pharmaceutical and Biomedical Analysis, Vol. 36, pp.
939–946.
Perrotin-Brunel, H.; Kroon, M.C.; van Roosmalen, M.J.E.; van Spronsen, J.; Peters, C.J. &
Witkamp, G.J. (2010). Solubility of non-psychoactive cannabinoids in supercritical
carbon dioxide and comparison with psychoactive cannabinoids. J. of Supercritical
Fluids, Vol. 55, pp. 603–608.
Tipparat, P.; Natakankitkul, S.; Chamnivikaipong, P. & Chutiwat, S. (2011). Characteristics
of cannabinoids composition of Cannabis plants grown in Northern Thailand and
its forensic application. Forensic Science International. doi:10.1016/j.forsciint.
2011.05.006
Turner, C.; Elsohly, M. & Boeren, E. (1980). Constituents of Canabis sativa L. XVII: A review
of natural constituents. Journal of Natural Products, Vol. 43, pp. 169-234.
www.intechopen.com

Gas Chromatography – Biochemicals, Narcotics and Essential Oils 210
Turner, C.; Elsohly, M.; Cheng, P. & Lewis, G. (1979). Constituents of Cannabis sativa L.
XIV. Intrinsic problems in classifying Cannabis based on a single cannabinoid
analysis. Journal of Natural Products, Vol. 42, pp. 317-319.
www.intechopen.com

Gas Chromatography - Biochemicals, Narcotics and Essential OilsEdited by Dr. Bekir Salih
ISBN 978-953-51-0295-3Hard cover, 236 pagesPublisher InTechPublished online 09, March, 2012Published in print edition March, 2012
InTech EuropeUniversity Campus STeP Ri Slavka Krautzeka 83/A 51000 Rijeka, Croatia Phone: +385 (51) 770 447 Fax: +385 (51) 686 166www.intechopen.com
InTech ChinaUnit 405, Office Block, Hotel Equatorial Shanghai No.65, Yan An Road (West), Shanghai, 200040, China
Phone: +86-21-62489820 Fax: +86-21-62489821
Gas Chromatography involves the study of various vaporizable molecules in chemistry and the other relatedresearch fields. This analytical method has a number of features and advantages that make it an extremelyvaluable tool for the identification, quantification and structural elucidation of organic molecules. This bookprovides detailed gas chromatography information to applications of biochemicals, narcotics and essential oils.The details of the applications were briefly handled by the authors to increase their comprehensibility andfeasibility. This guide should be certainly valuable to the novice, as well as to the experienced gaschromatography user who may not have the enough experience about the specific applications covered in thisbook. We believe this book will prove useful in most laboratories where modern gas chromatography ispracticed.
How to referenceIn order to correctly reference this scholarly work, feel free to copy and paste the following:
N.M. Florian-Ramírez, W.F. Garzón-Méndez and F. Parada-Alfonso (2012). Gas Chromatography in ForensicChemistry: Cannabinoids Content in Marijuana Leaves (Cannabis sativa L.) from Colombia, GasChromatography - Biochemicals, Narcotics and Essential Oils, Dr. Bekir Salih (Ed.), ISBN: 978-953-51-0295-3,InTech, Available from: http://www.intechopen.com/books/gas-chromatography-biochemicals-narcotics-and-essential-oils/gas-chromatography-in-forensic-chemistry-cannabinoids-content-in-marijuana-leaves-cannabis-sativa-l-


![Gas Chromatography-Mass Spectrometric Analysis of Forensic … · 2017-10-28 · benzodiazepines in blood [12-14]. Using liquid-liquid extraction, gas chromatography with tandem mass](https://img.dokumen.tips/doc/110x75/5e3b4516665f2b635c6b48a7/gas-chromatography-mass-spectrometric-analysis-of-forensic-2017-10-28-benzodiazepines.jpg)


