Embed Size (px)
Citation preview

CENTRAL STATES PENSION FUND
Investment Policy Decisions and Challenges Facing the Plan
Report to Congressional Requesters
June 2018
GAO-18-106
United States Government Accountability Office

United States Government Accountability Office
Highlights of GAO-18-106, a report to congressional requesters
June 2018
CENTRAL STATES PENSION FUND
Investment Policy Decisions and Challenges Facing the Plan
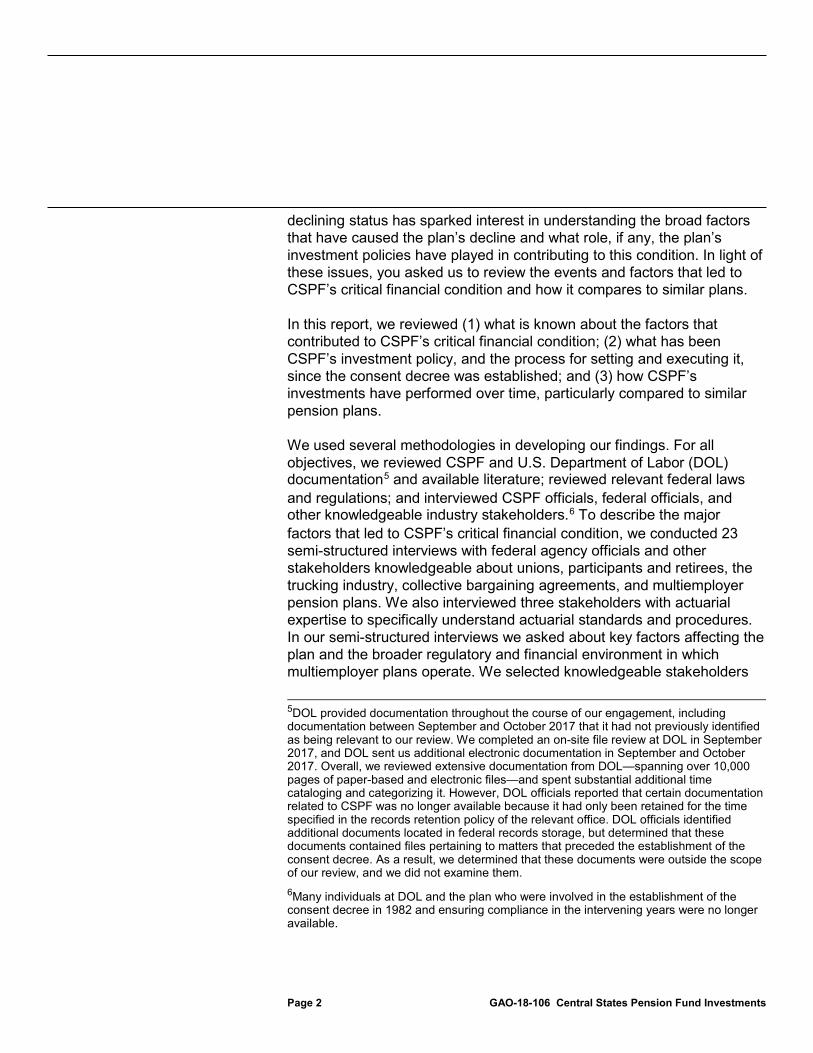
What GAO Found The Central States, Southeast and Southwest Areas Pension Fund (CSPF) was established in 1955 to provide pension benefits to trucking industry workers, and is one of the largest multiemployer plans. According to its regulatory filings, CSPF had less than half the estimated funds needed to cover plan liabilities in 1982 at the time it entered into a court-enforceable consent decree that provides for oversight of certain plan activities. Since then, CSPF has made some progress toward achieving its targeted level of funding; however, CSPF has never been more than 75 percent funded and its funding level has weakened since 2002, as shown in the figure below.
CSPF Funding Levels and Active and Nonworking Participant Totals, 1982–2016
Note: The most recent, publicly available data were from 2016. End-of-year participant data and beginning-of-year funding data are presented at the closest year end.
Stakeholders GAO interviewed identified numerous factors that contributed to CSPF's financial condition. For example, stakeholders stated that changes within the trucking industry as well as a decline in union membership contributed to CSPF’s inability to maintain a healthy contribution base. CSPF’s active participants made up about 69 percent of all participants in 1982, but accounted for only 16 percent in 2016. The most dramatic change in active participants occurred in 2007 when the United Parcel Service, Inc. (UPS) withdrew from the plan. At that time, UPS accounted for about 30 percent of the plan’s active participants (i.e. workers). In addition, the market declines of 2001 to 2002 and 2008 had a significant negative impact on the plan’s long-term investment performance. Stakeholders noted that while each individual factor contributed to CSPF’s critical financial condition, the interrelated nature of the factors also had a cumulative effect on the plan’s financial condition.
View GAO-18-106. For more information, contact Charles Jeszeck at (202) 512-7215 or [email protected] or Frank Todisco at (202) 512-2700 or [email protected].
Why GAO Did This Study Multiemployer plans are collectively bargained pension agreements often between labor unions and two or more employers. CSPF is one of the nation's largest multiemployer defined benefit pension plans, covering about 385,000 participants. Since 1982, the plan has operated under a court-enforceable consent decree which, among other things, requires that the plan’s assets be managed by independent parties. Within 7 years, CSPF estimates that the plan’s financial condition will require severe benefit cuts. GAO was asked to review the events and factors that led to the plan’s critical financial status and how its investment outcomes compare to similar plans.
GAO describes (1) what is known about the factors that contributed to CSPF’s critical financial condition; (2) what has been CSPF’s investment policy, and the process for setting and executing it, since the consent decree was established; and (3) how CSPF’s investments have performed over time, particularly compared to similar pension plans.
GAO reviewed relevant federal laws and regulations; interviewed CSPF representatives, International Brotherhood of Teamsters officials and members, federal officials, and knowledgeable industry stakeholders; reviewed CSPF documentation including investment policy statements and board of trustee meeting minutes; and analyzed investment returns and fees from required, annual pension plan filings and from consultant benchmarking reports.
What GAO Recommends GAO is not making recommendations in this report.

United States Government Accountability Office
Both CSPF’s investment policy and the process for setting and executing it have changed several times since the consent decree was established in 1982. The original consent decree gave an independent asset manager—called a named fiduciary—exclusive authority to set and change the plan’s investment policies and manage plan assets, and prohibited CSPF trustees from managing assets or making investment decisions. Initially, the named fiduciaries sold the troubled real estate assets acquired during the pre-consent decree era. Subsequent changes include the following:
• In 1993, the named fiduciaries started to increase investment in equities, and their policies continued to direct that asset allocations be weighted toward equities until early 2017.
• Between 2003 and 2010, the court approved three plan decisions to move a total of 50 percent of CSPF's assets into passively-managed accounts (passive management typically seeks to match the performance of a specific market index and reduce investment fees).
• An early-2017 investment policy change precipitated by CSPF’s deteriorating financial condition will continue to move plan assets into fixed income investments ahead of projected insolvency, or the date when CSPF is expected to have insufficient assets to pay promised benefits when due. As a result, assets will be gradually transitioned from “return-seeking assets”—such as equities and emerging markets debt—to high-quality investment grade debt and U.S. Treasury securities with intermediate and short-term maturities. The plan is projected to become insolvent on January 1, 2025. CSPF officials and named fiduciary representatives said these changes are intended to reduce the plan’s exposure to market risk and volatility, and provide participants greater certainty prior to projected insolvency.
GAO found that CSPF's investment returns and expenses were generally in line with similarly sized institutional investors and with demographically similar multiemployer pension plans. For example, GAO's analysis of returns using the peer group measure used by CSPF known as the Wilshire Associates' Trust Universe Comparison Service (TUCS), showed that CSPF’s annual investment returns since 1995 were above the median about as many times as they were below. Similarly, comparing CSPF's returns to a peer group of similar multiemployer defined benefit plans using federally required annual reports found that CSPF's annual investment returns were in line with those of its peers. Specifically, CSPF's annual returns were above the median nine times and below it six times—and CSPF's overall (dollar-weighted) average annual return from 2000 through 2014 was close to that of the peer median average return of 4.8 percent.
In addition, GAO found that CSPF's investment fees and other administrative expenses have also been in line with other large multiemployer plans. For example:
• CSPF's investment fees as a percentage of assets were about 9 percent lower than the median of large defined benefit multiemployer plans over the 2000 through 2014 period—though much of that difference is accounted for by a relative reduction in investment fees since 2007. CSPF's investment fees as a percentage of assets were, on average, about 34 basis points (or 0.34 percent).
• CSPF's administrative expenses related to the day-to-day operations of the plan have also been in line with other large multiemployer plans. CSPF's administrative expenses per participant were below the median for large defined benefit multiemployer plans for 12 of the 15 years over the 2000 through 2014 period. As of 2014, CSPF's administrative expense was $98 per participant, which is about 16 percent less than the median for large defined benefit multiemployer plans.
Brief History of the Consent Decree In the 1970s, the U.S. Department of Labor (DOL), the Internal Revenue Service, and the U.S. Department of Justice investigated CSPF for alleged fiduciary breaches of requirements in the Employee Retirement Income Security Act of 1974 (ERISA). As a result of its investigation, DOL filed suit against former trustees of the plan, and, in September 1982, the parties entered into a court-enforceable consent decree. The consent decree provides measures to ensure that CSPF complies with the requirements of ERISA and allows for oversight of certain plan activities. The consent decree has been amended several times and currently remains in force.
Key Parties to the Consent Decree CSPF – The consent decree reiterates that the plan must comply with ERISA and seek input from DOL and approval from the court for certain proposed actions, including the appointment of trustees to its board and the selection of named fiduciaries.
DOL – The consent decree allows DOL to request certain plan documents and comment on or object to certain plan activities.
U.S. District Court for the Northern District of Illinois, Eastern Division – The court oversees and enforces the consent decree and must approve certain proposed plan actions before they take effect.
Court-Appointed Independent Special Counsel – The consent decree provides for an independent special counsel to assist the court in overseeing the plan, attending meetings of the board of trustees, and submitting quarterly reports on plan activities to the court.
Named Fiduciaries – Independent asset managers, known as named fiduciaries, are selected by the plan’s trustees, subject to court approval, and have exclusive responsibility and authority to manage and control plan assets allocated to them.
View GAO-18-106.

Page i GAO-18-106 Central States Pension Fund Investments
Letter 1
Background 4 CSPF’s Critical Financial Condition Is a Result of Factors That
Reflect Challenges Experienced by the Multiemployer System 24 CSPF’s Investment Policy Since 1982 Generally Increased
Allocation to Equities, but Shifted Toward Fixed Income in 2017, Ahead of Projected Insolvency 38
Available Data Show That CSPF Investment Returns and Fees Were Generally Comparable to Similar Plans 58
Agency Comments and Our Evaluation 72
Appendix I Objectives, Scope, and Methodology 78
Appendix II Selected Events Affecting the Central States, Southeast and Southwest Areas Pension Fund 98
Appendix III Key Provisions of the Central States, Southeast and Southwest Areas Pension Fund’s Consent Decree 104
Appendix IV GAO Contacts and Staff Acknowledgments 110
Related GAO Products 111
Tables
Table 1: Common, Broad Categories of Assets Found in a Defined Benefit Plan Retirement Fund 7
Table 2: Selected CSPF Asset Allocations Compared to the Wilshire TUCS Median of Master Trusts of Greater than $3 Billion, in Year-end 1996, 2006 and 2016 61
Table 3: Selected Details from CSPF Investment Policy Statements, 1982–2017 83
Contents

Page ii GAO-18-106 Central States Pension Fund Investments
Table 4: Comparison of Administrative Expenses for Multiemployer Plans with 5,000 or More Participants by Percentile, and Sample (N), 2014 93
Table 5: Comparison of Administrative Expenses for Multiemployer Plans with 5,000 or More Participants, by Minimum, Mean, Maximum, Standard Deviation, and Sample (N), 2014 94
Table 6: Selected Events Affecting CSPF 98
Figures
Figure 1: Typical Multiemployer Defined Benefit Retirement Plan Administration 5
Figure 2: CSPF Net Assets, 1982–2016 11 Figure 3: Investment Assets Withdrawn by CSPF, 1986–2016 13 Figure 4: Multiemployer Retirement Plan Participants by Zone
Status, 2009–2014 22 Figure 5: CSPF Funded Percentage 1982–2017 25 Figure 6: Percent of Active and Nonworking Participants in PBGC-
Insured Multiemployer Plans, 1980–2014 28 Figure 7: CSPF Percent of Active and Nonworking Participants,
1982–2016 29 Figure 8: Named Fiduciaries Set Investment Objectives and
Control CSPF Assets under the Consent Decree 40 Figure 9: CSPF Investment Policies under Equitable and Morgan
Stanley in Early Period after Consent Decree, September 1982–October 1993 42
Figure 10: CSPF Asset Allocation in Early Period after Consent Decree, 1982–1992 43
Figure 11: Changes to CSPF’s Named Fiduciary Structure, 1982–2016 46
Figure 12: CSPF Equity Allocation Bounded by Investment Policies and Passively-Managed Accounts, 1993–2016 51
Figure 13: CSPF Asset Allocation, 1993–1999 53 Figure 14: Changes to CSPF’s Asset Allocation, 2000–2016 54 Figure 15: Planned Changes to CSPF’s Investments to Gradually
Reduce Risk, 2018–2024 56 Figure 16: Historical and Projected Changes to CSPF’s Account
Allocation, 2016–2025 57 Figure 17: CSPF Annual Returns Relative to the Wilshire TUCS
for Master Trusts of Greater than $3 Billion, by Percentile Category, 1995–2016 60

Page iii GAO-18-106 Central States Pension Fund Investments
Figure 18: CSPF’s Annual Investment Returns among Mature Multiemployer Plans, 2000—2014 65
Figure 19: Annual Investment Fee Expense Ratio among Largest Multiemployer Plans, 2000—2014 69
Figure 20: Annual Administrative Expenses per Participant among Largest Multiemployer Plans, 2000—2014 71
Figure 21: Timeline of CSPF Investment Policy Statements, 1982–2017 82
Figure 22: CSPF’s Annual Investment Returns among Large Plans, 2000–2014 95
Figure 23: Annual Administrative Expenses (Less Investments) as a Percentage of Benefits Paid among Largest Multiemployer Plans, 2000–2014 96

Page iv GAO-18-106 Central States Pension Fund Investments
Abbreviations BLS Bureau of Labor Statistics CSPF Central States, Southeast and Southwest Areas
Pension Fund DOJ U.S. Department of Justice DOL U.S. Department of Labor EBSA Employee Benefits Security Administration EOY End of Year Equitable Equitable Life Assurance Society of the United
States ERISA Employee Retirement Income Security Act of 1974 Goldman Sachs Goldman, Sachs & Co., Goldman Sachs Asset
Management, L.P. IRS Internal Revenue Service J.P. Morgan J.P. Morgan Investment Management Inc. Morgan Stanley Morgan Stanley Inc., Morgan Stanley Group, Inc.,
Morgan Stanley Dean Witter & Co. MPPAA Multiemployer Pension Plan Amendments Act of
1980 MPRA Multiemployer Pension Reform Act of 2014 Northern Trust Northern Trust Corporation, Northern Trust Global
Advisors, Inc., Northern Trust Investments, Inc. PBGC Pension Benefit Guaranty Corporation PPA Pension Protection Act of 2006 REIT Real Estate Investment Trust Teamsters International Brotherhood of Teamsters union
members Treasury U.S. Department of the Treasury TUCS Trust Universe Comparison Service UPS United Parcel Service, Inc. Wilshire Wilshire Associates WRERA Worker, Retiree, and Employer Recovery Act of
2008
This is a work of the U.S. government and is not subject to copyright protection in the United States. The published product may be reproduced and distributed in its entirety without further permission from GAO. However, because this work may contain copyrighted images or other material, permission from the copyright holder may be necessary if you wish to reproduce this material separately.

Page 1 GAO-18-106 Central States Pension Fund Investments
441 G St. N.W. Washington, DC 20548
June 4, 2018
Congressional Requesters
Established in 1955 to provide pension benefits to trucking industry workers, the Central States, Southeast and Southwest Areas Pension Fund (CSPF) is one of the nation’s largest multiemployer pension plans, with $15.3 billion in assets at the end of 2016. About 1,400 employers are obligated to contribute to CSPF, and the plan covers almost 385,000 participants.1 Since 1982, the plan has operated under a court-enforceable consent decree which, among other things, requires it to obtain approval from the U.S. District Court for the Northern District of Illinois, Eastern Division, for certain plan activities and requires independent asset managers to manage the plan’s investments.2 Currently, CSPF is projected to become insolvent within 7 years and is classified as a “critical and declining” plan under the Employee Retirement Income Security Act of 1974 (ERISA), as amended by subsequent laws, including the Multiemployer Pension Reform Act of 2014 (MPRA).3 In addition to causing financial hardship for hundreds of thousands of CSPF retirees who are at risk of severe benefit cuts, CSPF’s projected insolvency is also likely to coincide with the projected insolvency of the multiemployer insurance program managed by the Pension Benefit Guaranty Corporation (PBGC).4 The insolvency of PBGC’s multiemployer program would significantly impact the level of PBGC-guaranteed benefits to current and future beneficiaries in all multiemployer plans receiving PBGC assistance. CSPF’s critical and 1Participants include “active” participants (currently working in employment covered by the plan; also referred to in this report as working participants); “separated vested” participants (former employees who worked long enough to earn vested benefits but who left covered employment and have not yet begun receiving their retirement benefits); beneficiaries of deceased employees or former employees either currently receiving benefits or entitled to receive benefits in the future; and retired or separated participants currently receiving benefits. 2Unless otherwise clear from context, all references in this report to the consent decree include the original 1982 consent decree and all subsequent amendments to it. 3MPRA made changes to the multiemployer pension system to address the status of poorly funded multiemployer plans. More information about MPRA is provided later in this report. 4For multiemployer plans, PBGC provides assistance to those that become insolvent (up to a maximum benefit established in law). Each multiemployer plan pays an annual insurance premium to PBGC based on the number of participants covered by the plan.
Letter
Page 2 GAO-18-106 Central States Pension Fund Investments
declining status has sparked interest in understanding the broad factors that have caused the plan’s decline and what role, if any, the plan’s investment policies have played in contributing to this condition. In light of these issues, you asked us to review the events and factors that led to CSPF’s critical financial condition and how it compares to similar plans.
In this report, we reviewed (1) what is known about the factors that contributed to CSPF’s critical financial condition; (2) what has been CSPF’s investment policy, and the process for setting and executing it, since the consent decree was established; and (3) how CSPF’s investments have performed over time, particularly compared to similar pension plans.
We used several methodologies in developing our findings. For all objectives, we reviewed CSPF and U.S. Department of Labor (DOL) documentation5 and available literature; reviewed relevant federal laws and regulations; and interviewed CSPF officials, federal officials, and other knowledgeable industry stakeholders.6 To describe the major factors that led to CSPF’s critical financial condition, we conducted 23 semi-structured interviews with federal agency officials and other stakeholders knowledgeable about unions, participants and retirees, the trucking industry, collective bargaining agreements, and multiemployer pension plans. We also interviewed three stakeholders with actuarial expertise to specifically understand actuarial standards and procedures. In our semi-structured interviews we asked about key factors affecting the plan and the broader regulatory and financial environment in which multiemployer plans operate. We selected knowledgeable stakeholders
5DOL provided documentation throughout the course of our engagement, including documentation between September and October 2017 that it had not previously identified as being relevant to our review. We completed an on-site file review at DOL in September 2017, and DOL sent us additional electronic documentation in September and October 2017. Overall, we reviewed extensive documentation from DOL—spanning over 10,000 pages of paper-based and electronic files—and spent substantial additional time cataloging and categorizing it. However, DOL officials reported that certain documentation related to CSPF was no longer available because it had only been retained for the time specified in the records retention policy of the relevant office. DOL officials identified additional documents located in federal records storage, but determined that these documents contained files pertaining to matters that preceded the establishment of the consent decree. As a result, we determined that these documents were outside the scope of our review, and we did not examine them. 6Many individuals at DOL and the plan who were involved in the establishment of the consent decree in 1982 and ensuring compliance in the intervening years were no longer available.
Page 3 GAO-18-106 Central States Pension Fund Investments
based on a review of literature and prior GAO work, and recommendations from other stakeholders. Additionally, we selected stakeholders whose expertise coincided with the scope of our objectives and who would be able to provide a broad range of perspectives. We also collected actuarial, financial, and other data on current and historical measures of plan assets, liabilities, investment performance, and other factors, and performed our own analyses of these data. The data and documentation collected were generally from the plan or agencies that oversee pensions. We determined the information to be generally reliable for the purposes of our objectives.
To describe CSPF’s investment policy and the process for setting and executing it since the consent decree was established, we reviewed CSPF’s investment policy statements, performance reports from the plan’s named fiduciaries, select board of trustee meeting minutes, and select correspondence between CSPF and DOL. We also interviewed CSPF and federal officials about a recent investment policy change. To analyze CSPF’s performance, we examined its investment returns in comparison to a customized Wilshire Associates’ (Wilshire) Trust Universe Comparison Service benchmark of trusts with $3 billion or more in assets. CSPF provided these data, and they also included these data in the independent special counsel reports. Wilshire provided supplemental data using the same benchmark specifications. We also analyzed investment returns and fee and expense data from the Form 5500, the government’s primary source of information about pension plans. We used this Form 5500 data to examine CSPF’s investment returns and fees and expenses in comparison to groups of similar multiemployer pension plans. The Internal Revenue Service (IRS), DOL, and PBGC jointly developed the Form 5500-series returns for employee benefit plans to satisfy annual reporting requirements under ERISA and the Internal Revenue Code.7 We primarily relied on PBGC’s Form 5500 research database as the agency takes several steps to correct and update the raw electronic data. We also took steps to assess the reliability of the PBGC data and checked data fields and made appropriate corrections. In addition, we performed computer analyses of the data and identified inconsistencies and other indications of error and
7The Form 5500 is part of ERISA’s overall reporting and disclosure framework, which is intended to assure that employee benefit plans are operated and managed in accordance with certain prescribed standards and that participants, beneficiaries, and federal agencies are provided or have access to sufficient information to protect the rights and benefits of participants and beneficiaries.

Page 4 GAO-18-106 Central States Pension Fund Investments
took steps to correct inconsistencies or errors. A second analyst checked all computer analyses. After these processes, we determined the data to be sufficiently reliable for our purposes. For more information on our objectives, scope, and methodology, see appendix I.
We conducted this performance audit from July 2016 to June 2018 in accordance with generally accepted government auditing standards. Those standards require that we plan and perform the audit to obtain sufficient, appropriate evidence to provide a reasonable basis for our findings and conclusions based on our audit objectives. We believe the evidence obtained provides a reasonable basis for our findings and conclusions based on our audit objectives.
CSPF is a defined benefit multiemployer pension plan.8 Multiemployer plans are often created and maintained through collective bargaining agreements between labor unions and two or more employers, so that workers who move from job to job and employer to employer within an industry can continue to accrue pension benefits within the same plan over the course of their careers. Multiemployer plans are typically found in industries with many small employers such as trucking, building and construction, and retail food sales. In 2017, there were about 1,400 defined benefit multiemployer plans nationwide covering more than 10 million participants.
8In a defined benefit plan, pension benefits are typically set by formula, often based on the number of years worked while covered by the plan, the worker’s age at retirement, and sometimes, the worker’s average wages or salary level over some period of years prior to retirement. Multiemployer plans also can be defined contribution plans. Defined contribution plans have an individual account for each participant, with the account balance based on employer and employee contributions to the account and investment returns, with the participant bearing the investment risk. PBGC does not insure defined contribution plans. The term “multiemployer plan” will be used throughout this report to refer to defined benefit multiemployer plans.
Background

Page 5 GAO-18-106 Central States Pension Fund Investments
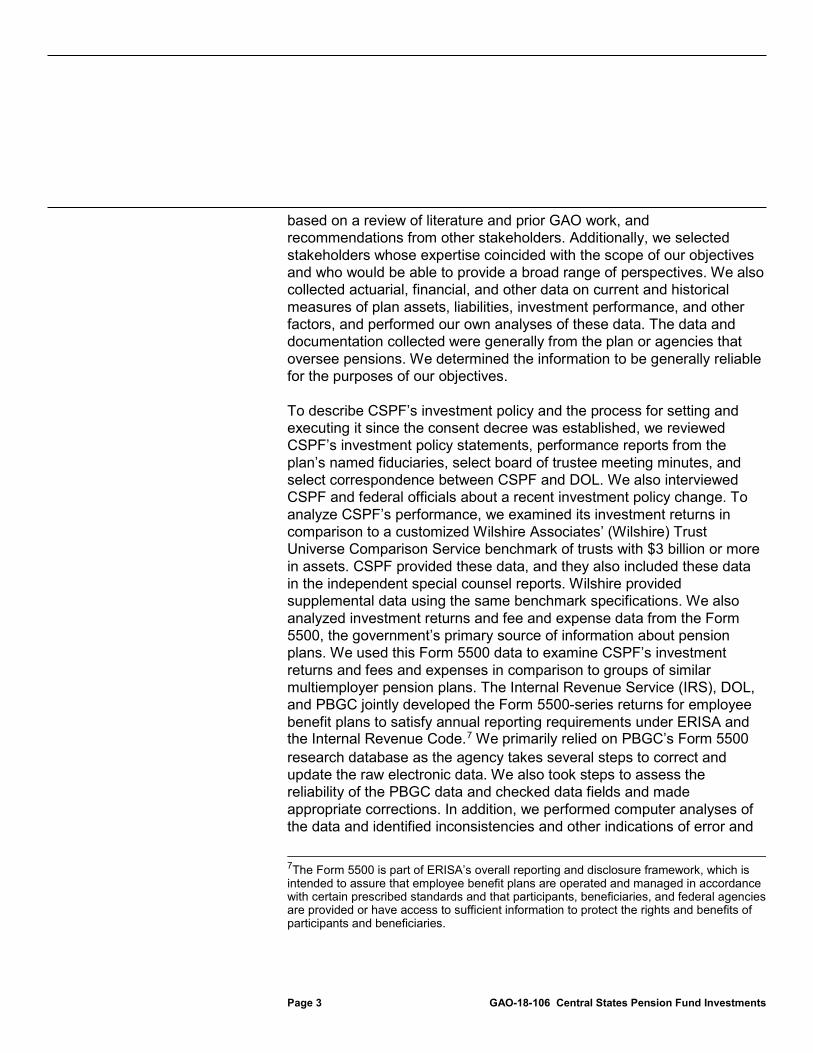
Most multiemployer plans are jointly administered and governed by a board of trustees selected by labor and management. The labor union typically determines how the trustees representing labor are chosen and the contributing employers or an employer association typically determines how the trustees representing management are chosen. The trustees set the overall plan policy, direct plan activities, and set benefit levels (see fig. 1).
Figure 1: Typical Multiemployer Defined Benefit Retirement Plan Administration
aBenefits are generally determined by the plan’s board of trustees. The bargaining parties negotiate a contribution rate and the trustees adopt or amend the plan’s benefit formulas and provisions. Decisions to increase benefits or change the plan are also typically made by the board of trustees. bOther plan operations can include appointing independent investment managers, hiring auditors, and paying Pension Benefit Guaranty Corporation premiums and plan expenses.
Multiemployer plans are “prefunded,” or funded in advance, primarily by employer contributions.9 The employer contribution is generally 9In a prefunded plan, contributions go into a trust fund, grow with investment returns, and eventually are paid out as benefits at a later date. Funding a plan in advance of benefit payouts improves the chances that some funds will be available to retirees if contributing employers are no longer able to fund the plan.
Multiemployer Plan Administration, Funding, and Benefits
Administration
Funding

Page 6 GAO-18-106 Central States Pension Fund Investments
negotiated through a collective bargaining agreement, and is often based on a dollar amount per hour worked by each employee covered by the agreement.10 Employer contributions are pooled in a trust fund for investment purposes, to pay benefits to retirees and their beneficiaries, and for administrative expenses. Multiemployer plan trustees typically decide how the trust fund should be invested to meet the plan’s objectives, but the trustees can use investment managers to determine how the trust fund should be invested.11 Multiemployer plan trust funds can be allocated among many different types of assets, any of which can generally be passively- or actively-managed, domestically or internationally based, or publicly or nonpublicly traded (see table 1).12
10Collective bargaining is a process through which the employers and the workers’ union come together to reach an agreement on a labor contract that includes wages, hours, and other terms and conditions of employment. 11While the trustees may delegate certain duties, such as plan management, to other parties, ERISA generally requires trustees, as fiduciaries, to make prudent decisions solely in the interest of plan participants and beneficiaries and diversify the investments of the plan to minimize the risk of large losses, among other things. See 29 U.S.C. §§ 1002(21)(A) (defining “fiduciary”), 1104(a) (establishing a prudent man standard of care for fiduciaries), and 29 C.F.R. § 2509.75-8, D-3 (explaining that a trustee of an employee benefit plan is a fiduciary). 12Passive management involves buying or creating an investment portfolio that closely tracks the performance of a broad class of assets usually defined by an index, such as the S&P 500. Passive managers attempt to match the performance of that class, typically with lower fees than active management. Active managers attempt to exceed performance of that class using their judgment about which individual investments will perform better than average.

Page 7 GAO-18-106 Central States Pension Fund Investments
Table 1: Common, Broad Categories of Assets Found in a Defined Benefit Plan Retirement Fund
Categories of assets Description Equity Equity indicates ownership in a business, often in the form of common stock. This asset class
includes mutual funds, collective investment trusts, and exchange-traded funds that invest in equity securities.
Fixed income Fixed income refers to any type of investment under which the borrower or issuer is obligated to make payments of a defined amount on a defined schedule. This asset class includes corporate bonds, most U.S. Treasury securities, mutual funds, collective investment trusts, and exchange-traded funds that invest in fixed-income securities.
Real estate Real estate investments can include direct purchase of properties, interests in nonpublicly traded entities such as partnerships that invest in real estate, or investments in a real estate investment trust (REIT).a
Cash and cash equivalent
Cash and cash equivalents include plan assets that are cash or can be converted into cash in a very short period of time. They include bank accounts, marketable securities, commercial paper, short-term U.S. Treasury securities, short-term government bonds (with maturities of 3 months or less), short-term certificates of deposit, and money-market funds.
Other assets Other assets include alternative assets, including hedge funds,b private equity,c and commodities.d In recent years, hedge funds and private equity were the two most common alternative assets held by institutional investors, such as pension funds.
Source: GAO analysis. | GAO-18-106 aA REIT is generally a company that owns income-producing real estate or real estate-related assets. It allows individual investors to earn a share of the income produced by commercial real estate without owning individual properties. Many REITs are registered with the Securities and Exchange Commission and are publicly traded. bThere is no universally accepted definition of hedge funds; however, the term is commonly used to describe pooled investment vehicles that are privately organized and administered by professional managers who often engage in active trading of various types of securities, commodity futures, options contracts, and other investment vehicles. cThere is no commonly accepted definition of private equity funds, but such funds are generally privately managed pools of capital that invest in companies, many of which are not listed on a stock exchange. dCommodities are goods and articles such as agricultural products, metals, oil, and financial products, including stock indexes and foreign currency.
A plan’s funded percentage is its ratio of plan assets to plan liabilities.13 Because the amount needed to pay pension benefits for many years into the future cannot be known with certainty due to a variety of economic 13A pension liability generally includes two portions: (1) the present value of all projected future benefits for current retirees and former employees not yet retired who have a vested right to a future pension, plus (2) the present value of a portion of the projected future benefits for current employees, based on their service to date (with each additional year of service adding to the liability), such that the full cost of benefits is expected to be accrued when employees reach retirement. Liability measurements can vary with the choice of discount rate and actuarial cost method, and with whether they are determined on an ongoing plan basis or a plan close-out basis.

Page 8 GAO-18-106 Central States Pension Fund Investments
and demographic factors, including the potential volatility of asset values, estimates of a plan’s funded percentage may vary from year to year.14 Defined benefit pension plans use a “discount rate” to convert projected future benefits into their “present value.” The discount rate is the interest rate used to determine the current value of estimated future benefit payments and is an integral part of estimating a plan’s liabilities. The higher the discount rate, the lower the plan’s estimate of its liability.15 Multiemployer plans use an “assumed-return approach” that bases the discount rate on a long-term assumed average rate of return on the pension plan’s assets. Under this approach, the discount rate depends on the allocation of plan assets.16 For example, a reallocation of plan assets into more stocks and fewer bonds typically increases the discount rate, which reduces the estimated value of plan liabilities, and therefore, reduces the minimum amount of funding required.17
Looking at the entire “multiemployer system”—the aggregation of multiemployer plans governed by ERISA and insured by PBGC—shows that while the system was significantly underfunded around 2001 and 2009, its funded position has improved since 2009.18 Specifically, analyses published by the Center for Retirement Research at Boston College and the Society of Actuaries used plan regulatory filings to
14There are many sources of variation in the year-to-year estimates of a plan’s funded status. Some change is expected, such as the improvement associated with any employer contributions that exceed the cost of new benefit accruals. However, significant change can be associated with unpredictable events. For example, calculation of the funding target involves many demographic and economic assumptions about the future, such as how long participants will work in covered employment, how long participants will live, and how much income the plan’s assets will generate. Due to their long-term nature, small changes to the assumptions can have a significant effect on the target. The funded status may also change from one estimate to the next due to differences between what was assumed to occur and what actually occurred. For example, a plan’s asset returns for a single year may vary significantly from what was assumed, particularly when there is significant investment in assets with volatile patterns of returns. 15For more information on different approaches used to determine the discount rate see GAO, Pension Plan Valuation: Views on Using Multiple Measures to Offer a More Complete Financial Picture, GAO-14-264 (Washington, D.C.: Sept. 30, 2014). 16See GAO-14-264. 17The potential implications of this approach to determining discount rates are discussed later in this report. 18The system’s funded statuses were generally measured by comparing asset and liability values used to determine minimum contribution requirements under ERISA, specifically, the Actuarial Values of Assets and the Actuarial Accrued Liabilities.

Page 9 GAO-18-106 Central States Pension Fund Investments
calculate the funded status for the system and determined that it was approaching 80 percent funded by 2014 after falling during the 2008 market downturn.19 However, some observers have noted that while many plans are making progress toward their minimum targets, a subset of plans face serious financial difficulties.20
Multiemployer retirement benefits are generally determined by the board of trustees. The bargaining parties negotiate a contribution rate and the trustees adopt or amend the plan’s benefit formulas and provisions. Decisions to increase benefits or change the plan are also typically made by the board of trustees. Benefit amounts are generally based on a worker’s years of service and either a flat dollar amount or the worker’s wage or salary history, subject to further adjustment based on the age of retirement.
CSPF was established in 1955 to provide pension benefits to International Brotherhood of Teamsters union members (Teamsters) in the trucking industry, and it is one of the largest multiemployer plans. In the late 1970s, CSPF was the subject of investigations by the IRS within the U.S. Department of the Treasury (Treasury), and by DOL and the U.S. Department of Justice (DOJ). The DOL investigation ultimately resulted in the establishment of a federal court-enforceable consent decree in 1982 that remains in force today.21 CSPF held more than $4.3 billion in Net Assets at the end of 1982 after the consent decree was established. The plan’s Net Assets peaked at nearly $26.8 billion at the end of 2007 and declined to about $15.3 billion at the end of 2016 (see
19In a December 2017 special report, the Center for Retirement Research at Boston College reported that the system’s funded status declined to lows of 69 percent and 72 percent in 2001 and 2009 respectively, and has since recovered to 78 percent based on actuarial regulatory filings for 2015. See Alicia H. Munnell, Jean-Pierre Aubry, and Caroline V. Crawford, Multiemployer Pension Plans: Current Status and Future Trends (Chestnut Hill, MA: Center for Retirement Research at Boston College, December 2017). The Society of Actuaries reported that the multiemployer system was 60 percent funded in 2009 and 76 percent funded in 2014. See Lisa A. Schilling, Multiemployer Pension Plan System Overview (Schaumburg, IL: Society of Actuaries, January 2017). 20PBGC noted that: “Over 100 of the multiemployer plans that PBGC insures, covering over1 million participants, have declared that they will be unable to raise contributions sufficiently to avoid insolvency over the next 20 years.” See Pension Benefit Guaranty Corporation, FY2016 PBGC Projections Report (Washington, D.C.: 2017). 21See a full discussion of the consent decree later in the background, as well as in appendix III.
Benefits
The Central States, Southeast and Southwest Areas Pension Fund (CSPF)

Page 10 GAO-18-106 Central States Pension Fund Investments
fig. 2).22 As of 2016, CSPF reported that it had about 1,400 contributing employers and almost 385,000 participants.23
22These data were reported by CSPF in Schedule H of their annual Form 5500 filings. 23The average CSPF monthly benefit amount in 2016 was $1,340 for pensioners. The average age of a CSPF pensioner in 2016 was 73.9 years.

Page 11 GAO-18-106 Central States Pension Fund Investments
Figure 2: CSPF Net Assets, 1982–2016
Note: These data were reported by CSPF in Schedule H of their annual Form 5500 filings. Nominal dollars are also called current or then-year values, and have not been adjusted for inflation. Real dollars have been adjusted to 2016 for inflation using a calendar year chain-weighted gross domestic product price index.

Page 12 GAO-18-106 Central States Pension Fund Investments
The number of active CSPF participants has declined over time. In 2016, 16 percent of about 385,000 participants were active, i.e., still working in covered employment that resulted in employer contributions to the plan. In comparison, CSPF reported in 1982 that 69 percent of more than 466,000 participants were active participants. Since the 1980s, CSPF’s ratio of active to nonworking participants has declined more dramatically than the average for multiemployer plans.24 By 2015, only three of the plan’s 50 largest employers from 1980 still paid into the plan, and for each full-time active employee there were over five nonworking participants, mainly retirees.25 As a result, benefit payments to CSPF retirees have exceeded employer contributions in every year since 1984. Thus, CSPF has generally drawn down its investment assets. In 2016, CSPF withdrew over $2 billion from investment assets (see fig. 3.).
24Nonworking participants include retired participants currently receiving benefits, separated vested participants (former employees who worked long enough to earn vested benefits but who left covered employment and have not yet commenced receiving their retirement benefits), as well as beneficiaries of deceased employees or former employees either currently receiving benefits or entitled to receive benefits in the future. 25At the beginning of 2016, 61.6 percent of nonworking participants were receiving benefits.

Page 13 GAO-18-106 Central States Pension Fund Investments
Figure 3: Investment Assets Withdrawn by CSPF, 1986–2016
Note: Nominal dollars are also called current or then-year values, and have not been adjusted for inflation. Real dollars have been adjusted to 2016 for inflation using a calendar year chain-weighted gross domestic product price index.
CSPF has historically had fewer plan assets than were needed to fully fund the accrued liability—the difference referred to as unfunded liability. In 1982, we reported that CSPF was “thinly funded”—as the January 1,

Page 14 GAO-18-106 Central States Pension Fund Investments
1980, actuarial valuation report showed the plan’s unfunded liability was about $6 billion—and suggested that IRS should closely monitor CSPF’s financial status.26 In 2015, the plan’s actuary certified that the plan was in “critical and declining” status. The plan has been operating under an ERISA-required rehabilitation plan since March 25, 2008, which is expected to last indefinitely.27 As of January 1, 2017, the plan was funded to about 38 percent of its accrued liability.28 In September 2015, CSPF filed an application with Treasury seeking approval to reduce benefits pursuant to provisions in the Multiemployer Pension Reform Act of 2014 (MPRA), which is fully discussed later in this section. The application was denied in May 2016 based, in part, on Treasury’s determination that the plan’s proposed benefit suspensions were not reasonably estimated to allow the plan to remain solvent.29 In 2017, CSPF announced it would no longer be able to avoid the projected insolvency.30 (See app. II for a timeline of key events affecting CSPF.)
26See GAO, Investigation to Reform Teamsters’ Central States Pension Fund Found Inadequate, HRD-82-13 (Washington, D.C.: Apr. 28, 1982). 27The Pension Protection Act of 2006 (PPA) amended ERISA to require plans certified to be in endangered status to adopt a funding improvement plan and plans certified to be in critical status to adopt a rehabilitation plan within 240 days of the required date of certification. These plans must consist of actions that will enable the plan to achieve certain targets in improved funding, generally over a 10-year period, i.e., increase contribution rates and/or decrease future benefit accruals or other benefits to the extent necessary to achieve the required improvement in the plan’s funding. These plans are generally adopted as part of the collective bargaining process. 28This funded percentage is calculated by dividing the plan’s Actuarial Value of Assets by its Actuarial Accrued Liability as reported in the plan’s Form 5500. The Actuarial Value of Assets and Actuarial Accrued Liability are used to determine the plan’s minimum required contributions under ERISA. 29In May 2016, Treasury rejected CSPF’s application to reduce benefits finding it failed to satisfy certain MPRA requirements, including that the: (1) proposed benefit suspensions, in the aggregate, be reasonably estimated to achieve, but not materially exceed, the level that is necessary to avoid insolvency, (2) proposed benefit suspensions be equitably distributed across the participant and beneficiary population, and (3) notices of proposed benefit suspensions be written so as to be understood by the average plan participant. CSPF officials said it was no longer possible to submit a renewed MPRA application because, in large part due to the passage of time, benefit suspensions under MPRA will not help the plan avoid insolvency. 30As of March 2018, CSPF’s actuaries projected that the fund will be insolvent on January 1, 2025—having insufficient assets to pay benefits for that year. Beginning January 1, 2025, the plan expects to pay a reduced benefit level throughout the year. Beginning January 1, 2026, the plan expects to receive PBGC financial assistance and benefits would be reduced to the PBGC maximum benefit guarantee.

Page 15 GAO-18-106 Central States Pension Fund Investments
As previously mentioned, CSPF was the subject of investigations in the 1970s by IRS, DOL, and DOJ.31 DOL’s investigation focused on numerous loan and investment practices alleged to constitute fiduciary breaches under ERISA, such as loans made to companies on the verge of bankruptcy, additional loans made to borrowers who had histories of delinquency, loans to borrowers to pay interest on outstanding loans that the fund recorded as interest income, and lack of controls over rental income. As a result of its investigation, DOL filed suit against the former trustees of CSPF and, in September 1982, the parties entered into a consent decree, which remains in force today.32 The consent decree provides measures intended to ensure that the plan complies with the requirements of ERISA, including providing for oversight by the court and DOL, and prescribes roles for multiple parties in its administration. For example, certain plan activities must be submitted to DOL for comment and to the court for approval, including new trustee approvals and some investment manager appointments.33 According to DOL, to prevent criminal influence from regaining a foothold of control over plan assets, the consent decree generally requires court-approved independent asset managers—called “named fiduciaries”—to manage CSPF’s investments. CSPF’s trustees are generally prohibited from managing assets; however, they remain responsible for selecting, subject to court approval, and overseeing named fiduciaries and monitoring plan performance. To focus attention on compliance with ERISA fiduciary responsibility provisions, the
31In 1968 and 1975, IRS and DOL, respectively, began investigating alleged misconduct by CSPF trustees. DOL filed suit after mismanagement and breaches of fiduciary responsibilities were alleged to have caused large losses due to improper loans and investments related to CSPF’s real estate assets and other businesses. DOL found apparent significant fiduciary violations and imprudent practices by the trustees with respect to many of the 82 CSPF real estate mortgage and collateral loans that were targeted for investigation. These loans totaled about $518 million and more than half of them were made to owners or entities that controlled hotels and casinos in Las Vegas, Nevada. DOJ’s investigation focused on criminal activities including possible links to organized crime. DOL and DOJ coordinated their investigations. 32For a more complete discussion of the investigations and the implementation of the consent decree, see GAO, HRD-82-13, and GAO, The Department of Labor’s Oversight of the Management of the Teamsters’ Central States Pension and Health and Welfare Funds, GAO/HRD-85-73 (Washington, D.C.: July 18, 1985). 33While DOL may request information and comment on or object to certain proposed plan changes, it is not required to do so. The court is the final decision maker with regard to any covered action the plan proposes to take. For investment policy changes, DOL receives notice of proposed changes from the plan and any changes shall not remain in effect for more than 90 days without court approval.
The Consent Decree

Page 16 GAO-18-106 Central States Pension Fund Investments
consent decree provides for a court-appointed independent special counsel with authority to observe plan activities and oversee and report on the plan. (See app. III for additional detail on the key provisions of the consent decree.)
In 1974, Congress passed ERISA to protect the interests of participants and beneficiaries of private sector employee benefit plans.34 Among other things, ERISA requires plans to meet certain requirements and minimum standards. DOL, IRS, and PBGC are generally responsible for administering ERISA and related regulations.
Department of Labor
DOL has primary responsibility for administering and enforcing the fiduciary responsibility provisions under Part 4 of Title I of ERISA, which include the requirement that plan fiduciaries act prudently and in the sole interest of participants and beneficiaries.35
Internal Revenue Service
Treasury, specifically the IRS, is charged with determining whether a private sector pension plan qualifies for preferential tax treatment under the Internal Revenue Code.36 Additionally, the IRS is generally responsible for enforcing ERISA’s minimum funding requirements, among 34See Pub. L. No. 93-406, 88 Stat. 829. Unless otherwise clear from context, when we refer to ERISA, we are referring to the law as amended by subsequent legislation. 35Additionally, DOL has primary responsibility for administering the reporting and disclosure provisions under Part 1 of Title I of ERISA. The Employee Benefits Security Administration (EBSA) is the agency within DOL responsible for overseeing employee benefit plans. EBSA’s mission is to ensure the security of the retirement, health, and other workplace-related benefits of workers and their families. EBSA seeks to accomplish this mission by developing regulations; assisting and educating workers, plan sponsors, fiduciaries, and service providers; and enforcing the law. For ease of reference, we refer to DOL in this report, although most activities are carried out by EBSA or DOL’s Office of the Solicitor. 36To qualify for the preferential tax treatment accorded to qualified plans under the Internal Revenue Code, multiemployer plans must comply with rules established in ERISA, including rules pertaining to eligibility, vesting, benefit accrual, coverage and participation, integration with Social Security benefits, and plan termination, in addition to other Internal Revenue Code requirements. See 26 U.S.C. §§ 401(a) and 501(a).
Legal Framework
Employee Retirement Income Security Act of 1974

Page 17 GAO-18-106 Central States Pension Fund Investments
other things. ERISA generally requires that multiemployer plans meet minimum funding standards, which specify a funding target that must be met over a specified period of time.37 The funding target for such plans is measured based on assumptions as to future investment returns, rates of mortality, retirement ages, and other economic and demographic assumptions. Under the standards, a plan must collect a minimum level of contributions each year to show progress toward meeting its target, or the plan employers may be assessed excise taxes and owe the plan for missed contributions plus interest. Minimum contribution levels may vary from year to year due to a variety of economic and demographic factors, such as addressing differences between assumed investment returns and the plan’s actual investment returns.38
Pension Benefit Guaranty Corporation
To protect retirees’ pension benefits in the event that plan sponsors are unable to pay plan benefits, PBGC was created by ERISA. PBGC is financed through mandatory insurance premiums paid by plans and plan sponsors, with premium rates set by law. PBGC operates two distinct insurance programs: one for multiemployer plans and another for single-employer plans.39 Each program has separate insurance funds and different benefit guarantee rules.
The events that trigger PBGC intervention differ between multiemployer and single-employer plans. For multiemployer plans, the triggering event is plan insolvency, the point at which a plan begins to run out of money while not having sufficient assets to pay the full benefits that were originally promised when due. PBGC does not take over operations of an insolvent multiemployer plan; rather, it provides loan assistance to pay
37See 26 U.S.C. §§ 412 and 431. 38ERISA requires an aggregate minimum contribution for the plan, but individual employer contributions are determined by the collective bargaining agreement with the union, which may or may not include provisions for an annual adjustment, e.g., the minimum contribution level required by ERISA and contributions agreed to in collective bargaining may not be equal. 39A single-employer plan is a plan that is established and maintained by a single employer. Single-employer plans can be established unilaterally by the sponsor or through a collective bargaining agreement with a labor union.

Page 18 GAO-18-106 Central States Pension Fund Investments
administrative expenses and benefits up to the PBGC-guaranteed level.40 According to PBGC, only once in its history has a financial assistance loan from the multiemployer pension insurance program been repaid. In 2017, PBGC provided financial assistance to 72 insolvent multiemployer plans for an aggregate amount of $141 million. For single-employer plans the triggering event is termination of an underfunded plan—generally, when the employer goes out of business or enters bankruptcy. When this happens, PBGC takes over the plan’s assets, administration, and payment of plan benefits (up to the statutory limit).
The PBGC-guaranteed benefit amounts for multiemployer plans and the premiums assessed by PBGC to cover those benefit guarantees are significantly lower than those for single-employer plans. Each insured multiemployer plan pays flat-rate insurance premiums to PBGC based on the number of participants covered.41 The annual premium rate for plan years beginning in January 2017 was $28 per participant and it is adjusted annually based on the national average wage index.42 (See app. II for the PBGC premium rates that have been in effect since the consent decree was established in 1982.) When plans receive financial assistance, participants face a reduction in benefits. For example, using 2013 data, PBGC estimated 21 percent of more than 59,000 selected participants in insolvent multiemployer plans then receiving financial assistance from PBGC faced a benefit reduction. The proportion of participants facing reductions due to the statutory guarantee limits is expected to increase. About 51 percent of almost 20,000 selected
40The PBGC maximum benefit guarantee for participants in a multiemployer plan is based on a formula prescribed by federal law. For plans that become insolvent after December 21, 2000, the maximum monthly amount is the product of a participant’s years of service multiplied by (1) 100 percent of the first $11 of the monthly benefit accrual rate, and (2) 75 percent of the next $33 of the accrual rate. For someone with 30 years of service, the guaranteed annual benefit limit is $12,870. 41Covered participants include active employees, former employees who worked long enough to earn vested benefits but who left covered employment without receiving a retirement benefit immediately, and retirees. 42The national average wage index is determined by the Social Security Administration to index earnings used to compute benefits and index program amounts that are significant to Old-Age, Survivors, and Disability Insurance. The index is updated annually based on wages subject to federal income taxes and contributions to deferred compensation plans. PBGC uses the national average wage index to compute flat-rate premiums for PBGC-insured single-employer and multiemployer plans, as required by the Deficit Reduction Act of 2005.

Page 19 GAO-18-106 Central States Pension Fund Investments
participants in plans that PBGC believed would require future assistance were projected to face a benefit reduction.43
Since 2013, the deficit in PBGC’s multiemployer program has increased by nearly 700 percent, from a deficit of $8.3 billion at the end of fiscal year 2013 to $65.1 billion at the end of fiscal year 2017. PBGC estimated that at of the end of 2016, the present value of net new claims by multiemployer plans over the next 10 years would be about $24 billion, or approximately 20 percent higher than its 2015 projections.44 The program is projected to become insolvent within approximately 8 years. If that happens, participants who rely on PBGC guarantees will receive only a very small fraction of current statutory guarantees. According to PBGC, most participants would receive less than $2,000 a year and in many cases, much less.
We have identified PBGC’s insurance programs as high-risk. This designation was made in part because multiemployer plans that are currently insolvent, or likely to become insolvent in the near future, represent a significant financial threat to the agency’s insurance program. We designated the single-employer program as high-risk in July 2003,
43PBGC identified almost 152,000 participants among 109 plans that were receiving financial assistance or had terminated and were likely to receive assistance in the future. PBGC selected the smaller representative sample of about 79,000 participants (59,000 plus 20,000) for whom it had sufficient data to determine how guarantee limits affect a participant’s retirement benefit. Pension Benefit Guaranty Corporation, PBGC’s Multiemployer Guarantee (Washington, D.C.: March 2015). 44Projected new claims arise primarily, but not solely, from plans that are currently in poor financial condition. Uncertainty as to the probability and timing of future financial assistance reflects both the volatility of plan investment returns and the timing of potential mass withdrawal from the plan by contributing employers. Variability in fund earnings, contributions, and benefit accruals makes the date of insolvency and the amount of financial assistance uncertain. To account for this uncertainty, PBGC runs many projections of the present value of net new claims over the next 10 years, which averaged $24 billion in their 2016 report and varied from $10 billion to $38 billion at the 15th through 85th percentiles, respectively.
Page 20 GAO-18-106 Central States Pension Fund Investments
and added the multiemployer program in January 2009. Both insurance programs remain on our high-risk list.45
Multiemployer Pension Plan Amendments Act of 1980
Among other things, the Multiemployer Pension Plan Amendments Act of 1980 (MPPAA) made employers liable for a share of unfunded plan benefits when they withdraw from a plan, unless otherwise relieved of their liability, and strengthened certain funding requirements.46 An employer that chooses to withdraw from a multiemployer plan may be required to continue to contribute if the plan does not have sufficient assets to cover the plan’s current and known future liabilities at the time the employer withdraws; however, these payments may not fully cover the withdrawing employer’s portion of the plan’s liabilities.47 In such cases, the employers remaining in the plan may effectively assume the remaining liability.
The Pension Protection Act of 2006
The Pension Protection Act of 2006 (PPA) was intended to improve the funding of seriously underfunded multiemployer plans, among other things.48 It included provisions that require plans in poor financial health to take action to improve their financial condition over the long term and established two categories of troubled plans: (1) “endangered status” or “yellow zone” plans (this category also includes a sub-category of “seriously endangered”), and (2) more seriously troubled “critical status” or “red zone” plans.49 PPA further required plans in the endangered and 45See GAO, High-Risk Series: Progress on Many High-Risk Areas, While Substantial Efforts Needed on Others, GAO-17-317 (Washington, D.C.: Feb. 15, 2017). GAO’s high-risk program focuses attention on government operations with greater vulnerabilities to fraud, waste, abuse, and mismanagement or in need of transformation to address economy, efficiency, or effectiveness challenges. The report notes that although significant and positive steps have been taken by Congress and PBGC to strengthen the agency over the past 3 years, concerns related to the multiemployer program and challenges related to PBGC’s funding structure and governance persist. The report states that PBGC’s financial future remains uncertain. 46See Pub. L. No. 96-364, §§ 104 and 304, 94 Stat. 1208, 1217, and 1293-94. 47Withdrawal liability payments are intended to prevent employers from abandoning a plan without paying a share of the unfunded liability and to help protect participants and employers who continue to participate in the plan. See 29 U.S.C. §§ 1382 and 1391. 48See Pub. L. No. 109-280, 120 Stat. 780. 49See 26 U.S.C. § 432(a).
Key Amendments to ERISA Affecting Multiemployer Plans

Page 21 GAO-18-106 Central States Pension Fund Investments
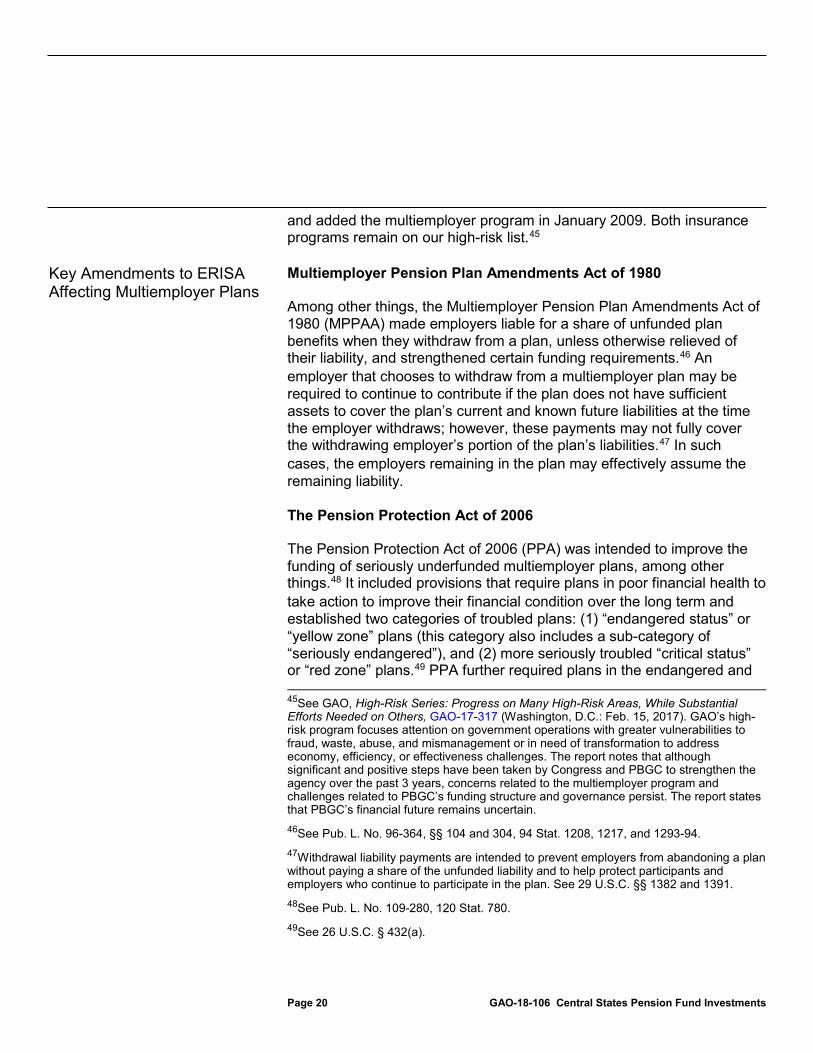
critical zones to develop written plans to improve their financial condition, such as by revising benefit structures, increasing contributions, or both, within a prescribed time frame.50 Multiemployer plans in yellow or red zone status must document their remediation strategies in a written plan, notify plan participants, and report annually on whether scheduled progress has been made.51 Since the 2008 market decline, the number of participants in endangered and critical plans has generally been decreasing (see fig. 4).
50While ERISA generally prohibits reductions in accrued, vested benefits (see 26 U.S.C. § 411(b)), after PPA, plans in critical status were allowed to reduce or eliminate early retirement subsidies and other “adjustable benefits” to help improve their funded status. PPA also amended ERISA to provide relief to employers with plans in critical status from liability for minimum required contributions and excise taxes, if the employer has adopted a rehabilitation plan and is in compliance with that plan. 51Plan trustees can offer bargaining parties multiple schedules of remediation actions from which to choose, but one must be designated as the “default schedule,” which is to be imposed if the parties do not select a schedule within a specified time frame.

Page 22 GAO-18-106 Central States Pension Fund Investments
Figure 4: Multiemployer Retirement Plan Participants by Zone Status, 2009–2014
Note: PBGC’s most recently published data analyze Form 5500 filings through 2014 and cover more than 1,400 plans and 10 million participants. A prominent actuarial consulting firm for multiemployer plans reported more recent summary information for over 375 plans covering 3.8 million participants with combined assets of nearly $185 billion as of spring 2016. Among all client plans with zone certification filing deadlines between April 1, 2015 and March 31, 2016, 64 percent were not in risk status, 11 percent were endangered, and 25 percent were in critical status. The firm reported its review of previous results for its clients and Form 5500 reports for all multiemployer plans indicated its clients’ zone status are representative of the universe as a whole.
The Multiemployer Pension Reform Act of 2014
In response to the funding crisis facing PBGC and multiemployer pension plans, the Multiemployer Pension Reform Act of 2014 (MPRA) made changes to the multiemployer system that were intended to improve its financial condition.52 Key changes included:
• Creation of critical and declining status. MPRA created a new category, “critical and declining,” for plans in critical status projected to become insolvent during the current plan year or within any of the 14 succeeding plan years, or in certain circumstances, within any of the
52See Pub. L. No. 113-235, div. O, 128 Stat. 2130, 2773-822.

Page 23 GAO-18-106 Central States Pension Fund Investments
19 succeeding plan years.53 In 2017, PBGC reported that more than 100 multiemployer plans (more than 7 percent of plans) representing approximately 1 million participants (about 10 percent of participants) have been determined to be “critical and declining.”54
• Permitted reduction of accrued benefits. MPRA permits plans to reduce participants’ and beneficiaries’ accrued retirement benefits if the plan can demonstrate such action is necessary to remain solvent. Plans apply to Treasury for the authority to reduce benefits. Treasury, in consultation with PBGC and DOL, reviews the applications and determines whether the proposed changes would enable the plan to remain solvent.55
• Increased PBGC premiums. MPRA also increased the PBGC premiums for multiemployer plans from $12 to $26 (per participant per plan year) in 2015 and from $26 to $28 in plan year 2017. The annual premium in subsequent years is indexed to changes in the national average wage index.
• Creation of new framework of rules for partition. Partition allows a multiemployer plan to split into two plans—the original and a successor. Partitions are intended to relieve stress on the original plan by transferring the benefits of some participants to a successor plan funded by PBGC and to help retain participant benefits in the plans at levels higher than the PBGC-guaranteed levels.
53See § 201(a)(2), (b)(2), 128 Stat. at 2798, 2810 (codified at 29 U.S.C. § 1085(b) and 26 U.S.C. § 432(b)). Specifically, the plan actuary must certify to Treasury and the plan sponsor that the plan is in critical status for the plan year. Under ERISA, if a multiemployer pension plan is determined to be in critical status (a plan in critical and declining status is considered to be a plan in critical status) or endangered status, the plan sponsor must provide notice of this status to participants, beneficiaries, the bargaining parties, PBGC, and DOL. If a plan is critical and declining, the plan sponsor may file an application with the Secretary of the Treasury requesting a temporary or permanent reduction of benefits to keep the plan from becoming insolvent. Pension plans in critical and endangered status are required to adopt a plan aimed at restoring the financial health of the pension plan. 54PBGC, FY2016 PBGC Projections Report. 55If Treasury approves a plan’s application, the proposed benefit reductions are subject to a vote by all plan participants. If a majority of participants vote to reject the proposed reductions and Treasury determines that the plan is a “systemically important” plan (one for which PBGC projects the present value of financial assistance payments to the plan will exceed $1 billion (indexed to inflation) if the reductions are not implemented), the Secretary of the Treasury shall permit reductions to occur.
Page 24 GAO-18-106 Central States Pension Fund Investments
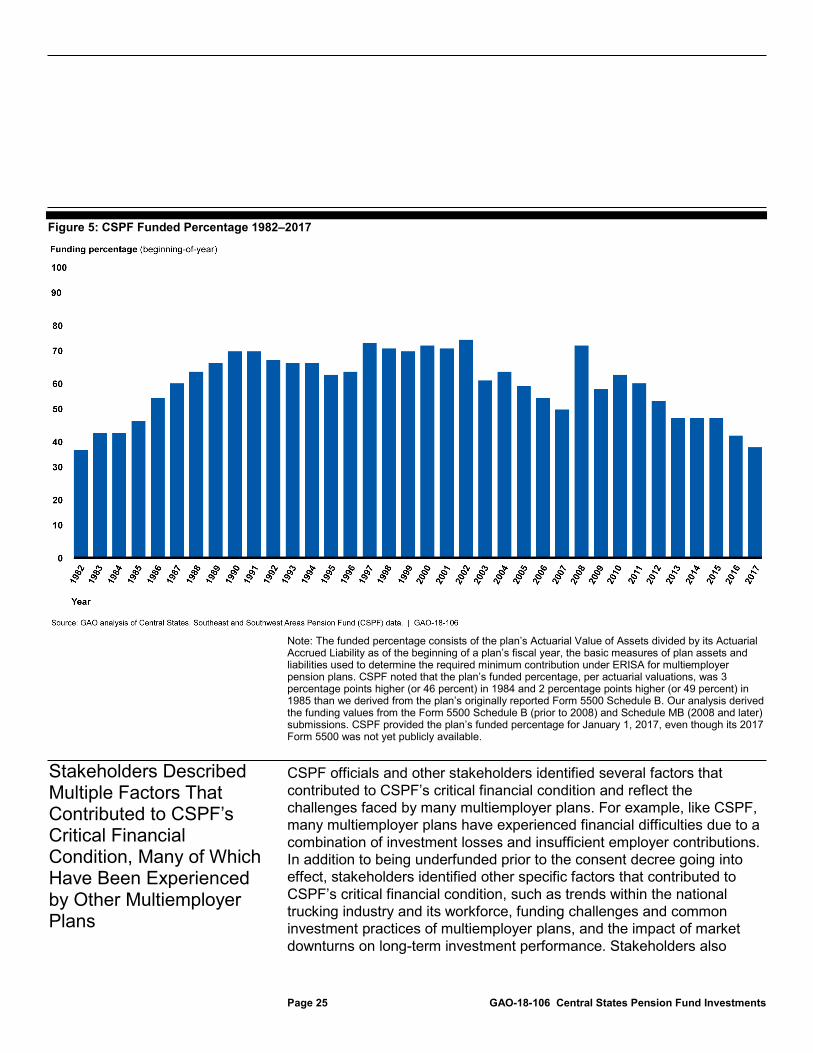
At the time the consent decree was established in 1982, CSPF had less than half the estimated funds needed to cover plan liabilities (and to pay associated benefits over the lifetime of participants) and it has not attained 100 percent of its estimated funding need since then, according to regulatory filings. CSPF’s 1982 Form 5500 we reviewed shows that the plan was less than 40 percent funded prior to the consent decree becoming effective. Over the next two decades, the plan generally made progress toward achieving its targeted level of funding but was never more than 75 percent funded, and funding has generally deteriorated since its 2002 filing (see fig. 5).56 Overall, the plan’s unfunded liability increased by approximately $11.2 billion (in inflation-adjusted dollars) between January 1983 and January 2016.57 As a consequence, participant benefits were never fully secured by plan assets over this period, as measured by ERISA’s minimum funding standards, and the plan consistently needed to collect contributions in excess of those needed to fund new benefit accruals to try to make up for its underfunded status. 56The historical funded percentages for each year were calculated as the plan’s Actuarial Value of Assets divided by its Actuarial Accrued Liability as of the beginning of the year. The Actuarial Value of Assets and Actuarial Accrued Liability were the basic measures of plan assets and liabilities used to determine the required minimum level of funding during those years. 57CSPF reported a $9.8 billion Actuarial Accrued Liability and a $4.2 billion Actuarial Value of Assets as of January 1, 1983, or $5.6 billion in underfunding by these measures ($11.4 billion when adjusted to January, 2016 for inflation). CSPF also reported a $39.0 billion Actuarial Accrued Liability and a $16.4 billion Actuarial Value of Assets, or $22.6 billion in underfunding, as of January 1, 2016.
CSPF’s Critical Financial Condition Is a Result of Factors That Reflect Challenges Experienced by the Multiemployer System
CSPF Has Been Underfunded Since the Consent Decree Was Established
Page 25 GAO-18-106 Central States Pension Fund Investments
Figure 5: CSPF Funded Percentage 1982–2017
Note: The funded percentage consists of the plan’s Actuarial Value of Assets divided by its Actuarial Accrued Liability as of the beginning of a plan’s fiscal year, the basic measures of plan assets and liabilities used to determine the required minimum contribution under ERISA for multiemployer pension plans. CSPF noted that the plan’s funded percentage, per actuarial valuations, was 3 percentage points higher (or 46 percent) in 1984 and 2 percentage points higher (or 49 percent) in 1985 than we derived from the plan’s originally reported Form 5500 Schedule B. Our analysis derived the funding values from the Form 5500 Schedule B (prior to 2008) and Schedule MB (2008 and later) submissions. CSPF provided the plan’s funded percentage for January 1, 2017, even though its 2017 Form 5500 was not yet publicly available.
CSPF officials and other stakeholders identified several factors that contributed to CSPF’s critical financial condition and reflect the challenges faced by many multiemployer plans. For example, like CSPF, many multiemployer plans have experienced financial difficulties due to a combination of investment losses and insufficient employer contributions. In addition to being underfunded prior to the consent decree going into effect, stakeholders identified other specific factors that contributed to CSPF’s critical financial condition, such as trends within the national trucking industry and its workforce, funding challenges and common investment practices of multiemployer plans, and the impact of market downturns on long-term investment performance. Stakeholders also
Stakeholders Described Multiple Factors That Contributed to CSPF’s Critical Financial Condition, Many of Which Have Been Experienced by Other Multiemployer Plans

Page 26 GAO-18-106 Central States Pension Fund Investments
described the effects of the 2007 withdrawal of a key employer, United Parcel Service (UPS), on CSPF’s critical financial condition.
Stakeholders we interviewed said changes to the workforce, such as declining union membership rates and changes resulting from industry deregulation, affected CSPF and some other multiemployer plans by reducing the number of workers able to participate in their plans.58 While the multiemployer structure distributes bankruptcy risk across many employers, for any particular multiemployer plan employers are often concentrated in the same industry, making the plans vulnerable to industry- specific trends and risks. For example, stakeholders noted the impact that the Motor Carrier Act of 1980 had on the trucking industry. Specifically, deregulation of the trucking industry reduced government oversight and regulation over interstate trucking shipping rates. The trucking industry became increasingly dominated by nonunion trucking companies resulting in the bankruptcy of many unionized trucking companies, according to stakeholders. New trucking companies typically did not join multiemployer plans because their labor force was not unionized and this, coupled with the bankruptcy of many contributing employers, contributed to a decrease in active participant populations for many plans serving the industry. As the total number of active participants in a plan declines, the resources from which to collect employer contributions declines proportionally.59 Stakeholders also said these changes were unforeseeable. Limitations on a plan’s ability to increase contributions mean that a plan has less capacity to recover from an underfunded position or to make up for investment returns that fall short of expectations.
A decline in the number of active workers can also accelerate plan “maturity,” as measured by the ratio of nonworking to working
58Union membership has declined generally across the labor force. According to data from the Bureau of Labor Statistics (BLS), union membership accounted for 6.5 percent of the U.S. private-sector labor force in 2017. In contrast, in 1990, union membership accounted for about 12 percent, and in 1980, about 19 percent. 59A decline in the number of active participants results in a decline in employer contributions unless the amount of contributions per active worker can be increased enough to offset the impact of the decline in the number of active participants. As noted later in this section, in the case of CSPF, plan officials told us that they could not significantly increase the contribution rate because of the financial hardship it would cause for employers remaining in the plan. For more information, see Center for Retirement Research at Boston College, The Financial Status of Private Sector Multiemployer Pension Plans, September. 2014.
Key Industry Specific Workforce Trends

Page 27 GAO-18-106 Central States Pension Fund Investments
participants.60 Plan maturity has implications for a plan’s investment practices and the time frame over which the plan must be funded. According to PBGC’s data for the multiemployer plans it insures, there were approximately three active participants for every nonworking participant in 1980 (3:1); by 2014, the ratio was approximately one active worker for every two nonworking participants (1:2). Figure 6 shows the change in the percentages of active and nonworking participants for the multiemployer plans that PBGC insures.
60Mature plans have relatively few active, working participants, which is why they have limited ability to draw higher contributions. Nonworking participants include both retired participants receiving benefits and separated vested participants not yet receiving benefits. For the ratios and percentages cited in this report, working participants will be referred to as “active” participants and retired and separated participants will be referred to as “nonworking” participants. Plan maturity is a general concept that can be measured in various specific ways for purposes of comparing plan maturity over time or plan maturity across plans. Other ways of measuring maturity include the ratio of active participants to participants in pay status, and the ratio of retiree liability to total plan liability; we use this latter metric when we look at investment returns across plans later in this report.

Page 28 GAO-18-106 Central States Pension Fund Investments
Figure 6: Percent of Active and Nonworking Participants in PBGC-Insured Multiemployer Plans, 1980–2014
CSPF saw an even more dramatic change in its active to nonworking participant ratio from 1982 through 2015. In 1982, there were more than two active workers for every nonworking participant (2:1) and by 2016 that ratio had fallen to approximately one active worker for every five nonworking participants (1:5) (see fig. 7). Because CSPF’s contributing employers were largely trucking companies, stakeholders said this made the fund especially vulnerable to industry-wide shocks. Like the industry as a whole, CSPF was unable to attract new employers to replace exiting employers, in part because of the lack of new unionized employers.

Page 29 GAO-18-106 Central States Pension Fund Investments
Figure 7: CSPF Percent of Active and Nonworking Participants, 1982–2016
CSPF officials said that changes to the trucking industry and its workforce also led to other challenges for the plan. For example, contributions to the plan declined with the shrinking number of active workers. CSPF officials told us they could not significantly increase the contribution rate paid by remaining employers because of the financial hardship it would cause, and as a result, the plan’s ability to recover from its underfunded position was limited. CSPF officials said that this increased the plan’s reliance on investment returns to try to close the gap between its assets and liabilities.
Stakeholders we interviewed cited challenges inherent in multiemployer plans’ funding and investment practices, and described how the
Funding Challenges and Investment Practices

Page 30 GAO-18-106 Central States Pension Fund Investments
challenges may have contributed to the critical financial condition of some plans, including CSPF.61
Employer Withdrawals
Stakeholders said that CSPF and many other multiemployer plans have been challenged by employer withdrawals. An employer withdrawal reduces the plan’s number of active worker participants, thereby reducing its contribution base and accelerating plan maturity. A withdrawing employer generally must pay a share of any unfunded benefits. Stakeholders identified several ways in which the withdrawal liability framework could result in a withdrawing employer underpaying its share of an unfunded liability.62 We have previously reported on the challenges associated with withdrawal liability, including:
• withdrawal liability assessments are often paid over time, and payment amounts are based on prior contribution rates rather than the employer’s actual withdrawal liability assessment.
• withdrawal liability payments are subject to a 20-year cap, regardless of whether an employer’s share of unfunded benefits has been fully paid within this 20-year timeframe;
• plans often did not collect some or all of the scheduled withdrawal liability payments because employers went bankrupt before completing their scheduled payments; and
• fears of withdrawal liability exposure increasing over time could be an incentive for participating employers to leave a plan and a disincentive for new employers to join a plan;
61In addition to the factors listed here, stakeholders provided examples of other factors that had an impact on some multiemployer plans but not CSPF. For example, stakeholders said that some plans increased benefits when asset valuations were high to avoid the penalties for exceeding statutory deductible limits on plan contributions. However, the benefit increases became unfunded liabilities when asset valuations receded. When asked, CSPF officials were not aware of being at risk of exceeding the maximum deductible limits and did not believe this factor to have been relevant for CSPF. 62Withdrawal liability payments are intended to prevent employers from abandoning a plan without paying a share of the unfunded liability and to help protect participants and employers who continue to participate in the plan. ERISA provides a framework for calculating withdrawal liability shares. For more information on how withdrawal liability is calculated, see GAO, Private Pensions: Timely Action Needed to Address Impending Multiemployer Plan Insolvencies, GAO-13-240 (Washington, D.C.: March 28, 2013).
Page 31 GAO-18-106 Central States Pension Fund Investments
Stakeholders we interviewed also added that the calculation used to determine withdrawal liability may use an investment return assumption that inherently transfers risk to the plan.63
When exiting employers do not pay their share of unfunded benefits, any remaining and future employers participating in the plan may effectively assume the unpaid share as a part of their own potential withdrawal liability as well as responsibility for the exiting employer’s “orphaned” participants.64 Participating employers may negotiate a withdrawal if they perceive a risk that the value of their potential withdrawal liability might grow significantly over time.65
In its MPRA application, CSPF cited employer withdrawals and bankruptcies as a significant challenge for the plan. CSPF reported that after deregulation, the number of contributing employers dropped by over 70 percent. While some of the drop could be due to the consolidation of trucking companies after deregulation, CSPF officials cited several cases in which employers went bankrupt or withdrew from the plan, which reduced the plan’s contribution base and accelerated its maturity. Additionally, when employers went bankrupt, they often did not pay their full withdrawal liability. For example, CSPF said two of its major contributing employers left the plan between 2001 and 2003, and left $290 million of more than $403 million in withdrawal liability unpaid after they went bankrupt.
Funding Time Frames
Stakeholders identified funding timeframes as a factor that contributed to the challenges facing many multiemployer plans, including CSPF. ERISA’s minimum funding standards have historically allowed multiemployer plans to amortize, or spread out the period of time for funding certain events, such as investment shortfalls and benefit improvements. For example, CSPF began a 40-year amortization of 63To the extent that an employer’s withdrawal liability was calculated using an assumption about future investment returns, the plan—not the withdrawn employer–-is liable for any future investment shortfalls. 64Orphaned participants are generally those whose employers or former employers no longer contribute to the plan. 65Mazo, Judith F. and Eli Greenblum “Multiemployer Pension Plans Respond to the Financial Crisis.” Reshaping Retirement Security: Lessons from the Global Financial Crisis (2012), 188-213.

Page 32 GAO-18-106 Central States Pension Fund Investments
approximately $6.1 billion in underfunding on January 1, 1981, giving the plan until the end of 2021 to fully fund that amount. Longer amortization periods increase the risk of plan underfunding due to the number and magnitude of changes in the plan’s environment that may occur, such as a general decline in participants or deregulation of an industry. The Pension Protection Act of 2006 shortened amortization periods for single-employer plans to 7 years and the amortization periods for multiemployer plans to 15 years.66 Shorter amortization periods provide greater benefit security to plan participants by reducing an unfunded liability more rapidly. In addition, shorter amortization periods can be better aligned with the projected timing of benefit payments for a mature plan. However, shorter periods can be a source of hardship for plans with financially troubled contributing employers because they may require higher contributions. According to CSPF officials, CSPF requested and received an additional 10-year amortization extension from the IRS in 2005 after relating that contribution requirements could force participating employers into bankruptcy. One CSPF representative said an amortization extension can also help avoid subjecting the plan’s employers to IRS excise taxes for failing to make required minimum contributions.67
Investment Practices
Stakeholders we interviewed said that certain common investment practices may have played a role in the critical financial condition of CSPF and other mature and declining plans. In general, multiemployer plans invest in portfolios that are expected, on average, to produce higher returns than a low-risk portfolio, such as one composed entirely of U.S. Treasury securities. Stakeholders also stated that these investment practices may have been too risky because returns can be more volatile, and the higher expected returns might not be achieved. In addition, the Congressional Budget Office has reported that if “plans had been required to fund their benefit liabilities—at the time those liabilities were accrued—with safer investments, such as bonds, the underfunding of 66Plans can request extensions, as they could prior to PPA. Also, following the economic downturn in 2008, the Pension Relief Act of 2010 allowed plans that met a special solvency test to amortize investment losses incurred in either or both of the first 2 plan years ending after August 31, 2008 to be amortized over 29 years. 67If a multiemployer plan fails to meet minimum funding requirements, employers could owe a tax of 5 percent of the accumulated funding deficiency or shortfall in minimum required contributions. Additional taxes may be imposed if the funding deficiency remains uncorrected. 26 U.S.C. § 4971. This tax could be significant for employers participating in a plan with a large funding deficiency.

Page 33 GAO-18-106 Central States Pension Fund Investments
multiemployer plans would have been far less significant and would pose less risk to PBGC and beneficiaries.”68
Stakeholders also told us that for mature plans like CSPF, these investment practices can pose further challenges. Mature plans, with fewer active employees, have less ability to recoup losses through increased contributions and have less time to recoup losses through investment returns before benefits must be paid. Market corrections, such as those that occurred in 2001 through 2002 and in 2008, can be particularly challenging to mature plans and their participants, especially if a mature plan is also significantly underfunded. Mature plans could mitigate these risks by investing more conservatively, however, the resulting lower expected returns from more conservative investing necessitates higher funding targets and contribution rates, which could be a hardship for employers in an industry with struggling employers. Alternatively, a plan that invests more conservatively may provide lower promised benefits to accommodate the level of contributions it can collect. Lower investment returns from a more conservative investment policy would cost employers more in contributions and could potentially result in employers leaving the plan. Further, investing in a conservative portfolio would be relatively unique among multiemployer plans, and stakeholders said plan managers may feel they are acting in a prudent fashion by investing similarly to their peers. Underfunded plans like CSPF may not see conservative investment as an option if they cannot raise the contributions necessary to fully fund their vested benefits. Officials from CSPF told us that, because they lacked the ability to significantly increase revenue or decrease accrued benefits, the named fiduciaries sought incrementally higher investment returns to meet funding thresholds required by the amortization extension they received in 2005.
On the other hand, there are challenges associated with risk bearing investments. In our prior work, we reported that multiemployer plans generally develop an assumed average rate of investment return and use that assumption to determine funding targets, required contributions, and the potential cost of benefit improvements.69 Experts we interviewed for that report told us that using a portfolio’s expected return to value the cost of benefits increases the risk that insufficient assets could be on hand
68Congressional Budget Office; Options to Improve the Financial Condition of the Pension Benefit Guaranty Corporation’s Multiemployer Program (August 2016). 69See GAO-14-264.

Page 34 GAO-18-106 Central States Pension Fund Investments
when needed. They also told us that using the portfolio’s expected return to calculate liabilities could incentivize plans to invest in riskier assets and to negotiate higher benefit levels because the higher returns expected from riskier portfolios can result in lower reported liabilities.
Plan Terms Set through Collective Bargaining
Stakeholders we interviewed said that plan terms, such as contribution rates, which are set through the collective bargaining process, can create an additional challenge for multiemployer plans.70 Employers in multiemployer plans generally are not required to contribute beyond what they have agreed to in collective bargaining, and these required employer contributions generally do not change during the term of a collective bargaining agreement.71 CSPF officials said that up until the early 2000s, plan officials did not request modifications to collective bargaining agreements, such as reallocating contribution dollars, to respond to adverse investment returns.72
Stakeholders highlighted the effects of market downturns on multiemployer plan assets as another contributing factor to CSPF’s critical financial condition and that of other multiemployer plans. Failure to achieve assumed returns has the effect of increasing unfunded liabilities. For the multiemployer system in aggregate, the average annual return on
70Unlike plans sponsored by single employers (with or without unionized participants), contributions to multiemployer plans are set in collective bargaining, typically as a certain amount of money per employee hour worked. Projected contributions thus become a function of the amount of expected business activity by participating employers for the duration of their contracts. If economic conditions change, future contributions could be greater or less than projected, with potential corresponding effects for plan provisions such as the negotiated level of future benefit accruals. 71Mazo, Judith F. and Eli Greenblum “Multiemployer Pension Plans Respond to the Financial Crisis.” Reshaping Retirement Security (2012), 188-213. 72CSPF officials said they have increased contribution rate requirements in certain instances since 2000. For example, in order to submit a rehabilitation plan pursuant to PPA, CSPF was required to demonstrate that it took reasonable measures to postpone insolvency, including increasing contribution rates.
Investment Performance and Market Downturns

Page 35 GAO-18-106 Central States Pension Fund Investments
plan assets over the 2002 to 2014 period was about 6.1 percent, well short of typical assumed returns of 7.0 or 7.5 percent in 2002.73
Many multiemployer plans were especially impacted by the 2008 market downturn. PBGC estimated that from 2007 to 2009, the value of all multiemployer plan assets fell by approximately 24 percent, or $103 billion, after accounting for contributions to and payments from the plans.74 Although asset values recovered to some extent after 2009, some plans continued to be significantly underfunded, and stakeholders said this could be due to the contribution base not being sufficient to help recover from investment shortfalls.
CSPF’s investment performance since 2000 has reflected performance similar to other multiemployer plans and the plan went from 73 percent funded in 2000 to about 38 percent funded in 2017. While the plan used an assumed rate of return of 7.5 to 8.0 percent per year between 2000 and 2014, our analysis of the plan’s regulatory filings shows that the plan’s weighted-average investment return over this period was about 4.9
73The market downturn that occurred during 2001-2002 is often referred to as the “bursting of the dot-com bubble,” and coincided with a downturn in the U.S. economy. The market downturn in 2008 occurred during a period known as the Great Recession, which involved a sharp decline in economic activity throughout the United States. The 6.1 percent annual average return is a cash flow weighted calculation in which we used aggregate statistics disclosed in the DOL’s historical Private Pension Plan Bulletins, which summarize Form 5500 filings from multiemployer plans. We calculated this return from 2002 to 2014 rather than from 2000 to 2014 because of data limitations affecting data for 2000 to 2001. CSPF’s cash-flow-weighted return over this period was approximately 6.5 percent, while its return for the longer 2000 to 2014 period is discussed later in this section. The typical assumed rates were based on a summary of assumptions disclosed in multiemployer plan filings for the 2002 plan year. Of 1,407 plans that disclosed an expected return assumption, 359 used a 7.0 percent assumption, 621 used a 7.5 percent assumption, and 170 used an 8.0 percent assumption. Prior research by PBGC showed that plans with larger benefit liabilities tended to use higher expected return assumptions. Also, our analyses of investment returns extend through 2014 because it was the most current data available at the time of our analysis. 74PBGC estimated that the vested benefit liabilities of multiemployer plans increased $51 billion over the same time period. PBGC estimates were based on Form 5500 filings for plans that PBGC insures. Liabilities were adjusted to reflect the cost of purchasing an annuity at the beginning of the relevant year, and typically differ from the liabilities that multiemployer plans use to determine their minimum funding requirements.

Page 36 GAO-18-106 Central States Pension Fund Investments
percent per year.75 CSPF officials said the 2008 downturn significantly reduced CSPF’s assets and it was unable to sufficiently recoup those losses when the market rebounded in 2009. Plan assets declined from $26.8 billion at the beginning of 2008 to $17.4 billion at the beginning of 2009, with $7.5 billion of the decline attributable to investment losses. Despite reporting a 26 percent return on assets during 2009, CSPF had only $19.5 billion in assets at the end of 2009 because benefits and expenses exceeded the contributions it collected and because it had fewer assets generating returns for the plan. By the end of 2009, CSPF’s funding target was $35.9 billion but the fund had less than $20 billion that could be used to generate investment returns.76 If CSPF’s portfolio had returned 7.5 percent per year over the 2000-2014 period, instead of the approximately 4.9 percent we calculated, we estimate that the portfolio value would have exceeded $32.0 billion at the end of 2014, or 91 percent of its Actuarial Accrued Liability.77
In addition to the factors mentioned that affected many multiemployer plans, stakeholders we interviewed also noted the unique effect of the UPS withdrawal on CSPF. In 2007, UPS negotiated with the International Brotherhood of Teamsters for a withdrawal from CSPF and paid a
75The 4.9 percent annual average return is a cash-flow-weighted calculation based on data disclosed in CSPF’s Form 5500 filings. Using the same data and methodology, the return over the 2000 to 2007 period was approximately 5.6 percent and the return over the 2008 to 2014 period was approximately 3.9 percent. As specified earlier, the cash-flow-weighted return over the 2002 to 2014 period was approximately 6.5 percent. See “Calculation of Average Investment Return over Multiple Years” in Appendix I for a discussion of cash-flow-weighted versus time-weighted average returns. 76This funding target was for purposes of determining the plan’s s minimum required contributions under ERISA. 77This estimate of a 91 percent funded percentage if the portfolio had returned 7.5 percent in each year over the 2000-2014 period is a hypothetical estimate assuming no other changes in cash flows into or out of the plan. In reality, higher returns may have resulted in different amounts of contributions into the plan, promised benefit levels, amounts of withdrawal liability assessments, and numbers of employers withdrawing from the plan or joining the plan. In addition, a 91 percent funded percentage would not necessarily have meant that plan benefits would have been secure, since the plan would still be a mature plan and the 91 percent measure is based on continued exposure to significant market risk. It is also worth noting that, due to the effect of net cash flows out of the plan, the funded percentage would differ if returns fluctuated over this period and merely averaged 7.5% on a time-weighted basis. See “Calculation of Average Investment Return over Multiple Years” in Appendix I for a discussion of cash-flow-weighted versus time-weighted average returns.
Effect of UPS Withdrawal

Page 37 GAO-18-106 Central States Pension Fund Investments
withdrawal liability payment of $6.1 billion.78 This payment was invested just prior to the 2008 market downturn. Moreover, the loss of UPS, CSPF’s largest contributing employer, reduced the plan’s ability to collect needed contributions if the plan became more underfunded. A UPS official said that, following the market decline of 2001-2002, the company considered whether it should withdraw from all multiemployer plans because it did not want to be the sole contributing employer in any plan.79 According to this official, UPS considered the large number of UPS employees in CSPF and the plan’s demographics—such as an older population and fewer employers—in its decision to withdraw. CSPF officials said they did not want UPS to withdraw because its annual contributions accounted for about one-third of all contributions to the plan. CSPF officials also told us that, prior to the UPS withdrawal, they had expected the population of active UPS workers in the plan to grow over time.80
UPS’ withdrawal of 30 percent of CSPF’s active workers, in combination with the significant market downturn just after UPS withdrew, reflected the loss of working members and investment challenges on a large scale. Additionally, stakeholders noted that although each of the factors that contributed to CSPF’s critical financial condition individually is important, their interrelated nature also had a cumulative effect on the plan. Industry deregulation, declines in collective bargaining, and the plan’s significantly underfunded financial condition all impaired CSPF’s ability to maintain a population of active workers sufficient to supply its need for contributions when investment shortfalls developed. Given historical rules for plan funding and industry stresses, CSPF was unable to capture adequate funding from participating employers either before or after they withdrew from the plan. The plan’s financial condition was further impaired when long-term investment performance fell short of expectations. For an underfunded, mature plan such as CSPF, the cumulative effect of these factors was described by some stakeholders as too much for CSPF to overcome.
78This withdrawal liability was paid as a single lump sum, rather than as a series of annual payments. 79According to a UPS official, in 1997, UPS attempted to withdraw from all Teamster multiemployer plans; however, after a 2-week strike, it renegotiated to stay in those plans. 80In December 2017, another large employer, Kroger Co. withdrew from CSPF. According to CSPF officials, the infusion of the resulting withdrawal liability payment will extend the solvency of the plan by a few months.

Page 38 GAO-18-106 Central States Pension Fund Investments
There have been three distinct periods related to CSPF’s investment policy after the original consent decree took effect:
• the early period, from the consent decree’s effective date in September 1982 through October 1993, during which named fiduciaries set different investment policies and sold many of CSPF’s troubled assets—mostly real estate;
• a middle period from November 1993 through early 2017, during which CSPF’s investment policies were consistently weighted towards equities and its asset allocation varied, with notable equity allocation increases occurring from year-ends 1993-1995 and 2000-2002; and
• the current period, starting in January 2017, during which named fiduciaries and CSPF trustees are moving assets into fixed income ahead of insolvency.
Appendix I has a detailed timeline that includes changes to CSPF’s investment policies since the consent decree was established in 1982.
The original consent decree placed exclusive responsibility for controlling and managing the plan’s assets with an independent asset manager, called a named fiduciary.81 Additionally, the original consent decree prohibited CSPF trustees from managing assets or making investment decisions and gave a single named fiduciary the authority to set and
81Under the consent decree, the named fiduciary must qualify as a “named fiduciary” as defined in section 402(a)(2) of ERISA and an investment manager under ERISA section 3(38). 29 U.S.C. §§ 1102(a) and 1002(38). The consent decree provides additional requirements for named fiduciaries that are banks, insurance companies, or certain investment advisers, including ranking among the 25 largest banks, insurance companies, or investment advisers in the United States and having at least 10 years of experience managing investments.
CSPF’s Investment Policy Since 1982 Generally Increased Allocation to Equities, but Shifted Toward Fixed Income in 2017, Ahead of Projected Insolvency
Early Period: September 1982–October 1993

Page 39 GAO-18-106 Central States Pension Fund Investments
change the plan’s investment objectives and policies, subject to court approval (see fig. 8).82
82CSPF trustees selected and oversaw named fiduciaries. The consent decree required that named fiduciaries consult with plan trustees and give appropriate regard to the plan’s actuarial requirements in setting investment objectives and policies. Named fiduciaries were responsible for writing investment policy statements, allocating the assets under their control among different types of investments and investment managers, and appointing, overseeing, and replacing those investment managers as needed. Although named fiduciaries had responsibility and authority to monitor the investment performance of the assets allocated to them that did not diminish the obligations of the trustees under ERISA, including the obligation to monitor the performance of the plan’s assets. The consent decree did not require that the named fiduciary manage assets held in reserve for payment of benefits and administrative expenses, but laid out specific requirements for the management of those assets. When applicable, assets held to pay benefits and administrative expenses were not included in any of the asset allocation totals we present in this report. These requirements remain a part of the consent decree today. See appendix I for more information on our methodology for summarizing CSPF’s assets.

Page 40 GAO-18-106 Central States Pension Fund Investments
Figure 8: Named Fiduciaries Set Investment Objectives and Control CSPF Assets under the Consent Decree
aTo fulfill their responsibilities, CSPF trustees said they rely on CSPF staff and investment consultants. CSPF staff said they monitor and benchmark performance and fees for named fiduciary and investment management services on a regular basis. In addition, since 1983, the trustees have engaged formal and informal investment consultants to advise them on a range of investment matters including selecting named fiduciaries and evaluating the plan’s asset allocation. bIn general, multiemployer pension plans formally state policy details, such as broad allocation targets, in an investment policy statement. In addition to setting a target asset allocation, investment policy statements may include constraints on the asset classes in which the plan may invest. The actual asset allocation will rarely match a specific target at a given point in time due to valuation challenges and fluctuations in the market value of assets. For more information, see Russell

Page 41 GAO-18-106 Central States Pension Fund Investments
Investments Group, LLC, Elements of a clearly defined investment policy statement for multi-employer plans, (Seattle, Washington: August 2016).
During this period, two successive named fiduciaries—first Equitable Life Assurance Society of the United States (Equitable) and then Morgan Stanley—set and executed the plan’s investment objectives using similar investment philosophies, but differing investment return goals and target asset allocations (see fig. 9).83 Both named fiduciaries planned to sell the plan’s troubled real estate assets from the pre-consent decree era.84 They also limited nonpublicly traded investments to 35 percent of the plan’s assets and set broad allocation targets for new real estate, fixed income, and equity assets. In 1984, Morgan Stanley considered a dedicated bond portfolio in its capacity as the plan’s named fiduciary, but after review, Morgan Stanley decided similar results could be obtained through other investment strategies.85
83At the time of the 1982 consent decree, the investment policy statement written by Equitable governed the plan’s asset allocation. Equitable and Victor Palmieri and Company Incorporated were the fund’s asset managers, managing real estate assets east and west of the Mississippi, respectively. Morgan Stanley was appointed in January 1984 and its new investment policy statement was approved by the court and effective as of April 1984. After Morgan Stanley’s appointment, CSPF retained Equitable and Victor Palmieri and Company Incorporated to continue to manage these real estate assets during a transition period. See GAO/HRD-85-73 for additional details. In this report, we shorten Morgan Stanley’s full name because throughout this named fiduciary’s history with CSPF, various parts of the broader financial entity have been approved to act as named fiduciary. For example, Morgan Stanley Inc., Morgan Stanley Group, Inc., and Morgan Stanley Dean Witter & Co. were all listed in court approvals referencing the named fiduciary. 84In 1982, we reported that the plan’s investment portfolio had already been substantially realigned. There were indications that the plan may have held up to 80 percent of its assets in real estate in the 1970s, but by August 1981, only 21.8 percent of the plan’s assets were invested in real estate and CSPF investment managers planned to continue to dispose of some of its existing real estate assets. See GAO, HRD-82-13. When Morgan Stanley succeeded Equitable as the appointed named fiduciary, it stated that it did not view most of the plan’s real estate assets as “investment-grade assets,” and stated that one of its major objectives would be to divest from the plan’s casino investments as promptly as possible. 85The dedicated bond portfolio would have matched the cash flows of investment assets to projected pension benefit payments, making it more certain that those pension benefits would be paid. According to a 1985 independent special counsel report, the plan’s named fiduciary considered a dedicated bond portfolio because a 1983 lawsuit against the plan suggested such a portfolio as a remedy to the plan’s alleged mismanagement and poor investment decisions prior to the original consent decree.

Page 42 GAO-18-106 Central States Pension Fund Investments
Figure 9: CSPF Investment Policies under Equitable and Morgan Stanley in Early Period after Consent Decree, September 1982–October 1993
Note: After CSPF’s 1982 consent decree took effect, Equitable Life Assurance Society of the United States (Equitable) became the plan’s first independent asset manager, referred to as a named fiduciary. In 1984, Morgan Stanley replaced Equitable. We shortened Morgan Stanley’s full name because throughout this named fiduciary’s history with CSPF, various parts of the broader financial entity have been approved to act as a named fiduciary. aCSPF’s executive director testified to Congress in 2013 that benefit payments to CSPF retirees exceeded employer contributions in every year since 1984. For example, in 1986, benefits and expenses exceeded contributions by $77 million (approximately $147 million in 2016 dollars), which reduced the amount of assets available for investment.
In executing these policies, the plan’s asset allocation varied from year to year.86 Starting in 1987 and in subsequent years during the early period, Morgan Stanley invested a majority of the plan’s assets in fixed income assets—more than half of which were passively managed—and all equity assets were allocated to domestic equity through 1992. By 1989, CSPF officials reported that nearly all troubled real estate assets had been sold and Morgan Stanley’s responsibilities and risk of potential fiduciary
86A distinction can be made between investment policies and actual asset allocation. Investment policies often specify broad asset allocation ranges. A plan could have a relatively stable investment policy with unchanged asset allocation ranges, but also a significantly changing actual asset allocation within the policy. In this section, we present CSPF’s investment policies and actual asset allocations over time.

Page 43 GAO-18-106 Central States Pension Fund Investments
liability were reduced, permitting a concomitant reduction in fees paid to the named fiduciary (see fig. 10).87
Figure 10: CSPF Asset Allocation in Early Period after Consent Decree, 1982–1992
Note: CSPF entered into a federal court-enforceable consent decree in September 1982 and the plan experienced an “early period” after the consent decree through October 1993. Since we have asset allocation data for the end of each year, we only provide those data in this figure through the end of 1992. CSPF’s asset allocation at the end of 1993 is not included in this figure. To compile these asset allocation proportions, we used the aggregate asset allocation categories CSPF’s named fiduciaries assigned in their annual performance reports. Generally, real estate can include direct purchase of properties or investment in vehicles that invest in real estate; cash equivalents include assets that can be converted to cash in a very short period of time; fixed income refers to any type of investment under which the borrower or issuer is obligated to make payments at a defined rate on a defined schedule; and equity indicates ownership in a business, often in the form of common stock. In each of these years, 0.1 percent or less of the plan’s assets were allocated to “other” assets, such as private placements and renewals on insurance contracts.
87As of December 31, 1983, before Morgan Stanley was appointed the plan’s named fiduciary, the plan reported $554 million (approximately $1.2 billion in 2016 dollars) in owned real estate and mortgage loans, which was approximately 12 percent of total plan assets. By the end of 1989, real estate assets totaled $9.5 million (less than 0.1 percent of total plan assets and approximately $16 million in 2016 dollars), almost 96 percent of which was the plan’s headquarters building.

Page 44 GAO-18-106 Central States Pension Fund Investments
During the middle period, CSPF’s investment policy was broad and consistently directed that asset allocations be weighted toward equities.88 In 1993, Morgan Stanley revised its investment policy statement for CSPF to eliminate asset allocation targets for each asset class and instead specified that the plan invest a majority of assets in equity or equity-type securities and no more than 25 percent in nonpublicly traded assets. After 1999, CSPF’s investment policy under other, successive named fiduciaries continued to be broad and generally specified that the plan should invest a majority of assets in equity or equity-type securities.89 Specifically J.P. Morgan’s and Northern Trust’s consecutive investment policies for part of the plan’s assets continued to specify that a majority of the plan’s assets be invested in equity or equity-type securities and no more than 15 percent be invested in nonpublicly traded assets.90 Goldman Sachs’ investment policy for another part of the plan’s assets did not specify asset allocation details but indicated slightly higher tolerance for risk in conjunction with its equity portfolio.91 CSPF trustees
88CSPF’s named fiduciaries during this period generally presented similar investment philosophies and plan characteristics in their investment policy statements. All investment policy statements during the period indicated that named fiduciaries planned to allocate the plan’s assets to achieve high investment returns while taking reasonable risks. 89CSPF officials said that named fiduciary investment policy statements during this period were purposefully broad. For example, they said the plan’s investment policy statements were purposefully written without target asset allocation details to provide flexibility and recognize that the plan would have to obtain court approval for even minor modifications. Instead, named fiduciaries periodically presented asset allocation details to trustees who said they challenged the asset allocations from time to time in accordance with their oversight responsibilities. 90In this report, we shorten J.P. Morgan’s full name from J.P. Morgan Investment Management Inc. We also shorten Northern Trust’s and Goldman Sachs’ full names because throughout these named fiduciaries’ histories with CSPF, various parts of the broader financial entities have been approved to act as named fiduciaries. For example, Northern Trust Corporation, Northern Trust Global Advisors, Inc., and Northern Trust Investments, Inc. were all listed in court approvals referencing the named fiduciary. Similarly, Goldman, Sachs & Co. and Goldman Sachs Asset Management, L.P. were names listed in court approvals referencing the named fiduciary. 91Goldman Sach’s investment policy statement recognized that market value volatility and other manifestations of risk may have been “tolerable given the long duration of the liabilities that [were] funded by the actively managed portion of the [plan’s] portfolio.”
Middle Period: November 1993–January 2017
CSPF’s Investment Policy

Page 45 GAO-18-106 Central States Pension Fund Investments
said that named fiduciaries considered investing in alternative assets, but instead chose to increase the plan’s allocation to equity assets.92
The named fiduciaries’ investment policies did not vary significantly over this period because CSPF officials said that the plan’s overarching investment objective of achieving full funding did not change, even though there were key changes to the plan’s investment management structure during this time period.93 Specifically, starting in 1999, the plan temporarily shifted to a dual named fiduciary structure and increased its use of passively-managed accounts—both described in detail below—changing the named fiduciary structure that had been in place since the original consent decree (see fig. 11).
92To describe CSPF’s asset allocation over time, presented later in the report, we used the aggregate asset allocation categories CSPF’s named fiduciaries assigned in their annual performance reports. In 32 of the 35 years, named fiduciaries reported small percentages of the plan’s assets as “other,” such as global listed infrastructure, renewal on insurance contracts, and “alternative” assets, such as distressed debt and commodities. In eight of those years, the amounts categorized as “other” were greater than 1.5 but less than 5 percent of the plan’s assets. 93While the overarching investment objective of the plan during the period was to achieve full funding, the named fiduciary investment policies all specified steps to achieve high investment returns with reasonable risk.

Page 46 GAO-18-106 Central States Pension Fund Investments
Figure 11: Changes to CSPF’s Named Fiduciary Structure, 1982–2016
Note: The 1982 CSPF consent decree as amended requires an investment manager, appointed by CSPF trustees subject to court approval, to manage the three passively-managed accounts, for which the plan chose Mellon Bank, N.A., or its subsidiary. We shortened the full name of Morgan Stanley, Goldman Sachs, and Northern Trust because throughout these named fiduciaries’ histories with

Page 47 GAO-18-106 Central States Pension Fund Investments
CSPF, various parts of the broader financial entities have been approved to act as named fiduciaries. We also shortened J.P. Morgan Investment Management Inc. in this figure. aThe dual named fiduciary structure was originally effective January 1, 1999. Bankers Trust Company was approved as a second named fiduciary, but on January 29, 1999, Bankers Trust Company submitted its resignation and Morgan Stanley reassumed management of all of the pension plan’s assets. A dual named fiduciary structure was then effective again on or after July 1, 1999, and Goldman Sachs was appointed as the second named fiduciary over “Group B” assets. Goldman Sachs used Morgan Stanley’s investment policy statement through the end of 1999 until September 2000, when it approved its own investment policy statement. In addition, effective February 1, 2000, J.P. Morgan replaced Morgan Stanley as named fiduciary over “Group A” assets. bIn conjunction with the receipt of a $6.1 billion withdrawal liability payment from the United Parcel Service, Inc., CSPF also created the passively-managed domestic equity account in December 2007 and adjusted each named fiduciary’s allocation so they were responsible for the same percent of the plan’s assets. The transfer that equalized each named fiduciary’s allocation was completed on February 1, 2008.
More specifically, the two key changes to the plan’s investment management structure were:
• A temporary shift to a dual named fiduciary structure. Effective in 1999, CSPF proposed and the court approved allocating plan assets between two named fiduciaries instead of one in order to diversify CSPF’s investment approach, among other things.94 Both named fiduciaries were in charge of setting and executing separate policies for plan assets they managed—called “Group A” and “Group B” assets—irrespective of the other named fiduciary’s allocations. During this time, the two named fiduciaries were J.P. Morgan/Northern Trust and Goldman Sachs. Specifically, J.P. Morgan was named fiduciary between 2000 and 2005 and Northern Trust between 2005 and 2007 for “Group A” assets. Goldman Sachs was named fiduciary for “Group B” assets between 2000 and 2010. In 2010, an investment consultant found the performance of two named fiduciaries under the dual named fiduciary structure had been similar and more expensive than it would be under a proposed move back to a single named fiduciary.95 Accordingly, CSPF officials proposed, and the court
94Plan consultants concluded that two named fiduciaries with different styles would be unlikely to perform poorly at the same time. Since the plan’s assets had grown significantly, the job of managing the plan’s assets had greatly increased in scope. One consultant felt that a dual named fiduciary structure would entice qualified investment managers to respond to CSPF’s request for proposals for named fiduciary services because they could be certain at least one new named fiduciary position would be open, which would result in increased competition during the request for proposals process. He also felt it could protect the plan since both named fiduciaries would be experienced and operating, and could take over, with court approval, if the other named fiduciary was terminated or resigned. 95The investment consultant estimated that the plan could save 0.16 percent (or 16 basis points) by moving to a single named fiduciary.

Page 48 GAO-18-106 Central States Pension Fund Investments
approved, consolidation of all assets allocated to named fiduciaries in August 2010, with Northern Trust as the plan’s single named fiduciary.96
• An increased use of passively-managed accounts. Between 2003 and 2010, the portion of assets that named fiduciaries managed declined as the plan moved 50 percent of its assets into three passively-managed accounts.97 Specifically, in 2003, 20 percent of CSPF’s assets were transitioned into a passively-managed domestic fixed income account to lower the plan’s investment management fees. In addition, both of the named fiduciaries reported that they had not outperformed the industry index for the domestic fixed income assets they managed after they were approved as named fiduciaries in 1999 and 2000 through February 2003.98 Similarly, in 2007 and 2010, CSPF officials said that two more passively-managed accounts were created to further reduce plan fees. Specifically, in 2007, 20 percent of plan assets were moved into a passively-managed domestic equity account. Then, in 2010, an additional 10 percent of the plan’s assets were allocated to passively-managed accounts—5 percent were allocated to a new passively-managed international equity account and 5 percent were added to the passively-managed domestic equity account.99
96Northern Trust’s 2005 investment policy statement pertained to “Group A” assets, but when the plan reverted back to a single named fiduciary in 2010 this 2005 investment policy statement continued to cover all assets allocated to Northern Trust. 97CSPF trustees petitioned the court to amend the consent decree in 2003, 2007, and 2010 to add three passive index accounts, referred to in this report as passively-managed accounts. In each instance, DOL reviewed and did not object to CSPF’s proposed changes. 98In 2003, this index was the Lehman Brothers Aggregate Bond Index, but has been recently renamed as the Bloomberg Barclays US Aggregate Bond Index. In a presentation to the trustees in 2003, CSPF reported that both named fiduciaries presented convincing arguments that active investment management was appropriate for all asset classes except domestic fixed income, for which they demonstrated that even the best active domestic fixed income managers added little value over the index, even over an extended period of time. 99The objective of each of CSPF’s passively-managed accounts was generally to match the return of a specific index, such as the Standard & Poor’s 500 Index, rather than exceed it. The passively-managed domestic fixed income account was to be invested in a representative sample of the investments held in the relevant index. The passively-managed domestic and international equity accounts were to replicate the index—or to hold each security of the relevant index in the same index weight.

Page 49 GAO-18-106 Central States Pension Fund Investments
CSPF officials and named fiduciary representatives also said that the plan’s investment policies did not change in response to a couple of the events that contributed to CSPF’s critical financial condition. For example, when UPS withdrew from the plan in December 2007, it paid $6.1 billion in a lump sum to fulfill its withdrawal liability. Consistent with the named fiduciaries’ investment policies during this time period, the majority of this withdrawal payment was invested in equity assets. Specifically, the court approved the UPS withdrawal liability payment to be allocated: $1 billion to Northern Trust to be invested primarily in short-term fixed income assets, $0.9 billion to the passively-managed domestic fixed income account, and $4.2 billion to partially fund the newly created passively-managed domestic equity account.100 As a result of the 2008 market downturn, the balance of each of CSPF’s accounts—Northern Trust’s named fiduciary account, the passively-managed domestic fixed income and domestic equity accounts, and Goldman Sachs’ named fiduciary account—declined because of investment losses or withdrawals from investment assets to pay benefits and expenses. Some of the declines in each account were reversed by investment gains in 2009.
Although the changes made to CSPF’s investment management structure did not lead to investment policy changes during the middle period, they altered the process by which the policy was set and executed. In particular, trustee responsibilities in the policy process grew after CSPF trustees became responsible for developing investment policy statements and selecting and overseeing managers of the passively-managed
100At the end of 2006, over 67 percent of CSPF’s assets were invested in equity assets, over 19 percent were invested in the passively-managed domestic fixed income account, and the other 13 percent were invested in actively-managed fixed income, real estate, cash and other assets. At the end of 2007, after UPS withdrawal liability payment was made, almost 67 percent of CSPF’s assets were invested in equity assets, which included a 20 percent allocation to the passively-managed domestic equity account created and funded in December. Of the 33 percent of the plan’s remaining assets, nearly 20 percent were invested in the passively-managed domestic fixed income account, and the other 13 percent were invested in actively-managed fixed income, real estate, cash and other assets. See additional information on CSPF’s asset allocation during this time period later in this report.
Process for Setting and Executing CSPF’s Investment Policy

Page 50 GAO-18-106 Central States Pension Fund Investments
accounts, subject to court approval.101 In addition, CSPF officials said the addition of passively-managed accounts between 2003 and 2010 had the effect of creating broad bounds within which the named fiduciary could set the plan’s asset allocation. For example, when the plan moved 20 percent of total plan assets into the passively-managed domestic fixed income account in 2003, this placed an upper bound on the plan’s total equity allocation at 80 percent. Similarly, since 2010 the 30 percent of total plan assets in passively-managed equity accounts has placed a lower bound on the plan’s total equity allocation at 30 percent (see fig. 12).
101The consent decree requires that the passively-managed accounts be managed (1) by an investment manager appointed by CSPF trustees, subject to court approval, and (2) separately from the authority, responsibility, and control of the named fiduciaries. CSPF trustees appointed Mellon Bank, N.A., in 2003 and 2007, and Mellon Capital Management Corporation, a subsidiary of Bank of New York Mellon Corporation, in 2010. Each quarter, the trustees determine the amount needed to be transferred among the passively-managed accounts and the named fiduciary account(s) to maintain a court-approved allocation of plan assets as stated in the consent decree.

Page 51 GAO-18-106 Central States Pension Fund Investments
Figure 12: CSPF Equity Allocation Bounded by Investment Policies and Passively-Managed Accounts, 1993–2016
Note: Equity indicates ownership in a business, often in the form of common stock. aBetween 2003 and 2010, the portion of assets that independent asset managers, called named fiduciaries, managed declined as the plan moved 50 percent of its assets into three passively-managed accounts. These additional accounts created broad bounds within which the named fiduciary could set the plan’s overall equity asset allocation. Specifically, the passively-managed domestic fixed income account added in 2003 limited the plan’s total equity allocation to 80 percent. Similarly, the passively-managed equity accounts added in 2007 and 2010 ensured that the plan’s total equity allocation did not fall below 30 percent after 2010. Prior to 2003 there were no similar court-approved allocations that limited the allowable range for allocations. bMultiple independent asset managers, called named fiduciaries, set CSPF’s investment objectives and controlled plan assets since 1993. In their investment policy statements, named fiduciaries generally specified bounds for total plan allocations to equity assets.
Nevertheless, named fiduciaries maintained the largest role in setting and executing CSPF’s investment policy throughout the middle period. From 1993 to 2003, named fiduciaries managed all of the plan’s investment assets, and from 2003 to 2009, when the plan added two of the current passively-managed accounts, named fiduciaries still held the majority of the plan’s assets. It has only been since 2010 that the assets in passively-managed accounts equaled those managed by the named fiduciary. Furthermore, Northern Trust representatives said they

Page 52 GAO-18-106 Central States Pension Fund Investments
considered the plan’s allocations to passively-managed accounts when developing the objectives and target asset allocations for the assets they managed. Northern Trust representatives also said they discussed the plan’s overall asset allocation with trustees, but the trustees, and ultimately the court, were responsible for the decision to move 50 percent of the plan’s assets into passively-managed accounts.
After the 1993 policy change that specified the plan would invest a majority of assets in equity or equity-type securities, CSPF’s asset allocation changed significantly. For example, during the middle period the plan’s allocation to equities increased from 37 percent at the end of 1993 to 69 percent at the end of 2002, and its allocation to cash plus fixed income decreased from 63 percent at the end of 1993 to 27 percent at the end of 2002.102 In particular, Morgan Stanley increased the plan’s allocation to equity assets from 37 percent at the end of 1993 to 63 percent at the end of 1995, with the percentage in equities almost or above 50 percent through the end of 1999.103 From 1993 through 1999, Morgan Stanley generally decreased the plan’s allocation to fixed income assets and increased its allocation to international equity (reaching a high of about 28 percent of the plan’s assets in 1995), an asset class in which the plan had not previously invested (see fig. 13).
102As measured by year-end allocations, these allocation changes occurred mainly from year-ends 1993-1995 and 2000-2002. Asset allocations as of a particular date can fluctuate because of day-to-day market fluctuations, the timing of rebalancing by asset managers, and other factors. However, examining such allocations over multiple years, as we do in this section, can reveal trends. 103Goldman Sachs was appointed as a second named fiduciary effective July 1, 1999, and received half of the plans assets in installments before November 1999, but it used Morgan Stanley’s investment policy statement until September 2000, when its own investment policy statement was approved.
Asset Allocation under CSPF’s Investment Policy

Page 53 GAO-18-106 Central States Pension Fund Investments
Figure 13: CSPF Asset Allocation, 1993–1999
Note: To compile these asset allocation proportions, we used the aggregate asset allocation categories that CSPF’s independent asset managers, called named fiduciaries, assigned in their annual performance reports. Generally, real estate can include direct purchase of properties or investment in vehicles that invest in real estate; cash equivalents include assets that can be converted to cash in a very short period of time; fixed income refers to any type of investment under which the borrower or issuer is obligated to make payments at a defined rate on a defined schedule; and equity indicates ownership in a business, often in the form of common stock. In each of these years, named fiduciaries reported small amounts of the plan’s assets as “other” assets. Specifically, in year-ends1995 through 1998, the “other” assets were greater than 1.5 percent of the plan’s assets, the majority of which were categorized as “alternative” assets such as commodities, oil and gas debt and royalties, or global tactical asset allocations. Totals may not add up to 100 due to rounding.
After 1999, the plan’s asset allocation continued to be weighted towards equities. After the market downturn in 2001, CSPF trustees told us that J.P. Morgan and Goldman Sachs explicitly increased the equity allocation in an attempt to generate higher investment returns and increase the plan’s funded ratio—the plan’s overarching investment objective. Between 2000 and mid-2010, when the plan had two named fiduciaries, equity assets increased from about 58 percent at the end of 2000 to between 66 and 70 percent at the end of 2001 and each year thereafter until the end of 2009, mostly based on the named fiduciaries’ decisions to increase the plan’s allocation to domestic equity assets. When Northern Trust became the sole named fiduciary in 2010, the proportion of equity assets declined from almost 72 percent at the end of 2010 to almost 63 percent at the end of 2016. During this time, Northern Trust generally

Page 54 GAO-18-106 Central States Pension Fund Investments
decreased the plan’s allocation to domestic equity assets, increased the allocation to actively-managed fixed income, and started investing in global infrastructure assets. Northern Trust representatives said CSPF’s recent portfolio had been kept relatively aggressive in an attempt to achieve the returns the plan would need to become fully funded while balancing risk (see fig. 14).
Figure 14: Changes to CSPF’s Asset Allocation, 2000–2016
Note: To compile these asset allocation proportions, we used the aggregate asset allocation categories that CSPF’s independent asset managers, called named fiduciaries, assigned in their annual performance reports. Generally, real estate can include direct purchase of properties or investment in vehicles that invest in real estate; cash equivalents include assets that can be converted to cash in a very short period of time; fixed income refers to any type of investment under which the borrower or issuer is obligated to make at a defined rate on a defined schedule; and equity indicates ownership in a business, often in the form of common stock. In most of these years, named fiduciaries reported small amounts of the plan’s assets as “other” assets. For example, in 2012 through 2015, the “other” assets were greater than 1.5 percent of the plan’s assets, the majority of which were categorized as global listed infrastructure. In 2008 and 2009, “alternative” assets of less than 0.6 percent were categorized as distressed debt. Totals may not add up to 100 due to rounding.
CSPF’s deteriorating financial condition precipitated a recent investment policy change that will move plan assets into fixed income and cash equivalent investments ahead of projected insolvency. In early 2017, Northern Trust representatives revised the plan’s investment policy
Current Period: January 2017 – Present

Page 55 GAO-18-106 Central States Pension Fund Investments
because they, in consultation with the trustees, believed the plan had no additional options to avoid insolvency (see textbox).104 This change to the plan’s outlook led to a significant change in the plan’s investment objective, from a goal of fully funding the plan to instead forestalling insolvency as long as possible while reducing the volatility of the plan’s funding. Northern Trust representatives and CSPF officials revised applicable plan investment policy statements and started to gradually transition the plan’s “return seeking assets”—such as equities and high yield and emerging markets debt—to high quality investment grade debt and U.S. Treasury securities with intermediate and short-term maturities.105 Northern Trust’s new investment policy specified the assets under its control would not be invested in nonpublicly traded securities, in order to manage risk and provide liquidity.
Source: CSPF officials and U.S. Department of the Treasury documentation. | GAO-18-106
104The court approved the trustees’ revised investment policy statement for the passively-managed domestic fixed income account on June 5, 2017 and Northern Trust’s revised investment policy statement on June 23, 2017. 105As this plan is implemented, Northern Trust said it will continue to review the plan’s financial condition, performance of investment markets, and legal environment at least annually to determine if any revisions are appropriate. Since the plan’s assets are divided equally between the named fiduciary and the passively-managed accounts, Northern Trust representatives and CSPF trustees will take a simultaneous approach to gradually reducing “return-seeking assets” for the assets under their control.
CSPF Has Limited Options to Achieve Solvency
As of March 2018, the Central States, Southeast and Southwest Areas Pension Fund (CSPF) was projected to be insolvent on January 1, 2025. As of July 2017, CSPF officials said that the following measures (in isolation) could help the plan avoid insolvency:
• 18 percent year-over-year investment returns (infinite horizon), or
• 250 percent contribution increases (with no employer attrition), or
• 46 percent across-the-board benefit cut.
However, CSPF officials said that investment returns and contribution increases of these magnitudes were untenable, and CSPF’s application to reduce accrued benefits under the Multiemployer Pension Reform Act of 2014 (MPRA) was denied in 2016.

Page 56 GAO-18-106 Central States Pension Fund Investments
CSPF officials and Northern Trust representatives said these asset allocation changes are intended to provide participants greater certainty regarding their benefits and reduce the plan’s exposure to market risk and volatility until it is projected to become insolvent on January 1, 2025 (see fig. 15).
Figure 15: Planned Changes to CSPF’s Investments to Gradually Reduce Risk, 2018–2024
Note: Since the plan’s assets are divided equally between the independent asset manager, called a named fiduciary, and the passively-managed accounts, “return-seeking assets” will be simultaneously reduced from the plan’s applicable accounts. “Return seeking assets” were described by the named fiduciary as equities and high yield and emerging markets debt, and the fixed income assets were described as high quality investment grade debt and U.S. Treasury securities with intermediate and short-term maturities. Median projected asset values were projected at year end, but to show how the plan’s projected target asset allocation changes over the time period, we used linear interpolation to show the end of 1st calendar quarter value. (This means we took one-quarter of the difference between the prior and current year-end values). Actual estimates could differ depending on varying cash flow considerations throughout the year. As of March 2018, CSPF’s actuaries project the plan will be insolvent on January 1, 2025.
Northern Trust is expected to continue to manage 50 percent of the plan’s investment assets until the plan becomes insolvent. While the total amount of assets in the passively-managed accounts will continue to constitute 50 percent of the plan’s assets, the trustees plan to transfer assets from the passively-managed domestic and international equity accounts into the passively-managed domestic fixed income account,

Page 57 GAO-18-106 Central States Pension Fund Investments
which will be gradually transitioned to shorter-term or cash-equivalent fixed-income securities sometime before the end of March 2020 (see fig. 16).
Figure 16: Historical and Projected Changes to CSPF’s Account Allocation, 2016–2025
Note: Changes to the plan’s account allocations are to be made before the date listed in the figure. With the proposed changes, as of March 2018 CSPF’s actuaries project the plan will be insolvent on January 1, 2025. The objective of each of CSPF’s passively-managed accounts was generally to match the return of a specific index, such as the Standard & Poor’s 500 Index, rather than exceed it. The passively-managed domestic fixed income account was to be invested in domestic fixed income assets that generally refer to any type of investment under which the borrower or issuer is obligated to make payments at a defined rate on a defined schedule. The other two passively-managed equity accounts were to be invested in domestic and international equity assets, respectively, which generally indicate ownership in a business, often in the form of common stock. Northern Trust’s named fiduciary account includes equity, fixed income, and other assets, which include real estate and global listed infrastructure. Totals may not add up to 100 due to rounding.

Page 58 GAO-18-106 Central States Pension Fund Investments
CSPF officials said the changes will reduce the amount of fees and transaction costs paid by the plan. Specifically, investment management fees are expected to generally decrease as the plan moves into shorter duration fixed income assets. In addition, Northern Trust’s plan is designed to reduce transaction costs in two ways: (1) in the near term, Northern Trust plans to liquidate “return-seeking assets” so the cash it receives can be used directly to pay benefits, and (2) it plans to synchronize the fund’s benefit payments with the maturity dates of fixed income assets it purchases so cash received can be used directly to pay benefits. Both of these design features are intended to eliminate the need to reinvest assets, which might entail additional transaction costs.
Our analysis of available data from several different sources shows the returns on CSPF’s investments and the fees related to investment management and other plan administration activities appear generally in line with similar pension plans or other large institutional investors of similar size.
The annual returns on CSPF’s investments in recent decades have generally been in line with the annual returns of a customized peer group provided by the investment consultant Wilshire. The comparison group data is from Wilshire’s Trust Universe Comparison Service (TUCS)—a tool used by CSPF to compare its investment returns to a group of
Available Data Show That CSPF Investment Returns and Fees Were Generally Comparable to Similar Plans
CSPF’s Investment Return History is in Line with Other Funds and Plans
CSPF Investment Returns Compared to Other Large Institutional Funds

Page 59 GAO-18-106 Central States Pension Fund Investments
peers.106 Over the 22 years covered by our analysis, CSPF’s returns were above the median in 12 years and below the median the other 10. Figure 17 illustrates how CSPF’s annual investment returns compare to CSPF’s customized peer group of master trusts107 with over $3 billion in assets.108
106According to a Wilshire brochure, as of 2012, the TUCS universe contains information from custodians and consultants that span 30 years of market history for over 2000 plans (or master trusts) representing more than $3.6 trillion in assets. The peer group for CSPF is a subset of these plans/funds, specifically master trusts with over $3 billion in assets. Given this criteria the number of peers varies by the year of analysis and thus the number of master trusts that meet the $3 billion dollar threshold. For example, 59 trusts met the $3 billion threshold in 2000 while 124 trusts met the threshold in 2014. 107A master trust is a collection of funds representing a single investor unit. Because of the proprietary nature of TUCS, the master trusts that are considered CSPF’s peers are not identified. A Wilshire Associates representative suggested that a multiemployer plan would likely use a different peer group set than, say, a university endowment. However, we were not able to ascertain additional characteristics of the peer group for CSPF, such as whether the other peer master trusts were largely or exclusively other multiemployer defined benefit plans. 108The information collected for CSPF’s custom TUCS peer group provides a simple annual comparison for CSPF’s investment returns. Other common measures of investment performance include comparisons against a benchmark index, and comparisons that adjust for the investment risk associated with each of the portfolios being compared. A benchmark index comparison may provide information about investment performance relative to a more neutral standard that possesses desirable characteristics for the investment. For example, the investment return of an actively-managed equity portfolio may be compared to the return on the Standard and Poor’s 500 (S&P 500) over the same time period. The relevance of this comparison would depend on the extent to which the portfolio relates to the S&P 500 index. By contrast, risk-adjusted comparisons account for the extent to which higher returns may be the result of taking greater investment risk. For example, equity investments often yield higher returns than Treasury bond investments; however, there is a greater risk that equity investments will return less than expected. Risk-adjustment methodologies attempt to compare returns on a risk-neutral basis, which can be helpful in comparing the performance of investments (or portfolios) that involve different levels of risk.

Page 60 GAO-18-106 Central States Pension Fund Investments
Figure 17: CSPF Annual Returns Relative to the Wilshire TUCS for Master Trusts of Greater than $3 Billion, by Percentile Category, 1995–2016
Note: Wilshire Associates' (Wilshire) Trust Universe Comparison Service (TUCS) data from 1999 through 2016 was provided by Central States, Southeast and Southwest Areas Pension Fund (CSPF). The custom comparison group, master trusts with greater than $3 billion in assets, is determined contemporaneously (specifically in early-February in the year following the December 31 return results for the prior year). Over time the master trusts included in the comparison group may change, for example, as the level of assets for the master trusts changes. For example, the return results for year-end 1999 contained 62 observations in the comparison group while the comparison group for year-end 2014 contained 124 observations. We were able to obtain additional years of TUCS data, from 1995 through 1998, for CSPF’s peer plans by directly contacting Wilshire.
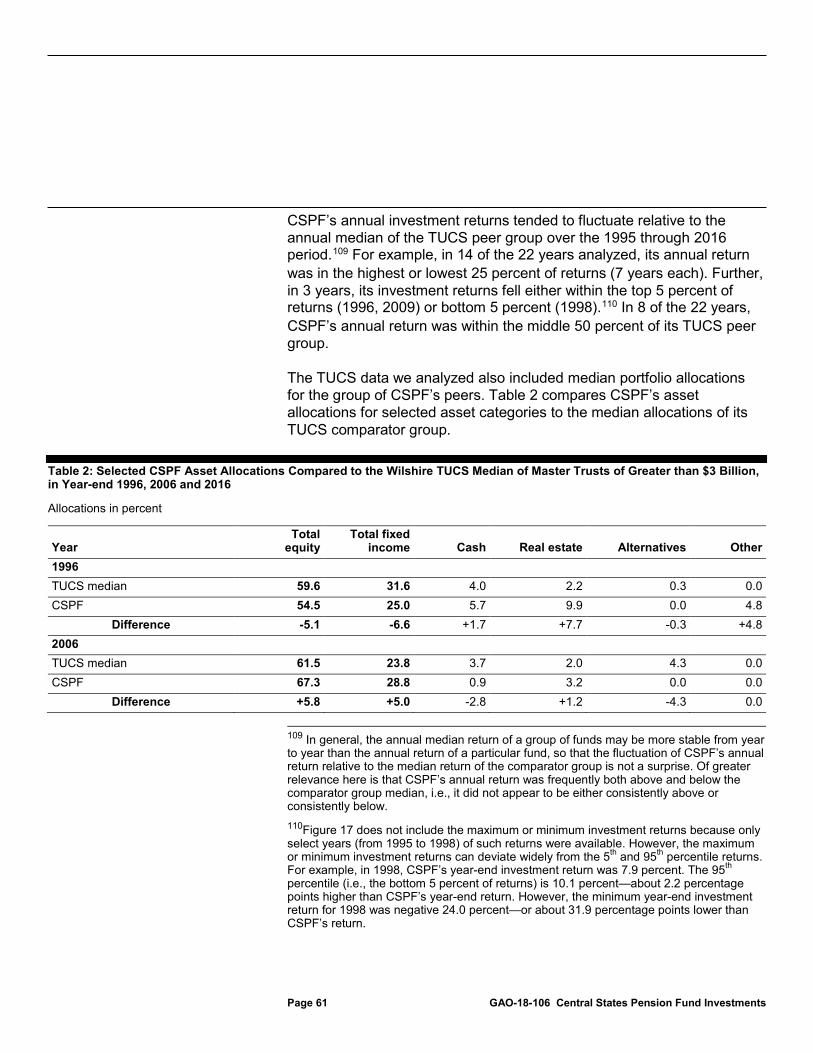
Page 61 GAO-18-106 Central States Pension Fund Investments
CSPF’s annual investment returns tended to fluctuate relative to the annual median of the TUCS peer group over the 1995 through 2016 period.109 For example, in 14 of the 22 years analyzed, its annual return was in the highest or lowest 25 percent of returns (7 years each). Further, in 3 years, its investment returns fell either within the top 5 percent of returns (1996, 2009) or bottom 5 percent (1998).110 In 8 of the 22 years, CSPF’s annual return was within the middle 50 percent of its TUCS peer group.
The TUCS data we analyzed also included median portfolio allocations for the group of CSPF’s peers. Table 2 compares CSPF’s asset allocations for selected asset categories to the median allocations of its TUCS comparator group.
Table 2: Selected CSPF Asset Allocations Compared to the Wilshire TUCS Median of Master Trusts of Greater than $3 Billion, in Year-end 1996, 2006 and 2016
Allocations in percent
Year Total
equity Total fixed
income Cash Real estate Alternatives Other 1996 TUCS median 59.6 31.6 4.0 2.2 0.3 0.0 CSPF 54.5 25.0 5.7 9.9 0.0 4.8
Difference -5.1 -6.6 +1.7 +7.7 -0.3 +4.8 2006 TUCS median 61.5 23.8 3.7 2.0 4.3 0.0 CSPF 67.3 28.8 0.9 3.2 0.0 0.0
Difference +5.8 +5.0 -2.8 +1.2 -4.3 0.0
109 In general, the annual median return of a group of funds may be more stable from year to year than the annual return of a particular fund, so that the fluctuation of CSPF’s annual return relative to the median return of the comparator group is not a surprise. Of greater relevance here is that CSPF’s annual return was frequently both above and below the comparator group median, i.e., it did not appear to be either consistently above or consistently below. 110Figure 17 does not include the maximum or minimum investment returns because only select years (from 1995 to 1998) of such returns were available. However, the maximum or minimum investment returns can deviate widely from the 5th and 95th percentile returns. For example, in 1998, CSPF’s year-end investment return was 7.9 percent. The 95th percentile (i.e., the bottom 5 percent of returns) is 10.1 percent—about 2.2 percentage points higher than CSPF’s year-end return. However, the minimum year-end investment return for 1998 was negative 24.0 percent—or about 31.9 percentage points lower than CSPF’s return.

Page 62 GAO-18-106 Central States Pension Fund Investments
Year Total
equity Total fixed
income Cash Real estate Alternatives Other 2016 TUCS median 48.1 24.3 4.2 3.1 11.8 0.0 CSPF 62.8 31.4 2.6 1.8 0.0 1.4
Difference +14.7 +7.1 -1.7 -1.3 -11.8 +1.4
Source: GAO analysis of Wilshire Associates' (Wilshire) Trust Universe Comparison Service (TUCS) and Central States, Southeast and Southwest Areas Pension Fund (CSPF) Named Fiduciary Reports | GAO-18-106.
Note: The asset categories are a selection of categories. Categories not shown include guaranteed investment contracts and convertibles (convertible bonds are an investment that gives the bondholders the right to convert the bonds to equities). Such investments are excluded because the Wilshire Associates' (Wilshire) Trust Universe Comparison Service (TUCS) median is zero and we identified no Central States, Southeast and Southwest Areas Pension Fund (CSPF) assets in these classes. The CSPF allocations may not add to 100 percent because of rounding. Additionally, the comparator median allocations will not necessarily add to 100 percent, because the median values for different asset categories may represent the allocation percentages of different master trusts from within the comparator group. Further, mean values might differ from medians. For example, in 1996, a year in which we have the comparator group mean and median, the mean value of total equity allocation is 56 percent, while the median value is nearly 60 percent. The available data did not include mean values for 1999 through 2016. Further, our classification of CSPF assets follows broad classifications in named fiduciary reports, but certain classifications may reflect variation in nomenclature. Specifically, the “other” category for CSPF assets reflects “commodities/cash reserves” and “oil and gas royalty.” Depending on the classification methodology for the TUCS information, certain categories could include different or overlapping asset categories.
In 1996, compared to the TUCS medians, CSPF had relatively lower proportions of its assets in both equities and fixed income and a relatively higher proportion in real estate. Twenty years later (2016), CSPF had relatively higher proportions of its assets in both equities and fixed income (about 15 and 7 percentage points, respectively) than the respective medians for its peer group. However, the relatively large difference between CSPF’s 2016 equity allocation and the median allocation of its peer group may be a result of the peers moving into different asset classes. For example, there is a relatively large difference, in the other direction, in the allocation to alternative investments (see table 2).111 We did not identify an alternative asset category in CSPF’s asset reports for
111Alternative investments are difficult to categorize—both as an asset class and in terms of risk or volatility. We previously reported that many investors may invest in alternative assets to diversify their investments or achieve returns that are less volatile than the overall market. In the report we describe private equity and hedge funds as examples of alternative assets. See GAO, Defined Benefit Pension Plans: Recent Developments Highlight Challenges of Hedge Fund and Private Equity Investing, GAO-12-324, (Washington, D.C.: Feb. 16, 2012). However, overall alternative assets are not a well-defined asset class as the class generally refers to asset classes or investment strategies that are outside of traditional stock (equities), or bond (fixed-income) categories. The categorizations of alternatives in the TUCS data provides no additional information about sub-categories or asset strategies included in alternatives.

Page 63 GAO-18-106 Central States Pension Fund Investments
2016, but the TUCS comparator group median asset allocation in that year is 11.8 percent of assets.112
Similar to our findings when comparing the returns on CSPF’s investments to a customized peer group of other large institutional funds, the annual returns on CSPF’s investments in recent decades have also generally been in line with the annual returns for a group of similar multiemployer pension plans. To create a group of comparable plans, we selected plans that had a similar degree of “maturity” to CSPF in 2000, as such plans may face similar cash flow challenges to those facing CSPF.113 This comparator group ultimately consisted of 15 plans in addition to CSPF. Relative to less mature plans, mature plans generally have a greater proportion of liabilities attributable to retired participants receiving benefit payments and a lower proportion attributable to active participants (i.e., workers) earning benefits. Mature plans may have limited capacity to make up for insufficient investment returns through employer contributions.
Similar to the comparison against other large institutional fund returns based on TUCS data, our comparison against other mature multiemployer plan returns based on Form 5500 data shows that CSPF’s annual returns fluctuate relative to the median annual return for the
112However, according to an actuary we spoke to with asset management expertise, 60 percent equity allocations, 25 percent fixed-income allocation and 15 percent alternative investment allocation is a common proportion of asset allocations for a multiemployer plan in recent years. This expert noted that alternative assets are hard to characterize as a class or in terms of risk. This expert added that alternative assets are often marketed as having higher expected returns and diversification—and suggested lowering estimates of expected returns from alternative investments because there are often unique risks embedded in such investments that may not be fully captured. For example, alternative assets may present challenges to a plan’s investment liquidity—that is, a plan may have limited ability to redeem investment shares on demand—in order to meet plan obligations. 113For the purposes of this analysis, we defined similar maturity as having the most similar ratio of in-pay retiree liabilities to total liabilities. In addition, the comparison group of plans had to have at least $300 billion in assets as of January 1, 2000. Lastly, the selected plans also have the same plan year-end as CSPF, December 31, so that the return periods are directly comparable for the group of plans.
CSPF Investment Returns Compared to Other Similar Multiemployer Plans

Page 64 GAO-18-106 Central States Pension Fund Investments
mature plan comparator group (see fig. 18).114 For example, in 12 of the 15 years, CSPF’s annual return was in the highest or lowest 25 percent of returns (7 times high and 5 times low). In 3 of the 15 years analyzed, CSPF’s annual return fell within the middle 50 percent of the peer group. Overall, from 2000 to 2014, CSPF’s annual return was above the group median return in 9 of the 15 years—and lower than the median return in the other 6 years. Relative to its peers, CSPF’s annual returns performed worst during economic downturns and best in years coming out of such downturns. CSPF’s annual investment return was in the bottom 10 percent of returns in 2001, 2002, and 2008. Alternatively, its annual return was in the top 10 percent of returns from 2003 to 2006, in 2009, and in 2012.
114The returns were calculated using data from the Form 5500—the annual report that most defined benefit plan sponsors are required to file with the federal government. In general the annual median return of a group of funds may be more stable from year to year than the annual return of a particular fund, so that the fluctuation of CSPF’s annual return relative to the median return of the comparator group is not a surprise. Of greater relevance here is that CSPF’s annual return was frequently both above and below the comparator group median, i.e., it did not appear to be either consistently above or consistently below.

Page 65 GAO-18-106 Central States Pension Fund Investments
Figure 18: CSPF’s Annual Investment Returns among Mature Multiemployer Plans, 2000—2014
Note: In addition to the Central States, Southeast and Southwest Areas Pension Fund (CSPF) we selected 15 plans with the lowest absolute differences from CSPF in their ratios of in-pay retiree liabilities to total liabilities, after screening for the other criteria listed here. The comparison group of plans had to have at least $300 million in current assets as of January 1, 2000. To assure comparability the selected plans also had to have the same plan year-end as CSPF, December 31. Plans with 4 or more years of missing data or large plan transfers (i.e. transfers of assets out of or into the plan) for which the date of transfer within the year was not provided were excluded. Among the 16 plans there may be instances of missing data (or unreported data due to plan transfers).
Additionally, the dollar-weighted average annual return for CSPF over the 2000 through 2014 period was roughly the same as the median for the mature plan comparison group. Specifically, the dollar-weighted average annual return over this period for CSPF was roughly 4.9 percent, while

Page 66 GAO-18-106 Central States Pension Fund Investments
the median dollar-weighted average annual return over this period among the comparison plans with continuous data was 4.8 percent.115
Our analysis of investment returns for mature plans compares investment returns for a set of peers that includes only multiemployer defined benefit plans. However, as with the comparison against other large institutional funds, the comparisons against other mature plans are not measures of over- or under-performance relative to an index or benchmark. Similarly, as with the earlier comparison, the analysis does not account for variations in the levels of investment risk taken by the plans.
Our analysis of Form 5500 data shows CSPF’s investment fees and administrative expenses were in line with other large multiemployer plans.116 Plan investment fees and administrative expenses are often paid from plan assets so many plans seek to keep these fees and expenses low. Additionally, investment fees are likely to be related to the value of assets under management, and plans with greater asset values tend to be able to negotiate more advantageous fee rates. According to a pension consultant and a DOL publication, investment management fees are typically a large defined benefit plan’s largest category of expense, but a pension plan also incurs a number of lesser expenses related to administering the plan.117 Administrative expenses (other than investment fees) may include those for:
115Only 12 mature plans in our comparison group had continuous data from 2000 through 2014. We also calculated an alternative return measure, the time-weighted average return, which was 6.0 percent for CSPF over the 2000 through 2014 period. The median time-weighted return for the 12 plans in the comparison group that had continuous data was 5.5 percent over the same period. The time-weighted average return is a common metric for conveying the performance of investments. We have previously reported that using time-weighted returns to calculate historical returns may not reflect the impact of the cash flow pattern experienced by the plan. See GAO-14-264. In that report, we noted that the relationship between cash-flow- and time-weighted returns can vary depending on the historical period and whether the plan has increasing or decreasing cash flows. 116Specifically, with regard to investment fees, the 2014 Form 5500, Schedule H asks the plan to report “the total fees paid…to an individual, partnership or corporation (or other person) for advice to the plan relating to its investment portfolio. These may include fees paid to manage the plan’s investments, fees for specific advice on a particular investment, and fees for the evaluation for the plan’s investment performance.” 117Penbridge Advisors, Defined Benefit Expense Survey: Initial Fielding Period Results, (Stamford, CT: May 2015). U.S. Department of Labor Employee Benefits Administration, Understanding Retirement Plan Fees and Expenses, (Washington, D.C.: Dec. 2011)
Fees and Expenses Paid by CSPF Were Similar to Other Large Multiemployer Plans

Page 67 GAO-18-106 Central States Pension Fund Investments
• PBGC premiums;
• actuarial services;
• trustee-related services;
• audit and bookkeeping/accounting services;
• legal services to the plan (opinions, litigation and advice);
• administrative services provided by contractors;
• plan staff salaries and expenses;
• plan overhead and supplies; and
• other miscellaneous expenses.
These administrative expenses relate to plan operations beyond the management of the assets, including the day-to-day expenses for basic administrative services such as participant services and record keeping. Furthermore, some of these expenses can vary based on the number of participants in the plan. To compare CSPF’s fees and expenses against similarly sized plans, we tallied various investment fee-related and other administrative expenses and compared CSPF to a group of multiemployer defined benefit plans that were among the 19 largest plans in terms of assets as of January 1, 2014.118
According to CSPF’s 2014 Form 5500, CSPF spent about $46.5 million on investment fees (or $47.6 million in 2016 dollars) and had about $17.4 billion in assets (or $17.8 billion in 2016 dollars) as of the end of the year—resulting in an investment fee expense ratio of about 27 basis points,119 or 0.27 percent.120 Over the 2000 to 2014 period, CSPF’s average annual investment fee expense ratio was 34 basis points (0.34 percent) while the median of the averages for our large plan comparison group was 37 basis points (0.37 percent). While CSPF’s average investment fee expense ratio was below the median for its comparison group over the period we examined, the relationship of CSPF’s annual 118Specifically these plans, along with CSPF, reported the 20 largest current values of assets as of January 1, 2014 on their 2014 Form 5500 Schedule MB and have plan years ending on December 31, like CSPF. See appendix I for more on the construction of this peer group. 119One basis point is equal to one one-hundredth of one percentage point (0.01 percent). 120Our definition of assets uses year-end net assets less any outstanding contributions (also known as receivables). See appendix I for our methodology for constructing the expense ratio.

Page 68 GAO-18-106 Central States Pension Fund Investments
ratio to the annual median changed over time. CSPF’s annual investment-fee expense ratio was consistently at or above the median from 2000 through 2006, but was below the median thereafter. In addition, CSPF’s average investment fee expenses over the period that followed 2006 were 26 percent less than the average over the period before 2007. (They averaged 39 basis points, or 0.39 percent, from 2000 through 2006 and 29 basis points, or 0.29 percent, from 2007 through 2014.) Two events may have contributed to this change. First, CSPF introduced the passively-managed accounts beginning in 2003—as noted earlier, and CSPF moved certain assets to those accounts in an effort to reduce fees.121 Second, the change back to a single named fiduciary, which was suggested as an expense saving move, occurred in the middle of the 2007 to 2014 period analyzed. Figure 19 illustrates how CSPF’s investment fee expense ratio compares to other large plans.
121See appendix I, figure 21 and table 3 for a time line regarding the formation of the passively-managed accounts.

Page 69 GAO-18-106 Central States Pension Fund Investments
Figure 19: Annual Investment Fee Expense Ratio among Largest Multiemployer Plans, 2000—2014
Note: We defined largest as the 20 multiemployer defined benefit plans having the largest asset values as of January 1, 2014, which includes the Central States, Southeast and Southwest Areas Pension Fund (CSPF). To ensure that the analysis period was directly comparable (and for comparability with investment returns), the selected plans also had the same December 31 year-end date. One plan has been removed from this analysis because the plan had 4 or more years of missing data. For the remaining plans in the comparison, there may be plan data missing in certain years. CSPF noted that the plan had categorized an investment fee as an administrative expense on the plan’s 2004 Form 5500 Schedule H. We did not update our figures in regards to this disclosure as we relied on PBGC Form 5500 research data, which contains the data as it was categorized in 2004. However, in consideration of CSPF’s disclosure, we calculated the changes to investment fees and administrative expenses by shifting the mischaracterized amount noted by CSPF from administrative expenses to investment fees. The effect for 2004 would be a 13 basis point (0.13 percent) increase to 50 basis points (0.50 percent) expense ratio.
Our analysis uses investment fee data reported in the Form 5500 that does not include details about the sources of the fees. Investment fees may be sensitive to a plan’s particular investment strategy and the way assets are allocated.122 For example, with CSPF, a named fiduciary has
122For example, one study found that the median fee for institutionally managed accounts of $500 million or more (2001 data) differed by up to 49 basis points (0.49 percent) depending on the asset class. Specifically, separately managed small-cap equities had a median investment fee expense of 65 basis points while separately managed short-maturity fixed-income assets had median investment fee expenses of 16 basis points in 2001. Sean Collins, Investment Company Institute Perspective: The Expenses of Defined Benefit Pension Plans and Mutual Funds, Vol. 9, No. 6, (Washington, D.C.: Dec. 2003).

Page 70 GAO-18-106 Central States Pension Fund Investments
responsibility for executing the investment strategy and allocations. According to a representative from Northern Trust—the current named fiduciary—CSPF pays a fee of about 5 basis points for named fiduciary services, and this, combined with investment management fees, is in line with investment fees for other clients (though the overall fees depend on the types of asset allocations and investment strategies).
Figure 20 shows how CSPF’s administrative (or non-investment) expenses compare to those of other large plans on a per participant basis. According to CSPF’s 2014 Form 5500, CSPF spent about $38 million on administrative expenses ($39 million in 2016 dollars)—the third most among the 20 peer plans. However, when these expenses are expressed relative to the number of plan participants, CSPF had per participant expenses of $98 in 2014, which is about 16 percent less than the median of the large comparator group, $117. Over the period studied, CSPF’s administrative expenses per participant were at or above the large comparator median in 3 years (2001, 2004, and 2005), but lower than the median in all other years of the 2000 to 2014 period.

Page 71 GAO-18-106 Central States Pension Fund Investments
Figure 20: Annual Administrative Expenses per Participant among Largest Multiemployer Plans, 2000—2014
Note: We defined largest as the 20 multiemployer defined benefit plans having the largest asset values as of January 1, 2014, which includes Central States, Southeast and Southwest Areas Pension Fund (CSPF). To ensure that the analysis period was directly comparable (and for comparability with investment returns), the selected plans also had the same December 31 year-end date. One plan has been removed from this analysis because the plan had 4 or more years of missing data. For the remaining plans in the comparison, there may be plan data missing in certain years. CSPF noted that the plan had categorized an investment fee as an administrative expense on the plan’s 2004 Form 5500 Schedule H. We did not update our figures in regards to this disclosure as we relied on PBGC Form 5500 research data, which contains the data as it was categorized in 2004. However, in consideration of CSPF’s disclosure, we calculated the changes to investment fees and administrative expenses by shifting the mischaracterized amount noted by CSPF from administrative expenses to investment fees. The effect for 2004 would be a decrease of administrative expenses per participant of $65 (2016 dollars), to $99 total. This value would be $5 less than the median of the comparator group in 2004.
CSPF’s administrative expenses were also in line with a broader group of comparators. For example, PBGC reported on 2014 administrative expenses of a population of large multiemployer plans (plans with more than 5,000 participants).123 By closely replicating the methodology of that study, we found CSPF’s expenses of $98 per participant in 2014 fell below the median expense rate of $124 dollars per participant but above the lowest quartile of this group of large multiemployer plans.124 In 123PBGC, Multiemployer Supplement 2015 Data Tables, (Washington, D.C.: March 2017). 124The lowest quartile had administrative expense rates of up to $86 per participant.

Page 72 GAO-18-106 Central States Pension Fund Investments
comparing administrative expenses as a percentage of benefits paid, we found CSPF’s administrative expenses were among the lowest 5 percent of this group of large multiemployer plans.125 We performed a similar comparison against the peer group of large plans.126 CSPF had the lowest administrative expense rate among the large plan peer group in 2014, paying administrative expenses at a rate of 1.4 percent of benefits paid. In addition, CSPF’s annual administrative expenses as a percentage of benefits were below the median of our peer group of large plans in all years we reviewed.
Our analysis of administrative expenses is highly summarized and does not account for possibly unique sources of administrative expenses. Plans may have unique organizational structures and attribute expenses differently. For example, one plan may contract a significant portion of administrative duties with a third-party, while another plan may administer the plan in-house. According to an actuary we interviewed, most multiemployer plans are administered by a third-party, but the plan’s in-house staff will still retain a number of duties. Additionally, the amount of individual administrative expenses could vary significantly by plan depending on the importance of the related administrative function in the plan’s organization.
We provided a draft of the report to the U.S. Department of Labor, U.S. Department of the Treasury, and the Pension Benefit Guaranty Corporation for review and comment. We received technical comments from the U.S. Department of Labor and the Pension Benefit Guaranty Corporation, which we incorporated as appropriate. The U.S. Department of the Treasury provided no comments.
125See appendix I for our methodology for constructing administrative fees—both relative to comparators and to the PBGC study. 126See figure 23 in appendix I. While we expressed investment fees as a percentage of assets, we express administrative costs as a percentage of benefits paid. In part, this is to be consistent with the PBGC study on administrative expenses. Additionally, CSPF’s investment fees are, as noted earlier, explicitly based on the amount of plan assets under management. However, other administrative expenses, such as bookkeeping or plan overhead may tend to be fixed costs or costs related to providing services to plan participants. As noted by a PBGC official, at least some administrative costs are specifically related to the distribution of plan benefits to participants.
Agency Comments and Our Evaluation

Page 73 GAO-18-106 Central States Pension Fund Investments
We will send copies to the appropriate congressional committees, the Secretary of Labor, the Secretary of the Treasury, Director of the Pension Benefit Guaranty Corporation, and other interested parties. This report will be available at no charge on the GAO website at http://www.gao.gov.
If you or your staff have any questions about this report, please contact Charles Jeszeck at (202) 512-7215 or [email protected] or Frank Todisco at (202) 512-2700 or [email protected]. Mr. Todisco meets the qualification standards of the American Academy of Actuaries to address the actuarial issues contained in this report. Contact points for our Offices of Congressional Relations and Public Affairs may be found on the last page of this report. GAO staff who made key contributions to this report are listed in appendix IV.
Charles A. Jeszeck Director Education, Workforce, and Income Security Issues
Frank Todisco Chief Actuary Applied Research and Methods

Page 74 GAO-18-106 Central States Pension Fund Investments
Congressional Requesters
The Honorable Sherrod Brown Ranking Member, Committee on Finance, Subcommittee on Social Security, Pensions and Family Policy United States Senate
The Honorable Jerry Nadler Ranking Member, Committee on the Judiciary House of Representatives
The Honorable Tammy Baldwin United States Senate
The Honorable Joe Donnelly United States Senate
The Honorable Tammy Duckworth United States Senate
The Honorable Richard J. Durbin United States Senate
The Honorable Heidi Heitkamp United States Senate
The Honorable Amy Klobuchar United States Senate
The Honorable Claire McCaskill United States Senate
The Honorable Gary C. Peters United States Senate
The Honorable Debbie Stabenow United States Senate
The Honorable Alma S. Adams House of Representatives
The Honorable Joyce Beatty House of Representatives
Page 75 GAO-18-106 Central States Pension Fund Investments
The Honorable Stanford D. Bishop, Jr. House of Representatives
The Honorable Cheri Bustos House of Representatives
The Honorable Michael E. Capuano House of Representatives
The Honorable André Carson House of Representatives
The Honorable Wm. Lacy Clay House of Representatives
The Honorable Emanuel Cleaver House of Representatives
The Honorable Steve Cohen House of Representatives
The Honorable Jim Costa House of Representatives
The Honorable Danny K. Davis House of Representatives
The Honorable Debbie Dingell House of Representatives
The Honorable Marcia L. Fudge House of Representatives
The Honorable Ruben Gallego House of Representatives
The Honorable Gene Green House of Representatives
The Honorable Brian Higgins House of Representatives

Page 76 GAO-18-106 Central States Pension Fund Investments
The Honorable Marcy Kaptur House of Representatives
The Honorable Daniel T. Kildee House of Representatives
The Honorable Ron Kind House of Representatives
The Honorable Brenda L. Lawrence House of Representatives
The Honorable Ted Lieu House of Representatives
The Honorable David Loebsack House of Representatives
The Honorable Stephen F. Lynch House of Representatives
The Honorable Betty McCollum House of Representatives
The Honorable James P. McGovern House of Representatives
The Honorable Gwen Moore House of Representatives
The Honorable Grace F. Napolitano House of Representatives
The Honorable Richard M. Nolan House of Representatives
The Honorable Collin C. Peterson House of Representatives
The Honorable Mark Pocan House of Representatives

Page 77 GAO-18-106 Central States Pension Fund Investments
The Honorable Mike Quigley House of Representatives
The Honorable Cedric L. Richmond House of Representatives
The Honorable Tim Ryan House of Representatives
The Honorable Janice D. Schakowsky House of Representatives
The Honorable Adam Smith House of Representatives
The Honorable Peter J. Visclosky House of Representatives
The Honorable John A. Yarmuth House of Representatives
Appendix I: Objectives, Scope, and Methodology
Page 78 GAO-18-106 Central States Pension Fund Investments
Our objectives were to review: (1) what is known about the factors that contributed to the Central States, Southeast and Southwest Areas Pension Fund’s (CSPF) critical financial condition; (2) what has been CSPF’s investment policy, and the process for setting and executing it, since the consent decree was established; and (3) how has CSPF performed over time, particularly compared to similar pension plans.
For all objectives, we reviewed relevant federal laws and regulations, literature, and documentation the U.S. Department of Labor (DOL) and CSPF officials provided, including reports prepared by the court-appointed independent special counsel. We interviewed knowledgeable industry stakeholders, participant advocates, CSPF officials, International Brotherhood of Teamsters officials and members, and federal officials—including officials from the Pension Benefit Guaranty Corporation (PBGC), DOL, and the U.S. Department of the Treasury (Treasury).1
To describe the major factors that led to CSPF’s critical financial condition, we conducted semi-structured interviews and reviewed CSPF documentation, relevant scholarly materials, trade and industry articles, government reports, conference papers, research publications, and working papers. We also collected actuarial, financial, and other data on current and historical measures of plan assets, liabilities, investment performance, and other factors, and performed our own analyses of these data. The data and documentation collected were generally from the plan or agencies that oversee pensions. We determined the information to be generally reliable for the purposes of our objectives.
To describe CSPF’s investment policy and the process by which it was set and executed we (1) reviewed CSPF’s investment policy statements, court orders and consent decree amendments, and other documentation provided by CSPF officials; (2) interviewed CSPF officials, including pension plan staff, the board of trustees, and the investment advisor, and representatives of the named fiduciary serving the plan at the time of our
1Many individuals at DOL and the plan who were involved in the establishment of the consent decree in 1982 and ensuring compliance in the intervening years were no longer available.
Appendix I: Objectives, Scope, and Methodology

Appendix I: Objectives, Scope, and Methodology
Page 79 GAO-18-106 Central States Pension Fund Investments
review; and (3) summarized certain aspects of CSPF’s assets using year-end performance reports prepared by the named fiduciaries.2
To describe how CSPF has performed over time compared to similar pension plans, we analyzed investment and fee data from DOL’s Form 5500, the government’s primary source of pension information. We also examined CSPF’s investment returns in comparison to a customized Wilshire Associates’ (Wilshire) Trust Universe Comparison Service (TUCS) benchmark of trusts with $3 billion or more in assets. CSPF provided these data and the data are included in the independent special counsel reports. Wilshire provided supplemental data using the same benchmark specifications.
We reviewed three types of documentation provided by CSPF for changes in named fiduciaries; changes in investment policy, strategy, and asset allocation; major issues that affected funding; and how these issues affected CSPF’s investment strategy and policy.
• Select independent special counsel reports. CSPF officials provided 4th quarter reports for each year from 1982 through 2002 and available quarterly reports from 2003 through 2007. We downloaded all available quarterly reports from 2008 through 2017 from CSPF’s website.
• Select board of trustee meeting minutes. We requested board of trustee meeting minutes from 1983, 1994-95, 1998-2005, 2007-2010, and 2016 so we could review trustee discussions from the first full year the plan was covered by the 1982 consent decree, the most recent full year; periods that included a recession and/or when the plan’s assets performed poorly; and periods that preceded a change or reappointment of the named fiduciary. CSPF officials selected portions of the trustee meeting minutes from those years that pertained to the following topics: named fiduciary reports concerning investment performance; discussions relating to the amortization extension the Internal Revenue Service (IRS) granted to the plan and the contribution rate increases the plan required of participating
2In conducting this work, we did not audit CSPF’s financial records in order to detect fraud, waste, or abuse. In accordance with Government Auditing Standards, we considered the risks of fraud to the successful completion of the specific objectives of this work. As part of this determination, we considered the two referrals of allegations GAO’s FraudNet made to PBGC that raised widely publicized criticisms of the plan.
CSPF and DOL Document Reviews

Appendix I: Objectives, Scope, and Methodology
Page 80 GAO-18-106 Central States Pension Fund Investments
employers in an effort to comply with funding targets required as condition of the IRS-approved amortization extension; major amendments to the plan; significant reports concerning the plan’s financial condition; amendments to the consent decree; discussions relating to any inquiries or issues DOL raised; discussions of named fiduciary appointments or resignations; discussions of particularly significant contributing employer delinquencies, bankruptcies, and settlements; and discussions relating to the independent special counsel. In addition to the board of trustee meeting minutes, CSPF officials provided select documentation on similar topics a former secretary of the board of trustees retained (1995 through 2008).
• Select correspondence between CSPF and DOL. CSPF officials provided select correspondence with DOL from 1987 through 2017 relating to DOL’s oversight of the plan. CSPF officials said they provided all records of those communications that related to significant, substantive, and nonroutine issues. The correspondence excluded other documents, such as periodic reports concerning asset rebalancing and correspondence related to fairly noncontroversial motions to the consent decree.
In addition, DOL provided documentation throughout the course of our engagement, including documentation it provided between September and October 2017 that it had not previously identified as being relevant to our review. We completed an on-site file review at DOL in September 2017, and DOL sent us additional electronic documentation in September and October 2017.3 Overall, we reviewed extensive documentation from DOL—spanning over 10,000 pages of paper-based and electronic files—and spent substantial time cataloging and categorizing it. However, DOL officials reported that certain documentation related to CSPF was no longer available because it had only been retained for the time specified in the records retention policy of the relevant office.
We conducted 23 semi-structured interviews with federal agency officials and other stakeholders, including affected parties, and persons knowledgeable about unions, participants and retirees, the trucking industry, collective bargaining agreements, and multiemployer pension plans. We also interviewed three stakeholders with actuarial expertise to 3DOL identified additional documents located in federal records storage, but determined that those documents contained files pertaining to matters that preceded the establishment of the consent decree in 1982. As a result, we determined that these documents were outside the scope of our review, and we did not examine them.
Semi-structured Interviews

Appendix I: Objectives, Scope, and Methodology
Page 81 GAO-18-106 Central States Pension Fund Investments
specifically understand actuarial standards and procedures. We selected knowledgeable stakeholders based on review of literature and prior GAO work, and recommendations from other stakeholders. We judgmentally selected stakeholders whose expertise coincided with the scope of our objectives and who would be able to provide a broad range of perspectives. In our semi-structured interviews we asked about key factors affecting the plan, the broader regulatory and financial environment in which multiemployer plans operate, and solvency options for plans like CSPF.
We reviewed CSPF’s investment policy statements after CSPF entered into a consent decree in 1982, most of which are documented in the consent decree or other court orders. Seven of the investment policy statements were developed by named fiduciaries in consultation with the plan’s board of trustees and four were developed by the trustees. (See fig. 21.)
Investment Policy Statement Review

Appendix I: Objectives, Scope, and Methodology
Page 82 GAO-18-106 Central States Pension Fund Investments
Figure 21: Timeline of CSPF Investment Policy Statements, 1982–2017
Note: The dual named fiduciary structure was originally effective January 1, 1999. Bankers Trust Company was approved as a second named fiduciary, but on January 29, 1999, Bankers Trust Company submitted its resignation and Morgan Stanley reassumed all of the pension plan’s assets. A dual named fiduciary structure was then effective again on or after July 1, 1999, and Goldman Sachs was appointed as the second named fiduciary over “Group B” assets on November 21, 2000. In addition, effective February 1, 2000, J.P. Morgan replaced Morgan Stanley as named fiduciary over “Group A” assets. We shortened Morgan Stanley’s, Goldman Sachs’, and Northern Trust’s full names because throughout these named fiduciaries’ histories with CSPF, various parts of the broader financial entities have been approved to act as named fiduciaries. We also shortened J.P. Morgan Investment Management Inc. in this figure. CSPF trustees petitioned the court to amend the consent decree in 2003, 2007, and 2010 to add three passive index accounts, referred to in this report as passively-managed accounts.
From each investment policy statement, we compiled relevant information on: (1) investment philosophy and plan characteristics considered in developing it, (2) investment return benchmarks, (3) asset allocation, and (4) strategies and assets. See table 3 for select asset allocation information.

Appendix I: Objectives, Scope, and Methodology
Page 83 GAO-18-106 Central States Pension Fund Investments
Table 3: Selected Details from CSPF Investment Policy Statements, 1982–2017
Entity developing investment policy statement
Applicability dates of investment policy statement (assets, if applicable)
Selected target asset allocation details
NAMED FIDUCIARY-DEVELOPED INVESTMENT POLICY STATEMENTS The Equitable Life Assurance Society of the United States
September 22, 1982 – April 29, 1984
Reduce existing real estate assets in an orderly and gradual manner, while preserving/enhancing their value and optimizing income. Allocate assets generally among the following categories: • mortgages/real estate 20-25%, • fixed income 25-55%, and • equity/common stock 25-45%. At no time will more than 35% of total assets be invested in nonpublicly traded assets.
Morgan Stanley April 30, 1984 – October 31, 1993
Sell existing real estate assets, while optimizing income. Allocate assets generally among the following categories: • mortgages/real estate 5-25%, • fixed income 20-70%, • equity/common stock 20-70%, and • short-term instruments, cash, or cash equivalents 0-50%. At no time will more than 35% of total assets be invested in nonpublicly traded assets.
Morgan Stanley Revised
November 1, 1993 – June/ September 2000
A majority of assets under management should be invested in equity securities. Sufficient cash will be available to meet the plan’s current needs. At no time will more than 25% of total assets under management be invested in nonpublicly traded assets.
J.P. Morgan June 30, 2000 – May 31, 2005 (“Group A”)
A majority of assets under management should be invested in equity securities. Sufficient cash will be maintained to meet the plan’s current and short-term needs. At no time will more than 15% of total assets under management be invested in nonpublicly traded assets.
Goldman Sachs September 2000 – August 2, 2010 (“Group B”)
Policy does not specify asset allocation details but indicates slightly higher tolerance for risk in conjunction with its equity portfolio. As part of the fixed income segment, it specifies that a separately managed short-term cash equivalent portfolio will be maintained to meet liquidity needs.
Northern Trust June 1, 2005 – April 2017 (“Group A” until August 2010 when Northern Trust began to manage all plan assets allocated to named fiduciaries according to this policy)
A majority of assets under management should be invested in equity or equity-type securities. Sufficient cash will be maintained to meet the plan’s current and short-term needs. At no time will more than 15% of total assets under management be invested in nonpublicly traded assets.

Appendix I: Objectives, Scope, and Methodology
Page 84 GAO-18-106 Central States Pension Fund Investments
Entity developing investment policy statement
Applicability dates of investment policy statement (assets, if applicable)
Selected target asset allocation details
NAMED FIDUCIARY-DEVELOPED INVESTMENT POLICY STATEMENTS Northern Trust Revised April 17, 2017 –
– present A majority of assets under management will generally be invested in fixed income assets, including short duration securities. The movement towards fixed income assets will be prudent, gradual, and in compliance with the court-authorized allocation under the consent decree. Sufficient cash will be maintained to meet the plan’s current and short-term needs. To manage risk and provide liquidity, no assets under Northern Trust control will be invested in nonpublicly traded securities.
TRUSTEE-DEVELOPED INVESTMENT POLICY STATEMENTS Trustees July 1, 2003 –
June 30, 2017 (passively-managed domestic fixed income account)
Investment manager will seek to replicate the characteristics of the Lehman Brothers Aggregate Bond Indexa with respect to duration, asset class distribution, sector distribution, quality distribution, coupon, maturity and yield. The manager will do this by investing in a representative sample of the securities in the index, selecting issues that represent an entire class or type of securities in the index.
Trustees December 26, 2007 – present (passively-managed domestic equity account)
Investment manager will seek to replicate the characteristics of the Standard & Poor’s 500 Index, remaining fully invested in the equity market at all times, and holding each security of the Standard & Poor’s 500 Index in the same index weight.
Trustees September 1, 2010 – present (passively-managed international equity account)
Investment manager will seek to replicate the characteristics of the Morgan Stanley Capital International Europe, Australasia, Far East Index (MSCI EAFE Index), remaining fully invested in the equity market at all times, and holding each security of the MSCI EAFE Index in the same index weight.
Trustees July 1, 2017 – present (passively-managed domestic fixed income account)
Investment manager will seek to replicate the characteristics of any of a number of applicable, intermediate and shorter term indices with respect to duration, asset class distribution, sector distribution, quality distribution, coupon, maturity and yield by investing in a representative sample of the securities in the index, selecting issues that represent an entire class or type of securities in the index. Specifically, the investment manager will decrease the account’s allocation to the Bloomberg Barclay’s US Aggregate Bond Index starting in the second quarter of 2017 in favor of intermediate term indices. Then, the manager will gradually increase the account’s allocation to shorter term and government-issued fixed income securities, trying to invest in securities with maturity dates that match the plan’s expected cash flow.
Source: GAO analysis of Central States, Southeast and Southwest Areas Pension Fund (CSPF) Investment Policy Statements. | GAO-18-106
Note: We shortened Morgan Stanley’s, Goldman Sachs’, and Northern Trust’s full names because throughout these named fiduciaries’ histories with CSPF, various parts of the broader financial entities have been approved to act as named fiduciaries. We also shortened J.P. Morgan Investment Management Inc. in this figure. CSPF trustees petitioned the court to amend the consent decree in 2003, 2007, and 2010 to add three passive index accounts, referred to in this report as passively-managed accounts. aThe Lehman Brothers Aggregate Bond Index is now called the Bloomberg Barclays US Aggregate Bond Index.

Appendix I: Objectives, Scope, and Methodology
Page 85 GAO-18-106 Central States Pension Fund Investments
To describe how CSPF’s investment policy was executed, we compiled information from performance reports prepared by named fiduciaries. We reported CSPF’s asset allocation generally based on the aggregate asset allocation categories CSPF’s named fiduciaries assigned in those reports. CSPF provided these reports for the end of each year 1984 through 2016—except 1992 and 1995, for which it provided reports as of the end of November. Information we compiled included the plan’s:
• total assets;
• account breakdown (i.e., assets in named fiduciary and passively-managed accounts);
• asset allocation; and
• investment assets withdrawn to pay benefits and administrative expenses.
When possible, we checked the information from year-end performance reports against that in other sources. Specifically, to ensure we captured the vast majority of the plan’s assets in our asset summary we compared the total amount of plan assets named fiduciaries reported with Net Assets reported in CSPF’s Form 5500 filings, available from 1982 through 2016.4 We generally found these totals to be similar for each year—in most years the difference was about or under 1 percent.5 Also, named fiduciary performance reports included information on withdrawals from investment assets to meet pension and administrative expense obligations as of the end of each year, except for 1995 and 1999-present. For 1995 through 2016, we compiled this information from independent special counsel reports. For years in which we had overlapping information, 1996 through 1998, we found the reported totals were 4For our purposes, we determined we could rely on the Net Asset totals reported in CSPF’s Form 5500 filings from 1982 through 2016 because the plan’s independent external auditors had opined in each of those years that CSPF’s financial statements presented CSPF’s financial status fairly and were prepared in accordance with generally accepted accounting principles. 5In 1992 and 1995, the difference was over 2 percent because we compared November performance report totals against year-end Form 5500 filing totals. We expected performance reports prepared by the plan’s named fiduciaries to include the vast majority of the plan’s assets because these reports include all investment assets under named fiduciary control and, when applicable, all investment assets in CSPF’s passively-managed accounts. However, when applicable, assets held to pay benefits and administrative expenses were not included in any of the asset allocation totals we present in this report.
Asset Summary

Appendix I: Objectives, Scope, and Methodology
Page 86 GAO-18-106 Central States Pension Fund Investments
similar—no more than about 0.6 percent difference in each of those years. Based on our review we believe that the differences were insignificant to our overall analysis and did not impact our findings.
To determine investment returns, investment fees, and administrative expenses for CSPF and related comparator group multiemployer defined benefit plans, we analyzed electronic Form 5500 information, the primary, federal source of private pension data. We analyzed information from 2000 through 2014, the most current and complete year at the time we performed our analysis. We began our analysis with 2000 data as data on investment returns and plan fees is primarily found in the Schedule H. Schedule H information was first collected in 1999. But we begin our analysis with 2000 data as electronic data became more reliable the year after the schedule was introduced.
We have previously reported on the problems associated with the electronic data of the Form 5500.6 To mitigate problems associated with the data, we used Form 5500 research data from PBGC. PBGC analysts routinely and systematically correct the raw 5500 data submitted by plans, and PBGC’s Form 5500 research data are thought to be the most accurate electronic versions. Although we did not independently audit the veracity of the PBGC data, we took steps to assess the reliability of the data and determined the data to be sufficiently reliable for our purposes. For example, we performed computer analyses of the data and identified inconsistencies and other indications of error and took steps to correct inconsistencies or errors. A second analyst checked all computer analyses.
Funded status is a comparison of plan assets to plan liabilities. One measure of funded status is the funded percentage, which is calculated by dividing plan assets by plan liabilities. Another measure of funded status is the dollar amount of difference between plan assets and plan liabilities; the excess of plan liabilities over plan assets is the unfunded 6See GAO, Private Pensions: Participants Need Information on the Risks of Investing in Employer Securities and the Benefits of Diversification, GAO-02-943 (Washington, D.C.: Sept. 6, 2002); Retirement Income Data: Improvements Could Better Support Analysis of Future Retirees’ Prospects, GAO-03-337 (Washington, D.C.: Mar. 21, 2003); Private Pensions: Multiemployer Plans Face Short- and Long-Term Challenges, GAO-04-423 (Washington, D.C.: Mar. 26, 2004); and Private Pensions: Publicly Available Reports Provide Useful but Limited Information on Plans’ Financial Condition, GAO-04-395 (Washington, D.C.: Mar. 31, 2004).
Form 5500 Data Analysis
Funded Status

Appendix I: Objectives, Scope, and Methodology
Page 87 GAO-18-106 Central States Pension Fund Investments
liability (or surplus if assets exceed liabilities). In this report, we measured funded status using the Actuarial Value of Assets and the Actuarial Accrued Liability, which are the basic measures used to determine the annual required minimum contribution for multiemployer plans under ERISA. We chose these measures because of the consistent availability of data for these measures. There are other ways to measure plan assets and plan liabilities.7 The Actuarial Value of Assets can be a “smoothed” value that differs from the market value of plan assets. The Actuarial Accrued Liability depends on the choice of actuarial cost method and discount rate, and on whether it is determined on an ongoing plan basis or a plan close-out basis. While different measures of plan assets and liabilities will produce different measures of funded status at any particular point in time, we found that our use of the Actuarial Value of Assets and the Actuarial Accrued Liability was sufficient for our purposes, which included examining the plan’s progress relative to statutory funding standards as well as its trend over time.
We developed multiple comparison groups for our analysis. The general rationale behind these comparator groups is to identify plans with similar fundamental characteristics, such as plan size or plan maturity, for purposes of investment return and fee and expense comparisons. We created the following two comparator groups:
1. Large plans (in terms of assets). We ordered multiemployer defined benefit plans by descending 2014 plan assets (line 2a of the 2014 of the Schedule MB).8 Because one of our key analyses of the data involves comparing investment returns across plans, we also limited the comparable plans to those that share a common plan year to CSPF (specifically if they have the same plan year-end of December
7 See GAO-14-264. 8Unless otherwise noted, all line items of the Form 5500 and Schedules are for 2014. For years prior to 2014, our analysis of the 5500 data uses data representing the same data element in the PBGC Form 5500 research database, however, the line item location may be different due to changes in the form or schedule over time.
Comparator Group Construction
Appendix I: Objectives, Scope, and Methodology
Page 88 GAO-18-106 Central States Pension Fund Investments
31). We selected the 20 plans that had the largest plan asset values.9 This includes CSPF, which was the second largest multiemployer plan as of the beginning of 2014. Because these comparator plans are among the largest, they should have similar cost advantages. For example, for investment management services, they should have similar advantages in obtaining lower fees and thus garner greater net returns due to the more favorable fee structures.10
2. Mature plans (in terms of retiree liability proportions). We ordered multiemployer defined benefit plans by their similarity to CSPF’s ratio of retiree to total liabilities as of the beginning of calendar year 2000. The ratio of retiree to total liabilities is defined as line 2(b)1(3) of the 2000 Schedule B divided by total liabilities of line 2(b)4(3) of the 2000 Schedule B.11 To compare retiree to total liability ratios, we created a variable for the absolute value of the difference between CSPF’s ratio and that of a given plan. We ordered the plans by ascending differences in the ratios (excluding any with missing differences). CSPF was the top plan because its difference is zero by definition. Because one of our key analyses of the data involved comparing investment returns across plans, we also limited the comparable plans to those that shared a common plan year with CSPF (specifically if
9Of the 20 plans, some were omitted from our analyses based on our criteria for removal. For the investment return analysis we removed a comparator plan if, over the 2000 to 2014 period, the plan had 4 or more years of missing data (either because the data was missing from the database or because we omitted calculated data that could be materially influenced by assumptions about the timing of significant cash flows, such as large transfers of assets into or out of the plan). Thus, figure 22, comparing large plan investment returns, has 17 total comparators (including CSPF). However, the timing of cash flows did not affect our fee and expense analysis. For example, figure 23 that compares annual administrative expenses includes a total of 19 (including CSPF) comparators—or two more comparators than in our investment return analysis of large comparators. 10See Alicia H. Munnell, Jean-Pierre Aubrey, and Caroline V. Crawford, “Investment Returns: Defined Benefit vs. Defined Contribution Plans,” Center for Retirement Research at Boston College, Number 15-21 (Chestnut Hill, MA: Dec. 2015). For example, table 4 shows that, using Form 5500 returns for defined benefit plans, weighted geometric returns are 30 basis points (0.30 percentage points) greater for defined benefit plans with greater than $100 million in assets compared to the geometric weighted return for all plans. 11As noted earlier, we associated the PBGC database data elements with their equivalent element in the 2014 Form 5500, which addresses changes in line item numbers over time. In 2014, the equivalent ratio of retiree-to-total liabilities divides line 2(b)1(2) of the 2014 Schedule MB by line 2(b)4(2) of the Schedule MB. In 2000, the actuarial schedule was known as the Schedule B for both single-employer and multiemployer plans. Beginning in 2008, the actuarial schedule was segregated into a single-employer schedule, known as the Schedule SB, and a multiemployer schedule, known as the Schedule MB.

Appendix I: Objectives, Scope, and Methodology
Page 89 GAO-18-106 Central States Pension Fund Investments
they have the same plan year-end of December 31). Of the plans that had the same plan year as CSPF and assets over $300 million, we selected the 20 plans (including CSPF) that had the smallest absolute difference from CSPF in the retiree-to-total liability ratio.12 Plans with a high ratio of liabilities attributable to retirees will have a relatively large portion of future benefit payments attributable to those that are older and retired. By selecting plans that were similarly mature to CSPF (and had $300 million in assets as of the beginning of 2000), we identified plans that may have had a similar basis for their plan investments, similar cash flow characteristics, or similar potential deviations between time-weighted and dollar-weighted average investment returns over time (see section below entitled “Calculation of Average Investment Return over Multiple Years”). That is, these plans should have roughly similar cost advantages and similar considerations in their investment objectives such as the balance of cash flows into and out of the fund and the plans’ investment horizons. Similarity in the balance of cash flows is important because it helps to mitigate the influence of plan maturity on the weighted average investment return over multiple years.13 The year 2000 was used to select the group because the primary purpose of this group is comparison of investment returns for plans that are similarly situated at the beginning of the period being analyzed.
Our calculation of investment returns is based on the investment return calculation expressed in the Form 5500 instructions for the Schedule MB. Specifically the instructions of the 2014 Schedule MB state:
Enter the estimated rate of return on the current value of plan assets for the 1-year period ending on the valuation date. (The current value is the same as the fair market value—see line 1b(1) instructions.) For this purpose, the rate of return is determined by using the formula 2I/(A + B – I), where I is the dollar amount of the investment return, A is the current value of the assets 1 year ago, and B is the current value of the assets on the current valuation
12 Of the 20 plans, some were omitted from our analyses based on our criteria for removal. We removed a comparator plan if, over the 2000 to 2014 period, the plan had 4 or more years of missing data (either because the data was missing from the database or because we omitted calculated data that could be materially influenced by assumptions about the timing of significant cash flows, such as large transfers of assets into or out of the plan). Thus, for figure 18, we note that annual investment returns for mature plans ultimately includes 16 comparator plans (including CSPF). 13 See “Calculation of Average Investment Return over Multiple Years” below.
Calculations of Annual Investment Returns

Appendix I: Objectives, Scope, and Methodology
Page 90 GAO-18-106 Central States Pension Fund Investments
date. Enter rates to the nearest .1 percent. If entering a negative number, enter a minus sign (“ - “) to the left of the number.
After preliminary analysis of the variable and consultation with a GAO senior actuary, we determined that Form 5500, Schedule H contains all the information necessary to derive the calculation for years prior to 2008—as far back as 1999 when the Schedule H first came into existence. Additionally, we made adjustments for the timing of cash flows, to the extent indicated by the data. For example, employer and employee contributions that were considered receivable at the end of the prior year and thus included in the Schedule MB calculation were instead included in the year when the plan received the cash for the contribution. Thus, our calculation of annual rate of return is expressed as line items of the 2014 Schedule H to be:
2 * [{item 2d} - {item 2a(3)} – {item 2c}] / [[{item1(f)a} – {item 1(b)1(a)} - {item 1(b)2(a)} - {item 1j(a)}] + [{item1(f)b} – {item 1(b)1(b)} - {item 1(b)2(b)} - {item 1j(b)}] – [{item 2d} - {item 2a(3)} – {item 2c}]]
Or expressed with expository names as:
For purposes of data reliability and validation of our results, we ran permutations of the calculation to see how, if at all, certain items could influence the calculation. In two permutations, we changed the timing of net asset transfers to or from other plans. (This occurs when, for example, there is a plan merger.) A senior actuary determined whether the calculations with/without net asset transfers affected our calculation. If the timing of the net transfer caused the investment return calculation to vary by more than 0.1 percent, we excluded the data for that particular plan in that particular year. We also ran another calculation that did not include “other” income so we could estimate the impact of not adjusting for such information.
(2 * (TLINCOME - TOTLCON - OTHERINCOMEW)) / ((TASSTSBY - (ERCONBOY + EECONBOY + OTHER_LIAB_BOY_AMT)) + (TASSTSEY - (ERCONEOY + EECONEOY + OTHER_LIAB_EOY_AMT)) - (TLINCOME - TOTLCON - OTHERINCOMEW))

Appendix I: Objectives, Scope, and Methodology
Page 91 GAO-18-106 Central States Pension Fund Investments
Historical average investment returns over multiple years can be calculated in at least two different ways.14 One measure is the “time-weighted” average return, calculated as a geometric average of the annual returns during the period.15 A time-weighted average measures average investment performance without regard to the order of the annual returns or the impact of different plan circumstances over time. Another measure is the “dollar-weighted” average return–also known as the “internal rate of return” (and also referred to as the “cash flow weighted” return in this report)—which reflects the impact of the plan’s cash flow pattern. The dollar-weighted average return is the rate that, when applied over time to the asset value at the beginning of the period and to each year’s net cash flow into or out of the plan over the period, reproduces the asset value at the end of the period.
We calculated dollar-weighted average returns (along with some time-weighted returns for comparison), for both CSPF and for the multiemployer system as a whole, as discussed in the report. We used a market value of plan assets for this purpose. The dollar-weighted average captures the impact of negative cash flow on average investment return. For example, with negative cash flow, investment results in an earlier year can have a bigger impact than investment results in a later year because more money is at stake in the earlier year.
Using the same beginning-of-period asset value, and subsequent annual net cash flows into or out of the plan, used in calculating the dollar-weighted average return, we also performed a hypothetical calculation of what CSPF’s end-of-period asset value would have been if the plan had earned 7.5 percent per year instead of its actual return.
Investment Fee Calculations
Conceptually, there are multiple ways to express investment fees, but our analysis used the following two methods for calculating them:
• Investment fee ratio. Investment fees [line 2i(3) of the 2014 Schedule H] divided by end-of-year net assets [line 1l(b) of the 2014
14 See GAO-14-264. 15 An even simpler version of this metric would be as an arithmetic average rather than a geometric average, but an arithmetic average can be misleading.
Calculation of Average Investment Return over Multiple Years
Calculation of Fees and Expenses

Appendix I: Objectives, Scope, and Methodology
Page 92 GAO-18-106 Central States Pension Fund Investments
Schedule H] less receivables [line 1b(1)(b); line 1b(2)(b); and line 1b(3)(b) of the 2014 Schedule H].16
• Investment fees per participant. Investment fees [line 2i(3) of the 2014 Schedule H] divided by total (end-of-year) participants [line 6f of the 2014 main form].
We define administrative expenses as all other expenses besides investment fees. In part, we used this definition of administrative expenses as it represents the expenses that remain after excluding investment fees. In addition, according to a PBGC analyst, this is the unit of analysis that they also used in their study of administrative expenses.17
• Administrative expense to benefits paid. This is administrative expenses (professional, contract and other) divided by benefits paid. For administrative expenses we derived the value by taking total expenses [line 2i(5) of the 2014 Schedule H] less investment fees [line 2i(3) of the Schedule H]. For benefits paid, we used the 2014 Schedule H, line 2e(1), “Benefit payment and payments to provide benefits directly to participants or beneficiaries, including direct rollovers.” However, if the benefit payment value for such payments is missing or zero, we used the 2014 Schedule H, line 2e(4) “Total Benefit Payments” since the plan may be expressing their benefit payments on another line.
• Administrative expense per participant. Administrative expenses (professional, contract and other) divided by total (end-of-year) participants [line 6f of the 2014 Form 5500]. For administrative expenses we derived the value by taking total expenses [line 2i(5) of the 2014 Schedule H] less investment fees [line 2i(3) of the 2014 Schedule H].
16The rationale for removing receivables is that these are not yet assets under management for purposes of investing such assets, so expenses would not be charged for their management. Also, the employer-contribution and employee-contribution receivables are the same receivables used in the investment return calculation, which are also removed from total assets for a similar rationale. 17See section below for more on PBGC study.
Administrative Expense Calculations
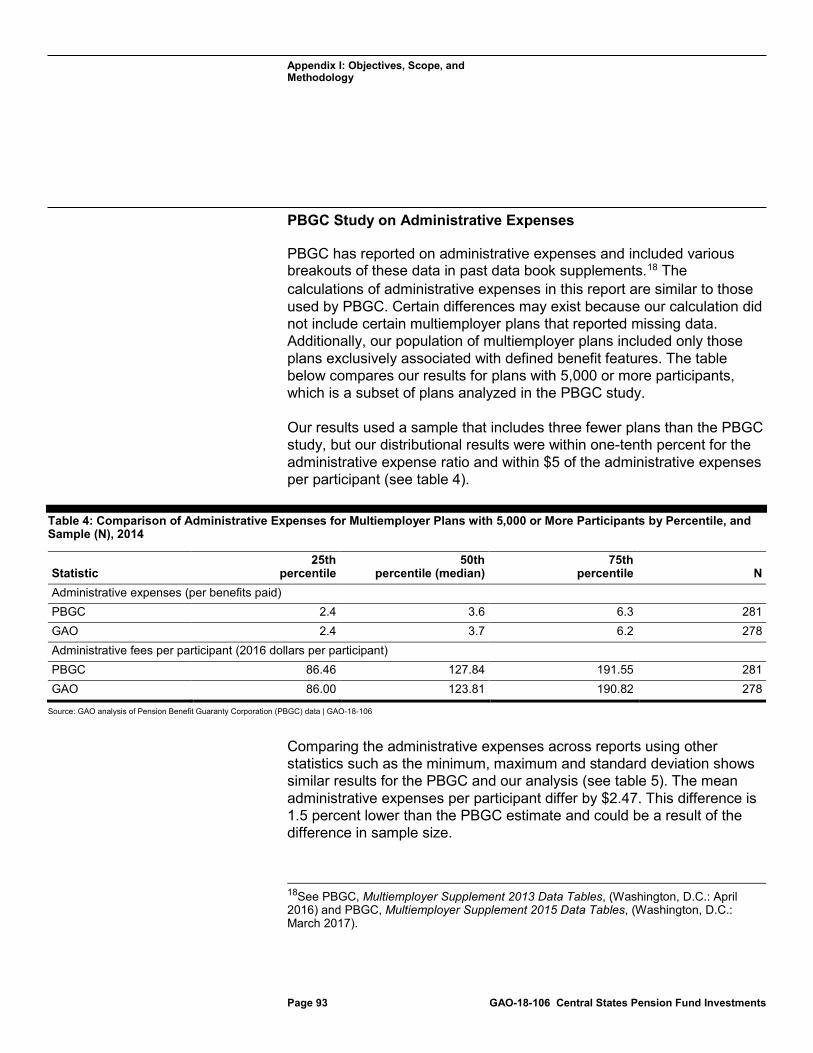
Appendix I: Objectives, Scope, and Methodology
Page 93 GAO-18-106 Central States Pension Fund Investments
PBGC Study on Administrative Expenses
PBGC has reported on administrative expenses and included various breakouts of these data in past data book supplements.18 The calculations of administrative expenses in this report are similar to those used by PBGC. Certain differences may exist because our calculation did not include certain multiemployer plans that reported missing data. Additionally, our population of multiemployer plans included only those plans exclusively associated with defined benefit features. The table below compares our results for plans with 5,000 or more participants, which is a subset of plans analyzed in the PBGC study.
Our results used a sample that includes three fewer plans than the PBGC study, but our distributional results were within one-tenth percent for the administrative expense ratio and within $5 of the administrative expenses per participant (see table 4).
Table 4: Comparison of Administrative Expenses for Multiemployer Plans with 5,000 or More Participants by Percentile, and Sample (N), 2014
Statistic 25th
percentile 50th
percentile (median) 75th
percentile N Administrative expenses (per benefits paid) PBGC 2.4 3.6 6.3 281 GAO 2.4 3.7 6.2 278 Administrative fees per participant (2016 dollars per participant) PBGC 86.46 127.84 191.55 281 GAO 86.00 123.81 190.82 278
Source: GAO analysis of Pension Benefit Guaranty Corporation (PBGC) data | GAO-18-106
Comparing the administrative expenses across reports using other statistics such as the minimum, maximum and standard deviation shows similar results for the PBGC and our analysis (see table 5). The mean administrative expenses per participant differ by $2.47. This difference is 1.5 percent lower than the PBGC estimate and could be a result of the difference in sample size.
18See PBGC, Multiemployer Supplement 2013 Data Tables, (Washington, D.C.: April 2016) and PBGC, Multiemployer Supplement 2015 Data Tables, (Washington, D.C.: March 2017).

Appendix I: Objectives, Scope, and Methodology
Page 94 GAO-18-106 Central States Pension Fund Investments
Table 5: Comparison of Administrative Expenses for Multiemployer Plans with 5,000 or More Participants, by Minimum, Mean, Maximum, Standard Deviation, and Sample (N), 2014
Statistic Minimum Mean Maximum
Standard Deviation N
Administrative expenses (per benefits paid) PBGC 0.0 6.3 118.4 10.2 281 GAO 0.0 6.3 118.4 10.2 278 Administrative fees per participant (Dollars per participant) PBGC 0.0 163.37 3992.86 255.27 281 GAO 0.0 165.84 3992.86 255.28 278
Source: GAO analysis of Pension Benefit Guaranty Corporation (PBGC) data | GAO-18-106
We also performed additional analyses as summarized below.
Large Plan Returns
We compared CSPF’s annual returns against plans that have the largest assets among multiemployer defined benefit plans (with the same plan year as CSPF) and CSPF’s results against these plans were broadly similar to results for the mature plans (see fig. 22).
Additional Analysis

Appendix I: Objectives, Scope, and Methodology
Page 95 GAO-18-106 Central States Pension Fund Investments
Figure 22: CSPF’s Annual Investment Returns among Large Plans, 2000–2014
Note: We defined largest as the 20 multiemployer defined benefit plans having the largest asset values as of January 1, 2014, which includes the Central States, Southeast and Southwest Areas Pension Fund (CSPF). To ensure that the analysis period was directly comparable (and for comparability with investment returns), the selected plans also had the same December 31 year-end date. Three plans have been removed from this analysis. (One was removed because the plan had 4 or more years of missing data. Two plans were removed because they had large plan transfers and missing data.) For the remaining plans in the comparison, there may be plan data missing in certain years.
Alternative Expense Statistics
We compared CSPF’s administrative expenses as a percentage of benefit paid against other large plans. As noted in this report, CSPF has the lowest relative administrative expenses among the comparators in 2014 with administrative expenses at 1.4 percent of benefits (see fig. 23).

Appendix I: Objectives, Scope, and Methodology
Page 96 GAO-18-106 Central States Pension Fund Investments
In addition, CSPF’s administrative expenses as a percentage of benefits were consistently below the median.
Figure 23: Annual Administrative Expenses (Less Investments) as a Percentage of Benefits Paid among Largest Multiemployer Plans, 2000–2014
Note: We defined largest as the 20 multiemployer defined benefit plans having the largest asset values as of January 1, 2014, which includes the Central States, Southeast and Southwest Areas Pension Fund (CSPF). To ensure that the analysis period was directly comparable (and for comparability with investment returns), the selected plans also had the same December 31 year-end date. One plan has been removed from this analysis because the plan had 4 or more years of missing data. For the remaining plans in the comparison, there may be plan data missing in certain years. CSPF noted that the plan had categorized an investment fee as an administrative expense on the plan’s 2004 Form 5500 Schedule H. We did not update our figures in regards to this disclosure as we relied on PBGC Form 5500 research data, which contains the data as it was categorized in 2004. However, in consideration of CSPF’s disclosure, we calculated the changes to investment fees and administrative expenses by shifting the mischaracterized amount noted by CSPF from administrative expenses to investment fees. For 2004, the change in administrative expenses would be a decrease of administrative expenses to 1.4 percent of benefits paid, which is more aligned with CSPF data in other years we analyzed.
For our analysis of Wilshire TUCS data, we used two sources of data. Data from 1999 through 2016 was provided by CSPF. CSPF provided reports of their TUCS custom comparison group, master trusts with greater than $3 billion in assets. These data also included the year-end return results for the total fund (also known as the combined fund) as well as returns by subcategory such as a specific named fiduciary or fund. For example, subcategories listed for year-end 2006 included the results for
Analysis of Wilshire TUCS Data

Appendix I: Objectives, Scope, and Methodology
Page 97 GAO-18-106 Central States Pension Fund Investments
both named fiduciaries (Goldman Sachs and Northern Trust) as well as the passively-managed accounts (then known as the CSSS fund).
The custom comparison groups for the 1999 through 2016 data were determined each year in early-February of the year following the December 31 return results for the prior year. Thus, over time more master trusts were added (or subtracted) depending on the level of assets for the master trusts in that year. For example, the return results for year-end 1999 are determined as of February 10, 2000 and the group of master trusts with more than $3 billion contains 62 observations. The number of trusts in the custom group of master trusts with more than $3 billion generally grew over time with the number peaking with the return results for year-end 2014 (determined as of February 9, 2015), which contains 124 observations.
The TUCS data from 1995 through 1998 was provided by Wilshire. The comparison group for these data were not selected each year, but, instead, selected retrospectively. For example, the comparison group of master trusts with more than $3 billion from 1995 through 1998 was selected as of January 9, 2017. There were 99 reported observations in 1995 and 132 observations in 1998. In addition, the 1995 through 1998 TUCS data did not include specific returns for CSPF. We were able to find the annual year-end return in the December (i.e. year-end) management report, which for these years was provided by the named fiduciary, Morgan Stanley.

Appendix II: Selected Events Affecting the Central States, Southeast and Southwest Areas Pension Fund
Page 98 GAO-18-106 Central States Pension Fund Investments
Below is a list of selected events that have affected the Central States, Southeast and Southwest Areas Pension Fund (CSPF) as identified through a review of relevant documentation and interviews with stakeholders and agency officials.1 It is not intended to be an exhaustive list of the events that have impacted CSPF, nor is it intended to include comprehensive descriptions of each event.
Table 6: Selected Events Affecting CSPF
1Additional information about the events leading up to and immediately following the establishment of the consent decree can be found in GAO, Investigation to Reform Teamsters’ Central States Pension Fund Found Inadequate HRD-82-13 (Washington, D.C.: April 28, 1982), and GAO, The Department of Labor’s Oversight of the Management of the Teamsters’ Central States Pension and Health and Welfare Funds GAO/HRD-85-73 (Washington, D.C.: July 18, 1985).
Appendix II: Selected Events Affecting the Central States, Southeast and Southwest Areas Pension Fund
Date Event Notes 1955 CSPF Established CSPF is established to provide pension benefits to International
Brotherhood of Teamsters members in the trucking industry. 1968 Internal Revenue Service (IRS)
initiates investigation of CSPF IRS focuses on prudence of loans and plan administration.
1974 Employee Retirement Income Security Act of 1974 (ERISA) enacted
ERISA sets minimum standards for most voluntarily established pension and health plans in private industry to provide protection for individuals in these plans. ERISA requires plans to provide participants with information about plan features and funding; sets minimum standards for participation, vesting, benefit accrual and funding; provides fiduciary responsibilities for those who manage and control plan assets; requires plans to establish a grievance and appeals process for participants to get benefits from their plans; gives participants the right to sue for benefits and breaches of fiduciary duty; and, if a multiemployer defined benefit plan becomes insolvent, provides financial assistance to the plan to cover promised benefits (up to a service-based limit) through a federally chartered corporation, known as the Pension Benefit Guaranty Corporation (PBGC).a See Pub. L. No. 93-406, 88 Stat. 829.
PBGC Flat-Rate Premium established
The flat-rate insurance premium that multiemployer plans pay to PBGC is established at $0.50. Employers pay this annual insurance premium for each participant and, in exchange, PBGC insures benefits up to a service-based limit in the event a plan is unable to pay promised benefits.
1975 Department of Labor (DOL) initiates investigation of CSPF
DOL focuses on 82 of 500 real estate loans made by CSPF, more than half of which were made to owners or entities that controlled hotels and casinos in Las Vegas, NV.
DOL meets with CSPF to advise them of investigation
CSPF offers voluntary cooperation and DOL accepts.
Department of Justice (DOJ) joins DOL’s investigation
DOJ focuses on criminal violations.

Appendix II: Selected Events Affecting the Central States, Southeast and Southwest Areas Pension Fund
Page 99 GAO-18-106 Central States Pension Fund Investments
Date Event Notes 1976 IRS revokes CSPF’s tax-exempt
status retroactive to 1965 Some employers withhold contributions. Twelve trustees resign.
Two weeks later IRS provides relief from the retroactive effect
IRS and CSPF negotiate regarding corrective actions.
1977 IRS requalifies fund’s tax-exempt status IRS and Labor set conditions for the restoration of the fund’s tax exempt status, which CSPF agrees to meet
Under the Internal Revenue Code, plans must be designated as qualified plans in order to establish and retain their tax-exempt status. This status allows contributing employers to deduct payments made to the plan on behalf of employees. Four holdover trustees resign and the plan appoints independent investment managers.
1978 CSPF formally terminates voluntary cooperation with DOL’s investigation
CSPF initially chose to voluntarily cooperate with an ongoing DOL investigation; however, in 1978, CSPF decided to end its voluntary cooperation leading DOL to pursue legal action.
DOL files a civil suit against 17 former trustees
As a result of investigations, on February 1, 1978, DOL files a civil suit to recover losses resulting from alleged breaches of fiduciary duties identified in 15 transactions, including mismanagement of fund assets.
1979 CSPF stops complying with requalification terms and bars IRS from making onsite audit
CSPF, which had been meeting IRS’ qualification terms set by IRS and Labor in 1977, chooses to stop adhering to the terms. Further, CSPF bars IRS from conducting onsite compliance audits.
PBGC premium increase The PBGC flat-rate premium for multiemployer plans is gradually increased from $0.50 to $1.00.
1980 Motor Carrier Act of 1980 enacted (deregulation)
The act “deregulates” the trucking industry by, in part, prohibiting interference with any carrier’s ability to publish its own shipping rates. See Pub. L. No. 96-296, 94 Stat. 793.
Multiemployer Pension Plan Amendments Act of 1980 (MPPAA) enacted
MPPAA strengthens the pension protection program for multiemployer plans. The act establishes mandatory requirements for financially weak multiemployer plans in “reorganization” and imposes new financial requirements on employers dropping out of plans (i.e., withdrawal liability). Employers who cease to have an obligation to contribute to multiemployer plans are made generally liable to the plan for a share of the plan’s underfunding. See Pub. L. No. 96-364, 94 Stat. 1208.
PBGC Premium Increase The PBGC flat-rate premium for multiemployer plans is increased from $1.00 to $1.40.
1981 DOL lawsuit expanded Nine loan transactions are added to DOL’s complaint. IRS provides a letter to the plan requiring them to follow certain actions to retain their tax qualification
IRS requires, with the exception of1 month of administrative and benefit expenses, all assets be transferred to qualified independent asset managers.
1982 CSPF and DOL enter into consent decree
CSPF and DOL enter into a court-enforceable consent decree overseen by the Court with the help of an independent special counsel.
Original named fiduciary under the consent decree
Equitable Life Assurance Society of the United States (Equitable) acts as the plan’s initial named fiduciary. Equitable had been serving at the time the consent decree was established.
Employee benefit at $775 per month
At the time the consent decree was entered into, the CSPF maximum employee retirement benefit is $775 per month. This benefit was available to participants who had 20 years of service and were at least 60 years old.

Appendix II: Selected Events Affecting the Central States, Southeast and Southwest Areas Pension Fund
Page 100 GAO-18-106 Central States Pension Fund Investments
Date Event Notes 1984 Change in named fiduciary and
investment policy Morgan Stanley succeeds Equitable as the plan’s single named fiduciary in January, and adopts a new investment policy statement in April.
PBGC premium increase The PBGC flat-rate premium for multiemployer plans is increased from $1.40 to $1.80.
1985 “30 and Out” benefit introduced Participants with 30 years of contributions paid on their behalf are eligible to retire at any age ($1,000 per month at any age, up to $1,250 per month at age 65).
1986 Contribution-based benefit introduced
Participants accrue a monthly retirement benefit payable at normal retirement age at 2% of future contributions made on their behalf. This new accrual based benefit is added to the participant’s accrued benefit as of December 31, 1985. Retirement benefits are paid at the greater of the accrued benefit or the “scheduled” benefit.
PBGC premium increase The PBGC flat-rate premium for multiemployer plans is increased from $1.80 to $2.20.
1987 Consent decree amendment The amendment permits CSPF to petition to dissolve the consent decree any time after September 22, 2007 absent good cause shown by DOL, and revises the procedures for the appointment of trustees.
1988 PBGC premium increase The PBGC flat-rate premium for multiemployer plans is increased from $2.20 to $2.60.
1989 Most troubled real estate assets removed from portfolio
Nearly all troubled real estate assets had been sold.
1991 Employee retirement benefit increased
The “30 and Out” benefit is increased to $2,000 per month at any age with a maximum benefit of $2,500 per month at age 65.
1993 UPS employee benefit introduced
A new pension class is established for UPS participants only. In addition to the “30 and Out” benefit of $2,000 per month, a “25 and Out” benefit becomes available at any age in the amount of $1,500 per month.
Investment policy statement revised Morgan Stanley revises its investment policy statement. 1994 National master freight
benefit introduced A new pension class is established for National Master Freight participants. The “30 and Out” pension is increased to $2,500 per month. Later that year, the same benefit becomes available to Car Haul participants.
1998 Consent decree amendment The amendment provides for the appointment of a second named fiduciary. National Master Freight benefit increased
A new pension class is established for National Master Freight participants. The “30 and Out” benefit is increased to $3,000 per month. The eligibility age for the Car Haul benefit for “25 and Out” is reduced from age 57 to age 55.
1999 Consent decree amendment The amendment revises the dual named fiduciary arrangement and the authority of each named fiduciary over fund assets and approves JP Morgan and a second fiduciary to be appointed later pursuant to the amendment.
2000 Changes in named fiduciary and asset allocation become effective
Effective February 1, 2000, J.P. Morgan replaces Morgan Stanley. Goldman Sachs’ is appointed as the second named fiduciary effective in November 2000. Plan assets are split equally between J. P. Morgan (Group A) and Goldman Sachs (Group B).
2001-2002 The “Dot Com Bubble” The market downturn that occurs during 2001-2002, often referred to as the “bursting of the dot-com bubble,” coincides with a downturn in the U.S. economy.

Appendix II: Selected Events Affecting the Central States, Southeast and Southwest Areas Pension Fund
Page 101 GAO-18-106 Central States Pension Fund Investments
Date Event Notes 2003 Consent decree amendment The amendment provides for revisions to the appointment of named
fiduciaries and investment managers and the establishment of a passively-managed domestic fixed income account.
Change in asset allocation becomes effective
CSPF revises the plan structure to move 20% of the portfolio to a passively-managed domestic fixed income account. The remaining assets are split equally between J. P. Morgan (Group A) and Goldman Sachs (Group B).
2004 Contributory credit pensions accruals reduced
Future benefit accruals under the contribution based benefit “and Out” benefits are lowered from 2% to 1% on a prospective basis.b
2005 Consent decree amendments The April 6, 2005 amendment provides for the appointment of a named fiduciary, and changes to the plan’s asset allocation. The May 10, 2005 amendment vacates part of the April 6 amendment and provides for the appointment of a named fiduciary and changes to the plan’s asset allocation.
IRS grants amortization extension
CSPF requests and receives an additional 10-year amortization extension after relating that contribution requirements could force participating employers into bankruptcy.
Change in named fiduciary becomes effective
Northern Trust replaces J. P. Morgan as the named fiduciary in charge of investments for the Group A assets. Northern Trust and Goldman Sachs each assume half of J.P. Morgan’s assets, resulting in the following allocation: Goldman Sachs 60 percent, Northern Trust 20 percent, and passively-managed domestic fixed income account 20 percent.
Deficit Reduction Act of 2005 enacted
For plan years that begin after December 31, 2005, the act sets the PBGC flat-rate premium for multiemployer plans at $8.00 and—for each plan year beginning after 2006—indexes future premium levels to the national average wage index. See Pub. L. No. 109-171, 120 Stat. 4.
2006 Pension Protection Act of 2006 (PPA) enacted
PPA requires certain underfunded multiemployer plans to develop strategies designed to improve their financial condition. See Pub. L. No. 109-280, 120 Stat. 780.
PBGC premium increase Based on changes enacted in 2005, the PBGC flat-rate premium for multiemployer plans is increased from $2.60 to $8.00.
2007 Consent decree amendment The amendment authorizes the court to change all asset allocations at any future time; gives authority to the trustees to appoint, remove, or replace custodians subject to court approval; prospectively requires that named fiduciaries’ authority to adopt and amend investment policies be contingent on approval by the court; establishes a passively-managed domestic equity account; and authorizes the court to approve a transition from two named fiduciaries to one named fiduciary at any future time.
Change in asset allocation becomes effective
In December 2007, CSPF revises the plan structure to move 20% of the portfolio to a passively-managed domestic equity account.
UPS withdraws from CSPF In December 2007, the United Parcel Service, Inc. (UPS) pays a negotiated $6.1 billion to withdraw from the pension fund, and $4.2 billion of this payment, as well as a transfer of $1.2 billion from Goldman Sachs, helps the plan create the passively-managed domestic equity account. From the UPS withdrawal liability payment, $1 billion is allocated to Northern Trust and the other $0.9 billion is allocated to the passively-managed domestic fixed income account.

Appendix II: Selected Events Affecting the Central States, Southeast and Southwest Areas Pension Fund
Page 102 GAO-18-106 Central States Pension Fund Investments
Date Event Notes 2008 Change in asset allocation On February 1, 2008, Goldman Sachs transfers $2.5 billion to Northern
Trust to equalize assets between the two named fiduciaries. As a result of the asset allocation changes in December 2007 and February 2008, as well as the receipt of UPS’s withdrawal liability payment, the passively-managed domestic fixed income and domestic equity accounts each hold 20 percent of the plan’s assets, and the remaining assets are split equally between Northern Trust (Group A) and Goldman Sachs (Group B).
The “Great Recession” The market downturn in 2008 occurs during a period known as the Great Recession, which involves a sharp decline in economic activity throughout the United States.
PBGC premium increase Due to indexation, the PBGC flat-rate premium for multiemployer plans is increased from $8.00 to $9.00.
Worker, Retiree, and Employer Recovery Act of 2008 (WRERA) enacted
WRERA makes several technical corrections to PPA and extends amortization schedules by allowing multiemployer plan trustees to “freeze” a plan’s zone status for1 year or to elect to extend the Funding Improvement Plan or Rehabilitation Plan period by 3 years. See Pub. L. No. 110-458, 122 Stat. 5092.
2010 Consent decree amendment The amendment provides for an asset reallocation from Goldman Sachs to Northern Trust, changes the dual named fiduciary arrangement to a single named fiduciary, and establishes a passively-managed international equity account.
Change in named fiduciary becomes effective
Goldman Sachs resigns and Northern Trust assumes the management of plan assets as the sole named fiduciary.
Change in asset allocation becomes effective
With Goldman Sachs resignation, CSPF moves 5 percent of its portfolio to a passively-managed international equity account and adds 5 percent to the passively-managed domestic equity account. This results in a plan structure of 20 percent of CSPF”s assets in the passively-managed domestic fixed income account, 25 percent in the passively-managed domestic equity account, 5 percent in the passively-managed international equity account, and 50 percent managed by Northern Trust.
2011 Minimum retirement age increased
CSPF Trustees approve a plan amendment establishing age 57 as the minimum retirement age for all participants retiring on or after June 1, 2011. This rule change applies to all participants regardless of benefit class and any “and Out” benefit provisions.
2013 PBGC premium increase The PBGC flat-rate premium for multiemployer plans is increased from $9.00 to $12.00.
2014 Multiemployer Pension Reform Act of 2014 (MPRA) enacted
MPRA provides options for severely underfunded plans to take actions to reduce the possibility of insolvency and increased multiemployer plan premiums. MPRA also resets indexing of multiemployer flat-rate premiums to the national average wage index for plan years beginning after 2015. See Pub. L. No. 113-235, div. O, 128 Stat. 2130, 2773-822.
2015 CSPF submits MPRA application CSPF applies under MPRA to suspend (or reduce) participants’ accrued benefits.
PBGC premium increase Before the enactment of MPRA, PBGC had announced the flat-rate premium for multiemployer plans would be increased to $13.00 due to indexation. As a result of premium changes in MPRA, the PBGC flat-rate premium for multiemployer plans is increased from $12.00 to $26.00.

Appendix II: Selected Events Affecting the Central States, Southeast and Southwest Areas Pension Fund
Page 103 GAO-18-106 Central States Pension Fund Investments
Source: GAO analysis of Central States, Southeast and Southwest Areas Pension Fund (CSPF) documentation and information from stakeholders and agency officials. | GAO-18-106
Notes: While many of these events are unique to CSPF, some events affected all multiemployer pension plans. aERISA provides separate rules for plans sponsored by one employer (single-employer plans), which are not discussed in this report. bCSPF benefits are sometimes referred to as “and Out” benefits—such as “25 and Out” or “30 and Out.”
Date Event Notes 2016 Treasury denies MPRA
application CSPF’s MPRA application is denied because Treasury determines that it fails to satisfy statutory criteria for approval of benefit suspensions—not reasonably expected to avoid insolvency, not equitably distributed across participant and beneficiary populations, and notices of proposed benefit suspensions are not understandable by an average participant.
PBGC premium increase Due to indexation, the PBGC flat-rate premium for multiemployer plans is increased from $26.00 to $27.00.
2017 Consent decree amendment The amendment changes the court-authorized asset allocation to gradually move assets into fixed income and cash equivalents ahead of insolvency, approves asset transfers to implement new asset allocations, and approves changes to the investment policy statement of the passive fixed-income account.
Change in asset allocation becomes effective
The court approves an investment policy change to allow the fund to gradually move assets into fixed income and cash equivalents ahead of insolvency.
PBGC premium increase Due to indexation, the PBGC flat-rate premium for multiemployer plans is increased from $27.00 to $28.00.
2025 Projected insolvency CSPF projects that, all else being equal, the fund will be insolvent on January 1, 2025—having insufficient assets to pay benefits for that year. Beginning January 1, 2025, the plan expects to pay a reduced benefit level throughout the year. Beginning January 1, 2026, the plan expects to receive PBGC financial assistance and benefits would be reduced to the PBGC maximum benefit guarantee.

Appendix III: Key Provisions of the Central States, Southeast and Southwest Areas Pension Fund’s Consent Decree
Page 104 GAO-18-106 Central States Pension Fund Investments
On September 22, 1982, the Department of Labor (DOL) entered into a court-enforceable consent decree with the Central States Southeast and Southwest Areas Pension Fund (CSPF) to help ensure the plan’s assets were managed for the sole benefit of the plan’s participants and beneficiaries as required by the Employee Retirement Income Security Act of 1974 (ERISA). The consent decree has been amended several times and currently remains in effect, as amended, under the jurisdiction of the Federal Court for the Northern District of Illinois, Eastern Division.1 Below is a description of the key parties to and their primary responsibilities under the consent decree.
The consent decree defines roles and responsibilities for its parties, including the court, the court-appointed independent special counsel, DOL, the plan and its Board of Trustees, and the independent asset manager, which is called the named fiduciary.
The primary role of the court is to oversee and enforce the consent decree. Specifically, the court:
• appointed an independent special counsel to assist it in administering the consent decree;
• has approval over the appointment of named fiduciaries and trustees;2
• has approval over the appointment of investment managers of the passively-managed accounts;3
• may, for good cause shown, remove a named fiduciary after 60 days’ notice provided to the named fiduciary and DOL; and
1Unless otherwise clear from context, all references to the consent decree include the original 1982 consent decree and all subsequent amendments to it. 2At least 60 days before the proposed effective date of the appointment of a new trustee or named fiduciary, the plan is required to request the court’s approval. 3In 2003, 2007, and 2010, the consent decree was amended to require a certain percentage of plan assets be placed in passively-managed accounts. At least 30 days before the proposed effective date of the appointment of any passively-managed account managers, the plan is required to request the court’s approval. The 2003 amendment created the passively-managed domestic fixed income account; the 2007 amendment created the passively-managed domestic equity account; and the 2010 amendment created the passively-managed international equity account.
Appendix III: Key Provisions of the Central States, Southeast and Southwest Areas Pension Fund’s Consent Decree
Brief History and Current Status of Consent Decree
Key Parties and Their Primary Roles under Consent Decree
Court

Appendix III: Key Provisions of the Central States, Southeast and Southwest Areas Pension Fund’s Consent Decree
Page 105 GAO-18-106 Central States Pension Fund Investments
• may, upon request by the plan, dissolve the consent decree absent good cause shown by DOL why the consent decree should continue in effect.4
The court-appointed independent special counsel is intended to serve the court by assisting in identifying and resolving issues that arise in connection with the plan’s compliance with the consent decree and Part 4 of Title I of ERISA, and to report on the plan to the court. Specifically, the independent special counsel:
• has full authority to examine the plan’s activities and oversee and report on the plan’s performance of the undertakings of the consent decree;
• may, with court approval, employ attorneys, accountants, investigators, and others reasonably necessary and appropriate to aid him in the exercise of his responsibilities;
• has full access to all documents, books, records, personnel, files, and information of whatever type or description in the possession, custody, or control of the plan;
• may attend meetings of the plan, including meetings of the board of trustees and any meetings at which plan-related matters are discussed or considered;
• can petition the court to compel the plan to cooperate with the independent special counsel in the performance of his duties and responsibilities;5
• may consult with DOL, the Internal Revenue Service, and other agencies, as appropriate, but must provide access to DOL upon its
4Under the original terms of the consent decree, the plan was able to petition the court to dissolve the consent decree for good cause shown after a period of 10 years and after providing notice to DOL. After a period of 15 years, CSPF was able to petition the court to dissolve the consent decree without cause, absent good cause shown by DOL for why it should remain in effect. In 1987, the consent decree was amended to permit CSPF to petition the court to dissolve the consent decree any time after September 22, 2007, absent good cause shown by DOL for why it should continue in effect. 5Additionally, administrators, fiduciaries, officers, trustees, custodians, counsels, agents, employees, advisers, providers of goods and services, consultants, representatives in any capacity, and all persons who serve in any capacity that involves decision-making authority or custody or control of the moneys, funds, or assets of the plan, as a condition of maintaining their relationships with the plan, are required to cooperate fully with the independent special counsel.
Independent Special Counsel

Appendix III: Key Provisions of the Central States, Southeast and Southwest Areas Pension Fund’s Consent Decree
Page 106 GAO-18-106 Central States Pension Fund Investments
request to any documents prepared by the independent special counsel within the exercise of his power;
• is required to file quarterly reports, as well as any other reports the independent special counsel deems necessary or appropriate, with the court, and provide copies to DOL and the plan;
• may have other powers, duties, and responsibilities that the court may later determine are appropriate; and
• cannot be discharged or terminated during the duration of the consent decree except for leave of court, and upon the termination, discharge, death, incapacity, or resignation of an independent special counsel, the court will appoint a successor.6
Under the consent decree, DOL has an oversight role and may object to certain proposed plan changes. Specifically, DOL:
• may request and review certain reports provided by the plan and any documents prepared by the independent special counsel in the exercise of his authority;
• may object to the appointment of proposed trustees, named fiduciaries, investment managers of the passively-managed accounts, and asset custodians;
• receives notice of proposed changes to the plan’s investment policy statements from the plan; and
• may object to the dissolution of the consent decree.7
6The court chooses a new independent special counsel from a list of three individuals recommended by the plan. 7DOL has the right to object within 30 days of the plan filing a request for court approval of a new trustee or named fiduciary and within 20 days of the plan filing a request for court approval of an investment manager of one of the passively-managed accounts. The court is the final decision maker with regard to any covered action the plan proposes to take.
Department of Labor

Appendix III: Key Provisions of the Central States, Southeast and Southwest Areas Pension Fund’s Consent Decree
Page 107 GAO-18-106 Central States Pension Fund Investments
The plan must operate in full compliance with the consent decree, with ERISA, and with any conditions contained in determination letters it receives from the Internal Revenue Service.8 Specifically, CSPF, its board of trustees, and its internal audit staff must meet certain requirements.9
CSPF
• is required to use an independent asset manager known as the named fiduciary;
• must rebid the named fiduciary role at least once within every 6 years, with the option to extend the appointment for 1 calendar year;
• may remove a named fiduciary without cause shown on 6 months’ written notice to the named fiduciary and DOL;10
• must cooperate with the independent special counsel in the performance of his duties and responsibilities and with DOL in its continuing investigation and enforcement responsibilities under ERISA;
• is required to recommend to the court three replacement candidates, agreeable to DOL, to replace an outgoing independent special counsel; and
• is required to maintain a qualified internal audit staff to monitor its affairs.
Board of Trustees
• is required to appoint, subject to court approval, the investment managers of the passively-managed accounts;
8Specifically, the plan must comply with any Internal Revenue Service determination letters concerning the status of the plan as a qualified pension plan under 26 U.S.C. § 401 or the exemption of the trust from tax under 26 U.S.C. § 501. 9The consent decree generally describes the role of the “pension fund”; however, in certain instances, as described more fully below, the consent decree specifically mentions roles for the board of trustees and an internal audit staff. 10At least 60 days before the termination of a named fiduciary’s appointment, the plan is required to select another independent asset manager to serve as a named fiduciary and request the approval of the court, and the appointment becomes effective immediately upon the removal of a then current named fiduciary.
CSPF (including Board of Trustees and Internal Audit Staff)

Appendix III: Key Provisions of the Central States, Southeast and Southwest Areas Pension Fund’s Consent Decree
Page 108 GAO-18-106 Central States Pension Fund Investments
• is prohibited from authorizing any future acquisitions, investments, or dispositions of plan assets on a direct or indirect basis unless specifically allowed by the consent decree;11 and
• is required to comply with ERISA fiduciary duties, such as monitoring the performance of the assets of the plan, under Part 4 of Title I of ERISA.12
Internal Audit Staff
• is required to review benefit administration, administrative expenditures, and the allocation of plan receipts to investments and administration;13 and
• is required to prepare monthly reports setting forth any findings and recommendations, in cooperation with the executive director of the plan, and make copies available to the independent special counsel and, upon request, to DOL and the court.
11This prohibition applies to any administrator, officer, trustee, agent, or employee of the plan, as well as the board of trustees. Moreover, persons convicted of certain crimes are subject to immediate removal and may not serve the plan as an administrator, fiduciary, officer, trustee, custodian, counsel, agent, employee, adviser, provider of goods or services, consultant, representative in any capacity, or in any capacity that involves decision-making authority or custody of control of the moneys, funds, or assets of the plan for at least 10 years after the conviction or resulting term of imprisonment, whichever is later. 12Although the named fiduciary has a monitoring function under the consent decree, its role does not diminish the fiduciary obligations of the board of trustees under Part 4 of Title I of ERISA or relieve any trustee of any liability. 13The plan may retain to pay benefits and administrative expenses only those assets that it has determined are reasonably necessary to pay benefits and administrative expenses in a particular month. All assets received by the plan and not retained to pay benefits and administrative expenses must be transferred to the named fiduciary and the passively-managed investment managers as allocated in the consent decree.

Appendix III: Key Provisions of the Central States, Southeast and Southwest Areas Pension Fund’s Consent Decree
Page 109 GAO-18-106 Central States Pension Fund Investments
The independent asset managers, known as named fiduciaries, are appointed by the plan’s trustees, subject to court approval, and have exclusive responsibility and authority to manage and control all assets of the plan allocated to them.14 Specifically, the named fiduciaries:
• may allocate plan assets among different types of investments and investment managers;
• have exclusive authority to appoint, replace, and remove those investment managers;
• have responsibility and authority to monitor the performance of their allocated investments; and
• are required to develop, in consultation with the Board of Trustees, and implement investment policy statements for the assets they manage, giving appropriate regards to CSPF’s actuarial requirements.15
14Under the consent decree, each independent asset manager must be a “named fiduciary” as defined in section 402(a)(2) of ERISA and qualified as an investment manager under ERISA section 3(38). See 29 U.S.C. §§ 1102(a) and 1002(38). The consent decree provides additional requirements for a named fiduciary that is a bank, insurance company, broker or dealer, or certain investment adviser. At its inception, the consent decree provided for a single named fiduciary, but in 1998 it was amended to allow for two separate named fiduciaries. Subsequently, in 2007, the consent decree was amended to allow the court to enter an order transitioning to a single named fiduciary at any time, and in 2010 it was amended to provide for a single named fiduciary, but the court retained discretion to require the use of more than one named fiduciary. 15The investment policy statement is intended to set forth the principal considerations and policies that will govern the investment of plan assets. The named fiduciary may change the investment policy statement after it consults with the board of trustees and provides notice of any changes to the court, the independent special counsel, the Secretary of Labor, and the plan, but any change will not remain in effect for more than 90 days without court approval.
Named Fiduciaries

Appendix IV: GAO Contacts and Staff Acknowledgments
Page 110 GAO-18-106 Central States Pension Fund Investments
Charles A. Jeszeck, (202) 512-7215 or [email protected], Frank Todisco, (202) 512-2700 or [email protected]
In addition to the individual named above David Lehrer (Assistant Director), Charles J. Ford, (Analyst-in-Charge), Laurel Beedon, Jessica Moscovitch, Layla Moughari, Joseph Silvestri, Anjali Tekchandani, Margaret J. Weber, Adam Wendel, and Miranda J. Wickham made key contributions to this report. Also contributing to this report were Susan Aschoff, Deborah K. Bland, Helen Desaulniers, Laura Hoffrey, Jennifer Gregory, Sheila McCoy, Mimi Nguyen, Jessica Orr, Monica P. Savoy, and Seyda Wentworth.
Appendix IV: GAO Contacts and Staff Acknowledgments
GAO Contact
Staff Acknowledgments

Related GAO Products
Page 111 GAO-18-106 Central States Pension Fund Investments
Central States Pension Fund: Department of Labor Activities under the Consent Decree and Federal Law. GAO-18-105. Washington, D.C.: June 4, 2018.
High-Risk Series: Progress on Many High-Risk Areas, While Substantial Efforts Needed on Others. GAO-17-317. Washington, D.C.: February 15, 2017.
Pension Plan Valuation: Views on Using Multiple Measures to Offer a More Complete Financial Picture. GAO-14-264. Washington, D.C.: September 30, 2014.
Private Pensions: Clarity of Required Reports and Disclosures Could Be Improved. GAO-14-92. Washington, D.C.: November 21, 2013.
Private Pensions: Timely Action Needed to Address Impending Multiemployer Plan Insolvencies. GAO-13-240. Washington, D.C.: March 28, 2013.
Private Pensions: Multiemployer Plans and PBGC Face Urgent Challenges. GAO-13-428T. Washington, D.C.: March 5, 2013.
Pension Benefit Guaranty Corporation: Redesigned Premium Structure Could Better Align Rates with Risk from Plan Sponsors. GAO-13-58. Washington, D.C.: November 7, 2012.
Private Pensions: Changes Needed to Better Protect Multiemployer Pension Benefits. GAO-11-79. Washington, D.C.: October 18, 2010.
Private Pensions: Long-standing Challenges Remain for Multiemployer Pension Plans. GAO-10-708T. Washington, D.C.: May 27, 2010.
The Department of Labor’s Oversight of the Management of the Teamsters’ Central States Pension and Health and Welfare Funds. GAO/HRD-85-73. Washington, D.C.: July 18, 1985.
Investigation to Reform Teamsters’ Central States Pension Fund Found Inadequate. HRD-82-13. Washington, D.C.: April 28, 1982.
Related GAO Products
(101010)

The Government Accountability Office, the audit, evaluation, and investigative arm of Congress, exists to support Congress in meeting its constitutional responsibilities and to help improve the performance and accountability of the federal government for the American people. GAO examines the use of public funds; evaluates federal programs and policies; and provides analyses, recommendations, and other assistance to help Congress make informed oversight, policy, and funding decisions. GAO’s commitment to good government is reflected in its core values of accountability, integrity, and reliability.
The fastest and easiest way to obtain copies of GAO documents at no cost is through GAO’s website (https://www.gao.gov). Each weekday afternoon, GAO posts on its website newly released reports, testimony, and correspondence. To have GAO e-mail you a list of newly posted products, go to https://www.gao.gov and select “E-mail Updates.”
The price of each GAO publication reflects GAO’s actual cost of production and distribution and depends on the number of pages in the publication and whether the publication is printed in color or black and white. Pricing and ordering information is posted on GAO’s website, https://www.gao.gov/ordering.htm.
Place orders by calling (202) 512-6000, toll free (866) 801-7077, or TDD (202) 512-2537.
Orders may be paid for using American Express, Discover Card, MasterCard, Visa, check, or money order. Call for additional information.
Connect with GAO on Facebook, Flickr, Twitter, and YouTube. Subscribe to our RSS Feeds or E-mail Updates. Listen to our Podcasts. Visit GAO on the web at https://www.gao.gov.
Contact:
Website: https://www.gao.gov/fraudnet/fraudnet.htm
Automated answering system: (800) 424-5454 or (202) 512-7470
Orice Williams Brown, Managing Director, [email protected], (202) 512-4400, U.S. Government Accountability Office, 441 G Street NW, Room 7125, Washington, DC 20548
Chuck Young, Managing Director, [email protected], (202) 512-4800 U.S. Government Accountability Office, 441 G Street NW, Room 7149 Washington, DC 20548
James-Christian Blockwood, Managing Director, [email protected], (202) 512-4707 U.S. Government Accountability Office, 441 G Street NW, Room 7814, Washington, DC 20548
GAO’s Mission
Obtaining Copies of GAO Reports and Testimony Order by Phone
Connect with GAO
To Report Fraud, Waste, and Abuse in Federal Programs
Congressional Relations
Public Affairs
Strategic Planning and External Liaison
Please Print on Recycled Paper.


![GAO Good Food Central Florida _Solar Cooker_MSD_April 18[1]](https://img.dokumen.tips/doc/110x75/577cd3041a28ab9e78967cd4/gao-good-food-central-florida-solar-cookermsdapril-181.jpg)


