Embed Size (px)
DESCRIPTION
Galvanic Corrosion
Citation preview

Surfaces, Interfaces, and their Applications II Galvanic corrosion
Dr. Patrik Schmutz, Laboratory for Joining Technologies and Corrosion, EMPA Dübendorf, 2014 1
5 Galvanic corrosion 5.1 Introduction – relevant factors Definition: Galvanic corrosion occurs when two different metals (alloys) are in electrical contact in a conducting electrolyte, Fig.5.1:
- The more noble (higher potential) element is protected - The more active (lower potential) element corrodes at higher rate
Galvanic coupling is also often used to protect structures with so-called sacrificial anodes:
a) b)
Figure 5.1: Schematic description of “possible” galvanic coupling problems when two dissimilar metals are placed in a solution: (a) in absence of electrical contact, both metals will corrode uniformly and separately, (b) with an electrical contact, the more active material (zinc in this case) will corrode faster and provide the electron to maintain the cathodic reaction on the more noble surface (iron). The main parameters controlling galvanic corrosion processes are: - The difference in corrosion potential (see practical potential series)
- The surface areas ratio between the coupling partners
- The electrolyte conductivity is a crucial parameter
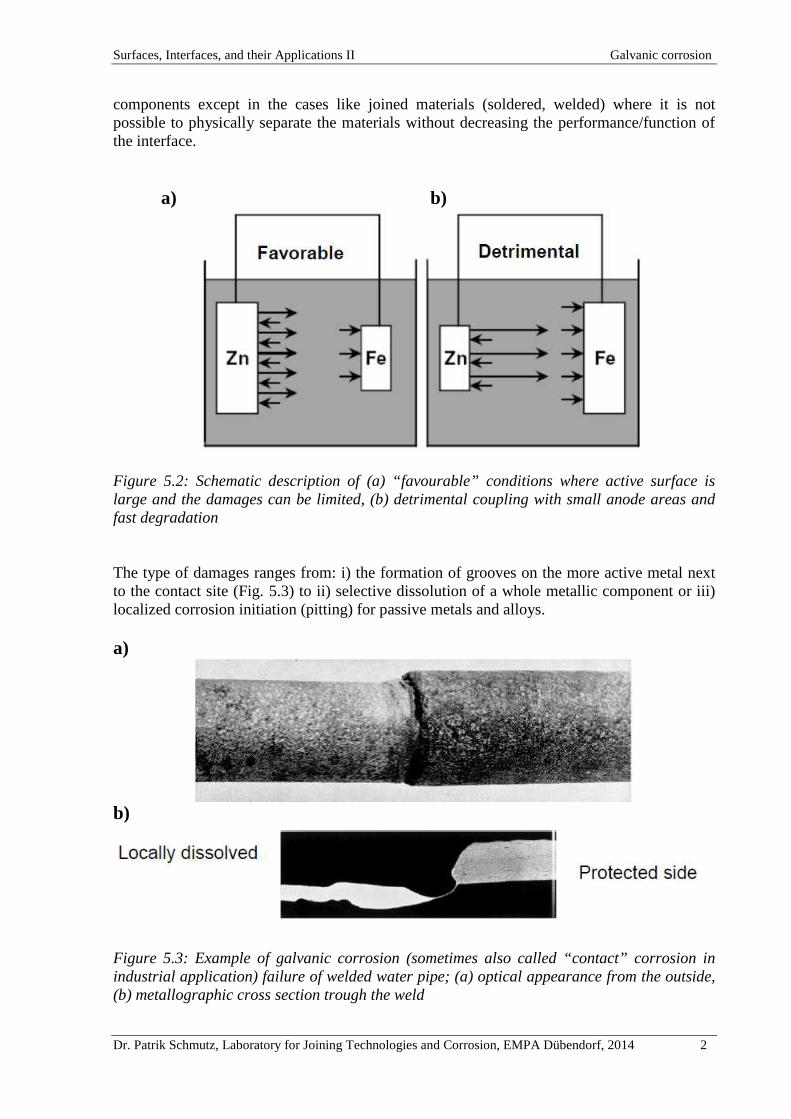
Galvanic corrosion becomes a problem when different corrosion susceptible materials of dissimilar sizes are electrically connected, Fig. 5.2. In the favourable case, with the active surface (called anode) being large (Fig.5.2a), the damages are reduced and controllable, but if the dimension of the active area is small, then very fast degradation occur. Macroscopic galvanic corrosion damage can usually be avoided with a good electrical isolation of the
Surfaces, Interfaces, and their Applications II Galvanic corrosion
Dr. Patrik Schmutz, Laboratory for Joining Technologies and Corrosion, EMPA Dübendorf, 2014 2
components except in the cases like joined materials (soldered, welded) where it is not possible to physically separate the materials without decreasing the performance/function of the interface.
a) b)
Figure 5.2: Schematic description of (a) “favourable” conditions where active surface is large and the damages can be limited, (b) detrimental coupling with small anode areas and fast degradation The type of damages ranges from: i) the formation of grooves on the more active metal next to the contact site (Fig. 5.3) to ii) selective dissolution of a whole metallic component or iii) localized corrosion initiation (pitting) for passive metals and alloys. a)
b)
Figure 5.3: Example of galvanic corrosion (sometimes also called “contact” corrosion in industrial application) failure of welded water pipe; (a) optical appearance from the outside, (b) metallographic cross section trough the weld

Surfaces, Interfaces, and their Applications II Galvanic corrosion
Dr. Patrik Schmutz, Laboratory for Joining Technologies and Corrosion, EMPA Dübendorf, 2014 3
Figure 5.3 shows severe galvanic corrosion attack on welded steel pipe used in a water supply circuit. The outer part of the pipes (Fig. 5.3a) will not show any sign of damages until the welded area will start to leak. In this example, the metallographic cross section (Fig. 5.3b) indicated that as well the welding material is inadequate (low potential actively corroding surface) as also one of the pipe material (left) that suffered from galvanic coupling (pipe wall thinning). The pipe material on the right is completely intact and cathodically protected. In principle, it seems simple to define the susceptibility to galvanic corrosion, but in the practice it is not always straightforward. The standard electrochemical potential (or reversible potentials) scale can be totally misleading and it is always necessary to consider the practical electrochemical potentials in real environments where the components are used. Figure 5.4 displays the difference in measured potentials for a series of industrially relevant materials. It is visible that because some of the reactive materials (Mg, Al, Cr, Ni) form an oxide on their surfaces in neutral NaCl solution, there will be a potential gradient in the oxide (will be discussed later) and a much higher potential is obtained on the surface compared to the standard potential. On the other side, Materials that are “noble” (high standard potential and not oxidizing easily) can experience a potential drop compared to their standard potential due to presence from the environment of additional electrochemical reduction interaction. In this case, it is the equilibrium with the cathodic oxygen reaction for example that will control the potential on the surface.
Figure 5.4: Standard and practical electrochemical potential series for industrially relevant materials
One misleading conclusion that can be drawn when considering only the standard potential scale is for example related to the galvanic coupling process between Zn and Al.
Surfaces, Interfaces, and their Applications II Galvanic corrosion
Dr. Patrik Schmutz, Laboratory for Joining Technologies and Corrosion, EMPA Dübendorf, 2014 4
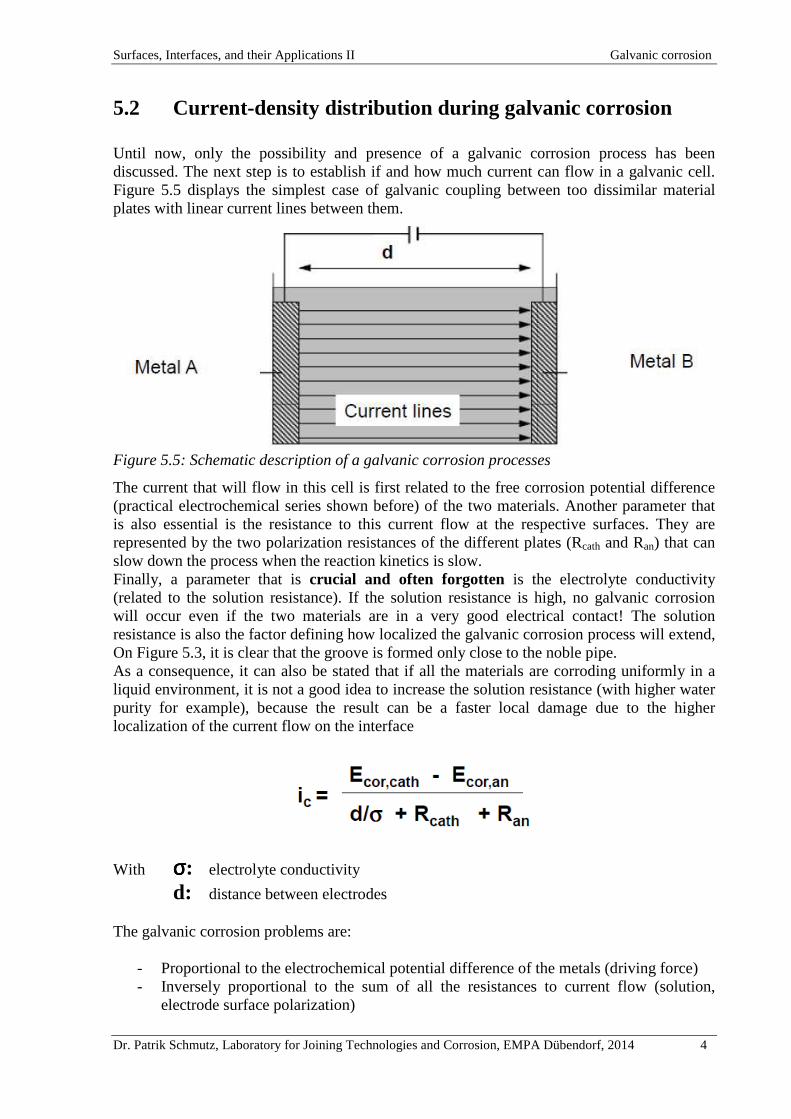
5.2 Current-density distribution during galvanic corrosion Until now, only the possibility and presence of a galvanic corrosion process has been discussed. The next step is to establish if and how much current can flow in a galvanic cell. Figure 5.5 displays the simplest case of galvanic coupling between too dissimilar material plates with linear current lines between them.
Figure 5.5: Schematic description of a galvanic corrosion processes
The current that will flow in this cell is first related to the free corrosion potential difference (practical electrochemical series shown before) of the two materials. Another parameter that is also essential is the resistance to this current flow at the respective surfaces. They are represented by the two polarization resistances of the different plates (Rcath and Ran) that can slow down the process when the reaction kinetics is slow. Finally, a parameter that is crucial and often forgotten is the electrolyte conductivity (related to the solution resistance). If the solution resistance is high, no galvanic corrosion will occur even if the two materials are in a very good electrical contact! The solution resistance is also the factor defining how localized the galvanic corrosion process will extend, On Figure 5.3, it is clear that the groove is formed only close to the noble pipe. As a consequence, it can also be stated that if all the materials are corroding uniformly in a liquid environment, it is not a good idea to increase the solution resistance (with higher water purity for example), because the result can be a faster local damage due to the higher localization of the current flow on the interface
With σσσσ: electrolyte conductivity
d: distance between electrodes The galvanic corrosion problems are:
- Proportional to the electrochemical potential difference of the metals (driving force) - Inversely proportional to the sum of all the resistances to current flow (solution,
electrode surface polarization)
Surfaces, Interfaces, and their Applications II Galvanic corrosion
Dr. Patrik Schmutz, Laboratory for Joining Technologies and Corrosion, EMPA Dübendorf, 2014 5
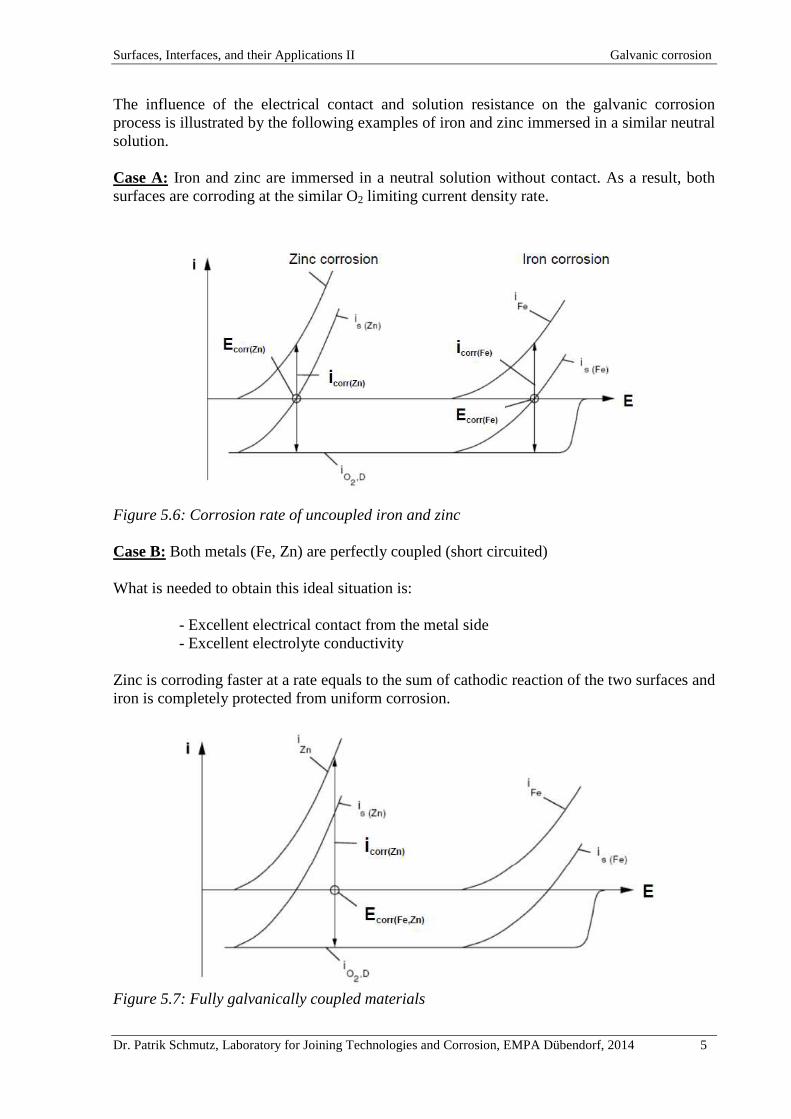
The influence of the electrical contact and solution resistance on the galvanic corrosion process is illustrated by the following examples of iron and zinc immersed in a similar neutral solution. Case A: Iron and zinc are immersed in a neutral solution without contact. As a result, both surfaces are corroding at the similar O2 limiting current density rate.
Figure 5.6: Corrosion rate of uncoupled iron and zinc Case B: Both metals (Fe, Zn) are perfectly coupled (short circuited) What is needed to obtain this ideal situation is: - Excellent electrical contact from the metal side - Excellent electrolyte conductivity Zinc is corroding faster at a rate equals to the sum of cathodic reaction of the two surfaces and iron is completely protected from uniform corrosion.
Figure 5.7: Fully galvanically coupled materials

Surfaces, Interfaces, and their Applications II Galvanic corrosion
Dr. Patrik Schmutz, Laboratory for Joining Technologies and Corrosion, EMPA Dübendorf, 2014 6
Key parameters influencing galvanic corrosion
1) The difference in relative surface area. The total current generated in a corroding system is always null ( Ianodic is constantly equal to Icathodic )
Σ ian = ΣΣΣΣ icath In the example of uniformly corroding materials in neutral environments: the anode will corrode at the diffusion limiting oxygen reduction current density multiplied by the cathode/anode area ratio.
ian * SAn = I O2,d * (SAn + Scat) Ian = I O2,d * (1 + Scat/ San)) with I: total current i: current density San: anodic surface area Scat: cathodic surface area This surface dependency is relatively obvious and care should always be taken in system design not to have very corrosion susceptible safety relevant small components attached to large structures. Joining processes have to be done will materials which are “noble” (high practical electrochemical potential) compared to the base materials and formation of reactive interface phase should be avoided.
2) Influence of Ohmic potential drop (Ur ) in solution The second parameter influencing the galvanic corrosion process is much more interesting/critical and is related to the solution resistance. As already mentioned previously, if this solution resistance becomes high, then even perfectly electrically connected dissimilar materials will not be in galvanic coupling conditions. The situation of Fig. 5.6 would be obtained even in presence of electrical contact between Fe and Zn. In reality the situation is always intermediate.
The simple Ohm’s law U=RI gives the potential difference that will establish between the two coupled electrodes in most practical cases. If there is a large current flowing in a system with a poorly conducting electrolyte, the two electrodes will be at different electrochemical potentials, Fig.5.8.

Surfaces, Interfaces, and their Applications II Galvanic corrosion
Dr. Patrik Schmutz, Laboratory for Joining Technologies and Corrosion, EMPA Dübendorf, 2014 7
The ohmic drop extend depends on:
- Conductivity of the electrolyte in contact with corroding surface
- Distance between the metals in contact (not always well defined !)
Figure 5.8: Influence of the solution resistance (ohmic drop) on the potential difference established in a galvanic coupling process One consequence of the presence of ohmic drops in solution is that materials (like Fe) even coupled with more active materials (like Zn) might be protected differently depending on the media considered. They will for example not be coupled in distilled water and perfectly in 3% NaCl solutions. Active dissolution of Zinc will however gradually increase the electrolyte conductivity so that coupling ability can depend on local conductivity gradients, inducing localization phenomena shown before.
5.3 Prevention and use of galvanic coupling phenomena 5.3.1 Prevention of macroscale processes Different very simple measures can be used to prevent macroscale galvanic corrosion:
1) For the materials: keep the potential difference between them small
2) Environment: avoid aggressive conducting electrolyte
3) In welds: large anode, small cathode
4) Construction: Isolation of different materials with coatings
Surfaces, Interfaces, and their Applications II Galvanic corrosion
Dr. Patrik Schmutz, Laboratory for Joining Technologies and Corrosion, EMPA Dübendorf, 2014 8
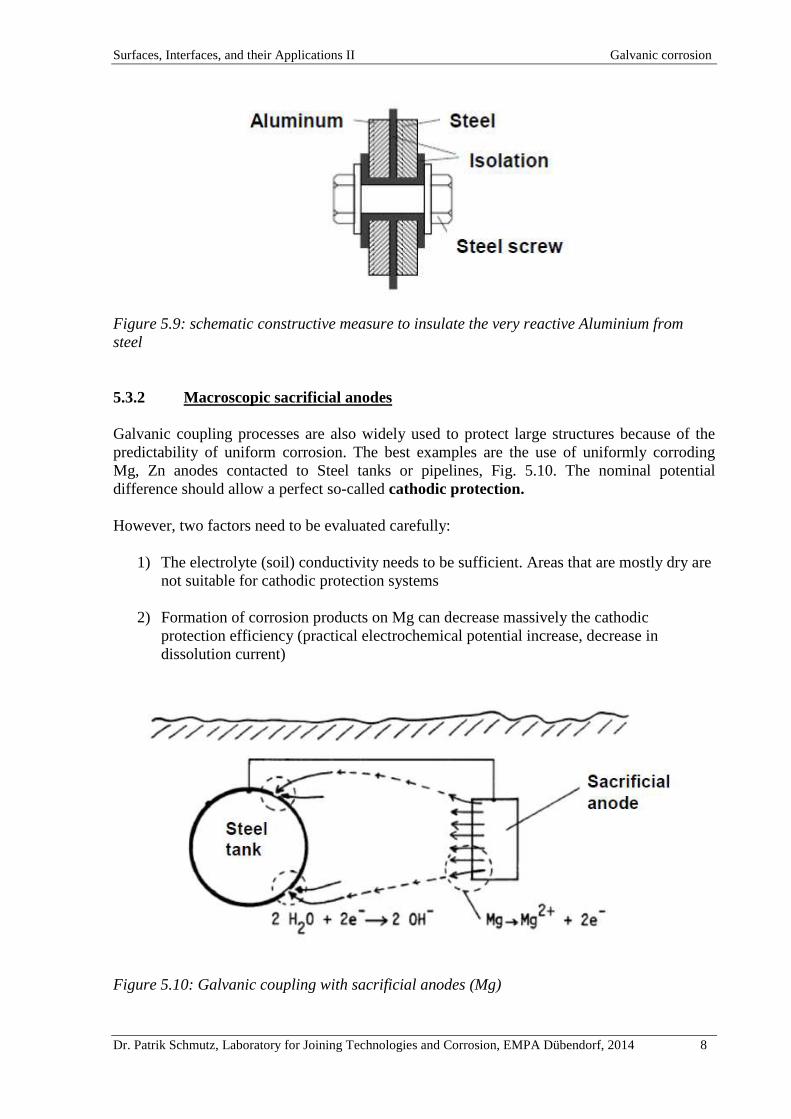
Figure 5.9: schematic constructive measure to insulate the very reactive Aluminium from steel 5.3.2 Macroscopic sacrificial anodes Galvanic coupling processes are also widely used to protect large structures because of the predictability of uniform corrosion. The best examples are the use of uniformly corroding Mg, Zn anodes contacted to Steel tanks or pipelines, Fig. 5.10. The nominal potential difference should allow a perfect so-called cathodic protection. However, two factors need to be evaluated carefully:
1) The electrolyte (soil) conductivity needs to be sufficient. Areas that are mostly dry are not suitable for cathodic protection systems
2) Formation of corrosion products on Mg can decrease massively the cathodic protection efficiency (practical electrochemical potential increase, decrease in dissolution current)
Figure 5.10: Galvanic coupling with sacrificial anodes (Mg)

Surfaces, Interfaces, and their Applications II Galvanic corrosion
Dr. Patrik Schmutz, Laboratory for Joining Technologies and Corrosion, EMPA Dübendorf, 2014 9
5.3.2 Sacrificial metallic coatings Another way to use cathodic protection is to apply directly the active (low potential) material on the substrate to be protected. The most common example is the zinc coating applied on iron and low alloyed steel, Fig. 5.11b. In this case, zinc will corrode away and polarize the iron surface in its cathodic domain. This protection process is very much used because the quality of the zinc layer does not have to be perfect and defects in the coatings are in principle immune to corrosion. The anode area is very large so that the substrate will not influence much the degradation rate of zinc. One absolute counter indication to the cathodic protection of a material is when this one is not stable in an alkaline environment, because if the cathodic reduction is taking place on the substrate, the medium will become alkaline locally with severe consequences! Depositing a metallic coating more noble compared to the substrate like for example nickel on iron (Fig. 5.11a) is much more problematic. In this case, any defect in the coating will locally accelerate the uniform corrosion of the substrate and the anode /cathode area ratio is extremely critical.
a) b)
Figure 5.11: Metallic coatings deposited on corrosion susceptible materials can either serve as (a) barrier layer when there are noble with respect to substrate or (b) protect the substrate by taking over the corrosion process due to galvanic coupling process
In summary:
- Nickel (or any noble) coatings have to be extremely protective (without defects) to act as corrosion protection when the substrate has lower electrochemical potential (like for iron in this case). This induces high production costs and a constant risk of corrosion attack upon mechanical surface damage! - Zinc coating will just corrode instead of iron and can tolerate defects (cheaper process). The only precaution that has to be taken is that the environment should be humid in order for the sacrificial dissolution of zinc to occur. The worst case scenario is when the surface is regularly wetted and subsequently dries. Iron is then corroding where it is exposed to water at defects and the galvanic coupling with zinc through the electrolyte is not guaranteed.

Surfaces, Interfaces, and their Applications II Galvanic corrosion
Dr. Patrik Schmutz, Laboratory for Joining Technologies and Corrosion, EMPA Dübendorf, 2014 10
5.4 Atomic Force Microscopy (AFM) characterization of microscale galvanic coupling
Until now, only “classical macroscopic” galvanic corrosion processes have been presented. They are typical and relevant for uniformly corroding materials. Galvanic coupling/corrosion processes are however also present at the microscale on multiphase materials, composites and small metallic structures and systems. All the concepts about: i) practical electrochemical series, ii) area ratio and iii) solution resistance with related ohmic drop presented until now are also valid at the micro- and nanometre scale. The main problem at this scale is related to the investigation of these processes, because it requires methods with at least microscale lateral resolution and able to measure simultaneously “electrochemical” information. For this purpose, a special AFM based method has been developed to track the local potentials on a surface. As discussed in relation with Figure 5.4, it is in principle not possible to make a direct correlation between a measured surface composition and electrochemical reactivity. 5.4.1 AFM principle and information obtained (see also Surfaces, Interfaces and their Applications I, chapter 10.2) The AFM principle has already been described during the first part of the lecture. The basic principle is that a laser beam is reflected on the back of a cantilever towards the detectors. In contact or close to a surface, interaction forces between the tip and the surface will result in a deflection of the cantilever. This deflection is monitored by the 2 quadrants detector and the feedback loop will adjust the sample position to compensate for this deflection by means of a piezoelectric crystal. This way, the force applied on the surface is constant and indirectly, the topography profile can be assessed with sub-nanometre accuracy in the vertical direction. AFM can be used in contact mode to record the topography and even stiff silicon cantilevers and tips are used in contact mode to induce damage on the surface. These stiff cantilevers can also be mechanically oscillated (tapping mode) and the tip is then in intermittent contact.
Figure 5.12: Schematic view of Atomic Force Microscopy (AFM) principle

Surfaces, Interfaces, and their Applications II Galvanic corrosion
Dr. Patrik Schmutz, Laboratory for Joining Technologies and Corrosion, EMPA Dübendorf, 2014 11
The Atomic Force Microscopy (AFM) technique offers, with the different types of forces that can be measured on surface, very broad possibilities to acquire quantitative information in the nano- and micrometer range under environmental conditions about surfaces:
- Topography • morphology • height distribution • roughness • effective surface area
- Material properties
• electric and magnetic properties • mechanical properties (elasticity, E-modulus, . . .) • heterogeneity • wettability
- functionality
• conductivity, isolating nature • hydrophilic, hydrophobic character • reactivity, inert • adaptive stimuli-responsive (pH, temperature, humidity, chemical)
5.4.2 Scanning Kelvin Probe Force Microscopy (SKPFM) in environmental condition The use of the Tapping mode with stiff cantilevers in Atomic Force Microscopy characterization is a well-established method. A fine tip mounted on a cantilever is scanned over the surface and its oscillation attenuation is monitored and sent to the feedback loop to control the tip-sample distance, Fig. 5.13b. In an Environmental AFM system, all the surface modifications like nm-scale topography changes can be followed in controlled environmental conditions. For this purpose, a small closed chamber system (Bruker Nano system, Fig. 5.13a) is used to allow very controlled but also rapid changes in environment (temperature, from low to very high humidity, high vacuum or inert gas operation). A list of all the environments typically possible with such a system is shown in Fig. 5.14a. A further specificity of the system is to be able to investigate the surface potential evolution (referred as Scanning Kelvin Probe Force Microscopy method) on samples in most of the atmospheric environments except directly in bulk conducting electrolytes. The measurement principle is sketched in Fig. 5.14b. A metallic coated tip (Pt-Ir) is used and after a first topographic scan, the tip is withdrawn from the surface from a distance that can be chosen from a few nm to typically 100 nm. An AC voltage is applied on the tip and this will induce a cantilever oscillation depending on the electrical field (local charges present on the sample surface). An additional DC voltage is then ramped until the oscillation stops indicating that the overall electrical field sensed by the tip is 0. This procedure allows getting very sensitive and very local information about surface reactivity.

Surfaces, Interfaces, and their Applications II Galvanic corrosion
Dr. Patrik Schmutz, Laboratory for Joining Technologies and Corrosion, EMPA Dübendorf, 2014 12
a) b)
Figure 5.13: Atomic Force Microscopy principle: a) Environmental AFM instrument; b)
principle of a topography measurement in tapping mode (usually used)
a) b)
Figure 5.14: Environmental AFM and Scanning Kelvin Probe Force Microscopy: a) List of parameter considered in the environmental AFM b) Principle of the SKPFM characterisation.
Setup combining: - Operation in inert gas atmosphere
(Ar, N2) or in CO
2
- Or High Vacuum operation
- With heating stage (250°C) and scans
- Relative humidity (up to 95%RH) control and scans
- Electrochemical cells under controlled atmosphere
- Local surface potential determination in defined controlled environment
° Electrochemical interface in thin electrolyte layer, surface reactivity, oxidation and oxide properties
Surfaces, Interfaces, and their Applications II Galvanic corrosion
Dr. Patrik Schmutz, Laboratory for Joining Technologies and Corrosion, EMPA Dübendorf, 2014 13
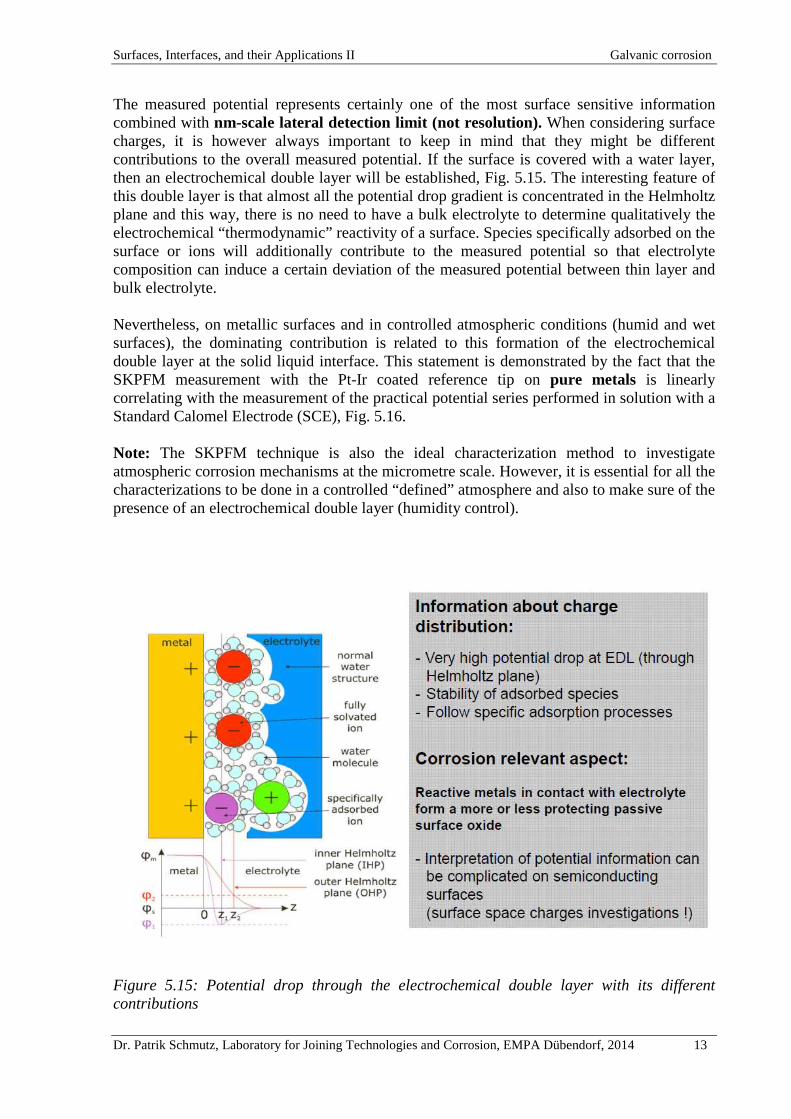
The measured potential represents certainly one of the most surface sensitive information combined with nm-scale lateral detection limit (not resolution). When considering surface charges, it is however always important to keep in mind that they might be different contributions to the overall measured potential. If the surface is covered with a water layer, then an electrochemical double layer will be established, Fig. 5.15. The interesting feature of this double layer is that almost all the potential drop gradient is concentrated in the Helmholtz plane and this way, there is no need to have a bulk electrolyte to determine qualitatively the electrochemical “thermodynamic” reactivity of a surface. Species specifically adsorbed on the surface or ions will additionally contribute to the measured potential so that electrolyte composition can induce a certain deviation of the measured potential between thin layer and bulk electrolyte. Nevertheless, on metallic surfaces and in controlled atmospheric conditions (humid and wet surfaces), the dominating contribution is related to this formation of the electrochemical double layer at the solid liquid interface. This statement is demonstrated by the fact that the SKPFM measurement with the Pt-Ir coated reference tip on pure metals is linearly correlating with the measurement of the practical potential series performed in solution with a Standard Calomel Electrode (SCE), Fig. 5.16. Note: The SKPFM technique is also the ideal characterization method to investigate atmospheric corrosion mechanisms at the micrometre scale. However, it is essential for all the characterizations to be done in a controlled “defined” atmosphere and also to make sure of the presence of an electrochemical double layer (humidity control).
Figure 5.15: Potential drop through the electrochemical double layer with its different contributions

Surfaces, Interfaces, and their Applications II Galvanic corrosion
Dr. Patrik Schmutz, Laboratory for Joining Technologies and Corrosion, EMPA Dübendorf, 2014 14
On the figure 5.16, differences between distilled water and NaCl solution immersion is also reflected by similar potential shifts for both macro and local methods. The conclusion from this calibration measurement on pure metals is that the practical electrochemical series can be investigated very locally on heterogeneous alloys or structures and local galvanic coupling risks can be identified. The generic term of “Volta Potential Difference” is used to define the measured potential by SKPFM (Fig. 5.16) because it refers to the work that has to be performed to extract a charge through a solid-liquid interface. For local assessment of corrosion mechanisms, interpretation in terms of electrochemical potential series is more adequate.
Figure 5.16: Electrochemical Open Circuit Potential measured on different pure metals with a standard Calomel reference electrode (SCE) or a Pt-Ir coated AFM tip. The experimentally measured potential contains the following single contributions related to the different physico-chemical processes at a solid-liquid interface that will be specifically discussed in the following sections until the end of this chapter:
Emeasured = E double layer + E oxide + E dipoles + E contamination
1) Oxidation component (Eoxide) Most of the metals and alloys used in industrial applications are covered with an oxide in environmental conditions so that the potential measured in presence of a thin electrolyte layer is not only an indication of the double layer formed at the reversible potential but is related to the practical nobility of the metals (practical electrochemical potential series).

Surfaces, Interfaces, and their Applications II Galvanic corrosion
Dr. Patrik Schmutz, Laboratory for Joining Technologies and Corrosion, EMPA Dübendorf, 2014 15
For a given materials, like for example Aluminium, the reversible potential that should be measured is -1.8 V SCE. The measured potential of -0.7 V in distilled water and -0.9V in NaCl corresponds to the additional potential gradient present in the passive layer (nm-thick oxide coverage) surface. If the oxide would be grown further by electrochemical anodizing, then an even larger potential increase would be measured. If a potential gradient of ∆E = 1100 mV is established through a passive film of a few nm (typically 6-8 nm for Al, Fig. 5.17), then it means that a dense passive film can sustain extreme electrical fields of around 107 V/cm close to its dielectric breakdown limit. This is a very important feature of ultrathin passive oxides where high electrical field growth and ionic migration is occurring.
Figure 5.17: Auger electron Spectroscopy (AES) depth-profile characterization of the passive film spontaneously formed in water on pure Aluminium. 5.4.3 Aluminium alloys and micro-scale galvanic coupling The reason why the SKPFM method was introduced in corrosion research was related to the difficulty to characterize this passivation and local microscale reactivity of the very heterogeneous aluminium alloys. Pure aluminium is extremely soft and could not be used industrially for structural applications. Addition of alloying element drastically improves mechanical properties but due to their very low solubility limit, they induce the formation of different types of intermetallics (some of them are desired for hardening purpose, larger ones are only adding detrimental reactivity issues). Typical compositions for currently widely industrially used alloys are given below; in particular, the reactivity of the 2024 alloy will be presented in the following examples: small amount (<0.2) 2024: 3.8 – 4.9% Cu 1.2 – 1.8% Mg 0.5% Fe, Si, Mn Zn, Ti
6061: 0.8 – 1.2% Mg 0.4 – 0.8% Si 0.7% Fe Cu, Mn. Cr, Ti
7075: 5.1 6.1% Zn 2.1 - 2.9% Mg 1.2 – 2% Cu Fe, Si, Mn, Cr, Ti

Surfaces, Interfaces, and their Applications II Galvanic corrosion
Dr. Patrik Schmutz, Laboratory for Joining Technologies and Corrosion, EMPA Dübendorf, 2014 16
During solidification of the alloys, intermetallic phases are produced:
- Small dispersoids in the aluminium matrix Strengthening of the - Grain boundary precipitates alloy
- Large intermetallic particles No real use
If the smaller dispersoids are very useful in generating higher strength of the alloys, the large intermetallics are of no use but potentially very detrimental for the alloy corrosion resistance. Figure 5.18 presents a typical microstructure found for a 2024-T3 alloy. Large microscale intermetallic phases are either Al-Cu-Fe-Mn compounds (particles 1 to 4) or round Al-Cu-Mg (particles A to C), Fig. 5.18a. Smaller dispersoids are typically Al2Cu with sometime some Mg integration depending on the tempering/ageing conditions, Fig. 5.18b. a) b)
Figure 5.18: Microstrucutural characterization of an2024-T3 alloy: (a) SEM image of larger microscopic scale intermetallics, (b) TEM image of the dispersoids in the matrix and aligned at the grain boundary The obvious advantage of the SKPFM measurement is the extremely good lateral spatial resolution for an “electrochemical” reactivity characterization owing to the small size of the probe and the small separation of the probe from the sample surface. Another key advantage of the technique when combined with environmental control is the fact that the surface is only in contact with a thin electrolyte layer. The technique takes advantage of the large ohmic drop in this thin water layer to avoid that the microscale phase directly couple. This kind of heterogeneous samples could not be completely immersed in a conducting electrolyte to perform locally resolved measurements; the electrochemical information would then not come from the location of the measurement. Figure 5.19 shows an SEM image and a SKPFM potential map for the same region of an as-polished sample of AA2024-T3 that was prepared without exposure to water to minimize corrosion during the preparation. Debris resulting from the non-aqueous polishing and rinsing of the sample are visible. Also visible are scratches and some holes that might have resulted

Surfaces, Interfaces, and their Applications II Galvanic corrosion
Dr. Patrik Schmutz, Laboratory for Joining Technologies and Corrosion, EMPA Dübendorf, 2014 17
from corrosion or particle pullout. On the right side, the Volta potential map (practical electrochemical potential series) of exactly the same region as analysed by SEM/EDX is shown. The bright areas in the SEM image were found by EDX analysis to be intermetallic particles. The large, blocky particles are the AlCuFeMn type and match perfectly with the high potential areas at -0.35V. The Aluminium matrix itself has a potential of -0.65V and the round particles, which are Al-Cu-Mg S-phase are very active. They are visible by dark spots of - 0.9V in the potential mapping. This measurement shows that within 30 µm, areas with very different electrochemical reactivities are found and would directly interact and couple if a conducting electrolyte would be present on the surface. This reactivity difference would not have been detected by SEM but also not clearly with Auger Electron Spectroscopy. X-Ray Photoelectron Spectroscopy could not be used in these samples because of the too small intermetallic. In contrast, the potential maps produced by the SKPFM identify directly the different phase reactivity. a) b)
Figure 5.19: Detailed analysis of the intermetallic particle reactivity (a) SEM image, (b) SKPFM local potential characterization of the same area
Figure 5.20: Schematic description of the local galvanic problem with different locations and separation of the cathodic and anodic reaction, local driving force and induced local pH changes.
Surfaces, Interfaces, and their Applications II Galvanic corrosion
Dr. Patrik Schmutz, Laboratory for Joining Technologies and Corrosion, EMPA Dübendorf, 2014 18
On the figure 5.20, the microscale galvanic phenomena are schematically presented. Cathodic oxygen reduction is preferentially occurring on the high potential intermetallics. This local reaction is inducing a pH increase that is detrimental for aluminium chemical stability. The Al matrix and in the case of the 2024 also the Al-Cu-Mg phase will dissolve faster when coupled to the cathodes. Areas with agglomeration of high potential Al-Cu-Fe-Mn intermetalllics will for example be preferentially attacked if the electrolyte conductivity is low. 5.4.4 Transmission Interferometric Adsorption Sensor (TInAS) (see also Surfaces, Interfaces and their Applications I, chapter 12.4.2) A next “more fundamental” step in the assessment of the environmental interaction on surfaces and of the relation between water layer formation and galvanic corrosion processes is to control and follow the electrochemical double layer formation. For this, it is necessary to introduce another method able to directly detect water adsorption. For this purpose, the Transmission Interferometric Adsorption Sensor (TInAS) which is an optical technique that relies on the common principle of interference of light in a transparent multi-layer structure that is best suited for the measurement, Fig. 5.21. When white light is transmitted through a thin layer, the intensity of the transmitted light is modulated such that constructively interfering wavelengths are bright, whereas destructively interfering wavelengths are suppressed. The transmitted spectrum consists of intensity maxima and minima. The exact wavelength of a maximum can be accurately determined as well as its shifts during the adsorption of molecules onto the sensor surface. An exact measurement of such a shift allows one to calculate the adsorbed film thickness or the adsorbed mass per area. The sensitivity of the method (1 ng/cm2) is comparable to other existing sensor systems, albeit with a much simpler setup. Measurements can readily be realized in different media (e.g. vacuum, water, air, etc.). A unique feature of the technique is that it can, in principle, measure both adsorbed thickness and refractive index simultaneously. It has been widely applied to polymer and protein adsorption studies, and also used to generate an adsorption isotherm for water on mica. The principle is described on Fig. 5.21(left): the TInAS was made of a back-silvered sheet of mica that was glued on a silica disc for mechanical support. For readout, the sensor was illuminated with white light, and the wavelength shifts of the peaks of the transmitted interference spectrum were used to determine the thickness of the adsorbed water layer, using the known dispersive bulk refractive indices of mica and water. On the Fig. 5.21(Right), there is a representative of an adsorption isotherms measured by TInAS on K+-mica at 22.7 °C (open symbols) from Balmer et al Langmuir 2008, 24, 1566. The relative partial pressure p/p0 can also be interpreted in terms of relative humidity. Considering the adsorption curve (Fig. 5.21, right), it can be stated that for p/p0 under 0.2 (20% RH), the surface is almost water free and that interaction with oxygen dominates. Between 20% and 70% RH, a monolayer of water is present on the surface, this is sufficient to generate an electrochemical double layer but the water molecules are bound so that no electrolyte conductivity can be generated. Above 70% RH, the water layer thickness increases fast and mobile water molecules as well as dissolved ionic species can be present. As a consequence the water layer resistance will drop allowing interactions between dissimilar phases first at the nanoscale and then with constantly larger lateral extension. A similar relative humidity scan with simultaneous SKPFM measurements can be performed with online environmental AFM characterization, Fig 5.22. For this example, a WC – Co composite has been considered because severe corrosion and failure has already been reported in atmospheric conditions and upon immersion in distilled water. The measured topography

Surfaces, Interfaces, and their Applications II Galvanic corrosion
Dr. Patrik Schmutz, Laboratory for Joining Technologies and Corrosion, EMPA Dübendorf, 2014 19
indicates that the WC carbide grains (white areas) are harder and the Co binder (dark areas) is slightly depressed (a few nanometre) during polishing. The sample has been sputter-cleaned in UHV and transferred in inert atmosphere into the environmental AFM chamber. The SKPFM measurement performed in dry air (4% RH) clearly allows distinguishing the different reactivity of the two phases. The WC grains are nobler (higher potential) and the Co binder has a potential 200mV lower.
Figure 5.21: Schematic description of the TInAS system: (a) resonator, (b) interference fringes measured and (c) Adsorbed water thickness as function of water partial pressure (relative humidity)
Figure 5.22: Relative humidity scan and related SKPFM potential measurement performed to identify the influence of thin water films on corrosion mechanisms of small structures

Surfaces, Interfaces, and their Applications II Galvanic corrosion
Dr. Patrik Schmutz, Laboratory for Joining Technologies and Corrosion, EMPA Dübendorf, 2014 20
In this dry condition, mainly interaction with oxygen is envisaged (Fig. 5.23a) and the measured potentials are very high indicating that the surface is in an oxidized state (dry oxidation). The potential of -0.1V measured for Co is typical for this situation as can be seen on the Pourbaix Diagram of Co, Fig. 5.23b. In absence of a layer of water molecule on the surface, the lateral resolution obtained is also the best with very sharp phase boundaries. Increasing the humidity to 50% RH (humid surface), water interacts with the surface (Fig. 5.23a) and an electrochemical interface is generated. The measured potentials drop and Co with -0.4V is getting close to its active reversible potential. In this environment condition, both phases still display clearly different electrochemical potential but the SKPFM data now indicates the risk of galvanic coupling between them. Increasing the relative humidity above the 70% RH threshold and going to 90% RH (wet surface), the potential of Co reaches its reversible potential of -0.5V and the interesting phenomenon is that the WC surface is also polarized down to the same Co potential. In this case, the water film is thick and mobile species guarantee an ionic conductivity. The galvanic coupling conditions are established and Co corrosion will proceed at very high rate. The area ratio is very detrimental for Co because there are much more WC grain than Co binder, Fig. 5.22. The humidity dependant SKPFM measurement allows a complete diagnostic of the corrosion mechanisms and galvanic corrosion susceptibility. The fact that the whole surface is polarized down to the Co corrosion potential is an indication that Co is actively dissolving at high rate. In these conditions, the cobalt surface will be non-polarizable because its corrosion rate can be increased without large polarization and the whole WC is cathodically polarized (a demonstration of this fact will be presented in the next chapter about pitting).
a) b)
Figure 5.23: Schematic description of (a) the water interaction as function of relative humidity and (b) the Pourbaix diagram of Co with experimental macroscopically measured potential as function of the pH Finally, two other contribution (dipoles and contaminants) to the SKPFM potential measurements are described below to complete the description of the information that can be obtained by the method.

Surfaces, Interfaces, and their Applications II Galvanic corrosion
Dr. Patrik Schmutz, Laboratory for Joining Technologies and Corrosion, EMPA Dübendorf, 2014 21
2) Adsorption / dipoles (Edipole)
When a metallic surface is additionally functionalized with polar molecules, then the dipole contribution (strength, orientation) is also inducing potential changes (charge gradients through the interface) that can be easily tracked by SKPFM. The method is ideal to investigate the adsorption processes at the local scale and determine the structure of the functional layer like in the example of the carborane molecule layers deposited on Ag. This information obviously adds to the “electrochemical” potential of pure Ag and can result either in a potential decrease or increase depending on the dipole orientation. If the dipole moment is known and the molecule is stable like for the carborane attached with its thiol groups to Ag, this type of system is ideal to obtain absolute values for the SKPFM potentials. The practical electrochemical potential series has always the drawback that it is a relative scale. The final goal of this study is however to find an efficient way to protect silver form corrosion in sulphur containing environment. The Ag-S interaction is very strong and the reason for silver degradation; but if this bond can be stabilized in a larger structure, than a corrosion protection layer can be applied. Tuning the surface charge with oriented dipole can add other functionalities such as hydrophobicity.
Figure 5.24: SKPFM investigation of dipole adsorption and orientation on Silver surfaces
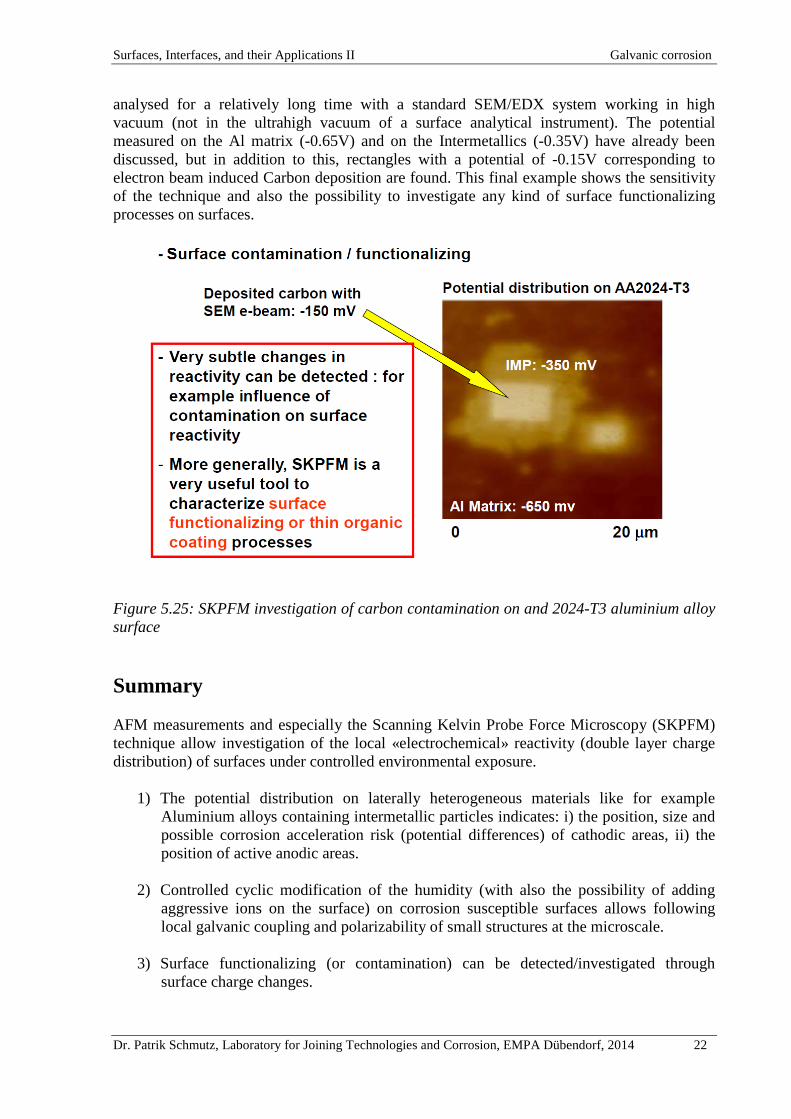
3) organic layers contaminants (E contaminants) Thicker organic layers consisting of atmospheric C-contamination, but also lubricant or polymer coatings will also induce a modification of the potential to a more positive value due to their dielectric properties. Polymer thickness will then play a role but only when a charge screening effect is present (presence of dipoles in the polymer). Compact conducting Carbon-layer or dipolar structures in a polymer are too major causes of potential shifts as seen in Fig. 5.25. In this case, an aluminium surface with intermetallic phases has been
Surfaces, Interfaces, and their Applications II Galvanic corrosion
Dr. Patrik Schmutz, Laboratory for Joining Technologies and Corrosion, EMPA Dübendorf, 2014 22
analysed for a relatively long time with a standard SEM/EDX system working in high vacuum (not in the ultrahigh vacuum of a surface analytical instrument). The potential measured on the Al matrix (-0.65V) and on the Intermetallics (-0.35V) have already been discussed, but in addition to this, rectangles with a potential of -0.15V corresponding to electron beam induced Carbon deposition are found. This final example shows the sensitivity of the technique and also the possibility to investigate any kind of surface functionalizing processes on surfaces.
Figure 5.25: SKPFM investigation of carbon contamination on and 2024-T3 aluminium alloy surface
Summary AFM measurements and especially the Scanning Kelvin Probe Force Microscopy (SKPFM) technique allow investigation of the local «electrochemical» reactivity (double layer charge distribution) of surfaces under controlled environmental exposure.
1) The potential distribution on laterally heterogeneous materials like for example Aluminium alloys containing intermetallic particles indicates: i) the position, size and possible corrosion acceleration risk (potential differences) of cathodic areas, ii) the position of active anodic areas.
2) Controlled cyclic modification of the humidity (with also the possibility of adding aggressive ions on the surface) on corrosion susceptible surfaces allows following local galvanic coupling and polarizability of small structures at the microscale.
3) Surface functionalizing (or contamination) can be detected/investigated through surface charge changes.