Embed Size (px)
Citation preview

Gaining Market Share for Nonparametric Statistics
Michael J. Schell
Moffitt Cancer Center
University of South Florida

Web of Science
• Source of count data for this talk
• Words/phrases found in title or abstract
• Mainly title only references before 1991
• The number of articles has increased over the years, thus the need for benchmarking


But is the Market Itself Expanding?


Non-Linear Regression Methods


Article Counts and Growth Rate of Regression Sub-Fields
Sub-Field 1990-94 2005-07* GRNon-linear 1469 2494 3.4Wavelets 1025 6114
11.9Linear 4360 8281 3.8Logistic 4291 16,728 7.8Mixed models 750 2817 7.5
Data mining 11 2979 542Bioinformatics 14 4194 599* Estimated 5-year rate obtained by doubling the countGR = Growth Rate

How Many Discoveries Have Been Lost by Ignoring Modern Statistical Methods?
Rand R. Wilcox, American Psychologist, 1998
Arbitrarily small departures from normality result in low power; even when distributions are normal, heteroscedasticity can seriously lower the power of standard ANOVA and regression methods.
… most quantitative articles tend to be too technical for applied researchers.
If the goal is to avoid low power, the worst method is the ANOVA F test.
…the Theil-Sen estimator deserves consideration as well.

British Medical Journal articles by Doug Altman
The scandal of poor medical research, 1994
Why are errors so common? Put simply, much poor research arise because researchers feel compelled for career reasons to carry out research that they are ill equipped to perform, and nobody stops them.
Statistics and ethics in medical research. The misuse of statistics is unethical, 1980

Marketing of Pharmaceuticals
1) Must have the produced the drug and shown its efficacy
2) Need to produce the drug in mass quantities
3) Marketing

Marketing of Statistical Ideas
1) Must have derived the statistic and demonstrated its efficacy
2) Need to have available software
3) Need to disseminate the idea

Key Principle
In an environment where ideas are not marketed, first on the market wins

First-on-the-market winners
T-test, 1905
ANOVA
Kolmogorov-Smirnov test, 1937
Duncan’s test, 1950
Kaplan-Meier curves, 1958
Cox regression, 1972

Hodges and Lehmann , 19614th Berkeley Symposium
Chernoff and Savage (1958) proved that the ARE of the normal scores test is at least 1
“The above results suggest that on the basis of power, at least for large samples, both the Wilcoxon and normal scores tests are preferable to the t-test for general use.”

First Simulation on Robustness of t-testCA Boneau, 1960
320 citations
Conclusion: t-test is fine, exponential distribution simulation was done wrong
Highest citation count on any subsequent simulation study (39 thru 2000) = 96

Textbook Placement
Basic Practice of Statistics, 4th Ed. 2006 David S. Moore (728 pages)
Non-parametric tests don’t make the book; they appear in the virtual appendix.
Statistics: A Biomedical Introduction, 1977
Hollander and Wolfe
T-test in Chapter 5; Wilcoxon in Chapter 13
Biostatistics, 2nd Ed. van Belle, Fisher, et al., 2004
T-test in Chapter 5; Wilcoxon in Chapter 8

One-Way Layout for Books of Psalms
Book N Mn SD Sk Kurt Range Md
1 41 15.0 9.3 1.9 4.6 5-50 12
2 31 15.0 8.0 1.1 0.9 5-36 12
3 17 21.1 16.7 2.3 5.4 7-72 18
4 17 18.9 13.2 1.2 0.5 5-48 15
5 44 15.9 26.1 5.6 34.5 2-43,176 9
150

Results
• ANOVA p = .7015
• ANOVA on logged data p = .0586
• Kruskal-Wallis p = .0458
• Normal scores p = .0378
• AD sum for data: 14 = 2.2 + 1.0 + 2.0 + 0.9 + 7.9• AD sum for log data: 1.9 = 0.3 + 0.3 + 0.5 + 0.2 + 0.6
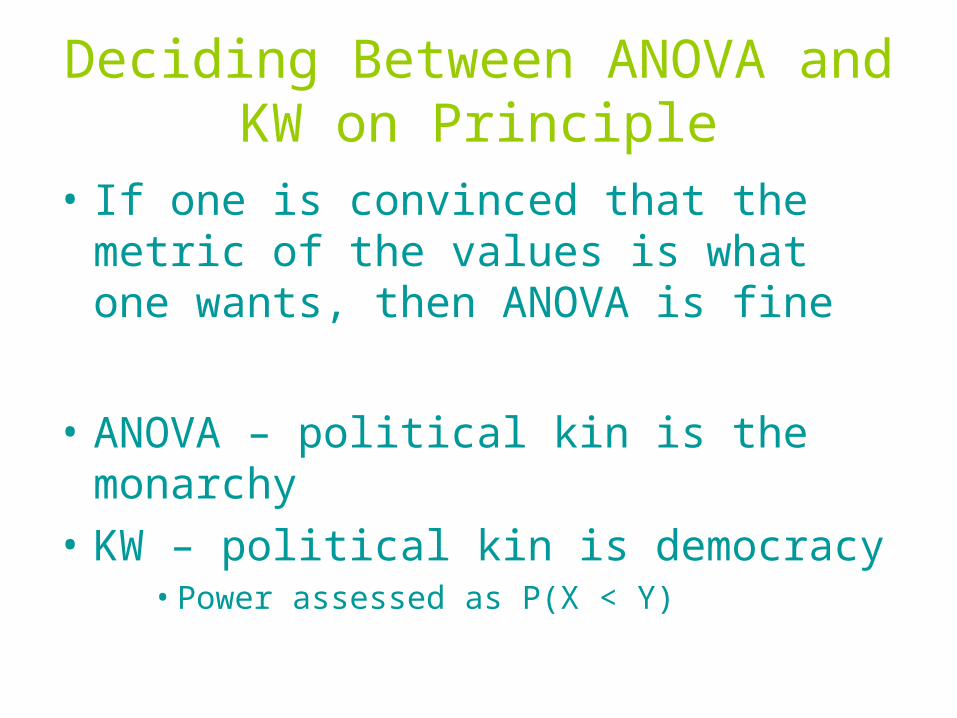
Deciding Between ANOVA and KW on Principle
• If one is convinced that the metric of the values is what one wants, then ANOVA is fine
• ANOVA – political kin is the monarchy
• KW – political kin is democracy• Power assessed as P(X < Y)

Cancer Research
It has been my experience as a statistician in cancer research, that we are:
1) rarely sure of the metric for the data,
2) typically interested in answering the democratic question
Thus, nonparametric analysis has predominated in my applied articles

Ethical Considerations
Applied statistical work is very important in decision-making
Educators have an ethical responsibility to properly train their “tool user” students in best practices
“Tool user” statisticians have an ethical responsibility to seek best practice information