Embed Size (px)
Citation preview

Annual Report 2021
01 Chorus Board and management overview
14 Management commentary
24 Financial statements
60 Governance and disclosures
92 Glossary

Patrick Strange
Chair
Mark Cross
Chair Audit & Risk Management Committee
FY21 results overview
1 Excludes partly subsidised education connections provided as part of Chorus’ COVID-19 response.2 Earnings before interest, income tax, depreciation and amortisation (EBITDA) is a non-GAAP profit measure. We monitor this as a key
performance indicator and we believe it assists investors in assessing the performance of the core operations of our business.3 Based on the average response to four key engagement questions.
EBITDA2 Customer satisfaction
Dividend Employee engagement score3
Fixed line connections1 Broadband connections1
Fibre connections1 Net profit after tax
FY21
25cps
FY20
24cps
FY21
8.5 out of 103
FY20
8.5
FY21
871,000
FY20
751,000
FY21
$47m
FY20
$52m
FY21
1,180,000
FY20
1,206,000
FY21
1,340,000
FY20
1,415,000
FY21
Installation
8.2 out of 10(target 8.0)
FY21
Intact
7.5 out of 10(target 7.5)
FY21
$649m
FY20
$648m
This report is dated 23 August 2021 and is signed on behalf of the Board of Chorus Limited.

Annual Report 2021 1
Dear investorsOur focus in FY21 was to help consumers capitalise on the gigabit head start our fibre network has given New Zealand. We knocked on about a quarter of a million doors and supported our 100 or so retailers to connect another 120,000 consumers to fibre. This saw fibre uptake grow from 60% to 65% across the year and represents strong momentum towards our target of 1 million connections in 2022. Pleasingly, we lifted customer satisfaction again, up from 8.1 out of ten to 8.2 for installations and up from 7.3 to 7.5 for service to homes with an existing or ‘intact’ fibre socket.
We continued to expand our fibre footprint under our public-private partnership with the Government. There are just 53,000 or so homes and businesses remaining to pass by the end of 2022. Hundreds of small provincial communities can already enjoy the socio-economic benefits of fibre connectivity. As New Zealand turns its focus to the challenges of climate change, there is a growing appreciation too of the environmental benefits of fibre broadband. As the greenest broadband technology, using materially less electricity than copper or mobile technology, fibre is reducing Chorus’ network energy needs. It is also enabling New Zealanders to work more flexibly, lowering commuting-driven carbon emissions.
Broadband’s role as an essential utility is reflected in the ongoing surge in data demand. Monthly average household data usage, including both downloads and uploads, grew from 350 gigabytes (GB) to 432GB across the year. Fibre customers averaged 500GB in June, up from 436GB the year before. At the same time, demand for reliable high capacity broadband was evident in 1 gigabit per second (Gbps) connections growing to 19% of our fibre connections, up from 16% last year. This growth is being increasingly driven by new entrant retailers from the electricity and pay TV sectors.
We enhanced our product portfolio during the year with new services to support greater industry peering and data centre connectivity. An 8Gbps Hyperfibre plan was launched and our in-home Wi-Fi service is being used by some smaller retailers. These are not yet large revenue earners, but they underpin our role as a neutral host helping improve New Zealand’s connectivity.
We did face some headwinds. COVID-19 continued to make its presence felt with several short lockdowns in Auckland affecting our fibre marketing activity. The historic levels of growth in the broadband market have also been constrained significantly by restrictions on migration into New Zealand. These pressures, together with the loss of international roaming revenue, have seen the traditional vertically integrated mobile network providers increase their focus on switching their customers from our network to their fixed wireless solutions.
At times, these campaigns have led to customer confusion, especially about the status of the copper network, and we continue to advocate for clearer product disclosure requirements to help ensure a level playing field. This is
especially important because fixed wireless services don’t provide the same level of service as fibre - or even VDSL in most cases – and these service limitations often aren’t made clear to the customer.
As expected, other fibre companies continued to win copper customers in those areas where they have overbuilt our network with fibre. Together, these factors meant we ended FY21 with 1,340,000 fixed line connections, down 75,000 lines from the year before. Within this total, broadband connections were down 26,000 to 1,180,000. Most of this reduction was in other fibre company areas. Our broadband connections grew by 5,000 in our UFB areas, helped by strong premises growth. These totals exclude the 10,000 student households we’ve continued to keep connected to broadband as part of our COVID-19 response, partly subsidised for the last quarter by the Ministry of Education.
Softer market conditions due to the ongoing effects of COVID-19 on demand, together with competition from other fibre and wireless networks, resulted in a $12 million drop in revenue compared to FY20. Operating expenses reduced by $13 million, reflecting our continued tight management of costs and the absence of the significant one-off COVID-19 costs experienced in FY20. This helped us just achieve our goal of a modest increase in EBITDA, with FY21 EBITDA of $649 million up $1 million from FY20. Net profit after tax was $47 million compared to $52 million in FY20.
A recruitment freeze for non-critical roles was in place for much of FY21. This, together with changes to our organisational structure through the year, saw total employee numbers reduce to 817. We appreciate the resilience and professionalism of Chorus employees through this period. Some of this change reflects our drive to become a more adaptive organisation. We’ve introduced agile practices into our technology teams and are focusing on identifying more opportunities to simplify the way we operate. Despite the broad spectrum of change we’re operating in, employee engagement was consistent with FY20 at 8.5 out of ten. Our flexible working policy has played a large part in this outcome with most employees working from home at least two days a week.
A considerable amount of our people’s time and focus was again required to help with the new utility-style regulatory regime being established for our fibre access network. As we noted last year, the Commerce Commission’s initial settings don't at all reflect the commercial realities of our investment in fibre. Our subsequent modelling based on the Commission’s initial draft price-quality decisions has suggested asset valuation outcomes that have disappointed investors and could constrain regulated revenues below our business plan for 2022 to 2024. Such outcomes would lead to perverse incentives under the regime. We continue to engage with the Commission on ways to deliver a transition to the new framework that encourages ongoing investment for consumer outcomes. It would be a poor outcome for New Zealand consumers if this wasn’t achieved.
A fully imputed final dividend of 14.5 cents per share will be paid on 12 October 2021, bringing total dividends for FY21 to 25 cents per share.
HAVE SIGNATURE WILLPLACE ON APPROVAL

Annual Report 20212
1.1 UFB rollout 95% completeWe finished FY21 with 871,000 active fibre connections nationwide, up from 751,000 the year before. About 837,000 of these connections were within our planned ultra fast broadband (UFB) footprint.
Together, the UFB1 and 2 projects have made fibre available to about 1.28 million homes and businesses. Across the UFB1 area, where deployment work was completed in late 2019, fibre uptake grew from 63% to 69% of homes and businesses. Uptake in New Zealand’s largest city, Auckland, rose from 68% to 75%.
In UFB2 areas, uptake grew from 37% to 42%, even with the rollout continuing to add a significant number of available addresses. Another 69,000 homes and businesses were passed during the year, from Whitianga with more than 3,000 premises to Fox Glacier with just 100.
Figure x:
Chorus UFB uptake
0%
50%
40%
30%
20%
10%
60%
70%
80%
90%
100%
UFB1 UFB2 UFB1 contractual uptake target (by 2020)
FY12 FY19FY18FY17FY16FY15FY14FY13 FY20 FY21
Figure 1:
Fibre uptake – UFB rollout
1.2 Driving fibre uptake as an active wholesalerWe have a range of in-market activity to promote uptake of fibre services and help consumers understand that nothing beats a fibre connection when it comes to reliable, uncongested and unlimited broadband. Our approach has become even more important with the large, traditional broadband retailers preferring to promote their own mobile and fixed wireless network solutions to their incumbent customers for financial reasons.
In FY21 our activity was concentrated around our own door knocking campaigns, retailer incentives and leveraging our Fibre – It’s how we internet now advertising campaign at national and local levels. Our managed migration campaigns again proved very successful in stimulating fibre demand. About 61,000 addresses received an installation through our door knocking and direct marketing efforts, up from 32,000 last year. Approximately 30,000 connections resulted from our migration programme installations.
We provided a range of incentives for retailers to, for example, migrate ‘late adopters’ from copper to fibre and win offnet customers onto the 1 gigabit fibre service. Fibre solutions for price conscious consumers were encouraged with an incentive for retailers offering a standalone price point of $60 or less for entry level 50Mbps fibre plans.
The combination of incentives and marketing activity in UFB1 fibre areas with comparatively low uptake produced good results. The Wellington-Kapiti region, where we have had historically low market share due to the presence of a competing cable network, saw uptake increase by approximately 10%.
1.3 Customer experienceWe’re focussed on doing everything we can to keep improving the experience consumers have when they connect to fibre. We were pleased to see customer satisfaction for fibre installations increase again in FY21, to 8.2 out of 10. This was above our target of 8.0 on a 12-month average. Strong satisfaction scores through the year reflect the work we’ve done with retailers on processes and communication, a greater proportion of orders via our door knocking programme and a reduction in the number of delayed installations. Door knocking typically produces a smoother connection process because of direct conversations with the consumer, but we continue to invest so that retailer-driven connections are as effective as possible.
We put a lot of effort into improving the connection experience of customers when they move to fibre ‘intact’ premises. These are homes, or businesses, where fibre is already installed and we just need to activate the broadband service. We worked closely with retailers to identify initiatives including clearer communication about the processes for retailers and consumers, reducing the activation time to as little as one hour and identifying solutions for situations where a previous homeowner’s service had not yet been disconnected. These initiatives produced strong results and lifted customer satisfaction from 7.3 to our rolling three-month target of 7.5.
Our investment in automating and streamlining our systems and processes continues to help retailers enhance their own service delivery, drive longer term reductions in our operational costs, and enable much better service to consumers. Enhanced options for fault diagnosis, for example, has reduced unnecessary technician visits by almost half. This has in turn helped us improve restoration times for genuine network faults. Optimisation of queries into our call centre and the speeding up of order processing were other areas of focus in FY21.
1.4 Data demandAverage monthly data usage grew by almost a quarter through FY21 from 350GB to 432GB, with fibre consumers averaging 500GB a month by the end of the year. Average throughput on our network at these times is close to consistently touching the 3 terabit per second record that was set during the nationwide lockdown in March 2020. Peak time traffic around 9pm grew by 28%.

Annual Report 2021 3
This rapid data growth points to the ongoing rise in consumers streaming online content and we expect this strong growth to continue in coming years. NZ On Air consumer research in mid-2020 suggested digital media audiences were on the cusp of overtaking traditional media audiences for the first time, with YouTube the leading digital platform. Daily streamed video on demand had grown to 95 minutes per person from just six minutes the year before. Other market research has noted the strong growth in video on-demand subscriptions as the popularity of services like Netflix, Disney+ and Amazon Prime Video continues to build.
The shift to online content is only likely to continue in FY22 with local TV networks expected to offer content from NBC Universal and Discovery+ as part of their streaming platforms.
These trends continue to support our forecast of 1,000GB average monthly demand by 2024. 4K capable TV sets are sold widely and 4K quality content is beginning to emerge across online platforms. The shift to online gaming platforms is expected to drive bandwidth demand further again, as will the future availability of 8K TVs and content.
Figure 2 :
Average monthly usage per connection on our fibre network
0
100
200
300
400
500
600
Jun-21Dec-20Jun-20Dec-19Jun-19Dec-18Jun-18Dec-17Jun-17Dec-16Jun-16Dec-15
Downstream Upstream (shown from June 2020 onwards)
Ave
rag
e m
on
thly
usa
ge
(gig
abyt
es)
COVID-19 lockdowns
As expected, the experience of COVID-19 lockdowns and the shift to more working from home has had a noticeable effect on consumer behaviour. Daytime bandwidth demand reflects greater upstream traffic, due to more use of videoconferencing, and consumers place greater value on reliable broadband at home. This is reflected in retailers now offering broadband packages tailored to people spending more time working from home, with an emphasis on features such as upload performance and security. We’ve also seen uptake of 1Gbps connections on our network grow from 16% to 19% of mass market fibre connections over the year.
The Commerce Commission’s independent broadband monitoring reports continue to highlight the strong performance of fibre relative to other technologies when it comes to features like latency, speed and two-way traffic. Our fibre and VDSL copper broadband services are consistently shown as performing better than 4G fixed wireless at peak times. This reflects the shared nature of wireless networks, that makes them more prone to congestion. The report also noted that fixed wireless connections are
more likely to experience issues with applications requiring low latency, such as online gaming and video calls.
Despite this independent evidence, wireless broadband providers are not required to disclose the expected performance of their service. This is the one area of New Zealand’s broadband regime where we believe consumer protections are falling very short. In Europe and Australia, broadband providers for fixed and wireless networks have the same standards of product disclosure. In New Zealand, only fixed line broadband consumers are told exactly what they are getting. This difference is very concerning when we continue to field reports of consumers being transferred to a wireless service if they don’t object within a certain timeframe (known as inertia selling). Some of these consumers were previously on VDSL services that provided better performance than the wireless service they were transferred to.

Annual Report 20214
Figure 3:
Average daily internet usage across the Chorus network 2018 – 2021
Peak tra�c of 2.81Tbps
2018 20212019 2020
Ave
rag
e d
aily
usa
ge
(T
bp
s)
0
1
2
3
12:00 PM8:00 PM4:00 PM12:00 PM8:00 AM4:00 AM12:00 AM
1.5 Product developmentWe launched a range of new services through the year as part of our strategic priority to grow new revenue.
The biggest area of development was in the backhaul space. Our new mobile access service is growing as mobile network providers expand their coverage in both urban and rural areas. We launched a peering service in conjunction with the New Zealand Internet Exchange to enable retailers to peer (i.e. exchange data directly between each other) via our Mount Eden exchange. A new EdgeConnect service also enables traffic to be connected to a centralised Internet Exchange from a different city or region using our extensive network reach. We believe these new services will significantly improve the peering landscape in New Zealand with enhanced interconnectivity between service providers.
We developed a backhaul service to connect data centres to our exchanges and to other data centres. At the same time, we continue to believe there is a strong opportunity for us to use our exchanges to support the growing shift in cloud computing services to network edges. The original trial rack spaces in our Mount Eden EdgeCentre space are now filled
and we’ve opened new space in Tauranga. We don't intend to compete with fully fledged data centres, but we believe that there is a strong opportunity for us to use our exchange space to support the growing shift in cloud computing services to network edges.
We drove rapid uptake of our small business plans with businesses recognising the added value we’ve provided through the introduction of enhanced service level commitments. Fibre connections to smart locations such as CCTVs and traffic lights continued to grow, but the pace slowed because of the economic effects of COVID-19.
We expanded on the 2 and 4Gbps Hyperfibre services we launched in 2020 with the introduction of an 8Gbps service in Auckland and Wellington. These advanced speeds have been made possible by the next wave of passive optical network (PON) technology. Our regular UFB fibre services are provided on gigabit PON (GPON) technology, while Hyperfibre services use 10-Gigabit-symmetrical PON (XGS-PON). With the rapid growth in data needs and the acceleration in fibre deployments globally, network vendors are already trialling 25 gigabit services as the next evolution in fibre capability.

Annual Report 2021 5
Figure 4:
Our network infrastructure
1.6 Optimising our non-fibre assetsOne of our four strategic pillars is to optimise our non-fibre assets. We made good progress in FY21.
The Commerce Commission published the final Copper Withdrawal Code in late 2020, enabling us to begin a small scale trial of withdrawing copper services in areas where fibre is available. We’re required to give customers six months' notice of our intention and have done this for about 1,100 addresses across 129 cabinets to date. This is focused on cabinets where customer numbers are low and the copper maintenance costs are very high. The first of these cabinets are due to be turned off in September 2021. The trial will be extended to more cabinets as we develop our processes and the number of customers remaining on copper cabinets reduces to levels where withdrawal makes sense.
Another programme is underway to rationalise the legacy network equipment we have in Spark exchanges. This will result in ongoing cost savings. We’re also reviewing our network needs outside our fibre areas and we began disposing of sites that are now non-essential. This includes old radio sites and surplus exchanges that are no longer economic to maintain.
2.0
We have about 820 permanent and fixed term employees and 140 independent contractors for our core operations. Several thousand service company workers and subcontractors undertake activity on our behalf.
Our network infrastructure enables ~100 retail service providers to connect homes and businesses nationwide.
We’re a wholesale only, fixed line telecommunications network operator.
A 2017 study1 estimated the wider social benefits from fibre uptake at about NZ$2 billion annually, in addition to a $3 billion annual contribution to GDP from business uptake.
73% of our broadband connections are fibre, enabling rapid growth in broadband speeds and data demand. 8Gbps Hyperfibre speeds just launched.
Gigabit broadband and our fibre backhaul is underpinning the development of sustainable communities through connections to devices and other network connectivity.
~600 exchanges
~12,000 cabinets
~300,000 poles
~65,000km duct network~57,000km fibre (excluding service leads)
~130,000km of copper
1. Sapere Research Group: Estimating the wider socio-economic impacts of Ultra Fast Broadband for New Zealand, August 2017.
Annual Report 20216
The New Zealand market
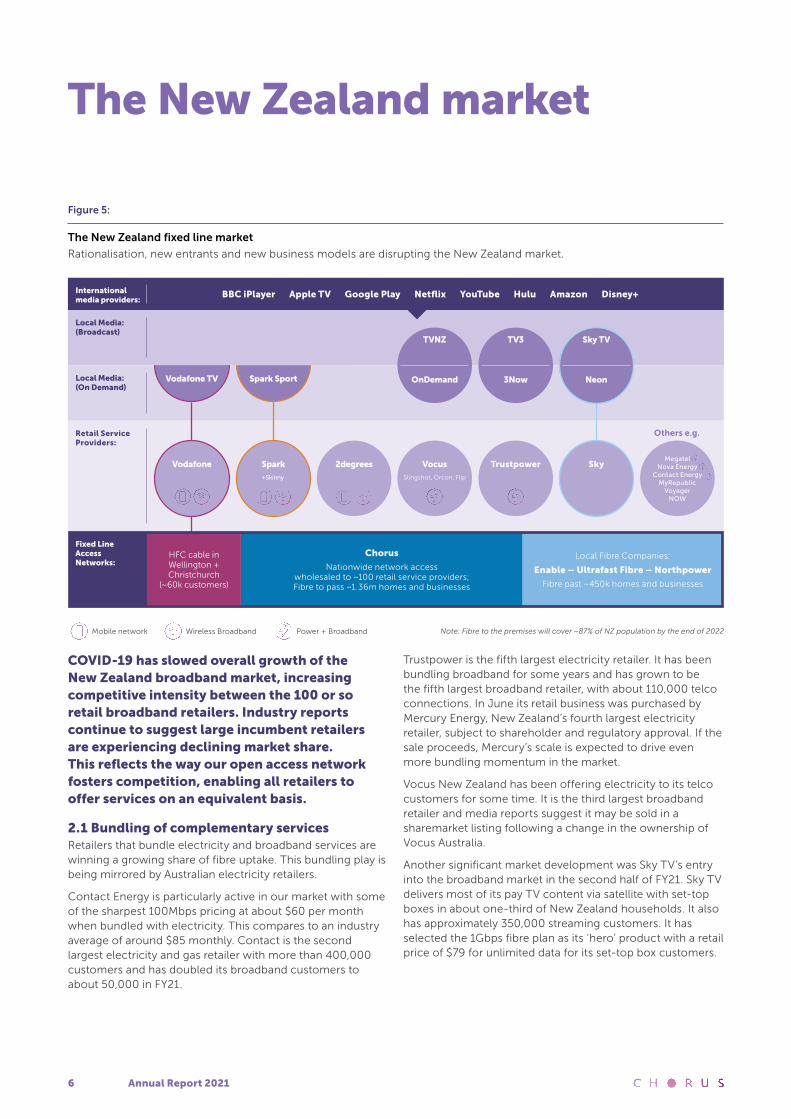
COVID-19 has slowed overall growth of the New Zealand broadband market, increasing competitive intensity between the 100 or so retail broadband retailers. Industry reports continue to suggest large incumbent retailers are experiencing declining market share. This reflects the way our open access network fosters competition, enabling all retailers to offer services on an equivalent basis.
2.1 Bundling of complementary servicesRetailers that bundle electricity and broadband services are winning a growing share of fibre uptake. This bundling play is being mirrored by Australian electricity retailers.
Contact Energy is particularly active in our market with some of the sharpest 100Mbps pricing at about $60 per month when bundled with electricity. This compares to an industry average of around $85 monthly. Contact is the second largest electricity and gas retailer with more than 400,000 customers and has doubled its broadband customers to about 50,000 in FY21.
Trustpower is the fifth largest electricity retailer. It has been bundling broadband for some years and has grown to be the fifth largest broadband retailer, with about 110,000 telco connections. In June its retail business was purchased by Mercury Energy, New Zealand’s fourth largest electricity retailer, subject to shareholder and regulatory approval. If the sale proceeds, Mercury’s scale is expected to drive even more bundling momentum in the market.
Vocus New Zealand has been offering electricity to its telco customers for some time. It is the third largest broadband retailer and media reports suggest it may be sold in a sharemarket listing following a change in the ownership of Vocus Australia.
Another significant market development was Sky TV’s entry into the broadband market in the second half of FY21. Sky TV delivers most of its pay TV content via satellite with set-top boxes in about one-third of New Zealand households. It also has approximately 350,000 streaming customers. It has selected the 1Gbps fibre plan as its ‘hero’ product with a retail price of $79 for unlimited data for its set-top box customers.
Figure 5:
The New Zealand fixed line market
Rationalisation, new entrants and new business models are disrupting the New Zealand market.
Note: Fibre to the premises will cover ~87% of NZ population by the end of 2022Power + BroadbandMobile network Wireless Broadband
Chorus
Nationwide network access wholesaled to ~100 retail service providers; Fibre to pass ~1.36m homes and businesses
Local Fibre Companies:
Enable – Ultrafast Fibre – Northpower
Fibre past ~450k homes and businesses
Retail Service Providers:
Local Media: (Broadcast)
Local Media: (On Demand)
Fixed Line Access Networks:
TV3
3Now
BBC iPlayer Apple TV Google Play Netflix YouTube Hulu Amazon Disney+International media providers:
OnDemand
TVNZ Sky TV
Neon
Trustpower
Others e.g.
Slingshot, Orcon, Flip
Vocus
Vodafone TV
Vodafone
HFC cable in Wellington + Christchurch
(~60k customers)
Spark Sport
+Skinny
Spark 2degrees SkyMegatel
Nova Energy Contact Energy
MyRepublic Voyager
NOW

Annual Report 2021 7
2.2 The growing role of Wi-Fi
A notable feature of retail broadband offers in the last 12 months has been the focus on in-home Wi-Fi solutions.
Poor performing Wi-Fi has long been a cause of customer complaints about broadband performance and the latest generation of Wi-Fi mesh devices is helping provide a solution. Various retailers are now providing their own Wi-Fi devices as a point of difference in their retail offers. These include Wi-Fi 6 capable devices that enable enhanced speed and reduced latency.
Our Wi-Fi 5 capable fibre terminals have begun to be used by some smaller retailers to enable Wi-Fi. This add-on service removes the need for retailers to dispatch their own routers to customers and enables customers to get their broadband up and running almost straight away.
We’re keeping a close eye on global Wi-Fi developments given its complementary role with fibre access products. Wi-Fi 6 devices, for example, are seen as a potential alternative to 5G in enterprise and other private environments where cost effective capacity and support for a large number of devices is important. To fully benefit from gigabit speeds on fibre, homes and businesses need Wi-Fi that can keep pace. Wi-Fi has long been a hotbed for broadband innovation and there is a fast-growing global push to release substantial amounts of unlicensed spectrum in the 6GHz range. This would greatly expand the capability of Wi-Fi, enabling substantial increases in real world speeds and encouraging development of new consumer devices and applications. New Zealand is currently consulting on its approach to this spectrum.
2.3 Fixed wireless New Zealand’s third mobile network operator, 2degrees, has now joined Spark and Vodafone in offering fixed wireless services. The Commerce Commission reported there were 221,000 customers on fixed wireless in 2019/20. These customers are mostly on a 4G service, with Vodafone and Spark continuing to build out their 5G coverage in selected centres.
2degrees has said it will have 5G in market by the end of 2021. It is the fourth largest broadband retailer and there are reports it may also be listed publicly in the near future.
Vodafone has said it hopes 25% of its broadband customers will migrate to its fixed wireless network while Spark has said its aspiration is 30% to 40% of its base. Both retailers offer unlimited data plans on fixed wireless, although fair use policies apply.
Increased spectrum capacity will become available for fixed wireless services through the auction of 3.5GHz and millimetre wave spectrum by late 2022. In the meantime, short term management rights for 3.5GHz spectrum have been allocated, enabling some expansion of 5G coverage.
While fixed wireless has become a viable product for some customers it cannot offer the same level of service as fibre. This is well demonstrated by the independent monitoring by the Commerce Commission.
2.4 Rural broadbandChorus operates ADSL and VDSL broadband across large parts of rural New Zealand. We’ve currently ruled out expanding fibre coverage to existing communities beyond our planned UFB footprint. This is because of the restrictive rate of allowable returns and geographic pricing constraints that apply to our services under the regulatory framework.
The Rural Connectivity Group, a joint venture between the three mobile network operators, is building hundreds of rural mobile sites under a rural service agreement with the Government. Chorus is providing fibre backhaul for the cellsites within fibre reach for a 10-year period. These new towers are increasing the footprint for fixed wireless competition, but they won’t cover the most remote copper network customers.
Starlink has begun providing low earth orbit satellite broadband as a beta service in parts of New Zealand. Pricing is around $160 monthly for unlimited data, plus the upfront cost of customer premises equipment at around $800, with indicative speeds said to be between 50 to 150 megabits per second (Mbps). This service could provide an alternative for rural customers, particularly where copper speeds are low.
The net effect of these developments is that it is becoming less economic for Chorus to invest in further upgrades to its rural network.

Annual Report 20218
Figure 6:
Summary of key market trends
Our market drivers What we’re focussed on
Large vertically integrated retailers are
encouraging customers to use their own fixed
wireless, cable and legacy fibre networks to
reduce their wholesale network costs.
We’re an active wholesaler, promoting our extensive broadband footprint
through advertising, retailer campaigns and our own door knocking initiatives.
Our network supports about 100 retailers, including new entrants from the
electricity and pay TV sectors.
Competing fibre companies have overbuilt our
existing copper network with fibre as part of the
Government’s UFB programme.
We’re optimising our business in these competing areas and maximising
our broadband share in other areas experiencing premises growth,
particularly Auckland.
Traditional voice only connections are declining
with changing demographics and wireless
service options.
Broadband penetration is growing, but at a slower rate due to the market effects
of COVID-19. We’re commercialising new potential revenue streams identified
by our innovation programme, such as data centres and smart city connectivity.
Technology keeps evolving, with 5G potentially
enhancing the capability of mobile/wireless
technologies as a fixed line alternative for
low data users.
Fibre is recognised as providing highly reliable broadband, particularly at peak
usage times. About 19% of our fibre consumers are on 1Gbps services and we’ve
launched Hyperfibre products up to 8Gbps. We see 5G as complementary
technology with more cellsites likely to require fibre backhaul.
3.0

Annual Report 2021 9
Regulatory environment
We operate our wholesale only network within the regulatory framework established by the Telecommunications Act. We’re also subject to the requirements of four open access deeds of undertaking for copper, fibre and Rural Broadband Initiative services that focus on the provision of services on a non-discriminatory basis. This regime will remain in place alongside the revised utility model now being implemented by the Commerce Commission (the Commission).
3.1 Moving to a regulated utility model In November 2018, the Telecommunications (New Regulatory Framework) Amendment Act passed into law with bipartisan political support. This marked the culmination of five years of policy review of the regulatory framework that applies to our business and the decision to transition to a utility-style framework for fibre access services.
Under the new framework our fibre investment will be regulated according to a utility style building block model from 2022. This model is already used to regulate other New Zealand utility businesses, such as electricity lines
and gas networks. It is intended to support private sector investment to meet network upgrades and increasing consumer demands through ongoing incentives to innovate, invest and improve efficiency for the long term benefit of customers.
The legislation also provides for deregulation of copper services in areas where fibre is available. This includes the ability to withdraw copper once consumer protection requirements are met, as set out under the Commission’s Copper Withdrawal Code. Copper services remain regulated in areas where fibre is not available, with copper prices annually adjusted for inflation.
Key features of the new fibre regime are:
• key fibre prices are frozen at 2020 pricing levels, adjusted for inflation, until 2022.
• “anchor” or declared services (e.g. fibre voice services, direct fibre access, 100Mbps fibre) are regulated from 2022-2024.
• unbundling of the fibre network is available in UFB1 areas on a commercial basis.
Figure 7:
New regulatory framework to replace UFB contractual framework by January 2022
87% of population where fibre will be available by end of 2022 Remaining 13% of population
Fibre access network
• Regulated asset base (RAB) with revenue cap
to be determined by Commerce Commission
• Price caps on contracted fibre products,
with annual inflation adjustment, until 2022.
Price caps then apply to "anchor" or declared
services: fibre voice service, a fibre broadband
service and a direct fibre access service
• Unbundled fibre (commercial price)
available in UFB1 areas from 2020
and UFB2 areas from 2026
• Three years after new regime commences,
the Commission can review the revenue
cap model and anchor products, subject to
specified conditions and statutory criteria
Copper - where fibre is available:
• Copper network deregulated and
Telecommunications Service Obligation
(TSO) removed
• Chorus can withdraw copper service,
subject to minimum consumer protection
requirements, developed by the
Commission
Copper - where fibre is not available:
• Copper remains regulated and TSO applies
• Copper pricing adjusted annually for
inflation
• Commission required to review pricing
framework no later than 2025

Annual Report 202110
3.2 Fibre input methodologies and Price-Quality processIn late 2020 the Commission released its final decisions on the Fibre Input Methodologies. These set the framework for determining the key elements of the new regime, such as the starting value of our regulated asset base (RAB), the regulatory weighted average cost of capital, cost allocations, and our maximum allowable revenue (MAR). Taken together, these elements determine the revenues we can earn from our regulated fibre network.
The Input Methodologies requirements underpinned our Initial Asset Value model submitted to the Commission in March 2021 under the Price-Quality process. This model suggested a conservative starting RAB of $5.5 billion for Chorus’ fixed line fibre access services at 1 January 2022. We also provided an alternative cost allocation approach supporting a RAB of approximately $6 billion if the full costs of structural separation, as required by the public-private partnership with the Government, were considered.
In mid-May 2021 we provided our MAR submission to the Commission for the first regulatory period from 2022 to 2024. This indicated an annual revenue cap range of $720 million to $820 million during the period and was consistent with our forecast fibre revenues. Our proposal included the use of tilted depreciation to ensure a smooth transition into the new regulatory regime and provide positive incentives to keep growing the fibre business.
In late May the Commission released a draft price-quality determination that referenced an annual revenue range of $689 million to $786 million. The decision included a diminishing value depreciation method for the financial loss asset, a preliminary post-tax weighted average cost of capital (WACC) of 4.46%, and reductions to our proposed capital and operating expenditure.
In July 2021 the Commission determined a mid-point vanilla WACC of 4.72% and a post-tax WACC of 4.52% for the first regulatory period from 2022 to 2024. As we’ve noted previously, this level of WACC is below that required to ensure our cost of capital reflects a fair return to investors, given the substantial investment risks taken in financing the fibre network and the technological risk that could emerge over time.
On 19 August 2021 the Commission released a draft decision proposing an initial RAB of $5.427 billion for Chorus’ regulated fibre business from January 2022. The Commission’s draft RAB is made up of core fibre assets of $3.98 billion and a financial loss asset of $1.446 billion. The Commission noted that if all other aspects of its draft price-quality decision in May remained unchanged, its indicative estimate of the combined impact of these decisions would lead to a 2%-2.5% reduction in Chorus’ MAR over the first regulatory period.
Poor outcomes for consumers and perverse incentives for Chorus will arise if the revenue cap ends up constraining our natural expected rate of growth. Consumers are currently benefitting from strong network investment, incentives to encourage fibre uptake and the ongoing development of new and higher-speed products. We would have limited incentives to keep growing and enhancing fibre services if the revenue cap is met when fibre uptake has only just reached 65%: this would be a very perverse outcome.
Significant steps remain to be completed under the Commission’s process. We continue to make extensive submissions in support of a smooth revenue path into the new regime that ensures consumers continue to benefit from investment in world class fibre services. We’ve also requested that the Commission expedite its processes so that we have sufficient certainty of outcomes ahead of the January 2022 implementation date.
Indicative fibre regulation timeline
August 2021 Initial Price-Quality RAB draft decision
December 2021 Transitional Price-Quality RAB final decision
Price-Quality final decision
Mid 2022 Initial Price-Quality RAB final decision
3.3 Commercial services for fibre unbundling We’ve built our fibre network to enable unbundled fibre services by providing a second fibre to each premises. This means retailers can choose to use our passive infrastructure - fibre optic cables, ducts, and poles – and their own broadband electronics, to deliver services to customers.
We’ve developed commercial terms for our point-to-multipoint layer 1 fibre access service (PONFAS), including a monthly access charge of about $28 per month to cover access to the fibre between the premises and the splitter, as well as $200 per month to access the feeder fibre from each splitter to a central network point. The pricing reflects the fact that passive infrastructure costs, known as layer 1, comprise most of our rollout investment, with broadband electronics, known as layer 2, representing a very small component.
The Commission has developed guidance on fibre equivalence and non-discrimination obligations following concerns from some retailers about our PONFAS terms. It is currently conducting a compliance assessment of the non-price terms of all Local Fibre Companies’ layer 1 fibre access services. Unbundled services will not be available in UFB2 areas until 2026.
4.0

Annual Report 2021 11
Outlook
FY22 is a crossroads year for Chorus and the ongoing development of New Zealand’s broadband landscape. We’ve invested billions of dollars since 2011 to help create a fibre network that other countries are now racing to replicate. The challenges of COVID-19 have accelerated the digitalisation of socio-economic activity and demand for bandwidth that’s always on has made fibre networks a must have. In Australia the government-owned National Broadband Network has said it will upgrade up to 2 million more premises to full fibre. In the United Kingdom, BT has committed to take fibre to 25 million homes after regulatory commitments to a fair return on fibre investment.
With our fibre network now 95% complete, our strategy for FY22 remains largely unchanged. At its core, we’re more focussed than ever on making New Zealand better. We want to keep unlocking the potential of fibre by continuing to connect people and technology, while developing services that underpin even better applications and use of the cloud.
We’ve put our new sustainability policy at the heart of our strategy with an emphasis on helping more Kiwis participate in a positive digital life. Our first Sustainability Report has been published alongside this Annual Report. Greater adoption of digital tools and solutions, backed by the low emission advantages of fibre broadband, has an important part to play in accelerating New Zealand’s journey to carbon neutrality. We’ll be working with groups like Senior Net and Digital Journeys to help close the digital divide and strengthen digital skills of people and businesses.
We’ve got plenty of work to do to get to our goal of 1 million fibre connections by the end of 2022. Fixed wireless services can deliver a broadband service that may provide a credible alternative for some customers, depending on things like coverage and data needs. We’re comfortable with competition, but we believe consumers should be fully informed about their options and the characteristics of the product they are paying for. Too often we’re being contacted by consumers who haven’t realised that they’ve been switched from a fixed line, or where their wireless service is of a lower quality.
This is why we’ve been investing in strong public information campaigns and advertising activity. We want consumers to be able to make an informed choice. We’ve also been providing retailers with marketing incentives to promote fibre uptake. These are a critical tool for us when mobile network operators have substantial retail market power, large incumbent customer bases, and prefer that consumers use their wireless networks. The playing field is further tilted in their favour because, unlike fibre, fixed wireless services aren’t subject to price or quality regulation.
We're encouraged by recent Commerce Commission proposals to require retailers to provide clearer product disclosure for consumers. However, we’re concerned by the suggestion in the Commission’s draft price-quality decision that our retailer incentives require a drawn-out approval process. This would tilt the retail broadband market in the favour of large incumbents that do not have the willingness to promote fibre like the smaller retailers do.
We wrote to the Commission to express our concern that this approach and their draft cuts to our expenditure proposals do not adequately reflect our market context. Taken together with the low WACC settings and our proposed initial asset valuation of $5.5 billion, there is a genuine risk that the new regulatory framework could discourage anything but essential investment for the next three years.
Chorus’ share price has dropped substantially over the last six months, reflecting initial asset valuations below market expectations and the potential for the cap on our regulated fibre revenues to be set below our business plan forecasts. Investors are concerned that the regulatory process has retrospectively written down the value of the investment we’ve made in the fibre network over the last decade. This is an extremely poor advertisement for investment in future New Zealand infrastructure public-private partnerships.
Market analysis suggests that a fairer approach to our investment risks, the cost of equity and the treatment of Crown funding should value the fibre network at more than $7 billion. Our initial $5.5 billion valuation, based on measures that don’t reflect our commercial reality, means we’ve had to propose acceleration of depreciation as a way to bridge the potential gap between our business plan revenue forecasts and the revenue cap for 2022 to 2024.
With fibre uptake at 65%, a revenue cap that doesn’t allow for growth at the rate we’ve forecast means we would be

Annual Report 202112
discouraged from making ongoing discretionary investment in fibre. We’ve already responded to investor feedback by ruling out expansion of the fibre footprint into more rural areas under current settings. Our investment appetite for things like the expansion of our Hyperfibre footprint and projects to enhance network resilience will also be shaped by regulatory outcomes.
In the meantime, we’re proceeding with our current business plan. We’ll continue to promote the migration of copper customers to fibre and there will be a growing, but still very modest, number of copper broadband cabinets that we can retire. And just so there’s no confusion, our copper network is not being shut down on a widespread basis. It’s still very much a street by street proposition. As the Commerce Commission’s broadband monitoring shows, our copper network continues to provide a high quality of service.
We’ll keep making our organisation more adaptive and even easier for customers to deal with. In FY22 we’re lifting our focus on customer experience measures from installations and intact connections to include a new service assurance measure. Customer experience will also be an important element of our new service company contracts from March 2022.
The unrelenting growth in demand for data, the increasing reliance on both high-speed download and upload performance, as well as the emerging awareness of fibre broadband’s contribution to sustainability, are all underlying trends that support our business. Our Hyperfibre services are already making 8Gbps symmetrical speeds available and 25Gbps capability is on the horizon. This is why fibre remains the world’s fastest growing and most future proof access technology.
The rapid evolution of cloud computing and Wi-Fi capability is exciting and points to future revenue opportunities for us to explore. We’ve made a promising start with EdgeCentre facilities and services that leverage our role as a neutral host. Wi-Fi applications and technologies are where significant innovation is occurring and governments around the world have begun to acknowledge this with increased Wi-Fi spectrum allocations.
Decisions on policy matters like this and within our broader regulatory context have the potential to amplify the consumer benefits from fibre in the next few years. New Zealand has a gigabit head start over the rest of the world. Let’s make the most of that advantage.
Annual Report 2021 13
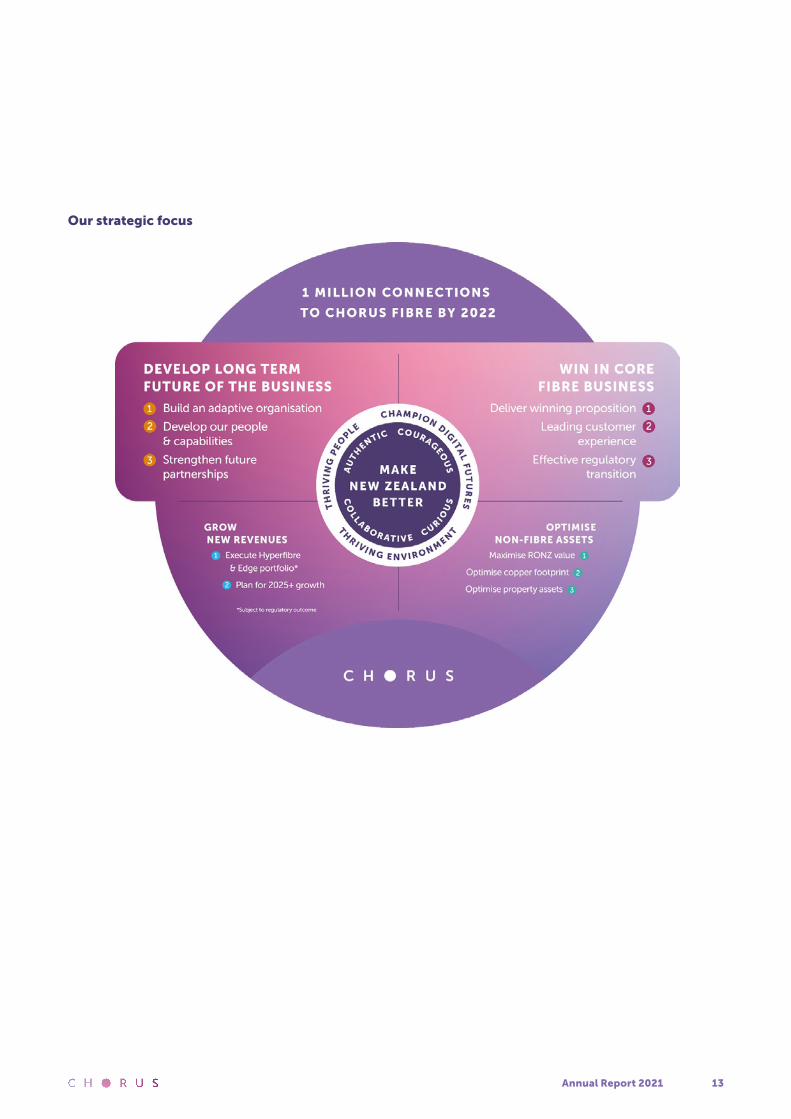
Our strategic focus

Annual Report 202114

Annual Report 2021 15
Management commentary
16 In summary
17 Revenue commentary
18 Expenditure commentary
21 Capital Expenditure commentary
23 Long term capital management
Annual Report 202116
2021$M
2020$M
Operating revenue 947 959
Operating expenses (298) (311)
Earnings before interest, income tax, depreciation and amortisation 649 648
Depreciation and amortisation (425) (402)
Earnings before interest and income tax 224 246
Net finance expense (152) (173)
Net earnings before income tax 72 73
Income tax expense (25) (21)
Net earnings for the year 47 52
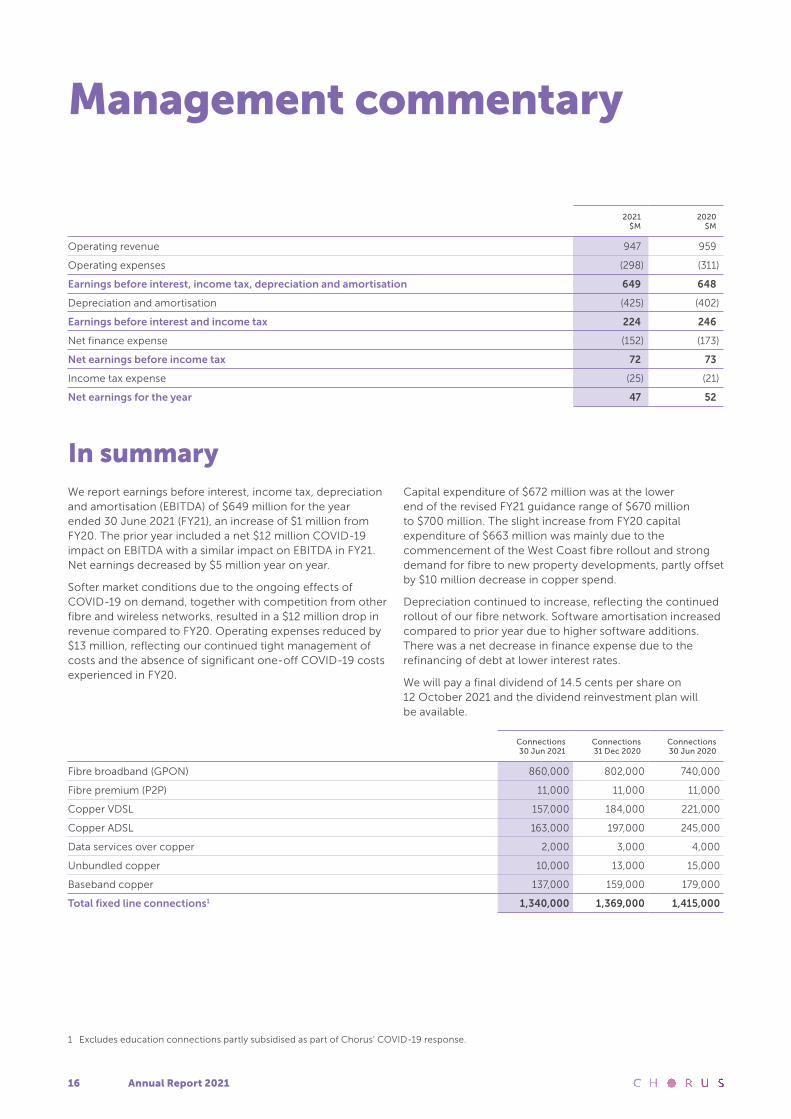
In summary
1 Excludes education connections partly subsidised as part of Chorus’ COVID-19 response.
We report earnings before interest, income tax, depreciation and amortisation (EBITDA) of $649 million for the year ended 30 June 2021 (FY21), an increase of $1 million from FY20. The prior year included a net $12 million COVID-19 impact on EBITDA with a similar impact on EBITDA in FY21. Net earnings decreased by $5 million year on year.
Softer market conditions due to the ongoing effects of COVID-19 on demand, together with competition from other fibre and wireless networks, resulted in a $12 million drop in revenue compared to FY20. Operating expenses reduced by $13 million, reflecting our continued tight management of costs and the absence of significant one-off COVID-19 costs experienced in FY20.
Capital expenditure of $672 million was at the lower end of the revised FY21 guidance range of $670 million to $700 million. The slight increase from FY20 capital expenditure of $663 million was mainly due to the commencement of the West Coast fibre rollout and strong demand for fibre to new property developments, partly offset by $10 million decrease in copper spend.
Depreciation continued to increase, reflecting the continued rollout of our fibre network. Software amortisation increased compared to prior year due to higher software additions. There was a net decrease in finance expense due to the refinancing of debt at lower interest rates.
We will pay a final dividend of 14.5 cents per share on 12 October 2021 and the dividend reinvestment plan will be available.
Connections30 Jun 2021
Connections31 Dec 2020
Connections30 Jun 2020
Fibre broadband (GPON) 860,000 802,000 740,000
Fibre premium (P2P) 11,000 11,000 11,000
Copper VDSL 157,000 184,000 221,000
Copper ADSL 163,000 197,000 245,000
Data services over copper 2,000 3,000 4,000
Unbundled copper 10,000 13,000 15,000
Baseband copper 137,000 159,000 179,000
Total fixed line connections1 1,340,000 1,369,000 1,415,000
Management commentary

Annual Report 2021 17
Revenue commentary
2021$M
2020$M
Fibre broadband (GPON) 477 393
Copper based broadband 203 271
Copper based voice 68 82
Fibre premium (P2P) 68 73
Field services products 62 65
Value added network services 30 29
Infrastructure 27 24
Data services over copper 9 16
Other 3 6
Total revenue 947 959
Revenue overviewChorus’ product portfolio encompasses a broad range of wholesale broadband, data and voice services across a mix of regulated and commercial products. Revenues of $947 million decreased by $12 million from FY20 reflecting a reduction of 75,000 total fixed line connections. The majority of line losses were copper-based voice connections. Fibre broadband revenue grew strongly as customers upgraded to fibre from copper-based services and demand for higher speed broadband increased.
Fibre broadband (GPON)Fibre broadband revenues continue to grow as customers migrate to our growing fibre network and broadband penetration increases. Fibre broadband connections grew by 16% to 860,000, with about 67% of connections on 100/20 Mbps plans, down from 69% in FY20. Uptake of 1 Gbps plans grew from 16% to 19% throughout the year, driven by our incentive campaigns to promote higher speed plans.
Copper based broadbandCopper based broadband revenue continues to decline as customers migrate from our ADSL and VDSL broadband services to either our fibre network or alternative fibre and wireless networks.
Copper based voiceCopper based voice revenues continue to decline as customers migrate to either a fibre based connection on our network, or to alternative fibre and wireless networks. Copper based voice connections declined by 42,000 lines in FY21 compared with 35,000 in FY20. Unbundled copper connections declined at the same rate as the prior year.
Fibre premium (P2P)Fibre premium (point to point) revenues decreased in FY21 as customers migrated from high value legacy connections. Total connections in this category remained constant as demand for Direct Fibre Access Service, other backhaul connections and mobile access increased.
Field services productField services revenue reduced by $3 million relative to FY20. This was due to reduced demand across services such as chargeable maintenance and installation activity.
Value added network servicesValue-added network services revenue increased slightly in FY21 due to one-off historic dispute resolution. The main driver for this revenue item is national data transport services which provide network connectivity across legacy backhaul links and aggregation handover links.
InfrastructureInfrastructure revenues increased $3 million to $27 million in FY21 reflecting a change in lease treatment for retailers’ use of Chorus’ buildings. While there was ongoing growth in demand for commercial co-location, this was largely offset by reduced demand for unbundled copper access space in exchanges.
Data services over copperData services over copper connections continue to decline as retailers transition business customers from legacy services to cheaper fibre based services, either on our fibre network, or on alternative local and CBD fibre networks.
OtherOther income largely consisted of revenue generated from the provision of billing and network management services to Spark, and settlements. FY20 included a favourable one-off settlement of $3 million.
Annual Report 202118
Expenditure commentary
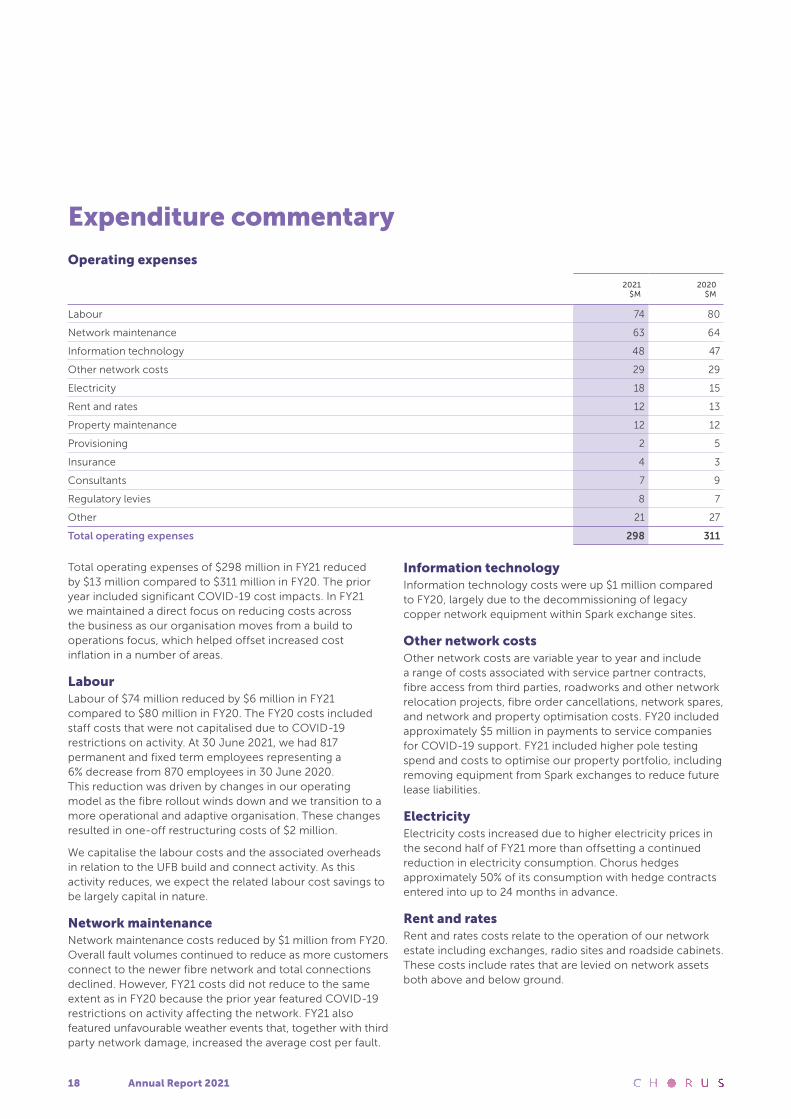
Operating expenses
2021$M
2020$M
Labour 74 80
Network maintenance 63 64
Information technology 48 47
Other network costs 29 29
Electricity 18 15
Rent and rates 12 13
Property maintenance 12 12
Provisioning 2 5
Insurance 4 3
Consultants 7 9
Regulatory levies 8 7
Other 21 27
Total operating expenses 298 311
Total operating expenses of $298 million in FY21 reduced by $13 million compared to $311 million in FY20. The prior year included significant COVID-19 cost impacts. In FY21 we maintained a direct focus on reducing costs across the business as our organisation moves from a build to operations focus, which helped offset increased cost inflation in a number of areas.
LabourLabour of $74 million reduced by $6 million in FY21 compared to $80 million in FY20. The FY20 costs included staff costs that were not capitalised due to COVID-19 restrictions on activity. At 30 June 2021, we had 817 permanent and fixed term employees representing a 6% decrease from 870 employees in 30 June 2020. This reduction was driven by changes in our operating model as the fibre rollout winds down and we transition to a more operational and adaptive organisation. These changes resulted in one-off restructuring costs of $2 million.
We capitalise the labour costs and the associated overheads in relation to the UFB build and connect activity. As this activity reduces, we expect the related labour cost savings to be largely capital in nature.
Network maintenanceNetwork maintenance costs reduced by $1 million from FY20. Overall fault volumes continued to reduce as more customers connect to the newer fibre network and total connections declined. However, FY21 costs did not reduce to the same extent as in FY20 because the prior year featured COVID-19 restrictions on activity affecting the network. FY21 also featured unfavourable weather events that, together with third party network damage, increased the average cost per fault.
Information technologyInformation technology costs were up $1 million compared to FY20, largely due to the decommissioning of legacy copper network equipment within Spark exchange sites.
Other network costsOther network costs are variable year to year and include a range of costs associated with service partner contracts, fibre access from third parties, roadworks and other network relocation projects, fibre order cancellations, network spares, and network and property optimisation costs. FY20 included approximately $5 million in payments to service companies for COVID-19 support. FY21 included higher pole testing spend and costs to optimise our property portfolio, including removing equipment from Spark exchanges to reduce future lease liabilities.
ElectricityElectricity costs increased due to higher electricity prices in the second half of FY21 more than offsetting a continued reduction in electricity consumption. Chorus hedges approximately 50% of its consumption with hedge contracts entered into up to 24 months in advance.
Rent and ratesRent and rates costs relate to the operation of our network estate including exchanges, radio sites and roadside cabinets. These costs include rates that are levied on network assets both above and below ground.
Annual Report 2021 19
ProvisioningProvisioning represents costs to provide connection services that are unable to be capitalised. These costs are reducing as the level of copper related activity reduces.
InsuranceInsurance increased due to higher premiums driven by prevalent economic conditions.
ConsultantsConsultant costs reduced by $2 million from FY20 due to the timing of activity to support implementation of the new regulated utility framework for fibre that will apply from January 2022.
Regulatory leviesRegulatory levies increased by $1 million compared to FY20 due to the Building Block Model (BBM) levy for the Commerce Commission’s implementation of the new fibre regulatory framework.
OtherOther costs include expenditure on general costs such as advertising, telecommunications, travel, training and legal fees. These reduced by $6 million in FY21, mainly as a result of adjustments to our doubtful debt provision and lower advertising spend.
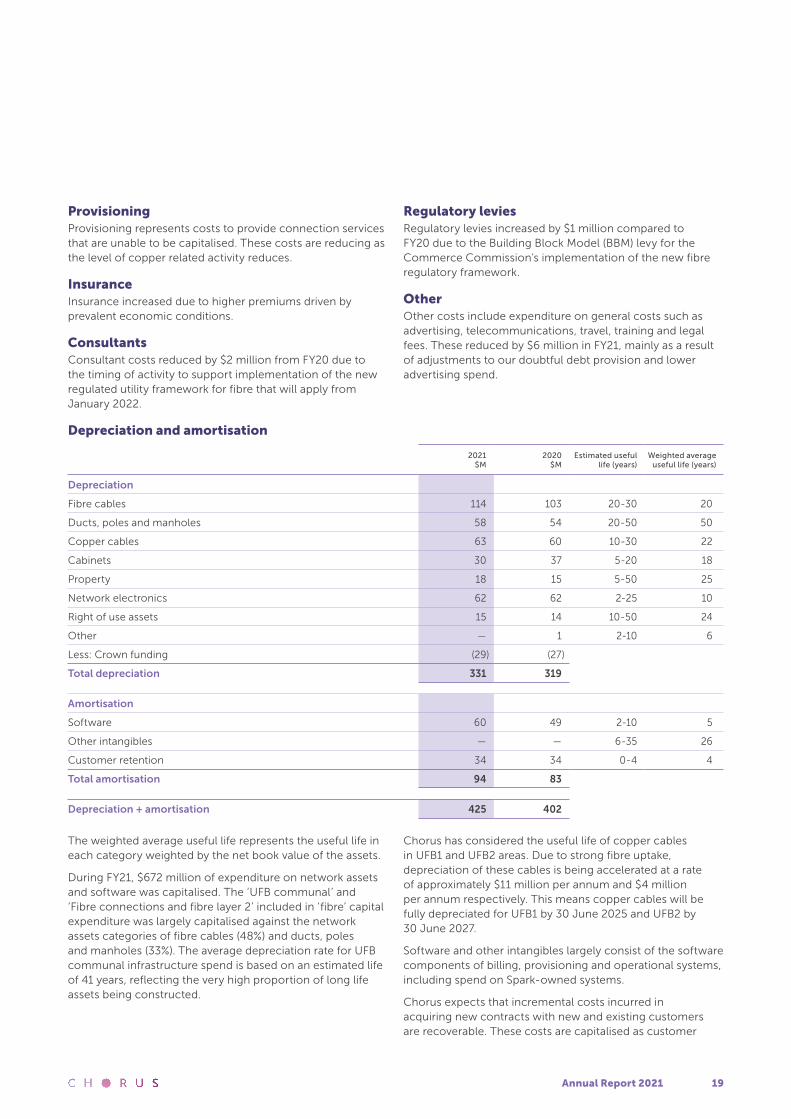
Depreciation and amortisation
2021$M
2020$M
Estimated useful life (years)
Weighted average useful life (years)
Depreciation
Fibre cables 114 103 20-30 20
Ducts, poles and manholes 58 54 20-50 50
Copper cables 63 60 10-30 22
Cabinets 30 37 5-20 18
Property 18 15 5-50 25
Network electronics 62 62 2-25 10
Right of use assets 15 14 10-50 24
Other — 1 2-10 6
Less: Crown funding (29) (27)
Total depreciation 331 319
Amortisation
Software 60 49 2-10 5
Other intangibles — — 6-35 26
Customer retention 34 34 0-4 4
Total amortisation 94 83
Depreciation + amortisation 425 402
The weighted average useful life represents the useful life in each category weighted by the net book value of the assets.
During FY21, $672 million of expenditure on network assets and software was capitalised. The ‘UFB communal’ and ‘Fibre connections and fibre layer 2’ included in ‘fibre’ capital expenditure was largely capitalised against the network assets categories of fibre cables (48%) and ducts, poles and manholes (33%). The average depreciation rate for UFB communal infrastructure spend is based on an estimated life of 41 years, reflecting the very high proportion of long life assets being constructed.
Chorus has considered the useful life of copper cables in UFB1 and UFB2 areas. Due to strong fibre uptake, depreciation of these cables is being accelerated at a rate of approximately $11 million per annum and $4 million per annum respectively. This means copper cables will be fully depreciated for UFB1 by 30 June 2025 and UFB2 by 30 June 2027.
Software and other intangibles largely consist of the software components of billing, provisioning and operational systems, including spend on Spark-owned systems.
Chorus expects that incremental costs incurred in acquiring new contracts with new and existing customers are recoverable. These costs are capitalised as customer

Annual Report 202120
retention assets. Capitalised customer retention assets are amortised against expenses when related revenues are recognised either upfront or over the life of the contract (currently estimated to be within a maximum of four years). In the period to 30 June 2021, the amount of amortisation was $34 million and there was no impairment in relation to the costs capitalised.
Our depreciation profile is expected to continue to change, reflecting the greater mix of longer dated UFB assets being built. The offset of Crown funding against depreciation is expected to continue to increase over time as the amount of funding received from the Crown accumulates, with the associated amortisation credit to depreciation increasing accordingly.
Finance income and expense
(income)/expense2021
$M2020
$M
Finance income (1) (12)
Finance expense
Interest on syndicated bank facility 5 5
Interest on EMTN - GBP — 40
Interest on EMTN - EUR 47 44
Interest on fixed rate NZD bonds 43 40
Other interest expense 30 27
Capitalised interest (2) (3)
Interest costs 123 153
Ineffective portion of changes in fair value of cash flow hedges (4) 3
Total finance expenses excluding securities (notional) interest 119 156
Securities (notional) interest 34 29
Total finance expense 153 185
Finance income is lower in FY21 because FY20 included the proceeds from term deposits held until required for repayment of the GBP EMTN in April 2020.
Interest costs decreased by $30 million year on year with the weighted effective interest rate on debt reducing to 4.16% from 5.16% in FY20. A $400m NZD bond was repaid in May 2021. This was refinanced in December 2020 with $400m of NZD bonds, equally split between two tranches, maturing in 2027 and 2030.
Other interest expense includes lease interest of $20 million (FY20: $21 million) and amortisation arising from the difference between fair value and proceeds realised from interest rate swap resets of $7 million (FY20: $5 million). Notional interest on Crown Infrastructure Partners (CIP) securities also increased as Crown funding continued to grow.
At a minimum, we aim to maintain 50% of our debt obligations at a fixed rate of interest. We have fully hedged the foreign exchange exposure on the EUR EMTNs with cross currency interest rate swaps. A portion of the floating interest on the EUR cross currency interest rate swaps has been hedged using interest rate swap instruments.
Ineffectiveness
As at 30 June 2021 Chorus holds all interest swaps in designated hedging relationships. These relationships are designated as either cash flow hedges, or fair value hedges.
Provided that the cash flow hedges remain effective, any future gains or losses will be processed through the hedge reserve in the statement of changes in equity. Effective fair value hedges will be offset within the finance expense. Minor differences in the hedged values will flow to finance expense in the income statement over the life of the derivatives as ineffectiveness. Minor differences in the credit valuation portion may also flow to the finance expense. Neither the direction, nor the rate of the impact on the income statement can be predicted as it is influenced by external market factors.
Ineffectiveness largely consists of the cumulative change in fair value of three interest rate swaps, designated as cash flow hedges that were restructured in prior years. Two of these restructured interest rate swaps have a combined face value of $500 million and relate to the 10 year resettable NZD bond issued in 2018. The other restructured interest rate swap has a face value of $200 million and relates to the EUR 300m EMTN bond. In FY21, ineffectiveness was credit $4 million (FY20: debit $3 million) across all hedge relationships.

Annual Report 2021 21
Taxation
The FY21 effective tax rate is 35% (FY20:29%). This is higher than FY20 which included a one-off $5m reduction to reported tax expense to account for the reintroduction of tax depreciation on buildings. The effective tax rate is higher than the statutory tax rate of 28% due to permanent differences between tax and accounting. Ongoing permanent differences arise from the tax treatment of the CIP securities and Crown funding for the Rural Broadband Initiative (RBI).
2 Layer 2 equipment, such as gigabit capable passive optical network ports, is installed ahead of demand as the UFB footprint expands.
The accounting interest and depreciation credit recognised in the profit and loss in relation to securities are non taxable as confirmed via binding rulings issued by Inland Revenue. RBI assets were funded by non taxable government grants. The accounting amortisation of RBI government grants and RBI accounting depreciation recognised in the profit and loss are non taxable and tax depreciation is not claimed.
Capital Expenditure commentary
2021$M
2020$M
Fibre 567 548
Copper 45 55
Common 60 60
Gross capital expenditure 672 663
Gross capital expenditure for FY21 was $672 million. This was $9 million higher than FY20 gross capital expenditure spend which was impacted by COVID-19 restrictions on field activity. Fibre spend increased due to the commencement of the West Coast fibre build project and strong demand from
new property developments. Copper related expenditure reduced by 18% on FY20 as copper network demand continues to reduce. Crown funding of $73 million was received for the UFB rollout, $24 million for the West Coast fibre project and $6 million for other capital expenditure.
Fibre capital expenditure
2021$M
2020$M
UFB communal 147 170
Fibre installations and fibre layer 22 275 282
Fibre products and systems 14 14
Other fibre and growth 91 54
Fibre sustain 11 8
Customer retention costs 29 20
Total fibre capital expenditure 567 548
Fibre capital expenditure included expenditure specifically focused on fibre assets and represented approximately 84% of our FY21 gross capital expenditure, consistent with FY20.
UFB communal network spend was $147 million in FY21 and was for deployment in UFB2 areas. This compared to $170 million in FY20, of which $25 million had been for the last stages of the UFB1 rollout. The UFB2 rollout was ahead of schedule and this meant communal expenditure was $3 million higher than guidance.
Fibre installations and layer 2 expenditure was $275 million. About 172,000 fibre installations were completed nationwide, including 44,000 for UFB2 customers. This was an increase on 167,000 installations in FY20, which had been impacted by COVID-19 restrictions. About $44 million was invested in ‘backbone’ network to enable the connection of multiple customers located along rights of way and multi-dwelling units.

Annual Report 202122
The average cost per premises connected (CPPC) in UFB1 areas was $1,0553, which was at the lower end of the FY21 guidance range of $1,025 to $1,175. The CPPC in UFB2 areas was $1,2173, which was at the lower end of the FY21 guidance range of $1,200 to $1,350.
Other fibre and growth increased $37 million compared to FY20, due to the commencement of build activities for the rollout of West Coast fibre and higher new property development demand. The West Coast fibre project is primarily government funded and is expected to complete in FY23.
3 Excluding layer 2 and backbone costs for multi-dwelling units and rights of way and including standard installations and some non-standard single dwellings and service desk costs.
Fibre network sustain refers to capital expenditure where the fibre network has been upgraded or network elements, such as poles, cabinets and cables are replaced. This is typically where network replacement is deemed more cost effective than reactive maintenance, or network is being relocated for reasons such as roadworks.
Customer retention costs increased from FY20 due to stronger market activity and less disruption from COVID-19.
Copper capital expenditure
2021$M
2020$M
Network sustain 29 31
Copper connections 1 1
Copper layer 2 4 7
Customer retention costs 11 16
Total copper capital expenditure 45 55
Copper capital expenditure decreased by $10 million from FY20 reflecting the lower spend required as customer numbers on our copper network reduce. Less investment in layer 2 capacity and customer retention were needed as more customers migrate to fibre and there is less demand for new copper broadband connections.
Common capital expenditure
2021$M
2020$M
Information technology 46 43
Building and engineering services 14 17
Total common capital expenditure 60 60
Information technology spend increased by $3 million from FY20 due to lifecycle upgrades for IT infrastructure. Building and engineering services decreased by the same amount due to lower spend on exchange building infrastructure upgrades.

Annual Report 2021 23
Long term capital managementWe will pay a final dividend of 14.5 cents per share on 12 October 2021 to all holders registered at 5.00pm 14 September 2021. The shares will be quoted on an ex-dividend basis from 13 September 2021. The dividends paid will be fully imputed, at a ratio of 28/72, in line with the corporate income tax rate. In addition, a supplementary dividend of 2.56 cents per share will be payable to shareholders who are not resident in New Zealand.
The dividend reinvestment plan will remain in place for the final dividend at a discount rate of 2%. Shareholders who have previously elected to participate in the dividend reinvestment plan do not need to take any further action. For those shareholders who wish to participate, election notices to participate must be received by 5.00pm (NZ time) on 15 September 2021.
Chorus is transitioning to a new free cash flow based dividend policy from 1 July 2021. As previously disclosed, full implementation of the policy will initially be constrained by the existing credit rating thresholds, given remaining capex to complete the UFB build and elevated installation capex. We also note that key regulatory settings for the 2022 to 2024 regulatory period will not be confirmed until December 2021.
Initial dividend guidance for FY22 has therefore been set at 26 cents per share, subject to no material adverse changes in circumstance or outlook. We expect to be able to provide further detail on dividend outlook, including expected pay-out range, at the half year result in February 2022, following confirmation of final regulatory settings. The FY21 final and FY22 interim dividends are expected to be fully imputed. We anticipate the FY22 final dividend will not be imputed.
The NZD $400 million bond was repaid in May 2021. This bond was refinanced in December 2020 with a dual tranche $400m bond due to mature in December 2027 and December 2030.
The Board considers that a ‘BBB’ or equivalent credit rating is appropriate for a company such as Chorus. It intends to maintain capital management and financial policies consistent with these credit ratings. At 30 June 2021, we had a long term credit rating of BBB/stable outlook by Standard & Poor’s and Baa2/stable by Moody’s Investors Service.

Annual Report 202124

Annual Report 2021 25
Financial statements
26 Independent auditor’s report
29 Income statement
29 Statement of comprehensive income
30 Statement of financial position
31 Statement of changes in equity
32 Statement of cash flows
34 Notes to the financial statements

Annual Report 202126
Independent auditor’s report
To the shareholders of Chorus Limited
Report on the consolidated financial statements
Basis for opinionWe conducted our audit in accordance with International Standards on Auditing (New Zealand) (‘ISAs (NZ)’). We believe that the audit evidence we have obtained is sufficient and appropriate to provide a basis for our opinion.
We are independent of the Group in accordance with Professional and Ethical Standard 1 International Code of Ethics for Assurance Practitioners (Including International Independence Standards) (New Zealand) issued by the New Zealand Auditing and Assurance Standards Board and the International Ethics Standards Board for Accountants’ International Code of Ethics for Professional Accountants (including International Independence Standards) (‘IESBA Code’), and we have fulfilled our other ethical responsibilities in accordance with these requirements and the IESBA Code.
Our responsibilities under ISAs (NZ) are further described in the auditor’s responsibilities for the audit of the consolidated financial statements section of our report.
Our firm has also provided other services to the Group in relation to regulatory audit and other advisory services. Subject to certain restrictions, partners and employees of our firm may also deal with the Group on normal terms within the ordinary course of trading activities of the business of the Group. These matters have not impaired our independence as auditor of the Group. The firm has no other relationship with, or interest in, the Group.
MaterialityThe scope of our audit was influenced by our application of materiality. Materiality helped us to determine the nature, timing and extent of our audit procedures and to evaluate the effect of misstatements, both individually and on the consolidated financial statements as a whole. The materiality for the consolidated financial statements as a whole was set at $8.5 million determined with reference to a benchmark of Group revenue. We chose the benchmark because, in our view, this is a key measure of the Group’s performance.
Key audit mattersKey audit matters are those matters that, in our professional judgement, were of most significance in our audit of the company and group financial statements in the current period. We summarise below those matters and our key audit procedures to address those matters in order that the shareholders as a body may better understand the process by which we arrived at our audit opinion. Our procedures were undertaken in the context of and solely for the purpose of our statutory audit opinion on the consolidated statements as a whole and we do not express discrete opinions on separate elements of the consolidated financial statements.
OpinionIn our opinion, the accompanying consolidated financial statements of Chorus Limited (the ’company’) and its subsidiaries (the ‘Group’) on pages 29 to 59:
i. present fairly in all material respects the Group’s financial position as at 30 June 2021 and its financial performance and cash flows for the year ended on that date; and
ii. comply with New Zealand Equivalents to International Financial Reporting Standards (NZ IFRS) and International Financial Reporting Standards.
We have audited the accompanying consolidated financial statements which comprise:
— the consolidated statement of financial position as at 30 June 2021;
— the consolidated income statement, statements of other comprehensive income, changes in equity and cash flows for the year then ended; and
— notes, including a summary of significant accounting policies and other explanatory information.

Annual Report 2021 27
The key audit matter How the matter was addressed in our audit
Capitalisation of assets
Refer to Note 1 to the Financial Statements.
During the year ended 30 June 2021 the Group has spent $581 million in network asset additions as it continues with its purpose of bringing better broadband to New Zealanders. As at 30 June 2021, the Group has total network assets of $5,269 million. Capitalisation of these costs and useful lives assigned to these assets are a key audit matter due to the significance of network assets to the Group’s business, and due to the judgement involved in the:
— decision to capitalise or expense costs relating to the network. This decision depends on whether the expenditure is considered to enhance network capability (and therefore capital), or to maintain the current operating capability of the network (and therefore an expense);
— estimation of the stage of completion of assets under construction; and
— estimation of the useful life of the asset once the costs are capitalised. There is also judgment when estimating asset lives due to the uncertainty of the impact of technological change.
Our audit procedures included:
— Examining that the controls to recognise capital projects in the fixed asset register and the approval of the asset life annual review are effective.
— Assessing the nature of costs incurred in capital projects by checking a sample of costs to invoice to determine whether the description of the expenditure met the capitalisation criteria.
— Evaluating a sample of assets under construction in which no costs had been incurred in the final three months of the financial reporting period. We challenged the status of those assets under construction to determine whether they remained appropriately capitalised.
— Assessing, on a sample basis, whether the accruals recorded for assets under construction were calculated in accordance with the progress of construction and the arrangements with external suppliers.
— Assessing the useful economic lives of the assets, by comparing to our knowledge of the business and its operations and industry benchmarks.
Chorus Funding
Refer to Notes 4, 6, 7 and 19 to the Financial Statements.
The CIP securities and interest rate derivatives are a key audit matter due to their significance to the Group’s consolidated statement of financial position. There is complexity and judgement involved in determining the appropriate valuation and accounting treatment for the interest rate derivatives and the CIP securities
Our audit procedures to assess the valuation and accounting treatment for the Group’s interest rate derivatives and CIP securities included:
— Our financial instrument specialists re-valuing all interest rate derivatives using valuation models and inputs independent from those utilised by management.
— Evaluating the hedge effectiveness of the interest rate derivatives hedging the EUR denominated Euro Medium Term Notes, the NZD Bond 2028 and the NZD Bond 2030. In all instances, our financial instrument specialists assessed the effectiveness of these hedges by independently modelling the future changes in the value of these instruments to assess whether the underlying derivatives were effective.
— Assessing the accounting treatment of the CIP securities. We read the underlying loan agreement and analysed the various features of the loan agreement to determine whether the CIP securities were a debt or equity instrument.
— Evaluating the valuation of the CIP securities. Our valuation specialists assessed the methodology used by management for determining the amounts allocated to debt and government grant.
— Assessing the inputs used in the valuation of the CIP securities. On a sample basis we compared interest rates and credit spreads to independent sources of information to determine an acceptable range of valuation inputs.
Revenue recognition
Refer to Note 9 to the Financial Statements.
Accuracy of revenue is considered to be a key audit matter due to the nature of the underlying billing processes that existed following the Chorus demerger from Spark in 2011.
There are certain legacy products where the billing is based on network consumption which cannot be easily linked to a physical end user connection. There is a risk that revenue billed on this basis may be disputed by Chorus’ customers who have a different view of their consumption of the Chorus network.
Our audit procedures included:
— Evaluating the Group’s recognition of revenue by assessing any revenue disputes recorded in the industry’s dispute reporting tool by Chorus customers. We compared the disputes raised by Chorus customers to the revenue recorded by Chorus and agreed settled disputes to final settlement agreements.
— Independently confirming the accuracy of a sample of outstanding debtor balances with Chorus customers.
— Agreeing a sample of revenue adjustments recorded during the year to authorised credit notes.

Annual Report 202128
Other informationThe Directors, on behalf of the Group, are responsible for the other information included in the Annual Report. Other information includes Chorus’s operating, marketing and regulatory overviews, management commentary and disclosures relating to corporate governance and statutory information. Our opinion on the company and Group financial statements does not cover any other information and we do not express any form of assurance conclusion thereon.
In connection with our audit of the company and group financial statements our responsibility is to read the other information and, in doing so, consider whether the other information is materially inconsistent with the company and group financial statements or our knowledge obtained in the audit or otherwise appears materially misstated. If, based on the work we have performed, we conclude that there is a material misstatement of this other information, we are required to report that fact. We have nothing to report in this regard.
Use of this independent auditor’s reportThis independent auditor’s report is made solely to the shareholders as a body. Our audit work has been undertaken so that we might state to the shareholders those matters we are required to state to them in the independent auditor’s report and for no other purpose. To the fullest extent permitted by law, we do not accept or assume responsibility to anyone other than the shareholders as a body for our audit work, this independent auditor’s report, or any of the opinions we have formed.
Responsibilities of the Directors for the consolidated financial statementsThe Directors, on behalf of the Group, are responsible for:
— the preparation and fair presentation of the consolidated financial statements in accordance with generally accepted accounting practice in New Zealand (being New Zealand Equivalents to International Financial Reporting Standards) and International Financial Reporting Standards;
— implementing necessary internal control to enable the preparation of a consolidated set of financial statements that is fairly presented and free from material misstatement, whether due to fraud or error; and
— assessing the ability to continue as a going concern. This includes disclosing, as applicable, matters related to going concern and using the going concern basis of accounting unless they either intend to liquidate or to cease operations, or have no realistic alternative but to do so.
Auditor’s responsibilities for the audit of the consolidated financial statementsOur objective is:
— to obtain reasonable assurance about whether the consolidated financial statements as a whole are free from material misstatement, whether due to fraud or error; and
— to issue an independent auditor’s report that includes our opinion.
Reasonable assurance is a high level of assurance, but is not a guarantee that an audit conducted in accordance with ISAs NZ will always detect a material misstatement when it exists.
Misstatements can arise from fraud or error. They are considered material if, individually or in the aggregate, they could reasonably be expected to influence the economic decisions of users taken on the basis of these consolidated financial statements.
A further description of our responsibilities for the audit of these consolidated financial statements is located at the External Reporting Board (XRB) website at:
http://www.xrb.govt.nz/standards-for-assurance-practitioners/auditors-responsibilities/audit-report-1/
This description forms part of our independent auditor’s report.
The engagement partner on the audit resulting in this independent auditor’s report is Ed Louden.
For and on behalf of
KPMG Wellington 23 August 2021

Annual Report 2021 29
Income statement
For the year ended 30 June 2021
Notes2021
$M2020
$M
Operating revenue 9 947 959
Operating expenses 10 (298) (311)
Earnings before interest, income tax, depreciation and amortisation 649 648
Depreciation 1,7 (331) (319)
Amortisation 2,3 (94) (83)
Earnings before interest and income tax 224 246
Finance income 1 12
Finance expense 4 (153) (185)
Net earnings before income tax 72 73
Income tax expense 14 (25) (21)
Net earnings for the year 47 52
Earnings per share
Basic earnings per share (dollars) 17 0.11 0.12
Diluted earnings per share (dollars) 17 0.08 0.10
Statement of comprehensive income
For the year ended 30 June 2021
Note2021
$M2020
$M
Net earnings for the year 47 52
Other comprehensive income
Items that will be reclassified subsequently to Income statement when specific conditions are met net of tax
Movements in effective cash flow hedges 19 62 (28)
Amortisation of de-designated cash flow hedges transferred to Income statement 19 5 (3)
Movement in cost of hedging reserve 19 (7) 3
Other comprehensive income net of tax 60 (28)
Total comprehensive income for the year net of tax 107 24
The accompanying notes are an integral part of these financial statements.

Annual Report 202130
Statement of financial position
As at 30 June 2021
Notes2021
$M2020
$M
Current assets
Cash and call deposits 15 53 —
Income tax receivable 23 20
Trade and other receivables 11 122 140
Derivative financial instruments 19 4 2
Finance lease receivable — 3
Total current assets 202 165
Non-current assets
Derivative financial instruments 19 71 93
Trade and other receivables 11 2 1
Deferred tax receivable 14 93 116
Customer retention assets 3 59 56
Software and other intangible assets 2 164 159
Network assets 1 5,269 5,052
Total non-current assets 5,658 5,477
Total assets 5,860 5,642
Current liabilities
Cash overdraft 15 — 5
Trade and other payables 12 278 279
Income tax payable 5 —
Lease payable 5 10 9
Derivative financial instruments 19 1 —
Debt 4 140 430
Total current liabilities excluding Crown funding 434 723
Crown funding 7 27 26
Total current liabilities 461 749
Non-current liabilities
Trade and other payables 12 11 3
Deferred tax payable 14 374 350
Derivative financial instruments 19 106 148
Lease payable 5 254 257
Debt 4 2,233 1,892
Total non-current liabilities excluding CIP and Crown funding 2,978 2,650
Crown Infrastructure Partners (CIP) securities 6 545 461
Crown funding 7 928 855
Total non-current liabilities 4,451 3,966
Total liabilities 4,912 4,715
Equity
Share capital 16 689 666
Reserves 19 (51) (111)
Retained earnings 310 372
Total equity 948 927
Total liabilities and equity 5,860 5,642
The accompanying notes are an integral part of these financial statements.
The financial statements are approved and signed on behalf of the Board.
Patrick Strange
Chair
Authorised for issue on 23 August 2021
Mark Cross
Chair, Audit and Risk Management Committee

Annual Report 2021 31
Statement of changes in equity
For the year ended 30 June 2021
NotesShare capital
$M
Retained earnings
$M
Hedging-related reserves
$MTotal
$M
Balance at 1 July 2019 638 424 (83) 979
Comprehensive income
Net earnings for the year — 52 — 52
Other comprehensive income
Movement in cash flow hedge reserve 19 — — (28) (28)
Amortisation of de-designated cash flow hedges transferred to
income statement19 — — (3) (3)
Movement in cost of hedging reserve 19 — — 3 3
Total comprehensive income — 52 (28) 24
Contributions by and (distributions to) owners:
Dividends 16 — (104) — (104)
Supplementary dividends — (12) — (12)
Tax credit on supplementary dividends — 12 — 12
Dividend reinvestment plan 16 28 — — 28
Total transactions with owners 28 (104) — (76)
Balance at 30 June 2020 666 372 (111) 927
Comprehensive income
Net earnings for the year — 47 — 47
Other comprehensive income
Movement in cash flow hedge reserve 19 — — 62 62
Amortisation of de-designated cash flow hedges transferred
to income statement19 — — 5 5
Movement in cost of hedging reserve 19 — — (7) (7)
Total comprehensive income — 47 60 107
Contributions by and (distributions to) owners:
Dividends 16 — (109) — (109)
Supplementary dividends — (12) — (12)
Tax credit on supplementary dividends — 12 — 12
Dividend reinvestment plan 16 23 — — 23
Total transactions with owners 23 (109) — (86)
Balance at 30 June 2021 689 310 (51) 948
The accompanying notes are an integral part of these financial statements.

Annual Report 202132
Statement of cash flows
For the year ended 30 June 2021
Notes2021
$M2020
$M
Cash flows from operating activities
Cash was provided from/(applied to):
Cash received from customers 954 940
Finance income 1 12
Payment to suppliers and employees (302) (329)
Taxation paid (1) (12)
Interest paid (96) (137)
Net cash flows provided from operating activities 556 474
Cash flows applied to investing activities
Cash was applied to:
Purchase of network and intangible assets (647) (679)
Capitalised interest paid (2) (3)
Net cash flows applied to investing activities (649) (682)
Cash flows from financing activities
Cash was provided from/(applied to):
Net outflow from leases (28) (23)
Crown funding (including CIP securities) 155 162
Proceeds from debt 510 544
Repayment of debt (400) (677)
Dividends paid (86) (76)
Net cash flows provided from/(applied to) financing activities 151 (70)
Net cash flows 58 (278)
Cash at the beginning of the year (5) 273
Cash at the end of the year 15 53 (5)
The accompanying notes are an integral part of these financial statements.
Reconciliation of net earnings to net cash flows from operating activities
Notes2021
$M2020
$M
Net earnings for the year 47 52
Adjustment for:
Depreciation charged on network assets 1 360 346
Amortisation of Crown funding 7 (29) (27)
Amortisation of software and other intangible assets 2 60 49
Amortisation of customer retention assets 3 38 40
Deferred income tax 14 24 11
Ineffective portion of changes in fair value of cash flow hedges 4 (4) 3
Amortisation of non-cash finance expenses (5) (5)
CIP securities (notional) interest 4 34 29
Other 5 (7)
530 491
Change in current assets and liabilities:
Decrease in trade and other receivables 11 17 6
Increase / (decrease) in trade payables 12 7 (12)
Increase in income tax receivable (3) (9)
Increase / (decrease) in income tax payable 5 (2)
26 (17)
Net cash flows from operating activities 556 474
The accompanying notes are an integral part of these financial statements.

Annual Report 2021 33
Reconciliation of movements of liabilities and equity to net cash flows from financing activities
Debt$M
Crown funding$M
CIP securities$M
Lease payable (net)$M
Share capital$M
Retained earnings$M
Balance at 1 July 2019 2,232 822 355 248 638 424
Movements from cash flows
Net outflow from leases — — — (23) — —
Proceeds from funding 544 85 77 — — —
Proceeds from repayment of borrowings (677) — — — — —
Dividends paid — — — — — (76)
Total changes from financing cash flows (133) 85 77 (23) — (76)
Non-cash movements
Movements in fair value (including foreign
exchange rates)224 — — — — —
Transaction costs and amortisation related to
financing(1) (29) 29 — — —
Accruals — 3 — — — —
Dividend reinvestment plan — — — — 28 (28)
Net lease movements — — — 38 — —
Net earnings for the year ended 30 June 2020 — — — — — 52
Balance at 30 June 2020 2,322 881 461 263 666 372
Movements from cash flows
Net outflow from leases — — — (28) — —
Proceeds from funding 510 105 50 — — —
Repayment of borrowings (400) — — — — —
Dividends paid — — — — — (86)
Total changes from financing cash flows 110 105 50 (28) — (86)
Non-cash movements
Movements in fair value (including foreign
exchange rates)(59) — — — — —
Transaction costs and amortisation related to
financing— (29) 34 — — —
Accruals — (2) — — — —
Dividend reinvestment plan — — — — 23 (23)
Net lease movements — — — 29 — —
Net earnings for the year ended 30 June 2021 — — — — — 47
Balance at 30 June 2021 2,373 955 545 264 689 310
The accompanying notes are an integral part of these financial statements.

Annual Report 202134
Notes to the financial statements
Reporting entity and statutory base
Chorus includes Chorus Limited together with its subsidiaries.
Chorus is New Zealand’s largest fixed line communications
infrastructure business. It maintains and builds a network
predominantly made up of fibre and copper cables, local
telephone exchanges and cabinets.
Chorus Limited is a profit-oriented company registered in
New Zealand under the Companies Act 1993 and is a FMC
Reporting Entity for the purposes of the Financial Markets
Conduct Act 2013. Chorus Limited was established as a
standalone, publicly listed entity on 1 December 2011, upon its
demerger from Spark New Zealand Limited (Spark, previously
Telecom Corporation of New Zealand Limited). The demerger
was a condition of an agreement with Crown Infrastructure
Partners Limited (previously Crown Fibre Holdings) to enable
Chorus Limited to provide the majority of the Crown’s Ultra-Fast
Broadband (UFB). Chorus Limited is listed and its ordinary shares
are quoted on the NZX main board equity security market (NZX
Main Board) and on the Australian Stock Exchange (ASX) and
has bonds quoted on the NZX and ASX debt markets. American
Depositary Shares, each representing five ordinary shares (and
evidenced by American Depositary Receipts), are not listed but
are traded on the over-the-counter market in the United States.
These financial statements have been prepared in accordance with
Generally Accepted Accounting Practice in New Zealand (NZ GAAP)
and Part 7 of the Financial Markets Conduct Act 2013. They comply
with New Zealand equivalents to International Financial Reporting
Standards (NZ IFRS) as appropriate for profit-oriented entities, and
with International Financial Reporting Standards.
These financial statements are expressed in New Zealand dollars.
All financial information has been rounded to the nearest million,
unless otherwise stated.
The measurement basis adopted in the preparation of
these financial statements is historical cost, modified by the
revaluation of financial instruments as identified in the specific
accounting policies below and the accompanying notes.
The Directors have considered the impact of the COVID-19
pandemic on these financial statements and note no material
impact to the going concern basis on which they are prepared.
Accounting policies and standards
Accounting policies that summarise the measurement basis
used which are relevant to the understanding of the financial
statements are provided throughout the accompanying notes.
The accounting policies adopted and methods of computation
have been applied consistently throughout the periods
presented in these financial statements.
Interest Rate Benchmark Reform
Interbank offered rates (“IBORs”) play an important role in global
financial markets. Market developments relating to the reliability
and robustness of some interest rate benchmarks has resulted in
the global regulatory community initiating various programmes
to develop alternative benchmarks (risk free rates) within certain
jurisdictions. These reforms have led to uncertainty about the
long-term viability of some interest rate benchmarks beyond
1 January 2022. Chorus’ hedging activities expose it to EUR
IBOR, which is subject to cessation.
In November 2019, the External Reporting Board (“XRB”) issued
the standard Interest Rate Benchmark Reform – amendments
to NZ IFRS 9, NZ IAS 39 and NZ IFRS 7, effective for periods
beginning on or after 1 January 2020. These amendments
require an entity to assume no impact to existing hedge
accounting relationships in the period leading up to the reform
(i.e. that the interest rate benchmark on which the hedged cash
flows and cash flows of the hedging instrument are based is not
altered as a result of the uncertainties of the reform).
The Interest Rate Benchmark Reform amendments are part of
phase 1 of the two-phase International Accounting Standard
Board (IASB) reform project. Phase 1 considers relief to hedge
accounting in the period before reform. Phase 2 of the reform
focuses on the financial reporting issues that may arise once the
existing rate is replaced with an alternative rate.
Chorus continues to monitor the expected impact of the Interest
Rate Benchmark Reform, with initial assessments indicating the
impact to the financial statements of Chorus to be insignificant.
Reclassification and re-statement of comparatives
Where management have reclassified items in the financial
statements, the related comparative disclosures have been
adjusted to provide a like-for-like comparison.
Accounting estimates and judgements
In preparing the financial statements, management has made
estimates and assumptions about the future that affect the
reported amounts of assets and liabilities at the date of the
financial statements and the reported amounts of revenue and
expenses during the period. Actual results could differ from
those estimates.
Estimates and assumptions are continually evaluated and are
based on experience and other factors, including macro-
economic and market factors, and expectations of future
events that may have an impact on Chorus. All judgements,
estimates, and assumptions are believed to be reasonable based
on the most current set of circumstances available to Chorus.
The principal areas of judgement in preparing these financial
statements are set out below.

Annual Report 2021 35
Network assets (note 1)
Assessing the carrying value of network assets for impairment
considerations which includes assessing the appropriateness
of useful life and residual value estimates of network assets, the
physical condition of the asset, technological advances, regulation
and expected disposal proceeds from the future sale of the asset.
Customer retention assets (note 3)
Assessing the carrying value of customer retention assets
for impairment considerations which includes assessing the
appropriateness of useful life, contract terms, revenue and
customer connections data.
Crown Infrastructure Partners (CIP) securities (note 6)
Determining the fair value of the CIP securities requires
assumptions on expected future cash flows and discount rates
based on future long dated swap curves.
Financial risk management (note 19 and 20)
Accounting judgements have been made in determining hedge
designation and the fair value of derivatives and borrowings.
The fair value of derivatives and borrowing are determined based
on valuation models that use forward-looking estimates and
market observable data, to the extent that it is available.
Note 1 – Network assetsIn the Statement of financial position, network assets are stated
at cost less accumulated depreciation and any accumulated
impairment losses. The cost of additions to network assets
and work in progress constructed by Chorus includes the
cost of all materials used in construction, direct labour costs
specifically associated with construction, interest costs that are
attributable to the asset, resource management consent costs
and attributable overheads.
Repairs and maintenance costs are recognised in the Income
statement as incurred. If the useful life of the asset is extended or
the asset is enhanced then the associated costs are capitalised.
Estimating useful lives and residual values of network
assets
The determination of the appropriate useful life for a particular
asset requires management to make judgements about,
amongst other factors, the expected period of service potential
of the asset, the likelihood of the asset becoming obsolete as a
result of technological advances, and the likelihood of Chorus
ceasing to use the asset in business operations.
Where an item of network assets comprises major components
having different useful lives, the components are accounted for
as separate items of network assets.
Where the remaining useful lives or recoverable values have
diminished due to technological, regulatory or market condition
changes, depreciation is accelerated. The assets’ residual values,
useful lives, and methods of depreciation are reviewed annually
and adjusted prospectively, if appropriate.
Depreciation is charged on a straight-line basis to write down
the cost of network assets to their estimated residual value over
their estimated useful life.
Estimated useful lives are as follows:
Fibre cables 20-30 years
Ducts, manholes, and poles 20-50 years
Copper cables 10-30 years
Cabinets 5-20 years
Property 5-50 years
Network electronics 2-25 years
Right of use assets (leases) 10-50 years
Other 2-10 years
Other network assets include motor vehicles, test instruments
and tools and plant.
An item of network assets and any significant part is
derecognised upon disposal or when no future economic
benefits are expected from its use. Where network assets
are disposed of, the profit or loss recognised in the Income
statement is calculated as the difference between the sale price
and the carrying value of the asset.
Leased assets and corresponding liabilities are recognised as
‘right of use’ assets and depreciated over the life of the lease.
Non-monetary items that are measured in terms of historical
cost in a foreign currency are translated using the exchange
rates as at the dates of the initial transactions.
Land and work in progress are not depreciated. Work in progress
is reviewed on a regular basis to ensure that costs represent
future assets.

Annual Report 202136
30 June 2021
Fibre cables
$M
Ducts, manholes, and poles
$M
Copper cables
$MCabinets
$MProperty
$M
Network electronics
$M
Right of use assets
$MOther
$M
Work in progress
$MTotal
$M
Cost
Balance at 1 July 2020 2,276 2,754 2,409 693 435 1,811 292 5 166 10,841
Additions 222 211 6 22 28 67 11 1 265 833
Disposals (1) — — — (5) (6) (2) (1) — (15)
Transfers from work in progress — — — — — — — — (252) (252)
Balance at 30 June 2021 2,497 2,965 2,415 715 458 1,872 301 5 179 11,407
Accumulated depreciation
Balance at 1 July 2020 (729) (659) (2,048) (473) (275) (1,537) (64) (4) — (5,789)
Depreciation (114) (58) (63) (30) (18) (62) (15) — — (360)
Disposals 1 — — — 4 6 — — — 11
Balance at 30 June 2021 (842) (717) (2,111) (503) (289) (1,593) (79) (4) — (6,138)
Net carrying amount 1,655 2,248 304 212 169 279 222 1 179 5,269
30 June 2020
Fibre cables
$M
Ducts, manholes, and poles
$M
Copper cables
$MCabinets
$MProperty
$M
Network electronics
$M
Right of use assets
$MOther
$M
Work in progress
$MTotal
$M
Cost
Balance at 1 July 2019 2,044 2,498 2,394 661 420 1,778 275 5 215 10,290
Additions 231 256 15 32 17 56 13 — 248 868
Disposals — — — — (2) (23) — — — (25)
Transfers from work in progress — — — — — — — — (297) (297)
Other 1 — — — — — 4 — — 5
Balance at 30 June 2020 2,276 2,754 2,409 693 435 1,811 292 5 166 10,841
Accumulated depreciation
Balance at 1 July 2019 (627) (605) (1,988) (436) (262) (1,497) (50) (2) — (5,467)
Depreciation (103) (54) (60) (37) (15) (62) (14) (1) — (346)
Disposals — — — — 2 22 — — — 24
Other 1 — — — — — — (1) — —
Balance at 30 June 2020 (729) (659) (2,048) (473) (275) (1,537) (64) (4) — (5,789)
Net carrying amount 1,547 2,095 361 220 160 274 228 1 166 5,052
There are no restrictions on Chorus’ network assets or any network assets pledged as securities for liabilities. At 30 June 2021 the
contractual commitments for acquisition and construction of the network assets was $119 million (30 June 2020: $196 million).
Note 1 – Network assets (cont.)

Annual Report 2021 37
Crown funding
Chorus receives funding from the Crown to finance the capital
expenditure associated with the development of the UFB network
and other services. Where funding is used to construct assets, it is
offset against depreciation over the life of the assets constructed.
Refer to note 7 for information on Crown funding.
Impairment
The carrying amounts of non-financial assets including network
assets, software and other intangibles and customer retention
assets are reviewed at the end of each reporting period for any
indicators of impairment.
If any such indication exists, the recoverable amount of the
asset is estimated. An impairment loss is recognised in earnings
whenever the carrying amount of an asset exceeds its estimated
recoverable amount. Should the conditions that gave rise to the
impairment loss no longer exist, and the assets are no longer
considered to be impaired, a reversal of an impairment loss
would be recognised immediately in earnings. In the period to
30 June 2021, there was no impairment in relation to the costs
capitalised (30 June 2020: no impairment).
The recoverable amount is the greater of an assets value in use
and fair value less costs to sell. Chorus’ assets do not generate
independent cash flows and are therefore assessed from a single
cash-generating unit perspective. In assessing the recoverable
amount, the estimates of future cash flows are discounted to
their net present value using a discount rate that reflects current
market assessments of the time value of money and the risks
specific to the business.
Capitalised interest
Finance costs are capitalised on qualifying items of network
assets and software assets at an annualised rate of 4.25%
(30 June 2020: 5.8%). Interest is capitalised over the period
required to complete the assets and prepare them for their
intended use. In the current year finance costs totalling
$2 million (30 June 2020: $3 million) have been capitalised
against network assets and software assets.
Right of use assets
Fibre cables$M
Ducts, manholes, and poles
$MProperty
$MTotal
$M
Balance 1 July 2019 (net) 9 34 182 225
Additions — 10 7 17
Depreciation charge — (2) (12) (14)
Balance at 30 June 2020 9 42 177 228
Additions — 9 2 11
Relinquishments — — (2) (2)
Depreciation charge (1) (4) (10) (15)
Balance at 30 June 2021 8 47 167 222
Right of use assets are the present value of leases held by Chorus as a lessee, as defined in the accounting policies. Leases are
capitalised at the present value of the minimum lease payments at inception of the lease.
Chorus has applied a single discount rate to a portfolio of leases across the two main portfolios of leases (‘Property’ and ‘Ducts,
manholes, and poles’) due to the long term usage nature of the underlying assets used to service the same network. This is reflective
of the longer term nature of infrastructure assets. The nature of these assets are similar enough that borrowing rates on commercial
debt would not change asset to asset. The incremental borrowing rate is reviewed annually.
Property exchanges
Chorus has leased exchange space and commercial co-location space owned by Spark which is subject to lease arrangements
(included within right of use assets). Chorus in turn leases exchange space and commercial co-location space owned by Chorus to
Spark under an operating lease arrangement.
Note 1 – Network assets (cont.)

Annual Report 202138
Note 2 – Software and other intangible assetsSoftware and other intangible assets are initially measured
at cost. The direct costs associated with the development of
network and business software for internal use are capitalised
where project success is probable and the capitalisation
criteria is met. Following initial recognition, software and
other intangible assets are stated at cost less accumulated
amortisation and impairment losses. Software and other
intangible assets with a finite life are amortised from the date the
asset is ready for use on a straight-line basis over its estimated
useful life which is as follows:
Software 2-10 years
Other intangibles 6-35 years
Other intangibles mainly consist of land easements.
Where estimated useful lives or recoverable values have
diminished due to technological change or market conditions,
amortisation is accelerated.
There are no restrictions on software and other intangible assets,
or any intangible assets pledged as securities for liabilities.
30 June 2021Software
$MOther intangibles
$MWork in progress
$MTotal
$M
Cost
Balance at 1 July 2020 788 6 42 836
Additions 85 — 65 150
Transfers from work in progress — — (85) (85)
Balance at 30 June 2021 873 6 22 901
Accumulated amortisation
Balance at 1 July 2020 (676) (1) — (677)
Amortisation (60) — — (60)
Balance at 30 June 2021 (736) (1) — (737)
Net carrying amount 137 5 22 164
30 June 2020Software
$MOther intangibles
$MWork in progress
$MTotal
$M
Cost
Balance at 1 July 2019 752 6 23 781
Additions 52 — 69 121
Disposals (16) — — (16)
Transfers from work in progress — — (50) (50)
Balance at 30 June 2020 788 6 42 836
Accumulated amortisation
Balance at 1 July 2019 (643) (1) — (644)
Amortisation (49) — — (49)
Disposals 16 — — 16
Balance at 30 June 2020 (676) (1) — (677)
Net carrying amount 112 5 42 159
At 30 June 2021 the contractual commitment for acquisition of software and other intangible assets was $4 million (30 June 2020:
$8 million).

Annual Report 2021 39
Note 3 – Customer retention assetsCustomer retention costs are incremental costs incurred in
acquiring new contracts with new and existing customers
that Chorus expects are recoverable and are capitalised
as customer retention assets. Following initial recognition,
customer retention assets are stated at cost less accumulated
amortisation and impairment losses. Customer retention
assets have a finite life and are amortised from the month that
costs are capitalised on a straight-line basis over the average
connection life which is as follows:
New connections and migrations 0-4 years
Customer incentives 1 year
New connections and migrations
$M
Customerincentives
$MTotal
$M
Balance at 1 July 2019 (net carrying amount) 57 4 61
Additions 31 4 35
Amortisation (34) (6) (40)
Balance at 30 June 2020 (net carrying amount) 54 2 56
Additions 37 4 41
Amortisation (34) (4) (38)
Balance at 30 June 2021 (net carrying amount) 57 2 59
Amortisation of customer retention assets
Customer retention assets are amortised to the Income statement, either as amortisation expense or operating revenue, based on
the nature of the specific costs capitalised.
2021$M
2020$M
Amortised to amortisation expense 34 34
Amortised to operating revenue 4 6
Total customer retention assets amortisation 38 40

Annual Report 202140
Note 4 – DebtDebt is classified as non-current liabilities except for those with
maturities less than 12 months from the reporting date, which
are classified as current liabilities.
Debt is initially measured at fair value, less any transaction costs
that are directly attributable to the issue of the instruments.
Debt is subsequently measured at amortised cost using the
effective interest method. Some borrowings are designated in
fair value hedge relationships, which means that any change in
market interest and foreign exchange rates result in a change in
the fair value adjustment on that debt.
The weighted effective interest rate on debt including the effect
of derivative financial instruments and facility fees was 4.16%
(30 June 2020: 5.16%).
Due date2021
$M2020
$M
Syndicated bank facilities Aug 2021 140 30
Euro medium term notes EUR Oct 2023 858 883
Euro medium term notes EUR Dec 2026 511 527
Fixed rate NZD Bonds May 2021 — 400
Fixed rate NZD Bonds Dec 2027 200 —
Fixed rate NZD Bonds Dec 2028 500 500
Fixed rate NZD Bonds Dec 2030 182 —
Less: facility fees (18) (18)
Total Debt 2,373 2,322
Current 140 430
Non-current 2,233 1,892
Syndicated bank facilities
As at 30 June 2021 Chorus had a $350 million committed
syndicated facility on market standard terms and conditions
(30 June 2020: $550 million). The facility is held with banks that
are rated A to AA-, based on Standard & Poor’s ratings.
During the period, $200 million of facilities were terminated, and
the remaining $350 million of facilities were consolidated into
a single tranche and extended to April 2024. At 30 June 2021
$140 million of this facility was drawn down.
Euro Medium Term Notes (EMTN)
Face value Interest rate2021
$M2020
$M
EUR 500 million 1.13% 858 883
EUR 300 million 0.88% 511 527
Chorus has in place cross currency interest rate swaps to hedge
the foreign currency exposure to the EMTN. The cross currency
interest rate swaps entitle Chorus to receive EUR principal and
EUR fixed coupon payments for NZD principal and NZD floating
interest payments. The EUR cross currency interest rate swaps
are partially hedged for the NZD interest payments using interest
rate swaps (notional amount EUR 800 million).
The EUR 500 EMTN cross currency interest rate swaps are
partially hedged for the NZD interest payments using interest
rate swaps (notional amount EUR 500 million). The EUR 300
cross currency interest rate swaps are fully hedged for the NZD
interest payments using interest rates swaps (notional amount
EUR 300 million).
The following table reconciles EMTN at hedged rates to EMTN
carrying value based on spot rates as reported under NZ IFRS.
EMTN at hedged rates is a non-GAAP measure and is not defined
by NZ IFRS:
2021EUR 300
$M
2020EUR 300
$M
2021EUR 500
$M
2020EUR 500
$M
EMTN (at carrying value) 511 527 858 883
Impact of fair value hedge (2) (5) (9) (12)
Impact of hedged rates used 5 (8) (64) (86)
EMTN at hedged rates 514 514 785 785
The fair value of EMTN’s is calculated based on the present value of future principal and interest cash flows, discounted at market
interest rates at balance date and is determined using Level 2 of the fair value hierarchy as described in Note 20. At balance date the
fair value of the EURO 500 million EMTN was $878 million (30 June 2020: $881 million) compared to a carrying value of $858 million
(30 June 2020: $883 million) and the fair value of the EUR 300 million EMTN is $526 million (30 June 2020: $539 million) compared
to a carrying value of $511 million (30 June 2020: $527 million).

Annual Report 2021 41
Fixed rate NZD Bonds
Due date Interest rate2021
$M2020
$M
Fixed rate NZD Bonds May 2021 4.12% — 400
Fixed rate NZD Bonds Dec 2027 1.98% 200 —
Fixed rate NZD Bonds Dec 2028 4.35% 500 500
Fixed rate NZD Bonds Dec 2030 2.51% 182 —
Total fixed rate NZD Bonds 882 900
On 2 December 2020 Chorus issued $400 million NZD Bonds
in two tranches, at fixed interest rates for 7 years and 10 years
of 1.98% and 2.51% respectively. The bonds will mature in
December 2027 and December 2030. The fixed rate on the 2030
tranche has been swapped to a floating rate using interest rate
swaps (see note 19) creating a fair value hedge which has a fair
value of $182 million (notional amount $200 million) at balance
date. This hedging relationship was entered to comply with
Chorus Treasury Policy which does not allow for greater than
70% of term debt to be subject to fixed interest rates beyond a
3-year time period.
The 2021 NZD Bonds were repaid and settled on 6 May 2021.
At 30 June 2021, Chorus had $900 million of unsecured,
unsubordinated debt securities (30 June 2020: $900 million).
Schedule of maturities
2021$M
2020$M
Current 140 430
Due one to two years — —
Due two to three years 858 —
Due three to four years — 883
Due four to five years — —
Due over five years 1,393 1,027
Total due 2,391 2,340
Less: facility fees (18) (18)
2,373 2,322
No debt has been secured against assets, however there are
financial covenants and event of default triggers, as defined
in the various debt agreements. During the current year
Chorus complied with the requirements set out in its financing
agreements (30 June 2020: complied).
Refer to note 20 for information on financial risk management.
Finance expense
2021$M
2020$M
Interest on syndicated bank facility 5 5
Interest on EMTN - GBP — 40
Interest on EMTN - EUR 47 44
Interest on fixed rate NZD bonds 43 40
Ineffective portion of changes in fair value of cash flow hedges (4) 3
Other interest expense 30 27
Capitalised interest (2) (3)
Total finance expense excluding CIP securities (notional) interest 119 156
CIP securities (notional) interest 34 29
Total finance expense 153 185
Other interest expense includes $20 million lease interest expense (30 June 2020: $21 million) and $7 million of amortisation arising
from the difference between fair value and proceeds realised from the swaps reset (30 June 2020: $5 million).
Note 4 – Debt (cont.)

Annual Report 202142
Note 5 – LeasesChorus is a lessee of certain network assets under lease
arrangements. For all leases Chorus recognises assets and
liabilities in the Statement of financial position, except those
determined to be short-term or low value. On inception of a new
lease, the lease payable is measured at the present value of the
remaining lease payments, discounted at Chorus’ incremental
borrowing rate at that date. Practical expedients within NZ IFRS 16:
Leases have been applied to allow a single discount rate to a
portfolio of leases with similar characteristics. Lease costs are
recognised through interest expense over the life of the lease.
The corresponding right of use asset incurs depreciation over
the estimated useful life of the asset.
Chorus’ discounted cash flows by category are summarised below:
Lease liabilities
2021$M
2020$M
Fibre cables 14 9
Ducts, manholes and poles 49 45
Property 201 212
Total Lease payable 264 266
Extension options
Most leases contain extension options exercisable by Chorus
up to one year before the end of the non-cancellable contract
period. Where practicable, Chorus seeks to include extension
options in new leases to provide operational flexibility.
The extension options held are exercisable only by Chorus and
not by the lessors. Chorus assesses at lease commencement
whether it is reasonably certain the extension options will be
exercised, and where it is reasonably certain, the extension
period has been included in the lease liability calculation.
Chorus reassesses whether it is reasonably certain to exercise
the options if there is a significant event or significant change in
circumstances within its control.
Chorus’ discounted cash flows by maturity are summarised below:
2021$M
2020$M
Maturity analysis - contractual discounted cash flows
Less than one year 10 9
Between one and five years 38 36
More than five years 216 221
Total lease payable 264 266
Current 10 9
Non-current 254 257
The amounts recognised in the income statement and the statement of cashflows relating to leases are summarised below:
2021$M
2020$M
Amounts recognised in Income statement:
Interest on lease payable 20 21
Amounts recognised in Statement of cash flows:
Principal payments (net) (8) (2)
Lease interest (net) (20) (21)
Other leases
Chorus also leases IT equipment with contract terms of one to three years. These leases are of low value. Chorus has elected not to
recognise right of use assets and lease liabilities for these leases.
The agreement for exchange and commercial co-location space leased by Spark ended during the period, and as a result no lease
receivable is recognised as at 30 June 2021 (30 June 2020: $3 million).

Annual Report 2021 43
Note 6 – Crown Infrastructure Partners (CIP) securities
Ultra-Fast Broadband (UFB)
Chorus receives Crown funding to finance construction costs
associated with the development of the UFB network. For the
first phase of the UFB network build (UFB1) Chorus received
funding at a rate of $1,118 for every premises passed (as certified
by CIP), in return Chorus issued CIP equity securities, CIP debt
securities and CIP warrants. UFB1 build was completed in
December 2019 to a total value of $924 million funding received.
Premises passed and tested by CIP under UFB1 totalled 827,000.
For the second phase of the UFB network build (UFB2 and
UFB2+), there are five different funding rates applied, at an
average rate of $1,828 for every premises passed (as certified by
CIP). In return for the CIP funding, CIP equity and debt securities
will be issued on very similar terms as UFB1 securities. Chorus
can elect the mix of securities to be issued (up to a maximum
of $306 million equity securities for UFB2). There are no CIP
warrants in relation to UFB2 and UFB2+ funding. The total
committed funding available for Chorus for the second phase is
expected to be $411 million. As at 30 June 2021, for UFB2 and
UFB2+ there have been 150,000 premises passed and tested by
CIP (30 June 2020: UFB2 and UFB2+ 83,000).
The CIP equity and debt securities are recognised initially
at fair value plus any directly attributable transaction costs.
Subsequently, they are measured at amortised cost using the
effective interest method. The fair value is derived by discounting
the equity securities and debt securities per premises passed by
the effective rate based on market rates. The difference between
funding received and the fair value of the securities is recognised
as Crown funding. Over time, the CIP debt and equity securities
increase to face value and the Crown funding is released against
depreciation and reduces to nil.
CIP equity securities
CIP equity securities are a class of non-interest bearing security
that carry no right to vote at meetings of holders of Chorus
ordinary shares but entitle the holder to a preferential right to
repayment on liquidation and additional rights that relate to
Chorus’ performance under its construction contract with CIP.
For UFB1 equity securities, dividends will become payable on a
portion of the CIP equity securities from 2025 onwards, with the
portion of CIP equity securities that attract dividends increasing
over time. For UFB2 and UFB2+ equity securities, dividends
will become payable from 2030 for securities issued prior to
30 June 2020. For all those issued after this date, dividends will
become payable from 2036.
CIP equity securities can be redeemed by Chorus at any time by
payment of the issue price or issue of new ordinary shares (at a
5% discount to the 20-day volume weighted average price) to
the holder. In limited circumstances CIP equity securities may be
converted by the holder into voting preference or ordinary shares.
The CIP equity securities are required to be disclosed as a liability
until the liability component of the compound instrument expires.
CIP debt securities
CIP debt securities are unsecured, non-interest bearing and
carry no voting rights at meetings of holders of Chorus ordinary
shares. Chorus is required to redeem the CIP debt securities
in tranches from 2025 (2030 for UFB2 and UFB2+) to 2036 by
repaying the face value to the holder.
The principal amount of CIP debt securities consists of a senior
portion and a subordinated portion. The senior portion ranks
equally with all other unsecured, unsubordinated creditors of
Chorus, and has the benefit of any negative pledge covenant
that may be contained in any of Chorus’ debt arrangements.
The subordinated portion ranks below all other Chorus
indebtedness but above ordinary shares of Chorus. The initial
value of the senior portion is the present value (using a discount
rate of 8.5%) of the sum repayable on the CIP debt securities, and
the initial subordinated portion will be the difference between
the issue price of the CIP debt security and the value of the
senior portion.
CIP warrants
For UFB 1 Chorus issued warrants to CIP for nil consideration
along with each tranche of CIP equity securities. Each CIP
warrant gives CIP the right, on a specified exercise date, to
purchase at a set strike price a Chorus share to be issued by
Chorus. The strike price for a CIP warrant is based on a total
shareholder return of 16% per annum on Chorus shares over the
period December 2011 to June 2036.
At 30 June 2021, Chorus had issued a total 14,678,063 warrants
which had a fair value and carrying value that approximated
zero (30 June 2020: 14,216,213 warrants issued). The number of
fibre connections made by 30 June 2021 impacts the number
of warrants that could be exercised. Because fibre connections
already exceed 20% before 30 June 2021, the number of
warrants that would be able to be exercised is 14,678,063
(30 June 2020: 14,216,213).

Annual Report 202144
At 30 June 2021, the component parts of debt and equity instruments including notional interest were:
2021 2020
CIP debt securities
$M
CIP equity securities
$M
Total CIP securities
$M
CIP debt securities
$M
CIP equity securities
$M
Total CIP securities
$M
Fair value on initial recognition
Balance at 1 July 176 184 360 154 129 283
Additional securities recognised at fair value — 50 50 22 55 77
Balance at 30 June 176 234 410 176 184 360
Accumulated notional interest
Balance at 1 July 49 52 101 36 36 72
Notional interest 14 20 34 13 16 29
Balance at 30 June 63 72 135 49 52 101
Total CIP securities 239 306 545 225 236 461
The fair value of CIP debt securities at balance date was
$296 million (30 June 2020: $287 million) compared to a
carrying value of $239 million (30 June 2020: $225 million).
The fair value of CIP equity securities at balance date was
$357 million (30 June 2020: $291 million) compared to a
carrying value of $306 million (30 June 2020: $236 million).
The fair value has been calculated using discount rates from
market rates at balance date.
Key assumptions in calculations on initial recognition
On initial recognition, a discount rate between 5.18% to 6.67%
(30 June 2020: 4.49% to 6.90%) was used for the CIP equity
securities to discount the expected cash flows, based on the
NZ swap curve. There were no debt securities issued during the
period (30 June 2020: 2.50% to 6.90%). The swap rates were
adjusted for Chorus specific credit spreads (based on market
observed credit spreads for debt issued with similar credit ratings
and tenure). The discount rate on the CIP equity securities is
capped at Chorus’ estimated cost of (ordinary) equity.
Note 7 – Crown fundingCrown funding is recognised at fair value where there is
reasonable assurance that the funding is receivable and all
attached conditions will be complied with. Crown funding is
then recognised in earnings as a reduction to depreciation
expense on a systematic basis over the useful life of the asset the
funding was used to construct.
2021 2020
UFB $M
WCSNB $M
RBI $M
Other $M
Total $M
UFB $M
RBI $MI
Other $M
Total $M
Fair value on initial recognition
Balance at 1 July 707 — 242 67 1,016 628 242 60 930
Additional funding recognised at fair value 73 24 — 6 103 79 — 7 86
Balance at 30 June 780 24 242 73 1,119 707 242 67 1,016
Accumulated amortisation of funding
Balance at 1 July (74) — (46) (15) (135) (56) (38) (14) (108)
Amortisation (18) — (8) (3) (29) (18) (8) (1) (27)
Balance at 30 June (92) — (54) (18) (164) (74) (46) (15) (135)
Total Crown funding 688 24 188 55 955 633 196 52 881
Current 27 26
Non-current 928 855
Note 6 – Crown Infrastructure Partners (CIP) securities (cont.)
Annual Report 2021 45
Ultra-Fast Broadband (UFB)
Chorus receives Crown funding to finance construction
costs associated with the development of the UFB network.
During the period Chorus has recognised funding for 67,000
premises where the premises was passed and tested by CIP as at
30 June 2021 under UFB 2 and UFB 2+ (30 June 2020: 112,000;
UFB1 65,000; UFB2 and UFB2+ 47,000).
This brings the total number of premises passed and tested by
CIP at 30 June 2021 to approximately 977,000 (30 June 2020:
910,000). The total number of premises passed (including those
that have not been tested by CIP) was approximately 989,000 at
30 June 2021 (30 June 2020: 917,000).
Continued recognition of the full amount of the Crown funding
is contingent on certain material performance targets being met
by Chorus. The most significant of these material performance
targets relate to compliance with certain specifications under
user acceptance testing by CIP. Performance targets to date
have been met.
West Coast Southland Network Build (WCSNB)
Chorus receives Crown funding to finance capital expenditure
associated with the development of the West Coast Southland
Network. Chorus is entitled to claim payment for costs relating
to deployment of rural cabinets, links, schools, hospitals, health
centres and mobile sites. One dollar of funding can be claimed
for each dollar of allowable costs incurred by Chorus, up to a
maximum funding limit agreed with CIP. Under phases 1 and 2 of
the WCSNB agreement, approximately $46 million of funding is
expected to be received.
Other
Chorus receives funding towards the cost of relocation of
communications equipment, school lead-ins and extending the
network coverage to rural areas.
Note 8 – Segmental reportingAn operating segment is a component of an entity that engages
in business activities from which it may earn revenues and incur
expenses and for which operating results are regularly reviewed
by the entity’s chief operating decision maker and for which
discrete financial information is available.
Chorus’ Chief Executive Officer (CEO) has been identified as the
chief operating decision maker for the purpose of segmental
reporting.
Chorus has determined that it operates in one segment
providing nationwide fixed line communications infrastructure.
The determination is based on the reports reviewed by the CEO
in assessing performance, allocating resources and making
strategic decisions.
All Chorus’ operations are provided in New Zealand, therefore no
geographic information is provided.
Three Chorus customers met the reporting threshold
of 10 percent of Chorus’ operating revenue in the year
to 30 June 2021. The total revenue for the year ended
30 June 2021 from these customers was $372 million
(30 June 2020: $409 million), $178 million (30 June 2020:
$195 million) and $120 million (30 June 2020: $117 million).
Note 9 – Operating revenueRevenue is measured based on the consideration specified in
a contract with a customer and excludes amounts collected
on behalf of third parties. Chorus recognises revenue when it
transfers control of a product or service to a customer.
Chorus services provided to customers Nature, performance obligation and timing of revenue
Fibre and copper connections Providing access to the Chorus fixed lines network to enable connections to the internet.
Chorus recognises revenue as it provides this service to its customers at a point in time.
Unbilled revenues from the billing cycle date to the end of each month are recognised as
revenue during the month the service is provided. Revenue is deferred in respect of the
portion of fixed monthly charges that have been billed in advance.
Value added network services Providing enhanced access to the Chorus fixed line network to enable internet access,
through backhaul and handover link services to connect across wider areas and to higher
quality levels. Recognition is the same as described for fibre and copper connections above.
Infrastructure Providing physical storage and site-sharing rental services for co-location of third party or
shared assets. This is billed and recognised on a monthly basis, based on a point in time.
Field services Providing services in the field to protect, strengthen, and increase the available network
– for example, installation services, wiring and consultation services. This is billed and
recognised as the service is provided over time. Revenue from installation of connections is
recognised upon completion of the connection.
Note 7 – Crown funding (cont.)

Annual Report 202146
Revenue by service
2021$M
2020$M
Fibre broadband 477 393
Copper based broadband 203 271
Copper based voice 68 82
Fibre premium 68 73
Field services 62 65
Value added network services 30 29
Infrastructure 27 24
Data services copper 9 16
Other 3 6
Total operating revenue 947 959
Note 10 – Operating expenses
2021$M
2020$M
Labour 74 80
Network maintenance 63 64
Information technology 48 47
Other network costs 29 29
Electricity 18 15
Rent and rates 12 13
Property maintenance 12 12
Provisioning 2 5
Insurance 4 3
Consultants 7 9
Regulatory levies 8 7
Other 21 27
Total operating expenses 298 311
Labour
Labour of $74 million (30 June 2020: $80 million) represents
employee costs which are not capitalised.
Pension contributions
Included in labour costs are payments to the New Zealand
Government Superannuation Fund of $299,000 (30 June 2020:
$335,000) and contributions to KiwiSaver of $3.0 million
(30 June 2020: $3.2 million). At 30 June 2021 there were
11 employees in New Zealand Government Superannuation Fund
(30 June 2020: 14 employees) and 740 employees in KiwiSaver
(30 June 2020: 752 employees). Chorus has no other obligations
to provide pension benefits in respect of employees.
Charitable and political donations
Other costs include charitable donations of $223,231 towards
digital inclusion and health initiatives (30 June 2020: Lifeline,
Women’s Refuge, KidsCan and Porirua E-Learning Trust of
$207,295). Chorus has not made any political donations
(30 June 2020: nil).
Note 9 – Operating revenue (cont.)

Annual Report 2021 47
Auditor remuneration
Included in other expenses are fees paid to auditors:
2021$000's
2020$000's
Audit and review of statutory financial statements 552 537
Regulatory audit and assurance work 459 298
Tax compliance services1 — 21
Other assurance services2 — 22
Other services3 10 10
Total other services 469 351
Total fees paid to the auditor 1,021 888
1. No tax compliance services were provided in the current period (30 June 2020: tax treatment of the interest rate swap restructure and other sundry tax assistance).
2. Relates to attendance at the Annual Shareholders Meeting and assurance relating to EMTN refresh comfort letters (30 June 2020: same services as current year).
3. Other services included preparation and presentation of hedge accounting training (30 June 2020: same services as current year).
Note 11 – Trade and other receivablesTrade and other receivables are initially recognised at the fair value of the amounts to be received, plus transaction costs (if any).
They are subsequently measured at amortised cost (using the effective interest method) less impairment losses.
2021$M
2020$M
Trade receivables 92 107
Other receivables 11 10
Prepayments 21 24
Trade and other receivables 124 141
Current 122 140
Non-current 2 1
Trade receivables are non-interest bearing and are generally on
terms of 20 working days or less.
Chorus maintains a provision for impairment losses when there
is objective evidence of its customers being unable to make
required payments and makes provision for doubtful debt
where debt is more than 60 days overdue. There have been no
significant individual impairment amounts recognised as an
expense. Trade receivables are net of allowances for disputed
balances with customers.
The ageing profile of trade receivables is as follows:
2021$M
2020$M
Not past due 86 91
Past due 1-30 days 6 16
92 107
Chorus has a concentrated customer base consisting
predominantly of a small number of retail service providers.
The concentrated customer base heightens the risk that a dispute
with a customer, or a customer’s failure to pay for services, will
have a material adverse effect on the collectability of receivables.
Any disputes arising that may affect the relationship between
the parties will be raised by relationship managers and follow a
dispute resolution process. Chorus has $6 million of accounts
receivable that are past due but not impaired (30 June 2020:
$16 million). The carrying value of trade and other receivables
approximates the fair value. The maximum credit exposure is
limited to the carrying value of trade and other receivables.
Note 10 – Operating expenses (cont.)

Annual Report 202148
Note 12 – Trade and other payablesTrade and other payables are initially recognised at fair value
less transaction costs (if any). They are subsequently measured
at amortised cost using the effective interest method. Trade and
other payables are non-interest bearing and are normally settled
within 30 day terms. The carrying value of trade and other
payables approximates their fair values.
2021$M
2020$M
Trade payables 68 82
Accruals 126 125
Personnel accruals 14 16
Revenue billed in advance 81 59
Trade and other payables 289 282
Current 278 279
Non-current 11 3
Note 13 – Commitments
Network infrastructure project agreement
Chorus is committed to deploying infrastructure for premises in
the UFB2 and UFB2+ candidate areas awarded to Chorus, to be
built according to annual build milestones and to be completed
no later than December 2022. In total it is expected that the
communal infrastructure for UFB2 and UFB2+ will pass an
estimated 223,000 premises. Chorus has estimated it will cost
$548 to $568 million to build the communal UFB2 and UFB2+
network by the end of 2022.
West Coast Southland Network Build (WCSNB) agreement
Chorus has signed a contract with CIP to deploy fibre in Milford
Sound and on the West Coast of the South Island. Chorus will
receive funding from CIP of up to $46 million in relation the
build.
Capital expenditure
Refer to note 1 and note 2 for details of capital expenditure
commitments.
Lease commitments
Refer to note 5 for details of lease commitments.
Note 14 – TaxationThis note provides an analysis of Chorus’ income tax expense and
shows which amounts are recognised in the Income statement,
Statement of other comprehensive income or directly in equity
and how income tax expense is affected by non-taxable items.
Income tax expense for the current year comprises current and
deferred tax. Income tax expense is recognised in the Income
statement, except to the extent it relates to items recognised
in the Statement of other comprehensive income or directly in
equity. In these cases, income tax expense is recognised in the
Statement of other comprehensive income or directly in equity.
Deferred tax is recognised in respect of temporary differences
between the carrying amounts of assets and liabilities for
financial reporting purposes and the amount used for taxation
purposes. The amount of the deferred tax is based on the
expected manner of realisation of the carrying amount of
assets and liabilities, using the tax rates enacted or substantially
enacted at reporting year end. A deferred tax asset is recognised
only to the extent it is probable it will be utilised.

Annual Report 2021 49
Income tax expense
2021$M
2020$M
Recognised in Income statement
Net earnings before tax 72 73
Tax at 28% 20 21
Tax effect of adjustments
Other non-taxable items 5 5
Reinstatement of depreciation on buildings — (5)
Tax expense recognised in Income statement 25 21
Comprising:
Current tax expense 1 1
Deferred tax expense 24 20
25 21
Recognised in other comprehensive income
Net movement in hedging related reserves 83 (39)
Tax at 28% 23 (11)
Tax expense/(benefit) recognised in other comprehensive income 23 (11)
Comprising:
Deferred tax expense/(benefit) 23 (11)
23 (11)
The movement in the deferred tax assets and liabilities is presented below.
Deferred tax receivable
Changes in fair value of hedging reserves
$MFinance leases
$MTotal
$M
Balance at 1 July 2019 33 68 101
Recognised in Income statement — 4 4
Recognised in other comprehensive income 11 — 11
Balance at 30 June 2020 44 72 116
Recognised in other comprehensive income (23) — (23)
Balance at 30 June 2021 21 72 93
Deferred tax payable
EMTN debt securities$M
Network, software, customer retention and other intangible assets
$MOther
$MTotal
$M
Balance at 1 July 2019 2 320 4 326
Recognised in Income statement (2) 18 8 24
Balance at 30 June 2020 — 338 12 350
Recognised in Income statement — 18 6 24
Balance at 30 June 2021 — 356 18 374
Imputation credits
There are $33 million (30 June 2020: $74 million) imputation credits available for subsequent reporting periods. Chorus has sufficient
imputation credits to fully impute the 2021 final dividend.
Note 14 – Taxation (cont.)

Annual Report 202150
Note 15 – Cash, call deposits, and cash overdraft Cash and call deposits are held with bank and financial
institution counterparties rated at a minimum of A, based on
rating agency Standard & Poor’s ratings.
There are no cash or call deposit balances held that are not
available for use.
The carrying values of cash and call deposits approximate
their fair values. The maximum credit exposure is limited to the
carrying value of cash and call deposits.
Cash and call deposits denominated in foreign currencies are
retranslated into New Zealand dollars at the spot rate of exchange
at the reporting date. All differences arising on settlement or
translation of monetary items are taken to the Income statement.
Chorus has a $10 million overdraft facility which is used in
normal course of operations.
Cash flow
Cash flows from derivatives in cash flow and fair value hedge
relationships are recognised in the Statement of cash flows in
the same category as the hedged item.
For the purposes of the Statement of cash flows, cash is
considered to be cash on hand, in banks and cash equivalents,
including bank overdrafts and highly liquid investments that are
readily convertible to known amounts of cash which are subject
to an insignificant risk of changes in values.
Note 16 – Equity
Share capital
Movements in Chorus Limited’s issued ordinary shares were as follows:
2021Number of shares
(millions)
2020Number of shares
(millions)
Balance 1 July 444 439
Dividend reinvestment plan 3 5
Balance at 30 June 447 444
Chorus Limited has 447,024,884 fully paid ordinary shares
(30 June 2020: 444,491,560). The issued shares have no par
value. The holders of ordinary shares are entitled to receive
dividends as declared from time to time and are entitled to
one vote per share at meetings of Chorus Limited. Under
Chorus Limited’s constitution, Crown approval is required if a
shareholder wishes to have a holding of 10% or more of Chorus
Limited’s ordinary shares, or if a shareholder who is not a
New Zealand national wishes to have a holding of 49.9% or more
of ordinary shares.
On 12 October 2020 and 13 April 2021, fully imputed dividends
of 14 cents per share and 10.5 cents per share respectively were
paid to shareholders. These two dividend payments totalled
$109 million (30 June 2020: 23.5 cents, $104 million).
In relation to the October 2020 dividend, eligible shareholders
(those resident in New Zealand or Australia) could choose to
have Chorus Limited reinvest all or part of their dividends in
additional Chorus Limited shares. 2,533,324 shares with a total
value of $23 million (30 June 2020: 5,203,406 shares across
both dividends, $28 million) were issued in lieu of the October
2020 dividend. The dividend reinvestment plan was not available
for the April 2021 dividend.
Chorus Limited issues securities to CIP based on the number
of premises passed. CIP securities are a class of security that
carry no right to vote at meetings of holders of Chorus Limited
ordinary shares but carry a preference on liquidation. Refer to
note 6 for additional information on CIP securities.
Should Chorus Limited return capital to shareholders, any return
of capital that arose on demerger may be taxable as Chorus
Limited had zero available subscribed capital on demerger.
Long-term performance share scheme
Chorus operates a long-term performance share scheme for
selected key management personnel. Under the legacy option
plan, selected key management personnel were issued shares.
This was superseded by a new long-term performance share
scheme in July 2019 under which key senior management are
issued share-rights instead of issuing shares. The existing grants
under the legacy share plan will continue until their vesting date.
Legacy share scheme
In August 2018, Chorus issued one three-year grant. The shares
have a vesting date of 27 August 2021 and an expiry date of
27 February 2022. The grant has an absolute performance hurdle
(Chorus’ actual total shareholder return equalling or being
greater than 10.4% per annum compounding) ending on the
vesting date, with provision for monthly retesting in the following
six month period.
The shares are held by a nominee (Chorus LTI Trustee Limited)
on behalf of the participants, until after the shares vest when the
nominee is directed to transfer or sell the shares. If the shares do
not vest, they may be held or sold by the nominee. The shares
carry the same rights as all other shares.
Participants have been provided with interest-free limited
recourse loans to fund the 101,480 shares purchased under the
LTI scheme (30 June 2020: 245,094 shares).

Annual Report 2021 51
New share scheme
In August 2019, Chorus issued a tranche of share rights
under the new scheme. The shares have a vesting date of
30 August 2022 and an expiry date of 30 August 2023. The grant
has an absolute performance hurdle (Chorus’ actual total
shareholder return equalling or being greater than 10.35% per
annum compounding) ending on the vesting date, with provision
for monthly retesting in the following twelve-month period.
In August 2020, Chorus issued a tranche of share rights
under the new scheme. The shares have a vesting date of
30 August 2023 and an expiry date of 30 August 2024. The grant
has an absolute performance hurdle (Chorus’ actual total
shareholder return equalling or being greater than 9.65% per
annum compounding) ending on the vesting date, with provision
for monthly retesting in the following twelve-month period.
The LTI scheme is an equity settled scheme and treated as an
option plan for accounting purposes. Each tranche of each grant
was valued separately. The absolute performance hurdle was
valued using Monte Carlo simulations.
The combined option cost for the year ended 30 June 2021
of $399,000 has been recognised in the Income statement
(30 June 2020: $392,000).
Reserves
Refer to note 19 for information on the cash flow hedge reserve
and cost of hedging reserve.
Note 17 – Earnings per shareThe calculation of basic earnings per share at 30 June 2021 is based on the net earnings for the year of $47 million (30 June 2020:
$52 million), and a weighted average number of ordinary shares outstanding during the period of 446 million (30 June 2020:
444 million), calculated as follows:
2021 2020
Basic earnings per share
Net earnings attributable to ordinary shareholders ($ millions) 47 52
Denominator - weighted average number of ordinary shares (millions) 446 444
Basic earnings per share (dollars) 0.11 0.12
Diluted earnings per share
Net earnings attributable to ordinary shareholders ($ millions) 47 52
Weighted average number of ordinary shares (millions) 446 444
Ordinary shares required to settle CIP equity securities (millions) 121 83
Ordinary shares required to settle CIP warrants (millions) 15 14
Denominator - diluted weighted average number of shares (millions) 582 541
Diluted earnings per share (dollars) 0.08 0.10
The number of ordinary shares that would have been required
to settle all CIP equity securities and CIP warrants on issue at 30
June has been used for the purposes of the diluted earnings per
share calculation.
Net tangible assets per security
Net tangible assets per security as at 30 June 2021 was $1.45
(30 June 2020: $1.39).
Note 18 – Related party transactions
Transactions with related parties
Key management personnel are defined as those persons
having authority and responsibility for planning, directing, and
controlling the activities of the Group, directly or indirectly, and
include the Directors, the Chief Executive, and his direct reports.
Certain key management personnel have interests in a number
of companies that Chorus has transactions within the normal
course of business.
Chorus has loans to employees and nominees receivable at
30 June 2021 of $0.4 million (30 June 2020: $0.9 million) as
outlined in the employee share plan section of note 16. All loans
outstanding are interest-free limited recourse loans.
Note 16 – Equity (cont.)

Annual Report 202152
Key management personnel compensation
2021$000's
2020$000's
Short term employee benefits 7,785 8,368
Termination benefits 595 —
Share based payments 468 392
8,848 8,760
This table includes gross remuneration of $1.1 million (30 June 2020: $1.1 million) paid to Directors and $7.7 million (30 June 2020:
$7.7 million) paid to key management personnel for the year.
Refer to note 16 for details of long-term incentives.
Note 19 – DerivativesChorus uses derivative financial instruments to reduce its
exposure to fluctuations in foreign currency exchange rates,
interest rates and the spot price of electricity. The use of hedging
instruments is governed by the Treasury Policy approved by the
Board. Derivatives are initially recognised at fair value on the
date a derivative contract is entered into and are subsequently
remeasured to fair value, with an adjustment made for credit risk in
accordance with NZ IFRS 9: Financial Instruments. The derivatives
are considered Level 2 investments as defined in Note 20.
Recognition of the resulting remeasurement gain or loss
depends on whether the derivative is designated as a hedging
instrument. If the derivative is not designated as a hedging
instrument, the remeasurement gain or loss is recognised
immediately in the Income statement.
Interest rate swaps
As at 30 June 2021 Chorus holds all interest rate swaps in
designated hedging relationships.
All interest rate swaps which are designated as cash flow hedges
are held in effective hedging relationships and their unrealised
gains or losses are recognised in the cash flow hedge reserve.
Chorus has also entered into two interest rate swaps which are
designated as fair value hedges. They have a combined face
value $200 million and were entered in conjunction with the
10 year NZD bonds issued on 2 December 2020. The intention of
these instruments is to swap the interest exposure from a fixed
to a floating rate to December 2030. This hedging relationship
was entered to comply with Chorus Treasury Policy which does
not allow for greater than 70% of term debt to be subject to fixed
interest rates beyond a 3 year time period.
Restructured interest rate swaps
Three interest rate swaps have been restructured: two in
December 2018 and one in February 2020.
The two December 2018 restructured interest rate swaps
have a combined face value of $500 million and were reset
in conjunction with the resettable NZD fixed rate bond issued
on 6 December 2018 to hedge interest rate exposure from
December 2023. As part of the restructure the original hedge
relationship was discontinued and on termination there was a
net present value of $14 million to be recognised in the cash flow
hedge reserve. This amount was held in the cash flow hedge
reserve as the hedged item still exists and is amortised over the
original hedge period (April 2020-April 2026). The unamortised
balance of the original fair values at 30 June 2021 is $11 million
(30 June 2020: $13 million).
The forward dated interest rate swap restructured in February 2020
had a face value of $200 million and was reset to be in conjunction
with the EUR 300 million EMTN issued on 5 December 2019,
to hedge interest rate exposure from April 2020. The original
hedge relationship was discontinued and on termination had
a net present value of $27 million. This amount was held in the
cash flow hedge reserve as the hedged item still exists and will
be amortised over the original hedge period (April 2020-April
2026). The unamortised balance of the original fair values at
30 June 2021 was $21 million (30 June 2020: $26 million).
Cross currency interest rate swaps
In conjunction with the EMTN EUR 500 million issued in October
2016 and the EMTN EUR 300 million issued in December 2019,
Chorus entered into cross currency interest rate swaps to hedge
the foreign currency and foreign interest rate risks on the EUR
EMTNs. The 2016 swaps have an aggregate principal of EUR
500 million on the receive leg and NZD 785 million on the pay
leg, and the 2019 swaps have an aggregate principal of EUR
300 million on the receive leg and NZD 514 million on the pay leg.
Using the cross-currency interest rate swaps, Chorus will pay New
Zealand Dollar floating interest rates and receive EUR nominated
fixed interest with coupon payments matching the underlying
notes. Chorus designated the EMTN and cross currency interest
rate swaps into three-part hedging relationships for each issue:
• a fair value hedge of EUR benchmark interest rates,
• a cash flow hedge of margin; and
• a cash flow hedge of the principal exchange.
Note 18 – Related party transactions (cont.)

Annual Report 2021 53
Hedge accounting
Chorus designates certain derivatives as either:
• Fair value hedges (of the fair value of recognised assets or
liabilities or firm commitments); or
• Cash flow hedges (of highly probable forecast transactions).
At inception each hedge relationship is formalised in NZ IFRS 9
compliant hedge documentation.
Chorus has a 1:1 hedge ratio and sources of ineffectiveness are
generally driven by credit value adjustments of derivatives.
Cash flow hedges
For cash flow hedges the effective part of the changes in fair value
of the hedging derivative are deferred in Other comprehensive
income and are transferred to the Income statement when the
hedged item affects the Income statement. Any gain or loss
relating to the ineffective portion of the hedging instrument in cash
flow hedge relationships are recognised in the Income statement.
Hedge accounting is discontinued when the hedge instrument
expires or is sold, terminated, exercised, or no longer qualifies for
hedge accounting.
Once hedging is discontinued, any cumulative gain or loss
previously recognised in Other comprehensive income is
recognised in the Income statement either:
• at the same time as the forecast transaction; or
• immediately if the transaction is no longer expected to occur.
Cash flow hedge reserve
The cash flow hedge reserve comprises the effective portion of
the cumulative net change in the fair value of cash flow hedging
instruments related to hedged transactions that have not yet
affected the Income statement.
For cash flow hedges, the effective portion of gains or losses
from remeasuring the fair value of the hedging instrument is
recognised in Other comprehensive income and accumulated
in the cash flow hedge reserve. Accumulated gains or losses are
subsequently transferred to the Income statement when the
hedged item affects the Income statement, or when the hedged
item is a forecast transaction that is no longer expected to occur.
Alternatively, when the hedged item results in a non-financial
asset or liability, the accumulated gains and losses are included
in the initial measurement of the cost of the asset or liability.
As long as the existing cash flow hedge relationships remain
effective, any future gains or losses will be processed through
the hedge equity reserves. Minor differences in the hedged
values will flow to finance expense in the income statement over
the life of the derivatives as ineffectiveness. Neither the direction,
nor the rate of the impact on the income statement can be
predicted as it is influenced by external market factors. In the
current year, ineffectiveness was credit $4 million (30 June 2020:
debit $3 million) across the hedge relationships (refer to note 4).
A reconciliation of movements in the cash flow hedge reserve:
2021$M
2020$M
Balance at 1 July 105 74
Changes in cash flow hedges (86) 39
Amortisation of de-designated cash flow hedges transferred to Income statement (7) 4
Tax expense/(benefit) 26 (12)
Closing balance at 30 June 38 105
Fair value hedges
Under a fair value hedge, the hedged item is revalued at fair
value in respect of the hedged risk. This revaluation is recognised
in the Income statement to offset the mark-to-market
revaluation of the hedging derivative, except for any adjustment
on the hedging derivative relating to credit risk.
Once hedging is discontinued, the fair value adjustment to the
carrying amount of the hedged item arising from the hedged
risk is amortised through the Income statement from that date
through to maturity of the hedged item. If the hedged item is
derecognised any corresponding fair value hedge adjustment is
immediately recognised in the Income statement.
To hedge the interest rate risk and foreign currency risk on the
EUR EMTN, Chorus uses cross currency interest rate swaps.
For hedge accounting purposes, these swaps were aggregated
and designated as two cash flow hedges and a fair value hedge.
Chorus hedges a portion of the EUR EMTN for Euro fixed rate
interest to Euro floating rate interest via a fair value hedge. In this
case, the change in the fair value of the hedged risk is also
attributed to the carrying value of the EMTN (refer to note 4).
Cost of hedging reserve
The cost of hedging reserve captures changes in the fair value
of the cost to convert foreign currency to NZD of Chorus’ cross
currency interest rate swaps on the EUR EMTN.
A reconciliation of movements in the cost of hedging reserve:
2021$M
2020$M
Balance at 1 July 6 9
Change in currency basis spreads (when excluded from the designation) 10 (4)
Tax (benefit)/expense (3) 1
Closing balance at 30 June 13 6
Note 19 – Derivatives (cont.)

Annual Report 202154
Hedging instruments used (pre-tax):
Life to date values as at 30 June 2021Year to date values recognised during the year ended
30 June 2021
Carrying amount of the hedging instrumentHedge effectiveness in
reservesHedge
effectivenessHedge
ineffectiveness
CurrencyMaturity
yearsAverage
rate
Nominal amount of
the hedging instrument
$MAssets
$MLiabilities
$M
Change in value used for
calculating hedge
effectiveness$M
Cost of hedging reserve
$M
Cash flow hedge (OCI)
$M
Cash flow hedge
reclassified to the
Income statement
$M
Fair value hedge
recognised in the Income
statement$M
Recognised in the Income
statement$M
Cash flow hedges
Interest rate swaps
(including forward
starting)
NZD 3-8 1.50% 864 12 — 12 — 41 — — —
Restructured
interest rate swaps
2018 (forward
starting)
NZD 8 4.41% 500 — (53) (37) — 32 — — (2)
Restructured
interest rate swap
2020
NZD 6 3.35% 200 — (20) 8 — 15 — — 5
Forward exchange
rate contractsNZD:USD 1-2 0.6903 52 — (1) (1) — (1) (1) — —
Forward exchange
rate contractsNZD:SEK 1-2 5.9298 43 — — — — — — — —
Electricity futures NZD 1-3 NA NA 5 — 6 — 6 (1) — —
Fair value hedges
Interest rate swaps NZD 9 Floating 200 — (18) (18) — — — (18) 1
Fair value and cash flow hedges
Cross currency
interest rate swapsNZD:EUR 3 Floating 785 58 — 71 (13) (20) 21 4 —
Cross currency
interest rate swapsNZD:EUR 6 Floating 514 — (15) (10) (6) (12) 13 4 —
Total hedged derivatives 3,158 75 (107) 31 (19) 61 32 (10) 4
Current — 4 (1) — —
Non-current — 71 (106) — —
Note 19 – Derivatives (cont.)

Annual Report 2021 55
Life to date values as at 30 June 2020Year to date values recognised during the year ended
30 June 2020
Carrying amount of the hedging instrumentHedge effectiveness in
reservesHedge
effectivenessHedge
ineffectiveness
CurrencyMaturity
yearsAverage
rate
Nominal amount of
the hedging instrument
$MAssets
$MLiabilities
$M
Change in value used for
calculating hedge
effectiveness$M
Cost of hedging reserve
$M
Cash flow hedge (OCI)
$M
Cash flow hedge
reclassified to the
Income statement
$M
Fair value hedge
recognised in the Income
statement$M
Recognised in the Income
statement$M
Cash flow hedges
Cross currency
interest rate swapsNZD:GBP 0 Floating — — — — — 178 (186) — (2)
Interest rate swaps NZD 0 4.89% — — — — — 18 — — —
Interest rate swaps
(including forward
starting)
NZD 4-9 1.93% 600 — (31) (31) — 12 — — —
Restructured
interest rate swaps
2018 (forward
starting)
NZD 9 4.41% 500 — (81) (65) — (31) — — —
Restructured
interest rate swap
2020
NZD 7 3.35% 200 — (36) (8) — (34) — — —
Forward exchange
rate contractsNZD:USD 1-2 0.6586 22 1 — 1 — 1 (1) — —
Forward exchange
rate contractsNZD:SEK 1 6.0168 34 — — — — — — — —
Electricity futures NZD 1-3 NA NA 1 — 1 — 1 (1) — —
Fair value and cash flow hedges
Cross currency
interest rate swapsNZD:EUR 4 Floating 785 85 — 95 (11) 27 (24) (1) —
Cross currency
interest rate swapsNZD:EUR 7 Floating 514 8 — 6 2 5 (8) (6) (1)
Total hedged derivatives 2,655 95 (148) (1) (9) 177 (220) (7) (3)
Current — 2 — — —
Non-current — 93 (148) — —
All hedging instruments can be found in the derivative finance
assets and liabilities, in the Statement of financial position. Items
taken to the Income statement have been recognised in finance
expenses (refer note 4).
Credit risk associated with derivative financial instruments
is managed by ensuring that transactions are executed with
counterparties with high quality credit ratings along with credit
exposure limits for different credit classes. The counterparty credit
risk is monitored and reviewed by the Board on a regular basis.
Note 19 – Derivatives (cont.)

Annual Report 202156
Note 20 – Financial risk managementChorus’ financial instruments consist of cash, short-term
deposits, trade and other receivables (excluding prepayments),
investments and advances, trade payables and certain other
payables, syndicated bank facilities, EMTN, fixed rate NZD bonds,
derivative financial instruments and CIP securities. Financial
risk management for currency and interest rate risk is carried
out by the treasury function under policies approved by the
Board. Chorus’ risk management policy, approved by the Board,
provides the basis for overall financial risk management.
Chorus does not hold or issue derivative financial instruments
for trading purposes. All contracts have been entered into with
creditworthy financial institutions. The risk associated with these
transactions is the cost of replacing these agreements at the
current market rates in the event of default by a counterparty.
Currency risk
Chorus’ exposure to foreign currency fluctuations predominantly
arises from the foreign currency debt and future commitments
to purchase foreign currency denominated assets. The primary
objective in managing foreign currency risk is to protect against
the risk that Chorus’ assets, liabilities and financial performance
will fluctuate due to changes in foreign currency exchange rates.
Chorus enters into foreign exchange contracts and cross currency
interest rate swaps to manage the foreign exchange exposure.
Chorus has EUR 800 million foreign currency debt in the form of
EMTN. The EUR EMTN has in place cross currency interest rate
swaps under which Chorus receives EUR 800 million principal
and EUR fixed coupon payments for $1,299 million principal
and floating NZD interest payments. The exchange gain or
loss resulting from the translation of EMTN denominated in
foreign currency to NZD is recognised in the Income statement.
The movement is offset by the translation of the principal value
of the related cross currency interest rate swap.
As at 30 June 2021, Chorus did not have any significant
unhedged exposure to currency risk (30 June 2020: no
significant unhedged exposure to currency risk). A 10% increase
or decrease in the exchange rate, with all other variables held
constant, would have minimal impact on profit and equity
reserves of Chorus.
Electricity price risk
In the normal course of business, Chorus is exposed to a variety
of financial risks which include the volatility in electricity prices.
Chorus has entered into electricity swap contracts to reduce
the exposure to electricity spot price movements. Chorus
has designated the electricity contracts as cash flow hedge
relationships.
A 10% increase or decrease in the spot price of electricity, with
all other variables held constant, would have minimal impact on
profit and equity reserves of Chorus.
Interest rate risk
Chorus has interest rate risk arising from the cross currency
interest rate swap converting the foreign debt into a floating
rate NZD obligation as well as loans under the syndicated bank
facility which are subject to floating interest rates, and the fixed
to floating interest rate swaps which hedge the 2030 NZD Bond.
Where appropriate, Chorus aims to reduce the uncertainty of
changes in interest rates by entering into interest rate swaps to
fix the effective interest rate to minimise the cost of net debt
and manage the impact of interest rate volatility on earnings.
The interest rate risk on a portion of the EUR cross currency
interest rate swaps has been hedged using interest rate swaps.
Interest rate repricing analysis
30 June 2021Within 1 Year
$M1-2 Years
$M2-3 Years
$M3-4 Years
$M4-5 Years
$M
Greater than 5 years
$MTotal
$M
Floating rate
Debt (after hedging) 635 — — — — — 635
Fixed rate
Debt (after hedging) 140 — 350 — — 1,214 1,704
CIP securities — — — — 132 413 545
775 — 350 — 132 1,627 2,884
30 June 2020
Floating rate
Cash and deposits 5 — — — — — 5
Debt (after hedging) 599 — — — — — 599
Fixed rate
Debt (after hedging) 430 — — 350 — 850 1,630
CIP securities — — — — — 461 461
1,034 — — 350 — 1,311 2,695

Annual Report 2021 57
Sensitivity Analysis
A change of 100 basis points in interest rates with all other variables held constant, would increase or decrease equity (after hedging)
and earnings after tax by the amounts shown below:
2021$M
Profit / (loss)
2021$M
Equity (increase) / decrease
2020$M
Profit / (loss)
2020$M
Equity (increase) / decrease
100 basis point increase 1 (4) 3 (4)
100 basis point decrease (1) 5 (3) 6
Credit risk
In the normal course of business, Chorus incurs counterparty
credit risk from financial instruments, including cash, trade
and other receivables, finance lease receivables and derivative
financial instruments.
Chorus has certain derivative transactions that are subject to
bilateral credit support agreements that require Chorus or the
counterparty to post collateral to support the value of certain
derivatives. As at 30 June 2021 no collateral was posted.
The maximum exposure to credit risk at the reporting date was
as follows:
Notes2021
$M2020
$M
Cash and call deposits 15 53 —
Trade and other receivables 11 103 117
Derivative financial instruments 19 75 95
Lease receivable 5 — 3
Maximum exposure to credit risk 231 215
Refer to individual notes for additional information on credit risk.
Chorus enters into derivative transactions under the International
Swaps and Derivatives Association (ISDA) master agreements.
The ISDA agreements do not meet the criteria for offsetting in
the Statement of financial position, as Chorus does not currently
have any legally enforceable right to offset recognised amounts.
Under the ISDA agreements the right to offset is enforceable
only on the occurrence of future events such as a default on the
bank loans or other credit events. The potential net impact of
this offsetting is shown below. Chorus does not hold, and is not
required to post, collateral against its derivative positions.
Net derivatives after applying rights of offset under ISDA agreements:
30 June 2021
Gross amounts of financial instruments in the statement of financial position
$M
Related financial instruments that are not offset
$MNet amount
$M
Financial assets
Other investments including derivatives
Interest rates swaps 12 (12) —
Electricity futures 5 — 5
Cross currency interest rate swaps 58 (15) 43
75 (27) 48
Financial liabilities
Interest rates swaps (18) 12 (6)
Cross currency interest rate swaps (15) 15 —
Restructured interest rate swaps (73) — (73)
Forward exchange contracts (1) — (1)
(107) 27 (80)
30 June 2020
Financial assets
Other investments including derivatives
Electricity futures 1 1
Cross currency interest rate swaps 93 — 93
Forward exchange contracts 1 — 1
95 — 95
Financial liabilities
Interest rates swaps (31) — (31)
Restructured interest rate swaps (117) — (117)
(148) — (148)
Note 20 – Financial risk management (cont.)

Annual Report 202158
Liquidity risk
Liquidity risk is the risk that Chorus will encounter difficulty raising
liquid funds to meet commitments as they fall due or foregoing
investment opportunities, resulting in defaults or excessive debt
costs. Prudent liquidity risk management implies maintaining
sufficient cash and the ability to meet its financial obligations.
Chorus’ exposure to liquidity risk based on contractual cash flows
relating to financial liabilities is summarised below:
30 June 2021
Carrying amount
$M
Contractual cashflow
$M
Within 1 Year
$M1-2 Years
$M2-3 Years
$M3-4 Years
$M4-5 Years
$M5+ Years
$M
Non-derivative financial liabilities
Trade and other payables 289 289 278 11 — — — —
Leases (net settled) 264 429 17 17 17 17 17 344
Debt 2,373 2,707 189 47 896 38 38 1,499
CIP securities 545 545 — — — — 132 413
Derivative financial liabilities
Interest rate swaps 79 89 13 10 12 12 10 32
Cross currency interest rate swaps:
Inflows 58 (1,502) (14) (14) (893) (5) (5) (571)
Outflows 15 1,450 33 40 815 18 20 524
Forward exchange contracts:
Inflows 1 (84) (59) (25) — — — —
Outflows — 86 61 25 — — — —
30 June 2020
Carrying amount
$M
Contractual cashflow
$M
Within 1 Year
$M1-2 Years
$M2-3 Years
$M3-4 Years
$M4-5 Years
$M5+ Years
$M
Non derivative financial liabilities
Trade and other payables 282 282 279 3 — — — —
Leases (net settled) 266 442 14 17 17 16 17 361
Debt 2,322 2,610 487 40 40 911 31 1,101
CIP securities 461 461 — — — — — 461
Derivative financial liabilities
Interest rate swaps 148 157 16 16 16 21 25 63
Cross currency interest rate swaps:
Inflows 93 (1,464) (14) (14) (14) (885) (5) (532)
Outflows — 1,444 31 29 30 806 13 535
Forward exchange contracts:
Inflows 1 (45) (24) (21) — — — —
Outflows — 44 23 21 — — — —
The gross (inflows)/outflows of derivative financial liabilities
disclosed in the table represent the contractual undiscounted
cash flows relating to derivative financial liabilities held for risk
management purposes and which are usually not closed out
prior to contractual maturity. The disclosure shows net cash
flow amounts for derivatives that are net cash settled and
gross cash inflow and outflow amounts for derivatives that
have simultaneous gross cash settlement (for example forward
exchange contracts).
Chorus manages liquidity risk by ensuring sufficient access
to committed facilities, continuous cash flow monitoring and
maintaining prudent levels of short-term debt maturities.
At balance date, Chorus had available $350 million under
the syndicated bank facilities (30 June 2020: $550 million).
$140 million of the facilities have been drawn down as at
30 June 2021 (30 June 2020: $30 million).
Capital risk management
Chorus manages its capital considering shareholders’ interests,
the value of its assets and credit ratings. The capital Chorus
manages consists of cash and debt balances.
The Chorus Board’s broader capital management objectives
include maintaining an investment grade credit rating with
headroom. In the longer term, the Board continues to consider a
‘BBB’ rating appropriate for a business such as Chorus.
Hedge accounting
Chorus designates and documents the relationship between
hedging instruments and hedged items, as well as the risk
management objective and strategy for undertaking various
hedge transactions. At hedge inception (and on an ongoing
basis), hedges are assessed to establish if they are effective in
offsetting changes in fair values or cash flows of hedged items.
Note 20 – Financial risk management (cont.)

Annual Report 2021 59
Hedges are classified into two primary types: cash flow hedges
and fair value hedges. Refer to note 19 for additional information
on cash flow and fair value hedge reserves.
Fair value
Financial instruments are either carried at amortised cost, less
any provision for impairment losses, or fair value. The only
significant variances between instruments held at amortised cost
and their fair value relate to the EMTN.
For those instruments recognised at fair value in the statement
of financial position, fair values are determined as follows:
Level 1: Quoted market prices – financial instruments with
quoted prices for identical instruments in active markets.
Level 2: Valuation techniques using observable inputs – financial
instruments with quoted prices for similar instruments
in active markets or quoted prices for identical or similar
instruments in inactive markets. Where quoted prices
are not available, the fair value of financial instruments
is valued using models where all significant inputs are
observable.
Level 3: Valuation techniques with significant non-observable
inputs – financial instruments valued using models
where one or more significant inputs are not observable.
The relevant financial assets and financial liabilities and their
respective fair values are outlined in note 19 and are all Level 2
(30 June 2020: Level 2).
Cross currency interest rate swaps, interest rate swaps and
forward-dated interest rate swaps
Fair value is estimated by using a valuation model involving
discounted future cash flows of the derivative using the
applicable forward price curve (for the relevant interest rate and
foreign exchange rate) and discount rate.
Electricity swaps
Fair value is estimated on the ASX forward price curve that relates
to the derivative.
Note 21 – Contingent liabilitiesThere are no contingent liabilities as at 30 June 2021.
Note 22 – Subsequent events
Dividends
On 23 August 2021 Chorus declared a dividend in respect of year ended 30 June 2021. The total amount of the dividend is
$65 million, which represents a fully imputed dividend of 14.5 cents per ordinary share.
CIP securities and Crown funding
There were 4 call notices issued subsequent to balance date.
Note 20 – Financial risk management (cont.)

Annual Report 202160

Annual Report 2021 61
Governance and disclosures
62 Our Board
64 Corporate governance framework
71 Managing risk
74 Acting ethically
75 Shareholder engagement
76 Remuneration and performance
83 Disclosures
92 Glossary

Annual Report 202162
Our Board
Sue Bailey Graduate Diploma in Marketing (with Distinction) from RMIT University
Director since 31 October 2019 Independent
Sue has over 30 years experience in telecommunications, across fixed telephony, mobile and broadband. She has worked for Telstra, Virgin Mobile and most recently for Optus where she was a member of the executive leadership team.
From 2010 to 2013, Sue was the CEO for Virgin Mobile Australia, a fully owned subsidiary of Optus. Prior to that, she was a Senior Vice President at Virgin Mobile USA where her responsibilities included product marketing, customer lifecycle management and analytics. Sue’s career began in Telstra, where she held a range of marketing and product roles. Sue is a director of CareFlight and a member of the Australian Institute of Company Directors.
Sue is on our People, Performance and Culture Committee.
Mark Cross BBS (Accounting & Finance), CA
Director since 1 November 2016 Independent
Mark is an experienced director with more than 20 years of international experience in corporate finance and investment banking.
Mark is currently chair of Milford Asset Management, and is a director of Accident Compensation Corporation (ACC), Z Energy and Xero. He is also a former director of Genesis Energy and Argosy Property.
Mark is a member of Chartered Accountants Australia and New Zealand, a chartered member of the Institute of Directors NZ and a member of the Australian Institute of Company Directors.
Mark is chair of our Audit and Risk Management Committee, and on our Nominations and Corporate Governance Committee.
Prue Flacks LLB, LLM
Director since 1 December 2011 Independent
Prue is a professional director with experience across a range of industries.
Prue was formerly a commercial lawyer and a partner in the national law firm Russell McVeagh for 20 years. Her expertise includes corporate and regulatory matters, corporate finance, capital markets and business restructuring.
Prue is currently chair of Mercury NZ Limited. She is a chartered member of the Institute of Directors.
Prue is on our People, Performance and Culture Committee and on our Nominations and Corporate Governance Committee.
Murray Jordan MProp
Director since 1 September 2015 Independent
Murray has extensive experience in the management of highly customer focused organisations and in navigating extremely complex environments, including as managing director of Foodstuffs North Island, one of New Zealand's largest companies.
Murray has also previously held various general manager positions at Foodstuffs and management roles in the property investment and development sectors. He is a director of Metlifecare, Metcash Limited, an ASX listed company, Southern Cross Medical Care Society, Southern Cross Healthcare Limited, SkyCity and Stevenson Group, and a Board trustee of Starship Foundation.
Murray is chair of our People, Performance and Culture Committee.

Annual Report 2021 63
Our Board and management are committed to ensuring our people act ethically, with integrity and in accordance with our policies and values.
Kate Jorgensen BBus, CA
Director since 1 July 2020 Independent
Kate has significant financial, audit, governance and commercial experience and has held a number of senior leadership positions within the telecommunications, infrastructure and construction industries in New Zealand.
Most recently, she was CFO of Vodafone New Zealand. Prior to that, Kate was CFO of KiwiRail, CFO of Fletcher Building's infrastructure division and a senior audit manager for KPMG.
Kate was a former advisory Board member of the New Zealand Sustainable Business Council.
Kate is a member of Chartered Accountants Australia and New Zealand.
Kate is a member of our Audit and Risk Management Committee.
Jack Matthews BA Philosophy, College of William and Mary
Director since 1 July 2017 Independent
Jack is an experienced director who has held a number of senior leadership positions within the media, telecommunications and technology industries in Australia and New Zealand.
Jack has extensive telecommunications industry experience having been CEO of TelstraSaturn during the period they deployed their HFC network in New Zealand, as well as a former director of Crown Fibre Holdings, the Crown agency overseeing the rollout of New Zealand’s fibre infrastructure network.
Formerly, Jack was CEO of Fairfax Media’s Metro Division, CEO of Fairfax Digital and Chief Operating Officer of Jupiter TV (Japan).
Jack is currently a director of Plexure Group and New Zealand Golf Network Limited and a former director of The Network for Learning, APN Outdoor Group and Trilogy International.
Jack is on our Audit and Risk Management Committee.
Patrick Strange BE (Hons), PhD
Chair Director since 6 April 2015 Independent
Patrick has spent 30 years working as a senior executive and director in both private and listed companies, including more than six years as Chief Executive of Transpower where he oversaw Transpower’s $3.8 billion of essential investment in the National Grid. Patrick is currently chair of Auckland International Airport, and a director of Mercury NZ.
Patrick is chair of our Nominations and Corporate Governance Committee.

Annual Report 202164
This statement outlines the key aspects of our corporate governance framework and was approved by our Board on 20 August 2021.
As a New Zealand company listed on the NZX, our corporate governance policies and practices meet or exceed the standards of that market. We have adopted and fully followed the recommendations set out in the NZX Corporate Governance Code.
Although we have an ASX “foreign exempt” listing status1 we also continue to take the ASX Corporate Governance Code into account in our governance practices and policies.
Our Board regularly reviews and assesses our governance policies, processes and practices to identify opportunities for enhancement.
Chorus is, this year, publishing its first sustainability report (Sustainability Report), reflecting our ambition to support New Zealand in its transition to be more sustainable. The Sustainability Report contains information on our sustainability strategy, including our environmental focus, our commitment to strengthening the digital capability in New Zealand, and our commitment to helping our people thrive.
Our corporate governance practices are outlined on the following pages, in our Sustainability Report and available at www.chorus.co.nz/governance.
Key corporate governance documents are also available at www.chorus.co.nz/governance.
Our Board’s roleOur Board is appointed by shareholders and has overall responsibility for strategy, culture, health and safety, governance and performance.
1 An ASX foreign exempt listing is based on the principle of substituted compliance. This means our primary obligation is to comply with the NZX listing rules (as our home exchange). As a result we do not need to follow or report against compliance with the ASX Corporate Governance Code.
Board membership
Our Board’s skills, experience and composition support effective governance and decision making, positioning it to add value.
Supported by the Nominations and Corporate Governance Committee (NCGC) our Board regularly assesses its composition utilising a skills matrix and annual evaluation processes. Training is provided or recruitment undertaken if new or additional skills or experience is required. This ensures diversity of thought, skills and expertise and that our Board remains aligned with our strategic direction.
Our constitution provides for a minimum of five and a maximum of 12 directors.
As at 30 June 2021 we had seven directors all of whom are independent directors. We have four male directors and three female directors.
Directors are not appointed for specified terms. However, the NZX listing rules compulsorily require that no director term exceeds three years, requiring all directors to stand again for re-election before their third anniversary. Due to Chorus' succession planning, Chorus has at least one director standing for re-election each year. Jack Matthews and Prue Flacks both stood for re-election in 2020, while Kate Jorgensen stood for election as a new director.
We recognise that women and ethnic minorities are still under-represented in the leadership of New Zealand businesses and our Board remains actively conscious of this in its succession planning. More information on our approach to diversity is set out in our Sustainability Report, available at www.company.chorus.co.nz/sustainability.
Corporate governance framework

Annual Report 2021 65
Summary1 of our Board’s roles and responsibilities:
Culture • Leading culture “from the top” so our culture is consistent with our values
Strategy & performance
• Engaging in ongoing strategy development
• Overseeing capital allocation
• Overseeing the regulatory strategy as we transition to a new regulatory regime
• Approving, and reviewing performance against, our strategy and business plans (including capital
expenditure and operating budgets)
Financial oversight & reporting
• Overseeing our accounting and reporting systems and, where appropriate, approving our financial and
other reporting
• Overseeing and monitoring the performance of internal and external auditors
• Overseeing our control and accountability systems
• Overseeing long term capital management (balance sheet and dividends)
• Setting, monitoring and reviewing our internal audit plan
Risk management • Adopting and reviewing Chorus’ risk management framework, including setting the risk appetite
• Regularly reviewing principal risk reporting
Health & safety • Setting the strategy, culture and expectations in relation to health and safety
Board composition & performance
• Reviewing and evaluating Board, Board committee and individual director performance
• Appointing members to Board committees
Governance • Overseeing corporate governance, including reviewing key governance documents
• Carrying out the functions specifically reserved to our Board and its committees under Board approved
policies and committee charters
• Monitoring compliance with our continuous disclosure obligations
People • Reviewing and approving remuneration and people strategies, structures and policies
• Appointing and removing our CEO, CFO, Chief Corporate Officer & General Counsel
• Assessing the measurable objectives set for, and progress towards achieving, our diversity and
inclusiveness goals
Significant transactions • Approving major capital expenditure and business activities outside the limits delegated to management
1 Summary primarily drawn from the Board Charter but also from other supporting governance documents.

Annual Report 202166
Patrick Strange and Murray Jordan are retiring by rotation and standing for re-election at our 2021 ASM. Prue Flacks will step down from the Board at this year's ASM.
Our Board has determined that collectively its directors have a broad range of managerial, financial, accounting and industry skills and experience in the key areas set out on the following page.
A summary of current directors skills, experience and qualifications is set out on our website at www.chorus.co.nz/governance.
As the Chorus business evolves, so too does the Board. Chorus’ beginnings were focused on infrastructure build and project management. With the success of the build,
we are increasingly focused on connecting customers and their experience as well as future connectivity and innovation opportunities. The Board considers it is important to balance both specialist expertise and the ongoing need for strong general commercial expertise.
Figure 12 Figure 13:
Director tenure Board gender diversity
Director Appointed Last elected at ASM
Prue Flacks 2011 2020
Murray Jordan 2015 2018
Patrick Strange 2015 2018
Mark Cross 2016 2019
Jack Matthews 2017 2020
Sue Bailey 2019 2019
Kate Jorgensen 2020 2020
0–3 years
4–6 years
6+ years
Female
Male
29%
14%
57%
57% 43%

Annual Report 2021 67
The following table reflects the strengths of the current Board based on a mix of key skills and experiences that are currently relevant for Chorus.
Skill/experience Description Combined Board
Capital markets
and investment
Experience in, and understanding of, capital markets, market regulation,
capital investment and the investor experience
Communications
connectivity and
technology
Understanding, expertise and/or experience in communications connectivity,
adopting new technologies, leveraging and implementing technologies
Governance –
financial, audit,
legal, listed company
Experience with, and a commitment to, high corporate governance standards
including in listed companies
Understanding financial business drivers, and/or experience implementing or
overseeing financial accounting, external reporting and internal financial controls
Physical infrastructure
and operations
including contracting,
safety and risk
Experience in leading, and/or understanding of, physical infrastructure
operations, including contracting
Commitment and experience in management of workplace safety
Experience anticipating and identifying key risks and monitoring the effectiveness
of risk management frameworks and controls
Governance –
executive experience
in large businesses
Executive experience in leading large businesses, developing and implementing
strategy and strategic objectives, assessing business plans and driving execution
Infrastructure
regulation
Understanding the current and developing regulatory environment, complexities
and actual and potential impacts
Expertise identifying and managing legal, regulatory, public policy and corporate
affairs issues
Customer
experience
Experience in customer-led transformation, customer focus and/or customer
centric organisations
Moderate experience Some experienceSubstantial experience

Annual Report 202168
AppointmentOur Board may appoint additional directors to our Board or to fill a casual vacancy. Any director appointed by the Board is required to stand for election at the next ASM.
The independence, qualifications, skills and experience needed for the future and those of existing Board members are reviewed before appointing new directors. External advisors are also engaged to identify potential candidates.
To be eligible for selection, candidates must demonstrate appropriate qualities and satisfy our Board they will commit the time needed to be fully effective in their role.
Appropriate checks are undertaken before a candidate is appointed or recommended for election as a director, including as to the person’s character, experience, education, criminal record and bankruptcy history.
Shareholders may also nominate candidates for appointment to our Board. In addition, under the agreements entered into with CIP relating to our UFB programme, CIP is entitled to nominate one person as an independent director, however CIP have never excercised this entitlement. Should this occur, our Board must consider this nomination in good faith, but the appointment (and removal) of any such person as a director is to be made by shareholders in the same way as other directors.
We have written agreements with each non-executive director setting out the terms of their appointment, including obligations and responsibilities, compliance with our policies (including code of ethics and securities trading) and ongoing professional development.
No person who is an 'associated person' of a telecommunications services provider in New Zealand may be appointed or hold office as a director.
Minimum shareholding policyChorus' Minimum Shareholding Policy sets the expectation on directors to hold, at a minimum, shares equal in value to one year's director base fee (after tax). If not held at date of appointment (or the commencement date of the policy), the policy expects directors to accumulate this holding over the first three years from the relevant date.
Director induction and professional developmentOur director induction programme ensures new directors are appropriately introduced to management and our business, provides directors with relevant industry knowledge and familiarises them with key governance documents and key stakeholders.
Our directors are expected to continue ongoing professional development to ensure they maintain appropriate expertise to effectively perform their duties.
We hold dedicated Board education sessions covering a range of topical matters, both technical and cultural.
Visits to our operations, briefings from key management, industry experts and key advisers, together with educational and stakeholder visits, are also arranged for our Board.
Review and evaluation of Board performanceOur Board uses performance and evaluation processes overseen by our NCGC. As part of this process our chair meets with directors individually to discuss performance.
Our Board also formally engages in annual reviews of our Board chair, and chairs of our standing Board committees.
In addition to Board performance reviews, our Board takes a future focused approach to future Board capability, composition and the potential contribution of each existing director.
Independent adviceA director may, with our chair’s prior approval, obtain independent professional advice (including legal advice) and request the attendance of advisers at Board and Board committee meetings.
IndependenceAll our directors are independent directors.
For a director to be considered independent our Board must affirmatively determine he or she does not have a disqualifying relationship as set out in our Board charter. These disqualifying relationships reflect those set out in the NZX listing rules and NZX and ASX corporate governance codes.
Our Board has not set financial materiality thresholds for determining independence but considers materiality in the context of each relationship and from the perspective of the parties to that relationship.
Delegation of authorityOur Board has overall responsibility for strategy, culture, health and safety, governance and performance.
Implementation of our Board approved strategy, business plan and governance frameworks, and responsibility for developing our culture and health and safety practices, is delegated by the Board to management through the CEO.
As such our CEO (with the support of his executive team) is responsible for Chorus’ day-to-day management, operations and leadership, reporting to the Board on key performance, management and operational matters.
Our CEO sub-delegates authority to his executive team and they sub-delegate their authority to other Chorus employees within specified financial and non-financial limits.
Formal policies and procedures govern the parameters and operation of these delegations.

Annual Report 2021 69
Three standing Board committees also assist our Board in carrying out its responsibilities. Some Board responsibilities, powers and authorities are delegated to those committees.
Board committeesBoard committees assist our Board by focusing on specific responsibilities in greater detail than is possible for the Board as a whole. Each standing Board committee has a Board approved charter and chair. Committee members are appointed by our Board.
Other committees may be established and specific responsibilities, powers and authorities delegated to those committees and/or to particular directors.
Audit and Risk Management Committee (ARMC)
Role Our ARMC assists our Board in overseeing our risk and financial management, accounting, audit and financial reporting
Members Mark Cross (chair), Jack Matthews, Kate Jorgensen
Independence All committee members are independent directors
Responsibilities • Overseeing the quality and integrity of external financial reporting, financial management, internal controls and accounting policy and practice
• Regularly reviewing principal risk reporting
• Recommending to our Board the appointment, and if necessary removal, of the external auditor
• Assessing the adequacy of the external audit and independence of the external auditor
• Reviewing and monitoring the internal audit plan and reporting
• Overseeing the independence and objectivity of the internal audit function
• Reviewing compliance with applicable laws, regulations and standards
People, Performance and Culture Committee (PPCC)
Role Our PPCC assists our Board in overseeing people, culture and related policies and strategies
Members Murray Jordan (chair), Prue Flacks, Sue Bailey
Independence All committee members are independent directors
Responsibilities • Reviewing people and remuneration strategies, structures and policies
• Approving annual remuneration increase guides and budgets
• Reviewing candidates for, and the performance and remuneration of, our CEO
• Approving, on the recommendation of our CEO, the appointment of our CEO’s executive direct reports (except our CFO and Chief Corporate Officer & General Counsel whose appointment is approved by our Board)
• Reviewing our CEO’s performance and his evaluation of his executive direct reports
• Developing and annually reviewing and assessing diversity and its reporting
• Overseeing recruitment, retention and termination policies and procedures for senior management
• Making recommendations (including proposing amendments) to our Board with respect to senior executive (including CEO) incentive remuneration plans
• Annually reviewing non-executive director remuneration
Our Shareholders
Chorus Limited Board
CEOExecutive
TeamOur
People
Audit and Risk Management Committee
People, Performance and Culture Committee
Nominations and Corporate Governance Committee

Annual Report 202170
Nominations and Corporate Governance Committee (NCGC)
Role Our NCGC assists our Board in overseeing and promoting continuous improvement of corporate governance
at Chorus
Members Patrick Strange (chair), Prue Flacks, Mark Cross
Independence All committee members are independent directors
Responsibilities • Identifying and recommending suitable candidates for appointment to our Board and Board committees
• Reviewing the size, independence, qualifications, skills, experience and composition of our Board
• Developing, reviewing and making recommendations to our Board on corporate governance principles
• Establishing, developing and overseeing a process for the annual review and evaluation of Board, Board
committee, and individual director performance
• Developing and reviewing Board succession planning (including for the Board chair)
• Monitoring compliance with our codes of ethics and managing breaches of the Director Code of Ethics
• Reviewing and overseeing director induction and ongoing professional development
Ad-hoc Regulatory Sub-CommitteeA new Regulatory Sub-Committee was established by the Board post balance date to oversee our regulatory strategy as we
transition into the new regulatory regime. The need to establish a sub-committee for additional regulatory work was flagged
to shareholders as part of the increase in the Directors' fee pool in 2019. The members include all of the directors on the
Board. The chair of the Board will be the chair of the new Regulatory Sub-Committee.
Board chair Our chair is elected by the Board and must be a non-executive, independent director.
The chair’s responsibilities include:
• Leading the Board;
• Setting the agenda for Board meetings in consultation with the CEO;
• Facilitating the effective contribution of all directors; and
• Promoting constructive relationships between directors and management.
The chair’s other commitments must not hinder his or her effective performance in the role.
Board and Board committee meeting attendance in the year ended 30 June 2021
Regular Board meetings
Other Board meetings1
ARMC PPCC NCGC
Total number of meetings held 8 4 4 4 2
Patrick Strange2 8 4 2
Jon Hartley 13
Mark Cross 8 4 4 2
Prue Flacks 8 4 4 2
Murray Jordan 8 4 4
Jack Matthews 8 4 4
Sue Bailey 8 4 4
Kate Jorgensen 8 4 4
JB Rousselot is not a director, but has attended 100% of all Board meetings.
Notes:1 Includes dedicated Board education, and strategy and business planning, meetings. Directors also have health and safety site visits each year.2 Patrick Strange, as Board chair, attends all Board committee meetings. As he is not a formal member of the ARMC or PPCC, that attendance is not
noted in the table.3 Jon Hartley retired from the Board effective 31 August 2020.

Annual Report 2021 71
The risk and
control environment
2. Risk assessment and ratings
– Risk assessment (likelihood and impact)
– Risk ratings (critical, high, medium, low)
5. Annual risk reviews
– Completeness,
accuracy and validity
of principal risks
– Effectiveness of the
risk management
process
1. Risk identification and description
– Risk identification and description
– Recording principal risks
3. Risk mitigations
– Risk responses
– Mitigating controls
– Action plans
4. Regular risk reporting
– Mitigation status
– Risk trends
– Current and potential risks
– Action plan status
AssuranceManagement assuranceIndependent assurance (including internal audit,
external audit)
Managing risk
Like all businesses, we are exposed to a range of risks. Our risk management activities aim to ensure we identify, prioritise and manage key risks so we can execute our strategies and achieve our goals.
Risk managementNo business can thrive without taking on risk. Effective risk management is about informed risk taking and appropriate and active management of risks.
We seek to understand and respond to our current and future business environment, and to actively seek and robustly evaluate opportunities and initiatives which protect and achieve our business strategies. We strive to understand, meet and appropriately balance stakeholders’ expectations to deliver value to shareholders and a sustainable environment for Chorus in the long term.
Our BoardOur Board is ultimately responsible for risk management governance:
• Annually setting risk appetite and tolerances and determining principal risks;
• Participating in discussions concerning elements of risk including emerging and unforeseen risks;
• Approving and regularly reviewing our Managing Risk Policy and supporting framework;
• Promoting a culture of proactively managing risk; and
• Through our ARMC, providing risk oversight and monitoring.
Risk appetiteOur risk appetite sets our tolerable levels of risk. It forms a dynamic link between strategy, target setting and risk management and sets boundaries for day-to-day decision making and reporting.
Risk management processesOur Managing Risk Policy sets out how we manage our risks, including by:
• Having a single risk management framework;
• Providing the CEO and executive team with discretion to manage risk within the guidance provided in our framework;
• Balancing the level of control implemented to mitigate identified risks with our commitment to comply with external regulation and governance requirements and Chorus’ value and growth aspirations; and
• Meeting good practice standards for risk management processes and related governance.
Principal risksPrincipal risks are owned by relevant executives. This promotes integration into operations and planning and a culture of proactive risk management. Notwithstanding individual ownership, our CEO and executive hold collective responsibility for considering how risk and events interrelate and for managing our overall risk profile.
Principal risks are reported to our ARMC quarterly and, if necessary, also by exception. Principal Risk owners support the regular reporting from the Head of Risk, Internal Audit & Compliance by providing “deep dives” on the risks they own. Our ARMC reports to our Board.
Principal risks are assessed with each responsible executive and collectively with the executive team before being reported to the ARMC. This allows for constructive challenge and debate. Underlying risk assessment and monitoring practices are undertaken by each principal risk owner with assistance from our Risk, Internal Audit & Compliance team.
Our Board also receives management and other internal and external reporting over risk positions and our risk management operation (including from internal audit plans approved by the ARMC) through our overall governance framework.

Annual Report 202172
Principal risks are our key risks to the achievement of our strategy. These are assessed on a risk profile identifying likelihood of occurrence and potential severity of impact. Current principal risk categories are identified via a comprehensive enterprise risk management framework encompassing financial and non-financial risks. They include anticipating and responding to:
• Customer/market risks: customer service and experience; revenue growth and market changes;
• Operational risks: e.g. network and IT quality, availability and resilience; delivering effective and quality outcomes (including with service partners); labour market risks;
• People & culture: e.g. health & safety; engagement; capability; talent and change management;
• Regulatory risks and broader societal expectations: e.g. working within the regulatory and legal environment, and broader societal expectations;
• Capital management: e.g. working within appropriate capital management settings.
Our climate change risks are reviewed as part of our operational risks (see our Sustainability Report).
In addition to Principal Risks, the Chorus Board or ARMC regularly receive updates on, and discuss with the Executive:
• Unforeseen risks which are 'black swan' events which have not been otherwise identified through normal risk processes;
• Emerging risks which are risks that are known to some degree but are not likely to materialise or have an impact in the near term;
• Business unit risks which are risks to the achievement of functional area strategies.
Internal auditWe operate a co-sourced internal audit model with our Head of Risk, Internal Audit & Compliance and her team supported by external advisors PricewaterhouseCoopers to provide additional resource and specialist expertise as required.
The responsibilities of our internal audit function include:
• Assisting our ARMC and Board in their assessment of internal controls and risk management;
• Developing an internal audit plan for review and approval by the ARMC each year;
• Executing the plan and reporting progress against it, significant changes, results and issues identified; and
• Escalating issues as appropriate (including to our ARMC and/or Board chairs).
Our executive team and ARMC monitor key outstanding internal audit issues and recommendations as part of regular reporting and review, including the timeliness of resolution.
Our ARMC has direct and unrestricted access to our internal audit function, including meeting them without management.
Our Head of Risk, Internal Audit & Compliance has a management reporting line to our Chief Corporate Officer & General Counsel and a direct reporting line to our ARMC, attending every ARMC meeting.
Our ARMC reviews the remuneration and incentive arrangements of our Head of Risk, Internal Audit & Compliance and our Risk & Assurance Manager each year.

Annual Report 2021 73
External auditorOur Board and ARMC monitor the ongoing independence and quality of our external auditor. Our ARMC also meets with our external auditor without management present.
Our ARMC charter and External Auditor Independence Policy amongst other things:
• Prohibit the provision of certain non-audit services by our external auditor;
• Require ARMC approval of all audit and permitted non-audit services;
• Require our client services partner and lead/engagement partner to be rotated every five years (with a five year cooling off period) and other audit partners to be rotated every seven years (with a two year cooling off period);
• Require our ARMC to review our external auditor’s fees half yearly (including the ratio of fees for audit vs. non-audit services); and
• Impose restrictions on the employment of former external audit personnel.
The non-audit services undertaken by our external auditor KPMG in the year to 30 June 2021 are set out in note 10 of the financial statements in this report. Those services were provided in accordance with our ARMC charter and External Auditor Independence Policy and did not affect KPMG’s independence, including because:
• They were approved only where we were satisfied the services would not compromise KPMG’s independence; and
• They did not involve KPMG acting in a managerial or decision-making capacity.
KPMG confirm their independence via independence declarations every six months.
Our external auditors attend our ASM each year.

Annual Report 202174
Codes of ethicsDirectors and employees are expected to act honestly and with high standards of personal integrity. Codes of ethics for our directors and employees set the expected minimum standards for professional conduct. These codes facilitate behaviours and decisions that are consistent with our values, business goals and legal and policy obligations, including in respect of:
• Conflicts of interest;
• Gifts and personal benefits;
• Anti-bribery and corruption;
• Use of corporate property, opportunities and information;
• Confidentiality;
• Compliance with laws and policies; and
• Reporting unethical behaviour.
We have communicated our codes of ethics and provided annual training to our directors and employees. Our people are also encouraged to report any unethical behaviour, including quarterly reporting of any potential conflicts.
This process is subject to internal audit. All reported breaches are investigated.
Trading in Chorus securities
All trading in Chorus securities by directors and employees must be in accordance with our Securities Trading Policy. That policy prohibits trading in Chorus securities while in possession of inside information and requires, amongst other things:
• Directors to notify, and obtain consent from, the chair (or in the chair’s case, the ARMC chair) before trading; and
• Employees identified as potentially coming across market sensitive information in the course of their employment (“restricted persons”), to obtain consent from our Chief Corporate Officer & General Counsel (or in our Chief Corporate Officer & General Counsel’s case, our Board chair) before trading.
Trading in Chorus shares or NZX listed bonds by directors is disclosed to our Board, the NZX and ASX. Trading by “senior managers” is disclosed to the NZX.
Market disclosuresWe are committed to providing timely, factual and accurate information to the market consistent with our legal and regulatory obligations.
We have a Board approved Disclosure Policy and a CEO approved Market Disclosure Policy setting out our disclosure practices and processes in more detail.
Our disclosure policies are designed to ensure:
• Roles of directors, executives and employees are clearly set out.
• Appropriate reporting and escalation mechanisms are established.
• There are robust and documented confidentiality protocols in place where appropriate.
• Only authorised spokespersons comment publicly, within the bounds of information which is either already publicly known or non-material.
Our approach to taxWe take our tax obligations seriously and work closely with Inland Revenue to ensure we meet our tax obligations.
We obtain external advice and Inland Revenue’s views (through informal correspondence, determinations or rulings) in respect of unusual or material transactions.
As we operate only in New Zealand all our tax is paid in New Zealand at the prevailing corporate tax rate (currently 28%). We have paid all taxes we owe and all tax compliance obligations are up to date.
Acting ethically

Annual Report 2021 75
We are committed to fostering constructive relationships
with shareholders:
• Communicating effectively with them;
• Giving ready access to balanced and understandable information;
• Making it easy for shareholders to participate in general meetings; and
• Maintaining an up to date website providing information about our business.
Our investor relations programme is designed to further facilitate two-way communication with shareholders, provide them and other market participants with an understanding of our business, governance and performance and an opportunity to express their views. As part of this programme we enable investors and other interested parties to ask questions and obtain information, meet with investors and analysts and undertake formal investor presentations. Our annual and half year results presentations are made available to all investors via webcast.
Until 2020 Chorus has held annual meetings in a main centre and webcast to enable shareholders to view and hear proceedings online.
Due to concerns about the uncertain COVID-19 environment and the potential health risks for our shareholders, we chose to hold the 2020 ASM as a virtual meeting. Voting and the asking of questions was facilitated electronically. Due to the recent COVID-19 lockdowns, the Board has indicated that the 2021 ASM is also likely to be a virtual meeting.
We enable shareholders to vote by proxy ahead of meetings without having to physically attend or participate in those meetings and adopt the one share one vote principle, conducting voting at shareholder meetings by poll.
We consider that shareholders should be entitled to vote on decisions which would change the essential nature of our business.
Shareholders are also able to ask questions of, and express their views in respect of, our Board, management and auditors (including via appointed proxies) at and before annual meetings.
We encourage shareholders to communicate with us and our share registrar electronically, including by providing email communication channels and online contact details and instructions on our website.
Shareholder engagement

Annual Report 202176
Remuneration and performanceOur remuneration model Our remuneration model is designed to enable the achievement of our strategy, whilst ensuring that remuneration outcomes are aligned with employee and shareholder interests.
Remuneration is governed through the Board and assisted by the People, Performance and Culture Committee (PPCC). The PPCC supports the Board to fulfil their remuneration obligations by overseeing our remuneration strategy and policy.
Figure 16:
Our remuneration policy is designed around six guiding principles:
1
2
3
4
5
6
Fair to all – employees and shareholders, sharing in the success of Chorus.
Supports a Performance focused culture.
Valued by our people.
Simple to understand and administrate.
Market — aligned with our competitors.
Point of difference — how we know it is Chorus.
Commitment to pay equity and alignment with our shareholders’ expectations.
Rewards aligned with performance.
We have a diverse workforce and aim to provide an appropriate suite of rewards that provide value, now and in the future.
Simplicity promotes understanding, clarity and fairness perception.
We ensure we are not over or underpaying our people through robust market analysis that guides our decisions on remuneration.
Supports Chorus’ strategy, values, purpose and employee value proposition.
Remuneration principles What does this mean?
There were no material changes to Chorus’ remuneration strategy or policy in FY21.
The CEO and members of the executive leadership team have the potential to earn a long term incentive (LTI) and short term incentive (STI). Both STI and LTI are deemed at risk because the outcome is determined by performance against a combination of pre-determined financial and non-financial objectives.
Fixed remuneration Fixed remuneration (not at risk) consists of base salary and other benefits including KiwiSaver. Fixed remuneration is adjusted each year based on data from independent remuneration specialists. Employees’ fixed remuneration is based on a matrix of their own performance and their current position when compared to the market.
Short term incentive As with FY20, only senior employees were invited to participate in the FY21 STI scheme. The FY21 STIs are at risk component payments, that are set as a percentage of fixed remuneration, from 15% to 30% based on the complexity of the role (the CEO’s STI is a higher percentage of fixed remuneration as set out later in this report). STI payments are determined following a review of Company and individual performance and paid out at a multiplier of between 0x and 1.75x for the CEO and executive leadership team, and between 0x and 2.8 for all other employees.
Company performance goals are set and reviewed annually by our Board to align with shareholder value. A strong emphasis on the customer experience continued to be a feature for the FY21 STI measures.

Annual Report 2021 77
The Board has agreed the FY22 STI scheme will have the same focus areas as the FY21 scheme, with the same weightings. One small change is the introduction of a new customer experience measure for fibre fault restoration. This will replace the fibre installation measure used in FY21 and reflects our shift in focus from build to operate as the fibre rollout comes to an end.
Fundamental to the Chorus STI structure is a gateway goal which is based on a minimum level of EBITDA. The philosophy of the gateway goal is to provide a preliminary threshold of financial success and affordability, before any other measures can be considered for potential STI payments. If the gateway goal is not achieved, then no STI is payable.
Individual performance goals for all employees are tailored to their role, with 70% of the goals based on what they achieve and 30% based on how they perform their role, which includes a health and safety component for all people leaders. Payments are subject to the Board's discretion.
As an example of how the STI is calculated, an employee with fixed remuneration of $100,000 and an STI element of 15% may receive between $0 and $42,000 (0x to 2.8x their STI percentage) depending on the level of company performance and their individual performance.
Long term incentives We offer long term incentives under an executive LTI share scheme to reward and retain key executives. The LTIs are an at risk payment designed to align the interests of executives and shareholders and encourage longer term decision making.
The LTI is described in more detail in Note 16 of the financial statements on page 50.
To further align executive interests with those of shareholders, a minimum shareholding policy was introduced in 2019. The policy prohibits executives from selling shares received under the new LTI, unless the executive holds the equivalent of at least 25% of their after tax base remuneration in Chorus shares (or 33% for the CEO).
Fibre connections Based on total connection target of 890,000 at year end.
Customer experience Measured by consumer scores for fibre installation (target
of 8.0 average over 12 months) and intact fibre connection
experience (target of 7.5 average over three months)
EBITDA Year end target aligned with objective of modest
EBITDA growth.
Strategic and transformation initiatives
Qualitative assessment by Board based on long-term
business initiatives including the transition to the new
regulatory regime and implementation of a new
operating model.
Figure 17:
FY21 STI Goals
20% 20%
40%
Strategic & transformation initiatives
Fibre connections
EBITDA
Customer experience
20%

Annual Report 202178
Chief Executive employment agreement and remunerationJB Rousselot’s employment agreement reflects standard conditions that are appropriate for a senior executive of a listed New Zealand company. The employment agreement may be terminated by:
— either he or the company giving six months' notice in writing;
— the company without notice in the case of serious misconduct, serious breach (including substantial non-performance) or other cause justifying summary dismissal; or
— the company immediately, if the Board forms the view that substantial incompatibility and/or irreconcilable differences have developed with him, or the Board otherwise wishes to terminate his employment when he is not at fault (including a redundancy situation or medical incapacity).
Our CEO continues to have a significant portion of his remuneration linked to performance and at risk. Total remuneration for our CEO continues to be determined using a range of external factors, including advice from external remuneration specialists and is reviewed annually by the PPCC and Board.
CEO remuneration performance and pay
The scenario chart below demonstrates the elements of the CEO remuneration design in the year ended 30 June 2021.
The chart does not include any income from the LTI scheme.
0
$ T
ho
usa
nd
s
FIXED ON-PLAN MAXIMUM
4,000
3,000
2,000
1,000
100% 57%
43%
43%
57%
Done
Base Annual variable
The CEO has received two grants under the LTI scheme ($319,829 in 2019 and $412,500 in 2020) that are yet to vest. Those LTI grants are subject to the performance measures outlines overleaf. The first grant (2019) is not due to vest until August 2022.
CEO remuneration for FY20 and FY21 was:
Fixed remuneration
Pay for performance LTI Total remuneration
J B Rousselot FY21 1,250,000 768,750 — 2,018,750
J B Rousselot FY20 763,6991 661,5542 — 1,425,253
Kate McKenzie FY20 588,3253 — — 588,325
1 Pro-rated from start date of 20 November 2019.2 STI for FY20 performance period, pro-rated from start date of 20 November 2019 (paid FY21).3 Pro-rated to end date of 20 December 2019.
Other benefits paid to JB Rousselot: FY21 Company KiwiSaver Contrib JB Rousselot: $58,845; FY20 Company KiwiSaver Contrib JB Rousselot $22,672
Five year summary of CEO remuneration:
CEO Total remuneration % STI awarded
against maximum% LTI awarded
against maximum
% LTI replacement awarded against
maximumSpan of LTI performance
period
J B Rousselot FY21 $2,018,750 82% — — —
FY201 $1,425,253 66% — — —
Kate McKenzie FY202 $588,325 — — — —
FY19 $2,068,560 53% — — —
FY18 $2,219,475 65% — — —
FY17 $845,618 60%
Mark Ratcliffe FY18 — — 89% — FY15 - FY18
FY17 $1,981,987 48% 100% 100% FY15 - FY17
1 Pro-rated from start date of 20 November 20192 Pro-rated to end date of 20 December 2019

Annual Report 2021 79
The table below outlines the CEO’s STI, LTI and extended LTI schemes for the performance period ending 30 June 20211 :
Description Performance measures Percentage achieved
STI Set at 75% of base remuneration. Based on key financial and non-financial performance measures.
• Company performance – see FY21 STI Goals on page 77 for weightings.
• Individual performance – based on business fundamentals (both financial and non-financial), connections, customer experience and strategic initiatives.
82%
LTI - 2019 Three-year grant made November 2019, equivalent to 33% of base remuneration.
• Chorus TSR performance over grant period must exceed 10.35% on an annualised basis, compounding.
Assessed August 2022 with possible retesting up to August 2023.
LTI - 2020 Three-year grant made August 2020, equivalent to 33% of base remuneration.
• Chorus TSR performance over grant period must exceed 9.65% on an annualised basis, compounding.
Assessed August 2023 with possible retesting up to August 2024.
1. The STI payments for FY21 will be paid in FY22.
Total Shareholder Return (TSR) performance
30 June 2016
30 June 2017
30 June 2018
30 June 2019
30 June 2021
30 June 2020
Chorus NZX50
Pe
rce
nta
ge
re
turn
-50.00
0.00
50.00
100.00
150.00
200.00
The graph above shows Chorus’ TSR performance against the NZX50 between 30 June 2016 and 30 June 2021.

Annual Report 202180
Executive shareholdingFor the year ended 30 June 2021, Chorus executives held shares in Chorus as shown in the table below.
1. The executive left Chorus during FY21.
DiversityWe provide targeted development opportunities to support diversity in leadership and have a focus on gender diversity in leadership roles. Our target is a 40:40:201 gender ratio in our people leader community. We achieved a ratio of 64% men and 36% women in FY21. This was below our target.
We had 4 male and 3 female directors at 30 June 2021 (30 June 2020: 5 male and 2 female directors). Our executive (officers or senior managers) comprising our CEO and his leadership team had 6 males and one female at 30 June 2021 (30 June 2020: 7 males and 2 females).
Based on its annual review of our progress against our measurable diversity metrics and objectives, our Board considers that we’re not where we need to be as an organisation, in particular within diverse leadership. They have asked that we place additional focus in FY22, on areas like recruitment and selection practices and talent mobility, to drive meaningful change.
1. 40% men, 40% women, 20% of any/either gender
Gender pay gapLike other businesses we deferred our standard remuneration review in FY21 due to the effects of COVID-19. We did, however, undertake a comprehensive pay analysis focussed on gender pay equity. We want to ensure our people are paid fairly for their value and contribution to Chorus, irrespective of gender. Our objective is to achieve a 0% gender career level pay gap.
There were two parts to the gender pay review. We compared pay for:
• people in the same or similar roles and;
• roles that were paid low in the relevant pay band, but where the employee was high performing.
A total of 90 employees received a remuneration increase as a result of this review (61% female and 38% male), with a total budget of $500,000. This process also ensured compliance with the Equal Pay Act 1972.
Median pay gapThe median pay gap represents the number of times greater the CEO remuneration is to an employee paid at the median of all Chorus employees. At 30 June 2021 the CEO’s base salary at $1,250,000 (on an annualised basis ) was 11.3 times that of the median employee at $110,000 per annum.
The CEO’s total remuneration on an annualised basis including STI was 18.4 times the total remuneration of the median employee including STI at $110,000.
Executive Current Holdings
Shares Eligible to Vest
Andrew Carroll 85,312 20,428
David Collins - -
Ed Hyde - 16,137
Elaine Campbell - 14,670
Ewen Powell 64,344 13,570
Ian Bonnar1 35,501 9,719
JB Rousselot - -
Shaun Philp 14,464 12,469
Vanessa Oakley1 80,458 14,487
Total 280,079 101,480
Figure 14:
Gender by role three year review
20%
40%
60%
80%
100%
0
PE
OP
LE
LEA
DE
RS
20
21
64
36
PE
OP
LE
LEA
DE
RS
20
20
60
40
PE
OP
LE
LEA
DE
RS
20
19
62
38
DIR
EC
TO
RS
20
20
62
38
DIR
EC
TO
RS
20
19
62
38
DIR
EC
TO
RS
20
21
57
43
EX
EC
UT
IVE
2
02
0
78
22
EX
EC
UT
IVE
2
019
55
45
EX
EC
UT
IVE
2
02
1
86
14
ALL
C
HO
RU
S 2
019
60
40
ALL
C
HO
RU
S 2
02
1
59
41
ALL
C
HO
RU
S 2
02
0
59
41

Annual Report 2021 81
Employee remuneration range for the year ended 30 June 2021The table to the right shows the number of employees and former employees who received remuneration and other benefits in excess of $100,000 during the year ended 30 June 2021. This includes STI and LTI paid during FY21, as well as other benefits such as insurance and a broadband concession.
During the year, certain employees received contributions towards membership of the Marram Trust (a community healthcare and holiday accommodation provider), received contributions toward their Government Superannuation Fund (a legacy benefit provided to a small number of employees) and, if a member, received contributions of 3% of gross earnings towards their KiwiSaver accounts. These amounts are not included in these remuneration figures. Any benefits received by employees that do not have an attributable value are also excluded.
The remuneration paid to, and other benefits received by, JB Rousselot in his capacity as CEO are detailed on pages 78 to 79 and are excluded from the table to the right.
The current Living Wage is $22.10 per hour. Chorus does not have any permanent employee earning less than the current living wage.
Two things have contributed to the reduction in the number of people in the $100,000 table:
• Fewer layer 1-4 positions where $100,000+ salaries are more likely (231 in FY20 vs 184 in FY21)
• Reduction in headcount overall from 870 in FY20 to 817 in FY21
Managing PerformanceOur performance management approach is based on fostering and rewarding valuable business outcomes.
Our people have performance and development plans which are regularly reviewed with their people leaders. Performance plans are developed to connect our people with our strategy, their functional plans and the connection with their individual roles. Performance plans include outcome based objectives, behavioural measures aligned with our values and an individual development plan.
Formal performance reviews were undertaken for all our people during the year. As part of this, people leaders sought feedback and participated in peer review and moderation sessions, resulting in an overall performance rating and remuneration recommendations determining an individual’s total pay (fixed remuneration and variable).
A similar process is undertaken each year for our executive team, with our CEO making recommendations to our PPCC for executive team members, and our PPCC leading the performance review of our CEO, making recommendations to our Board. These processes are consistent with those set out in our PPCC charter and allow our Board to provide input into individual performance outcomes, total reward approvals (fixed and variable) and development plans. These processes were all undertaken in the year ended 30 June 2021.
Remuneration range $ (Gross)Number of employees in the year
ended 30 June 2021
Actual Payment REM and other benefits
760,001 to 770,000 1
730,001 to 740,000 1
680,001 to 690,000 1
620,001 to 630,000 1
560,001 to 570,000 2
510,001 to 520,000 2
420,001 to 430,000 1
390,001 to 400,000 2
370,001 to 380,000 1
360,001 to 370,000 1
340,001 to 350,000 2
320,001 to 330,000 2
310,001 to 320,000 3
300,001 to 310,000 3
280,001 to 290,000 5
270,001 to 280,000 4
260,001 to 270,000 4
250,001 to 260,000 7
240,001 to 250,000 7
230,001 to 240,000 7
220,001 to 230,000 7
210,001 to 220,000 10
200,001 to 210,000 21
190,001 to 200,000 17
180,001 to 190,000 17
170,001 to 180,000 17
160,001 to 170,000 20
150,001 to 160,000 30
140,001 to 150,000 48
130,001 to 140,000 51
120,001 to 130,000 53
110,001 to 120,000 65
100,000 to 110,000 68
Grand Total 481

Annual Report 202182
Director remuneration
Fee structure
Total remuneration available to directors (in their capacity as such) in the year ended 30 June 2021 was fixed at our 2019 annual shareholders’ meeting at $1,169,042.
Annual fee structure Year ended 30 June 2021 $ Year ended 30 June 2020 $
Board fees:
Board chair 223,650 223,650
Deputy chair – 167,750
Non-executive director 114,000 114,000
Board committee fees:
Audit and Risk Management Committee
Chair 32,600 32,600
Member 16,300 16,300
People, Performance and Culture Committee
Chair 22,900 22,900
Member 11,750 11,750
Nominations and Corporate Governance Committee
Chair – –
Member 8,880 8,880
Notes:1 The Board chair receives Board chair fees only. Other directors receive committee fees in addition to their Board fees. A fee of $16,720 is available
for the chair of the NCGC as part of the fee structure, but is not currently payable as the Board chair is also NCGC chair. 2 The deputy chair role was disestablished once Jon Hartley retired as a director effective 31 August 2020.3 Directors do not participate in a bonus or profit-sharing plan, do not receive compensation in share options, and do not have superannuation or any
other scheme entitlements or retirement benefits.4 Directors may be paid an additional daily rate of $2,400 for additional work as determined and approved by our chair and where the payment is
within the total fee pool available. There were no such fees paid in the year to 30 June 2021. There was also no increase in director and committee base fees in the year to 30 June 2021.
Fees paid to Directors (in their capacity as such) in the year ended 30 June 2021
Director Total fees1 $ Board fees ARMC PPCC NCGC
Patrick Strange 223,650 223,650 –
Jon Hartley 27,958 27,958 2 – –
Mark Cross 153,260 114,000 32,600 6,660
Prue Flacks 134,630 114,000 11,750 8,880
Murray Jordan 136,900 114,000 22,900
Jack Matthews 130,300 114,000 16,300
Sue Bailey 125,750 114,000 11,750
Kate Jorgensen 130,300 114,000 16,300
Total 1,062,748
Notes:1 Amounts are gross and exclude GST (where applicable).2 Jon Hartley retired as a director effective 31 August 2020.3 Directors did not receive any fees or other benefits for additional work during the year ended 30 June 2021.4 Directors are entitled to be reimbursed for travel and incidental expenses incurred in performance of their duties in addition to the above fees.5 The total fee pool available to directors is $1,169,042.
Fee structure from 1 July 2021
Our PPCC reviews non-executive director remuneration annually based on criteria developed by that committee. Based on that committee’s recommendation the Board has determined not to change Board fees for the year from 1 July 2021. There may be additional ad-hoc fees payable as a result of the Regulatory Sub-Committee established post balance date to oversee our regulatory strategy. The Board authorised fees of $2,400 per member, per day for work and attendance at meetings. All Board directors are members of the Regulatory Sub-Committee. The chair of the Board will be the chair of the new Regulatory Sub-Committee, but receives Board chair fees only.

Annual Report 2021 83
Disclosures
Group structureChorus Limited has two wholly owned subsidiaries:
Chorus New Zealand Limited (CNZL) and Chorus LTI Trustee Limited (CLTL).
Chorus Limited
Chorus New Zealand Limited Chorus LTI Trustee Limited
Chorus Limited is the entity listed on the NZX and ASX1. It is also the borrowing entity under the group’s main financing arrangements and the entity which has partnered with the Crown for the UFB build.
CNZL undertakes (and is the contracting entity for) Chorus’ operating activities and is the guarantor of Chorus Limited’s borrowing. CNZL also employs all Chorus people. CNZL has its own constitution but its Board is the same as the Chorus Limited Board.
CLTL was incorporated in December 2014 as trustee for our long term incentive plan.
Disclosures in respect of CNZL and CLTL are set out in the “Subsidiaries” section on page 91.
Indemnities and insurance
Chorus indemnifies directors under our constitution for liabilities and costs they may incur for their acts or omissions as directors (including costs and expenses of defending actions for actual or alleged liability) to the maximum extent permitted by law. We have also entered into deeds of indemnity with each director under which:
• Chorus indemnifies the director for liabilities incurred intheir capacity as a director and as officers of other Choruscompanies.
• Directors are permitted to access company records whiledirectors and after they cease to hold office (subject tocertain conditions).
Deeds of indemnity have also been entered into on similar terms with certain senior employees for liabilities and costs they may incur for their acts or omissions as employees, directors of subsidiaries or as directors of non-Chorus companies in which Chorus holds interests.
We have a directors’ and officers’ liability insurance policy in place covering directors and senior employees for liability arising from their acts or omissions in their capacity as directors or employees on commercial terms. The policy does not cover dishonest, fraudulent, malicious or wilful acts or omissions.
Director changeJon Hartley resigned as director effective 31 August 2020. Kate Jorgensen's appointment as a director, effective 1 July 2020, was confirmed at the 2020 ASM on 6 November 2020.
Notes:1 Chorus Limited is no longer listed on Luxembourg stock exchange following repayments of our GBP 260 million bonds in April, 2020

Annual Report 202184
Director interests and trading
As at 30 June 2021, directors had a relevant interest (as defined in the Financial Markets Conduct Act 2013) in approximately 0.063% of shares as follows:
Current Directors
Interest as at 30 June 2021 Transactions during the reporting period
Director Shares Interest Number of shares
Nature of transaction Consideration Date
Patrick Strange 51,000 Beneficial owner as
beneficiary of Three Kings
Trust
10,000 On market acquisition $79,400.00 15 December 2020
Mark Cross 29,034 Beneficial owner as
beneficiary of Alpha
Investment Trust; power to
exercise voting rights and
acquire/dispose of financial
products as director of
trustee.
418 Acquisition of shares on
reinvestment of dividends
under Chorus’ dividend
reinvestment plan
$3,731.65 12 October 2020
Prue Flacks 43,344 Registered holder and
beneficial owner
18,900 On market acquisition $124,172.85 7 April 2021
352 Acquisition of shares on
reinvestment of dividends
under Chorus’ dividend
reinvestment plan
$3,142.44 12 October 2020
4,650 On market acquisition $39,278.85 3 September 2020
Murray Jordan 117,235 Registered holder and
beneficial owner of ordinary
shares as trustee and
beneficiary of Endeavour
Trust
1,686 Acquisition of shares on
reinvestment of dividends
under Chorus’ Dividend
Reinvestment Plan
$15,051.60 12 October 2020
Jack Matthews 10,295 Registered holder and
beneficial owner
148 Acquisition of shares on
reinvestment of dividends
under Chorus’ Dividend
Reinvestment Plan
$1,321.26 12 October 2020
Sue Bailey 25,000 Registered holder and
beneficial owner
5,000 On market acquisition $34,697.63 31 March 2021
5,000 On market acquisition $38,532.00 23 February 2021
798 On market acquisition $6,239.01 11 December 2020
4,202 On market acquisition $32,856.06 14 December 2020
5,000 On market acquisition $44,567.00 9 November 2020
Kate Jorgensen 6,237 Registered holder and
beneficial owner4,455 On market acquisition $29,000.00 12 April 2021
1,782 On market acquisition $14,610.36 1 December 2020

Annual Report 2021 85
As at 30 June 2021, directors had a relevant interest (as defined in the Financial Markets Conduct Act 2013) in approximately 0.091% of Chorus’ NZX bonds maturing December 2028 as follows:
Interest as at 30 June 2021 Transactions during the reporting period
Director Bonds Interest Number of bonds
Nature of transaction Consideration Date
Patrick Strange 340,000 Beneficial owner as beneficiary of Three Kings Trust
– – – –
Prue Flacks 15,000 Registered holder as trustee of CJH Bull Family Trust
– – – –
Murray Jordan 100,000 Registered holder and beneficial owner as trustee and beneficiary of Endeavour Trust
– – – –
Changes in Director interests
Patrick Strange None
Jon Hartley None1
Mark Cross Became a director of MPE GP Limited2. Became director of Cross Family Trustees Limited3. Retired as director of
MFL Mutual Fund Limited and Superannuation Investments Limited.4
Prue Flacks Retired as director of Bank of New Zealand5.
Murray Jordan Became a director of Asia Pacific Village Holdings6, Asia Pacific Village Group7, Metlifecare Limited8, Modern
Merchants Limited9, Strategic Interchange Limited10, Tetrad Corporation Limited.11
Jack Matthews Became a director of Mediaworks Outdoor Limited.12 Became a director of MW NZ Bureau Limited.13
Became a director of New Zealand Golf Network Limited.14 Ceased as a director of Bravo TV New Zealand Limited.15
Sue Bailey Became a director and member of CareFlight.16
Notes:1 Jon Hartley ceased to be a director as at 31 August 2020.2 From 17 June 2021.3 From 2 September 2019.4 From 31 March 2021.5 From 9 October 2020.6 From 3 November 2020.7 From 3 November 2020.8 From 3 November 2020.9 From 11 January 2019.10 From 11 January 2019.11 From 11 January 2019.12 From 1 January 2021.13 From 1 January 2021.14 From 1 July 2020.15 From 30 September 2020.16 From 2 September 2020.

Annual Report 202186
Director restrictions
No person who is an ‘associated person’ of a telecommunications services provider in New Zealand may be appointed or hold office as a director. NZX has granted a waiver to allow this restriction to be included in our constitution.
Securities and security holders
Ordinary shares
Chorus Limited’s shares are quoted on the NZX and on the ASX and trade under the ‘CNU’ ticker. There were 447,024,884 ordinary shares on issue at 30 June 2021. Each share confers on its holder the right to attend and vote at a shareholder meeting (including the right to cast one vote on a poll on any resolution).
Constitutional ownership restrictions
As part of the establishment of Chorus we inherited an obligation to obtain Crown approval prior to any person:
• Having a relevant interest in 10% or more of our shares; or
• Other than a New Zealand national, having a relevant interest in more than 49.9% of our shares.
On each request the Crown has provided approval, currently:
• L1 Capital Pty Ltd can hold a relevant interest in up to 15% of our shares.
• AMP Capital Holdings Limited can hold a relevant interest in up to 15% of our shares.
If our Board or the Crown determines there are reasonable grounds for believing a person has a relevant interest in our shares in excess of the ownership restrictions, our Board may, after following certain procedures, prohibit the exercise of voting rights (in which case the voting rights vest in our chair) and may force the sale of shares. Our Board may also decline to register a transfer of shares if it reasonably believes the transfer would breach the ownership restrictions.
NZX has granted waivers allowing our constitution to include the power of forfeiture, the restrictions on transferability of shares and our Board’s power to prohibit the exercise of voting rights relating to these ownership restrictions. ASX has also granted a waiver in respect of the refusal to register a transfer of shares which is or may be in breach of the ownership restrictions.
Takeovers protocol
We have established a takeovers protocol setting out the procedure to be followed if there is a takeover offer, including managing communications between insiders and the bidder and engagement of an independent adviser. The protocol includes the option of establishing an independent takeover committee, and the likely composition and implementation of that committee.
Shareholder distribution as at 30 June 2021
Holding Number of holders % of holders Total number of shares held
% of shares issued
1 to 999 11,095 52.01% 4,564,324 1.02%
1,000 to 4,999 6,827 32.01% 15,987,125 3.58%
5,000 to 9,999 1,898 8.9% 12,593,130 2.82%
10,000 to 99,999 1,432 6.71% 29,430,964 6.58%
100,000 and over 79 0.37% 384,449,341 86%
Total 21,331 100% 447,024,884 100%
Substantial holders
We have received substantial product holder notices from shareholders as follows:
Notices received as at 30 June 20211
Number of ordinary shares held
% of shares on issue
L1 Capital Pty Ltd 37,513,882 8.39%
The Vanguard Group, Inc. 33,540,564 7.50%
UniSuper Limited 28,785,874 6.48%
BNP Paribas SA 26,604,686 5.95%
Commonwealth Bank of Australia 22,589,629 5.05%
1. Notices received as at 30 June 2021.

Annual Report 2021 87
Twenty largest shareholders as at 30 June 2021
Rank Holder name Holding %
1 HSBC Custody Nominees (Australia) Limited 43,148,017 9.65
2 BNP Paribas Nominees Pty Ltd <Agency Lending DRP A/C> 35,674,913 7.98
3 JP Morgan Nominees Australia Limited 32,229,341 7.21
4 Citibank Nominees (New Zealand) Limited – NZCSD <CNOM90>* 32,131,874 7.19
5 HSBC Nominees (New Zealand) Limited – NZCSD <HKBN90>* 28,495,727 6.37
6 Citicorp Nominees Pty Limited 27,452,006 6.14
7 Accident Compensation Corporation – NZCSD <ACCI40>* 20,522,305 4.59
8 HSBC Nominees (New Zealand) Limited A/C State Street – NZCSD <HKBN45>* 16,473,593 3.69
9 JPMorgan Chase Bank NA NZ Branch-Segregated Clients Acct – NZCSD <CHAM24>* 13,350,509 2.99
10 National Nominees Limited 13,206,027 2.95
11 Forsyth Barr Custodians Limited <1-Custody> 10,771,679 2.41
12 HSBC Nominees A/C NZ Superannuation Fund Nominees Limited – NZCSD <SUPR40>* 8,216,515 1.84
13 BNP Paribas Nominees (NZ) Limited – NZCSD <BPSS40>* 7,975,461 1.78
14 National Nominees Limited <N A/C> 7,541,287 1.69
15 New Zealand Depository Nominee Limited <A/C 1 Cash Account> 7,370,172 1.65
16 JBWere (NZ) Nominees Limited <NZ Resident A/C> 7,288,035 1.63
17 ANZ Wholesale Australasian Share Fund – NZCSD <PNAS90>* 6,596,955 1.48
18 BNP Paribas Nominees (NZ) Limited – NZCSD <COGN40>* 5,630,812 1.26
19 Hobson Wealth Custodian Limited <Resident Cash Account> 4,143,016 0.93
20 National Nominees Limited – NZCSD <NNLZ90>* 3,953,550 0.88
* Held through New Zealand Central Securities Depository Limited (NZCSD). NZCSD provides a custodial service that allows electronic trading of securities by its members. As at 30 June 2021, 158,688,332 Chorus ordinary shares (or 35.5% of the ordinary shares on issue) were held through NZCSD.
American depositary receiptsAmerican Depositary Shares, each representing five shares and evidenced by American Depositary Receipts, are not listed but are traded on the over-the-counter market in the United States under the ticker ‘CHRYY’ with Bank of New York Mellon as depositary bank. As at 30 June 2021 Chorus had 1.1 million ADRs on issue.

Annual Report 202188
Twenty largest bondholders (December 2027) as at 30 June 2021
Rank Holder name Holding %
1 BNP Paribas Nominees (NZ) Limited – NZCSD <BPSS40>* 26,801,000 13.40
2 Forsyth Barr Custodians Limited <1-Custody> 25,954,000 12.98
3 FNZ Custodians Limited 21,758,000 10.88
4 Custodial Services Limited <A/C 4> 13,744,000 6.87
5 National Nominees Limited – NZCSD <NNLZ90>* 12,836,000 6.42
6 HSBC Nominees (New Zealand) Limited – NZCSD <HKBN90>* 8,750,000 4.38
7 Citibank Nominees (New Zealand) Limited – NZCSD <CNOM90>* 8,285,000 4.14
8 ANZ Bank New Zealand Limited – NZCSD <NBNZ40>* 8,131,000 4.07
9 Pin Twenty Limited <Kintyre A/C> 7,000,000 3.50
10 Custodial Services Limited <A/C 3> 6,195,000 3.10
11 Custodial Services Limited <A/C 2> 6,086,000 3.04
12 Westpac Banking Corporate NZ Financial Markets Group – NZCSD <WPAC40>* 6,000,000 3.00
13 Custodial Services Limited <A/C 1> 5,317,000 2.66
14 Mint Nominees Limited – NZCSD <NZP440>* 4,300,000 2.15
15 Commonwealth Bank Of Australia – NZCSD <CBAANZ>* 3,877,000 1.94
16 Custodial Services Limited <A/C 18> 3,536,000 1.77
17 Risk Reinsurance Limited 2,865,000 1.43
18 Tea Custodians Limited Client Property Trust Account – NZCSD <TEAC40>* 2,250,000 1.13
19 JBWere (NZ) Nominees Limited <NZ Resident A/C> 2,140,000 1.07
20= Neurological Foundation Of New Zealand Incorporated 2,000,000 1.00
20= NZPT Custodians (Grosvenor) Limited – NZCSD <NZPG40>* 2,000,000 1.00
Twenty largest bondholders (December 2028) as at 30 June 2021
Rank Holder name Holding %
1 Forsyth Barr Custodians Limited <1-Custody> 68,935,000 13.79
2 JBWere (NZ) Nominees Limited <NZ Resident A/C> 41,974,000 8.39
3 ANZ Custodial Services New Zealand Limited – NZCSD <PBNK90>* 41,903,000 8.38
4 Hobson Wealth Custodian Limited <Resident Cash Account> 38,046,000 7.61
5 Custodial Services Limited <A/C 4> 30,818,000 6.16
6 HSBC Nominees (New Zealand) Limited O/A Euroclear Bank – NZCSD <HKBN95>* 30,000,000 6.00
7 FNZ Custodians Limited 25,433,000 5.09
8 Custodial Services Limited <A/C 2> 17,332,000 3.47
9 Custodial Services Limited <A/C 3> 17,102,000 3.42
10 JBWere (NZ) Nominees Limited <Res Inst A/C> 17,100,000 3.42
11 BNP Paribas Nominees (NZ) Limited – NZCSD <COGN40>* 15,819,000 3.16
12 Custodial Services Limited <A/C 1> 9,464,000 1.89
13 Custodial Services Limited <A/C 18> 7,951,000 1.59
14 Forsyth Barr Custodians Limited <Account 1 E> 6,791,000 1.36
15 ANZ Wholesale NZ Fixed Interest Fund – NZCSD* 6,089,000 1.22
16 Generate Kiwisaver Public Trust Nominees Limited <NZCSD> <NZPT44>* 5,750,000 1.15
17 Tea Custodians Limited Client Property Trust Account – NZCSD <TEAC40>* 4,844,000 0.97
18 JBWere (NZ) Nominees Limited <44625 A/C> 4,600,000 0.92
19 HSBC Nominees (New Zealand) Limited A/C State Street – NZCSD <HKBN45>* 4,250,000 0.85
20 Investment Custodial Services Limited <A/C C> 4,230,000 0.85
* Held through New Zealand Central Securities Depository Limited (NZCSD).

Annual Report 2021 89
Twenty largest bondholders (December 2030) as at 30 June 2021
Rank Holder name Holding %
1 Accident Compensation Corporation – NZCSD <ACCI40>* 108,000,000 54.00
2 ANZ Custodial Services New Zealand Limited – NZCSD <PBNK90>* 22,670,000 11.34
3 Citibank Nominees (New Zealand) Limited – NZCSD <CNOM90>* 10,000,000 5.00
4 ANZ Fixed Interest Fund – NZCSD <PNLI90>* 6,761,000 3.38
5 BNP Paribas Nominees (NZ) Limited – NZCSD <COGN40>* 5,630,000 2.82
6 HSBC Nominees (New Zealand) Limited O/A Euroclear Bank – NZCSD <HKBN95>* 5,000,000 2.50
6 Queen Street Nominees ACF Pie Funds – NZCSD* 5,000,000 2.50
8 Forsyth Barr Custodians Limited <1-Custody> 4,766,000 2.38
9 HSBC Nominees (New Zealand) Limited – NZCSD <HKBN90>* 4,690,000 2.35
10 FNZ Custodians Limited 3,810,000 1.91
11 Custodial Services Limited <A/C 4> 3,296,000 1.65
12 Westpac Banking Corporate NZ Financial Markets Group – NZCSD <WPAC40>* 2,132,000 1.07
13 Custodial Services Limited <A/C 2> 1,970,000 0.99
14 Custodial Services Limited <A/C 3> 1,536,000 0.77
15 Custodial Services Limited <A/C 1> 1,475,000 0.74
16 Custodial Services Limited <A/C 18> 1,245,000 0.62
17 Forsyth Barr Custodians Limited <Account 1 E> 1,188,000 0.59
18 Hobson Wealth Custodian Limited <Resident Cash Account> 1,055,000 0.53
19 Investment Custodial Services Limited <A/C C> 910,000 0.46
20 Commonwealth Bank Of Australia – NZCSD <CBAANZ>* 864,000 0.43
* Held through New Zealand Central Securities Depository Limited (NZCSD).
Debt listingsChorus Limited has the following bonds on issue:
• $200 million bonds traded on the NZX debt market (the NZDX) maturing December 2027;
• $500 million bonds traded on the NZX debt market maturing December 2028
• $200 million bonds traded on the NZX debt market maturing December 2030;
• EUR 500 million EMTNs traded on the ASX maturing October 2023; and
• EUR 300 million EMTNs traded on the ASX, maturing December 2026.

Annual Report 202190
NZX bondholder distribution as at 30 June 2021
December 2027 maturity
Holding Number of holders % of holders Total number of bonds held % of bonds issued
5,000 to 9,999 14 6.8% 89,000 0.04%
10,000 to 99,999 140 67.96% 3,916,000 1.96%
100,000 and over 52 25.24% 195,995,000 98%
Total 206 100% 200,000,000 100%
December 2028 maturity
Holding Number of holders % of holders Total number of bonds held % of bonds issued
5,000 to 9,999 82 5.96% 492,000 0.1%
10,000 to 99,999 1,127 81.84% 34,055,000 6.81%
100,000 and over 168 12.2% 465,453,000 93.09%
Total 1,377 100% 500,000,000 100%
December 2030 maturity
Holding Number of holders % of holders Total number of bonds held % of bonds issued
5,000 to 9,999 22 9.57% 145,000 0.07%
10,000 to 99,999 184 80% 4,740,000 2.37%
100,000 and over 24 10.43% 195,115,000 97.56%
Total 230 100% 200,000,000 100%
Unquoted securities
Crown Infrastructure Partners (CIP) Securities
The terms of issue for the CIP1 and CIP2 securities are set out in the subscription agreements between Chorus Limited and CIP.
These terms are summarised in note 6 of our Financial Statements and on our website at www.chorus.co.nz/reports.
Security Number issued in the year ended 30 June 2021
Total on issue at 30 June 2021
Holder Percentage held
CIP1 equity securities – 462,052,071 CIP 100%
CIP1 debt securities – 462,052,071 CIP 100%
CIP1 equity warrants 461,850 14,678,063 CIP 100%
CIP2 equity securities 122,132,406 264,763,451 CIP 100%

Annual Report 2021 91
Other disclosures
New NZX listing rules
NZX updated its listing rules from 1 January 2020.
NZX waivers
On 28 March 2019 Chorus applied for the continuation of existing and still required waivers and rulings. On 3 April 2020 a waiver from NZX listing rule 2.3.2, 4.1.1, 4.1.2, 4.2.1, 4.14, 6.6.1, 8.1.5 and a ruling from NZX on listing rule 4.9.1 were granted.
A summary of all waivers relied on by Chorus in the 12 months ending 30 June 2021 is available on our website at www.chorus.co.nz/investor-info.
Non-standard designation
NZX has attached a ‘non-standard’ designation to Chorus Limited because of the ownership restrictions in our constitution (described above).
ASX disclosures
Chorus Limited and its subsidiaries are incorporated in New Zealand.
Chorus Limited is not subject to Chapters 6, 6A, 6B and 6C of the Australian Corporations Act 2001 dealing with the acquisition of shares (including substantial shareholdings and takeovers).
Our constitution contains limitations on the acquisition of securities, as described above.
For the purposes of ASX listing rule 1.15.3 Chorus Limited continues to comply with the NZX listing rules.
Registration as a foreign company
Chorus Limited has registered with the Australian Securities and Investments Commission as a foreign company and has been issued an Australian Registered Body Number (ARBN) of 152 485 848.
Net tangible assets per security
As at 30 June 2021, consolidated net tangible assets per share was $1.45 (30 June 2020: $1.39).
Net tangible assets per share is a non-GAAP financial
measure and is not prepared in accordance with NZ IFRS.
Revenue from ordinary activities and net profit
In the year ended 30 June 2021:
• Revenue from ordinary activities decreased 1.2% to $947 million (30 June 2020: $959 million); and
• Profit from ordinary activities after tax, and net profit, attributable to shareholders decreased 9.6% to $47 million (30 June 2020: $52 million)
Subsidiaries
Chorus New Zealand Limited (CNZL)
Directors as at 30 June 2021: Patrick Strange, Mark Cross, Prue Flacks, Murray Jordan, Jack Matthews, Sue Bailey, Kate Jorgensen.
Jon Hartley resigned as a director from CNZL during the year to 30 June 2021.
Current CNZL directors are also Chorus Limited directors and do not receive any remuneration in their capacity as CNZL directors.
Chorus LTI Trustee Limited (CLTL)
Directors as at 30 June 2021: Prue Flacks, Murray Jordan and Sue Bailey.
Current and former directors of CLTL did not receive any remuneration in their capacity as directors of CLTL.
Other subsidiaries
Chorus Limited has no other subsidiaries.

Annual Report 202192
Glossary
Backbone network Fibre cabling and other shared network elements required either in the common areas of multi-dwelling units to connect individual apartments/offices, or to serve premises located along rights of way.
Backhaul The portion of the network that links local exchanges to other exchanges or retail service provider networks.
Baseband A technology neutral voice input service that can be bundled with a broadband product or provided on a standalone basis.
Board Chorus Limited’s Board of Directors.
Building block model
A methodology used for regulating monopoly utilities. Under BBM a regulated supplier’s allowed revenue is equal to the sum of the underlying components or ‘building blocks’, consisting of the return on capital, depreciation, operating expenditure and various other components such as tax.
Chorus Chorus Limited and subsidiaries.
CIP Crown Infrastructure Partners, the Government organisation that manages New Zealand’s rollout of Ultra-Fast Broadband infrastructure.
Commission Commerce Commission – the independent Crown Entity whose responsibilities include overseeing the regulation of the telecommunications sector.
Constitution Chorus Limited’s Constitution.
Direct fibre access Also known as ‘dark’ fibre, a fibre service that provides a point to point fibre connection and can be used to deliver backhaul connections to mobile sites.
Director A director of Chorus Limited.
EBITDA Earnings before interest, income tax, depreciation and amortisation.
EMTN European Medium Term Notes.
FY Financial year – twelve months ended 30 June. e.g. FY21 is from 1 July 2020 to 30 June 2021.
Gbps Gigabits per second. A measure of the average rate of data transfer.
Gigabit The equivalent of 1 billion bits. Gigabit Ethernet provides data transfer rates of about 1 gigabit per second.
GPON Gigabit Passive Optical Network.
IT Information Technology.
Layer 2 The data link layer, including broadband electronics, within the Open Systems Interconnection model. Layer 1 is the physical cables and co-location space.
Mbps Megabits per second – a measure of the average rate of data transfer.
NZ IFRS International Financial Reporting Standards – the rules that the financial statements have to be prepared by.
P2P Where two parties or devices are connected point-to-point via fibre.
RAB Regulatory Asset Base refers to the value of total investment by a regulated utility in the assets which will generate revenues over time.
RBI Rural Broadband Initiative – refers to the Government programme to improve and enhance broadband coverage in rural areas between 2011 and 2016.
Share Means an ordinary share in Chorus.
TSO Telecommunications Services Obligation – a universal service obligation under which Chorus must maintain certain coverage and service on the copper network.
TSR Total shareholder return.
UFB Ultra-Fast Broadband refers to the Government programme to build a fibre to the premises network to about 85% of New Zealanders. UFB1 refers to the original phase of the rollout to 75% of New Zealanders. UFB2 and UFB2+ were subsequent phases announced in 2017.
VDSL Very High Speed Digital Subscriber Line – a copper-based technology that provides a better broadband connection than ADSL.

Annual Report 2021 93
Disclaimer
This annual report:
• May contain forward looking statements. These statements are not guarantees or predictions of future performance. They involve known and unknown risks, uncertainties and other factors, many of which are beyond Chorus’ control, and which may cause actual results to differ materially from those expressed in the statements contained in this annual report.
• Includes statements relating to past performance. These should not be regarded as reliable indicators of future performance.
• Is current at its release date. Except as required by law or the NZX and ASX listing rules, Chorus is not under any obligation to update this annual report or the information in it at any time, whether as a result of new information, future events or otherwise.
• Contains non-GAAP financial measures, including EBITDA. These measures may differ from similarly titled measures used by other companies because they are not defined by GAAP. Although Chorus considers those measures provide useful information they should not be used in substitution for, or isolation of, Chorus’ audited financial statements.
• May contain information from third parties Chorus believes reliable. However, no representations or warranties are made as to the accuracy or completeness of such information.
• Should be read in the wider context of material previously published by Chorus and released through the NZX and ASX.
• Does not constitute investment advice or an offer or invitation to purchase Chorus securities.

chorus.co.nz
DirectoryRegistrars
NEW ZEALAND Computershare Investor Services Limited Private Bag 92119, Victoria Street West Auckland 1142, New Zealand P: +64 9 488 8777 F: +64 9 488 8787 E: [email protected] investorcentre.com/nz
AUSTRALIA Computershare Investor Services Pty Limited GPO Box 3329, Melbourne 3001, Australia FP: 1 800 501 366 F: +61 3 9473 2500 E: [email protected] investorcentre.com/nz
Registered Offices
NEW ZEALAND Level 10, 1 Willis Street Wellington, New Zealand P: +64 800 600 100
AUSTRALIA C/– Allens Corporate Services Pty Limited Level 28, Deutsche Bank Place, 126 Phillip Street, Sydney, NSW 2000, Australia P: +61 2 9230 4000
ADR Depository
BNY Mellon Shareowner Services PO Box 505000, Louisville, KY 40233-5000 United States of America P: US domestic calls (toll free) 1 888 269 2377P: International calls +1 201 680 6825E: [email protected] https://www-us.computershare.com/investor ARBN 152 485 848