Embed Size (px)
Citation preview
1
Honda Motor Co., Ltd.May 14, 2021
FY21 Financial Results
2
Contents
• Outline of FY21 Financial Results and FY22 Financial Forecasts
• FY21 Financial Resultsand FY22 Financial Forecasts
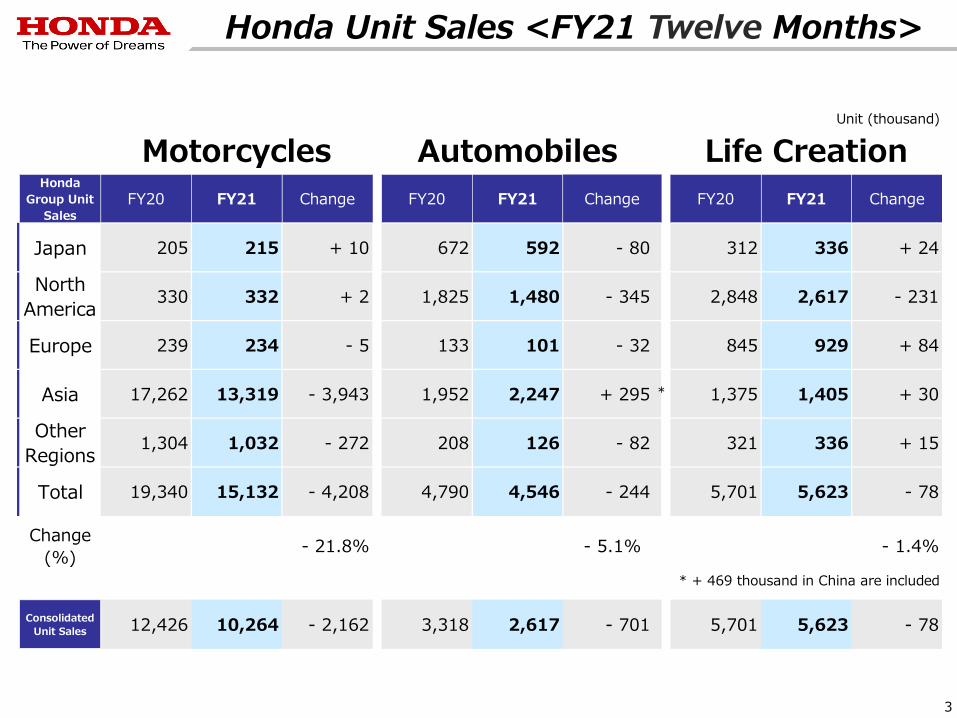
Honda Unit Sales <FY21 Twelve Months>
3
Unit (thousand)
Honda
Group Unit
Sales
FY20 FY21 Change FY20 FY21 FY20 FY21 Change
Japan 205 215 + 10 672 592 - 80 312 336 + 24
North
America330 332 + 2 1,825 1,480 - 345 2,848 2,617 - 231
Europe 239 234 - 5 133 101 - 32 845 929 + 84
Asia 17,262 13,319 - 3,943 1,952 2,247 + 295 * 1,375 1,405 + 30
Other
Regions1,304 1,032 - 272 208 126 - 82 321 336 + 15
Total 19,340 15,132 - 4,208 4,790 4,546 - 244 5,701 5,623 - 78
Change
(%)- 21.8% - 1.4%
Consolidated
Unit Sales 12,426 10,264 - 2,162 3,318 2,617 - 701 5,701 5,623 - 78
- 5.1%
* + 469 thousand in China are included
Change
Life CreationAutomobilesMotorcycles
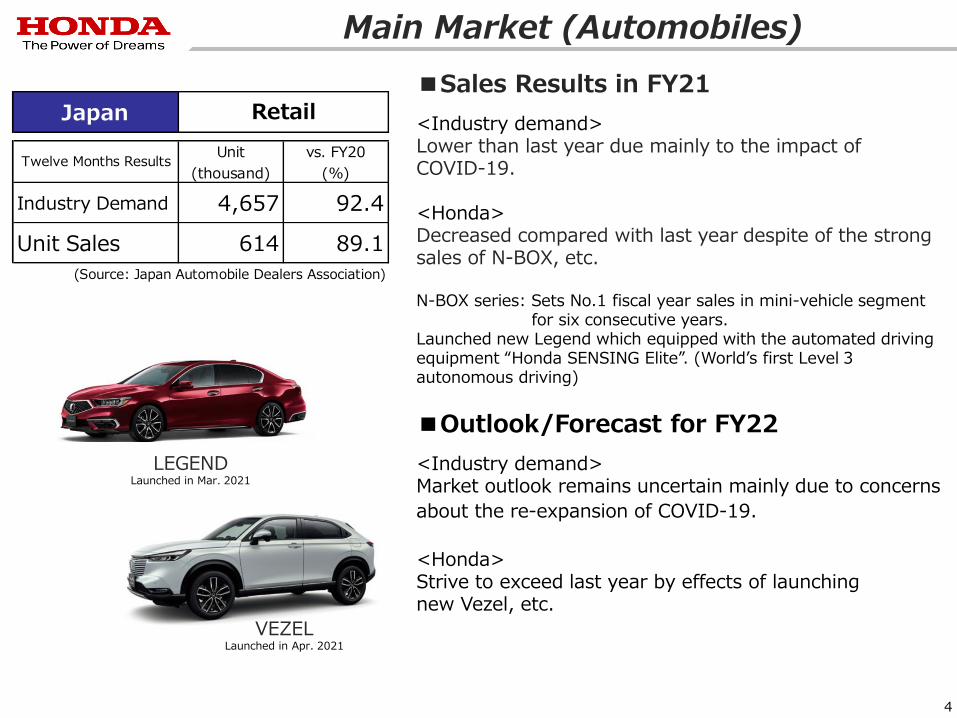
■Sales Results in FY21
<Industry demand>Lower than last year due mainly to the impact of COVID-19.
<Honda>Decreased compared with last year despite of the strong sales of N-BOX, etc.
N-BOX series: Sets No.1 fiscal year sales in mini-vehicle segmentfor six consecutive years.
Launched new Legend which equipped with the automated driving equipment “Honda SENSING Elite”. (World’s first Level 3 autonomous driving)
■Outlook/Forecast for FY22
<Industry demand>Market outlook remains uncertain mainly due to concerns
about the re-expansion of COVID-19.
<Honda>Strive to exceed last year by effects of launching new Vezel, etc.
Main Market (Automobiles)
Japan
Twelve Months ResultsUnit
(thousand)
vs. FY20
(%)
Industry Demand 4,657 92.4
Unit Sales 614 89.1
(Source: Japan Automobile Dealers Association)
Retail
4
LEGENDLaunched in Mar. 2021
VEZELLaunched in Apr. 2021
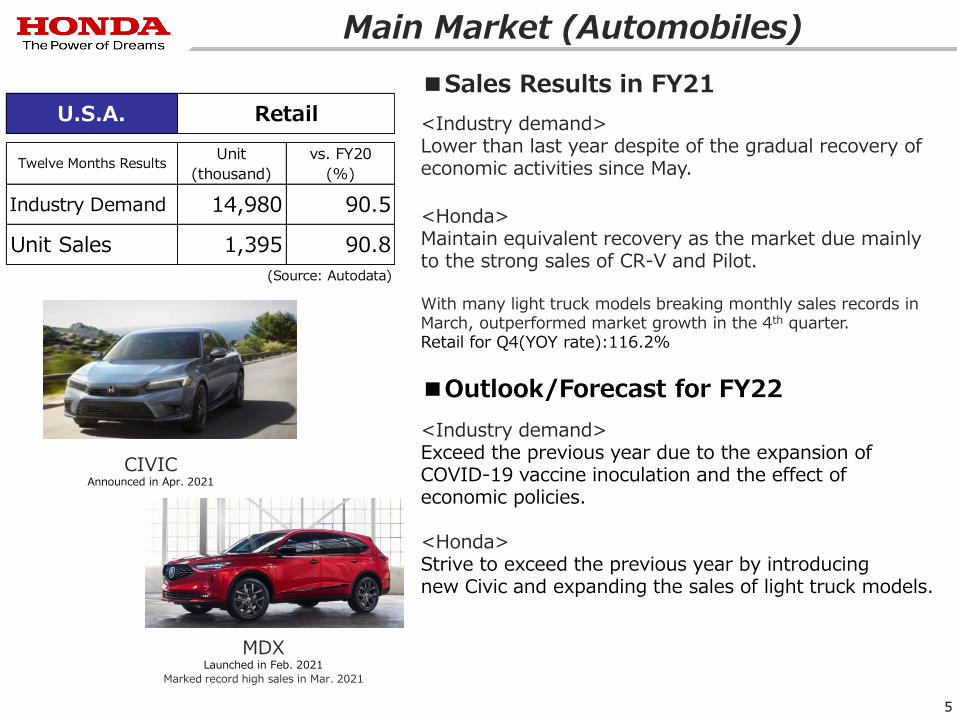
■Sales Results in FY21
<Industry demand>Lower than last year despite of the gradual recovery of economic activities since May.
<Honda>Maintain equivalent recovery as the market due mainlyto the strong sales of CR-V and Pilot.
With many light truck models breaking monthly sales records in March, outperformed market growth in the 4th quarter.Retail for Q4(YOY rate):116.2%
■Outlook/Forecast for FY22
<Industry demand> Exceed the previous year due to the expansion of COVID-19 vaccine inoculation and the effect of economic policies.
<Honda> Strive to exceed the previous year by introducing new Civic and expanding the sales of light truck models.
Main Market (Automobiles)
U.S.A.
Twelve Months ResultsUnit
(thousand)
vs. FY20
(%)
Industry Demand 14,980 90.5
Unit Sales 1,395 90.8
(Source: Autodata)
Retail
5
CIVICAnnounced in Apr. 2021
MDXLaunched in Feb. 2021
Marked record high sales in Mar. 2021
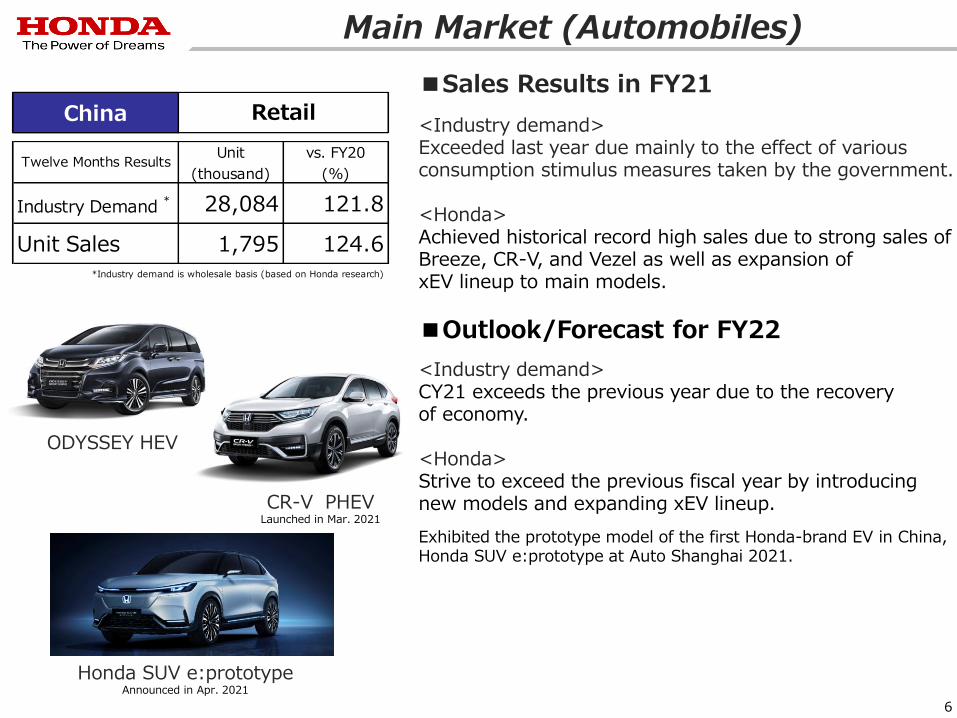
■Sales Results in FY21
<Industry demand>Exceeded last year due mainly to the effect of variousconsumption stimulus measures taken by the government.
<Honda>Achieved historical record high sales due to strong sales of Breeze, CR-V, and Vezel as well as expansion of xEV lineup to main models.
■Outlook/Forecast for FY22
<Industry demand>CY21 exceeds the previous year due to the recoveryof economy.
<Honda>Strive to exceed the previous fiscal year by introducing new models and expanding xEV lineup.
Exhibited the prototype model of the first Honda-brand EV in China, Honda SUV e:prototype at Auto Shanghai 2021.
Main Market (Automobiles)
China
Twelve Months ResultsUnit
(thousand)
vs. FY20
(%)
Industry Demand * 28,084 121.8
Unit Sales 1,795 124.6
Retail
*Industry demand is wholesale basis (based on Honda research)
6
Honda SUV e:prototypeAnnounced in Apr. 2021
ODYSSEY HEV
CR-V PHEVLaunched in Mar. 2021
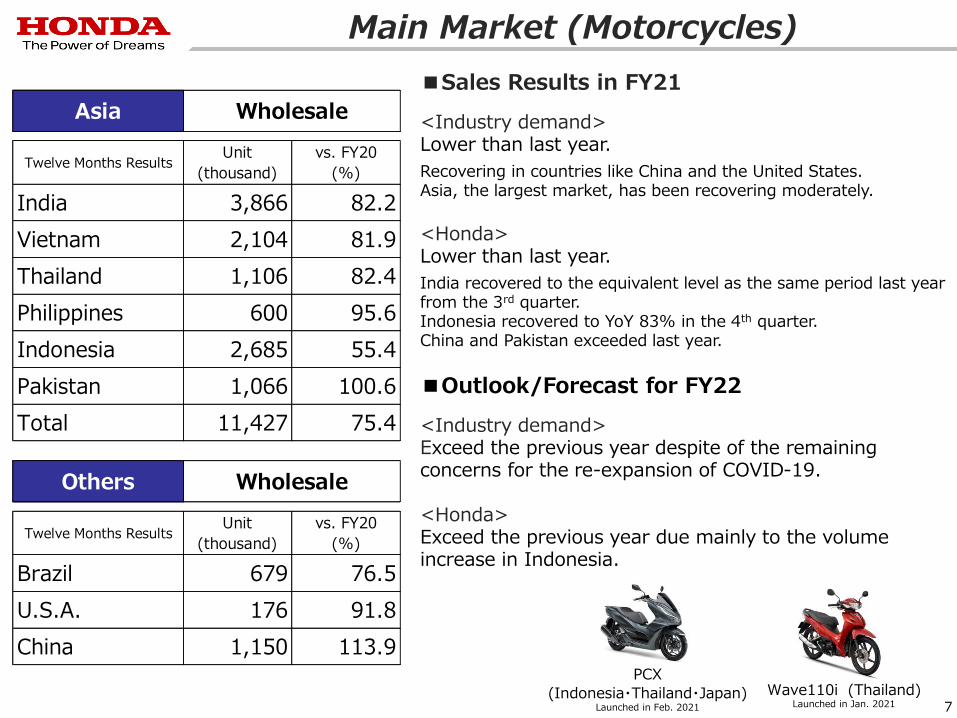
■Sales Results in FY21
<Industry demand>Lower than last year.
Recovering in countries like China and the United States. Asia, the largest market, has been recovering moderately.
<Honda>Lower than last year.
India recovered to the equivalent level as the same period last year from the 3rd quarter.Indonesia recovered to YoY 83% in the 4th quarter.China and Pakistan exceeded last year.
■Outlook/Forecast for FY22
<Industry demand>Exceed the previous year despite of the remaining concerns for the re-expansion of COVID-19.
<Honda>Exceed the previous year due mainly to the volume increase in Indonesia.
Main Market (Motorcycles)
Asia
Twelve Months ResultsUnit
(thousand)
vs. FY20
(%)
India 3,866 82.2
Vietnam 2,104 81.9
Thailand 1,106 82.4
Philippines 600 95.6
Indonesia 2,685 55.4
Pakistan 1,066 100.6
Total 11,427 75.4
Others
Twelve Months ResultsUnit
(thousand)
vs. FY20
(%)
Brazil 679 76.5
U.S.A. 176 91.8
China 1,150 113.9
Wholesale
Wholesale
Wave110i (Thailand)Launched in Jan. 2021 7
PCX
(Indonesia・Thailand・Japan)Launched in Feb. 2021
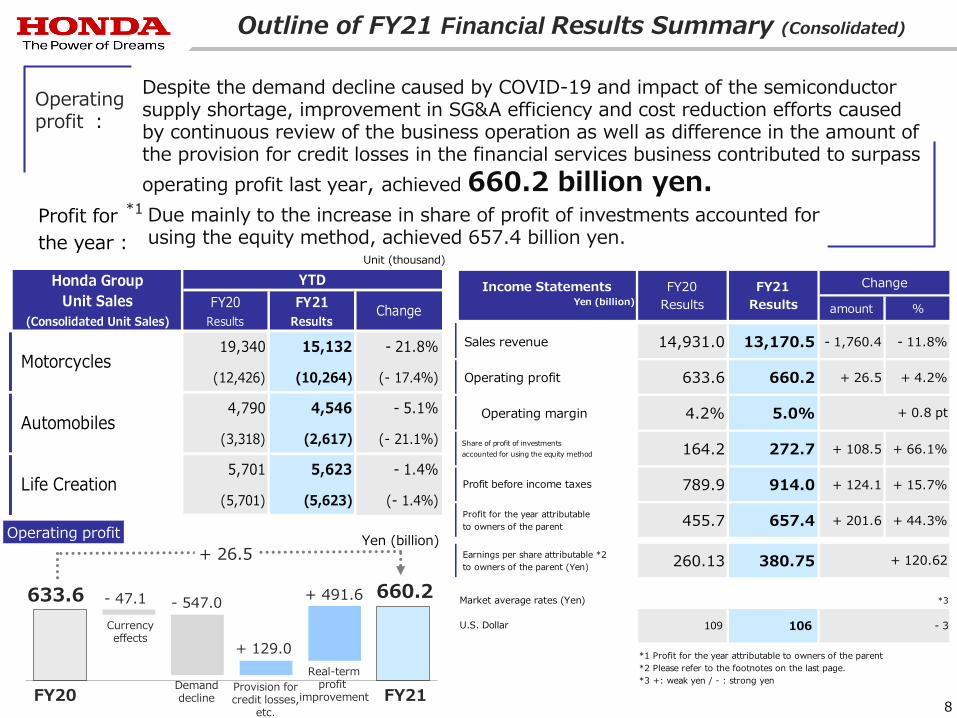
Despite the demand decline caused by COVID-19 and impact of the semiconductor supply shortage, improvement in SG&A efficiency and cost reduction efforts caused by continuous review of the business operation as well as difference in the amount of the provision for credit losses in the financial services business contributed to surpass
operating profit last year, achieved 660.2 billion yen.Due mainly to the increase in share of profit of investments accounted forusing the equity method, achieved 657.4 billion yen.
8
Operating profit :
Outline of FY21 Financial Results Summary (Consolidated)
633.6 660.2
+ 26.5
Demand decline FY20 FY21
- 47.1 - 547.0
+ 129.0
+ 491.6
Provision for credit losses,
etc.
*1
FY20 FY21
(Consolidated Unit Sales) Results Results
19,340 15,132 - 21.8%
(12,426) (10,264) (- 17.4%)
4,790 4,546 - 5.1%
(3,318) (2,617) (- 21.1%)
5,701 5,623 - 1.4%
(5,701) (5,623) (- 1.4%)
Motorcycles
Automobiles
Life Creation
Honda Group
Unit Sales
YTD
Change
Income Statements FY20 FY21Yen (billion) Results Results amount %
Sales revenue 14,931.0 13,170.5 - 1,760.4 - 11.8%
Operating profit 633.6 660.2 + 26.5 + 4.2%
Operating margin 4.2% 5.0%
Share of profit of investments
accounted for using the equity method 164.2 272.7 + 108.5 + 66.1%
Profit before income taxes 789.9 914.0 + 124.1 + 15.7%
Profit for the year attributable
to owners of the parent 455.7 657.4 + 201.6 + 44.3%
Earnings per share attributable *2
to owners of the parent (Yen) 260.13 380.75
Market average rates (Yen) *3
*1 Profit for the year attributable to owners of the parent
*2 Please refer to the footnotes on the last page.
*3 +: weak yen / - : strong yen
106 - 3
+ 0.8 pt
+ 120.62
109U.S. Dollar
Change
Profit for
the year :Unit (thousand)
Yen (billion)Operating profit
Currencyeffects
Real-termprofit
improvement
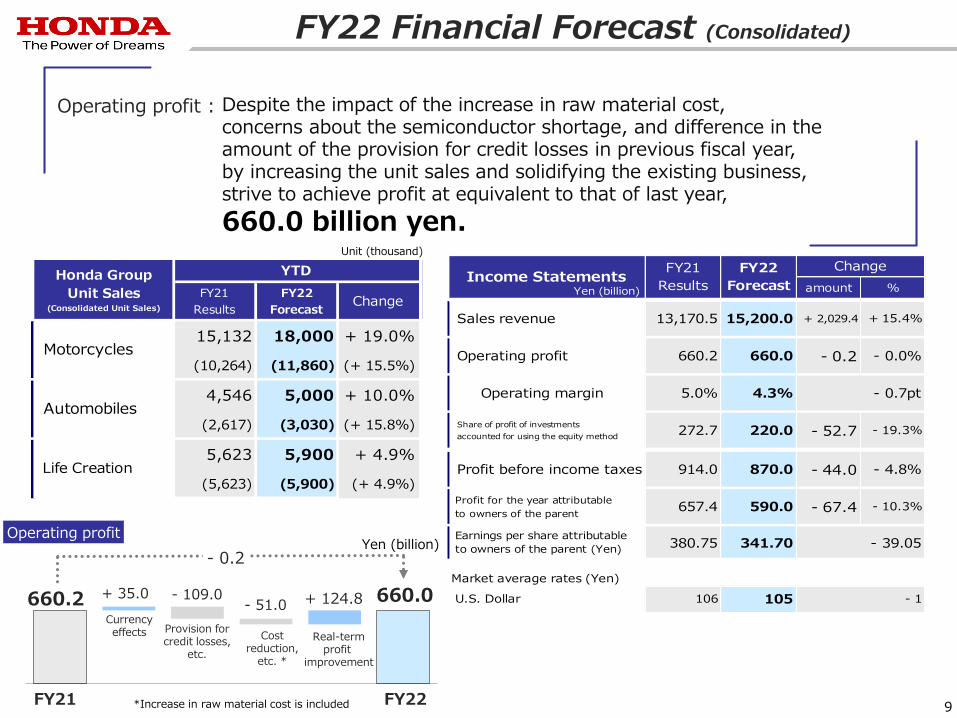
FY22 Financial Forecast (Consolidated)
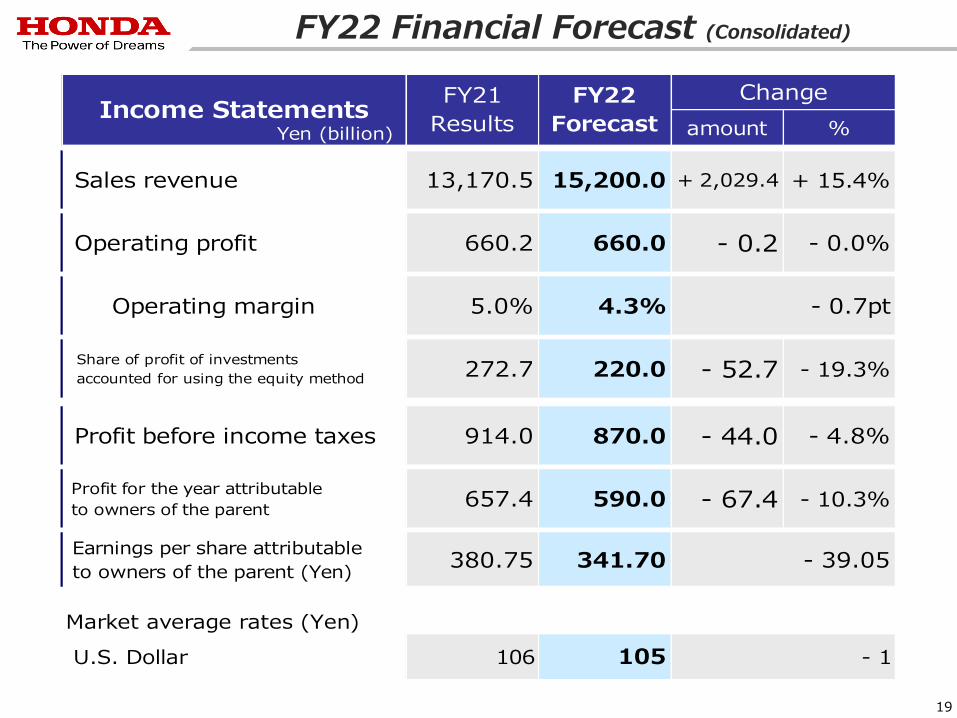
Despite the impact of the increase in raw material cost, concerns about the semiconductor shortage, and difference in the amount of the provision for credit losses in previous fiscal year, by increasing the unit sales and solidifying the existing business, strive to achieve profit at equivalent to that of last year,
660.0 billion yen.
9
Operating profit :
営業利益
FY21
Results
FY22
ForecastChange
15,132 18,000 + 19.0%
(10,264) (11,860) (+ 15.5%)
4,546 5,000 + 10.0%
(2,617) (3,030) (+ 15.8%)
5,623 5,900 + 4.9%
(5,623) (5,900) (+ 4.9%) Life Creation
Honda Group
Unit Sales(Consolidated Unit Sales)
YTD
Motorcycles
Automobiles
amount %
Sales revenue 13,170.5 15,200.0 + 2,029.4 + 15.4%
Operating profit 660.2 660.0 - 0.2 - 0.0%
Operating margin 5.0% 4.3% - 0.7pt
Share of profit of investments
accounted for using the equity method272.7 220.0 - 52.7 - 19.3%
Profit before income taxes 914.0 870.0 - 44.0 - 4.8%
Profit for the year attributable
to owners of the parent657.4 590.0 - 67.4 - 10.3%
Earnings per share attributable
to owners of the parent (Yen) 380.75 341.70 - 39.05
Market average rates (Yen)
Income StatementsChange
U.S. Dollar 106 - 1105
FY21
Results
FY22
ForecastYen (billion)
660.2 660.0
- 0.2
FY21 FY22
+ 35.0 - 109.0- 51.0 + 124.8
Cost reduction,
etc. *
Currencyeffects
Operating profit
Real-termprofit
improvement
Unit (thousand)
Provision for credit losses,
etc.
Yen (billion)
*Increase in raw material cost is included
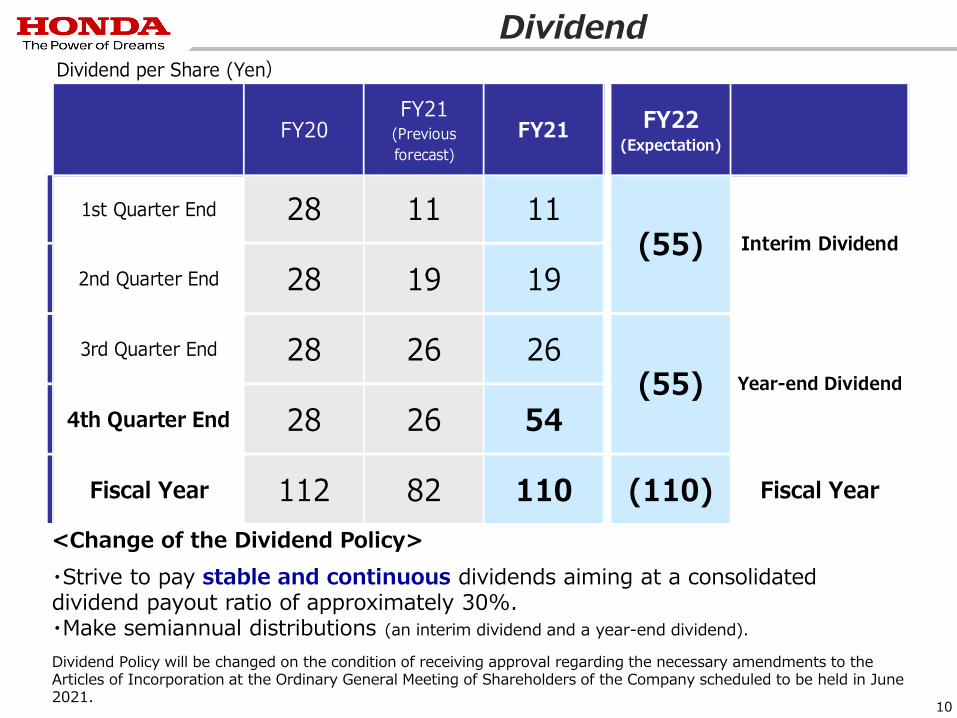
DividendDividend per Share (Yen)
1st Quarter End 28 11 11
2nd Quarter End 28 19 19
3rd Quarter End 28 26 26
4th Quarter End 28 26 54
Fiscal Year 112 82 110 (110) Fiscal Year
(55) Interim Dividend
(55) Year-end Dividend
FY20 FY21 FY22(Expectation)
FY21(Previous
forecast)
10
<Change of the Dividend Policy>
・Strive to pay stable and continuous dividends aiming at a consolidated dividend payout ratio of approximately 30%.・Make semiannual distributions (an interim dividend and a year-end dividend).
Dividend Policy will be changed on the condition of receiving approval regarding the necessary amendments to the Articles of Incorporation at the Ordinary General Meeting of Shareholders of the Company scheduled to be held in June 2021.
11
Contents
• Outline of FY21 Financial Results and FY22 Financial Forecasts
• FY21 Financial Resultsand FY22 Financial Forecasts
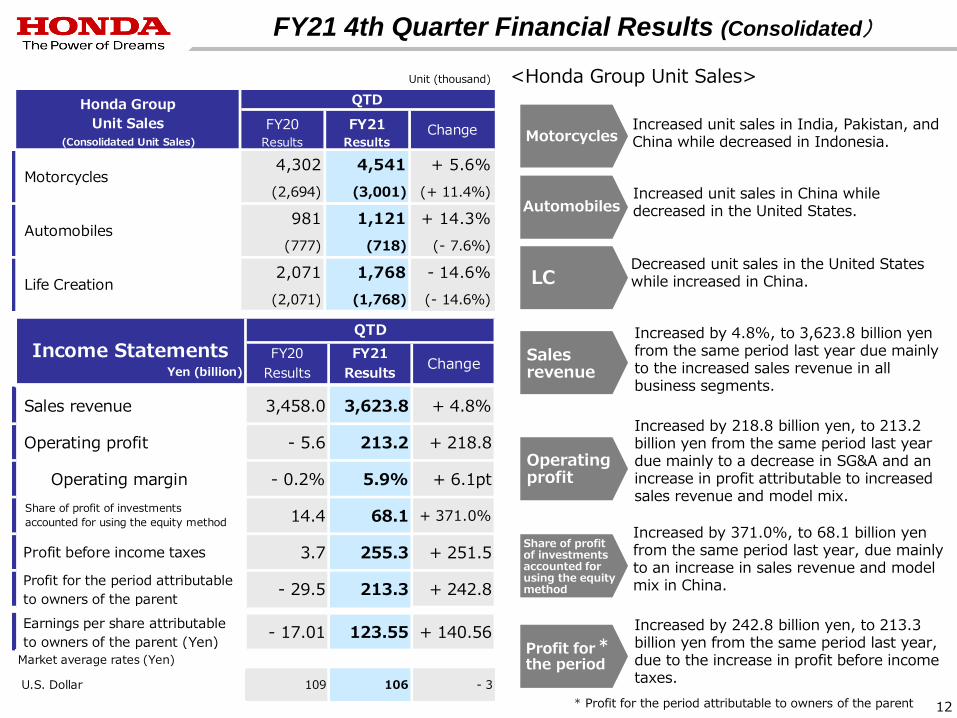
FY21 4th Quarter Financial Results (Consolidated)
<Honda Group Unit Sales>
Increased by 4.8%, to 3,623.8 billion yen from the same period last year due mainly to the increased sales revenue in all business segments.
Increased by 218.8 billion yen, to 213.2 billion yen from the same period last year due mainly to a decrease in SG&A and an increase in profit attributable to increased sales revenue and model mix.
Increased by 242.8 billion yen, to 213.3 billion yen from the same period last year, due to the increase in profit before income taxes.
Increased by 371.0%, to 68.1 billion yen from the same period last year, due mainly to an increase in sales revenue and model mix in China.
Increased unit sales in India, Pakistan, and China while decreased in Indonesia.
Increased unit sales in China while decreased in the United States.
Decreased unit sales in the United States while increased in China.
12
LC
Motorcycles
Automobiles
Sales revenue
Operating profit
Share of profit of investments accounted for using the equity method
Profit for the period
* Profit for the period attributable to owners of the parent
*
FY20 FY21(Consolidated Unit Sales) Results Results
4,302 4,541 + 5.6%
(2,694) (3,001) (+ 11.4%)
981 1,121 + 14.3%
(777) (718) (- 7.6%)
2,071 1,768 - 14.6%
(2,071) (1,768) (- 14.6%)
Honda Group
Unit Sales
QTD
Change
Motorcycles
Automobiles
Life Creation
Unit (thousand)
FY20 FY21
Yen (billion) Results Results
Sales revenue 3,458.0 3,623.8 + 4.8%
Operating profit - 5.6 213.2 + 218.8
Operating margin - 0.2% 5.9% + 6.1pt
Share of profit of investments
accounted for using the equity method 14.4 68.1 + 371.0%
Profit before income taxes 3.7 255.3 + 251.5
Profit for the period attributable
to owners of the parent- 29.5 213.3 + 242.8
Earnings per share attributable
to owners of the parent (Yen)- 17.01 123.55 + 140.56
Market average rates (Yen)
U.S. Dollar 109 106 - 3
Income StatementsQTD
Change
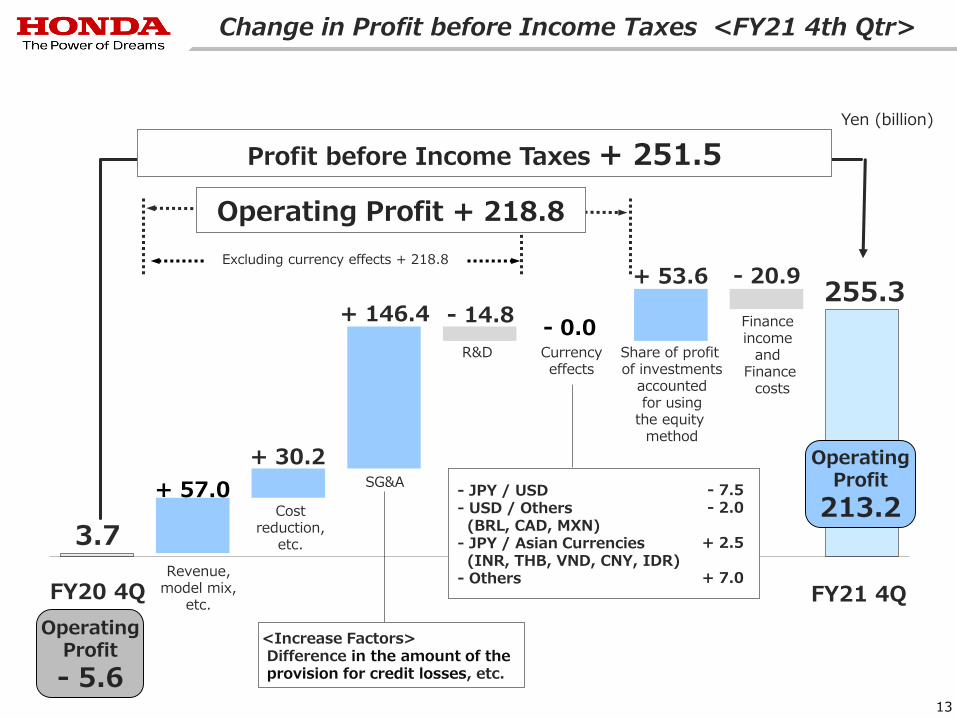
Change in Profit before Income Taxes <FY21 4th Qtr>
3.7
+ 57.0
- 14.8
+ 30.2
+ 146.4
- 20.9
- 0.0
255.3+ 53.6
OperatingProfit
- 5.6
OperatingProfit
213.2
Revenue,model mix,
etc.
R&D
Costreduction,
etc.
SG&A
Share of profit of investments
accountedfor using
the equity method
Finance income
and Finance
costs
Currencyeffects
Excluding currency effects + 218.8
- JPY / USD- USD / Others(BRL, CAD, MXN)
- JPY / Asian Currencies(INR, THB, VND, CNY, IDR)
- Others
- 7.5- 2.0
+ 2.5
+ 7.0
Operating Profit + 218.8
13
<Increase Factors>Difference in the amount of the provision for credit losses, etc.
FY20 4Q FY21 4Q
Profit before Income Taxes + 251.5
Yen (billion)

Sales Revenue/Operating Profit (Margin) by Business Segment <FY21 4th Qtr>
14
In the financial services business, Honda provides services such as loan and lease,mainly related to sales of automobiles, for customers buying products.
Operating profit relating to automobiles in financial services business is allocated in accordance with total assets ratio, etc.
upper:FY21
lower:FY20
Increase/Decrease
Factors
- 7.8
FY20 4Q:- 53.6 / - 2.0% FY20 4Q:- 13.8
* Combined operating profit of Automobile Business and
Financial Services Business for automobiles
<Reference>
Combined operating profit *
Operating profit from aircraft and
aircraft engines included in above
140.4 / 4.7%
13.4% - 3.2% 3.7% - 16.8%
Increased by 8.7 billion yen due
mainly to an increase in profit
attributable to increased sales
revenue and model mix, and cost
reduction.
Increased by 113.3 billion yen
due mainly to a decrease in SG&A
and an increase in profit
attributable to increased sales
revenue and model mix.
Increased by 83.4 billion yen
due mainly to difference in
the amount of the provision
for credit losses.
Improved by 13.3 billion yen
due mainly to an increase in
profit attributable to increased
sales revenue and model mix,
and a decrease in SG&A.
Operating
Margin
106.3 - 3.0
63.4 - 75.6 22.9 - 16.3
13.7% 1.6% 16.5% - 3.0%
Operating
Profit
72.2 37.6
529.1 2,418.4 643.6 100.4
473.5 2,338.7
Yen (billion)
Sales
Revenue 628.3 97.2
4,541
4,302 981 2,071
1,121 - 1,768
Motorcyle
Business
Automobile
Business
Financial Services
Business
Life Creation and
Other Businesses Unit (thousand)
Honda Group
Unit Sales(Consolidated Unit
Sales) (2,694) (777) (2,071)-
(1,768)-(718)(3,001)
-

FY21 Financial Results (Consolidated)
15
Income Statements FY20 FY21Yen (billion) Results Results amount %
Sales revenue 14,931.0 13,170.5 - 1,760.4 - 11.8%
Operating profit 633.6 660.2 + 26.5 + 4.2%
Operating margin 4.2% 5.0%
Share of profit of investments
accounted for using the equity method 164.2 272.7 + 108.5 + 66.1%
Profit before income taxes 789.9 914.0 + 124.1 + 15.7%
Profit for the year attributable
to owners of the parent 455.7 657.4 + 201.6 + 44.3%
Earnings per share attributable
to owners of the parent (Yen) 260.13 380.75
Market average rates (Yen)
Change
U.S. Dollar 106 - 3
+ 0.8pt
+ 120.62
109
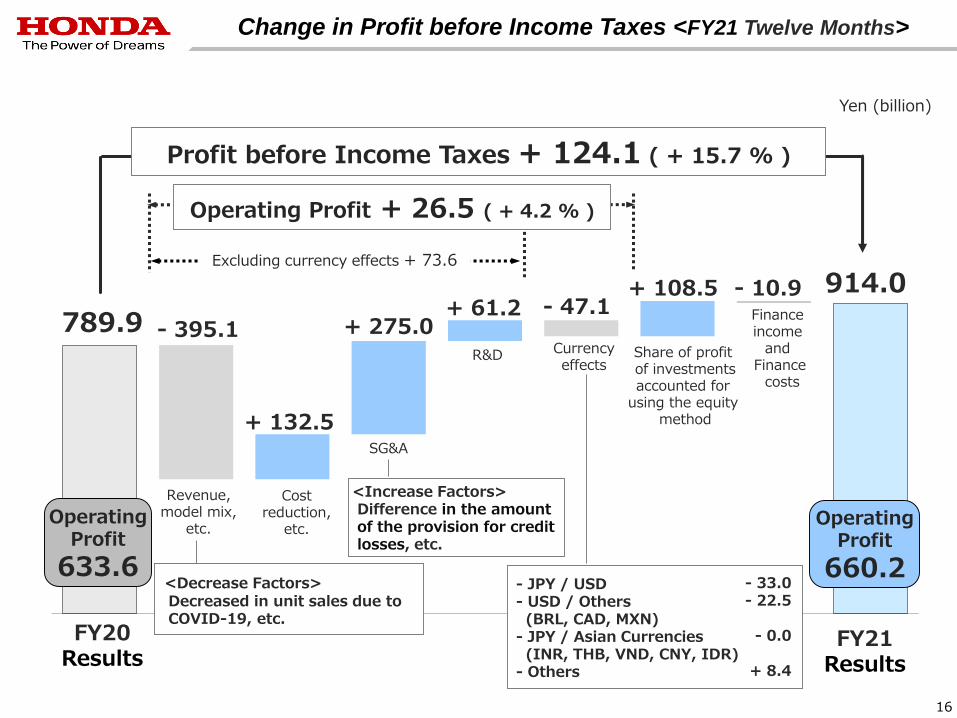
789.9 - 395.1+ 61.2
+ 132.5
+ 275.0
- 10.9- 47.1
+ 108.5 914.0
Change in Profit before Income Taxes <FY21 Twelve Months>
16
FY20Results
FY21Results
OperatingProfit
633.6
OperatingProfit
660.2<Decrease Factors>Decreased in unit sales due to COVID-19, etc.
Revenue,model mix,
etc.
Costreduction,
etc.
SG&A
- JPY / USD- USD / Others(BRL, CAD, MXN)
- JPY / Asian Currencies(INR, THB, VND, CNY, IDR)
- Others
- 33.0- 22.5
- 0.0
+ 8.4
R&D Currencyeffects
Share of profit of investmentsaccounted for
using the equity method
Finance income
and Finance
costs
Excluding currency effects + 73.6
Operating Profit + 26.5 ( + 4.2 % )
Profit before Income Taxes + 124.1 ( + 15.7 % )
Yen (billion)
<Increase Factors>Difference in the amount of the provision for credit losses, etc.
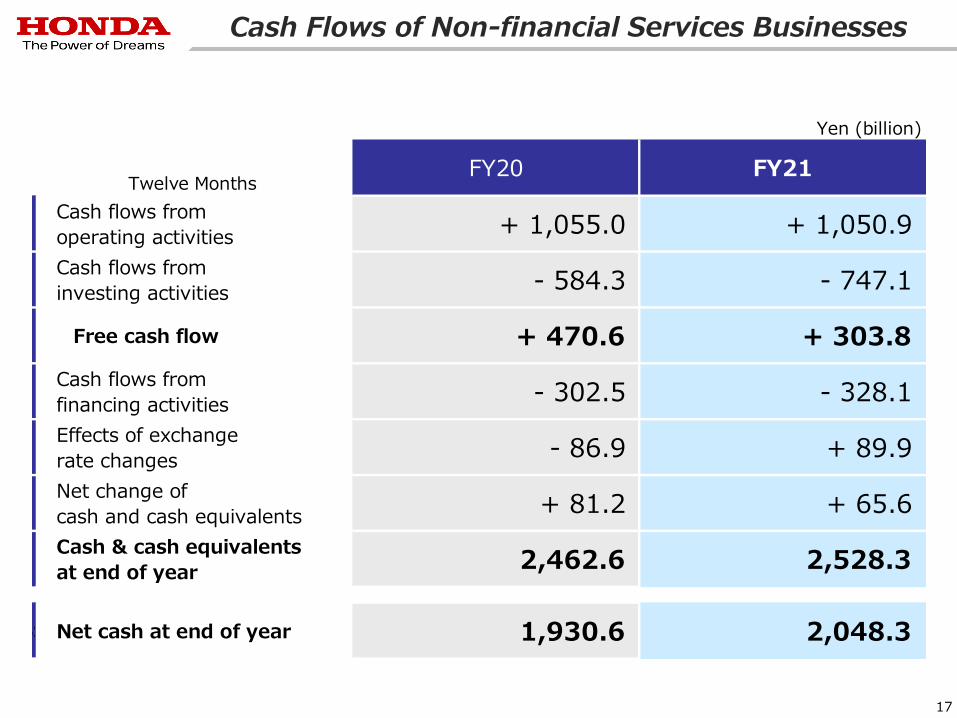
Cash Flows of Non-financial Services Businesses
17
Yen (billion)
Twelve MonthsFY20 FY21
Cash flows from
operating activities+ 1,055.0 + 1,050.9
Cash flows from
investing activities- 584.3 - 747.1
Free cash flow + 470.6 + 303.8
Cash flows from
financing activities- 302.5 - 328.1
Effects of exchange
rate changes- 86.9 + 89.9
Net change of
cash and cash equivalents+ 81.2 + 65.6
Cash & cash equivalents
at end of year 2,462.6 2,528.3
←BS担当作成の3. BS(概況)ペラ・パワポ用 9XX.xlsxから転記Net cash at end of year 1,930.6 2,048.3
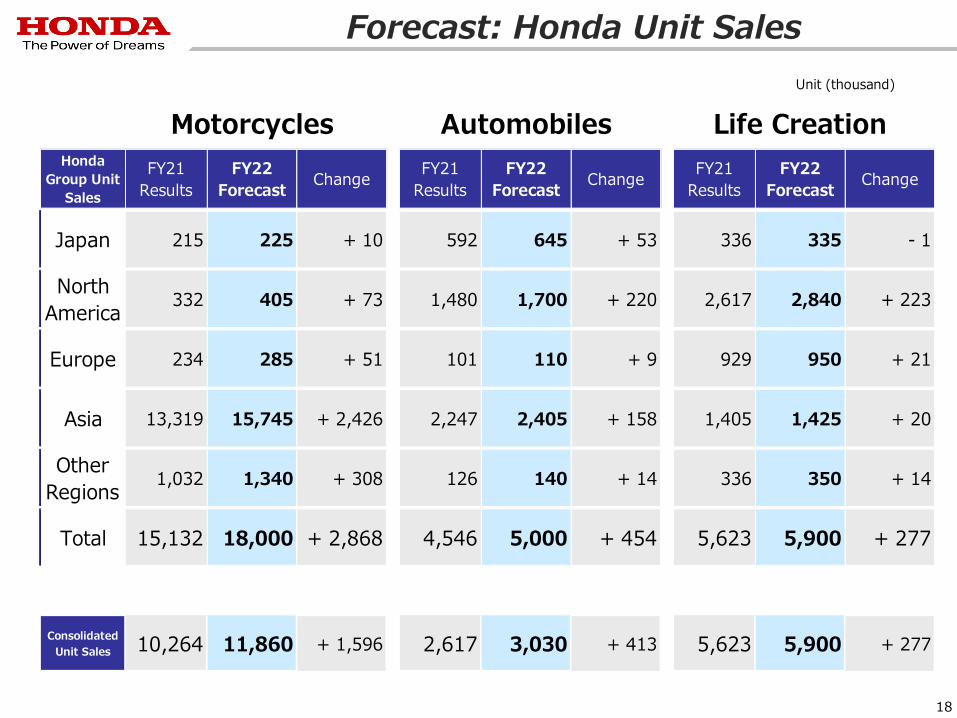
Forecast: Honda Unit Sales
*
18
Motorcycles Automobiles Life CreationHonda
Group Unit
Sales
FY21
Results
FY22
ForecastChange
FY21
Results
FY22
ForecastChange
FY21
Results
FY22
ForecastChange
Japan 215 225 + 10 592 645 + 53 336 335 - 1
North
America332 405 + 73 1,480 1,700 + 220 2,617 2,840 + 223
Europe 234 285 + 51 101 110 + 9 929 950 + 21
Asia 13,319 15,745 + 2,426 2,247 2,405 + 158 1,405 1,425 + 20
Other
Regions1,032 1,340 + 308 126 140 + 14 336 350 + 14
Total 15,132 18,000 + 2,868 4,546 5,000 + 454 5,623 5,900 + 277
Consolidated
Unit Sales 10,264 11,860 + 1,596 2,617 3,030 + 413 5,623 5,900 + 277
Unit (thousand)
FY22 Financial Forecast (Consolidated)
amount %
Sales revenue 13,170.5 15,200.0 + 2,029.4 + 15.4%
Operating profit 660.2 660.0 - 0.2 - 0.0%
Operating margin 5.0% 4.3% - 0.7pt
Share of profit of investments
accounted for using the equity method272.7 220.0 - 52.7 - 19.3%
Profit before income taxes 914.0 870.0 - 44.0 - 4.8%
Profit for the year attributable
to owners of the parent657.4 590.0 - 67.4 - 10.3%
Earnings per share attributable
to owners of the parent (Yen)380.75 341.70 - 39.05
Market average rates (Yen)
Income StatementsChange
U.S. Dollar 106 - 1105
FY21
Results
FY22
ForecastYen (billion)
19
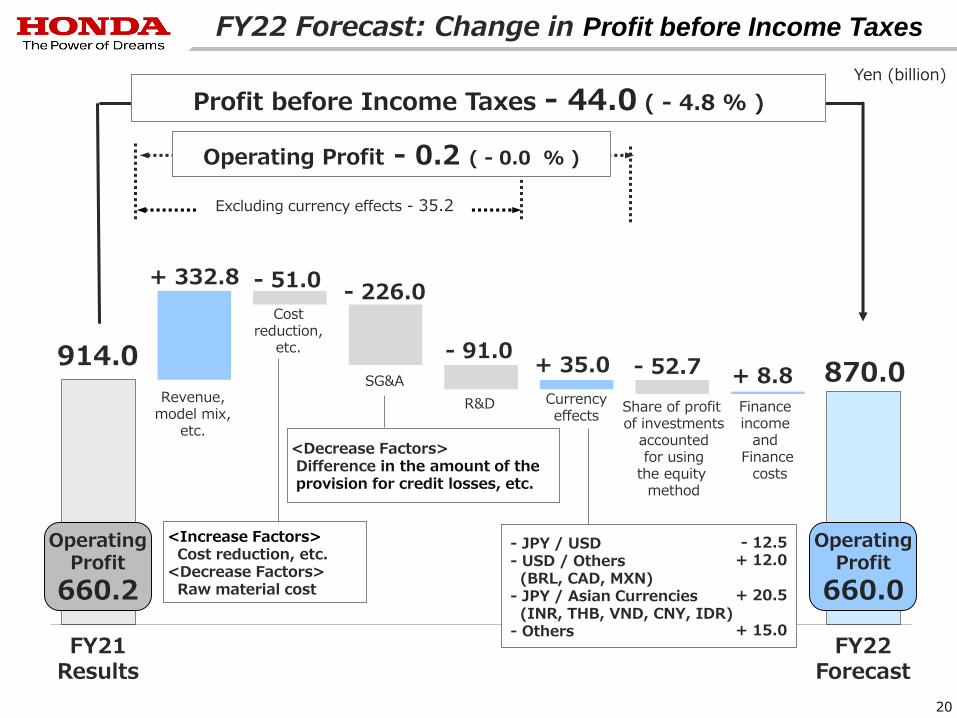
FY22 Forecast: Change in Profit before Income Taxes
914.0
+ 332.8
- 91.0
- 51.0- 226.0
+ 8.8+ 35.0 - 52.7 870.0
20
FY21Results
FY22Forecast
OperatingProfit
660.2
OperatingProfit
660.0
Yen (billion)
Revenue,model mix,
etc.
Costreduction,
etc.
SG&A
R&D Currencyeffects
Share of profit of investments
accountedfor using
the equity method
Finance income
and Finance
costs
- JPY / USD- USD / Others(BRL, CAD, MXN)
- JPY / Asian Currencies(INR, THB, VND, CNY, IDR)
- Others
- 12.5+ 12.0
+ 20.5
+ 15.0
Excluding currency effects - 35.2
Operating Profit - 0.2 ( - 0.0 % )
Profit before Income Taxes - 44.0 ( - 4.8 % )
<Decrease Factors>Difference in the amount of the provision for credit losses, etc.
<Increase Factors>Cost reduction, etc.
<Decrease Factors>Raw material cost
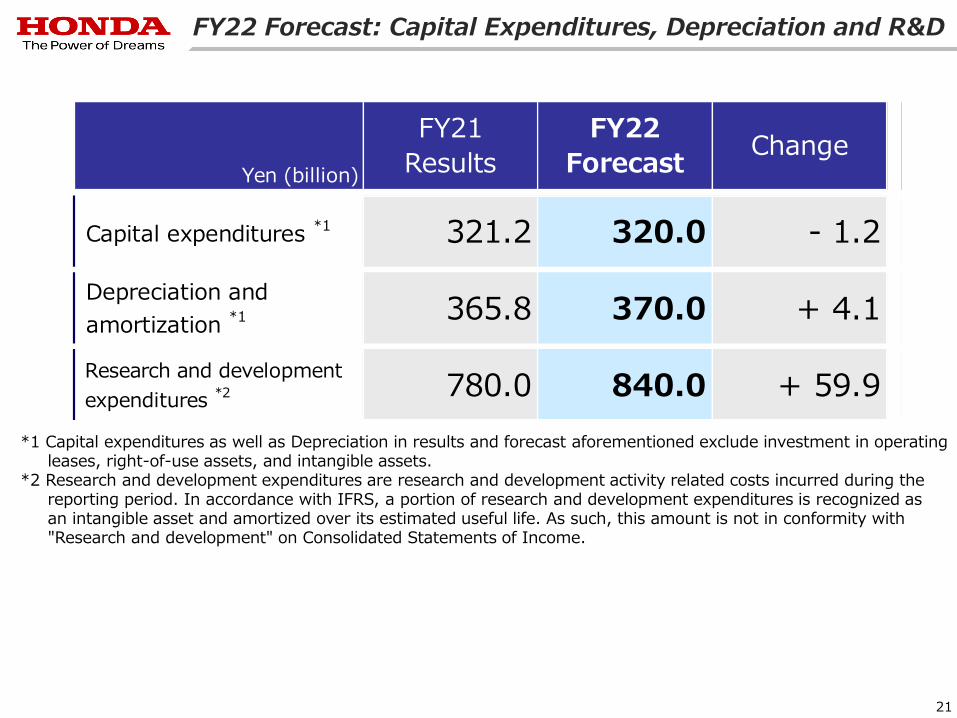
FY22 Forecast: Capital Expenditures, Depreciation and R&D
Capital expenditures *1 321.2 320.0 - 1.2
Depreciation and
amortization *1 365.8 370.0 + 4.1
Research and development
expenditures *2 780.0 840.0 + 59.9
Yen (billion)
ChangeFY22
Forecast
FY21
Results
21
*1 Capital expenditures as well as Depreciation in results and forecast aforementioned exclude investment in operating leases, right-of-use assets, and intangible assets.
*2 Research and development expenditures are research and development activity related costs incurred during the reporting period. In accordance with IFRS, a portion of research and development expenditures is recognized as an intangible asset and amortized over its estimated useful life. As such, this amount is not in conformity with "Research and development" on Consolidated Statements of Income.
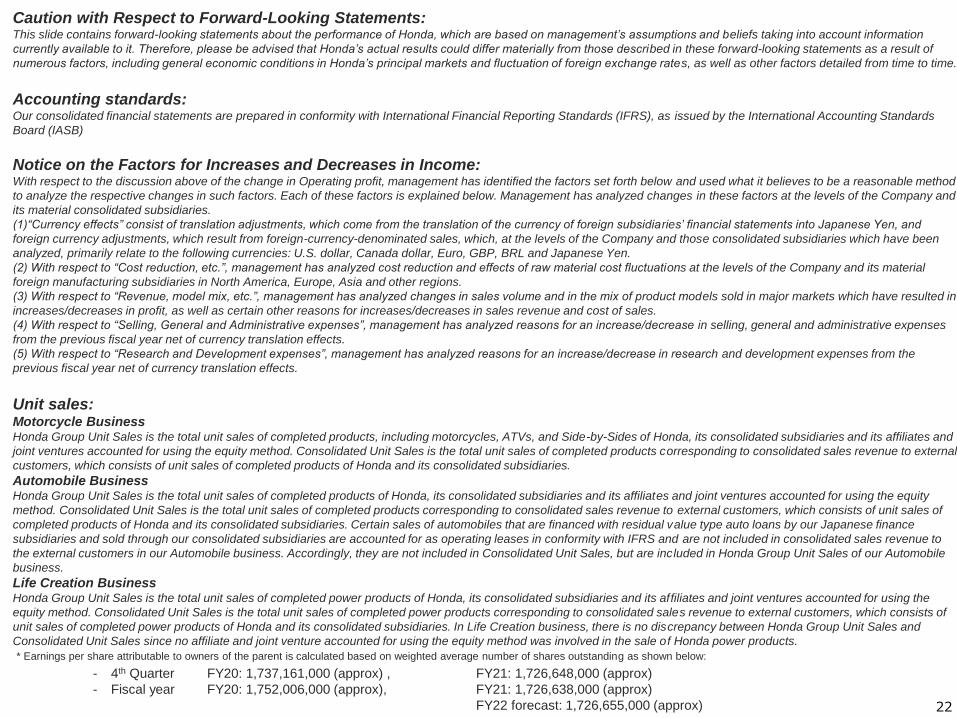
Caution with Respect to Forward-Looking Statements:This slide contains forward-looking statements about the performance of Honda, which are based on management’s assumptions and beliefs taking into account information
currently available to it. Therefore, please be advised that Honda’s actual results could differ materially from those described in these forward-looking statements as a result of
numerous factors, including general economic conditions in Honda’s principal markets and fluctuation of foreign exchange rates, as well as other factors detailed from time to time.
Accounting standards: Our consolidated financial statements are prepared in conformity with International Financial Reporting Standards (IFRS), as issued by the International Accounting Standards
Board (IASB)
Notice on the Factors for Increases and Decreases in Income:With respect to the discussion above of the change in Operating profit, management has identified the factors set forth below and used what it believes to be a reasonable method
to analyze the respective changes in such factors. Each of these factors is explained below. Management has analyzed changes in these factors at the levels of the Company and
its material consolidated subsidiaries.
(1)“Currency effects” consist of translation adjustments, which come from the translation of the currency of foreign subsidiaries’ financial statements into Japanese Yen, and
foreign currency adjustments, which result from foreign-currency-denominated sales, which, at the levels of the Company and those consolidated subsidiaries which have been
analyzed, primarily relate to the following currencies: U.S. dollar, Canada dollar, Euro, GBP, BRL and Japanese Yen.
(2) With respect to “Cost reduction, etc.”, management has analyzed cost reduction and effects of raw material cost fluctuations at the levels of the Company and its material
foreign manufacturing subsidiaries in North America, Europe, Asia and other regions.
(3) With respect to “Revenue, model mix, etc.”, management has analyzed changes in sales volume and in the mix of product models sold in major markets which have resulted in
increases/decreases in profit, as well as certain other reasons for increases/decreases in sales revenue and cost of sales.
(4) With respect to “Selling, General and Administrative expenses”, management has analyzed reasons for an increase/decrease in selling, general and administrative expenses
from the previous fiscal year net of currency translation effects.
(5) With respect to “Research and Development expenses”, management has analyzed reasons for an increase/decrease in research and development expenses from the
previous fiscal year net of currency translation effects.
Unit sales:Motorcycle BusinessHonda Group Unit Sales is the total unit sales of completed products, including motorcycles, ATVs, and Side-by-Sides of Honda, its consolidated subsidiaries and its affiliates and
joint ventures accounted for using the equity method. Consolidated Unit Sales is the total unit sales of completed products corresponding to consolidated sales revenue to external
customers, which consists of unit sales of completed products of Honda and its consolidated subsidiaries.
Automobile BusinessHonda Group Unit Sales is the total unit sales of completed products of Honda, its consolidated subsidiaries and its affiliates and joint ventures accounted for using the equity
method. Consolidated Unit Sales is the total unit sales of completed products corresponding to consolidated sales revenue to external customers, which consists of unit sales of
completed products of Honda and its consolidated subsidiaries. Certain sales of automobiles that are financed with residual value type auto loans by our Japanese finance
subsidiaries and sold through our consolidated subsidiaries are accounted for as operating leases in conformity with IFRS and are not included in consolidated sales revenue to
the external customers in our Automobile business. Accordingly, they are not included in Consolidated Unit Sales, but are included in Honda Group Unit Sales of our Automobile
business.
Life Creation BusinessHonda Group Unit Sales is the total unit sales of completed power products of Honda, its consolidated subsidiaries and its affiliates and joint ventures accounted for using the
equity method. Consolidated Unit Sales is the total unit sales of completed power products corresponding to consolidated sales revenue to external customers, which consists of
unit sales of completed power products of Honda and its consolidated subsidiaries. In Life Creation business, there is no discrepancy between Honda Group Unit Sales and
Consolidated Unit Sales since no affiliate and joint venture accounted for using the equity method was involved in the sale of Honda power products.
- 4th Quarter FY20: 1,737,161,000 (approx) , FY21: 1,726,648,000 (approx)
- Fiscal year FY20: 1,752,006,000 (approx), FY21: 1,726,638,000 (approx)
FY22 forecast: 1,726,655,000 (approx)
* Earnings per share attributable to owners of the parent is calculated based on weighted average number of shares outstanding as shown below:
22

23
24
Appendix

Change in Sales Revenue (Sales revenue from external customers)
compared with FY20 4Q : + 165.7 / + 4.8 % (Exc. currency translation effects:+ 228.3 / + 6.6 %)
compared with FY20 : - 1,760.4 / - 11.8 % (Exc. currency translation effects:- 1,410.9 / - 9.4 %)
25
Three Months
Twelve Months
Yen (billion)
(%)
Motorcycle Business 473.5 529.1 + 55.5 + 70.8 + 15.0%
Automobile Business 2,267.9 2,359.4 + 91.5 + 122.7 + 5.4%
Financial Services Business 625.0 640.6 + 15.6 + 32.2 + 5.2%
Life Creation and Other Businesses 91.5 94.5 + 3.0 + 2.5 + 2.8%
Total 3,458.0 3,623.8 + 165.7 + 228.3 + 6.6%
Market average rate (Yen)
U.S. Dollar 109 106
excluding currency translation effectsFY20 FY21 ChangeChange
(%)
Motorcycle Business 2,059.3 1,787.2 - 272.0 - 174.5 - 8.5%
Automobile Business 9,959.0 8,567.2 - 1,391.8 - 1,202.8 - 12.1%
Financial Services Business 2,586.9 2,494.2 - 92.6 - 33.1 - 1.3%
Life Creation and Other Businesses 325.6 321.7 - 3.8 - 0.4 - 0.1%
Total 14,931.0 13,170.5 - 1,760.4 - 1,410.9 - 9.4%
Market average rate (Yen)
U.S. Dollar 109 106
excluding currency translation effectsChangeFY21FY20Change

Sales Revenue/Operating Profit (Margin) by Business Segment <FY21 Twelve Months>
26
upper:FY21
lower:FY20 Unit (thousand)
Honda Group
Unit Sales(Consolidated Unit Sales)
15,132 4,546 - 5,623
(10,264) (2,617) - (5,623)
- 5,701
(12,426) (3,318) - (5,701)
19,340 4,790
1,787.2 8,779.3 2,506.7 341.8
2,059.3 10,194.6
Yen (billion)
Sales
Revenue 2,600.9 350.6
356.9 - 11.6
285.6 153.3 219.7 - 25.0
Operating
Profit
224.6 90.2
3.9%
13.9% 1.5% 8.4% - 7.1%
Operating
Margin
12.6% 1.0% 14.2% - 3.4%
Life Creation and
Other Businesses
Financial Services
Business
Automobile
Business
Motorcyle
Business
FY20 YTD:- 42.2
- 32.3
2.9%FY20 YTD:363.6 /
* Combined operating profit of Automobile Business and Financial
Services Business for automobiles <Reference>
Combined operating profit *
Operating profit from aircraft and
aircraft engines included in above
432.8 /
In the financial services business, Honda provides services such as loan and lease,mainly related to sales of automobiles, for customers buying products.
Operating profit relating to automobiles in financial services business is allocated in accordance with total assets ratio, etc.
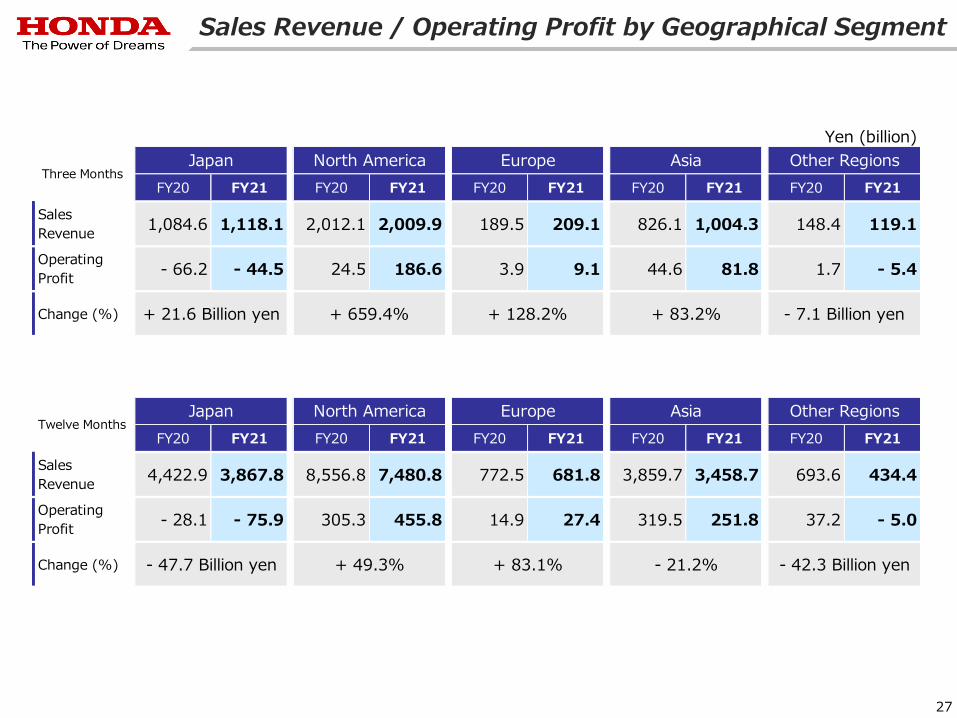
Sales Revenue / Operating Profit by Geographical Segment
27
FY20 FY21 FY20 FY21 FY20 FY21 FY20 FY21 FY20 FY21
Sales
Revenue4,422.9 3,867.8 8,556.8 7,480.8 772.5 681.8 3,859.7 3,458.7 693.6 434.4
Operating
Profit- 28.1 - 75.9 305.3 455.8 14.9 27.4 319.5 251.8 37.2 - 5.0
Change (%)
Asia Other Regions
- 47.7 Billion yen + 49.3% + 83.1% - 21.2% - 42.3 Billion yen
Twelve MonthsJapan North America Europe
Yen (billion)
FY20 FY21 FY20 FY21 FY20 FY21 FY20 FY21 FY20 FY21
Sales
Revenue1,084.6 1,118.1 2,012.1 2,009.9 189.5 209.1 826.1 1,004.3 148.4 119.1
Operating
Profit- 66.2 - 44.5 24.5 186.6 3.9 9.1 44.6 81.8 1.7 - 5.4
Change (%)
Other Regions
+ 21.6 Billion yen + 659.4% + 128.2% + 83.2% - 7.1 Billion yen
Three MonthsJapan North America Europe Asia
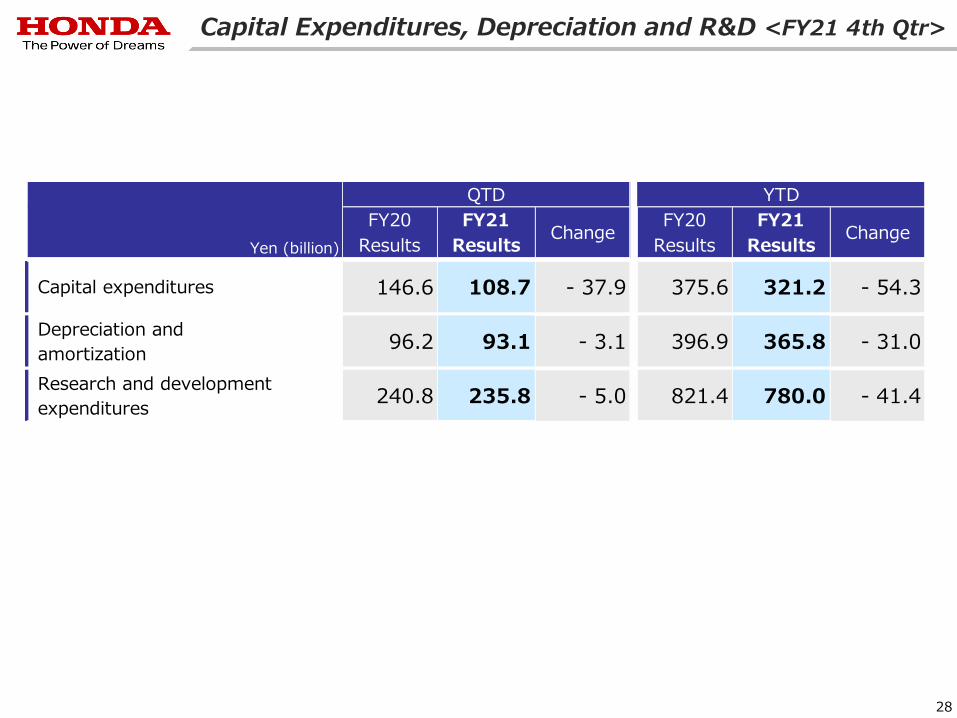
Capital Expenditures, Depreciation and R&D <FY21 4th Qtr>
28
FY20 FY21 FY20 FY21
Results Results Results Results
Capital expenditures 146.6 108.7 - 37.9 375.6 321.2 - 54.3
Depreciation and
amortization96.2 93.1 - 3.1 396.9 365.8 - 31.0
Research and development
expenditures240.8 235.8 - 5.0 821.4 780.0 - 41.4
Yen (billion)
QTD
Change
YTD
Change
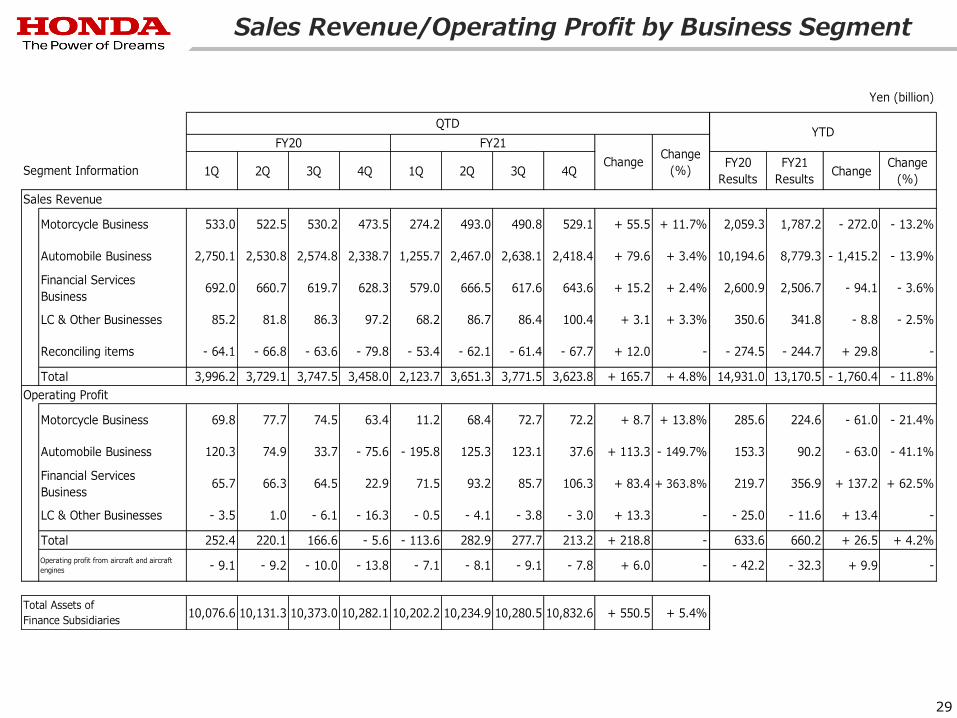
Sales Revenue/Operating Profit by Business Segment
29
1Q 2Q 3Q 4Q 1Q 2Q 3Q 4QFY20
Results
FY21
ResultsChange
Change
(%)
Sales Revenue
Motorcycle Business 533.0 522.5 530.2 473.5 274.2 493.0 490.8 529.1 + 55.5 + 11.7% 2,059.3 1,787.2 - 272.0 - 13.2%
Automobile Business 2,750.1 2,530.8 2,574.8 2,338.7 1,255.7 2,467.0 2,638.1 2,418.4 + 79.6 + 3.4% 10,194.6 8,779.3 - 1,415.2 - 13.9%
Financial Services
Business692.0 660.7 619.7 628.3 579.0 666.5 617.6 643.6 + 15.2 + 2.4% 2,600.9 2,506.7 - 94.1 - 3.6%
LC & Other Businesses 85.2 81.8 86.3 97.2 68.2 86.7 86.4 100.4 + 3.1 + 3.3% 350.6 341.8 - 8.8 - 2.5%
Reconciling items - 64.1 - 66.8 - 63.6 - 79.8 - 53.4 - 62.1 - 61.4 - 67.7 + 12.0 - - 274.5 - 244.7 + 29.8 -
Total 3,996.2 3,729.1 3,747.5 3,458.0 2,123.7 3,651.3 3,771.5 3,623.8 + 165.7 + 4.8% 14,931.0 13,170.5 - 1,760.4 - 11.8%
Operating Profit
69.8 77.7 74.5 63.4 11.2 68.4 72.7 72.2 + 8.7 + 13.8% 285.6 224.6 - 61.0 - 21.4%
120.3 74.9 33.7 - 75.6 - 195.8 125.3 123.1 37.6 + 113.3 - 149.7% 153.3 90.2 - 63.0 - 41.1%
65.7 66.3 64.5 22.9 71.5 93.2 85.7 106.3 + 83.4 + 363.8% 219.7 356.9 + 137.2 + 62.5%
- 3.5 1.0 - 6.1 - 16.3 - 0.5 - 4.1 - 3.8 - 3.0 + 13.3 - - 25.0 - 11.6 + 13.4 -
Total 252.4 220.1 166.6 - 5.6 - 113.6 282.9 277.7 213.2 + 218.8 - 633.6 660.2 + 26.5 + 4.2%
Operating profit from aircraft and aircraft
engines - 9.1 - 9.2 - 10.0 - 13.8 - 7.1 - 8.1 - 9.1 - 7.8 + 6.0 - - 42.2 - 32.3 + 9.9 -
10,076.6 10,131.3 10,373.0 10,282.1 10,202.2 10,234.9 10,280.5 10,832.6 + 550.5 + 5.4%
Motorcycle Business
Total Assets of
Finance Subsidiaries
Automobile Business
Financial Services
Business
LC & Other Businesses
Yen (billion)
QTDYTD
FY20 FY21
ChangeChange
(%)Segment Information
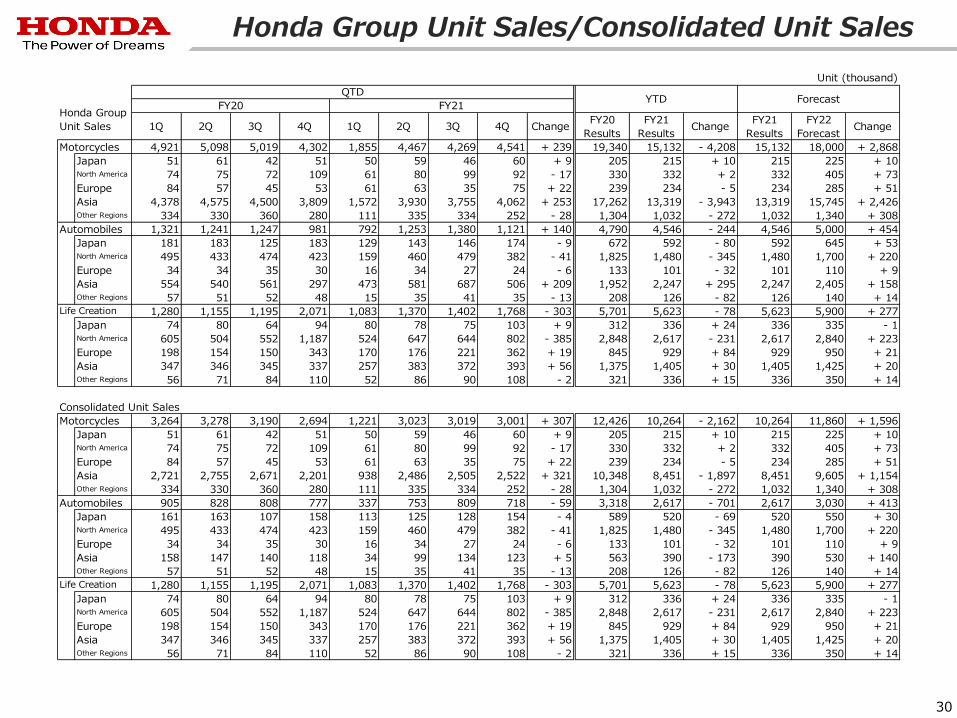
Honda Group Unit Sales/Consolidated Unit Sales
30
1Q 2Q 3Q 4Q 1Q 2Q 3Q 4Q ChangeFY20
Results
FY21
ResultsChange
FY21
Results
FY22
ForecastChange
Motorcycles 4,921 5,098 5,019 4,302 1,855 4,467 4,269 4,541 + 239 19,340 15,132 - 4,208 15,132 18,000 + 2,868
Japan 51 61 42 51 50 59 46 60 + 9 205 215 + 10 215 225 + 10North America 74 75 72 109 61 80 99 92 - 17 330 332 + 2 332 405 + 73
Europe 84 57 45 53 61 63 35 75 + 22 239 234 - 5 234 285 + 51
Asia 4,378 4,575 4,500 3,809 1,572 3,930 3,755 4,062 + 253 17,262 13,319 - 3,943 13,319 15,745 + 2,426Other Regions 334 330 360 280 111 335 334 252 - 28 1,304 1,032 - 272 1,032 1,340 + 308
Automobiles 1,321 1,241 1,247 981 792 1,253 1,380 1,121 + 140 4,790 4,546 - 244 4,546 5,000 + 454
Japan 181 183 125 183 129 143 146 174 - 9 672 592 - 80 592 645 + 53North America 495 433 474 423 159 460 479 382 - 41 1,825 1,480 - 345 1,480 1,700 + 220
Europe 34 34 35 30 16 34 27 24 - 6 133 101 - 32 101 110 + 9
Asia 554 540 561 297 473 581 687 506 + 209 1,952 2,247 + 295 2,247 2,405 + 158Other Regions 57 51 52 48 15 35 41 35 - 13 208 126 - 82 126 140 + 14
1,280 1,155 1,195 2,071 1,083 1,370 1,402 1,768 - 303 5,701 5,623 - 78 5,623 5,900 + 277
Japan 74 80 64 94 80 78 75 103 + 9 312 336 + 24 336 335 - 1North America 605 504 552 1,187 524 647 644 802 - 385 2,848 2,617 - 231 2,617 2,840 + 223
Europe 198 154 150 343 170 176 221 362 + 19 845 929 + 84 929 950 + 21
Asia 347 346 345 337 257 383 372 393 + 56 1,375 1,405 + 30 1,405 1,425 + 20Other Regions 56 71 84 110 52 86 90 108 - 2 321 336 + 15 336 350 + 14
Consolidated Unit Sales
Motorcycles 3,264 3,278 3,190 2,694 1,221 3,023 3,019 3,001 + 307 12,426 10,264 - 2,162 10,264 11,860 + 1,596
Japan 51 61 42 51 50 59 46 60 + 9 205 215 + 10 215 225 + 10North America 74 75 72 109 61 80 99 92 - 17 330 332 + 2 332 405 + 73
Europe 84 57 45 53 61 63 35 75 + 22 239 234 - 5 234 285 + 51
Asia 2,721 2,755 2,671 2,201 938 2,486 2,505 2,522 + 321 10,348 8,451 - 1,897 8,451 9,605 + 1,154Other Regions 334 330 360 280 111 335 334 252 - 28 1,304 1,032 - 272 1,032 1,340 + 308
Automobiles 905 828 808 777 337 753 809 718 - 59 3,318 2,617 - 701 2,617 3,030 + 413
Japan 161 163 107 158 113 125 128 154 - 4 589 520 - 69 520 550 + 30North America 495 433 474 423 159 460 479 382 - 41 1,825 1,480 - 345 1,480 1,700 + 220
Europe 34 34 35 30 16 34 27 24 - 6 133 101 - 32 101 110 + 9
Asia 158 147 140 118 34 99 134 123 + 5 563 390 - 173 390 530 + 140Other Regions 57 51 52 48 15 35 41 35 - 13 208 126 - 82 126 140 + 14
1,280 1,155 1,195 2,071 1,083 1,370 1,402 1,768 - 303 5,701 5,623 - 78 5,623 5,900 + 277
Japan 74 80 64 94 80 78 75 103 + 9 312 336 + 24 336 335 - 1North America 605 504 552 1,187 524 647 644 802 - 385 2,848 2,617 - 231 2,617 2,840 + 223
Europe 198 154 150 343 170 176 221 362 + 19 845 929 + 84 929 950 + 21
Asia 347 346 345 337 257 383 372 393 + 56 1,375 1,405 + 30 1,405 1,425 + 20Other Regions 56 71 84 110 52 86 90 108 - 2 321 336 + 15 336 350 + 14
Unit (thousand)
Forecast
Life Creation
Life Creation
QTDYTD
Honda Group
Unit Sales
FY20 FY21