Embed Size (px)
Citation preview
The School District of Lee County Florida SPECIAL BOARD MEETING
Public Hearing – FY18 Final Budget September 5, 2017
5:05 P.M.
A G E N D A
Order of Business
I. Call to Order Motion to adopt agenda as the order of business.
II. Presentations
Percent of Increase (Decrease) Over Roll-Back Rate Proposed Millage Budget Overview Proposed Final Budget
III. Public Hearing on Final Budget
IV. Adoption
Required Local Effort Millage Basic Discretionary Millage Capital Outlay Millage Resolution Determining Revenues and Millages and Resolution Adopting the Final
Millage Rates for the Fiscal Year 2017-2018 FY18 Final Budget and Related Resolution Adopting the Final Budget
V. Superintendent, Board Attorney and Board Member Comments VI. Adjournment
Any person wishing to appeal any decision made by The School Board of Lee County at a meeting or hearing will need a verbatim record of the proceedings. This record must include the testimony and evidence upon which the appeal is to be based.
MEMO FROM . . .
AMI DESAMOURS
CHIEF FINANCIAL OFFICER
Phone: (239)337-8217 Fax: (239)335-1501 Email: [email protected]
TO: Board Members
DATE: August 29, 2017
RE: Final Budget, 2017-2018
The attached information is the final budget book for the 2017-2018 school year, containing all the relevant information concerning this fiscal year’s budget, as well as detailed position information and budget resolutions to be signed after the final hearing.
You will be receiving a hard copy of the budget book for your convenience shortly. We hope you find the summary and detail information contained in the book helpful, and we are happy to answer any questions you may have. We look forward to the final budget hearing on September 5th, at 5:05 pm.

THE SCHOOL DISTRICT OF LEE COUNTYFORT MYERS, FLORIDA
FINALBUDGET
2017-2018
VISIONTo be a world-classschool system

THE SCHOOL BOARD OF LEE COUNTY, FLORIDA
Mary Fischer, M.A. Chairman, District 1
Jane E. Kuckel, PhD
Vice Chairman, District 6
Melisa W. Giovannelli Member, District 2
Chris N. Patricca Member, District 3
Steven K. Teuber Member, District 4
Pamela H. LaRiviere
Member, District 5
Cathleen O’Daniel Morgan Member, District 7
Gregory K. Adkins, Ed.D. Superintendent
The School District of Lee County 2855 Colonial Boulevard
Fort Myers, Florida 33966-1012
www.leeschools.net
If you should have questions or need any clarification relating to the budget document or budget process, you should direct them to the School District of Lee County, Budget Department, 2855 Colonial Boulevard, Fort Myers, FL 33966-1012. Telephone (239) 337-8215
School District of Lee County 2017-2018 Final Budget
1
MAJOR SECTIONS
This final budget is published to be a comprehensive representation of the 2015-2016 budget for the School District of Lee County. It is designed for ease of use and to facilitate the reader’s knowledge of the school system’s budget. This budget document consists of five major sections: (1) Introductory, (2) Organizational, (3) Financial, (4) Student Achievement, and (5) Informational Section. I. INTRODUCTORY SECTION
The Introductory Section is a high-level overall view of the 2015-2016 final budget. It contains a summary which can stand as a quick-reference guide for the 2015-2016 final budget.
II. ORGANIZATIONAL SECTION
The Organizational Section includes Organizational and Management Structures, Financial Organization and a brief outline of the Strategic Plan and Operational goals for the School District of Lee County.
III. FINANCIAL SECTION
The Financial Section displays all funds and components of the final budget in summary form to establish a “big picture financial overview”. It is sub-divided into seven sections: Consolidated Funds (All Funds) General Fund Debt Services Fund Capital Outlay Fund Special Revenue Fund – Federal Special Revenue Fund – Food Service Internal Service Fund
IV. STUDENT ACHIEVEMENT SECTION
The Student Achievement Section outlines selected data which illustrates achievements of Lee County students
V. INFORMATIONAL SECTION
The Informational Section contains general information of interest about the school system, the budget and related material of useful value for all stakeholders. Examples of the information provided are major revenue assumptions, local tax information, enrollment data, top Lee County employers, debt and amortization schedules, and glossary of terms.
School District of Lee County 2017-2018 Final Budget
2
TABLE OF CONTENTS
I. INTRODUCTORY SECTION 5
Summary - Board Members and Superintendent 6 - Key Administrative Staff 7 - Key Budget Development Staff 8 - School District of Lee County-
Vision, Mission, Core Values, Strategic Goals 9 - Profile of Fort Myers, Florida / Lee County 10 - Profile of The School District of Lee County 11 - Budget Brief (All Funds) 15 - Truth in Millage (TRIM) Calendar 18 2017-2018 Budget Narrative 20 District Budget Trends 36 Demographic Statistics 37
II. ORGANIZATIONAL SECTION 41
Organizational and Management Structure 42 Florida County Map 43 Current Organizational Chart 44 Zone Boundaries 45 Divisional Overview 46
Financial Organization Budget Structure 53 Fiscal Management Policies 54 Budget Process 55 State’s Role in Education Policy and Finance 57 Florida Education Finance Program 58
III. FINANCIAL SECTION 59
Financial Section 60 2017-2018 Consolidated Funds Statement 61 2017-2018 Final Budget Summary 63 Details of Balances and Reserves 64 Total Budget Illustration 65 All Funds Summary: Revenue Sources 66

School District of Lee County 2017-2018 Final Budget
3
III. FINANCIAL SECTION (CONTINUED)
All Funds Summary: Expenditures by Object
67 Three Year History of Expenses by Major Object 68 2017-2018 Approved Budget Breakdown 69 All Funds: Staffing Comparison 70 Summary of Organizational Budget – All Funds 73
General (Operating) Fund
75
Debt Service Fund
81
Capital Projects Fund
87
Special Revenue Fund-Federal
94
Special Revenue Fund-Food Service
95
Internal Service Fund
96
IV.
STUDENT ACHIEVEMENT SECTION
97
V.
INFORMATIONAL SECTION
107
Community Overview
108
Top Employers in Southwest Florida
110
Major Revenue Federal Revenue
111
State Revenue Sources 111 Description of State Distribution 111 Local Revenue and Beginning Fund Balance 113
Millage Tax Analysis Millage
113
Explanation of Rolled Back Rate 114 Property Tax Roll 117 Property Tax Historical Millages 118
Student Enrollment Projections (FTE and COFTE)
119
Actual and Estimated Regular Term FTE
121 Enrollment Charts 122 Capital Outlay FTE (COFTE) Forecasts 123
Personnel
124 Instructional Salaries 125 Support Personnel Salaries (SPALC) 127 Supervisory/Technical/Confidential Employees 128 Administrative Salary Schedule 129 Value Added to Compensation 130

School District of Lee County 2017-2018 Final Budget
4
V. INFORMATIONAL SECTION (CONTINUED)
Funding Analysis 131
Additional Budget Information Glossary 134 Who to Contact for Budget Information 146 Schools By Zone 147
School District of Lee County 2017-2018 Final Budget
5
THIS INTRODUCTORY SECTION OF THE BUDGET CONTAINS:
SUMMARY
- Board Members and Superintendent
- Key Administrative Staff
- Key Budgetary Development Staff
- School District of Lee County
- Vision, Mission, Core Values, Strategic Goals
- Profile of Fort Myers, Florida / Lee County
- Profile of the School District of Lee County
- Budget Brief (All Funds)
- Truth in Millage (TRIM) Calendar
2017 – 2018 Approved District Budget Narrative
District Budget Trends
Demographic Statistics
School District of Lee County 2017-2018 Final Budget
6
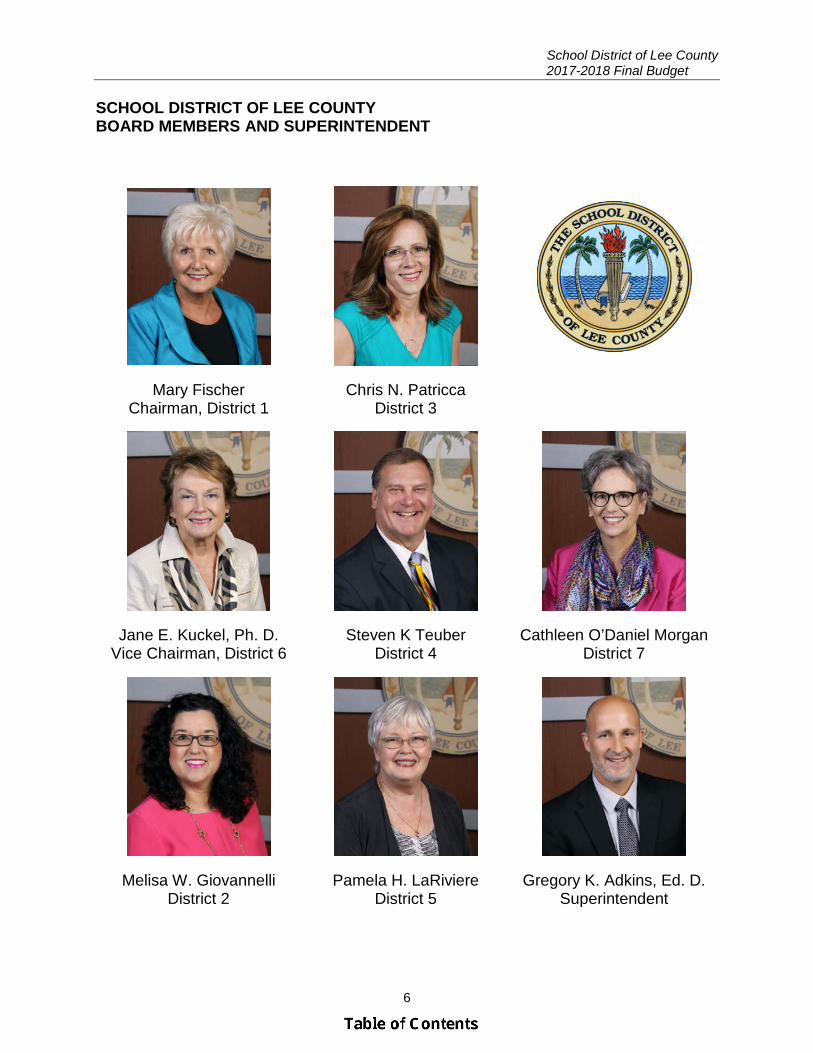
SCHOOL DISTRICT OF LEE COUNTY BOARD MEMBERS AND SUPERINTENDENT
Mary Fischer Chairman, District 1
Chris N. Patricca District 3
Jane E. Kuckel, Ph. D. Vice Chairman, District 6
Steven K Teuber District 4
Cathleen O’Daniel Morgan District 7
Melisa W. Giovannelli District 2
Pamela H. LaRiviere District 5
Gregory K. Adkins, Ed. D. Superintendent

School District of Lee County 2017-2018 Final Budget
7
KEY ADMINISTRATIVE STAFF
Mr. Trey Davis Chief Information Officer
Information Systems
Dr. Ami V. Desamours Chief Financial Officer Business & Finance
Mr. William Law Chief Operations Officer
Operations
Dr. Angela Pruitt Chief Human Resources Officer
Human Resources
TBD Chief Academic Officer
Academic Services
School District of Lee County 2017-2018 Final Budget
8
KEY BUDGET DEVELOPMENT STAFF
Dr. Ami V. Desamours Chief Financial Officer Business & Finance
Kelly Letcher Director
Business Services
Linda Cronk Senior Accountant Budget Services
Sarah Lazenby Senior Accountant Budget Services
Melissa Rivera Senior Accountant Budget Services
Margie Rodriguez Senior Accountant Budget Services
Sherry Pearsall Executive Secretary
Budget Services
Special thanks and acknowledgement to the dedicated staff who contributed their skills, efforts, and time in the completion of this professional quality document.
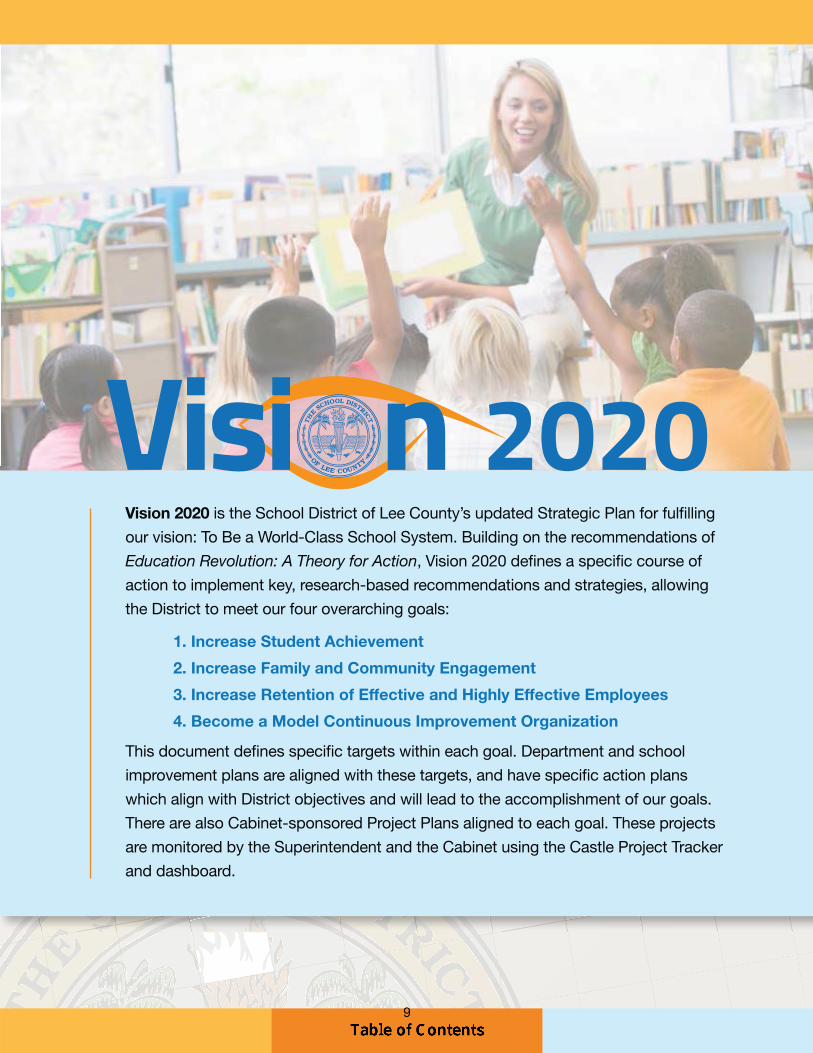
Vision 2020 is the School District of Lee County’s updated Strategic Plan for fulfilling
our vision: To Be a World-Class School System. Building on the recommendations of
Education Revolution: A Theory for Action, Vision 2020 defines a specific course of
action to implement key, research-based recommendations and strategies, allowing
the District to meet our four overarching goals:
1. Increase Student Achievement
2. Increase Family and Community Engagement
3. Increase Retention of Effective and Highly Effective Employees
4. Become a Model Continuous Improvement Organization
This document defines specific targets within each goal. Department and school
improvement plans are aligned with these targets, and have specific action plans
which align with District objectives and will lead to the accomplishment of our goals.
There are also Cabinet-sponsored Project Plans aligned to each goal. These projects
are monitored by the Superintendent and the Cabinet using the Castle Project Tracker
and dashboard.
2020Visi n
9
School District of Lee County 2017-2018 Final Budget
_________________________________________________________________________________________
10
PROFILE OF FORT MYERS, FLORIDA LEE COUNTY
HISTORY
Ponce de Leon, who explored the Florida Gulf Coast in 1513 and 1521, was believed to have stopped along the barrier islands of Lee County several times. The Spanish and Cuban settlers used the coast for temporary fishing and farming camps. For years Southwest Florida was an isolated area.
During the 1700s, the coastal areas of Lee County were used as a base of operations for bands of pirates who raided cargo ships that were sailing to and from the Port of New Orleans. In 1821, Florida became a US territory and settlers requested protection from the native Seminoles. Fort Myers became a base of operation during the Seminole Indian Wars and was named after Colonel Abraham C. Myers.
In 1885, Fort Myers was the second largest town on the Gulf Coast south of Cedar Key with a population of 349. It was this same year that Thomas Edison stopped to visit the town and subsequently built his home. By 1914 the first Ford Dealership was opened in Fort Myers. Edison’s friend Henry Ford, enjoying the area as well, eventually purchased land next to Edison’s estate and was a frequent winter visitor.
Between 1898 and the 1920s, hundreds of winter visitors flocked to Florida looking for land investments. The boom continued with the opening of Tamiami Trail which linked Fort Myers to Tampa and Miami. Unfortunately, two devastating hurricanes in 1921 & 1926 would slow the boom.
The 1940s would bring air bases and thousands of servicemen whom would later make Fort Myers their permanent home. Since World War II, the city has continued to grow along with Lee County. LOCATION Fort Myers is located on the west coast of the Florida peninsula along the Caloosahatchee River and is considered a gateway to the Gulf of Mexico. ENVIRONMENT Fort Myers is a beautiful warm city. Lee County is home to more than 100 parks, beaches, and wildlife refuges, dozens of freshwater lakes and streams, and beautiful beaches that span 50 miles along the Gulf of Mexico. The area is also rich in cultural experiences from fine arts galleries to the Southwest Florida Symphony. Fort Myers also hosts two major league spring training teams (Minnesota Twins and Boston Red Sox), and has the Miracles, a minor league baseball team. GOVERNMENT Fort Myers City Council is comprised of six members that represent six different wards of the city. They are elected by registered voters and serve four year terms. In order to run for election, council members must also reside in that specific ward. County Government is managed by the Board of County Commissioners, a five –member board that represents the entire county for a four-year term. POPULATION Lee County is located on the southwest coast of Florida, between Tampa and Naples. According to the Office of Economic and Demographic Research, Lee County had an estimated 2016 population of 680,539, and is projected to grow to a population of 748,925 by 2020. Once a retirement haven, Lee County is now dominated by working-age people, and has become an attractive location for business expansion.
School District of Lee County 2017-2018 Final Budget
_________________________________________________________________________________________
11
POPULATION (Continued)
The School District of Lee County serves the entire area of the county, which includes Cape Coral, Fort Myers, Fort Myers Beach, Lehigh, Sanibel, and Bonita Springs. The School Board, a public body corporate under the laws of the State of Florida, consists of seven members with five elected from their District and two elected at large. The Superintendent, who is a School Board appointee, serves as the Chief Executive Officer of the School District and Secretary to the School Board.
EDUCATION
Within Fort Myers, students can get a higher education at eight educational organizations. Fort Myers is the home to Florida SouthWestern State College (FSW), Florida Gulf Coast University (FGCU), Hodges University, Barry University (satellite campus), Nova Southeastern University, and Rasmussen College.
BUSINESS
Lee County has emerged in recent years as a dynamic destination for businesses. In 2014, Florida was voted the second best state for business by Chief Executive Magazine, and Cape Coral ranked as one of the Best Cities for Future Job Growth in 2014 by Forbes. Today, Lee County celebrates 125 years being a key player in the Florida business network. The vast majority of non-agricultural employment is in the service providing areas such as transportation, retail trade, professional and business services, leisure and hospitality, education, and health services. Business will have a ready workforce to draw from; the 20-54 year old population is projected to grow faster than the rest of the state increasing by up to 9.00% by 2020. In addition, 87% of the population over age 25 has at least a high school diploma, with 26% having a bachelor’s degree or higher. Several business and technical education institutions also serve to prepare the workforce for in-demand jobs.
ECONOMY
Our county led the country in foreclosures during 2009, and unemployment was amongst the highest in the nation. The trend appears to be changing; however. Unemployment is currently at 4.6% declining from 10% in 2011. With new companies moving their headquarters here, commercial and residential real estate activity has increased.
PROFILE OF SCHOOL DISTRICT OF LEE COUNTY
The School District will serve approximately 92,720 full time equivalent students in the 2017-18 school year, in 45 elementary, 16 middle, 4 K-8, 14 high, 14 special schools/programs, 3 technical colleges/vocational schools, and 24 charter schools. With 11,561 full and part time employees, the School District is the second largest employer in Lee County. We believe that given the right opportunities and educational environment, all students can learn and achieve at high levels. Some of our schools hold nationwide honors. To name just a few, according to Newsweek magazine, Fort Myers High was ranked among the top 100 best high schools in the nation. Our Head Start program was recognized as a program of excellence by the National Head Start Association. Dunbar High was recognized as the first Microsoft Certified High School in the world. Tropic Isles Elementary received the Governor’s Sterling Award for performance excellence. Our students continue to compete and be recognized by both the state and nation in academics and athletics. The class of 2016 earned over $53 million in scholarships. The School District of Lee County earned a “B” according to the State’s accountability system.
45 Elementary Schools 4 Combined Schools (K-8) 16 Middle Schools 14 High Schools 17 Special Center & Vocational 24 Charter Schools 120 Total Schools

School District of Lee County 2017-2018 Final Budget
_________________________________________________________________________________________
12
ADMINISTRATION
The seven School Board members are elected for four year terms, alternating every two years, at the November general election. Five members are elected from the District in which they reside and two members are elected at large. Each school member is charged with representing the entire School District. To assist in its deliberations, the School Board has established a series of Citizen Advisory Committees that advise the School Board on areas of special interest or concern. The School Board Attorney reports directly to the Board Office.
Responsibility for the administration and management of the schools, and for the supervision of instruction in the School District, is vested in the Superintendent as the Secretary and Executive Officer of the School Board. Similar to the Board, the Superintendent has established Advisory Committees of students, teachers, principals, and administrative staff to advice on various aspects of School District policy and procedures.
STAFF
The School District of Lee County is the county’s second largest employer with 11,561 employees.
The average school teacher salary in 2017-2018 with benefits is $66,251 for a 196 day, 7.60 hour/day contract.
Source: SDLC Final Budget Reports 2011-2012
ACADEMIC
The School District of Lee County is committed to maintaining instructional equity for all students, while maximizing and celebrating diversity throughout the system. Increased student achievement for all students is the goal of the District as it works to attain not only requirements of the Florida A+ plan but also those of the Federal Every Student Succeeds Act. Source: SDLC FTE Estimate, 2017-2018
Providing a rigorous and innovative curriculum to ensure that all students are adequately prepared for the work place, military, and/or post-secondary education is a priority of the School Board, Superintendent and his Cabinet. Parent and community partnerships are encouraged to enhance student learning throughout the School District. In addition, the district is committed to providing a safe and secure environment conducive to learning. To address an increasing demand for highly qualified teachers, the School District is making a concerted effort to recruit and retain a workforce that meets the national criteria of highly qualified teachers and paraprofessionals. Training current administrators and encouraging the concept of “growing from within” is taking place through mentoring, staff development, and partnerships with local universities. The District’s commitment to continuous improvement helps create a challenging, equitable, and rewarding work environment.
SPECIAL PROGRAMS
Specialized programs provide additional resources and innovative learning techniques that cater to students’ special talents or interest. There are many schools throughout the entire district that offer programs to enhance student talent and enrich students’ education. Dance, drama, and other creative and expressive arts, technology, science, math programs, and comprehensive vocational training are examples of the types of programs that are offered to Lee County students to provide well-rounded educational opportunities to all students.
Instructional 6,053 Administrative 365 Supervisory/Technical 568 Support Personnel 4,568 Elected Officials 7 Total Employees 11,561
2017-2018 Projected Student Count Elementary (PK-5) 43,697 Middle School (6-8) 20,991 High School (9-12) 28,032 Non-FTE Generating PK 864 Total 93,584
Employee count above does not include substitutes.

School District of Lee County 2017-2018 Final Budget
_________________________________________________________________________________________
13
SCHOOL BUDGET PROCESS
The State Legislature plays a central role in determining the revenues available to the School District. These revenues are allocated to school districts through the Florida Education Finance Program (FEFP). This allocation is determined on the basis of projected student populations or "FTE's" (Full Time Equivalent students; see glossary). FTE projections are finalized in February, and the Governor’s recommended budget is released. Based on this funding estimate, the District will release funding to schools. Schools receive most of their funding through District Resource Allocations, or DRAs. DRA allocations are made to schools using a formula based primarily on weighted full time equivalents (WFTE) (see glossary). The DRA system provides a predictable allocation for financial planning. Consolidating the majority of school allocations into a single funding process establishes a more equitable distribution of resources to the schools. The principal, with input from the school staff and school advisory committee, determines the staffing level that most effectively meets the educational needs of the school’s student population. The decentralization of the resources to the school level allows for increased flexibility by the schools in making resource allocation decisions most appropriate for the individual sites. School allocations have been modified to require a minimum number of teachers and custodians, calculated to ensure that our district will meet the class size mandate as required for this fiscal year, and keep our buildings well maintained. Some school allocations are considered non-DRA, that is, outside of the DRA allocation process. These include positions such as principal, secretary to the principal, grant-funded positions, and food service staff. Non-personnel dollars are distributed by formula based on FTE or WFTE for supplies, substitutes, equipment, textbooks, school improvement and high cost science lab materials. Some schools do not use the DRA allocation method for the distribution of resources. These schools have unique situations where the student enrollment is not stable during the school year. These schools include the juvenile justice programs, Success Academy, technical colleges/vocational schools, and adult education schools. All schools are allowed to budget funds according to priorities established at the school level within required state standards. To the extent that funds can be made available, schools are allowed to carry over unexpended funds (except for salaries and benefits) from one fiscal year to the next.
DEPARTMENT BUDGET PROCESS
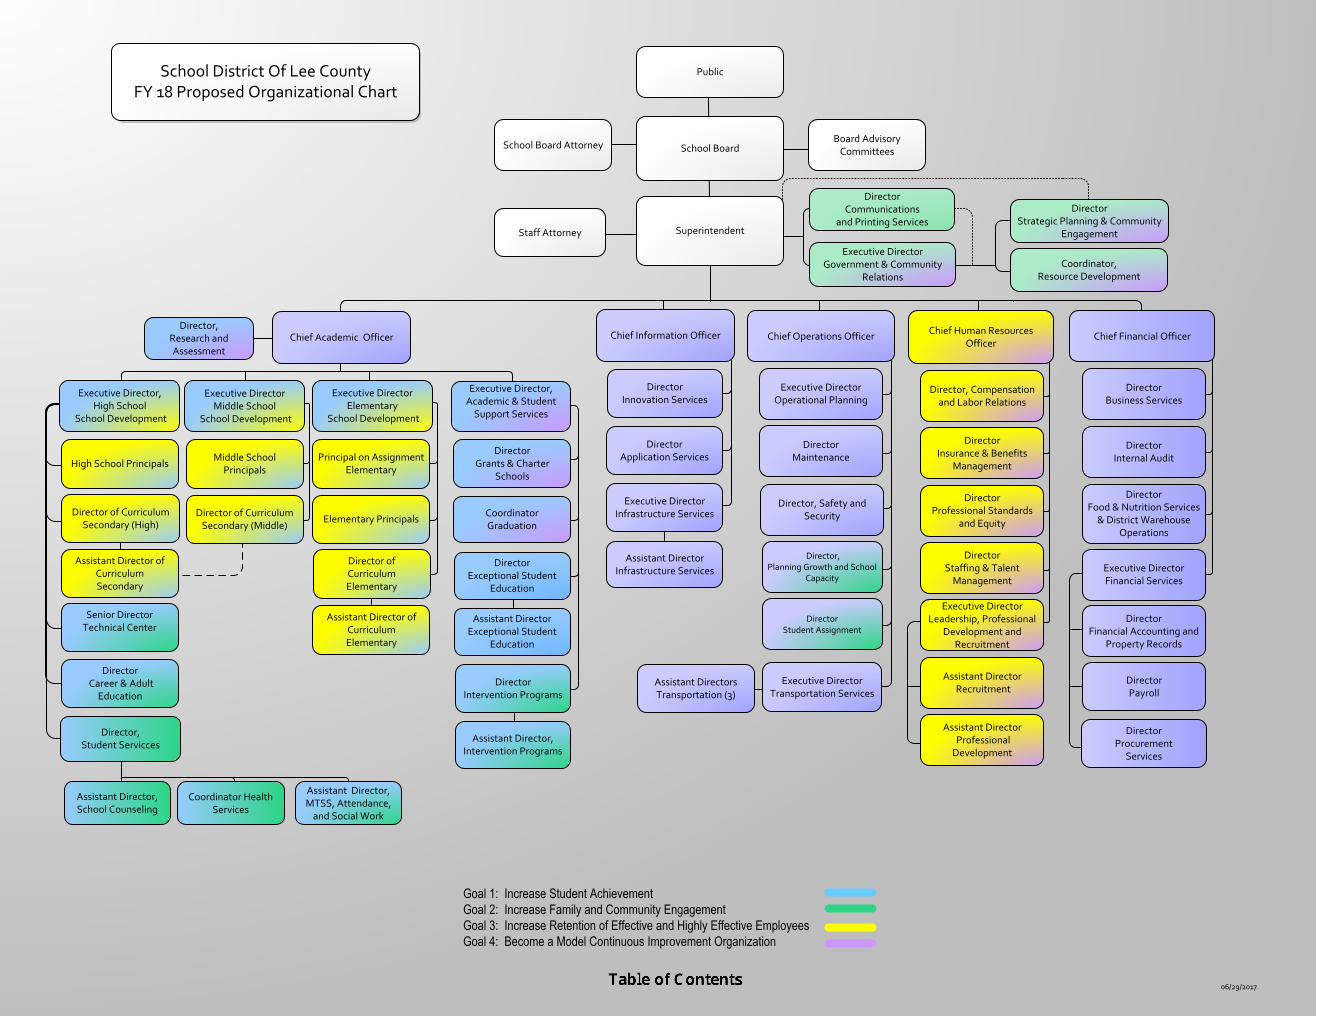
The organization of the School District is divided into five areas with Chief Officers overseeing these areas: Academic Services, Operations, Information Systems, Human Resources and Business & Finance. The Chief Officers, the Staff Attorney, the Director of Communications & Printing Services, and the Executive Director of Government & Community Relations report directly to the Superintendent. The Academic Services division is organized into the following departments: School Development, Academic & Student Support Services, Curriculum & Instructional Innovation – Elementary, Curriculum & Instructional Innovation – Secondary, Exceptional Student Education, Student Services, Health Services, Student Welfare & Attendance, Psychological Services, Grants & Program Development, Career & Adult Education, Intervention Services, Title I, Migrant, Early Childhood Services and Accountability, Research & Assessment. The Operations division is organized into the following departments: Facility Development & Programming Services, Maintenance, Planning, Growth & School Capacity, Safety & Security, Student Assignment, Transportation and Central Services. The Information Systems division is organized into the following departments: Application Services, Infrastructure Services, and Innovation Services.

School District of Lee County 2017-2018 Final Budget
_________________________________________________________________________________________
14
DEPARTMENT BUDGET PROCESS (Continued)
The Human Resources division is organized into the following departments: Insurance & Benefits Management, Staffing & Talent Management, Leadership, Professional Development & Recruitment, Compensation & Labor Relations and Professional Standards & Equity. The Business & Finance division is organized into the following departments: Budget, Financial Accounting & Property Records, Internal Audit, Payroll, Procurement Services, Food & Nutrition Services and District Warehouse Operations. Requests for department budgets were sent out in January. In 2017-2018 departments developed their proposed budgets taking into consideration the District’s Vision 20/20, their department goals and the most efficient use of funds. Once all departments proposed budgets were received, the information was compiled and reviewed by the Superintendent’s Cabinet for recommendations to the Board.
The statistical information about Lee County is from the Lee County Economic Development Office website.

School District of Lee County 2017-2018 Final Budget
_____________________________________________________________________________
15
BUDGET BRIEF (ALL FUNDS)
• The total consolidated budget for the Lee County School District is $1,508,771,993. • The projected FTE for the 2017-2018 year is 92,720 an increase of over 1,500 students
(1.7%) over last year’s FTE. This growth is comparable to growth the District has been experiencing over the last 5 or 6 years. The District has held FTE shortfall reserve in the event that actual FTE falls short of projections.
• At the time of the budget book production, we were still in negotiations with the Teachers and support personnel.
• Class size funding increased by approximately $1.4 million. The state’s allocation to Lee County for this year is $101.8 million. Compliance is at the strictest level (every class every period of the day) for 2018 but because of Lee Counties Student Assignment process the Lee County School District is on a school wide average for our schools of choice.
• 68% of the operating budget is salary and benefits cost, with instructional staff comprising 52% of the workforce
• The District contributes $6,935.40 for each employee, for health and life insurance. This amount was increased in 2016-17 by $500.40.
• Fund balances in the general fund are holding steady. This is due to the Boards direction to hold reserves steady.
• The capital budget decreased by $22 million. In 2017 the amount included a Certificate of Participation for Bonita High School. The District is in need of additional capital funds to help with the significant student growth we are experiencing as well as funds to maintain aging buildings and increased technology from state mandates.
• Lee County’s tax roll has increased for a fifth year since 2008 to $81 billion, an approximate 8.11% increase. The increase in the tax roll is a hopeful indication that it will continue to hold steady or increase in future years.
FINANCIAL DETAILS The current general fund budget for the district is $875.5 million. General fund income sources break down as follows:
Federal $4.3 million .59% State $296.2 million 40.61% Local $428.8 million 58.80%
The budgeted general fund expenditures for salaries and benefits total $598.6 million, and account for 68% of the total operating budget. School instructional costs, which include student instruction, instructional support, and school administration account for 72% of general fund budgeted expenditures, and student transportation expenditures add another 6.3% to the District’s general fund budget.

School District of Lee County 2017-2018 Final Budget
_____________________________________________________________________________
16
BUDGET BRIEF (ALL FUNDS) (Continued) REVENUE AND APPROPRIATION HIGHLIGHTS (ALL FUNDS) 2017-2018 SCHOOL YEAR Where dollars come from: Budgeted Revenue (Money) Sources
Source: SDLC Final Budget Summary, All Funds, 2017-2018
Budgeted Appropriations by Fund Where the dollars go:
Source: SDLC Final Budget Summary, All Funds, 2017-2018
Total Federal, $134,986,060,
9%
State Sources,
$306,479,414, 20%
Local Sources,
$652,308,574, 43%
Transfers/ Non-Revenue
Sources, $54,906,012,
4%
Beginning Fund Balance, $360,091,933,
24%
Budget Revenue Sources for 2017-2018 Total Budget $1,508,771,993
Operating $875,546,812
58%
Debt Service $59,015,542
4%
Capital Projects
$288,500,250 19%
Special Revenue
$85,340,451 6%
Internal Service
$130,163,790 8%
Food Service $70,205,148
5%
Budgeted Appropriation by Fund for 2017-2018 Total Budget $1,508,771,993
The District is funded by a combination of local, state and federal funding with the largest percentage from local (43%). Property taxes are the largest source of revenue from local funding.
Revenues the district receives from various sources are placed in funds for specific activities for attaining certain objectives such as food service, federal programs, retirement of debt, and capital outlay. When revenue is not designated for a specific purpose, it is usually placed in the operating fund which is 58% of the total budget.

School District of Lee County 2017-2018 Final Budget
_____________________________________________________________________________
17
BUDGET BRIEF (ALL FUNDS) (Continued)
SUMMARY OF APPROPRIATIONS (ALL FUNDS) 2017-2018 SCHOOL YEAR
Appropriations by Function Function classification indicates the overall purpose or objective of expenditures. These group-related activities are aimed at accomplishing a major service of regulatory responsibility.
Source: SDLC Final Budget Summary, All Funds, 2017-2018
1Other includes functional areas debt service and community services. SUMMARY OF APPROPRIATIONS (ALL FUNDS) 2017-2018 SCHOOL YEAR Appropriations by Object/Category The object classification indicates the type of goods or services obtained as a result of a specific expenditure. These objects can be combined into five major categories.
Source: SDLC Final Budget Reports, 2017-2018
Direct School Exp
628,899,910 42%
Instructional Spt
139,708,672 9%
Administrative 121,491,299
8%
Maintenance/Construction
Service 249,456,637
17%
Food Service 52,003,271
3%
Other 60,345,605
4%
Transfer/Fund Balance
256,866,599 17%
Appropriations by Function 2017-2018 Total Budget $1,508,771,993
Personnel Expense
$675,793,775 45%
Operating Expense
$363,701,461 24%
Debt Service $47,344,315
3%
Fund Balances/ Transfers [VALUE]
[PERCENTAGE]
Capital $165,065,843
11%
Appropriations by Object for 2017-2018 Total Budget $1,508,771,993
Five major object categories are:
• Personnel Expense1 • Operating Expense2 • Debt Service • Fund Balance &
Transfers • Capital Outlay 1 Personnel expense includes salary and benefits.
2 Operating expense includes such costs as purchased services, energy services, and materials and supplies.
The budget for the local school system is classified into seven broad areas:
• Direct School Expenses • Instructional Support • Administrative • Maintenance/ Construction
Service • Food Service • Other1 • Transfers/ Fund Balances

School District of Lee County2017-2018 Final Budget
___________________________________________________________________________________________
18
NovemberBegin budget planning process
December
Input On FY18 FTE Projections from Planning and Program CoordinatorsThird calculation of FEFP for FY17
Dec-6 Budget Briefing/School District Growth and Debt
January
Student Assignment Open Enrollment beginsLegislature Convenes
Jan-11 Submit FTE forecast for FY18Jan-20 Meet with Central Leadership on budget procedures for FY18Jan-24 FY18 Budget UpdateJan-31 Governor's budget released
February
Begin school FTE projections for FY18Feb-3 Department budget requests completed and sent to Budget Department
MarchReview of Project Priority List For Capital PlanningChiefs Review of BudgetDRA allocations released to schools
April
Anticipated notification to Staffing and Talent Managment of surplus and involuntary transfers
Apr-4 Budget Workshop/Budget UpdateSuperintendent/Cheif Review of Requested Budgets
May
Superintendent/Cheif Review of Requested BudgetsMay-2 Budget Workshop/Budget UpdateMay-12 Schools DRA files due back to BudgetMay-16 Budget Workshop/Budget Update
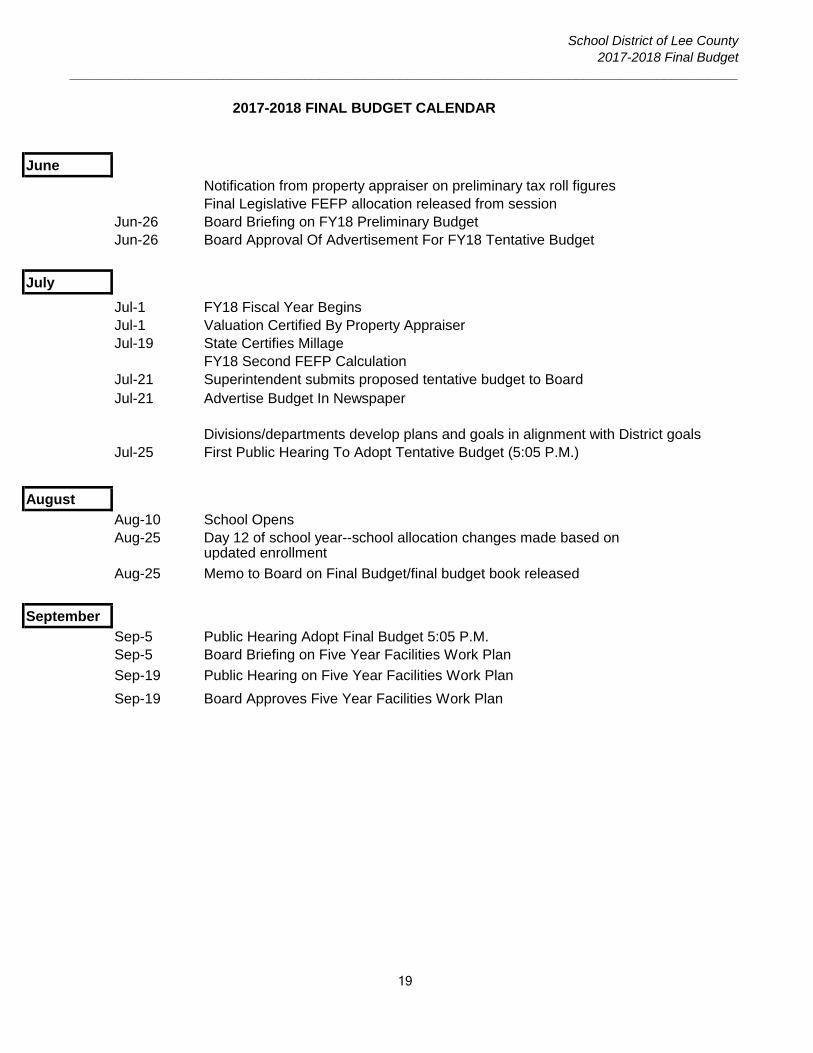
2017-2018 FINAL BUDGET CALENDAR
School District of Lee County2017-2018 Final Budget
___________________________________________________________________________________________
19
June
Notification from property appraiser on preliminary tax roll figuresFinal Legislative FEFP allocation released from session
Jun-26 Board Briefing on FY18 Preliminary BudgetJun-26 Board Approval Of Advertisement For FY18 Tentative Budget
July
Jul-1 FY18 Fiscal Year BeginsJul-1 Valuation Certified By Property AppraiserJul-19 State Certifies Millage
FY18 Second FEFP CalculationJul-21 Superintendent submits proposed tentative budget to BoardJul-21 Advertise Budget In Newspaper
Divisions/departments develop plans and goals in alignment with District goalsJul-25 First Public Hearing To Adopt Tentative Budget (5:05 P.M.)
August
Aug-10 School OpensAug-25 Day 12 of school year--school allocation changes made based on
updated enrollment
Aug-25 Memo to Board on Final Budget/final budget book released
September
Sep-5 Public Hearing Adopt Final Budget 5:05 P.M.Sep-5 Board Briefing on Five Year Facilities Work Plan
Sep-19 Public Hearing on Five Year Facilities Work Plan
Sep-19 Board Approves Five Year Facilities Work Plan
2017-2018 FINAL BUDGET CALENDAR
School District of Lee County 2017-2018 Final Budget
_____________________________________________________________________________________
20
2017-2018 BUDGET NARRATIVE
FLORIDA EDUCATION FINANCE PROGRAM (FEFP)
In Florida, the ground rules for the educational system are established by the state. A general understanding of state requirements is essential to understanding the School District's budget development and implementation process.
The State's Role in Budgetary Allocations Florida State Statutes, Chapters 1000-1013, and the Administrative Rules implementing them, specify in substantial detail the what, when, and how of the delivery of educational services at the local level. Funds expended under the Florida Education Finance Program are allocated primarily on the basis of the number of students and the educational programs they require. The state has a comprehensive program and cost reporting system that requires extensive data collection and maintenance on practically every aspect of district program and fiscal operations. While much of this data is useful for necessary program management purposes, it contributes to significant administrative expense outside the classroom and school setting. Thus, while the School Board has significant discretion in establishing policy and directing district operations, it is significantly constrained in budgetary matters by Florida State law and regulations. In 1973, the Florida Legislature passed the Florida Education Finance Program (FEFP) with the following purpose: "To guarantee to each student in the Florida public educational system the availability of programs and services appropriate to his or her educational needs which are substantially equal to those available to any similar student notwithstanding geographic differences and varying local economic factors." The FEFP determines the budget level for each school district, including both state and local revenue sources. The FEFP uses a formula to recognize (1) varying local property tax bases, (2) varying program costs, (3) district cost differentials, and (4) differences in per student costs for equivalent educational programs due to sparsity and dispersion of student population. For each school district, the state determines the total school district FEFP allocation, what the state share should be, and then determines the local share. (See the following page for a comparison). The state then sets the local millage rate required to generate the required local share. School districts must impose the state established millage rate in order to obtain the state share of funding for district programs. This required local effort millage for the School District of Lee County for this year is 4.431. The state also establishes additional millage levels, which a school district may impose on a "discretionary" basis for operating purposes. The current base rate is 0.748 mills. School boards could previously levy an additional discretionary millage to raise an amount not to exceed $100 per FTE or .25 mills, but this millage has been suspended by the legislature since 2010. In FY11, the legislature gave school districts the opportunity to levy an additional tax of up to 0.25 mills at the Board’s discretion for critical operating needs. This opportunity is now only allowed if local taxpayers agree through an election to continue the critical needs millage. In 2018 we are not levying the critical needs millage. A full time equivalent (FTE) is equal to any regular education student in the fourth through eighth grade attending classes for a full year. The Legislature sets a "base student allocation" for that student (for FY18, it is $4,203.95). Any other student is "weighted" to compensate for calculated differing program cost factors for that student.

School District of Lee County 2017-2018 Final Budget
_____________________________________________________________________________________
21
FEFP (Continued)
FTE Students X Program Cost Factors =
Weighted FTE
Students X
Base Student Allocation
(BSA) X
District Cost
Differential (DCD)
=
Base Funding +
Declining Enrollment
Supplement + Sparsity
Supplement + Discretionary Contribution + Instructional
Materials +
Discretionary Compression + Safe Schools + Reading
Program + Supplemental
Academic Instruction
+ ESE
Guaranteed Allocation
+
Teachers Classroom
Supply Assistance
+ DJJ
Supplemental Allocation
+ Virtual
Education Contribution
+ Student Trans-
portation +
Digital Classrooms Allocation
+
Federally Connected
Student Supplement
= Gross State and Local
FEFP Dollars -
Required Local Effort =
Gross State
FEFP +/-
Proration/
Adjustment
=
Net State FEFP
Allocation
Source: Funding for Florida School Districts
The total amount of FEFP money for a school district is determined by the weighted full-time equivalent students anticipated in the school district for the school year, adjusted by cost differentials and other FEFP factors that may apply. Student counts are taken during the fiscal year and funding is adjusted based on actual enrollment. In addition to state FEFP formula funding for operations, the state provides funds for class size reduction, Discretionary Lottery, and School Recognition on a "categorical" formula basis. MILLAGE The property tax rate is referred to as millage. Property taxes are based on a unit called a mill. A mill is the rate used to calculate taxes based upon assessed property value. One mill is equal to $1.00 per $1,000 of assessed property value. A mill can also be expressed as .001. With certain exceptions, the Constitution limits school board levies to no more than 10 mills.
Distributing State Dollars (Flow Chart) Funding for public schools is allocated on a per student basis through FEFP. The amount of STATE AND LOCAL FEFP DOLLARS for each school district is determined in the following manner:
School District of Lee County 2017-2018 Final Budget
_____________________________________________________________________________________
22
MILLAGE (Continued)
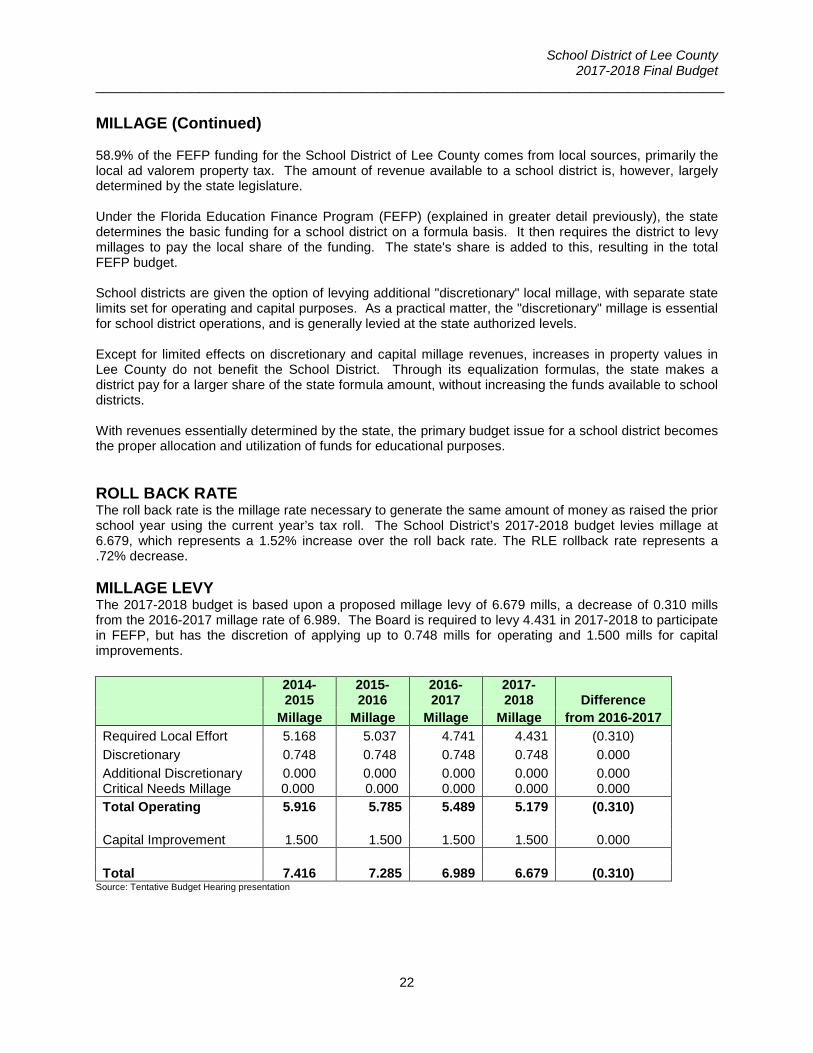
58.9% of the FEFP funding for the School District of Lee County comes from local sources, primarily the local ad valorem property tax. The amount of revenue available to a school district is, however, largely determined by the state legislature. Under the Florida Education Finance Program (FEFP) (explained in greater detail previously), the state determines the basic funding for a school district on a formula basis. It then requires the district to levy millages to pay the local share of the funding. The state's share is added to this, resulting in the total FEFP budget. School districts are given the option of levying additional "discretionary" local millage, with separate state limits set for operating and capital purposes. As a practical matter, the "discretionary" millage is essential for school district operations, and is generally levied at the state authorized levels. Except for limited effects on discretionary and capital millage revenues, increases in property values in Lee County do not benefit the School District. Through its equalization formulas, the state makes a district pay for a larger share of the state formula amount, without increasing the funds available to school districts. With revenues essentially determined by the state, the primary budget issue for a school district becomes the proper allocation and utilization of funds for educational purposes. ROLL BACK RATE The roll back rate is the millage rate necessary to generate the same amount of money as raised the prior school year using the current year’s tax roll. The School District’s 2017-2018 budget levies millage at 6.679, which represents a 1.52% increase over the roll back rate. The RLE rollback rate represents a .72% decrease. MILLAGE LEVY The 2017-2018 budget is based upon a proposed millage levy of 6.679 mills, a decrease of 0.310 mills from the 2016-2017 millage rate of 6.989. The Board is required to levy 4.431 in 2017-2018 to participate in FEFP, but has the discretion of applying up to 0.748 mills for operating and 1.500 mills for capital improvements.
2014-2015
2015-2016
2016-2017
2017-2018 Difference
Millage Millage Millage Millage from 2016-2017
Required Local Effort 5.168 5.037 4.741 4.431 (0.310)
Discretionary 0.748 0.748 0.748 0.748 0.000
Additional Discretionary 0.000 0.000 0.000 0.000 0.000 Critical Needs Millage 0.000 0.000 0.000 0.000 0.000 Total Operating 5.916 5.785 5.489 5.179 (0.310) Capital Improvement 1.500 1.500 1.500 1.500 0.000 Total 7.416 7.285 6.989 6.679 (0.310)
Source: Tentative Budget Hearing presentation

School District of Lee County 2017-2018 Final Budget
_____________________________________________________________________________________
23
MILLAGE LEVY (Continued) The total property assessment for Lee County has increased by 8.11% between 2017 ($75.82 billion) and 2018 ($81.97 billion).
2014-2015 2015-2016 2016-2017
% Increase
from 2015-2016 2017-2018
% Increase
from 2016-2017
Property Value $64,429,903,676 $69,129,597,816 $75,824,368,848 +9.68% $81,973,613,642 +8.11%
Source: DR-420S Certification of School Taxable Value
Millage Rates
The effect of the millage change on property taxes will depend heavily on the change in taxable value of each specific property. As Lee County’s tax roll slowly increases, taxpayers are seeing an increase in property taxable value. The overall tax rate is increasing 8.11% meaning most property owners will see an increase in the taxable value of their property and a slight increase in their property taxes.

School District of Lee County 2017-2018 Final Budget
_____________________________________________________________________________________
24
APPROVED BUDGET 2017-2018 SCHOOL YEAR The 2017-2018 approved budget for The School District of Lee County is $1,508,771,993 which consists of Operating ($875.6 M), Debt Service ($59.0 M), Capital Project ($288.5 M), Special Revenue ($85.3 M), Internal Service ($130.2 M), and Food Service ($70.2 M).
Source: SDLC Final Budget Summary, All Funds 2017-2018
Source: SDLC Final Budget Summary, All Funds, 2017-2018

School District of Lee County 2017-2018 Final Budget
_____________________________________________________________________________________
25
APPROVED BUDGET 2017-2018 SCHOOL YEAR (Continued)
Approved Budget 2017-2018
ACTUAL
2014-2015
ACTUAL 2015-2016
ACTUAL 2016-2017
APPROVED
BUDGET 2017-2018
DIFFERENCE
GENERAL DEBT SERVICE CAPITAL PROJ SPECIAL REV INTERNAL SVC FOOD SERVICE
$ 817,945,039 $ 208,253,471 $ 185,955,007 $ 69,579,298 $ 135,389,927 $ 55,331,511
$ 837,202,087 $ 51,675,604 $ 193,073,102 $ 70,581,954 $ 139,304,379 $ 60,061,116
$ 860,375,762 $ 117,702,731 $ 310,513,554 $ 73,092,698 $ 135,923,380 $ 65,479,731
$ 875,546,812 $ 59,015,542 $ 288,500,250 $ 85,340,451 $ 130,163,790 $ 70,205,148
$ 15,171,050 $ (58,687,189) $ (22,013,304) $ 12,247,753 $ (5,759,590) $ 4,725,417
SUBTOTAL
$ 1,472,454,253
$1,351,898,242
$1,563,087,856
$1,508,771,993
$ (54,315,863)
Source: SDLC Final Budget Reports 2014-2015 Actual as of 8/10/15 2015-2016 Actual as of 8/10/16 2016-2017 Actual as of 8/10/17

School District of Lee County 2017-2018 Final Budget
26
GENERAL FUND This fund is the primary operating fund of the district. Revenues that are not specifically allocated to another fund are accounted for in this fund. FEFP dollars are the principle source of revenue for the general fund. The general fund is 58.03% of the total budget and is the fund that provides for the day to day needs of the district. Examples of expenses from this fund are: salaries, benefits, contracted services with vendors, supplies, instructional materials, textbooks, legal fees, utilities, bus transportation, and custodial services among others.
GENERAL FUND REVENUES 2016-17 2017-18 Inc/(Dec) ESTIMATED REVENUE Actual Budget 2016-17 to 2017-18 Federal - Direct 1,702,332 1,733,000 30,668 Federal through State 2,533,241 2,550,000 16,759 Total Federal 4,235,573 4,283,000 47,427 State Sources 282,227,993 296,182,073 13,954,080 Local Sources 422,511,037 428,801,871 6,290,834 Total Revenue Sources 708,974,603 729,266,944 20,292,341 Incoming Transfers 10,895,414 9,619,350 (1,276,064) Non-revenue Receipts 326,784 5,897 (320,887) Beginning Balances 140,178,961 136,654,621 (3,524,340) TOTAL ESTIMATED REVENUE, TRANSFERS AND BALANCES 860,375,762 875,546,812 15,171,050
Source: SDLC Final Budget Summary, General Fund Revenue, 2017-18 Note: 2016-17 Actuals are as of August 10, 2017.
Total estimated general fund revenues for fiscal year 2017-2018 are $875,546,812 with expenses to match. Carryforward fund balance figures include reserve for contingencies $23,000,000 (which represents approximately 2.63% of the total general fund) and reserve for board priorities of $17,056,789 (which represents approximately 1.95% of the total general fund). The total general fund budget increased $15 million over 2016-2017 actual results.

School District of Lee County 2017-2018 Final Budget
27
General Fund Appropriations 2016-2017 2017-2018 Increase/
Actual Budget (Decrease)
Salaries & Benefits 543,499,385 598,559,103 55,059,718 Purchased Services 131,898,652 143,251,220 11,352,568 Energy 21,381,283 25,792,351 4,411,068 Supplies 15,023,284 40,297,066 25,273,782 Capital Outlay 7,401,263 16,546,774 9,145,511 Other 4,517,274 5,043,509 526,235 Transfer Reserve 136,654,621 46,056,789 (90,597,832) Total 860,375,762 875,546,812 15,171,050
Source: SDLC Final Budget Book 2017-18
The resources of the General Fund are used primarily for salaries and benefits totaling just over $598 million or approximately 68% of the total estimated budget. From a functional view, direct school expenditures and instructional support account for 78.43% of the budget. Expenditures for maintenance services account for 11.50% of the budget and administration accounts for 3.40% of the budget.
General Fund Appropriations 2017-2018 Total Budget $875,546,812
Direct School Expenditures $576,204,703
65.81%
Instructional Support
$110,465,185 12.62%
Admin $29,761,126
3.40%
Maintenance $100,684,521
11.50%
Other $12,374,488
1.41%
Fund Balance $46,056,789
5.26%
School District of Lee County 2017-2018 Final Budget
_____________________________________________________________________________
28
DEBT SERVICE FUND
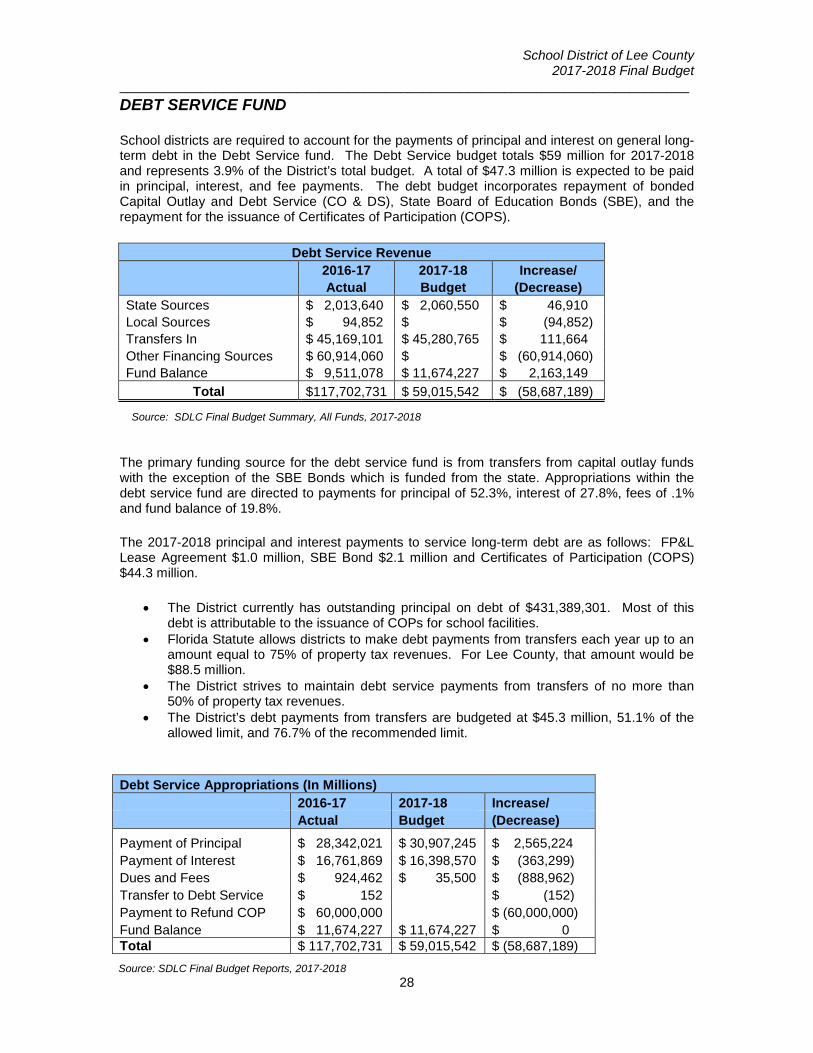
School districts are required to account for the payments of principal and interest on general long-term debt in the Debt Service fund. The Debt Service budget totals $59 million for 2017-2018 and represents 3.9% of the District’s total budget. A total of $47.3 million is expected to be paid in principal, interest, and fee payments. The debt budget incorporates repayment of bonded Capital Outlay and Debt Service (CO & DS), State Board of Education Bonds (SBE), and the repayment for the issuance of Certificates of Participation (COPS).
Debt Service Revenue 2016-17 2017-18 Increase/ Actual Budget (Decrease) State Sources $ 2,013,640 $ 2,060,550 $ 46,910 Local Sources $ 94,852 $ $ (94,852) Transfers In $ 45,169,101 $ 45,280,765 $ 111,664 Other Financing Sources $ 60,914,060 $ $ (60,914,060) Fund Balance $ 9,511,078 $ 11,674,227 $ 2,163,149
Total $117,702,731 $ 59,015,542 $ (58,687,189)
The primary funding source for the debt service fund is from transfers from capital outlay funds with the exception of the SBE Bonds which is funded from the state. Appropriations within the debt service fund are directed to payments for principal of 52.3%, interest of 27.8%, fees of .1% and fund balance of 19.8%.
The 2017-2018 principal and interest payments to service long-term debt are as follows: FP&L Lease Agreement $1.0 million, SBE Bond $2.1 million and Certificates of Participation (COPS) $44.3 million.
• The District currently has outstanding principal on debt of $431,389,301. Most of this debt is attributable to the issuance of COPs for school facilities.
• Florida Statute allows districts to make debt payments from transfers each year up to an amount equal to 75% of property tax revenues. For Lee County, that amount would be $88.5 million.
• The District strives to maintain debt service payments from transfers of no more than 50% of property tax revenues.
• The District’s debt payments from transfers are budgeted at $45.3 million, 51.1% of the allowed limit, and 76.7% of the recommended limit.
Debt Service Appropriations (In Millions) 2016-17 2017-18 Increase/ Actual Budget (Decrease)
Payment of Principal $ 28,342,021 $ 30,907,245 $ 2,565,224 Payment of Interest $ 16,761,869 $ 16,398,570 $ (363,299) Dues and Fees $ 924,462 $ 35,500 $ (888,962) Transfer to Debt Service $ 152 $ (152) Payment to Refund COP $ 60,000,000 $ (60,000,000) Fund Balance $ 11,674,227 $ 11,674,227 $ 0 Total $ 117,702,731 $ 59,015,542 $ (58,687,189)
Source: SDLC Final Budget Summary, All Funds, 2017-2018
Source: SDLC Final Budget Reports, 2017-2018

School District of Lee County 2017-2018 Final Budget
_____________________________________________________________________________
29
CAPITAL PROJECTS FUND
The Capital Projects Budget totals $288.5 million for 2017-2018 and represents 19.1% of our total budget.
As part of the budget requirements, the School Board holds a workshop to review, discuss, and approve a Five-Year Capital Outlay Plan for the expenditure of property tax revenue and other state and local capital revenue sources available for the fiscal year.
The Five-Year Capital Outlay Plan is reviewed semi-annually by the Board. The current five year plan focuses on adding student stations with the addition of seven new schools over the next five years – two elementary schools, three middle schools, two high schools (includes Bonita High School which is opening in FY18 in portables) and an addition at Lehigh Senior High School. Capital resources will also be used to completely renovate two existing schools, replacement of buses, maintenance of schools, and technology.
Capital Projects funds report the revenues, transfers, and appropriations for construction, renovation, maintenance and repair of educational facilities. Major funding sources include:
Property tax revenues are permitted for school districts through Florida Statute. Section 1011.71 permits school boards to levy a maximum of 1.500 mills for capital outlay purposes at the option of local school boards. For FY18 the capital millage will generate approximately $118 million, which is used to fund capital projects, maintain schools and repayment of debt.
Impact Fees for the school district are levied according to the ordinance approved by the Board of County Commissioners. Impact fees can be used to mitigate the effects of growth on the school district. Authorized uses include the purchase of land and construction of buildings that add additional student stations to accommodate growth. On March 12, 2013, County Commissioners approved a two year reduction in impact fees of 80%. In March 2015, the impact fee rate was increased by 15.7%. The collection rate was also increased from 20% to 45%.
Public Education Capital Outlay (PECO) funds had been the primary source of state revenue for capital projects since 1976. These funds are derived from utility taxes throughout the State and are allocated by the legislature each year. This revenue source has decreased drastically for traditional public schools.
State and local capital projects funds must be spent on capital outlay projects in accordance with Florida Statues and State Board of Education Rules.

School District of Lee County 2017-2018 Final Budget
_____________________________________________________________________________
30
CAPITAL PROJECTS FUND (CONTINUED)
Capital Projects Revenue (In Millions)
2016-17 2017-18 Increase/
Actual Budget (Decrease)
State Sources
PECO $ 1,926,462 $ 1,926,462 $ 0
Other $ 5,522,023 $ 5,944,000 $ 421,977
Local Sources
Millage $110,255,520 $ 118,042,004 $ 7,786,484
Impact Fees $ 6,654,615 $ 6,615,000 $ (39,615)
Other $ 1,094,058 $ 706,000 $ (388,058)
Loans $ 19,965,000 $ 0 $ (19,965,000)
Certificates of Participation $ 70,935,000 $ 0 $ (70,935,000)
Fund Balance $ 94,160,876 $ 155,266,784 $ 61,105,908
Total $310,513,554 $288,500,250 $ (22,013,304)
Capital Projects Appropriations (In Millions)
2016-17 2017-18 Increase/
Actual Budget (Decrease)
Library Books (New Libraries) $ 0 $ 0 $ 0
Audio Visual Materials $ 0 $ 0 $ 0
Buildings & Fixed Equipment $ 8,634,096 $ 45,233,053 $ 36,598,957
Furniture, Fixtures, & Equipment $ 3,618,553 $ 17,790,853 $ 14,172,300
Computer Hardware $ 16,821,628 $ 19,398,780 $ 2,577,152
Motor Vehicles/School Buses $ 23,411,905 $ 15,937,374 $ (7,474,531)
Land $ 11,171,997 $ 0 $ (11,171,997)
Improvements other than Buildings $ 3,981,642 $ 5,211,476 $ 1,229,834
Remodeling & Renovations $ 29,322,094 $ 34,834,135 $ 5,512,041
Other $ 2,220,492 $ 2,642,728 $ 422,236
Transfers $ 56,064,363 $ 54,900,115 $ (1,164,248)
Fund Balance $155,266,784 $ 92,551,736 $ (62,715,048)
Total $310,513,554 $ 288,500,250 $ (22,013,304)
Source: SDLC Final Budget Reports, 2017-2018
Source: SDLC Final Budget Reports, 2017-2018

School District of Lee County2017-2018 Final Budget
31
SPECIAL REVENUE FUND - FEDERAL
2016-17 2017-18 Increase/Actual Budget (Decrease)
Federal Direct $19.3 $20.9 $1.6Federal through State $53.7 $64.4 $10.7Local $0.1 ($0.1)
$73.1 $85.3 $12.2
Source: SDLC Final Budget Reports 2017-2018
2016-17 2017-18 Increase/Actual Budget (Decrease)
Salaries & Benefits $55.7 $53.3 (2.4)Purchased Services $6.7 $9.3 2.6Materials & Supplies $3.7 $11.6 7.9Capital Outlay & Energy Services $1.8 $3.6 1.8Other Expenses $5.2 $7.5 2.3
$73.1 $85.3 $12.2Source: SDLC Final Budget Reports 2017-2018
Special Revenue Fund - Federal Revenue (In Millions)
Total
Special Revenue Fund - Federal Appropriations (In Millions)
Total
The Special Revenue Fund-Federal budget totals $85.3 million for 2017-2018 and represents 5.66% of the total budget. The Special Revenue Fund tracks federal grants and entitlements that are received by the District from various federal and state agencies. To receive federal funds, projects must be approved by the School Board and the Department of Education or other governing agency. The Special Revenue Fund must be carefully monitored to ensure that all expenditures are itemized in the approved budget and occur within a stipulated time period. Approximately 62% ($53.3 million) of the funds budgeted under Special Revenue Funds are allocated for District salaries and benefits.
Two federal projects, Individual with Disabilities Act (IDEA) ($28.3 million) and the Elementary and Secondary Education Act (Title I) ($33.2 million) account for 72% ($61.5 million) of the total budgeted revenue ($85.3 million) for special revenue. The Title I school-wide projects provide supplemental reading, writing, and mathematics instruction services in eligible elementary, middle and high schools. The Individual with Disabilities Education Act (IDEA), Part B, funds provide for the excess cost of special education and related services for students with disabilities, in keeping with the federal mandate for a free appropriate public education, the full opportunity goal, and other requirements specified in the assurances. An approved indirect cost rate is established each year based on the percentage of District indirect expenditures in the general fund for the preceding fiscal year. This percentage is applied to all expenditures in the special revenue fund (except capital outlay) and paid to the general fund monthly to offset overhead. The approved rate for the 2016-2017 fiscal year was 4.24% with payments to the general fund of $2.8 million. The Department of Education has approved an indirect cost rate of 4.24% for 2017-2018 fiscal year. Federal grants continue to be budgeted during the fiscal year as grants are awarded.
School District of Lee County2017-2018 Final Budget
32
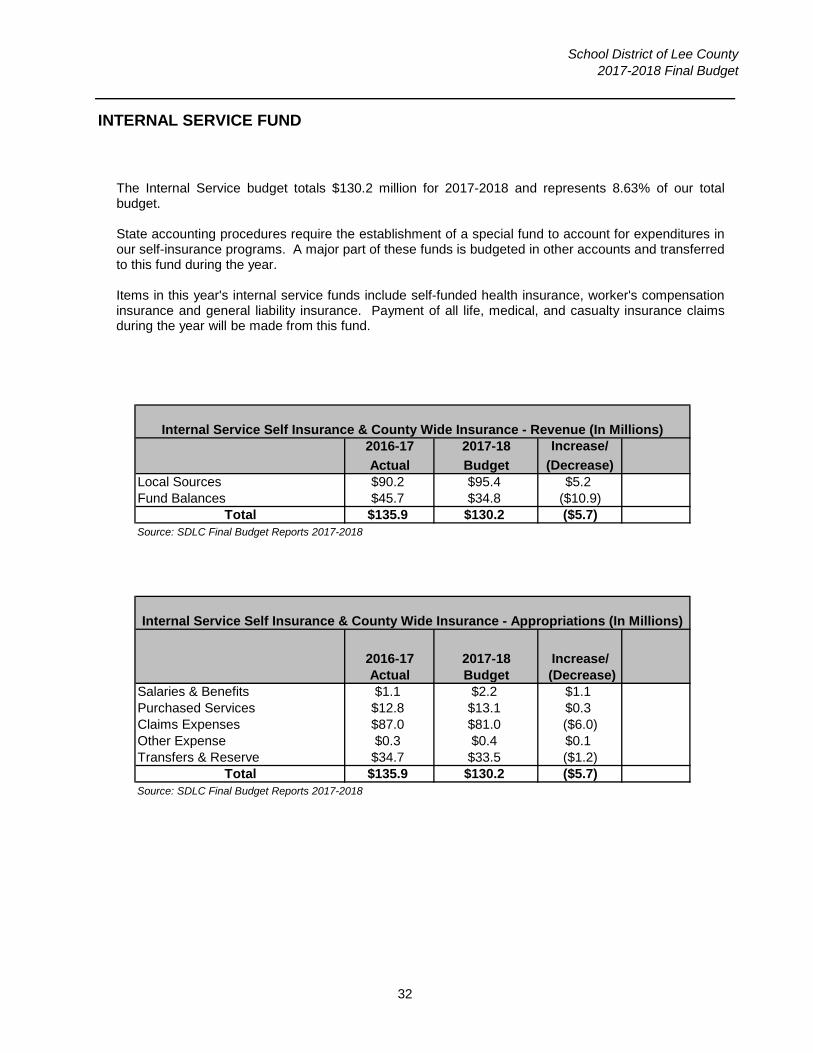
INTERNAL SERVICE FUND
2016-17 2017-18 Increase/
Actual Budget (Decrease)Local Sources $90.2 $95.4 $5.2Fund Balances $45.7 $34.8 ($10.9)
Total $135.9 $130.2 ($5.7)Source: SDLC Final Budget Reports 2017-2018
2016-17 2017-18 Increase/Actual Budget (Decrease)
Salaries & Benefits $1.1 $2.2 $1.1Purchased Services $12.8 $13.1 $0.3Claims Expenses $87.0 $81.0 ($6.0)Other Expense $0.3 $0.4 $0.1Transfers & Reserve $34.7 $33.5 ($1.2)
Total $135.9 $130.2 ($5.7)Source: SDLC Final Budget Reports 2017-2018
Internal Service Self Insurance & County Wide Insurance - Revenue (In Millions)
Internal Service Self Insurance & County Wide Insurance - Appropriations (In Millions)
The Internal Service budget totals $130.2 million for 2017-2018 and represents 8.63% of our total budget. State accounting procedures require the establishment of a special fund to account for expenditures in our self-insurance programs. A major part of these funds is budgeted in other accounts and transferred to this fund during the year. Items in this year's internal service funds include self-funded health insurance, worker's compensation insurance and general liability insurance. Payment of all life, medical, and casualty insurance claims during the year will be made from this fund.
School District of Lee County2017-2018 Final Budget
33
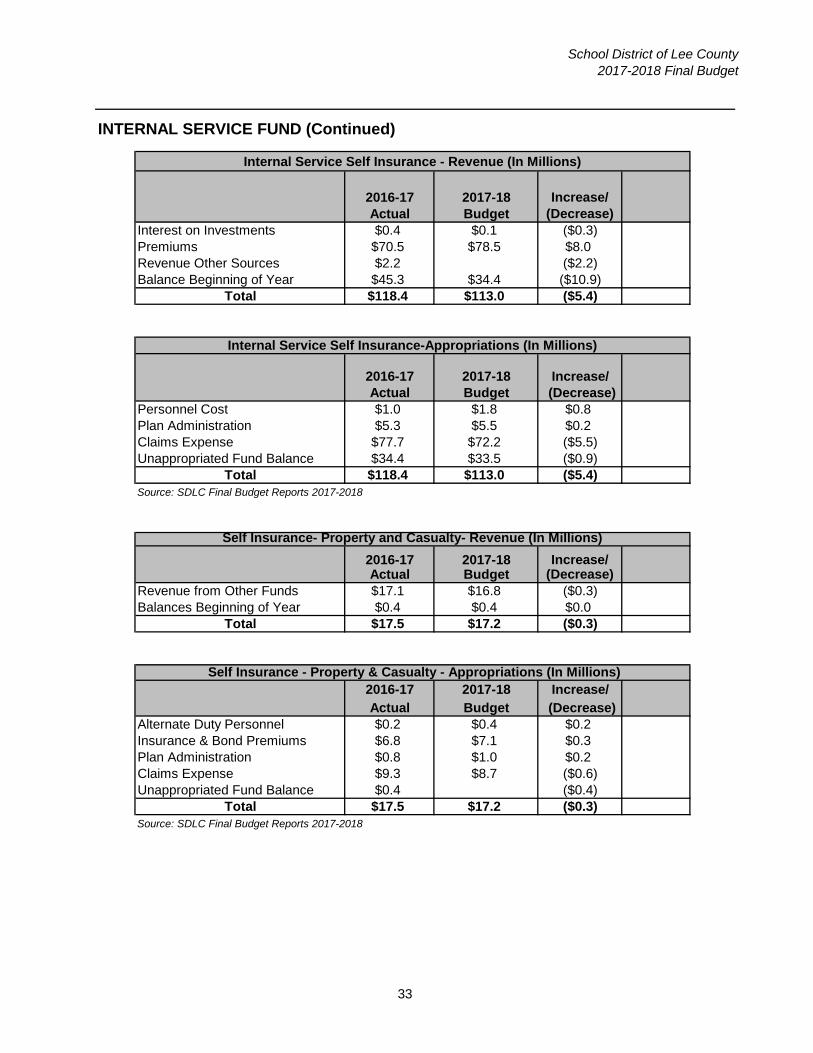
INTERNAL SERVICE FUND (Continued)
2016-17 2017-18 Increase/Actual Budget (Decrease)
Interest on Investments $0.4 $0.1 ($0.3)Premiums $70.5 $78.5 $8.0Revenue Other Sources $2.2 ($2.2)Balance Beginning of Year $45.3 $34.4 ($10.9)
Total $118.4 $113.0 ($5.4)
2016-17 2017-18 Increase/Actual Budget (Decrease)
Personnel Cost $1.0 $1.8 $0.8Plan Administration $5.3 $5.5 $0.2Claims Expense $77.7 $72.2 ($5.5)Unappropriated Fund Balance $34.4 $33.5 ($0.9)
Total $118.4 $113.0 ($5.4)Source: SDLC Final Budget Reports 2017-2018
2016-17 2017-18 Increase/Actual Budget (Decrease)
Revenue from Other Funds $17.1 $16.8 ($0.3)Balances Beginning of Year $0.4 $0.4 $0.0
Total $17.5 $17.2 ($0.3)
2016-17 2017-18 Increase/Actual Budget (Decrease)
Alternate Duty Personnel $0.2 $0.4 $0.2Insurance & Bond Premiums $6.8 $7.1 $0.3Plan Administration $0.8 $1.0 $0.2Claims Expense $9.3 $8.7 ($0.6)Unappropriated Fund Balance $0.4 ($0.4)
Total $17.5 $17.2 ($0.3)Source: SDLC Final Budget Reports 2017-2018
Internal Service Self Insurance - Revenue (In Millions)
Internal Service Self Insurance-Appropriations (In Millions)
Self Insurance- Property and Casualty- Revenue (In Millions)
Self Insurance - Property & Casualty - Appropriations (In Millions)

School District of Lee County2017-2018 Final Budget
34
SPECIAL REVENUE FUND - FOOD SERVICE
2016-17 Actual
2017-18 Budget
Increase/ (Decrease)
Federal Sources $41.7 $45.3 $3.6
State Sources: $0.6 $0.4 ($0.2)
Local Sources: $2.7 $2.7 $0.0
Beginning Balances $20.5 $21.8 $1.3
Total $65.5 $70.2 $4.7
Source: Final Budget Reports 2017-2018
2016-17 Actual
2017-18 Budget
Increase/ (Decrease)
Personnel Cost $17.3 $20.9 $3.6Food Cost $18.4 $22.6 $4.2Operational Cost $3.2 $3.8 $0.6Capital Outlay $4.8 $4.7 ($0.1)
Fund Balances: $21.8 $18.2 ($3.6)
Total $65.5 $70.2 $4.7
Source: Final Budget Reports 2017-2018
Special Revenue Fund - Food Service Revenue (In Millions)
Special Revenue Fund - Food Service Appropriations (In Millions)
The special revenue budget for the food service program totals $70.2 million for 2017-2018 and represents 4.65% of our total budget. The food service program of the School District of Lee County is supported by federal and state funds and through meal charges to adults and students. Federal and state funding programs include National School Lunch Program, School Breakfast Program, and the Summer Lunch Program.
The District operates self-contained and satellite kitchens for the preparation and serving of meals. Every school facility operated by the School District of Lee County is serviced by food services. Food service revenue is used to feed Lee County's over 92,000 children, and to fund upgrades to kitchens and kitchen equipment. The District now utilizes the Community Eligibility Program (CEP). This program qualifies all students at individual schools as eligible for free lunch based on the percentage of students that qualify for other Federal or State assistance. Based on the number of direct certified students in 2017-2018, 78 of our 84 schools serving meals are CEP schools, meaning all students at that school receive free lunch. The remainder of our schools still participate in the free/reduced lunch program. All District students may receive a free breakfast at all schools.
School District of Lee County2017-2018 Final Budget
35
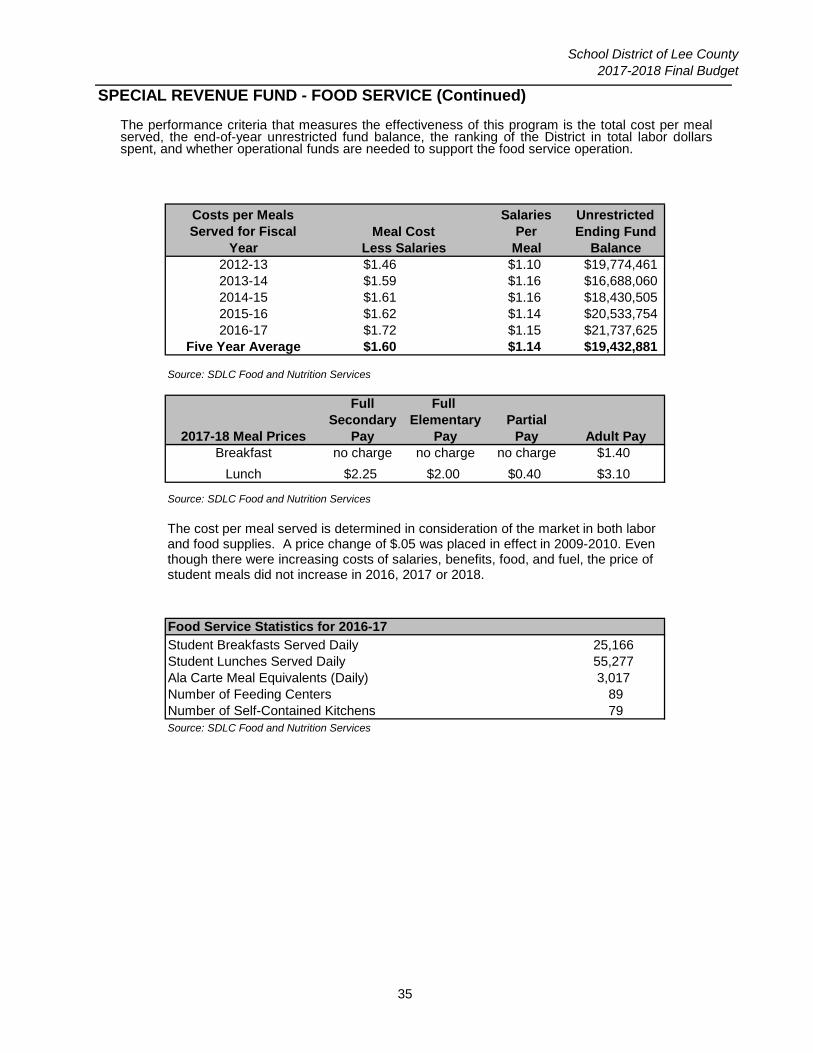
SPECIAL REVENUE FUND - FOOD SERVICE (Continued)
Costs per Meals Salaries UnrestrictedServed for Fiscal Per Ending Fund
Year Meal Balance2012-13 $1.46 $1.10 $19,774,4612013-14 $1.59 $1.16 $16,688,0602014-15 $1.61 $1.16 $18,430,5052015-16 $1.62 $1.14 $20,533,7542016-17 $1.72 $1.15 $21,737,625
Five Year Average $1.60 $1.14 $19,432,881
Source: SDLC Food and Nutrition Services
Full Full Secondary Elementary Partial
2017-18 Meal Prices Pay Pay Pay Adult PayBreakfast no charge no charge no charge $1.40
Lunch $2.25 $2.00 $0.40 $3.10
Source: SDLC Food and Nutrition Services
Food Service Statistics for 2016-17Student Breakfasts Served Daily 25,166Student Lunches Served Daily 55,277Ala Carte Meal Equivalents (Daily) 3,017Number of Feeding Centers 89Number of Self-Contained Kitchens 79Source: SDLC Food and Nutrition Services
Meal CostLess Salaries
The performance criteria that measures the effectiveness of this program is the total cost per meal served, the end-of-year unrestricted fund balance, the ranking of the District in total labor dollars spent, and whether operational funds are needed to support the food service operation.
The cost per meal served is determined in consideration of the market in both labor and food supplies. A price change of $.05 was placed in effect in 2009-2010. Even though there were increasing costs of salaries, benefits, food, and fuel, the price of student meals did not increase in 2016, 2017 or 2018.
School District of Lee County 2017-2018 Final Budget
________________________________________________________________________
36
DISTRICT BUDGET TRENDS The 2017-2018 budget reflects a continued trend of increasing growth for our school district and community. This year will make nine straight years of solid student growth for the district (between 1.5 and 2.5%), making us one of the most consistent and fastest growing districts in the state in terms of student growth. We project to have over 92,500 students in our district this year, which is 1,500 more students than last year, a 1.7% increase. This keeps us in the top ten largest districts in the state, and top 40 in the country. We believe the district’s growth is a positive indication of the area’s economy and the quality of our school district, and we welcome each student and family into our school district and community. This year’s increase in state funding for operations was slight at 1.38% per student funding. While this was a smaller increase than what we anticipated, we continue to focus on utilizing our resources efficiently to create the most impact in the areas of highest need. This means creating operational efficiencies in administrative and support areas in order to drive as many resources as we can to our schools for direct impact on our students. Our School Board voted in July, 2017 to bring a lawsuit against the state of Florida regarding House Bill 7069. This law was passed in the legislative session during the 2017 session, and contains provisions that, in our opinion, are detrimental to public education. One of the provisions in HB 7069 calls for sharing capital revenue with charter schools. This is of particular concern from a financial perspective. In addition, other provisions affect the educational program and usurp our authority to carry out our fundamental responsibility of providing a high quality education to all students. Ten school districts in Florida have joined this lawsuit, more are expected to join, and we expect this to be ongoing for some time. The 2018 budget includes resources to meet the many state and federal mandates that are required of the District, while focusing on the educational programs that make our District unique, including arts, STEM (Science, Technology, Engineering, and Math), International Baccalaureate, Cambridge, and dual language. The budget also contains additional resources for differentiated accountability to improve student and staff performance at those schools. We will continue to focus our resources until we earn and maintain “A” status. District’s goals this year include:
Create and implement an aggressive recruitment and retention plan to hire and keep high quality teachers and staff
Maximize student learning gains across all categories of students Implement teacher career ladder Implement a district school grading system and create the Lee County Academic
Standards of Excellence—our own standards to ensure students gain appropriate depth of knowledge at each grade level
Advancement of technology in our schools Focus professional development on creating leaders that enhance the district’s ability to
recruit and retain high quality personnel Provide appropriate resources to our students most in need Build community support and participation in school district initiatives
Budgeting for and delivery of a high quality educational program remains the primary focus for the School District of Lee County. The budget will support the education of over 92,500 students representing 159 countries and 98 different languages. The diversity of our student population demands a budget that supports the creativity and dedication of all school district employees that strive every day to make the School District of Lee County a world class school system.

School District of Lee County2017-2018 Final Budget
37
ANNUAL BUDGET Total Annual Budget 1,508,771,993$
Total General Fund Budget 875,546,812$ 58.03%Total Special Revenue Fund Budget 85,340,451$ 5.66%Total Food Service Fund Budget 70,205,148$ 4.65%Total Capital Fund Budget 288,500,250$ 19.12%Total Debt Service Fund Budget 59,015,542$ 3.91%Total Internal Service Fund Budget 130,163,790$ 8.63%
District operating average per day expenditure (255 days)(General Fund, Federal Projects, and Food Service, net of transfers and projected ending fund balance)Budgeted Cost per day to run School District of Lee County $3,791,505
Stakeholders:Population for Lee County As of April 1,2016:
Unincorporated 342,137 Cape Coral 170,474 Estero 30,565 Fort Myers 76,108 Bonita Springs 48,388 Fort Myers Beach 6,276 Sanibel 6,591 TOTAL 680,539
Students:Lee County 92,720National Ranking for number of students 33rdState Ranking for number of students 9th
Property tax base of 2016Assessed value for Lee County $81,973,613,642Required Local Effort (includes prior period adj.) $348,696,079 4.431 MillsBasic Discretionary $58,863,612 0.748 MillsCapital Outlay $118,042,004 1.500 MillsDebt Service N/A1 mill generates (x 96% collection rate x .001) $78,694,669 6.679 Mills Total
Number of SchoolsPermanent Buildings 799Number of Acres 3,217Total Square Feet under Roof 13,190,416Estimated Cost to Build a School:
High School $74,000,000Middle School $35,000,000K-8 School $32,000,000Elementary School $28,000,000
SCHOOL DISTRICT OF LEE COUNTY STATISTICS
Millage Levy

School District of Lee County2017-2018 Final Budget
38
Number of Schools:K-5 45K-8 4Middle Schools 16High Schools 14Special Schools 17Charter 24
TOTAL 120
TransportationNumber of buses 754Number of riders per day (eligible) 72,983Number of bus stops 6,447Number of miles traveled daily with students aboard 67,826Total miles per year with students aboard (route miles only) 12,208,648
EmployeesTotal number of employees (FTE) 11,561 Teachers (FTE) 5,757 49.80%Paraprofessionals/Helping Teachers (FTE) 1,786 15.45%Percent of Administrators including principals 3.36%Average teacher's salary $51,744Average teacher's benefits $14,507Average teacher's salary with benefits $66,251Total General Fund Salaries and Benefits (% of total general fund budget) $598,559,103.00Instructional Salaries $306,585,320.00Health insurance contribution for each employee $6,935.40Total Budget for cost of Health Insurance $66,001,436.00
Computer NetworkNumber of computers 118,216Number of sites networked 95Number of servers 885
District Ranking: FloridaLee--State Funding for 2017 9thLee--Teacher Salaries for 2017 29Lee--Number of students for 2017 9th
Food ServiceAverage breakfasts served per day in FY17 25,166Average lunches served per day in FY17 55,277Average Number of Ala carte-meal equivalents daily in FY17 3,017Number of feeding centers in FY17 89Cost of student lunch at Elementary School in FY17 $2.00Cost of student lunch at Secondary School in FY17 $2.25Number of Food Service Employees in FY17 736
Custodial ServicesNumber of custodial workers 542
Business ServicesVouchers paid in 2017 82,044Number of payroll checks/direct deposits in FY17 295,585

School District of Lee County2017-2018 Final Budget
39
Amount of Outstanding Debt of the DistrictPrincipal $431,389,301Interest $123,712,968Total $555,102,269
Accountability (State of Florida A++ Plan) (Elementary and Middle Only)Number of "A" schools (District and Charter) 24Number of Schools Improved One Letter (District and Charter) 23Number of Schools Improved Two Letters (District and Charter) 2Number of "D" or "F" Schools (District, Charter, Virtual) 8
VolunteersNumber of Volunteers per year 15,673Number of Hours Donated per year 446,608
School District of Lee County2017-2018 Final Budget
40
THIS PAGE INTENTIONALLY LEFT BLANK

School District of Lee County 2017-2018 Final Budget
41
THIS ORGANIZATIONAL SECTION OF THE BUDGET SUMMARY CONTAINS: Organizational and Management Structure
- Florida County Map - Current Organizational Chart - Zone Boundaries - Divisional Overview Financial Organization - Budget Structure - Financial Policies/Practices/Procedures - Budget Process - State’s Role in Education Policy and Finance - Florida Education Finance Program (FEFP) Strategic and Operational Goals - Strategic Plan
School District of Lee County 2017-2018 Final Budget
________________________________________________________________________
42
ORGANIZATIONAL AND MANAGEMENT STRUCTURE The School District of Lee County is committed to maintaining instructional equity for all students, while maximizing and celebrating diversity throughout the system. From 1878 when the first school opened its doors, parent and community partnerships have been encouraged to enhance student learning throughout the School District. The School Board consists of seven members. Five members are elected for four year terms, alternating every two years, at the November general election from five district school board member residence areas. They are elected solely by voters residing within their district of residence. These areas are approximately equal in population. Two board members will be elected “at large” (county wide). They will not be assigned a district and have no residency requirement. For the first term, the District 6 seat is a 2-year term and the District 7 seat is a 4-year term. Each school board member is charged with representing the entire School District. The Board has jurisdiction to establish policy, engage in contracts, approve building plans, approve staff, set salaries, and adopt the school budget. To assist in its deliberations, the School Board established a series of Citizen Advisory Committees that advise the School Board on areas of special interest or concern. Board meetings are normally held twice each month on Tuesdays at 6:00 p.m. at the Lee County Public Education Center.
Mary Fischer - District 1, Chairman Jane E. Kuckel, PhD - District 6, Vice Chairman
Melisa W. Giovannelli - District 2 Chris N. Patricca - District 3
Pamela H. LaRiviere - District 5 Cathleen O’Daniel Morgan – District 7
Gregory K. Adkins, Ed.D. - Superintendent The Board appoints the Superintendent of Schools who is responsible for the administration and management of the schools and for the supervision of the instruction in the School District. The Superintendent is vested as the Secretary and Executive Officer of the School Board. Similar to the Board, the Superintendent has established advisory committees of students, teachers, principals, and administrative staff to advise on various aspects of School District policy and procedures. The management structure for the School District of Lee County is based on quality principals and the professional learning community is our new foundation and way of work in Lee County Schools. The School District of Lee County is ranked 9th largest in student population in the state and 33rd largest in the nation according to the Lee County Government Economic Development Office. The District has estimated 93,584 students, with over 11,000 employees, approximately 5,700 of which are instructional staff with the remaining comprised of support staff, and part-time employees. There are a total of 120 schools in the District in the following categories:
45 Elementary Schools 16 Middle Schools
4 Combined Schools K-8 14 High Schools 14 Special Centers
3 Vocational Schools 24 Charter Schools
School District of Lee County 2017-2018 Final Budget
43
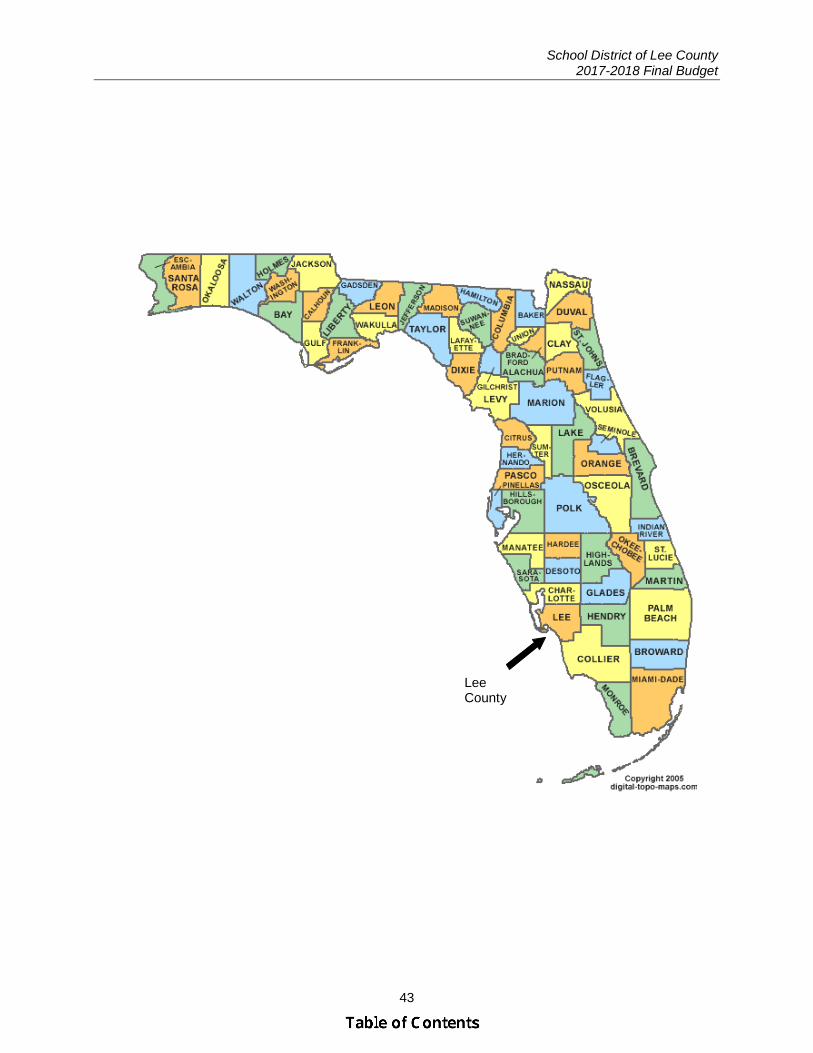
Lee County
School Board
Superintendent
Board Advisory Committees
School District Of Lee CountyFY 18 Proposed Organizational Chart
Public
Staff Attorney
DirectorInsurance & Benefits
Management
Chief Human Resources Officer
Assistant Director Recruitment
DirectorProfessional Standards
and Equity
DirectorApplication Services
DirectorInnovation Services
Executive DirectorInfrastructure Services
Assistant DirectorInfrastructure Services
Assistant Directors Transportation (3)
Chief Information Officer
Director, Compensation and Labor Relations
DirectorFinancial Accounting and
Property Records
DirectorBusiness Services
DirectorFood & Nutrition Services
& District Warehouse Operations
Executive DirectorFinancial Services
DirectorProcurement
Services
DirectorInternal Audit
DirectorPayroll
School Board Attorney
Executive DirectorElementary
School Development
Chief Operations Officer Chief Financial Officer
DirectorStudent Assignment
DirectorMaintenance
Director,Planning Growth and School
Capacity
Executive DirectorTransportation Services
Director, Safety and Security
Executive DirectorOperational Planning
Goal 1: Increase Student Achievement
Goal 2: Increase Family and Community Engagement
Goal 3: Increase Retention of Effective and Highly Effective Employees
Goal 4: Become a Model Continuous Improvement Organization
Executive DirectorLeadership, Professional
Development and Recruitment
DirectorStaffing & Talent
Management
Assistant Director Professional Development
Executive DirectorMiddle School
School Development
Executive Director, High School
School Development
Assistant Director, MTSS, Attendance,
and Social Work
Assistant Director, School Counseling
Director Career & Adult
Education
Director,Research and Assessment
DirectorIntervention Programs
Assistant Director, Intervention Programs
Coordinator Health Services
Coordinator Graduation
Director,Student Servicces
DirectorExceptional Student
Education
Assistant DirectorExceptional Student
Education
Senior DirectorTechnical Center
High School PrincipalsMiddle School
Principals
Director ofCurriculum Elementary
Principal on AssignmentElementary
Director of CurriculumSecondary (Middle)
Elementary Principals
Chief Academic Officer
Director of Curriculum Secondary (High)
Executive Director,Academic & Student
Support Services
DirectorCommunications
and Printing Services
Executive DirectorGovernment & Community
Relations
DirectorStrategic Planning & Community
Engagement
Coordinator, Resource Development
DirectorGrants & Charter
Schools
Assistant Director ofCurriculum Elementary
Assistant Director ofCurriculum Secondary
06/29/2017

Free school bus transportation is provided for students who live beyond two miles from their assigned school. Students residing in barrier island boundary areas of Fort Myers Beach, and Pine Island will attend their barrier island elementary school. Students residing in barrier island boundary area of Sanibel Island will attend their barrier island elementary and middle school.
WEST ZONEStudent Assignment Office
Cape Coral .................................................1Elementary Schools
Caloosa (U) ................................................5Cape ..........................................................6Diplomat (U) ..............................................8Gulf .........................................................16Hancock Creek ........................................17Hector A. Cafferata, Jr. (U) ........................40J. Colin English (U) (IB).............................19Littleton (U) ................................................9NFM Academy for the Arts (K-8) (A) (U) .....23Patriot ......................................................44Pelican .....................................................26Skyline ....................................................30Trafalgar (U) .............................................34Tropic Isles ..............................................38
Middle SchoolsCaloosa ......................................................3Challenger ................................................17Diplomat.....................................................5Gulf ...........................................................8Mariner (IB) ..............................................10NFM Academy for the Arts (K-8) (A) (U) ....23Trafalgar ..................................................13
High SchoolsCape Coral (IB) ..........................................1 Ida S. Baker (C) ........................................10Island Coast .............................................13Mariner .....................................................7North Fort Myers (A) (CA) ...........................8
SOUTH ZONEStudent Assignment Office
Fort Myers .................................................2Elementary Schools
Allen Park ..............................................1Bonita Springs (U) (A) ............................4Colonial (U) ............................................7Edison Park (A) ................................... 11Franklin Park (U) ................................. 13Heights (IB) .......................................... 18Orangewood ......................................... 25Pinewoods ........................................... 28Ray V. Pottorf ...................................... 41Rayma C. Page (U) ............................... 42San Carlos Park (U) (A) ........................ 29Spring Creek (U) .................................. 31Tanglewood .......................................... 33Three Oaks .......................................... 36Villas ................................................... 39
Middle SchoolsBonita Springs (A) ..................................2Cypress Lake (A) ....................................4Fort Myers Middle Academy (U) (T) ....... 16Lexington (IB) ...................................... 15Paul Laurence Dunbar ......................... 11Three Oaks (U) ..................................... 12
High SchoolsBonita Springs (9th grade only) ............ 14Cypress Lake (A) ....................................2Dunbar Zone Magnet (IB STEM) ............... 3Estero (CA) ............................................4Fort Myers (IB) .......................................5South Fort Myers (C) ............................ 11
EAST ZONEStudent Assignment Office
Lehigh Acres .............................................3Elementary Schools
Alva (K-8) .................................................2Bayshore (U) ............................................3Edgewood Academy (A) (U) ................... 10G. Weaver Hipps ...................................... 45Gateway ................................................15Harns Marsh .........................................43James Stephens Academy (U) ..................6Lehigh ...................................................20Manatee (U) ...........................................14Mirror Lakes (U) .....................................22Orange River (U) ....................................24River Hall (U) .........................................12Sunshine ...............................................32Tice (FL) .................................................37Tortuga Preserve (U)...............................46Treeline (U) ............................................35Veterans Park (K-8) (A) (U) .....................27
Middle SchoolsAlva (K-8) .................................................2Harns Marsh (STEM) (U) ........................28Lehigh Acres (U) .....................................14Oak Hammock (A) (U) ............................18Varsity Lakes (U)......................................7Veterans Park (K-8) (A) (U) .....................27
High SchoolsDunbar (IB STEM)......................................3East Lee County (C) (CA) ........................12Lehigh Senior (A) (CA) ..............................6Riverdale (IB) ...........................................9
(A) Arts Program; (C) Comprehensive Program; (IB) International Baccalaureate; (CA) Cambridge Program; (T) Technology Program;(STEM) Science, Technology, Engineering, Math; (FL) Foreign Language; (U) this school has a uniform clothing policy
THE ScHOOl DiSTricT Of lEE cOUNTy
STUDENTASSIGNMENT
ZoNES2017-2018
Elementary
Middle
Multi-LevelHigh
Multi-ZoneStudentAssignment Office
W-3
W-2
W-1
S-1
S-2
S-3
E-1
E-2E-3
45

School District of Lee County 2017-2018 Final Budget
_____________________________________________________________________________
46
DIVISIONAL OVERVIEW ACADEMIC SERVICES DIVISION The Academic Services Division is organized into the following departments:
• School Development • Academic & Student Support • Accountability, Research & Assessment • Adult & Career Education • Curriculum & Instructional Innovation, Elementary • Curriculum & Instructional Innovation, Secondary • Exceptional Student Education • Grants & Charter Schools • Intervention Programs (including Title I and Migrant Services) • Student Services • Student Welfare and Attendance • Psychological Services • Health Services • Early Childhood Learning Services
School Development is there to support, develop and serve schools to ensure the development of our schools and student success. This is accomplished through the alignment of student and school information, curriculum/instructional practices and communication between the parents and schools. Academic & Student Support overseas Grants & Charter Schools, Exceptional Student Education, Intervention Programs, Psychological Services. They also oversee the multi-tiered structure of support (MTSS) process that enables all schools to initiate intervention activities for students who are academically at risk. They are implementing initiatives to increase student graduation rates focusing on Charter School graduation rates. In Intervention Programs, one of the District’s main points of focus has been to offer the best support to our school based staff and community while assisting schools in meeting District, State, Supplemental, and Federal compliance and student achievement standards. Focused support for economically needy and bilingual students, as well as volunteer planning takes place in this department. All District schools participated in recruiting volunteers to assist our students. The number of volunteer hours has continued to increase. Early Childhood Learning Services includes Head Start and Early Head Start programs. In addition, the Voluntary Prekindergarten Program (VPK) and LAMP (teen parent program) are also part of the Early Childhood Learning Services. These services are to enhance school readiness for young children, age birth to five, so they can enter kindergarten ready to learn. The majority of children served in the program are minority students from low income families that have additional risk factors. Student Services helps broaden educational experiences by providing professional assistance and coordinated activities to help students, families, schools, and the community overcome challenges that interfere with academic achievement, personal, social, physical, and career development. They provide training and activities to support Anti-Bullying Efforts. They also run the Safe Schools programs which provide School Resource Officers and Alternative to Suspension Programs.

School District of Lee County 2017-2018 Final Budget
_____________________________________________________________________________
47
ACADEMIC SERVICES DIVISION (cont.) Student Welfare and Attendance (SWAT) is to support schools in their efforts to achieve academic success by providing attendance services and professional social work interventions to students, families, & schools. Student Welfare and Attendance continued its work to serve and improve the attendance of some of our neediest students, including homeless youth and children in foster care. Psychological Services is to enhance and maintain the well being of all students and maintain regulatory compliance through timely and accurate psychological evaluations to help diagnose various learning, developmental and behavioral disorders as well as needs for gifted education. The Health Services Department advances the health, well-being, academic success, and life-long achievements of students. They provide medical and health services to all schools in the District, including state mandated screenings and immunization surveillance, assessment, and management of acute and chronic health and medical conditions, and control of infectious and communicable diseases. Exceptional Student Education (ESE) provides all students with disabilities a high quality educational program in the least restrictive learning environment. Curriculum & Instructional Innovation, Elementary establishes relevant and rigorous curriculum aligned to the Florida Standards and Next Generation Sunshine State Standards. They also provide guidance, leadership, professional development in support of curriculum, instruction and assessment. Curriculum & Instructional Innovation, Secondary establishes relevant and rigorous curriculum aligned to the Florida Standards and Next Generation Sunshine State Standards. They also provide guidance, leadership, professional development in support of curriculum, instruction and assessment, and college and career readiness skills. Adult & Career Education instructional programs consist of Adult Education, Cape Coral Technical College, Ft. Myers Technical College, Southwest Florida Public Service Academy, and Dunbar Community School. Currently, all district High Schools have CAPE Academies. Tech & Career Ed has provided industry certificate training to all business and IT teachers. Grants & Charter Schools support student learning by securing grant funding, assisting with high quality implementation of those grants, and supporting compliance with related legal and program requirements. It is the liaison between the District and Charter Schools. They also collaborated in the planning and implementation of a new Charter School Information Management System. This allows departments to provide sponsor services to charter schools. Accountability, Research & Assessment provides accurate data to administrators, schools, the Board, and the community in an accurate and timely manner. They also manage test administration, provide test materials, manage school improvement, district improvement and interpret the results for the District. They are also responsible for the planning, coordination and overall implantation of accountability services, projects and activities in the district with an emphasis on the interpretation and use of teacher evaluation data, including the Value Added Measure, to improve student achievement. The department has improved the level of skills among administrators and instructional personnel in the areas of accessing, understanding, and analyzing student achievement data through written materials and data analysis workshops.

School District of Lee County 2017-2018 Final Budget
_____________________________________________________________________________
48
OPERATIONS DIVISION The Operations division is responsible for the following departments:
• Facility Development & Programming Services • Maintenance • Central Services • Planning, Growth, & School Capacity • Safety & Security • Student Assignment • Transportation
Facility Development & Programming Services strategically plans, designs and builds student stations and support spaces for the District to meet all education programming requirements. The Maintenance Department provides services to ensure adequate facilities for the students, staff, and community for the Lee County School District. It allows students and staff to work and learn in an environment that is safe and sanitary and enhances the instructional program. Major efforts have been mounted to increase energy efficiency and decrease cleaning time by improving equipment. The department also has a Building Supervisor training program. Central Services is the staff at the administration building. They are in charge of making sure equipment is in place when needed, keeping the building clean, and maintaining the grounds and parking area. The Planning, Growth, & School Capacity Department provides reliable and accurate information by which the District will optimize the utilization of schools and ancillary facilities, meet the constitutional mandates for class size and effectively implement school concurrency. Projections are based upon residential student population projections, desegregated by demographic and ESE service delivery characteristics. It also coordinates the purchase of needed property for schools and ancillary facilities, completes the Educational Facilities Surveys, participates in completion of the five-year work plan, and helps establish school-by-school, program-by-program, grade-by-grade capacities at schools for student assignment and budgetary purposes. Planning, Growth, & School Capacity manages enrollments in schools within zones and sub-zones for efficient, effective, and equitable utilization. Safety & Security works to maintain a secure environment for all students, staff and visitors. It is the liaison to the SRO Program. This department also maintains the compliance of all inspections that are mandated by the Federal and State Statutes, as well as with local ordinances and Board Policies. Student Assignment registers and enrolls students into the District in accordance with the student assignment plan based on residence, grade, program, preferences, parent rankings and availability. They provide accurate and professional service to all new, re-enrolling, or transferring students and families. The Transportation Department transports more than 70,000 students to and from school on a daily basis over an 804 square mile area. There are 754 buses in service and more than 67,000 miles are traveled daily. They also service and maintain over 1,200 district vehicles.

School District of Lee County 2017-2018 Final Budget
_____________________________________________________________________________
49
INFORMATION SYSTEMS DIVISION The Information Systems division is responsible for the following departments:
• Application Services • Infrastructure Services • Innovation Services
Application Services provides data processing services and information support for the District; maintains and provides access to the District’s administrative data and designs, enhances, and supports the District’s administrative applications. It also supports the electronic transmission of data; satisfies the data reporting requirements of the Department of Education, and manages the data and processes necessary for Full-Time Equivalency (FTE) generation. Infrastructure Services manages the District’s technology infrastructure and provides engineering, support and project management services to the schools and administrative departments. Innovation Services provides support, maintenance and business analytic services for our Financial, Human Capital and Enterprise Learning systems. The department models and implements new business processes and tools for effective operations. The systems also maintain and produce data needed for State and Federal reporting. HUMAN RESOURCES DIVISION The Human Resources division is responsible for the following departments:
• Insurance & Benefits Management • Staffing & Talent Management • Professional Standards & Equity • Recruitment • Compensation & Labor Management • Professional Development
Insurance & Benefits Management administers all District insurance and employees benefit programs to include health, life, dental, vision, income protection, flexible spending accounts, flexible benefits, tax sheltered accounts, and the District’s wellness and employee assistance programs. This department also oversees the property, casualty, general, professional liability, auto, and worker’s compensation programs and the purchase of all insurance, reinsurance, and self-insured lines of coverage. Staffing & Talent Management provides services include all phases of the employment process, including application, fingerprinting, initial hire, transfers, retirement, and termination. Ensures the maintenance of accurate and updated information on District employees to achieve proper reporting to local, state national agencies. Additionally, the department processes all certification applications and renewals, FMLA leave requests, sick leave bank withdrawals, Florida retirement plans, and unemployment claims. Professional Standards & Equity ensures all employment related conduct is held to the highest ethical, moral, and professional standards as set forth by Board Policies, contractual obligations, and state and federal statutes. They are also committed to ensuring equal opportunities for all students and staff in all programs and activities offered by the school district. Efforts are made to remove barriers to academic and student support services as well as barriers to employment opportunities in the public education workforce.

School District of Lee County 2017-2018 Final Budget
_____________________________________________________________________________
50
HUMAN RESOURCES DIVISION (cont.) Recruitment provides major support roles in recruiting, maintaining, and retaining a qualified and diverse workforce by providing services to schools and departments. Establish processes and activities to ensure sourcing and attraction of top talent. Compensation & Labor Relations develops the salary schedules and oversee internal job analysis and evaluation to ensure appropriate classification and grading of jobs. They manage the negotiations and bargaining agreements with two collective bargaining groups, TALC & SPALC. Professional Development develops professional development systems, processes and activities for District, school and individual professional development that aligns with state and national standards. Recruits, trains and retains high quality educational leaders, highly qualified and highly effective teachers and other instructional personnel to enhance student learning. BUSINESS & FINANCE DIVISION The Business & Finance Division include:
• Budget • Financial Accounting & Property Records • Food & Nutrition Services • District Warehouse Operations • Internal Audit • Payroll • Procurement Services
The Budget Department has the responsibility of compiling, communicating, and monitoring an equitable and balanced budget in support of the District’s strategic plan. Major events throughout the year include the estimation and reporting of FTE which is the basis of the general fund’s major source of funding, allocation of resources to schools and departments, and presentations to the board and public communicating how dollars are budgeted in our system. Financial Accounting and Property Records is in charge of paying all of the District’s invoices and keeping track of the District’s depreciable equipment. They accurately and efficiently report, manage, and monitor the District’s assets and make timely payment to vendors to garner goodwill of vendors and maintain excellent financial ratings. The department also handles investments with the State Board of Administration (SBA) and US Bank as Trustee for the COPs funds requiring monthly reconciliations and withdrawals as needed to fund expenditures. This department is also responsible for the District’s document imaging project, property inventory and records management. Food and Nutrition Services provide meals that nourish over 92,000 students, enhancing their readiness to learn. They accomplish this within state and federal guidelines and without the use of funds intended for instruction. District Warehouse Operations (DWO) purchases key supply items for schools and departments to realize substantial cost savings. They also perform work requests moving furniture and equipment between schools and departments. DWO monitors and troubleshoots garbage and recycling at all schools and administrative buildings. They also oversee uniform ordering and invoicing.

School District of Lee County 2017-2018 Final Budget
_____________________________________________________________________________
51
BUSINESS & FINANCE DIVISION (cont.) Internal Audit assures the District is in compliance with School Board rules and state statutes by assisting, guiding, and educating bookkeepers and principals in regards to internal funds. It also adheres to Florida Administrative Code Rule 6A-1.087 providing for an annual audit of internal funds. They assist schools with better understanding of policy and procedures related to internal funds. There is training offered to principals, assistant principals, and bookkeepers in accounting functions and internal funds. Internal Audit also works with Construction Services with ranking various construction and engineering firms to decide what firms win district construction projects. The Payroll Department’s responsibility is to calculate accurate wage payments to employees in a timely manner. They must meet compliance issues of the Fair Labor Standards Act, Internal Revenue Service, Social Security Administration, and Florida Retirement System to avoid penalties. Other services include processing insurance benefit deductions, voluntary and other payroll deductions, wage verifications, absence reports, and leave requests for attendance and absenteeism records. Procurement Services is the District’s primary repository and resource center for information, advice, assistance, and support with respect to procurement activities and issues. They assist schools and departments with all purchasing activities. Major responsibilities include ensuring the maximum value is derived from the expenditure of District resources through mutually beneficial vendor relationships created by fair and open competition; facilitating the establishment of appropriate standards and specifications that are the basis for all competitive bid and proposal solicitations; managing the evaluation of competitive offers received from vendors; developing appropriate contract award recommendations; assisting schools and departments in contract administration functions; resolution of disputes with vendors, and administration of the District P-Card program.

School District of Lee County 2017-2018 Final Budget
_____________________________________________________________________________
52
THIS PAGE INTENTIONALLY LEFT BLANK

School District of Lee County 2017-2018 Final Budget
53
FINANCIAL ORGANIZATION
BUDGET STRUCTURE The budget of the School District of Lee County is prepared in accordance with the requirements of Florida State Statutes, Florida Department of Education Administrative Rules, and the "Financial and Program Cost Accounting and Reporting for Florida Schools", commonly known as the "Red Book." Budgetary accounts are maintained on a modified accrual basis1 in accordance with Generally Accepted Accounting Principles. The District’s audited financial statements are presented in the format required by the Governmental Accounting Standards Board (GASB) Statement 34. GASB Statement 34 uses the accrual basis of accounting2 for the Government-Wide Financial Statements, proprietary and fiduciary fund statements. The Statement also requires the modified accrual basis of accounting for the general, special revenue, debt service and capital projects fund statements. The budget is divided into six major fund groups: • General Fund provides funding for the operations of the School District of Lee County, • Debt Service Funds provide for the retirement of debt and lease-purchase obligations (COPs), • Capital Funds are comprised of state and local revenue allocations to build and maintain District
buildings and to purchase equipment, • Special Revenue Funds are comprised primarily of federal categorical grants, • Internal Service Funds are essentially clearing accounts for the School District's insurance programs,
with funding levels determined by insurance activity and actuarial requirements, • Food Service Fund is supported from revenue from food sales and allocations from the federal
government. State regulations require school districts to present their budgets on the basis of “functions” and “objects”. Functions designate where the money was spent, (i.e., classroom instruction or instructional pupil personnel services, etc.). Objects show what the money was spent on, (i.e., salaries, supplies, etc.). This budget document uses functional and object summaries that are informative and beneficial to the reader. 1 The method of accounting in which revenues are recognized when earned and available 2 The method of accounting in which revenues are recorded when levies are made and expenditures are recorded as soon as they result in liabilities, regardless of when the revenue is actually received or the payment is actually made.
School District of Lee County 2017-2018 Final Budget
54
FINANCIAL POLICIES/PRACTICES/PROCEDURES
School Board Policy Policy 6.02 of the Lee County School Board, states that the Superintendent shall annually prepare and recommend to the School Board a balanced District budget that reflects consideration of strategic planning for successful student academic achievement, student and staff safety, District goals and priorities, maximize budgets distributed to schools and continue cost containment. The policy further states that amendments to the budget shall be approved by the Board within 60 days of the end of the month in which expenses occurred with no amendment being approved after the due date of the Annual Financial Report for that year. Capital Allocations and Long Range Planning The capital budget is prepared within the framework of the five-year capital plan. The plan, in accordance with guidelines issued by the Florida Department of Education, is driven by a needs assessment based on increased student enrollment, site acquisition needs, and the need for repairs and renovations to existing District facilities. The five-year capital plan is used as a planning document to assess and determine the priority and timing of capital projects. This plan is revised annually, and all amendments to the plan are approved by the Board. Investment of Funds Policy 6.05 of the Lee County School Board ensures that all funds in excess of the amounts needed to meet current expenses shall be invested to earn the best possible risk adverse yield for the period available. The Superintendent, under advisement of School District financial staff, and the District’s investment advisor, shall determine the best risk adverse yield from investments such as bids from qualified depositories, certificates of deposit, time deposits, securities guaranteed by the United States Government, State Board of Administration Trust Fund, or other forms of authorized investments. This policy ensures that our funds are sensibly invested, while realizing a reasonable rate of return. Use of One Time Revenues To avoid issues caused by revenue shortfalls in critical areas, the Lee County School District avoids using temporary revenue to fund ongoing services. One time revenues shall be used to fund temporary expenditures. Contingencies/Reserves Each annual budget is designed to maintain an adequate amount of resources in reserve, and to protect the District and community from any disruption in services due to revenue shortfall. The District strives to maintain reserves of no less than 3% of total general fund revenues, with an ongoing goal to maintain reserves of no less than 5% of total general fund revenues. Expenditure Accountability Reports on current budget condition, including comparison of budget to actual expenditures, are prepared and presented to the Board monthly.

School District of Lee County 2017-2018 Final Budget
55
BUDGET PROCESS
Fiscal Year The School District's fiscal year begins July 1. Under State law, the School District operates under a tentative budget adopted in July until the final budget is adopted in September.
The two major elements of the budget development process are the determination of revenues and the allocation of resources. Advertisement of Tentative Budget and Proposed Millage Rates The Superintendent of Schools is responsible for recommending a tentative budget and proposed ad valorem property tax millage rates to the School Board. By law the School Board must advertise a tentative budget and the proposed millage rates in a daily newspaper of general circulation in the county within 29 days after receiving the certification from the Property Appraiser. The advertisements contain a budget summary, proposed millage rates and a notice of the date, time and address of the first public hearing on the budget. The advertisement was published in the News Press on July 21, 2017 and the tentative budget hearing was held on July 25, 2017 at the Lee County Public Education Center. Second (Final) Public Hearing The second public hearing is required to be held at least 65 days, but not more than 80 days, after receiving the tax roll certification from the Property Appraiser. After this public hearing, the School Board adopts the final budget and a resolution stating the ad valorem property tax millage rates to be levied. The final public hearing will be held on September 5, 2017 at 5:05 p.m. at the Lee County Public Education Center. Budget Regulations Regulations of the State Board of Education require that expenses may not be incurred in excess of School Board approved appropriations. The budgetary accounts of the District are grouped into funds in accordance with generally accepted accounting principles and standards prescribed by the Florida Department of Education. The budget document contains budget information for each of the funds or fund groups of the District for which a budget must be adopted. Revenue Determination The State Legislature plays a central role in determining the revenues available to the School District. These revenues are allocated to school districts through the Florida Education Finance Program (FEFP). This allocation is determined on the basis of projected student populations or "FTE's" (Full Time Equivalent students; see glossary).
The revenue determination process begins in December when the School District submits enrollment projections for the following school year to the state. Preliminary revenue estimates are made in January. These estimates are used to determine initial allocations to schools and to analyze the effects of proposed legislative actions on the School District budget.
Revenue estimates are revised during April, May and June based on legislative action and available information. These estimates are used in preparing and presenting the preliminary budget to the School Board in June. Final action on appropriations is normally taken by the Legislature in a time frame that allows final allocations to be used in presenting a tentative budget to the School Board in July.
Final required millage determinations and discretionary millage limits are annually determined by the state by July 19th. The School Board, at a public hearing, sets proposed millage by August 3rd. Final revenue estimates including actual fund balances and appropriations are approved for adoption at a public hearing in September.

School District of Lee County 2017-2018 Final Budget
56
Resource Allocation School District activities can be grouped into two major categories: the operation of individual school units and district level activities that support all of the schools. The District level support to schools is organized in a department format.
The preparation of budget allocations can be divided into three major categories: school allocations, departmental allocations, and the capital budget. School Allocations Schools receive most of their funding through District Resource Allocations, or DRAs. DRA allocations are made to schools using a formula based primarily on weighted full time equivalents (WFTE; see glossary). The DRA system provides a predictable allocation for financial planning. Consolidating the majority of school allocations into a single funding process establishes a more equitable distribution of resources to the schools. The principal, with input from the school staff and School Advisory Committee, determines the staffing level that most effectively meets the educational needs of the school’s student population. The decentralization of the resources to the school level allows for increased flexibility by the schools in making resource allocation decisions most appropriate for the individual sites.
Some school allocations are considered non-DRA, that is, outside of the DRA allocation process. These include positions such as Principal, Secretary to the Principal, grant-funded positions, and food service staff. Non-Personnel dollars are distributed by formula based on FTE or WFTE for supplies, substitutes, equipment, textbooks, and high cost science lab materials.
Some schools do not use the DRA allocation method for the distribution of resources. These schools have unique situations where the student enrollment is not stable during the school year. These schools include the Juvenile Justice programs, Success Academy, Virtual education, vocational-oriented schools, and Adult Education schools.
All schools are allowed to budget funds according to priorities established at the school level within required state and District standards. To the extent that funds can be made available, schools are allowed to carry over unexpended funds (except for salaries and benefits) from one fiscal year to the next.
Departmental Allocations In 2017-2018 departments developed their proposed budgets taking into consideration the District’s Vision 20/20, their department goals and the most efficient use of funds. Once all departments proposed budgets were received, the information was compiled and reviewed by the Superintendent’s Cabinet for recommendations to the Board. The Superintendent’s Cabinet consists of the Superintendent and upper level District administration.
School District of Lee County 2017-2018 Final Budget
57
THE STATE’S ROLE IN EDUCATION POLICY AND FINANCE
In Florida, as in all states, the ground rules for the educational system are established by the state. A general understanding of state requirements is essential to understanding the School District's budget development and implementation process.
The State’s Role in Revenue Determination Almost 59% of the general fund for the School District of Lee County comes from local sources, primarily the local ad valorem property tax. The amount of revenue available to a school district is, however, largely determined by the state legislature. Under the Florida Education Finance Program (FEFP) (explained in greater detail on the following page) the state determines the basic funding for a school district on a formula basis. It then requires the district to levy millages to pay the local share of the funding. The state's share is added to this, resulting in the total FEFP budget. School districts are given the option of levying "discretionary" local millage, with separate state limits set for operating and capital purposes. As a practical matter, the "discretionary" millage is essential for school district operations, and is generally levied at the state authorized levels. Except for limited effects on discretionary and capital millage revenues, increases in property values in Lee County do not benefit the School District. Through its equalization formulas, the state makes a district pay for a larger share of the state formula amount, without increasing the funds available to school districts. With revenues essentially determined by the state, the primary budget issue for a school district becomes the proper allocation and utilization of funds for educational purposes.
The State's Role in Budgetary Allocations Florida State Statutes, Chapters 1000-1013, and the Administrative Rules implementing them, specify in substantial detail the what, when, and how of the delivery of educational services at the local level. Funds expended under the Florida Education Finance Program are allocated primarily on the basis of the number of students and the educational programs they require. The state has a comprehensive program and cost reporting system that requires extensive data collection and maintenance on practically every aspect of district program and fiscal operations. While much of this data is useful for necessary program management purposes, it contributes to significant administrative expense outside the classroom and school setting. Thus, while the School Board has significant discretion in establishing policy and directing district operations, it is significantly constrained in budgetary matters by Florida State law and regulations.

School District of Lee County 2017-2018 Final Budget
58
THE FLORIDA EDUCATION FINANCE PROGRAM (FEFP) In 1973, the Florida Legislature passed the Florida Education Finance Program (FEFP) with the following purpose: "To guarantee to each student in the Florida public educational system the availability of programs and services appropriate to his or her educational needs which are substantially equal to those available to any similar student notwithstanding geographic differences and varying local economic factors." The FEFP determines the budget level for each school district, including both state and local revenue sources. The FEFP uses a formula to recognize (1) varying local property tax bases, (2) varying program costs, (3) district cost differentials, and (4) differences in per student costs for equivalent educational programs due to sparsity and dispersion of student population. For each school district, the state determines the total school district FEFP allocation, what the state share should be, and then determines the local share. The state then sets the local millage rate required to generate the required local share. School districts must impose the state established millage rate in order to obtain the State share of funding for district programs. The state also establishes additional millage levels, which a school district may impose on a "discretionary" basis for operating purposes. The current base rate is .748 mills. School boards could previously levy an additional discretionary millage to raise an amount not to exceed $100 per FTE or .25 mills. Since FY10 additional discretionary millage has not been allowed by the legislature. In FY11, the legislature gave school districts the opportunity to levy an additional tax of up to .25 mills for critical operating needs. This opportunity is now only allowed if local taxpayers agree through an election to continue this critical needs millage. A full time equivalent (FTE) is equal to any regular education student in the fourth through eighth grade attending classes for a full year. A "base student allocation" is determined for that student (for FY18, it is $4,203.95). Any other student is "weighted" to compensate for calculated differing program cost factors for that student. The total amount of FEFP money for a school district is determined by the weighted full-time equivalent students anticipated in the school district for the school year, adjusted by cost differentials and other FEFP factors and funding categories that may apply. Student counts are taken during the fiscal year and funding is adjusted based on actual enrollment.
School District of Lee County 2017-2018 Final Budget
59
THIS FINANCIAL SECTION OF THE BUDGET CONTAINS: Financial Section Consolidated Funds (all funds)
- Consolidated Funds Statement - 2017-2018 Budget Summary - Details of Balances and Reserves - School District Budget Illustrations - All Funds Summary: Revenue Sources - All Funds Summary: Expenditures by Object - Three Year History of Expenses by Major Objects - 2017-2018 Approved Budget Breakdown - Staffing Comparison-All Funds - Summary of Organizational Budgets – All Funds General Fund
Debt Service Fund Capital Projects Fund Special Revenue Fund-Federal Special Revenue Fund-Food Service Internal Service Fund
School District of Lee County 2017-2018 Final Budget
60
FINANCIAL SECTION This section displays details concerning all funds, combined and individually, of the School District of Lee County’s budget. The budget of the School District of Lee County is prepared in accordance with the requirements of Florida State Statutes, Florida Department of Education Administrative Rules, and the "Financial and Program Cost Accounting and Reporting for Florida Schools", commonly known as the "Red Book." Budgetary accounts are maintained on a modified accrual basis1 in accordance with Generally Accepted Accounting Principles. The District’s audited financial statements are presented in the format required by the Governmental Accounting Standards Board (GASB) Statement 34. GASB Statement 34 uses the accrual basis of accounting2 for the Government-Wide Financial Statements, proprietary and fiduciary fund statements. The Statement also requires the modified accrual basis of accounting for the general, special revenue, debt service and capital projects fund statements. The budget is divided into six major fund groups: • General Fund provides funding for the operations of the School District of Lee County, • Debt Service Funds provide for the retirement of debt and lease-purchase obligations (COPs), • Capital Funds are comprised of state and local revenue allocations to build and maintain District
buildings and to purchase equipment, • Special Revenue Funds are comprised primarily of federal categorical grants, • Internal Service Funds are essentially clearing accounts for the School District's insurance programs,
with funding levels determined by insurance activity and actuarial requirements, • Food Service Fund is supported from revenue from food sales and allocations from the federal
government. State regulations require school districts to present their budgets on the basis of “functions” and “objects”. Functions designate where the money was spent, (i.e., classroom instruction or instructional pupil personnel services, etc.). Objects show what the money was spent on, (i.e., salaries, supplies, etc.). This budget document uses functional and object summaries that are informative and beneficial to the reader. 1 The method of accounting in which revenues are recognized when earned and available. 2 The method of accounting in which revenues are recorded when levies are made and expenditures are recorded as soon as they result in liabilities, regardless of when the revenue is actually received or the payment is actually made.

SCHOOL DISTRICT OF LEE COUNTY FINAL BUDGETCONSOLIDATED FUNDS STATEMENT
2017-2018
CONSOLIDATED FUNDS
ACCOUNT DESCRIPTIONGENERAL
FUNDSDEBT
SERVICECAPITAL
PROJECTSSPEC. REV. FOOD SERV
SPEC. REV. FEDERAL
INTERNAL SERVICE
APPROVED BUDGET 2017-
2018ACTUAL 2016-
2017*ACTUAL 2015-
2016*FEDERAL OTHER FEDERAL DIRECT……………………… 1,733,000 20,898,414 22,631,414 20,974,703 21,336,991 RACE TO THE TOP EDUCATIONS FOR HANDICAPPED ACT…… 28,314,332 28,314,332 18,108,009 16,881,391 TITLE I…………………………………………. 33,199,129 33,199,129 28,819,633 27,563,097 SCHOOL MEALS REIMBURSEMENT………… 42,339,595 42,339,595 40,033,199 36,861,216 ESEA TITLE VI………………………………… 0 OTHER FEDERAL REVENUE………………….. 2,550,000 3,023,014 2,928,576 8,501,590 11,002,637 10,210,278TOTAL FEDERAL……………………………………. 4,283,000 0 0 45,362,609 85,340,451 0 134,986,060 118,938,181 112,852,973STATE FEFP………………………………………………. 178,269,075 178,269,075 163,848,436 165,767,538 WORKFORCE DEVELOPMENT……………….. 9,697,421 9,697,421 10,064,226 10,026,007 LOTTERY……………………………………… 1,557,106 1,557,106 1,544,033 CLASS SIZE REDUCTION………………………. 101,832,320 101,832,320 100,383,530 99,525,290
SCHOOL RECOGNITION FUNDS……………… 1,490,006 1,490,006 1,490,006 3,846,668 PECO…………………………………………… 1,926,462 1,926,462 1,926,462 1,277,972 CHARTER SCHOOL CAPITAL OUTLAY 4,035,000 4,035,000 3,489,966 2,477,285 OTHER STATE REVENUE……………………… 3,336,145 2,060,550 1,909,000 366,329 7,672,024 9,507,082 9,268,441
TOTAL STATE………………………………………… 296,182,073 2,060,550 7,870,462 366,329 0 0 306,479,414 292,253,741 292,189,201LOCAL DISTRICT LOCAL TAX…………………………… 407,559,691 407,559,691 399,499,006 385,303,457 DISTRICT LOCAL TAX CAPITAL IMPROVE…. 118,042,004 118,042,004 110,255,520 99,905,824 INTEREST ON INVESTMENTS……………… 1,900,000 706,000 30,000 90,000 2,726,000 4,237,464 2,400,579 STUDENT LUNCH SALES……………………. 1,907,332 1,907,332 1,796,035 2,066,261 SCHOOL AGE CHILD CARE FEES……………. 7,580,796 7,580,796 7,212,582 7,073,650 REVENUE FROM OTHER FUNDS…………….. 2,850,000 95,315,114 98,165,114 87,638,496 73,747,163 IMPACT FEES……………………………… 6,615,000 6,615,000 6,654,615 6,137,978 OTHER LOCAL REVENUE 8,911,384 801,253 9,712,637 16,349,868 30,935,032TOTAL LOCAL 428,801,871 0 125,363,004 2,738,585 0 95,405,114 652,308,574 633,643,586 607,569,944REVENUE TRANSFERS TRANSFERS FROM CAPITAL PROJECTS 9,619,350 45,280,765 54,900,115 56,064,363 54,315,041 OTHER TRANSFERS 152 8TOTAL REVENUE TRANSFERS 9,619,350 45,280,765 0 0 0 0 54,900,115 56,064,515 54,315,049NON-REVENUE SOURCES COPS 71637060 INSURANCE LOSS RECOVERIES 5,897 5,897 326,784 263,905 OTHER NON REVENUE SOURCES 80177000TOTAL NON-REVENUE SOURCES 5,897 0 0 0 0 0 5,897 152,140,844 263,905FUND BALANCES
BALANCES BEGINNING OF YEAR 136,654,621 11,674,227 155,266,784 21,737,625 34,758,676 360,091,933 310,046,989 284,707,170
TOTAL FUND BALANCES 136,654,621 11,674,227 155,266,784 21,737,625 0 34,758,676 360,091,933 310,046,989 284,707,170
TOTAL REVENUE ALL SOURCES 875,546,812 59,015,542 288,500,250 70,205,148 85,340,451 130,163,790 1,508,771,993 1,563,087,856 1,351,898,242
Source: School District of Lee County Final Budget Reports
61

SCHOOL DISTRICT OF LEE COUNTY FINAL BUDGETCONSOLIDATED FUNDS STATEMENT
2017-2018
CONSOLIDATED FUNDS
ACCOUNT DESCRIPTIONGENERAL
FUNDSDEBT
SERVICECAPITAL
PROJECTSSPEC. REV. FOOD SERV
SPEC. REV. FEDERAL
INTERNAL SERVICE
APPROVED BUDGET 2017-
2018ACTUAL 2016-
2017*ACTUAL 2015-
2016*
APPROPRIATIONS BY
OBJECT CLASSIFICATIONS
100 SALARIES………………………………… 463,972,550 14,346,405 41,358,516 2,028,665 521,706,136 483,269,040 465,491,705
200 EMPLOYEE BENEFITS…………………… 134,586,553 6,526,745 12,014,348 138,028 153,265,674 134,441,638 128,136,460
300 PURCHASED SERVICES………………… 143,251,220 528,199 9,292,535 13,151,823 166,223,777 151,805,629 144,048,717
400 ENERGY SERVICES……………………… 25,792,351 19,000 24,986 25,836,337 21,468,253 21,384,413
500 MATERIAL & SUPPLIES…………………. 40,297,066 24,864,560 11,574,484 51,341 76,787,451 38,897,297 38,703,809
600 CAPITAL OUTLAY……………………… 16,546,774 141,045,399 4,707,897 3,561,362 26,375 165,887,807 113,165,665 58,550,635
700 OTHER EXPENSES………………………. 5,043,509 47,341,315 3,000 1,010,465 7,514,220 81,285,703 142,198,212 203,883,886 131,144,684
SUBTOTAL………………………………. 829,490,023 47,341,315 141,048,399 52,003,271 85,340,451 96,681,935 1,251,905,394 1,146,931,408 987,460,423
800 REPLACEMENT OF EQUIPMENT…………
SUBTOTAL……………………………….. 0 0 0 0 0 0 0 0 0
62 TRANSFERS:
900 TRANSFERS OUT………………………… 54,900,115 54,900,115 56,064,515 54,315,049
RESERVES & ENDING FUND BALANCES: 360,091,933 310,122,770
991 RESERVE FOR ENCUMBRANCES 0
992 RESERVE FOR BOARD PRIORITIES…….. 17,056,789 17,056,789
996 RESERVE FOR INVENTORY……………. 0
998 UNAPPROPRIATED FUND BALANCE….. 11,674,227 92,551,736 18,201,877 33,481,855 155,909,695
997 RESTRICTED FUND BALANCE…………. 6,000,000 6,000,000
993 CONTINGENCY RESERVE……………… 23,000,000 23,000,000
995 RESERVE FOR BAL BROUGHT FORWARD 0
999 STORES……………………………………
SUBTOTAL………………………………… 46,056,789 11,674,227 147,451,851 18,201,877 0 33,481,855 256,866,599 416,156,448 364,437,819
TOTAL BY OBJECT………………………. 875,546,812 59,015,542 288,500,250 70,205,148 85,340,451 130,163,790 1,508,771,993 1,563,087,856 1,351,898,242
Source: School District of Lee County Final Budget Reports
*Actual Results from previous years are as of August 10th and represents the totals as they were at time of printing and not necessarily the final expenses.

FINAL BUDGET SUMMARY
PART I PART II PART III PART IV PART VII PART IX
ESTIMATED REVENUE OPERATING DEBT SVC CAPITAL PROJ SPECIAL REV INTERNAL SVC FOOD SVC TOTAL
Federal (Direct) 1,733,000 20,898,413 22,631,413Federal (Thru State) 2,550,000 64,442,038 45,362,609 112,354,647State Sources 296,182,073 2,060,550 7,870,462 366,329 306,479,414Local Sources 428,801,871 125,363,004 95,405,114 2,738,585 652,308,574
Sub-Total 729,266,944 2,060,550 133,233,466 85,340,451 95,405,114 48,467,523 1,093,774,048 Incoming Transfers 9,619,350 45,280,765 54,900,115Non-Revenue Receipts 5,897 5,897 Beginning Balances/Reserves 136,654,621 11,674,227 155,266,784 34,758,676 21,737,625 360,091,933
TOTAL ESTIMATED REVENUE 875,546,812 59,015,542 288,500,250 85,340,451 130,163,790 70,205,148 1,508,771,993
APPROPRIATIONS
Instruction 525,804,832 51,710,300 577,515,132
Pupil Personnel Services 26,489,238 6,207,744 32,696,982
Instructional Media Services 3,940,975 270,982 4,211,957
Inst/Curr Development Services 9,606,492 18,359,158 27,965,650
Instructional Staff Training 7,007,453 3,737,838 10,745,291
Instruction Related Technology 8,019,495 56,901 8,076,396Board of Education 1,810,030 1,180 1,811,210General Administration 3,745,449 2,119,207 5,864,656School Administration 50,399,871 984,907 51,384,778Facilities Acquisition and Const. 8,548,348 141,045,399 509,483 26,375 150,129,605Fiscal Services 4,032,912 4,032,912Food Services 52,003,271 52,003,271Central Services 12,245,199 44,726 89,565,060 101,854,985Pupil Transportation Services 55,401,532 610,864 56,012,396Operation of Plant 74,644,661 97,109 7,090,500 81,832,270Maintenance of Plant 17,491,512 3,250 17,494,762Administrative Technology 7,927,536 7,927,536Community Services 12,374,488 626,802 13,001,290Debt Service 47,341,315 3,000 47,344,315
Sub-Total 829,490,023 47,341,315 141,048,399 85,340,451 96,681,935 52,003,271 1,251,905,394
Transfer of Funds 54,900,115 54,900,115Ending Balances/Reserves 46,056,789 11,674,227 92,551,736 33,481,855 18,201,877 201,966,484
TOTAL APPROPRIATIONS 875,546,812 59,015,542 288,500,250 85,340,451 130,163,790 70,205,148 1,508,771,993
SCHOOL DISTRICT OF LEE COUNTY
2017-18
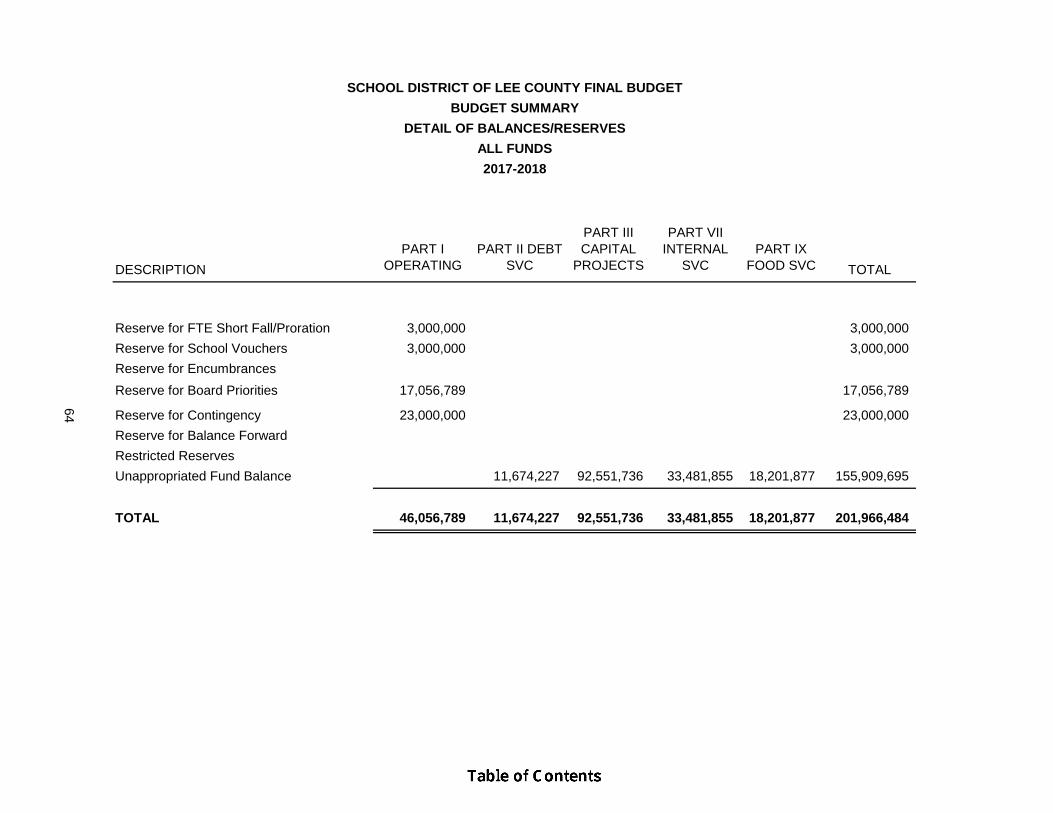
DESCRIPTION
PART I OPERATING
PART II DEBT SVC
PART III CAPITAL
PROJECTS
PART VII INTERNAL
SVCPART IX
FOOD SVC TOTAL
Reserve for FTE Short Fall/Proration 3,000,000 3,000,000
Reserve for School Vouchers 3,000,000 3,000,000
Reserve for Encumbrances
Reserve for Board Priorities 17,056,789 17,056,789
64 Reserve for Contingency 23,000,000 23,000,000
Reserve for Balance Forward
Restricted Reserves
Unappropriated Fund Balance 11,674,227 92,551,736 33,481,855 18,201,877 155,909,695
TOTAL 46,056,789 11,674,227 92,551,736 33,481,855 18,201,877 201,966,484
2017-2018
SCHOOL DISTRICT OF LEE COUNTY FINAL BUDGET
BUDGET SUMMARY
DETAIL OF BALANCES/RESERVES
ALL FUNDS

School District of Lee County2017-2018 Final Budget
65
ALL FUNDS AND GENERAL FUNDFY08 - FY18
TOTAL BUDGET
GENERAL FUND The general fund receives its funding primarily through the Florida Education Finance Program which is based on student enrollment. Starting in FY04, the general fund grew at a steady pace as the District enrollment initally climbed by 3,600 - 5,000 students per year. In FY09, the District experienced a drop in enrollment for the first time but enrollments have increased again by 1,000 to 2,000 in current years. Starting in FY09 the general fund declined due to the slowing of growth as well as State funding shortfalls. Beginning in FY10 stimulus funds provided a needed infusion of funds over the next two years to help offset declining state revenues. In FY14, the legislative session brought much needed increases to education, with a large portion of the increases set aside for teacher salary increases. Since FY15 there have been small increases in funding. Due to previous reductions in state funding we have just now caught up to the per student funding that we had ten years ago. ALL FUNDS Capital funds grew from 2005 to 2008 due to increases in the tax roll and receipt of capital dollars for the construction of new classrooms to meet the class size reduction mandate. Beginning in 2009 and continuing through to 2015, capital funds decreased significantly due to a lower tax base, the elimination of Classrooms for Kids and a reduction in impact fees. FY16 and FY17 reflected an increase in capital funds. In FY17 the capital funds included a refinancing of bonds and the COPS issuance for the new high school. The total budget of all funds in FY18 is $1.5 billion as shown in the graph above. Note: The figures above represent the adopted budgets for FY08 through FY18.
FY08 FY09
FY10 FY11 FY12 FY13
FY14 FY15
FY16
FY17 FY18
FY08 FY09 FY10 FY11 FY12 FY13 FY14 FY15 FY16 FY17
FY18
0.0
200.0
400.0
600.0
800.0
1,000.0
1,200.0
1,400.0
1,600.0
1,800.0
FY08 FY09 FY10 FY11 FY12 FY13 FY14 FY15 FY16 FY17 FY18
ALL FUNDS
GENERAL FUND
(In Millions)

School District of Lee County2017-2018 Final Budget
66
2014-15 2015-16 2016-17 2017-18ACTUAL ACTUAL ACTUAL BUDGET CHANGE PERCENT
Federal - Direct 21,092 21,337 20,975 22,631 1,656 7.89%Federal thru State 84,721 91,516 97,963 112,355 14,392 14.69%
Total Federal 105,813 112,853 118,938 134,986 16,048 13.49%
State Sources 284,060 292,189 292,254 306,479 14,225 4.87%
Local Sources 578,515 607,570 633,644 652,309 18,665 2.95%
Total Revenue Sources 968,388 1,012,612 1,044,836 1,093,774 48,938 4.68%
Incoming Transfers 66,009 54,315 56,064 54,900 (1,164) (2.08%)Non-revenue Receipts 158,063 264 152,141 6 (152,135) (100.00%)Beginning Fund Balance 279,994 284,707 310,047 360,092 50,045 16.14%
Total Budget 1,472,454 1,351,898 1,563,088 1,508,772 (54,316) (3.47%)
2016-17 TO 2017-18
SUMMARY OF ALL FUNDSREVENUE SOURCES (IN 000'S)
0
100,000
200,000
300,000
400,000
500,000
600,000
700,000
REVENUE SOURCES (IN 000's) 2014-15
2015-16
2016-17
2017-18
FEDERAL LOCAL
FY18 % of Total Revenue
Federal 12.34% State 28.02% Local 59.64%
STATE
State and local sources have increased slightly due to an increase in funding from the state as well as an increase in the local tax roll.

School District of Lee County2017-2018 Final Budget
67
2014-15 2015-16 2016-17 2017-18ACTUAL ACTUAL ACTUAL BUDGET CHANGE PERCENT
Personnel Expense (Salary & Benefits) 579,640 593,627 617,711 675,795 58,084 9.40%Operating Expense 445,990 295,157 310,024 363,701 53,677 17.31%Debt Service 40,945 40,125 106,031 47,344 (58,687) (55.35%)Capital Outlay 55,335 58,551 113,165 165,066 51,901 45.86%
Total Appropriations/Expenses 1,121,910 987,460 1,146,931 1,251,906 104,975 9.15%
Transfers 66,009 54,315 56,065 54,900 (1,165) (2.08%)
Fund Balance/Equity 284,535 310,123 360,092 201,966 (158,126) (43.91%)
Total 1,472,454 1,351,898 1,563,088 1,508,772 (54,316) (3.47%)
SUMMARY OF ALL FUNDSEXPENDITURES BY OBJECT (IN 000'S)
2016-17TO 2017-18
Personnel Expense (Salary & Benefits)
$675,795 44.79%
Operating Expense $363,701 24.11%
Debt Service $47,344 3.14%
Fund Balances/ Transfers $256,866
17.02%
Capital $165,066 10.94%
Appropriations by Object for 2017-2018 Total Budget $1,508,771,993
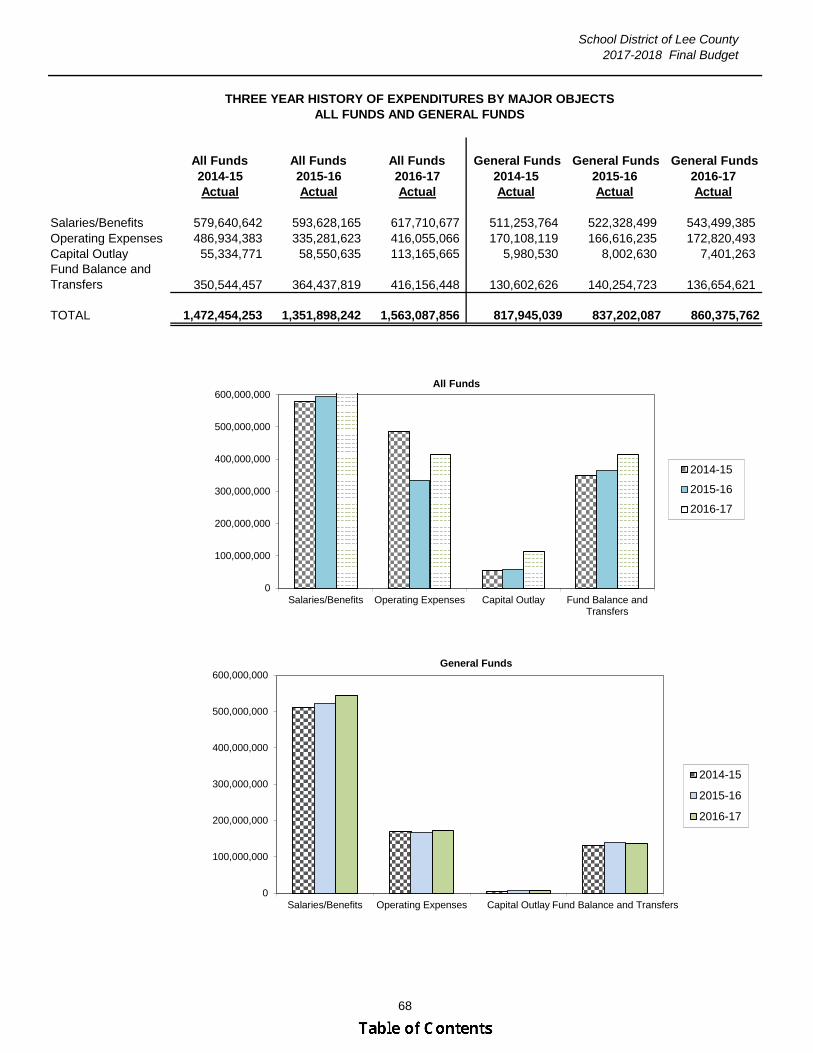
School District of Lee County2017-2018 Final Budget
68
All Funds All Funds All Funds General Funds General Funds General Funds 2014-15 2015-16 2016-17 2014-15 2015-16 2016-17Actual Actual Actual Actual Actual Actual
Salaries/Benefits 579,640,642 593,628,165 617,710,677 511,253,764 522,328,499 543,499,385 Operating Expenses 486,934,383 335,281,623 416,055,066 170,108,119 166,616,235 172,820,493 Capital Outlay 55,334,771 58,550,635 113,165,665 5,980,530 8,002,630 7,401,263 Fund Balance and Transfers 350,544,457 364,437,819 416,156,448 130,602,626 140,254,723 136,654,621
TOTAL 1,472,454,253 1,351,898,242 1,563,087,856 817,945,039 837,202,087 860,375,762
THREE YEAR HISTORY OF EXPENDITURES BY MAJOR OBJECTS ALL FUNDS AND GENERAL FUNDS
0
100,000,000
200,000,000
300,000,000
400,000,000
500,000,000
600,000,000
Salaries/Benefits Operating Expenses Capital Outlay Fund Balance andTransfers
All Funds
2014-15
2015-16
2016-17
0
100,000,000
200,000,000
300,000,000
400,000,000
500,000,000
600,000,000
Salaries/Benefits Operating Expenses Capital Outlay Fund Balance and Transfers
General Funds
2014-15
2015-16
2016-17

School District of Lee County 2017-2018 Final Budget
____________________________________________________________________________________
69
APPROVED BUDGET 2017-2018 SCHOOL YEAR The 2017-2018 approved budget for The School District of Lee County is $1,508,771,993 which consists of Operating ($875.6 M), Debt Service ($59.0 M), Capital Project ($288.5 M), Special Revenue ($85.3 M), Internal Service ($130.2 M), and Food Service ($70.2 M).
Source: SDLC Final Budget Summary, All Funds 2017-2018
Source: SDLC Final Budget Summary, All Funds, 2017-2018

School District of Lee County2017-2018 Final Budget
_______________________________________________________________________________________________
70
FTE 2015-16 2016-17 2017-18OBJECT DAILY ACTUAL ACTUAL BUDGETCODE DESCRIPTION HOURS POSITION POSITION POSITION CHANGE PERCENT
ELECTED OFFICIALS511400 Board Members 5.00 7.00 7.00
TOTAL ELECTED OFFICIAL 5.00 7.00 7.00
INSTRUCTIONAL 512800 School Counselor 7.6 137.30 138.90 141.87 2.97 2.14%514500 Occupational/Physical Therapist 7.6 7.00 7.00 7.00514800 Media Specialist 7.6 23.30 19.30 16.00 (3.30) (17.10%)515200 Nurse, RN 7.6 41.60 42.60 44.80 2.20 5.16%515800 Psychologist 7.6 32.00 33.00 32.00 (1.00) (3.03%)516200 Social Worker/Visiting Teacher 7.6 41.00 45.53 46.53 1.00 2.20%516400 Career Specialist 7.6 4.00 5.00 5.00516500 Primary Specialist 7.6 3.50 1.53 2.17 0.64 41.83%516900 Teacher 7.6 5,459.27 5,565.95 5,757.43 191.48 3.44%
TOTAL INSTRUCTIONAL 5,748.97 5,858.81 6,052.80 193.99 3.31%
ADMINISTRATIVE510500 Assistant Director 8.0 10.00 9.00 12.00 3.00 33.33%510700 Assistant Principal 8.0 161.00 169.00 167.50 (1.50) (0.89%)510800 Executive Officer 8.0 4.00 6.00 5.00 (1.00) (16.67%)511700 Attorney 8.0 2.00 2.00 2.00512700 Coordinator 8.0 41.00 34.00 42.00 8.00 23.53%513300 Director/Executive Director 8.0 38.00 38.00 39.00 1.00 2.63%513800 Superintendent of Schools 8.0 1.00 1.00 1.00515300 Manager 8.0 3.00 3.00 3.00515600 Principal 8.0 88.00 91.00 92.00 1.00 1.10%517800 Program Administrator 8.0 1.00 1.00 1.50 0.50 50.00%
TOTAL ADMINISTRATIVE 349.00 354.00 365.00 11.00 3.11%
STAFFING COMPARISON - ALL FUNDS
2016-17TO 2017-18
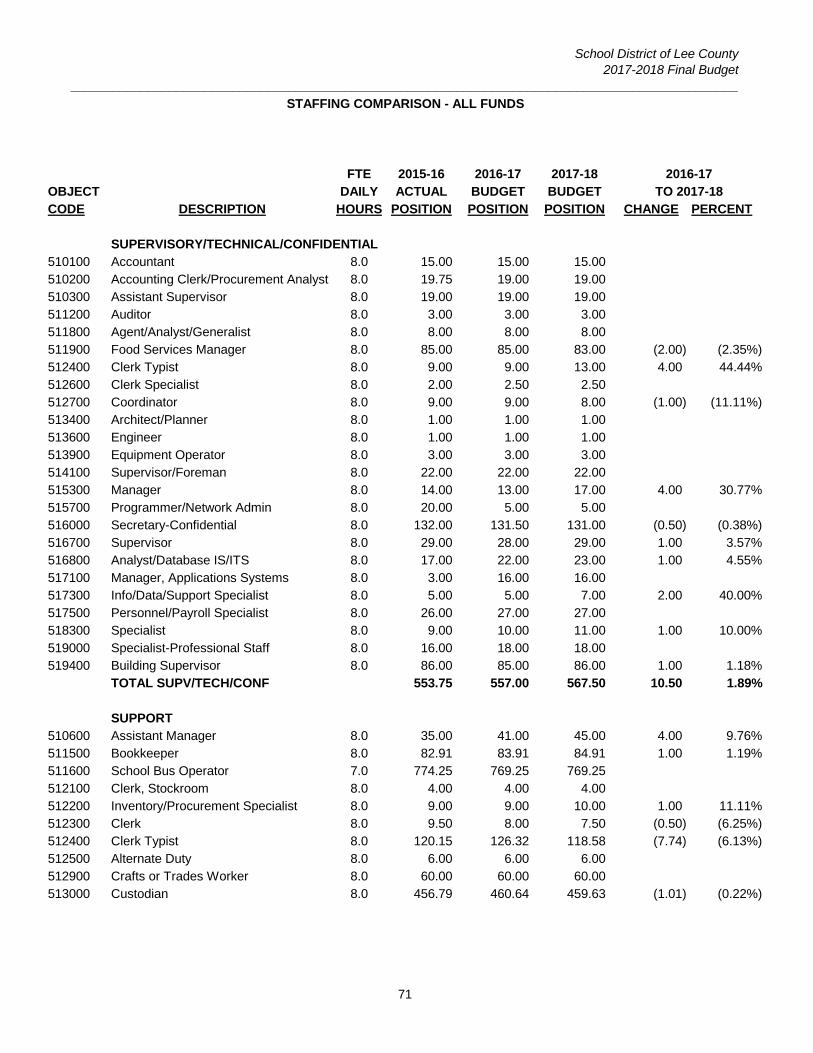
School District of Lee County2017-2018 Final Budget
_______________________________________________________________________________________________
71
STAFFING COMPARISON - ALL FUNDS
FTE 2015-16 2016-17 2017-18OBJECT DAILY ACTUAL BUDGET BUDGETCODE DESCRIPTION HOURS POSITION POSITION POSITION CHANGE PERCENT
SUPERVISORY/TECHNICAL/CONFIDENTIAL510100 Accountant 8.0 15.00 15.00 15.00510200 Accounting Clerk/Procurement Analyst 8.0 19.75 19.00 19.00510300 Assistant Supervisor 8.0 19.00 19.00 19.00511200 Auditor 8.0 3.00 3.00 3.00511800 Agent/Analyst/Generalist 8.0 8.00 8.00 8.00511900 Food Services Manager 8.0 85.00 85.00 83.00 (2.00) (2.35%)512400 Clerk Typist 8.0 9.00 9.00 13.00 4.00 44.44%512600 Clerk Specialist 8.0 2.00 2.50 2.50512700 Coordinator 8.0 9.00 9.00 8.00 (1.00) (11.11%)513400 Architect/Planner 8.0 1.00 1.00 1.00513600 Engineer 8.0 1.00 1.00 1.00513900 Equipment Operator 8.0 3.00 3.00 3.00514100 Supervisor/Foreman 8.0 22.00 22.00 22.00515300 Manager 8.0 14.00 13.00 17.00 4.00 30.77%515700 Programmer/Network Admin 8.0 20.00 5.00 5.00516000 Secretary-Confidential 8.0 132.00 131.50 131.00 (0.50) (0.38%)516700 Supervisor 8.0 29.00 28.00 29.00 1.00 3.57%516800 Analyst/Database IS/ITS 8.0 17.00 22.00 23.00 1.00 4.55%517100 Manager, Applications Systems 8.0 3.00 16.00 16.00517300 Info/Data/Support Specialist 8.0 5.00 5.00 7.00 2.00 40.00%517500 Personnel/Payroll Specialist 8.0 26.00 27.00 27.00518300 Specialist 8.0 9.00 10.00 11.00 1.00 10.00%519000 Specialist-Professional Staff 8.0 16.00 18.00 18.00519400 Building Supervisor 8.0 86.00 85.00 86.00 1.00 1.18%
TOTAL SUPV/TECH/CONF 553.75 557.00 567.50 10.50 1.89%
SUPPORT510600 Assistant Manager 8.0 35.00 41.00 45.00 4.00 9.76%511500 Bookkeeper 8.0 82.91 83.91 84.91 1.00 1.19%511600 School Bus Operator 7.0 774.25 769.25 769.25512100 Clerk, Stockroom 8.0 4.00 4.00 4.00512200 Inventory/Procurement Specialist 8.0 9.00 9.00 10.00 1.00 11.11%512300 Clerk 8.0 9.50 8.00 7.50 (0.50) (6.25%)512400 Clerk Typist 8.0 120.15 126.32 118.58 (7.74) (6.13%)512500 Alternate Duty 8.0 6.00 6.00 6.00512900 Crafts or Trades Worker 8.0 60.00 60.00 60.00513000 Custodian 8.0 456.79 460.64 459.63 (1.01) (0.22%)
TO 2017-182016-17
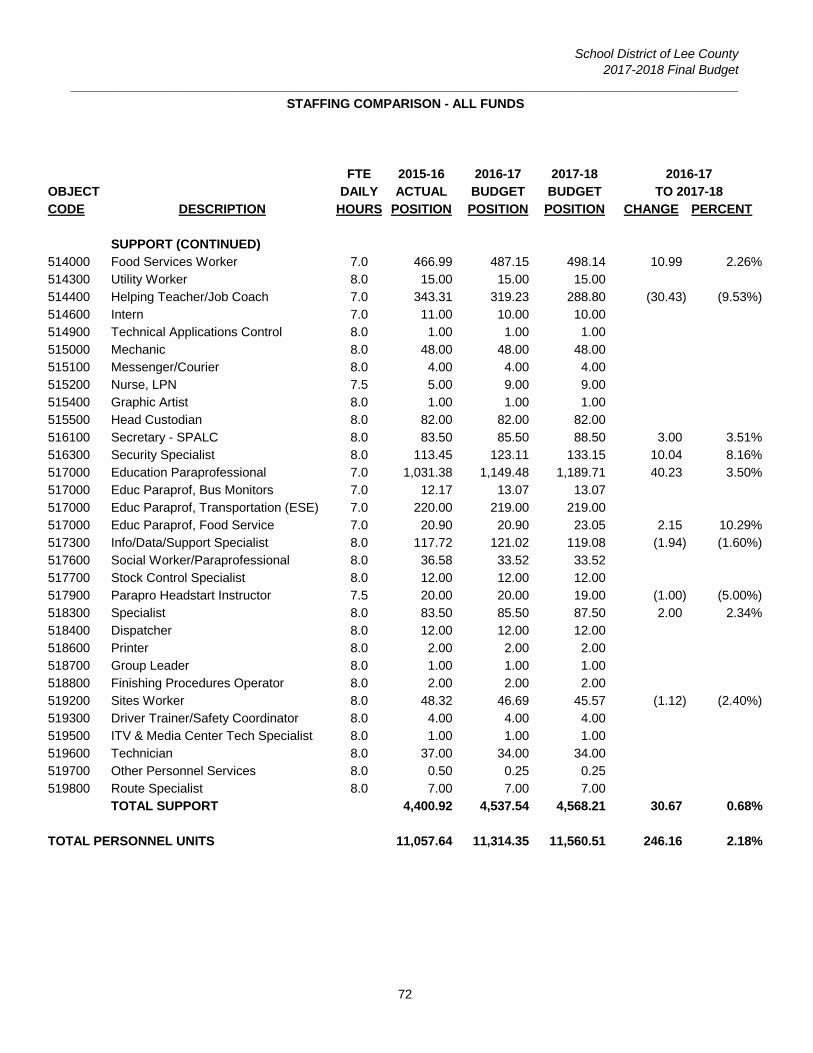
School District of Lee County2017-2018 Final Budget
_______________________________________________________________________________________________
72
STAFFING COMPARISON - ALL FUNDS
FTE 2015-16 2016-17 2017-18OBJECT DAILY ACTUAL BUDGET BUDGETCODE DESCRIPTION HOURS POSITION POSITION POSITION CHANGE PERCENT
SUPPORT (CONTINUED)514000 Food Services Worker 7.0 466.99 487.15 498.14 10.99 2.26%514300 Utility Worker 8.0 15.00 15.00 15.00514400 Helping Teacher/Job Coach 7.0 343.31 319.23 288.80 (30.43) (9.53%)514600 Intern 7.0 11.00 10.00 10.00514900 Technical Applications Control 8.0 1.00 1.00 1.00515000 Mechanic 8.0 48.00 48.00 48.00515100 Messenger/Courier 8.0 4.00 4.00 4.00515200 Nurse, LPN 7.5 5.00 9.00 9.00515400 Graphic Artist 8.0 1.00 1.00 1.00515500 Head Custodian 8.0 82.00 82.00 82.00516100 Secretary - SPALC 8.0 83.50 85.50 88.50 3.00 3.51%516300 Security Specialist 8.0 113.45 123.11 133.15 10.04 8.16%517000 Education Paraprofessional 7.0 1,031.38 1,149.48 1,189.71 40.23 3.50%517000 Educ Paraprof, Bus Monitors 7.0 12.17 13.07 13.07517000 Educ Paraprof, Transportation (ESE) 7.0 220.00 219.00 219.00517000 Educ Paraprof, Food Service 7.0 20.90 20.90 23.05 2.15 10.29%517300 Info/Data/Support Specialist 8.0 117.72 121.02 119.08 (1.94) (1.60%)517600 Social Worker/Paraprofessional 8.0 36.58 33.52 33.52517700 Stock Control Specialist 8.0 12.00 12.00 12.00517900 Parapro Headstart Instructor 7.5 20.00 20.00 19.00 (1.00) (5.00%)518300 Specialist 8.0 83.50 85.50 87.50 2.00 2.34%518400 Dispatcher 8.0 12.00 12.00 12.00518600 Printer 8.0 2.00 2.00 2.00518700 Group Leader 8.0 1.00 1.00 1.00518800 Finishing Procedures Operator 8.0 2.00 2.00 2.00519200 Sites Worker 8.0 48.32 46.69 45.57 (1.12) (2.40%)519300 Driver Trainer/Safety Coordinator 8.0 4.00 4.00 4.00519500 ITV & Media Center Tech Specialist 8.0 1.00 1.00 1.00519600 Technician 8.0 37.00 34.00 34.00519700 Other Personnel Services 8.0 0.50 0.25 0.25519800 Route Specialist 8.0 7.00 7.00 7.00
TOTAL SUPPORT 4,400.92 4,537.54 4,568.21 30.67 0.68%
TOTAL PERSONNEL UNITS 11,057.64 11,314.35 11,560.51 246.16 2.18%
TO 2017-182016-17
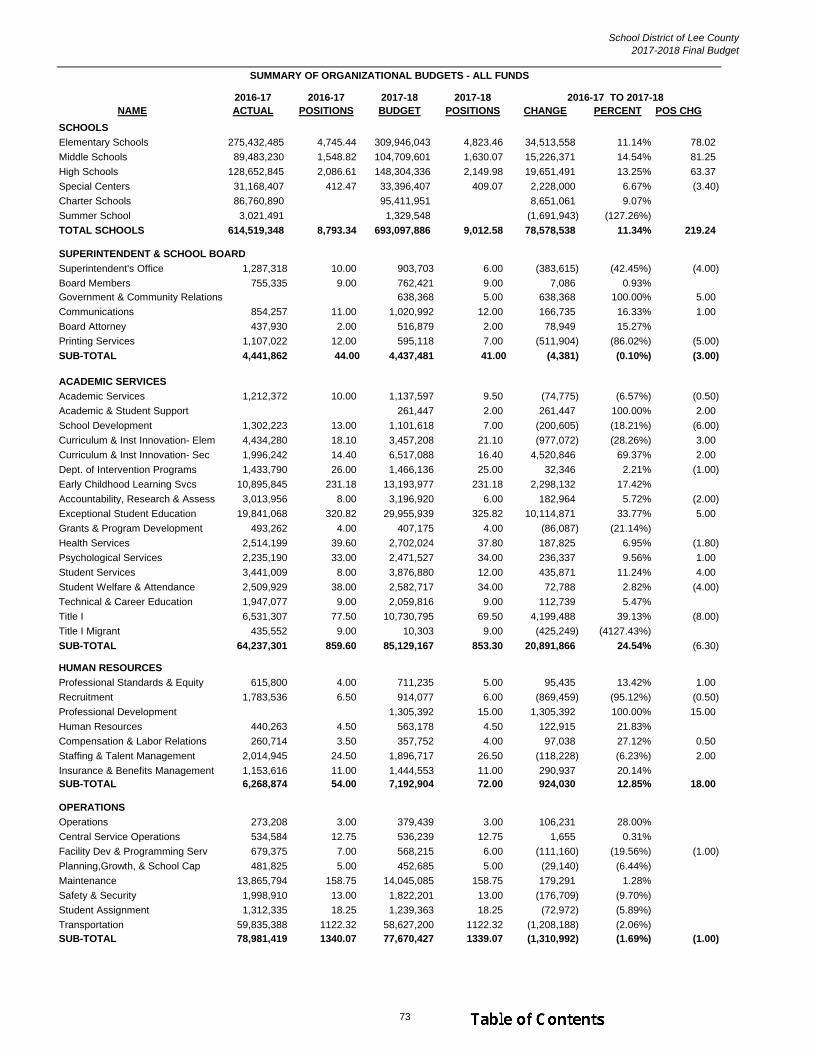
School District of Lee County2017-2018 Final Budget
73
2016-17 2016-17 2017-18 2017-18NAME ACTUAL POSITIONS BUDGET POSITIONS CHANGE PERCENT POS CHG
SCHOOLS
Elementary Schools 275,432,485 4,745.44 309,946,043 4,823.46 34,513,558 11.14% 78.02
Middle Schools 89,483,230 1,548.82 104,709,601 1,630.07 15,226,371 14.54% 81.25
High Schools 128,652,845 2,086.61 148,304,336 2,149.98 19,651,491 13.25% 63.37
Special Centers 31,168,407 412.47 33,396,407 409.07 2,228,000 6.67% (3.40)
Charter Schools 86,760,890 95,411,951 8,651,061 9.07%
Summer School 3,021,491 1,329,548 (1,691,943) (127.26%)
TOTAL SCHOOLS 614,519,348 8,793.34 693,097,886 9,012.58 78,578,538 11.34% 219.24
SUPERINTENDENT & SCHOOL BOARD
Superintendent's Office 1,287,318 10.00 903,703 6.00 (383,615) (42.45%) (4.00)
Board Members 755,335 9.00 762,421 9.00 7,086 0.93%Government & Community Relations 638,368 5.00 638,368 100.00% 5.00
Communications 854,257 11.00 1,020,992 12.00 166,735 16.33% 1.00
Board Attorney 437,930 2.00 516,879 2.00 78,949 15.27%
Printing Services 1,107,022 12.00 595,118 7.00 (511,904) (86.02%) (5.00)
SUB-TOTAL 4,441,862 44.00 4,437,481 41.00 (4,381) (0.10%) (3.00)
Academic Services 1,212,372 10.00 1,137,597 9.50 (74,775) (6.57%) (0.50)
Academic & Student Support 261,447 2.00 261,447 100.00% 2.00
School Development 1,302,223 13.00 1,101,618 7.00 (200,605) (18.21%) (6.00)
Curriculum & Inst Innovation- Elem 4,434,280 18.10 3,457,208 21.10 (977,072) (28.26%) 3.00
Curriculum & Inst Innovation- Sec 1,996,242 14.40 6,517,088 16.40 4,520,846 69.37% 2.00
Dept. of Intervention Programs 1,433,790 26.00 1,466,136 25.00 32,346 2.21% (1.00)
Early Childhood Learning Svcs 10,895,845 231.18 13,193,977 231.18 2,298,132 17.42%
Accountability, Research & Assess 3,013,956 8.00 3,196,920 6.00 182,964 5.72% (2.00)
Exceptional Student Education 19,841,068 320.82 29,955,939 325.82 10,114,871 33.77% 5.00
Grants & Program Development 493,262 4.00 407,175 4.00 (86,087) (21.14%)
Health Services 2,514,199 39.60 2,702,024 37.80 187,825 6.95% (1.80)
Psychological Services 2,235,190 33.00 2,471,527 34.00 236,337 9.56% 1.00
Student Services 3,441,009 8.00 3,876,880 12.00 435,871 11.24% 4.00
Student Welfare & Attendance 2,509,929 38.00 2,582,717 34.00 72,788 2.82% (4.00)
Technical & Career Education 1,947,077 9.00 2,059,816 9.00 112,739 5.47%
Title I 6,531,307 77.50 10,730,795 69.50 4,199,488 39.13% (8.00)
Title I Migrant 435,552 9.00 10,303 9.00 (425,249) (4127.43%)
SUB-TOTAL 64,237,301 859.60 85,129,167 853.30 20,891,866 24.54% (6.30)
HUMAN RESOURCES
Professional Standards & Equity 615,800 4.00 711,235 5.00 95,435 13.42% 1.00
Recruitment 1,783,536 6.50 914,077 6.00 (869,459) (95.12%) (0.50)
Professional Development 1,305,392 15.00 1,305,392 100.00% 15.00
Human Resources 440,263 4.50 563,178 4.50 122,915 21.83%
Compensation & Labor Relations 260,714 3.50 357,752 4.00 97,038 27.12% 0.50
Staffing & Talent Management 2,014,945 24.50 1,896,717 26.50 (118,228) (6.23%) 2.00
Insurance & Benefits Management 1,153,616 11.00 1,444,553 11.00 290,937 20.14%SUB-TOTAL 6,268,874 54.00 7,192,904 72.00 924,030 12.85% 18.00
Operations 273,208 3.00 379,439 3.00 106,231 28.00%
Central Service Operations 534,584 12.75 536,239 12.75 1,655 0.31%
Facility Dev & Programming Serv 679,375 7.00 568,215 6.00 (111,160) (19.56%) (1.00)
Planning,Growth, & School Cap 481,825 5.00 452,685 5.00 (29,140) (6.44%)
Maintenance 13,865,794 158.75 14,045,085 158.75 179,291 1.28%
Safety & Security 1,998,910 13.00 1,822,201 13.00 (176,709) (9.70%)
Student Assignment 1,312,335 18.25 1,239,363 18.25 (72,972) (5.89%)
Transportation 59,835,388 1122.32 58,627,200 1122.32 (1,208,188) (2.06%)SUB-TOTAL 78,981,419 1340.07 77,670,427 1339.07 (1,310,992) (1.69%) (1.00)
ACADEMIC SERVICES
OPERATIONS
SUMMARY OF ORGANIZATIONAL BUDGETS - ALL FUNDS
2016-17 TO 2017-18
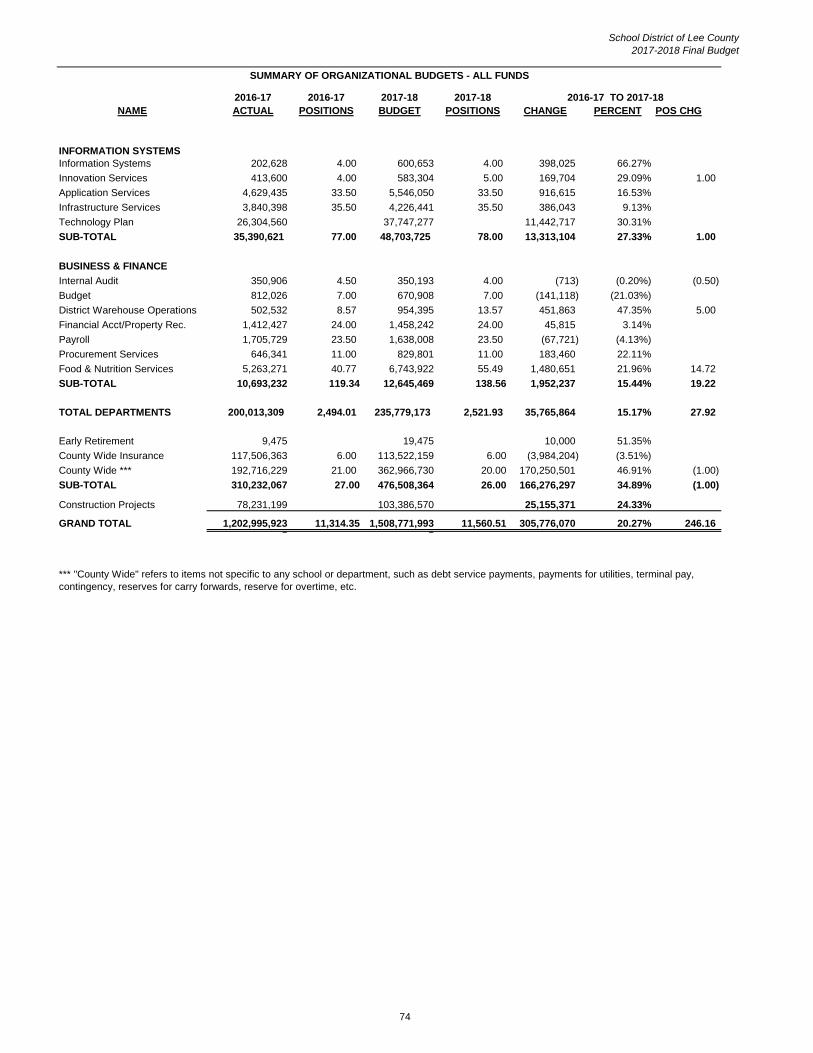
School District of Lee County2017-2018 Final Budget
74
2016-17 2016-17 2017-18 2017-18NAME ACTUAL POSITIONS BUDGET POSITIONS CHANGE PERCENT POS CHG
SUMMARY OF ORGANIZATIONAL BUDGETS - ALL FUNDS
2016-17 TO 2017-18
INFORMATION SYSTEMSInformation Systems 202,628 4.00 600,653 4.00 398,025 66.27%
Innovation Services 413,600 4.00 583,304 5.00 169,704 29.09% 1.00
Application Services 4,629,435 33.50 5,546,050 33.50 916,615 16.53%
Infrastructure Services 3,840,398 35.50 4,226,441 35.50 386,043 9.13%
Technology Plan 26,304,560 37,747,277 11,442,717 30.31%
SUB-TOTAL 35,390,621 77.00 48,703,725 78.00 13,313,104 27.33% 1.00
BUSINESS & FINANCE
Internal Audit 350,906 4.50 350,193 4.00 (713) (0.20%) (0.50)
Budget 812,026 7.00 670,908 7.00 (141,118) (21.03%)
District Warehouse Operations 502,532 8.57 954,395 13.57 451,863 47.35% 5.00
Financial Acct/Property Rec. 1,412,427 24.00 1,458,242 24.00 45,815 3.14%
Payroll 1,705,729 23.50 1,638,008 23.50 (67,721) (4.13%)
Procurement Services 646,341 11.00 829,801 11.00 183,460 22.11%
Food & Nutrition Services 5,263,271 40.77 6,743,922 55.49 1,480,651 21.96% 14.72
SUB-TOTAL 10,693,232 119.34 12,645,469 138.56 1,952,237 15.44% 19.22
TOTAL DEPARTMENTS 200,013,309 2,494.01 235,779,173 2,521.93 35,765,864 15.17% 27.92
Early Retirement 9,475 19,475 10,000 51.35%
County Wide Insurance 117,506,363 6.00 113,522,159 6.00 (3,984,204) (3.51%)
County Wide *** 192,716,229 21.00 362,966,730 20.00 170,250,501 46.91% (1.00)
SUB-TOTAL 310,232,067 27.00 476,508,364 26.00 166,276,297 34.89% (1.00)
Construction Projects 78,231,199 103,386,570 25,155,371 24.33%
GRAND TOTAL 1,202,995,923 11,314.35 1,508,771,993 11,560.51 305,776,070 20.27% 246.161 1
*** "County Wide" refers to items not specific to any school or department, such as debt service payments, payments for utilities, terminal pay,contingency, reserves for carry forwards, reserve for overtime, etc.

School District of Lee County2017-2018 Final Budget
75
2016-17 2014-15 2015-16 2016-17 2017-18 TO 2017-18
ACTUAL ACTUAL ACTUAL BUDGET CHANGE PERCENTREVENUE
STATE FEFP REVENUEFEFP State Payment 157,108,682 165,767,538 163,848,436 178,269,075 14,420,639 8.80%Lottery Allocation 323,400 1,544,033 1,557,106 13,073 0.85%Class Size Reduction 98,655,320 99,525,290 100,383,530 101,832,320 1,448,790 1.44%School Recognition Funds 4,214,304 3,846,668 1,490,006 1,490,006Voluntary PreKindergarten 2,055,797 2,037,169 2,053,965 2,355,367 301,402 14.67%
Subtotal 262,357,503 271,176,665 269,319,970 285,503,874 16,183,904 6.01%
OTHER STATE SOURCESWork Force Development 9,889,670 10,026,007 10,064,226 9,697,421 (366,805) (3.64%)CO & DS Withheld-Admin Exp 52,434 53,800 54,118 53,000 (1,118) (2.07%)Sales Tax Distribution 223,250 223,250 223,250 223,250State License Tax 505,704 493,900 532,402 480,000 (52,402) (9.84%)Misc. & Other State Revenue 907,806 1,839,931 2,034,026 224,529 (1,809,497) (88.96%)
Subtotal 11,578,864 12,636,888 12,908,022 10,678,200 (2,229,822) (17.27%)
FEDERAL REVENUEFederal Impact,Current Operating 35,649 33,010 23,965 33,000 9,035 37.70%Medicaid 2,545,507 2,408,004 2,533,241 2,550,000 16,759 0.66%Reserve Officer Training-JROTC 1,550,039 1,693,731 1,678,367 1,700,000 21,633 1.29%
Subtotal 4,131,196 4,134,745 4,235,573 4,283,000 47,427 1.12%
LOCAL SOURCESDistrict School Tax 366,770,645 385,303,457 399,499,006 407,559,691 8,060,685 2.02%Rent 504,692 563,164 563,078 590,000 26,922 4.78%Interest on Investments 1,353,605 1,812,221 2,568,999 1,900,000 (668,999) (26.04%)Net Change Fair Mkt Value Investmen (280,986) 948,457 (1,172,300) 1,172,300 (100.00%)Gifts, Grants & Bequests 944,180 987,130 1,302,447 297,640 (1,004,807) (77.15%)Post-secondary Fees 2,269,161 2,087,410 2,701,562 1,923,532 (778,030) (28.80%)Continuing Workforce Ed Courses 19,634 9,705 27,323 (27,323) (100.00%)Capital Improvement Fees 93,364 81,535 103,376 5,280 (98,096) (94.89%)GED Testing Fees 46,912 23,106 35,290 1,849 (33,441) (94.76%)Lifelong Learning Fees 94,907 97,770 127,862 (127,862) (100.00%)Other Student Fees/Financial Aid 299,733 324,060 332,305 207,705 (124,600) (37.50%)Preschool Program Fees 106,823 118,233 172,928 96,293 (76,635) (44.32%)School Age Child Care Fees 6,467,147 7,073,650 7,212,582 7,580,796 368,214 5.11%Miscellaneous Local Sources 5,398,191 3,444,253 3,626,748 5,075,566 1,448,818 39.95%
Continued on next page
GENERAL FUND
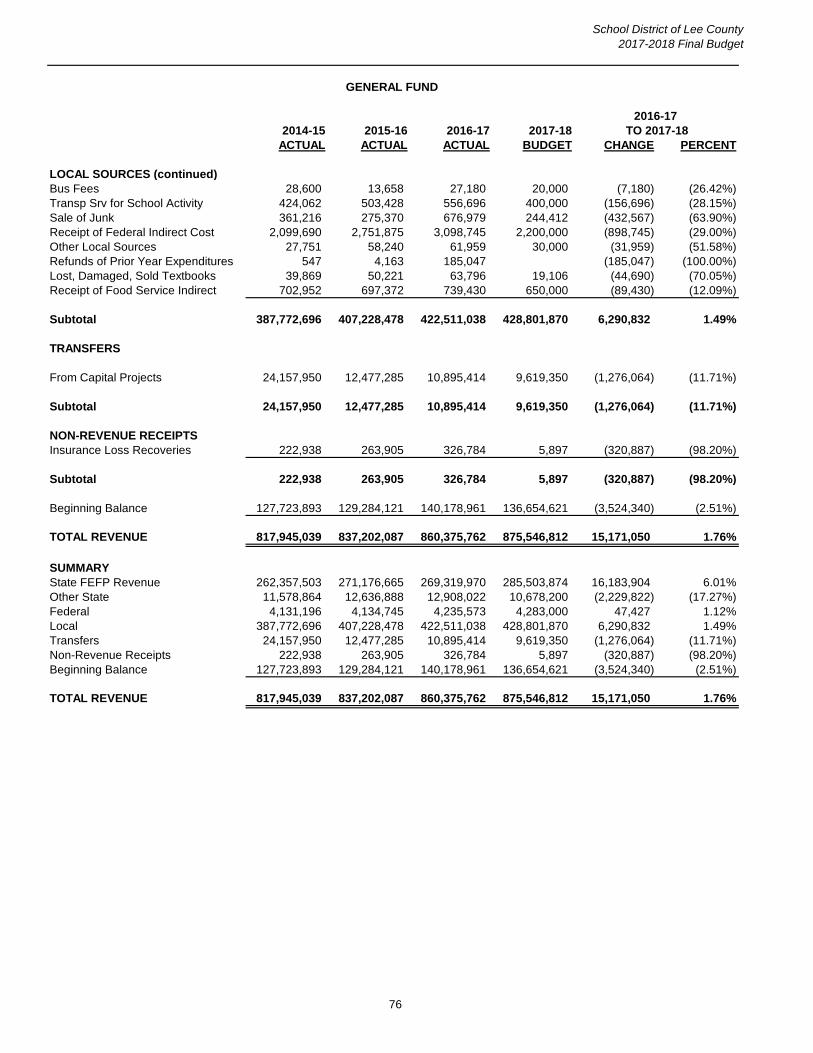
School District of Lee County2017-2018 Final Budget
76
2016-17 2014-15 2015-16 2016-17 2017-18 TO 2017-18
ACTUAL ACTUAL ACTUAL BUDGET CHANGE PERCENT
GENERAL FUND
LOCAL SOURCES (continued)Bus Fees 28,600 13,658 27,180 20,000 (7,180) (26.42%)Transp Srv for School Activity 424,062 503,428 556,696 400,000 (156,696) (28.15%)Sale of Junk 361,216 275,370 676,979 244,412 (432,567) (63.90%)Receipt of Federal Indirect Cost 2,099,690 2,751,875 3,098,745 2,200,000 (898,745) (29.00%)Other Local Sources 27,751 58,240 61,959 30,000 (31,959) (51.58%)Refunds of Prior Year Expenditures 547 4,163 185,047 (185,047) (100.00%)Lost, Damaged, Sold Textbooks 39,869 50,221 63,796 19,106 (44,690) (70.05%)Receipt of Food Service Indirect 702,952 697,372 739,430 650,000 (89,430) (12.09%)
Subtotal 387,772,696 407,228,478 422,511,038 428,801,870 6,290,832 1.49%
TRANSFERS
From Capital Projects 24,157,950 12,477,285 10,895,414 9,619,350 (1,276,064) (11.71%)
Subtotal 24,157,950 12,477,285 10,895,414 9,619,350 (1,276,064) (11.71%)
NON-REVENUE RECEIPTSInsurance Loss Recoveries 222,938 263,905 326,784 5,897 (320,887) (98.20%)
Subtotal 222,938 263,905 326,784 5,897 (320,887) (98.20%)
Beginning Balance 127,723,893 129,284,121 140,178,961 136,654,621 (3,524,340) (2.51%)
TOTAL REVENUE 817,945,039 837,202,087 860,375,762 875,546,812 15,171,050 1.76%
SUMMARYState FEFP Revenue 262,357,503 271,176,665 269,319,970 285,503,874 16,183,904 6.01%Other State 11,578,864 12,636,888 12,908,022 10,678,200 (2,229,822) (17.27%)Federal 4,131,196 4,134,745 4,235,573 4,283,000 47,427 1.12%Local 387,772,696 407,228,478 422,511,038 428,801,870 6,290,832 1.49%Transfers 24,157,950 12,477,285 10,895,414 9,619,350 (1,276,064) (11.71%)Non-Revenue Receipts 222,938 263,905 326,784 5,897 (320,887) (98.20%)Beginning Balance 127,723,893 129,284,121 140,178,961 136,654,621 (3,524,340) (2.51%)
TOTAL REVENUE 817,945,039 837,202,087 860,375,762 875,546,812 15,171,050 1.76%

School District of Lee County2017-2018 Final Budget
77
2016-17 2014-15 2015-16 2016-17 2017-18 TO 2017-18
ACTUAL ACTUAL ACTUAL BUDGET CHANGE PERCENT
GENERAL FUND
APPROPRIATIONS/EXPENSES
Instruction 431,114,574 438,653,867 448,439,884 525,804,832 77,364,948 17.25%Pupil Personnel Services 23,559,651 24,716,069 25,551,135 26,489,238 938,103 3.67%Instructional Media Services 3,913,120 4,039,587 3,899,570 3,940,975 41,405 1.06%Instr./Curr. Development Svcs 5,743,591 8,595,573 8,697,024 9,606,492 909,468 10.46%Instructional Staff Training 4,684,797 4,386,689 4,489,848 7,007,453 2,517,605 56.07%Instruction Related Technology 6,527,798 7,211,002 7,682,659 8,019,495 336,836 4.38%Board of Education 929,267 952,254 1,127,469 1,810,030 682,561 60.54%General Administration 2,984,248 2,940,076 3,311,890 3,745,449 433,559 13.09%School Administration 44,551,028 44,851,206 47,631,676 50,399,871 2,768,195 5.81%Facilities Acquisition & Const 7,868,486 7,428,370 9,978,465 8,548,348 (1,430,117) (14.33%)Fiscal Services 3,539,349 3,802,267 3,953,186 4,032,912 79,726 2.02%Central Services 8,490,822 8,486,161 9,998,727 12,245,199 2,246,472 22.47%Pupil Transportation Services 51,499,087 50,268,022 54,231,588 55,401,532 1,169,944 2.16%Operation of Plant 66,243,385 64,066,908 66,930,517 74,644,661 7,714,144 11.53%Maintenance of Plant 15,506,370 16,075,315 16,543,591 17,491,512 947,921 5.73%Administrative Technology 5,730,364 5,764,496 5,798,458 7,927,536 2,129,078 36.72%Community Services 4,362,448 4,709,502 5,455,454 12,374,488 6,919,034 126.83%Debt Service 94,028Transfer of Funds 1,490,000
Subtotal 688,832,413 696,947,364 723,721,141 829,490,023 105,768,882 14.61%
TransfersFund Balance/Equity ** 129,112,626 140,254,723 136,654,621 46,056,789 (90,597,832) (66.30%)
TOTAL APPROPRIATIONS/EXP 817,945,039 837,202,087 860,375,762 875,546,812 15,171,050 1.76%
** The Fund Balance/Equity in the prior years represents the funds remaining at the end of that fiscal year after all expenses haveoccurred. The Fund Balance/Equity in 2017-18 represents only those funds set aside in reserve accounts, such as contingency, etc. All other funds were spread through school and department budgets.
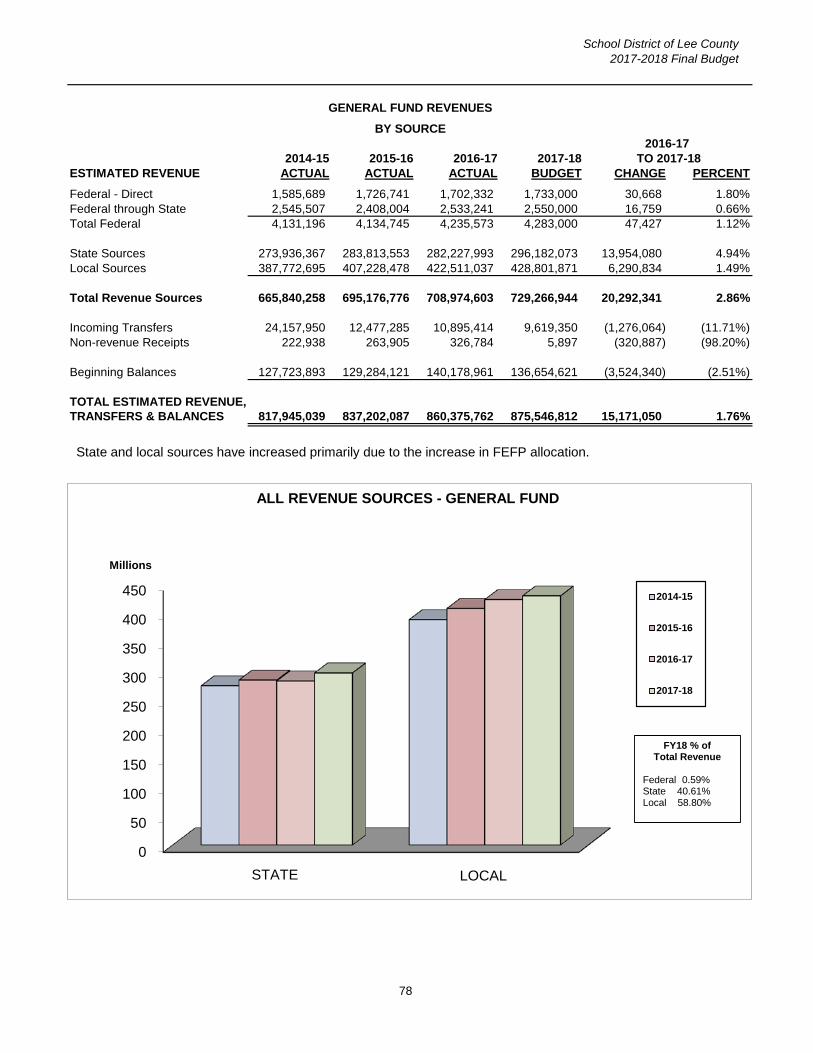
School District of Lee County2017-2018 Final Budget
78
2014-15 2015-16 2016-17 2017-18ESTIMATED REVENUE ACTUAL ACTUAL ACTUAL BUDGET CHANGE PERCENT
Federal - Direct 1,585,689 1,726,741 1,702,332 1,733,000 30,668 1.80%Federal through State 2,545,507 2,408,004 2,533,241 2,550,000 16,759 0.66%Total Federal 4,131,196 4,134,745 4,235,573 4,283,000 47,427 1.12%
State Sources 273,936,367 283,813,553 282,227,993 296,182,073 13,954,080 4.94%Local Sources 387,772,695 407,228,478 422,511,037 428,801,871 6,290,834 1.49%
Total Revenue Sources 665,840,258 695,176,776 708,974,603 729,266,944 20,292,341 2.86%
Incoming Transfers 24,157,950 12,477,285 10,895,414 9,619,350 (1,276,064) (11.71%)Non-revenue Receipts 222,938 263,905 326,784 5,897 (320,887) (98.20%)
Beginning Balances 127,723,893 129,284,121 140,178,961 136,654,621 (3,524,340) (2.51%)
TOTAL ESTIMATED REVENUE,TRANSFERS & BALANCES 817,945,039 837,202,087 860,375,762 875,546,812 15,171,050 1.76%
2016-17 TO 2017-18
GENERAL FUND REVENUES
BY SOURCE
0
50
100
150
200
250
300
350
400
450
Millions
ALL REVENUE SOURCES - GENERAL FUND
2014-15
2015-16
2016-17
2017-18
STATE LOCAL
FY18 % of Total Revenue
Federal 0.59% State 40.61% Local 58.80%
State and local sources have increased primarily due to the increase in FEFP allocation.

School District of Lee County2017-2018 Final Budget
79
Note: The Salaries and Benefits include funding for substitutes and supplemental contracts.
Budget Percent
Salaries & Benefits 598,559,103 68.36%
Purchased Services* 143,251,220 16.36%
Energy 25,792,351 2.95%
Supplies 40,297,066 4.60%
Capital Outlay 16,546,774 1.89%
Other** 5,043,509 0.58%
Reserve 46,056,789 5.26%
875,546,812 100.00%
*Purchased Services include professional & technical services, insurance and bond premiums, repairs,
communications, travel, utilities.
**Other includes memberships, dues and fees, miscellaneous and indirect costs.
Salaries & Benefits 68.36%
Purchased Services* 16.36%
Energy 2.95%
Supplies 4.60%
Capital Outlay 1.89%
Other** 0.58% Reserve
5.26%
GENERAL FUND EXPENDITURE BY OBJECTS

School District of Lee County2017-2018 Final Budget
80
GENERAL FUND EXPENDITURE PER PK-12 FTE STUDENT
CURRENT AND CONSTANT DOLLARS
FY08
The General Fund is typically a good indicator of operating expenditures for the School District of Lee County. The chart above shows that, in constant dollars (adjusted for inflation), the FTE student expenditures increased each year between 2007 and 2009, due to increased expenditures to move to a stricter standard for class size reduction. Expenditures per student fell sharply between 2009 and 2012 due to budget shortfalls at the state level. In 2012 through 2015, the per student spending slowly increased but in dollars adjusted for inflation, it has slowly decreased. 2016/2017 showed a slight increase in current dollars expensed per student. NOTE: "FTE" is Full Time Equivalent student (see glossary). The FY17 information represents final expenditures as of August 10, 2017.
2,500
3,500
4,500
5,500
6,500
7,500
8,500
FY07 FY08 FY09 FY10 FY11 FY12 FY13 FY14 FY15 FY16 FY17
Constant Dollars
Current Dollars
7,524
3,619 3,187
7,799
School District of Lee County 2017-2018 Final Budget
_____________________________________________________________________________
81
DEBT SERVICE There are four major sources of capital debt financing available to the School District: GENERAL OBLIGATION BONDS Florida school districts can issue general obligation bonds supported by a local property tax millage subject to a local referendum. Currently, the School District of Lee County does not carry general obligation debt. STATE BOARD OF EDUCATION CAPITAL OUTLAY BONDS The State Constitution provides that a portion of motor vehicle license tax revenues be dedicated to local school districts. These revenues may be used by the state to issue bonds on behalf of a school district. Annually, the Department of Education notifies each district of the amount of potential bonding capacity available. At the request of the district, the state will issue and administer bonds on behalf of the district, withholding sufficient motor vehicle tax revenues to cover debt service and administrative expenses. The District has not participated in this bond program since fiscal year 2004. SPECIAL ACT BONDS By special act of the legislature, a portion of racetrack revenues is made available to school districts, which can issue revenue bonds supported by this revenue source. The School District does not currently carry any special act bonds. CERTIFICATES OF PARTICIPATION Certificates of Participation (COPS) are long-term lease-purchase agreements. While it is similar to bonds, technically it is not long-term debt because repayment is subject to annual appropriations by the issuing body. The interest paid is slightly higher than for bonds to compensate for this increased risk to the lender. COPs are secured by leases on the property covered. In the event of default, the lender takes possession of the property for the balance of the lease term. The School District of Lee County has entered into a series of COPs issues that are covered under one “master lease”. A default on one COPs issue is deemed a default on all. Since a substantial number of District facilities are covered under the master lease, default is not a realistic option. State statute mandates the legal annual debt service amount be no more than 75% of the District’s annual capital outlay millage revenue. School District practice, however, strongly recommends that debt service be no more than 50% of capital outlay millage revenue. In FY18, the School District will be at 51.1% of its total legal debt service capacity, and 76.7% of recommended capacity.

School District of Lee County2017-2018 Final Budget
82
2014-15 2015-16 2016-17 2017-18 ACTUAL ACTUAL ACTUAL BUDGET CHANGE PERCENT
REVENUE
STATE SOURCESCO & DS withheld for SBE/COBI 2,201,187 1,977,534 2,013,091 2,059,550 46,459 2.31%SBE/COBI Bond Interest 1,851 376 549 1,000 451 82.03%
Sub-total 2,203,038 1,977,910 2,013,640 2,060,550 46,910 2.33%
Interest on Investments 88,595 32,833 94,852 (94,852) (100.00%)Net Inc (Dec) Fair Mkt Val Invest. (73,358)
INCOMING TRANSFERSFrom Debt Service Fund 8 152 (152) (100.00%)From Capital Projects 40,360,831 41,837,755 45,168,949 45,280,765 111,816 0.25%
NON-REVENUE SOURCESRefunding Bonds 137,453,000 60,177,000 (60,177,000) (100.00%)Loans 35,000 (35,000) (100.00%)Certificates of Participation (COP) 702,060 (702,060) (100.00%)Premium on Refunding Bonds 20,387,177Beginning Balance 7,834,188 7,827,097 9,511,078 11,674,227 2,163,149 22.74%
TOTAL REVENUE 208,253,471 51,675,604 117,702,731 59,015,542 (58,687,189) (49.86%)
APPROPRIATIONS/EXPENSES
DEBT SERVICERedemption of Principal 26,291,489 26,823,872 28,342,021 30,907,245 2,565,224 9.05%Interest 14,625,502 15,309,463 16,761,869 16,398,570 (363,299) (2.17%)Dues and Fees 1,381,694 31,183 924,462 35,500 (888,962) (96.16%)Payment to Refund COP 158,127,690 60,000,000 (60,000,000) (100.00%)Total Debt Service 200,426,374 42,164,518 106,028,352 47,341,315 (58,687,037) (55.35%)
OUTGOING TRANSFERSTransfer to Debt Service Fund 8 152 (152) (100.00%)Unappropriated Fund Balance 7,827,097 9,511,078 11,674,227 11,674,227
TOTAL APPROPRIATIONS/EXPENSES 208,253,471 51,675,604 117,702,731 59,015,542 (58,687,189) (49.86%)
*Proceeds from refinancing of debt caused a major increase in the debt service fund in 2015 and 2017.
TO 2017-2018
DEBT SERVICE FUND
2016-2017

School District of Lee County2017-2018 Final Budget
____________________________________________________________________________________________________
83
FUTURE ANNUAL REQUIREMENTS TO RETIRE DEBT
FYE 6-30-18
COPS SBE
BOND BOND TOTAL TOTAL TOTAL
FY & PMT TYPE TOTAL TOTAL BONDS NOTE PAYABLE DEBT
17/18 PRINCIPAL 28,084,600.00 1,885,000.00 29,969,600.00 4,769,643.18 34,739,243.18
INTEREST 16,147,732.80 174,550.00 16,322,282.80 342,953.33 16,665,236.13
0.00
SUBTOTAL 44,232,332.80 2,059,550.00 46,291,882.80 5,112,596.51 51,404,479.31
18/19 PRINCIPAL 29,209,600.00 503,000.00 29,712,600.00 4,892,598.40 34,605,198.40
INTEREST 15,051,707.50 80,300.00 15,132,007.50 253,688.95 15,385,696.45
SUBTOTAL 44,261,307.50 583,300.00 44,844,607.50 5,146,287.35 49,990,894.85
19/20 PRINCIPAL 30,590,600.00 420,000.00 31,010,600.00 4,363,123.91 35,373,723.91
INTEREST 13,888,863.60 55,500.00 13,944,363.60 171,768.27 14,116,131.87
SUBTOTAL 44,479,463.60 475,500.00 44,954,963.60 4,534,892.18 49,489,855.78
20/21 PRINCIPAL 31,740,600.00 248,000.00 31,988,600.00 4,245,876.63 36,234,476.63
INTEREST 12,843,650.50 40,350.00 12,884,000.50 114,431.65 12,998,432.15
SUBTOTAL 44,584,250.50 288,350.00 44,872,600.50 4,360,308.28 49,232,908.78
21/22 PRINCIPAL 33,003,600.00 267,000.00 33,270,600.00 4,323,584.47 37,594,184.47
INTEREST 11,579,440.00 27,950.00 11,607,390.00 57,447.31 11,664,837.31
SUBTOTAL 44,583,040.00 294,950.00 44,877,990.00 4,381,031.78 49,259,021.78
22/23 PRINCIPAL 32,544,600.00 239,000.00 32,783,600.00 42,074.46 32,825,674.46
INTEREST 10,326,972.20 16,700.00 10,343,672.20 115.05 10,343,787.25
SUBTOTAL 42,871,572.20 255,700.00 43,127,272.20 42,189.51 43,169,461.71
23/24 PRINCIPAL 35,493,600.00 139,000.00 35,632,600.00 0.00 35,632,600.00
INTEREST 9,221,990.00 6,950.00 9,228,940.00 0.00 9,228,940.00
SUBTOTAL 44,715,590.00 145,950.00 44,861,540.00 0.00 44,861,540.00
24/25 PRINCIPAL 37,157,600.00 0.00 37,157,600.00 0.00 37,157,600.00
INTEREST 7,958,172.80 0.00 7,958,172.80 0.00 7,958,172.80
SUBTOTAL 45,115,772.80 0.00 45,115,772.80 0.00 45,115,772.80
25/26 PRINCIPAL 38,411,600.00 0.00 38,411,600.00 0.00 38,411,600.00
INTEREST 6,668,346.50 0.00 6,668,346.50 0.00 6,668,346.50
SUBTOTAL 45,079,946.50 0.00 45,079,946.50 0.00 45,079,946.50
26/27 PRINCIPAL 30,180,000.00 0.00 30,180,000.00 0.00 30,180,000.00
INTEREST 5,081,250.00 0.00 5,081,250.00 0.00 5,081,250.00
SUBTOTAL 35,261,250.00 0.00 35,261,250.00 0.00 35,261,250.00
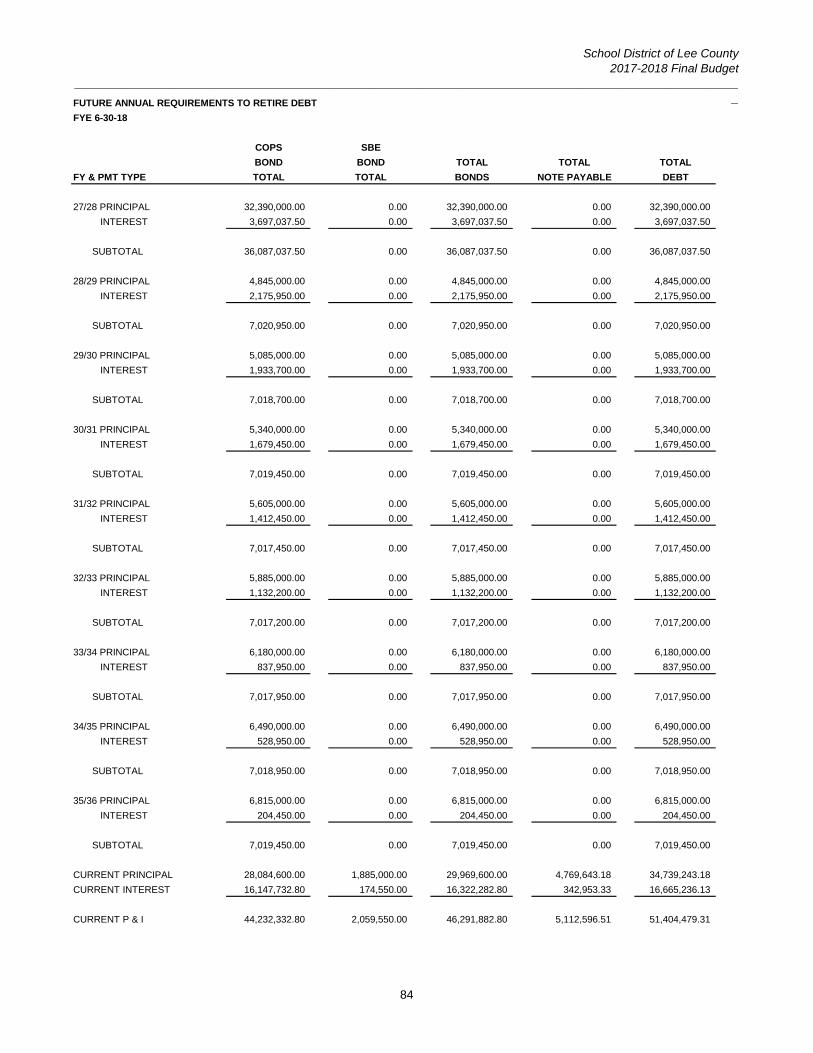
School District of Lee County2017-2018 Final Budget
____________________________________________________________________________________________________
84
FUTURE ANNUAL REQUIREMENTS TO RETIRE DEBT
FYE 6-30-18
COPS SBE
BOND BOND TOTAL TOTAL TOTAL
FY & PMT TYPE TOTAL TOTAL BONDS NOTE PAYABLE DEBT
27/28 PRINCIPAL 32,390,000.00 0.00 32,390,000.00 0.00 32,390,000.00
INTEREST 3,697,037.50 0.00 3,697,037.50 0.00 3,697,037.50
SUBTOTAL 36,087,037.50 0.00 36,087,037.50 0.00 36,087,037.50
28/29 PRINCIPAL 4,845,000.00 0.00 4,845,000.00 0.00 4,845,000.00
INTEREST 2,175,950.00 0.00 2,175,950.00 0.00 2,175,950.00
SUBTOTAL 7,020,950.00 0.00 7,020,950.00 0.00 7,020,950.00
29/30 PRINCIPAL 5,085,000.00 0.00 5,085,000.00 0.00 5,085,000.00
INTEREST 1,933,700.00 0.00 1,933,700.00 0.00 1,933,700.00
SUBTOTAL 7,018,700.00 0.00 7,018,700.00 0.00 7,018,700.00
30/31 PRINCIPAL 5,340,000.00 0.00 5,340,000.00 0.00 5,340,000.00
INTEREST 1,679,450.00 0.00 1,679,450.00 0.00 1,679,450.00
SUBTOTAL 7,019,450.00 0.00 7,019,450.00 0.00 7,019,450.00
31/32 PRINCIPAL 5,605,000.00 0.00 5,605,000.00 0.00 5,605,000.00
INTEREST 1,412,450.00 0.00 1,412,450.00 0.00 1,412,450.00
SUBTOTAL 7,017,450.00 0.00 7,017,450.00 0.00 7,017,450.00
32/33 PRINCIPAL 5,885,000.00 0.00 5,885,000.00 0.00 5,885,000.00
INTEREST 1,132,200.00 0.00 1,132,200.00 0.00 1,132,200.00
SUBTOTAL 7,017,200.00 0.00 7,017,200.00 0.00 7,017,200.00
33/34 PRINCIPAL 6,180,000.00 0.00 6,180,000.00 0.00 6,180,000.00
INTEREST 837,950.00 0.00 837,950.00 0.00 837,950.00
SUBTOTAL 7,017,950.00 0.00 7,017,950.00 0.00 7,017,950.00
34/35 PRINCIPAL 6,490,000.00 0.00 6,490,000.00 0.00 6,490,000.00
INTEREST 528,950.00 0.00 528,950.00 0.00 528,950.00
SUBTOTAL 7,018,950.00 0.00 7,018,950.00 0.00 7,018,950.00
35/36 PRINCIPAL 6,815,000.00 0.00 6,815,000.00 0.00 6,815,000.00
INTEREST 204,450.00 0.00 204,450.00 0.00 204,450.00
SUBTOTAL 7,019,450.00 0.00 7,019,450.00 0.00 7,019,450.00
CURRENT PRINCIPAL 28,084,600.00 1,885,000.00 29,969,600.00 4,769,643.18 34,739,243.18
CURRENT INTEREST 16,147,732.80 174,550.00 16,322,282.80 342,953.33 16,665,236.13
CURRENT P & I 44,232,332.80 2,059,550.00 46,291,882.80 5,112,596.51 51,404,479.31

School District of Lee County2017-2018 Final Budget
____________________________________________________________________________________________________
85
FUTURE ANNUAL REQUIREMENTS TO RETIRE DEBT
FYE 6-30-18
COPS SBE
BOND BOND TOTAL TOTAL TOTAL
FY & PMT TYPE TOTAL TOTAL BONDS NOTE PAYABLE DEBT
LT PRINCIPAL 376,966,800.00 1,816,000.00 378,782,800.00 17,867,257.87 396,650,057.87
LT INTEREST 106,222,530.60 227,750.00 106,450,280.60 597,451.23 107,047,731.83
LT P & I 483,189,330.60 2,043,750.00 485,233,080.60 18,464,709.10 503,697,789.70
TOTAL PRINCIPAL 405,051,400.00 3,701,000.00 408,752,400.00 22,636,901.05 431,389,301.05
TOTAL INTEREST 122,370,263.40 402,300.00 122,772,563.40 940,404.56 123,712,967.96
TOTAL P & I 527,421,663.40 4,103,300.00 531,524,963.40 23,577,305.61 555,102,269.01
INTEREST RATES 4.017/5.587 4.30/6.00 1.64/4.027
FINAL MATURITY 2036 2024 2023

FY TOTAL
12 528,192,959
13 500,809,520
14 478,616,903
15 436,996,704
16 416,181,793
17 470,614,922
18 431,389,301
19 396,650,058
20 362,044,859
21 326,671,136
86 22 290,436,659
23 252,842,474
24 220,016,800
25 184,384,200
26 147,226,600
27 108,815,000
28 78,635,000
29 46,245,000
30 41,400,000
31 36,315,000
32 30,975,000
33 25,370,000
34 19,485,000
35 13,305,000
36 6,815,000
SCHOOL DISTRICT OF LEE COUNTY FINAL BUDGET
OUTSTANDING DEBT
2017-2018
-
25
50
75
100
125
150
175
200
225
250
275
300
325
350
375
400
425
450
475
500
525
550
575
12 13 14 15 16 17 18 19 20 21 22 23 24 25 26 27 28 29 30 31 32 33 34 35 36
Millions
Note: The chart includes all debt principal from State Board of Education bonds, 1011.13 loans, a lease agreement with FP&L and COPs.

School District of Lee County 2017-2018 Final Budget
_______________________________________________________________________________
87
CAPITAL PROJECTS FUND
The Capital Projects Budget totals $288.5 million for 2017-2018 and represents 19.1% of our total budget.
As part of the budget requirements, the School Board holds a workshop to review, discuss, and approve a Five-Year Capital Outlay Plan for the expenditure of property tax revenue and other state and local capital revenue sources available for the fiscal year.
The Five-Year Capital Outlay Plan is reviewed semi-annually by the Board. The current five year plan focuses on adding student stations with the addition of seven new schools over the next five years – two elementary schools, three middle schools, two high schools (includes Bonita High School which is opening in FY18 in portables) and an addition at Lehigh Senior High School. Capital resources will also be used to completely renovate two existing schools, replacement of buses, maintenance of schools, and technology.
Capital Projects funds report the revenues, transfers, and appropriations for construction, renovation, maintenance and repair of educational facilities. Major funding sources include:
Property tax revenues are permitted for school districts through Florida Statute. Section 1011.71 permits school boards to levy a maximum of 1.500 mills for capital outlay purposes at the option of local school boards. For FY18 the capital millage will generate approximately $118 million, which is used to fund capital projects, maintain schools and repayment of debt.
Impact Fees for the school district are levied according to the ordinance approved by the Board of County Commissioners. Impact fees can be used to mitigate the effects of growth on the school district. Authorized uses include the purchase of land and construction of buildings that add additional student stations to accommodate growth. On March 12, 2013, County Commissioners approved a two year reduction in impact fees of 80%. In March 2015, the impact fee rate was increased by 15.7%. The collection rate was also increased from 20% to 45%.
Public Education Capital Outlay (PECO) funds had been the primary source of state revenue for capital projects since 1976. These funds are derived from utility taxes throughout the State and are allocated by the legislature each year. This revenue source has decreased drastically for traditional public schools.
State and local capital projects funds must be spent on capital outlay projects in accordance with Florida Statues and State Board of Education Rules.
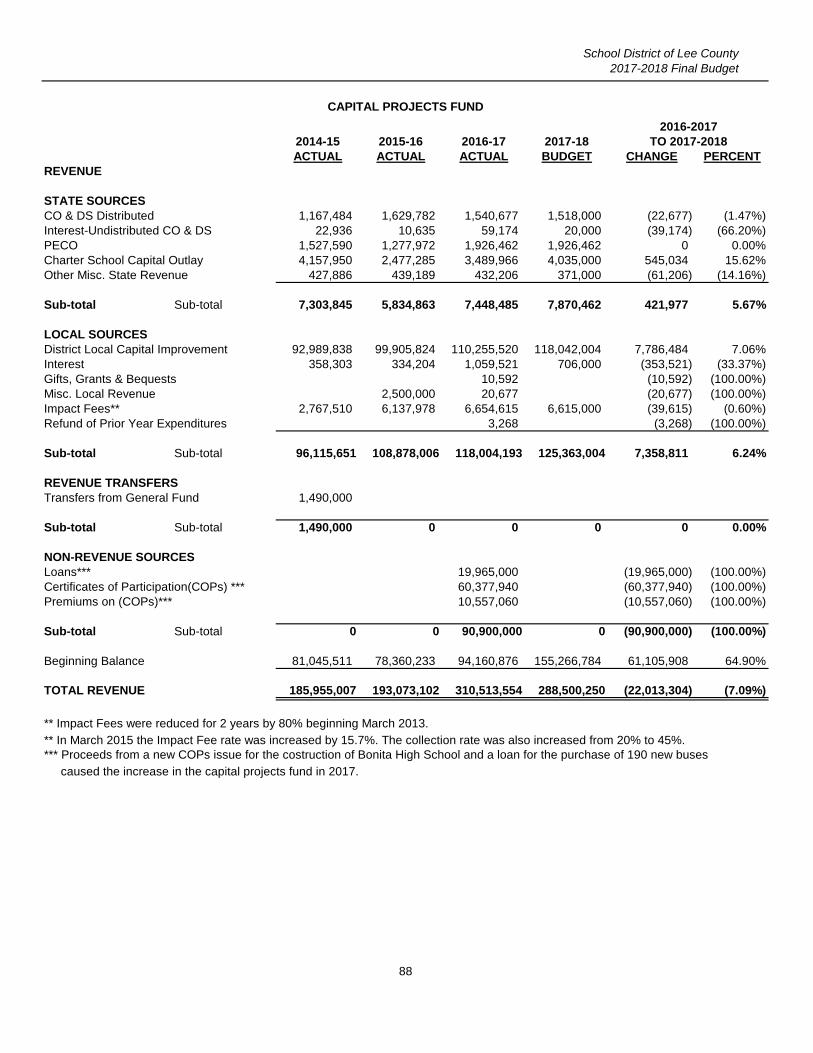
School District of Lee County2017-2018 Final Budget
88
2016-20172014-15 2015-16 2016-17 2017-18 TO 2017-2018ACTUAL ACTUAL ACTUAL BUDGET CHANGE PERCENT
REVENUE
STATE SOURCESCO & DS Distributed 1,167,484 1,629,782 1,540,677 1,518,000 (22,677) (1.47%)Interest-Undistributed CO & DS 22,936 10,635 59,174 20,000 (39,174) (66.20%)PECO 1,527,590 1,277,972 1,926,462 1,926,462 0 0.00%Charter School Capital Outlay 4,157,950 2,477,285 3,489,966 4,035,000 545,034 15.62%Other Misc. State Revenue 427,886 439,189 432,206 371,000 (61,206) (14.16%)
Sub-total Sub-total 7,303,845 5,834,863 7,448,485 7,870,462 421,977 5.67%
LOCAL SOURCESDistrict Local Capital Improvement 92,989,838 99,905,824 110,255,520 118,042,004 7,786,484 7.06%Interest 358,303 334,204 1,059,521 706,000 (353,521) (33.37%)Gifts, Grants & Bequests 10,592 (10,592) (100.00%)Misc. Local Revenue 2,500,000 20,677 (20,677) (100.00%)Impact Fees** 2,767,510 6,137,978 6,654,615 6,615,000 (39,615) (0.60%)Refund of Prior Year Expenditures 3,268 (3,268) (100.00%)
Sub-total Sub-total 96,115,651 108,878,006 118,004,193 125,363,004 7,358,811 6.24%
REVENUE TRANSFERSTransfers from General Fund 1,490,000
Sub-total Sub-total 1,490,000 0 0 0 0 0.00%
NON-REVENUE SOURCESLoans*** 19,965,000 (19,965,000) (100.00%)Certificates of Participation(COPs) *** 60,377,940 (60,377,940) (100.00%)Premiums on (COPs)*** 10,557,060 (10,557,060) (100.00%)
Sub-total Sub-total 0 0 90,900,000 0 (90,900,000) (100.00%)
Beginning Balance 81,045,511 78,360,233 94,160,876 155,266,784 61,105,908 64.90%
TOTAL REVENUE 185,955,007 193,073,102 310,513,554 288,500,250 (22,013,304) (7.09%)
** Impact Fees were reduced for 2 years by 80% beginning March 2013.
** In March 2015 the Impact Fee rate was increased by 15.7%. The collection rate was also increased from 20% to 45%. *** Proceeds from a new COPs issue for the costruction of Bonita High School and a loan for the purchase of 190 new buses
caused the increase in the capital projects fund in 2017.
CAPITAL PROJECTS FUND

School District of Lee County2017-2018 Final Budget
89
2016-20172014-15 2015-16 2016-17 2017-18 TO 2017-2018ACTUAL ACTUAL ACTUAL BUDGET CHANGE PERCENT
CAPITAL PROJECTS FUND
APPROPRIATIONS/EXPENSESLibrary Books 2,294AV Materials CapitalizedAV Materials Non-Capitalized 247Buildings & Fixed Equipment 3,358,336 21,876 8,634,096 45,233,053 36,598,957 423.89%Furn Fixtures & Equip. Capitalized 1,584,765 819,223 894,842 14,703,499 13,808,657 1543.14%Furn Fixt & Equip. Non-capitalized 3,434,130 3,651,976 2,723,711 3,087,354 363,643 13.35%Computer Hardware Capitalized 2,350,963 870,194 1,068,554 5,214,518 4,145,964 388.00%Computer Hardware Non-capitalized 10,094,146 11,642,814 15,753,074 14,184,262 (1,568,813) (9.96%)School Buses 3,976,221 23,411,905 15,937,374 (7,474,531) (31.93%)Motor Vehicles 18,499Land 28,690 11,171,997 (11,171,997) (100.00%)Improvement Other than Bldgs. 43,283 315,483 405,616 462,380 56,764 13.99%Non-Capitalized Land Improvements 1,241,335 2,033,338 3,576,025 4,749,096 1,173,071 32.80%Remodeling 60,742 9,600 24,285 6,005 (18,280) (75.27%)Capitalized Personnel Costs 37,471 810,625 63,010 821,965 758,955 1204.49%Capitalized Operating Costs 1,229,365 1,396,301 1,230,393 1,787,763 557,370 45.30%Non-Capitalized Remodel & Renovation 19,340,923 18,122,011 29,297,809 34,828,130 5,530,321 18.88%Software Capitalized 267,171 895,999 30,000 30,000 100.00%Software Non-capitalized 924,344 (924,344) (100.00%)
Sub-total Sub-total 43,063,422 44,594,598 99,179,661 141,045,399 41,865,738 42.21%
Dues & Fees 12,571 2,587 2,746 3,000 254 9.27%
Sub-total 12,571 2,587 2,746 3,000 254 9.27%
OUTGOING TRANSFERSTo General Fund 24,157,950 12,477,285 10,895,414 9,619,350 (1,276,064) (11.71%)To Debt Service 40,360,831 41,837,755 45,168,949 45,280,765 111,816 0.25%Sub-total Sub-total 64,518,781 54,315,041 56,064,363 54,900,115 (1,164,248) (2.08%)
Fund Balance/Equity 78,360,233 94,160,876 155,266,784 92,551,736 (62,715,048) (40.39%)
TOTAL APPROPRIATIONS/EXP 185,955,007 193,073,102 310,513,554 288,500,250 (22,013,304) (7.09%)
Note: Capitalized items cost $1,000 or more per item. Non-capitalized items cost less than $1,000 per item.

ESTIMATED REVENUE ActualCurrent Revenue 16/17 17/18 18/19 19/20 20/21 21/22 FIVE YEAR TOTAL
Taxes 110,255,520 118,042,004 123,944,000 128,902,000 132,769,000 136,752,000 640,409,004
Impact Fees 6,654,615 6,615,000 6,946,000 7,293,000 7,658,000 8,041,000 36,553,000
CO & DS 1,540,677 1,518,000 1,564,000 1,611,000 1,659,000 1,709,000 8,061,000
PECO Maintenance 1,926,462 1,926,462 1,926,462 1,978,150 2,016,016 2,016,016 9,863,106
Charter Schools Revenue 3,489,966 4,035,000 4,236,750 4,385,000 4,538,000 4,697,000 21,891,750
Misc. 463,476 371,000 378,000 391,000 405,000 419,000 1,964,000
Interest 1,118,695 726,000 950,000 975,000 844,000 744,000 4,239,000
Current Revenue sub-total 125,449,411 133,233,466 139,945,212 145,535,150 149,889,016 154,378,016 722,980,860
Additional Revenue
Fund Balance - Unallocated 94,160,876 155,266,784 198,701,736 202,943,330 163,120,708 132,097,369 155,266,784
Prior Year Refund 3,268 0
DEBT PROCEEDS
New COPs 70,935,000 131,700,000 94,000,000 29,000,000 75,600,000 0 330,300,000
FY17 Bus Loan 19,965,000 0
TOTAL ESTIMATED REVENUE 310,513,554 420,200,250 432,646,948 377,478,480 388,609,724 286,475,385 1,208,547,644
90
APPROPRIATIONS
EAST ZONE CONSTRUCTION PROJECTS 0 11,750,000 22,250,000 55,850,000 74,750,000 18,900,000 183,500,000
SOUTH ZONE CONSTRUCTION PROJECTS 20,923,852 63,691,975 66,000,000 14,500,000 33,400,000 18,900,000 196,491,975
WEST ZONE CONSTRUCTION PROJECTS 0 0 0 0 0 0 0
SUPPORT FACILITIES PROJECTS 0 0 0 0 0 0 0
MAJOR MAINTENANCE REPAIRS/RENOVATIONS 32,479,556 40,387,497 33,647,600 33,204,925 34,257,060 34,390,425 175,887,507
TECHNOLOGY 20,766,278 22,723,530 19,755,000 20,273,000 20,806,000 21,355,000 104,912,530
EQUIPMENT/BUSES 25,009,976 19,742,397 13,509,000 13,594,000 13,681,000 13,771,000 74,297,397
CHARTER SCHOOLS - TAX REVENUE 8,300,000 8,676,080 9,023,140 9,293,830 9,572,640 44,865,690
TRANSFERS 10,895,414 9,619,350 9,600,317 9,563,110 9,571,453 9,581,457 47,935,687
BANK FEES 2,746 3,000 0 0 0 0 3,000
DEBT SERVICE 45,168,949 45,280,765 56,265,621 58,349,597 60,753,012 66,751,801 287,400,796
TOTAL APPROPRIATIONS 155,246,770 221,498,514 229,703,618 214,357,772 256,512,355 193,222,323 1,115,294,581
ALLOCATED FUND BAL CARRYFORWARDCARRYFORWARD/RESERVE FUTURE PROJ.** 155,266,784 198,701,736 202,943,330 163,120,708 132,097,369 93,253,062 93,253,062
ADJUSTMENTS TO FUND BALANCE 8.85%
TOTAL APPROPRIATIONS AND RESERVES 310,513,554 420,200,250 432,646,948 377,478,480 388,609,724 286,475,385 1,208,547,644
**Is not an indication of available funding due to restrictions applicable to various sources of capital funding.
LEE COUNTY SCHOOL DISTRICTCapital Plan2018-2022

SCHOOL PROJECTS
STUDENT Five Year
Prj # PROJECT SEATS 16/17 17/18 18/19 19/20 20/21 21/22 TotalA. EAST ZONE CONSTRUCTION PROJECTS
* ELEM EAST 1,034 2,000,000 13,000,000 13,000,000 28,000,000
* EAST MIDDLE 1,345 2,000,000 3,500,000 14,850,000 14,850,000 35,200,000
EAST MIDDLE 1,345 18,900,000 18,900,000 37,800,000
7046 EAST HIGH 2,200 3,500,000 10,500,000 28,000,000 28,000,000 70,000,000
LEHIGH SENIOR ADDITION 500 6,250,000 6,250,000 12,500,000 SUB-TOTAL EAST ZONE CONSTRUCTION PROJECTS 0 11,750,000 22,250,000 55,850,000 74,750,000 18,900,000 183,500,000
STUDENT Five Year
Prj # PROJECT SEATS 16/17 17/18 18/19 19/20 20/21 21/22 TotalB. SOUTH ZONE CONSTRUCTION PROJECTS
* SOUTH ELEMENTARY 1,034 14,500,000 14,500,000 29,000,000
FRANKLIN PARK ELEMENTARY REMODEL 28,000,000 28,000,000
CYPRESS LAKE MIDDLE REMODEL 38,000,000 38,000,000
SOUTH MIDDLE 1,345 18,900,000 18,900,000 37,800,000
7045 SOUTH HIGH (LLL) 1,694 20,923,852 63,691,975 63,691,975
SOUTH HIGH 0SUB-TOTAL SOUTH ZONE CONSTRUCTION PROJECTS 20,923,852 63,691,975 66,000,000 14,500,000 33,400,000 18,900,000 196,491,975
91 STUDENT Five Year
Prj # PROJECT SEATS 16/17 17/18 18/19 19/20 20/21 21/22 TotalC. WEST ZONE CONSTRUCTION PROJECTS
* WEST ELEMENTARY 1000 0
WEST MIDDLE 1334 0* WEST HIGH 2106 0
SUB-TOTAL - WEST ZONE PROJECTS 0 0 0 0 0 0 -
TOTAL - SCHOOL CONSTRUCTION PROJECTS 20,923,852 75,441,975 88,250,000 70,350,000 108,150,000 37,800,000 379,991,975
TOTAL CONSTRUCTION PROJECTS 20,923,852 75,441,975 88,250,000 70,350,000 108,150,000 37,800,000 379,991,975
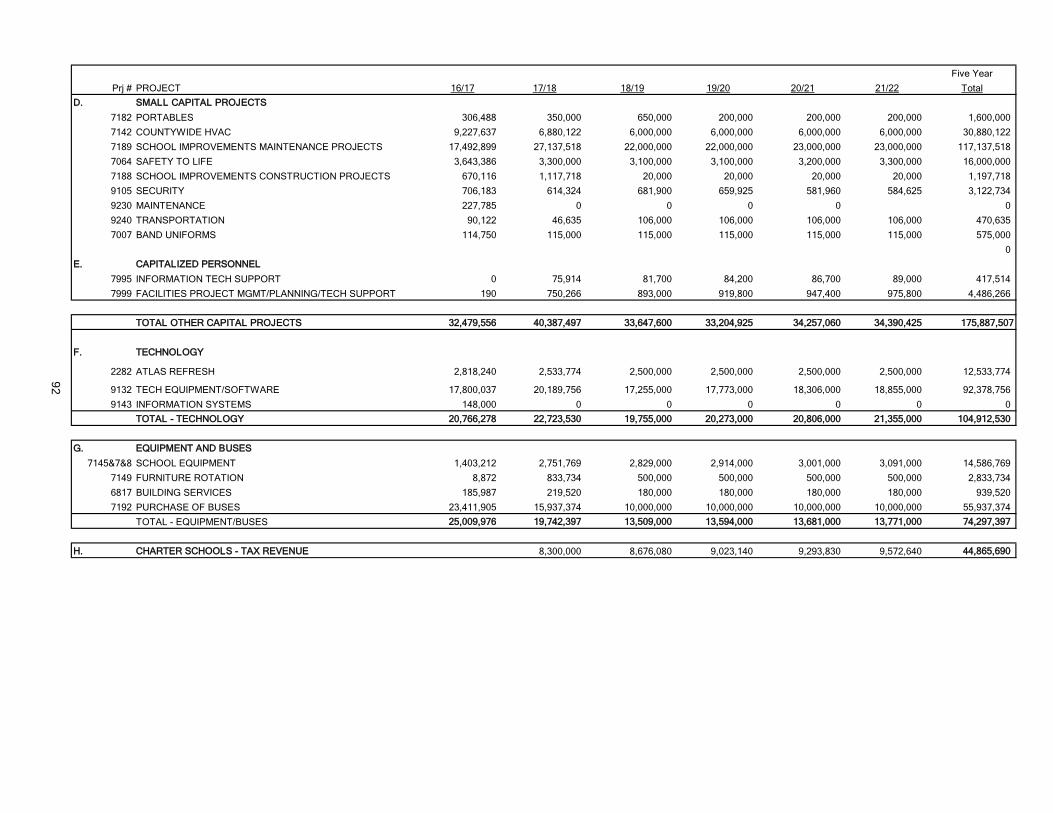
Five Year
Prj # PROJECT 16/17 17/18 18/19 19/20 20/21 21/22 TotalD. SMALL CAPITAL PROJECTS
7182 PORTABLES 306,488 350,000 650,000 200,000 200,000 200,000 1,600,000
7142 COUNTYWIDE HVAC 9,227,637 6,880,122 6,000,000 6,000,000 6,000,000 6,000,000 30,880,122
7189 SCHOOL IMPROVEMENTS MAINTENANCE PROJECTS 17,492,899 27,137,518 22,000,000 22,000,000 23,000,000 23,000,000 117,137,518
7064 SAFETY TO LIFE 3,643,386 3,300,000 3,100,000 3,100,000 3,200,000 3,300,000 16,000,000
7188 SCHOOL IMPROVEMENTS CONSTRUCTION PROJECTS 670,116 1,117,718 20,000 20,000 20,000 20,000 1,197,718
9105 SECURITY 706,183 614,324 681,900 659,925 581,960 584,625 3,122,734
9230 MAINTENANCE 227,785 0 0 0 0 0
9240 TRANSPORTATION 90,122 46,635 106,000 106,000 106,000 106,000 470,635
7007 BAND UNIFORMS 114,750 115,000 115,000 115,000 115,000 115,000 575,000
0E. CAPITALIZED PERSONNEL
7995 INFORMATION TECH SUPPORT 0 75,914 81,700 84,200 86,700 89,000 417,514
7999 FACILITIES PROJECT MGMT/PLANNING/TECH SUPPORT 190 750,266 893,000 919,800 947,400 975,800 4,486,266
TOTAL OTHER CAPITAL PROJECTS 32,479,556 40,387,497 33,647,600 33,204,925 34,257,060 34,390,425 175,887,507
F. TECHNOLOGY
2282 ATLAS REFRESH 2,818,240 2,533,774 2,500,000 2,500,000 2,500,000 2,500,000 12,533,77492 9132 TECH EQUIPMENT/SOFTWARE 17,800,037 20,189,756 17,255,000 17,773,000 18,306,000 18,855,000 92,378,756
9143 INFORMATION SYSTEMS 148,000 0 0 0 0 0 0TOTAL - TECHNOLOGY 20,766,278 22,723,530 19,755,000 20,273,000 20,806,000 21,355,000 104,912,530
G. EQUIPMENT AND BUSES
7145&7&8 SCHOOL EQUIPMENT 1,403,212 2,751,769 2,829,000 2,914,000 3,001,000 3,091,000 14,586,769
7149 FURNITURE ROTATION 8,872 833,734 500,000 500,000 500,000 500,000 2,833,734
6817 BUILDING SERVICES 185,987 219,520 180,000 180,000 180,000 180,000 939,520
7192 PURCHASE OF BUSES 23,411,905 15,937,374 10,000,000 10,000,000 10,000,000 10,000,000 55,937,374
TOTAL - EQUIPMENT/BUSES 25,009,976 19,742,397 13,509,000 13,594,000 13,681,000 13,771,000 74,297,397
H. CHARTER SCHOOLS - TAX REVENUE 8,300,000 8,676,080 9,023,140 9,293,830 9,572,640 44,865,690

Five Year
Prj # PROJECT 16/17 17/18 18/19 19/20 20/21 21/22 Total
I. TRANSFERS
9600 TRANSFER FOR CHARTER SCHOOLS - PECO 3,202,795 4,035,000 4,236,750 4,385,000 4,538,000 4,697,000 21,891,750
9600 TRF FOR INNOVATIVE GRANTS/BP SETTLEMENT 2,500,000 0
9600 GROWTH INCREMENTAL (4,807,381) (4,415,650) (4,636,433) (4,821,890) (4,966,547) (5,115,543) (23,956,063)
9600 TRANSFER FOR MAINTENANCE 10,000,000 10,000,000 10,000,000 10,000,000 10,000,000 10,000,000 50,000,000
TOTAL TRANSFERS 10,895,414 9,619,350 9,600,317 9,563,110 9,571,453 9,581,457 47,935,687
BANK FEES 2,746 3,000 3,000
J. DEBT SERVICE
29400 FY08 COPs 718,020 0 0 0 0 0 0
29600 FY10 COPS 4,368,965 6,421,343 6,418,676 6,417,780 0 0 19,257,799
29900 FY11 QSCB 2,021,082 2,028,819 2,023,819 2,023,819 2,023,819 2,023,819 10,124,095
29501 FY12B COPs 17,330,892 17,298,100 15,991,450 3,280,950 24,625,950 24,631,700 85,828,150
29801 FY12C COPs 574,308 574,033 1,893,633 14,825,780 0 0 17,293,446
29301 FY13 COPs 2,212,480 250,065 246,258 246,412 246,509 246,548 1,235,792
29302 FY14A COPs 4,558,028 4,487,913 4,491,413 4,484,413 4,484,413 4,480,913 22,429,065
29201 FY14B COPs 7,798,861 7,786,750 7,786,250 7,788,000 7,791,500 7,791,000 38,943,50093 29500 FY16A COPs 3,249,234 3,796,050 3,791,050 3,793,550 3,793,300 3,790,300 18,964,250
29401 FY17 COPs 611,408 1,623,762 1,618,762 1,618,762 1,618,762 1,618,762 8,098,810
29702 FY17 Bus Loan 306,839 0 0 0 0 0 0
MMM (EAST) HIGH DEBT SERVICE 0 0 4,000,000 4,000,000 4,000,000 4,000,000 16,000,000
MIDDLE SCHOOL (EAST) DEBT SERVICE 0 0 3,000,000 3,000,000 3,000,000 3,000,000 12,000,000
FRANKLIN PARK/CYPRESS MIDDLE DEBT SVC 0 0 4,000,000 4,000,000 4,000,000 4,000,000 16,000,000
ELEM SCHOOL (EAST) DEBT SERVICE 0 0 0 2,500,000 2,500,000 2,500,000 7,500,000
ELEM SCHOOL (SOUTH) DEBT SERVICE 0 0 0 0 2,500,000 2,500,000 5,000,000
MIDDLE SCHOOL (SOUTH) DEBT SERVICE 0 0 0 0 0 3,000,000 3,000,000
MIDDLE SCHOOL (EAST) DEBT SERVICE 0 0 0 0 0 3,000,000 3,000,000
Fund 29100 FP&L Lease Agreement 441,476 21,269 0 0 0 0 21,269
Fund 29700 FP&L Lease Agreement 808,597 823,902 835,551 201,372 0 0 1,860,825
Fune 29701 FY12 FP&L Lease Agreement 168,758 168,759 168,759 168,759 168,759 168,759 843,795TRANSFER TO DEBT SERVICE 45,168,949 45,280,765 56,265,621 58,349,597 60,753,012 66,751,801 287,400,796
Value of 50% Mill 55,127,760 59,021,002 61,972,000 64,451,000 66,384,500 68,376,000
Debt Service as % of 50% mill 81.9% 76.7% 90.8% 90.5% 91.5% 97.6%
Statutory Debt Limit (75%) 82,691,640 88,531,503 92,958,000 96,676,500 99,576,750 102,564,000
Debt Service as % of 75% mill 54.6% 51.1% 60.5% 60.4% 61.0% 65.1%
***Difference between FY18 budgeted amounts for Capital on previous pages and the Capital Plan is due to anticipated COPs and related expenditures for the construction of two new schools and an addition scheduled in FY18.
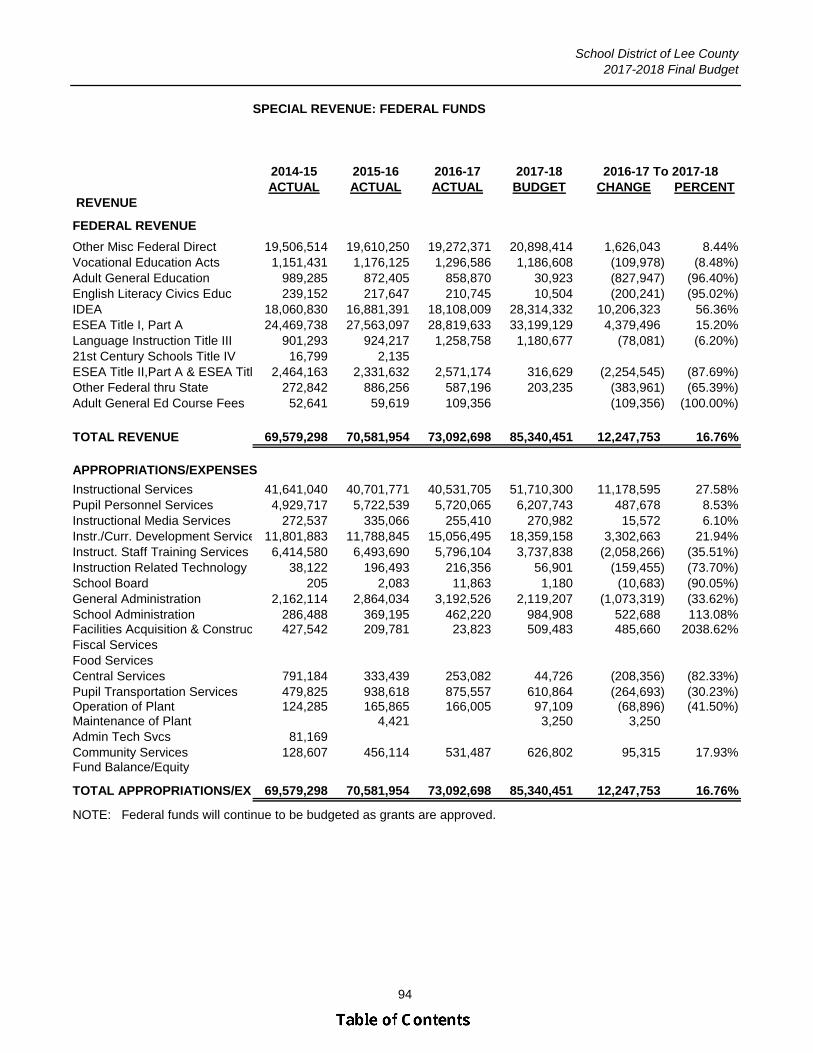
School District of Lee County2017-2018 Final Budget
94
2014-15 2015-16 2016-17 2017-18ACTUAL ACTUAL ACTUAL BUDGET CHANGE PERCENT
REVENUE
FEDERAL REVENUE
Other Misc Federal Direct 19,506,514 19,610,250 19,272,371 20,898,414 1,626,043 8.44%Vocational Education Acts 1,151,431 1,176,125 1,296,586 1,186,608 (109,978) (8.48%)Adult General Education 989,285 872,405 858,870 30,923 (827,947) (96.40%)English Literacy Civics Educ 239,152 217,647 210,745 10,504 (200,241) (95.02%)IDEA 18,060,830 16,881,391 18,108,009 28,314,332 10,206,323 56.36%ESEA Title I, Part A 24,469,738 27,563,097 28,819,633 33,199,129 4,379,496 15.20%Language Instruction Title III 901,293 924,217 1,258,758 1,180,677 (78,081) (6.20%)21st Century Schools Title IV 16,799 2,135ESEA Title II,Part A & ESEA Titl 2,464,163 2,331,632 2,571,174 316,629 (2,254,545) (87.69%)Other Federal thru State 272,842 886,256 587,196 203,235 (383,961) (65.39%)Adult General Ed Course Fees 52,641 59,619 109,356 (109,356) (100.00%)
TOTAL REVENUE 69,579,298 70,581,954 73,092,698 85,340,451 12,247,753 16.76%
APPROPRIATIONS/EXPENSES
Instructional Services 41,641,040 40,701,771 40,531,705 51,710,300 11,178,595 27.58%Pupil Personnel Services 4,929,717 5,722,539 5,720,065 6,207,743 487,678 8.53%Instructional Media Services 272,537 335,066 255,410 270,982 15,572 6.10%Instr./Curr. Development Service 11,801,883 11,788,845 15,056,495 18,359,158 3,302,663 21.94%Instruct. Staff Training Services 6,414,580 6,493,690 5,796,104 3,737,838 (2,058,266) (35.51%)Instruction Related Technology 38,122 196,493 216,356 56,901 (159,455) (73.70%)School Board 205 2,083 11,863 1,180 (10,683) (90.05%)General Administration 2,162,114 2,864,034 3,192,526 2,119,207 (1,073,319) (33.62%)School Administration 286,488 369,195 462,220 984,908 522,688 113.08%Facilities Acquisition & Construc 427,542 209,781 23,823 509,483 485,660 2038.62%Fiscal ServicesFood ServicesCentral Services 791,184 333,439 253,082 44,726 (208,356) (82.33%)Pupil Transportation Services 479,825 938,618 875,557 610,864 (264,693) (30.23%)Operation of Plant 124,285 165,865 166,005 97,109 (68,896) (41.50%)Maintenance of Plant 4,421 3,250 3,250Admin Tech Svcs 81,169Community Services 128,607 456,114 531,487 626,802 95,315 17.93%Fund Balance/Equity
TOTAL APPROPRIATIONS/EX 69,579,298 70,581,954 73,092,698 85,340,451 12,247,753 16.76%
NOTE: Federal funds will continue to be budgeted as grants are approved.
SPECIAL REVENUE: FEDERAL FUNDS
2016-17 To 2017-18

School District of Lee County2017-2018 Final Budget
95
2014-15 2015-16 2016-17 2017-18ACTUAL ACTUAL ACTUAL BUDGET CHANGE PERCENT
REVENUES
FEDERAL THROUGH STATESchool Lunch Reimbursement 23,011,368 28,188,381 30,725,456 32,243,520 1,518,064 4.94%School Breakfast Reimbursement 7,428,989 8,233,638 8,865,203 9,702,884 837,681 9.45%After School Snack Reimbursement 422,177 439,197 442,540 393,191 (49,349) (11.15%)Child Care Food Program 32,404 309,569 1,592,622 1,283,053 414.46%USDA Donated Foods 430,212 268,725 350,000 350,000Summer Feeding Program 612,726 767,699 882,992 1,079,392 196,400 22.24%Cash in Lieu of Donated Food 30,655 27,197 201,443 1,000 (200,443) (99.50%)Fresh Fruit & Vegetables 219,191 238,652 292,063 (292,063) (100.00%)Sub-total 32,155,318 38,195,893 41,719,266 45,362,609 3,643,343 8.73%
STATE SOURCESBreakfast Supplement 255,848 257,418 261,482 175,222 (86,260) (32.99%)Food Service Supplement 308,482 305,457 302,141 191,107 (111,034) (36.75%)Other Miscellaneous State Revenue
Sub-total 564,330 562,875 563,623 366,329 (197,294) (35.00%)
LOCAL SOURCESInterest on Investments 70,187 40,512 89,804 30,000 (59,804) (66.59%)Student Lunch Sales 4,973,935 2,066,262 1,796,035 1,907,332 111,297 6.20%Adult Plate Sales 605,361 618,315 612,298 680,297 67,999 11.11%Other Food Sales 245,887 195,219 128,884 120,956 (7,928) (6.15%)Cash Short and Over 28,479 (48,905) (9075) 9,075 (100.00%)Gifts Grants and Bequests 750 (750) (100.00%)Miscellaneous Local Sources 440 44,278 (44,278) (100.00%)
Sub-total 5,923,849 2,871,843 2,662,974 2,738,585 75,611 2.84%
NON-REVENUE RECEIPTSBeginning Balance 16,688,014 18,430,505 20,533,868 21,737,625 1,203,757 5.86%
TOTAL REVENUE 55,331,511 60,061,116 65,479,731 70,205,148 4,725,417 7.22%
APPROPRIATIONS/EXPENSESPersonnel Cost* 15,615,936 16,179,436 17,310,088 20,873,150 3,563,062 20.58%Food Cost 15,533,875 16,890,430 18,396,253 22,641,305 4,245,052 23.08%Operational Cost 2,866,733 2,996,417 3,213,297 3,780,919 567,622 17.66%Capital Outlay 2,884,462 3,461,079 4,822,468 4,707,897 (114,571) (2.38%)Unappropriated Fund BalanceFund Balance/Equity 18,430,505 20,533,754 21,737,625 18,201,877 (3,535,748) (16.27%)
TOTAL APPROPRIATIONS/EXPENSES 55,331,511 60,061,116 65,479,731 70,205,148 4,725,417 7.22%
*Personnel Costs are budgeted with Full Employee Benefits (Social Security, Retirement & Health Insurance). Historically, some Food Service Workers do not work full time to accrue full benefits and the actual expenses are less than the budgeted figure.
SPECIAL REVENUE - FOOD SERVICE FUND
2016-17 to 2017-18

School District of Lee County2017-2018 Final Budget
96
2014-15 2015-16 2016-17 2017-18ACTUAL ACTUAL ACTUAL BUDGET CHANGE PERCENT
REVENUE
LOCAL SOURCESInterest on Investments 67,993 180,808 424,288 90,000 (334,288) (78.79%)Medical Insurance Premiums 70,942,713 70,297,916 70,481,029 78,525,122 8,044,093 11.41%Revenue from Other Funds 16,877,680 16,125,953 17,157,467 16,789,992 (367,475) (2.14%)Pharmacy Rebate Revenue 798,725 1,879,461 1,918,252 (1,918,252) (100.00%)Miscellaneous Local Sources 15,027 280,138 (280,138) (100.00%)
Sub-total 88,687,111 88,499,165 90,261,174 95,405,114 5,143,940 5.70%
Beginning Balance 46,702,816 50,805,214 45,662,206 34,758,676 (10,903,530) (23.88%)
TOTAL REVENUE 135,389,927 139,304,379 135,923,380 130,163,790 (5,759,590) (4.24%)
APPROPRIATIONS/EXPENSES, SELF-INSURANCE - HEALTH
Personnel Cost 514,027 712,062 954,133 1,834,701 880,568 92.29%Plan Administration 5,834,559 5,338,484 5,321,062 5,384,323 63,261 1.19%Claims Expenses 61,345,920 71,168,404 77,711,100 72,200,000 (5,511,100) (7.09%)Expenses 12,209 297,137 85,445 108,416 22,971 26.88%Sub-total 67,706,715 77,516,087 84,071,740 79,527,440 (4,544,300) (5.41%)Fund Balance/Equity 50,805,533 45,362,339 34,394,172 33,481,855 (912,317) (2.65%)TOTAL APPROPRIATIONS/EXPENSESSELF-INSURANCE HEALTH 118,512,248 122,878,426 118,465,912 113,009,295 (5,456,617) (4.61%)
APPROPRIATIONS/EXPENSES, SELF-INSURANCE - PROPERTY & CASUALTY
Alternate Duty Personnel 113,141 190,298 222,698 331,992 109,294 49.08%Insurance Premiums 7,367,452 6,976,033 6,802,792 7,090,500 287,708 4.23%Plan Administration 608,841 608,871 630,294 650,000 19,706 3.13%Claims Expenses 8,587,549 8,165,315 9,301,483 8,715,000 (586,483) (6.31%)Expenses 728 348 148 2,200 2,052 1386.49%State Assessment Workers' Comp 199,968 185,088 135,549 364,803 229,254 169.13%
Sub-total 16,877,679 16,125,953 17,092,964 17,154,495 61,531 0.36%Reserve for EncumbrancesFund Balance/Equity 300,000 364,504TOTAL APPROPRIATIONS/EXPENSESSELF-INSURANCE PROP. & CASUALTY 16,877,679 16,425,953 17,457,468 17,154,495 (302,973) (1.74%)
TOTAL APPROPRIATIONS/EXPENSES INTERNAL SERVICE FUNDS 135,389,927 139,304,379 135,923,380 130,163,790 (5,759,590) (4.24%)
approved 1.5 million for Employee Wellness Incentives
INTERNAL SERVICE FUNDS
2016-17 to 2017-18
The increase in Personnel costs and Plan Administration in FY18 is due to the Board

School District of Lee County 2017-2018 Final Budget
_____________________________________________________________________________
97
STUDENT ACHIEVEMENT The School District of Lee County has endeavored to provide resources to each school that allow students and staff to be successful in every way. The following pages outline selected data that illustrates the improvement Lee County students have shown. The School District has worked to close the achievement gap, increase opportunities for advanced courses, and increase the graduation rate. Students have consistently performed at or above state average in reading and math. Our District will continue to focus on teaching children fundamental skills and building their knowledge base each year. The District’s focus on a continuous PK-12 curriculum has contributed to student success. Schools are consistently teaching the same subject matter in each grade across all schools in the District. Given the District’s mobility rate of 27.80% of children moving from school to school, this continuity is helpful in cultivating an environment of constant improvement. Reading, math, technology, career education, and higher education preparation are just a few examples of what students in the School District of Lee County learn every day that help prepare them for a successful future.
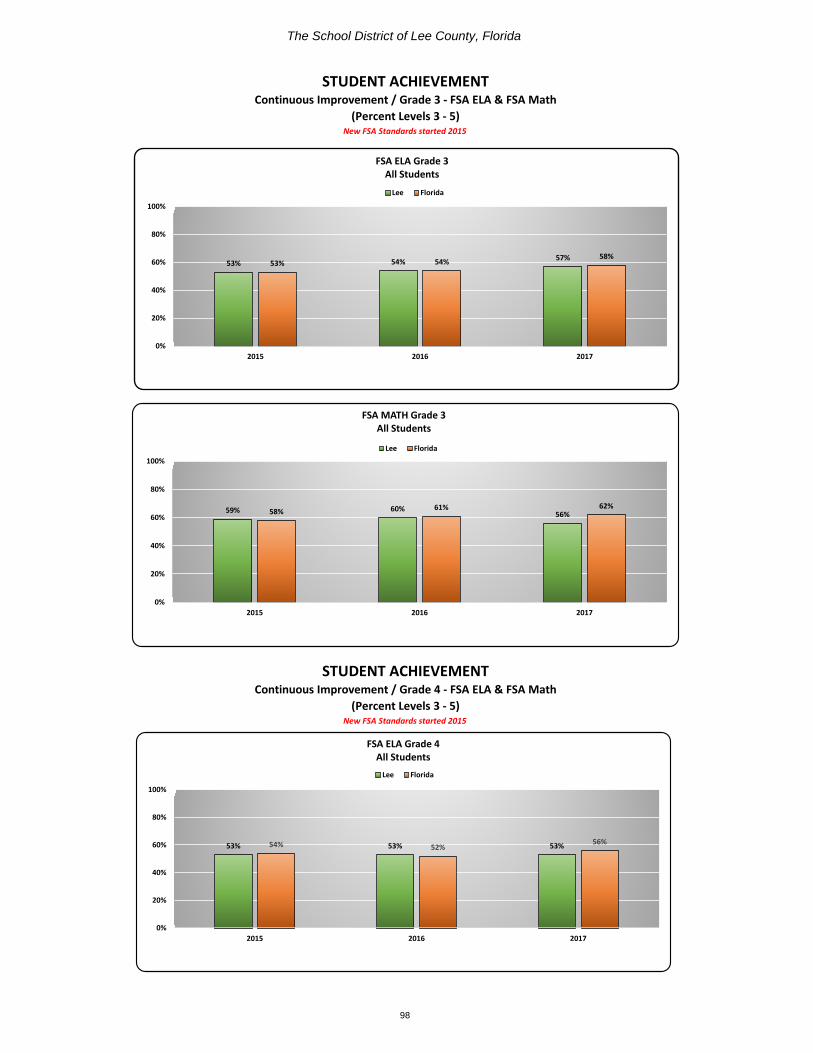
The School District of Lee County, Florida
98
STUDENT ACHIEVEMENTContinuous Improvement / Grade 3 - FSA ELA & FSA Math
(Percent Levels 3 - 5)New FSA Standards started 2015
STUDENT ACHIEVEMENTContinuous Improvement / Grade 4 - FSA ELA & FSA Math
(Percent Levels 3 - 5)New FSA Standards started 2015
53% 54% 57% 53% 54%
58%
0%
20%
40%
60%
80%
100%
2015 2016 2017
FSA ELA Grade 3 All Students
Lee Florida
59% 60% 56% 58% 61% 62%
0%
20%
40%
60%
80%
100%
2015 2016 2017
FSA MATH Grade 3 All Students
Lee Florida
53% 53% 53% 54% 52% 56%
0%
20%
40%
60%
80%
100%
2015 2016 2017
FSA ELA Grade 4 All Students
Lee Florida
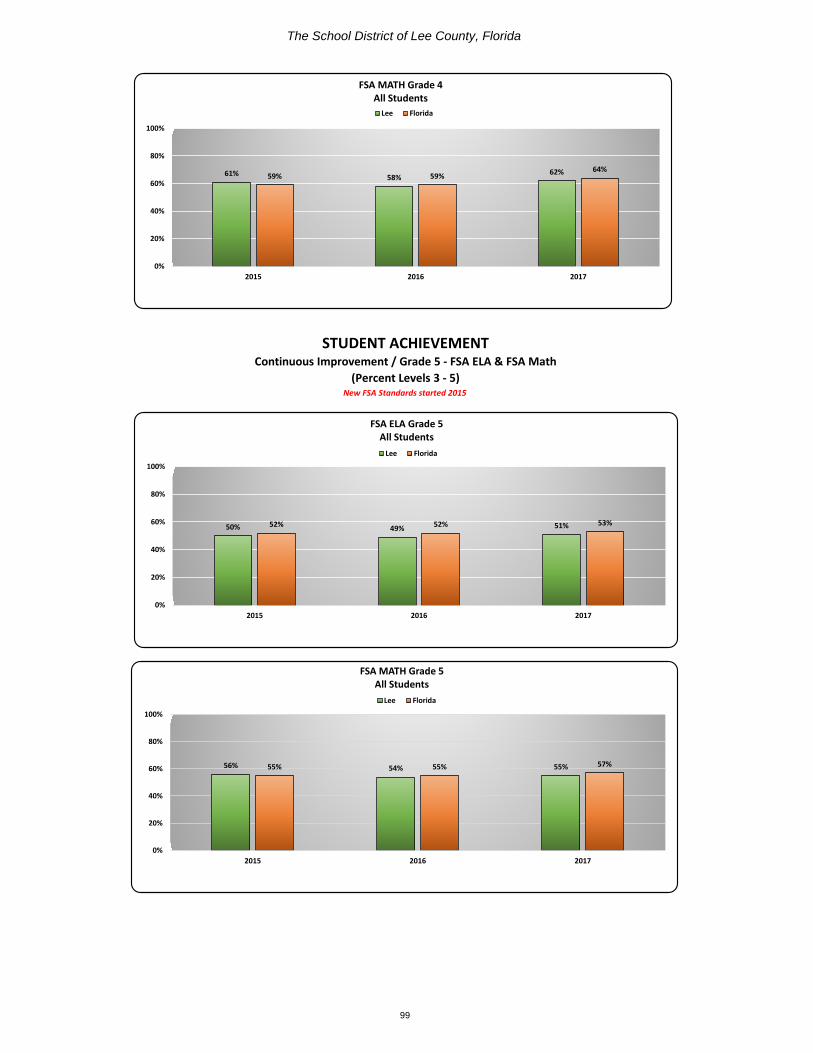
The School District of Lee County, Florida
99
New FSA Standards started 2015
STUDENT ACHIEVEMENTContinuous Improvement / Grade 5 - FSA ELA & FSA Math
(Percent Levels 3 - 5)
61% 58% 62% 59% 59%
64%
0%
20%
40%
60%
80%
100%
2015 2016 2017
FSA MATH Grade 4 All Students
Lee Florida
50% 49% 51% 52% 52% 53%
0%
20%
40%
60%
80%
100%
2015 2016 2017
FSA ELA Grade 5 All Students
Lee Florida
56% 54% 55% 55% 55% 57%
0%
20%
40%
60%
80%
100%
2015 2016 2017
FSA MATH Grade 5 All Students
Lee Florida
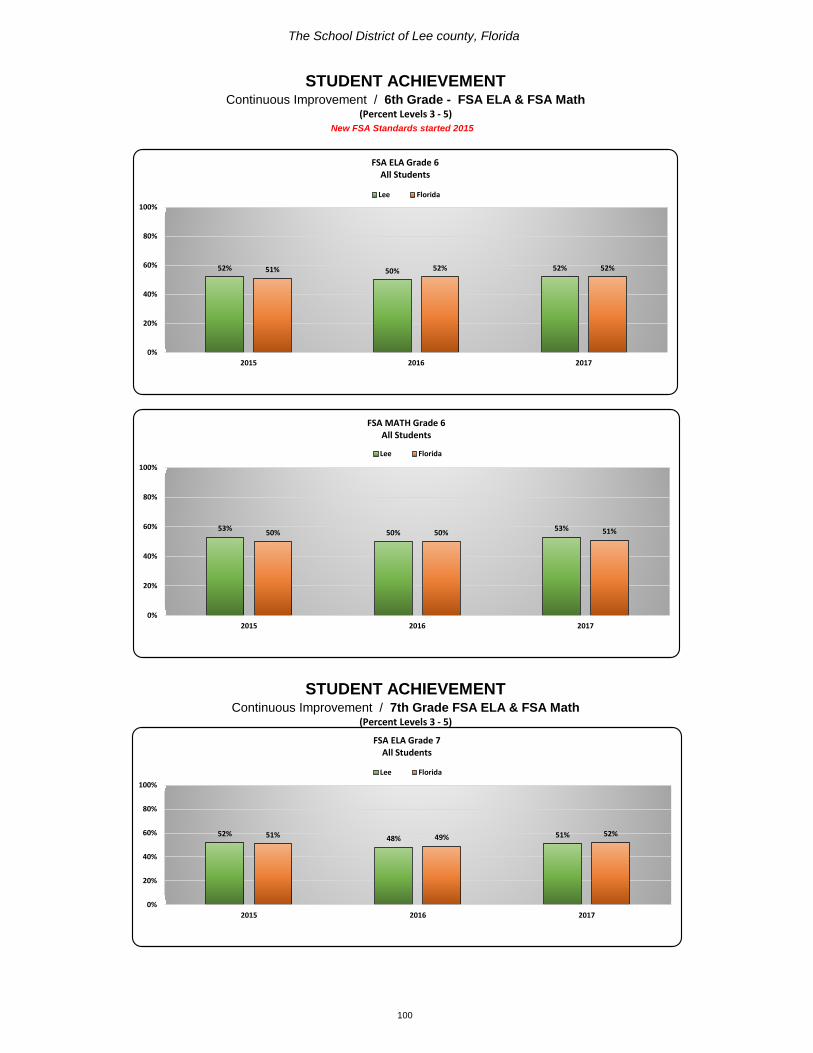
The School District of Lee county, Florida
100
STUDENT ACHIEVEMENTContinuous Improvement / 6th Grade - FSA ELA & FSA Math
(Percent Levels 3 - 5) New FSA Standards started 2015
STUDENT ACHIEVEMENTContinuous Improvement / 7th Grade FSA ELA & FSA Math
(Percent Levels 3 - 5)New FSA Standards started 2015
52% 50% 52% 51% 52% 52%
0%
20%
40%
60%
80%
100%
2015 2016 2017
FSA ELA Grade 6 All Students
Lee Florida
53% 50% 53% 50% 50% 51%
0%
20%
40%
60%
80%
100%
2015 2016 2017
FSA MATH Grade 6 All Students
Lee Florida
52% 48% 51% 51% 49% 52%
0%
20%
40%
60%
80%
100%
2015 2016 2017
FSA ELA Grade 7 All Students
Lee Florida

The School District of Lee county, Florida
101
New FSA Standards started 2015
STUDENT ACHIEVEMENTContinuous Improvement / 8th Grade FSA ELA & FSA Math
(Percent Levels 3 - 5)
57% 56% 55% 52% 52% 53%
0%
20%
40%
60%
80%
100%
2015 2016 2017
FSA MATH Grade 7 All Students
Lee Florida
59% 57% 55% 55% 57% 55%
0%
20%
40%
60%
80%
100%
2015 2016 2017
FSA ELA Grade 8 All Students
Lee Florida
43% 45% 41%
45% 48% 46%
0%
20%
40%
60%
80%
100%
2015 2016 2017
FSA Math Grade 8 All Students
Lee Florida
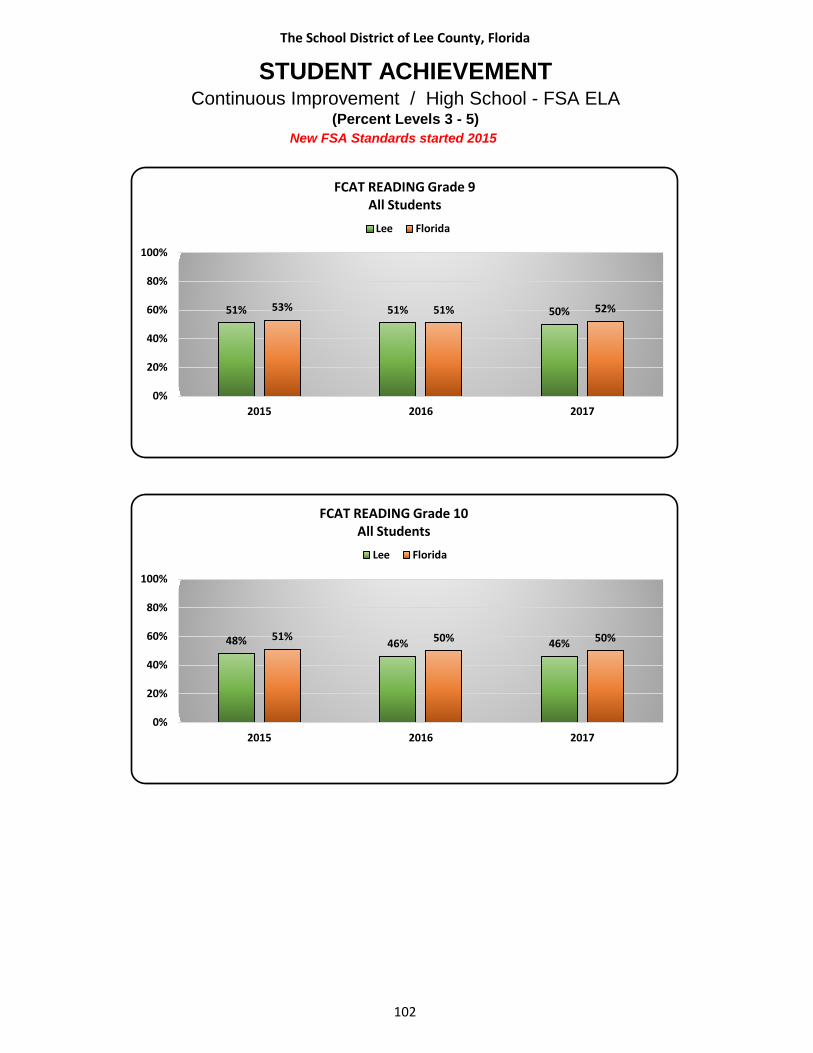
The School District of Lee County, Florida
102
STUDENT ACHIEVEMENTContinuous Improvement / High School - FSA ELA
(Percent Levels 3 - 5)New FSA Standards started 2015
48% 46% 46% 51% 50% 50%
0%
20%
40%
60%
80%
100%
2015 2016 2017
FCAT READING Grade 10 All Students
Lee Florida
51% 51% 50% 53% 51% 52%
0%
20%
40%
60%
80%
100%
2015 2016 2017
FCAT READING Grade 9 All Students
Lee Florida
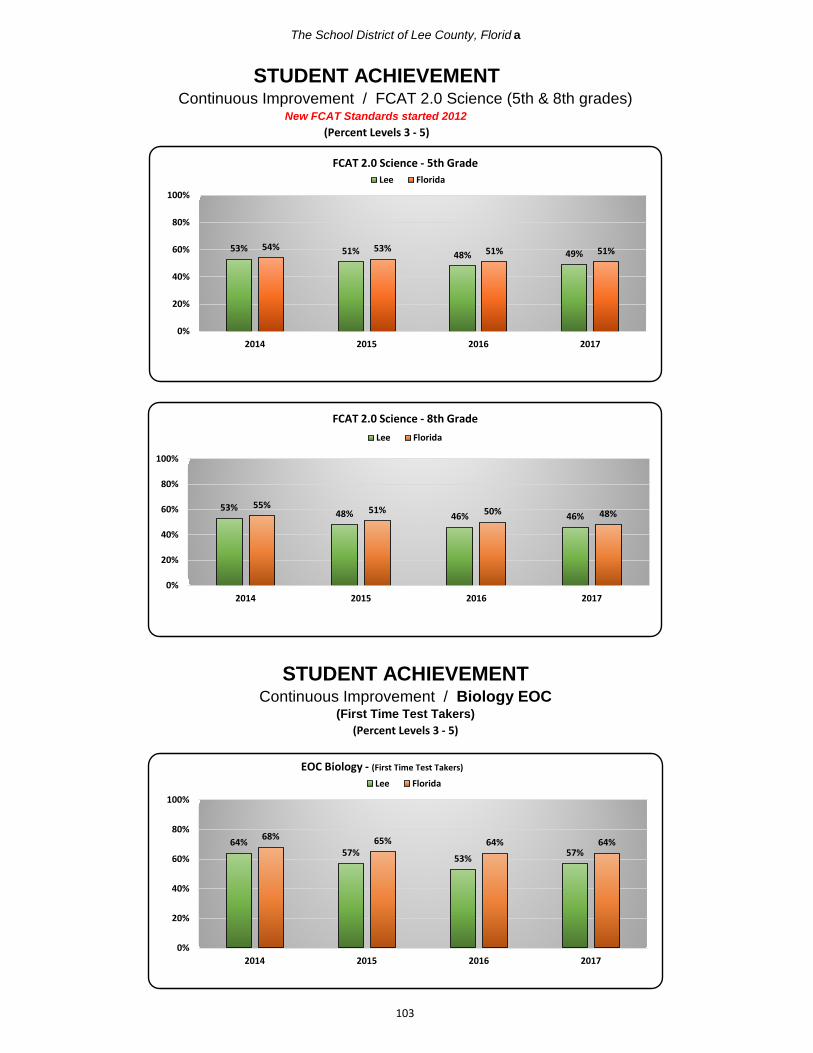
The School District of Lee County, Florid a
103
STUDENT ACHIEVEMENTContinuous Improvement / Biology EOC
(First Time Test Takers)(Percent Levels 3 - 5)
STUDENT ACHIEVEMENTContinuous Improvement / FCAT 2.0 Science (5th & 8th grades)
New FCAT Standards started 2012(Percent Levels 3 - 5)
53% 51% 48% 49% 54% 53% 51% 51%
0%
20%
40%
60%
80%
100%
2014 2015 2016 2017
FCAT 2.0 Science - 5th Grade Lee Florida
53% 48% 46% 46% 55% 51% 50% 48%
0%
20%
40%
60%
80%
100%
2014 2015 2016 2017
FCAT 2.0 Science - 8th Grade Lee Florida
64% 57% 53% 57%
68% 65% 64% 64%
0%
20%
40%
60%
80%
100%
2014 2015 2016 2017
EOC Biology - (First Time Test Takers)
Lee Florida
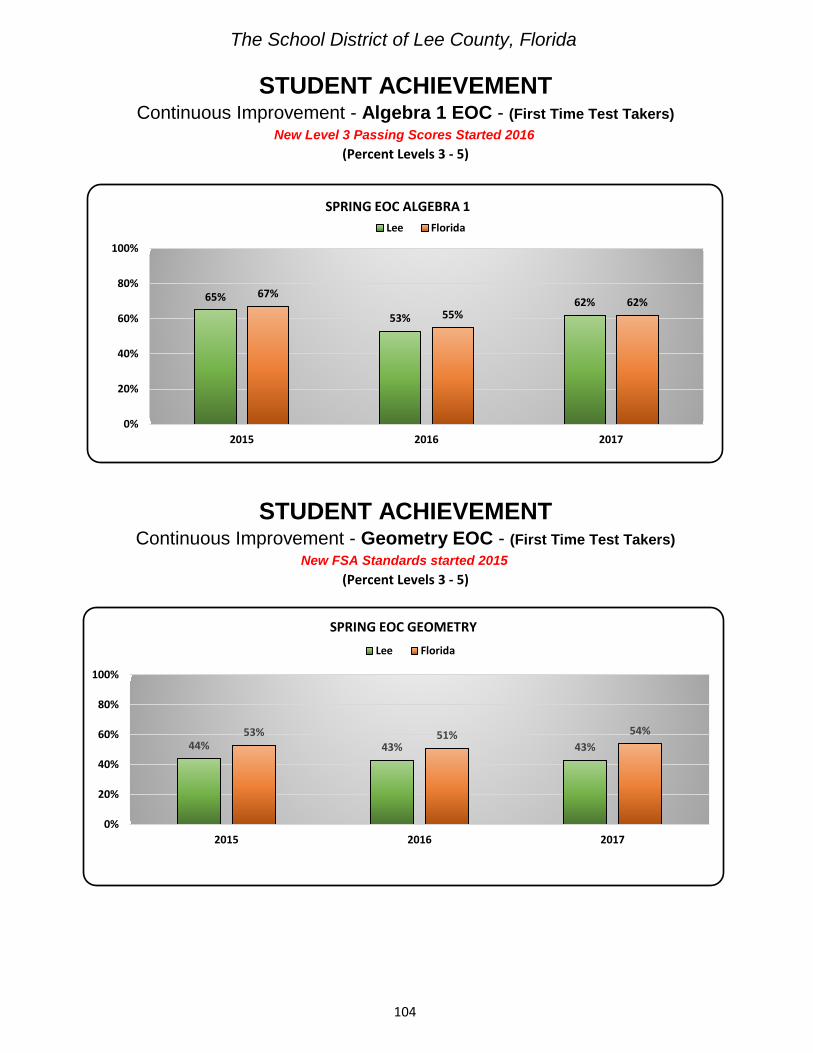
The School District of Lee County, Florida
104
STUDENT ACHIEVEMENTContinuous Improvement - Geometry EOC - (First Time Test Takers)
New FSA Standards started 2015(Percent Levels 3 - 5)
STUDENT ACHIEVEMENTContinuous Improvement - Algebra 1 EOC - (First Time Test Takers)
New Level 3 Passing Scores Started 2016(Percent Levels 3 - 5)
65%
53% 62%
67%
55% 62%
0%
20%
40%
60%
80%
100%
2015 2016 2017
SPRING EOC ALGEBRA 1 Lee Florida
44% 43% 43% 53% 51% 54%
0%
20%
40%
60%
80%
100%
2015 2016 2017
SPRING EOC GEOMETRY Lee Florida

The School District of Lee County, Florida
105
STUDENT ACHIEVEMENTContinuous Improvement / U. S. History EOC
(First Time Test Takers)(Levels 3 - 5)
STUDENT ACHIEVEMENTContinuous Improvement / Civics EOC
(First Time Test Takers)(Percent Levels 3 - 5)
2015 - Achievement Levels Set
64% 65% 64% 65% 67% 70%
0%
20%
40%
60%
80%
100%
2015 2016 2017
SPRING EOC CIVICS
Lee Florida
63% 60% 59% 60% 65% 66% 66% 67%
0%
20%
40%
60%
80%
100%
2014 2015 2016 2017
SPRING EOC U.S. HISTORY Lee Florida
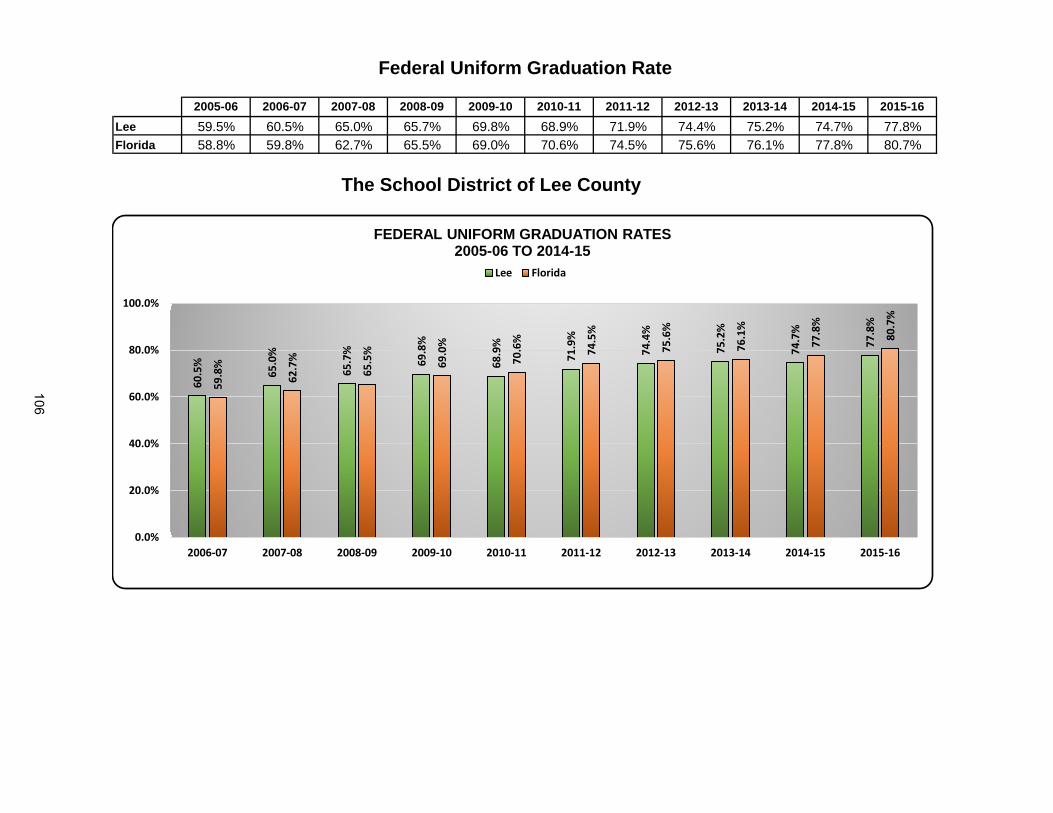
2005-06 2006-07 2007-08 2008-09 2009-10 2010-11 2011-12 2012-13 2013-14 2014-15 2015-16
Lee 59.5% 60.5% 65.0% 65.7% 69.8% 68.9% 71.9% 74.4% 75.2% 74.7% 77.8%Florida 58.8% 59.8% 62.7% 65.5% 69.0% 70.6% 74.5% 75.6% 76.1% 77.8% 80.7%
The School District of Lee County
Federal Uniform Graduation Rate
60.5
%
65.0
%
65.7
%
69.8
%
68.9
%
71.9
%
74.4
%
75.2
%
74.7
%
77.8
%
59.8
%
62.7
%
65.5
%
69.0
%
70.6
%
74.5
%
75.6
%
76.1
%
77.8
%
80.7
%
0.0%
20.0%
40.0%
60.0%
80.0%
100.0%
2006-07 2007-08 2008-09 2009-10 2010-11 2011-12 2012-13 2013-14 2014-15 2015-16
FEDERAL UNIFORM GRADUATION RATES 2005-06 TO 2014-15
Lee Florida
106
School District of Lee County 2017-2018 Final Budget
107
THIS INFORMATIONAL SECTION OF THE BUDGET CONTAINS: Community Overview
Major Employers in Southwest Florida Major Revenue
- Federal Revenue - State Revenue Sources - Description of State Distribution - Local Revenue and Beginning Fund Balance Millage Tax Analysis Millage Explanation of Rolled Back Rate Lee County School District Taxes for the 2017-2018 School Year Effects of the New Millage Rates on the Individual Taxpayer (Current and Prior Years) Property Tax Historical Millages Student Enrollment Projections (FTE and COFTE) Actual and Estimated Regular Term FTE Enrollment Charts
Capital Outlay FTE (COFTE) Forecasts
Personnel Salary Schedules Value Added to Compensation Funding Analysis Glossary Who to Contact for Budget Information Listing of Schools
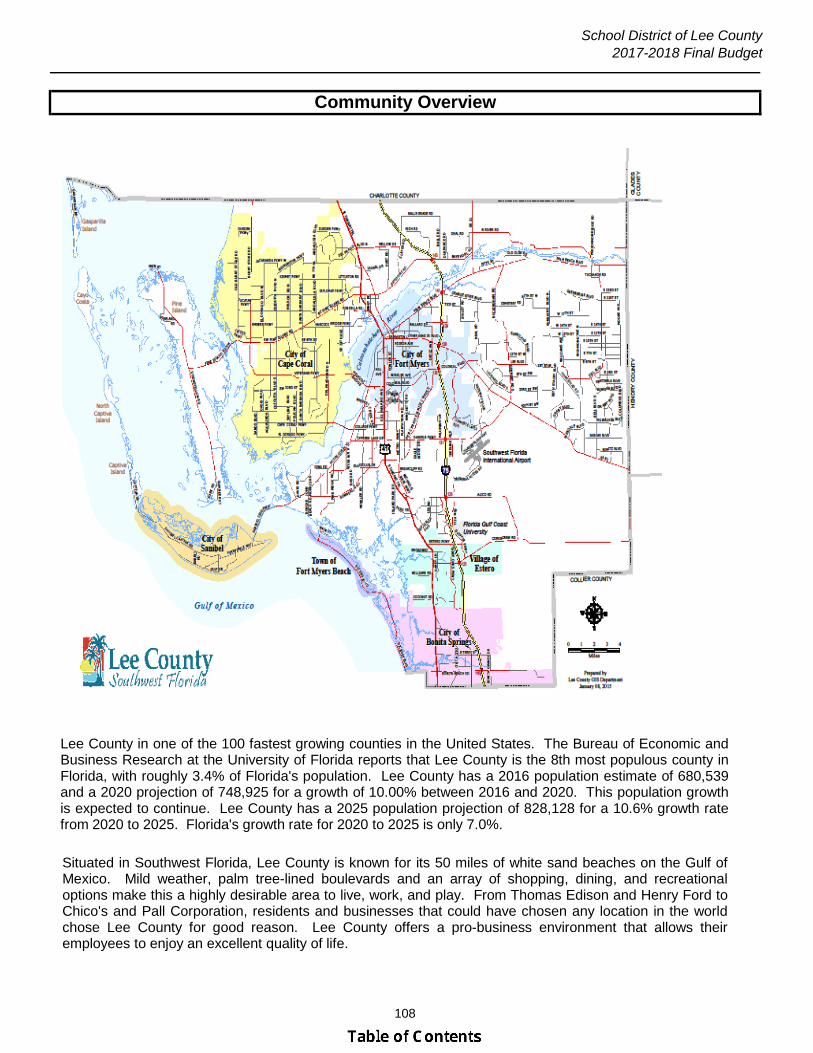
School District of Lee County2017-2018 Final Budget
108
Lee County
Community Overview
Lee County in one of the 100 fastest growing counties in the United States. The Bureau of Economic and Business Research at the University of Florida reports that Lee County is the 8th most populous county in Florida, with roughly 3.4% of Florida's population. Lee County has a 2016 population estimate of 680,539 and a 2020 projection of 748,925 for a growth of 10.00% between 2016 and 2020. This population growth is expected to continue. Lee County has a 2025 population projection of 828,128 for a 10.6% growth rate from 2020 to 2025. Florida's growth rate for 2020 to 2025 is only 7.0%.
Situated in Southwest Florida, Lee County is known for its 50 miles of white sand beaches on the Gulf of Mexico. Mild weather, palm tree-lined boulevards and an array of shopping, dining, and recreational options make this a highly desirable area to live, work, and play. From Thomas Edison and Henry Ford to Chico's and Pall Corporation, residents and businesses that could have chosen any location in the world chose Lee County for good reason. Lee County offers a pro-business environment that allows their employees to enjoy an excellent quality of life.

School District of Lee County2017-2018 Final Budget
109
Five reasons Lee County is the perfect place to launch a business:
*
*
*
*
*
Lee County Florida
2020 Population Projection based on 2016 estimate 748,925 21,438,743 2016 Median age 46.3 41.62016 Unemployment rate 4.60% 4.90%2010 Unemployment rate 12.50% 11.10%2015 Per capita personal income 44,583$ 44,429$ Educational attainment, persons 25 and older
% HS graduate or higher 87.00% 86.90%% bachelors degree or higher 26.00% 27.30%
Language spoken at home other than Englishpersons aged 5 and over 21.30% 28.10%
SELECTED DEMOGRAPHIC CHARACTERISTICS OF LEE COUNTY AND FLORIDA
Chief Executive ranks Florida as the second best state to do business in. Florida ranks 7.60 out of 10 in taxation and regulation; 6.77 out of 10 in workforce quality; and 7.95 out of 10 in living environment.
Per the Lee County Economic Development office's website, Florida businesses created 60,600 private sector jobs in the first quarter of 2017. Since December of 2010, more than 1.3M new jobs have been added in Florida. Florida's annual job growth is 3.2% while the nation's rate lags behind at 1.7%. Per Chief Executive, some of the key industries in Florida are: aviation/aerospace, corporate headquarters, financial and professional services, I.T., logistics/distribution, and manufacturing.
Per the Lee County Economic Development office, the technology industry is thriving in Florida. Per Cyberstates 2017, employment in the tech industry grew an estimated 3.1 percent in 2016. This equates to 9,600 new jobs. Florida ranks fourth in the USA for tech employment with an estimated 318,343 workers.
The Horizon Council's Lee County Business Climate Survey Report for the second quarter of 2017 reported that 63 percent of surveyed executives felt that economic conditions in Lee County were moderately or substantially better than a year ago. Local business owners are happy with the direction of the local economy.
Per the August, 2017 Southwest Florida Regional Indicators report put out by Florida Gulf Coast University, Southwest Florida's economy maintained it's solid growth, as shown by a five percent increase in tourist tax revenue from May, 2016 to May, 2017 and a three percent increase in taxable sales revenues from April, 2016 to April, 2017. There was a 26% increase in single-family building permits from June, 2016 to June, 2017.

School District of Lee County2017-2018 Final Budget
110
Rank Company Name Employment
1 Lee Health System 11,8002 Lee County School District 10,6003 Collier County Pubic Schools 7,0414 Publix Supermarkers (Lee Co.) 6,4535 NCH Healthcare System 4,0006 Wal-Mart (Lee Co.) 3,8617 Lee County Administration 3,5008 Chico's FAS, Inc. 1,6009 Lee County Sheriff's Office 1,58510 Lee County Public Safety 1,40911 Florida Gulf Coast University 1,25312 Shell Point Retirement Community 1,20213 Ritz-Carlton Naples 1,10014 Garquilo Produce 1,10015 Arthrex Inc. 1,05616 Target (Lee Co.) 1,04017 Collier County Sheriff's Office 1,02918 Comcast (Lee Co.) 99419 Hope HealthCare Services (Lee Co.) 88020 City of Fort Myers 87921 Fawcett Memorial Hospital 85422 Bayfront Health Port Charlotte 82523 U.S. Postal Service 74924 Marriott 70025 Naples Grand Beach Resort 70026 Palm Automall 67027 Winn-Dixie (Charlotte Co.) 66428 21st Century Oncology 62729 Lowe's (Lee Co.) 62630 Bayfront Health Punta Gorda 60031 Home Depot (Charlotte Co.) 60032 Bentley Village 55033 Bank of America 50034 City of Naples 48035 CenturyLink 44636 South Port Square 40037 South Seas 40038 McDonalds (Charlotte Co.) 38539 Humana Market Pointe 37340 Englewood Community Hospital 350
Per Charlotte Co. Economic Development, 2016, Collier Co. Government, 2016, Lee Co. Economic Development Alliance, 2016
2016 TOP 40 EMPLOYERS IN CHARLOTTE, COLLIER, AND LEE COUNTIES
School District of Lee County 2017-2018 Final Budget
___________________________________________________________________________________
111
MAJOR REVENUE FEDERAL REVENUE Federal revenue is generally provided for a specific activity. Primarily federal revenue is provided for exceptional student education programs, supplemental funding to serve children from low-income households and developmental disabilities. Federal grants are budgeted when the award letter is received. STATE REVENUE SOURCES Some of the state sources from which the district receives funding are:
• Sales and Use Tax • Documentary Stamp Tax • Fuel-Related Taxes and Fees • Communications Service Tax • Corporate Tax
LOTTERY In November 1986, voters approved a constitutional amendment allowing a state operated lottery. Approximately 30% of the total collected is distributed to the Educational Enhancement Trust Fund. The lottery has very limited effects on funding for K-12 education. In FY17 the lottery funds received by our district is enough to run our district for less than half a day. DESCRIPTION OF STATE DISTRIBUTION FLORIDA EDUCATION FINANCE PROGRAM (FEFP) (How the State of Florida funds operations for a School District) Legal Authorization: Part II of Chapter 1011, F.S.; Chapter 2017-70, Laws of Florida (2017-18 General Appropriations Act) Requirements for participation: Each district participating in the state appropriations for the FEFP must provide evidence of its effort to maintain an adequate school program throughout the district and must meet at least the following requirements.
4. Expend funds for salaries in accordance with a salary schedule or schedules adopted by the School Board in accordance with the provisions of the laws and rules of the State Board of Education.
5. Observe all requirements of the state Board relating to the preparation, adoption, and
execution of budgets for the district school system.
1. Maintain adequate and accurate records, including a system of internal accounts for individual schools, and file with the Department of Education, in correct and proper form, on or before the date due, each annual or periodic report that is required by State Board of Education Rules.
2. Operate all schools for a term of at least 180 actual teaching days. Upon written
application, the State Board may prescribe procedures for altering this requirement.
3. Provide written contracts for all instructional personnel and require no less than 196 days of service for all members of the instructional staff.
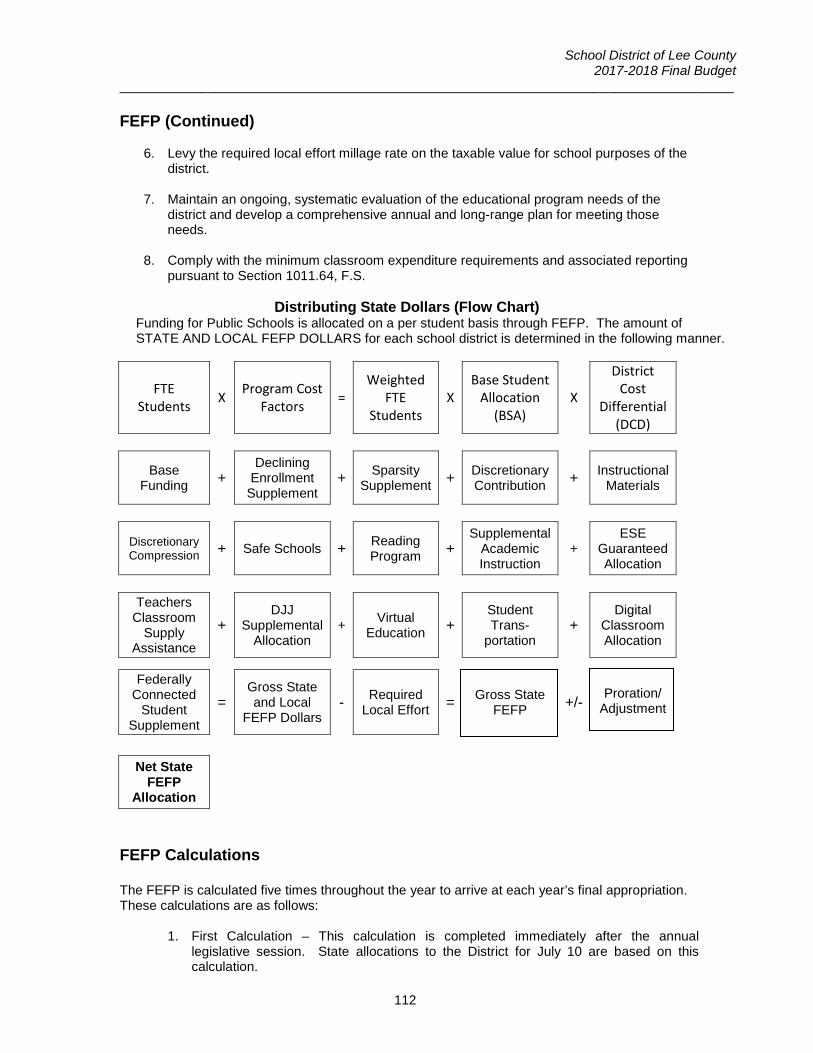
School District of Lee County 2017-2018 Final Budget
___________________________________________________________________________________
112
FEFP (Continued)
6. Levy the required local effort millage rate on the taxable value for school purposes of the
district.
7. Maintain an ongoing, systematic evaluation of the educational program needs of the district and develop a comprehensive annual and long-range plan for meeting those needs.
8. Comply with the minimum classroom expenditure requirements and associated reporting
pursuant to Section 1011.64, F.S. Distributing State Dollars (Flow Chart) Funding for Public Schools is allocated on a per student basis through FEFP. The amount of STATE AND LOCAL FEFP DOLLARS for each school district is determined in the following manner.
FTE Students X Program Cost
Factors = Weighted
FTE Students
X Base Student
Allocation (BSA)
X
District Cost
Differential (DCD)
Base
Funding + Declining
Enrollment Supplement
+ Sparsity Supplement + Discretionary
Contribution + Instructional Materials
Discretionary Compression + Safe Schools + Reading
Program + Supplemental
Academic Instruction
+ ESE
Guaranteed Allocation
Teachers
Classroom Supply
Assistance
+ DJJ
Supplemental Allocation
+ Virtual
Education + Student Trans-
portation +
Digital Classroom Allocation
Federally Connected
Student Supplement
= Gross State and Local
FEFP Dollars - Required
Local Effort = Gross State FEFP +/-
Proration/
Adjustment
Net State FEFP
Allocation
FEFP Calculations The FEFP is calculated five times throughout the year to arrive at each year’s final appropriation. These calculations are as follows:
1. First Calculation – This calculation is completed immediately after the annual
legislative session. State allocations to the District for July 10 are based on this calculation.

School District of Lee County 2017-2018 Final Budget
___________________________________________________________________________________
113
FEFP Calculations (Continued)
2. Second Calculation – This calculation is made upon receipt of the certified tax roll
from the Department of Revenue as provided for in Section 1011.62(4), F.S. State allocations to the District for July 26 through December 10 are based on this calculation.
3. Third Calculation - This calculation is made upon receipt of districts’ October survey
FTE reported in November. State allocations to the District for December 26 through April 10 are based on this calculation.
4. Fourth Calculation – This calculation is made upon receipt of districts’ February FTE
and estimated June FTE reported in March. State allocations to the District for April 26 through June 26 are based on this calculation.
5. Final Calculation – This calculation is made upon receipt of districts’ June FTE
reported in July. Prior year adjustments in the following fiscal year are made, based on a comparison of this Final Calculation, to the Fourth Calculation.
The School District of Lee County uses the first and second calculations to estimate revenue for the fiscal year. The third and fourth calculations are used to adjust the current year budget. The final calculation is used to adjust the revenue in the next fiscal year. LOCAL REVENUE AND BEGINNING FUND BALANCE The School District of Lee County receives local revenue from:
• Ad Valorem property taxes • Revenues paid to the district for tuition and student charges • Investment earnings • Any other lawful revenue-raising activities
The major local revenue received is property tax. Local property tax revenues had previously been calculated at a minimum of 95 percent. In 2011, the legislature increased the mandated collection rate to base the budget on 96 percent. Assessed taxable property value times millage rate times 96 percent collection rate is the estimated local tax revenue. Other local funding is estimated based on past history of collections and services provided. Any money not expended in a given budget year is allowed to be carried forward to the subsequent year as a beginning balance.
MILLAGE TAX ANALYSIS MILLAGE Sixty percent of the new funding for the School District of Lee County comes from local sources, primarily the local ad valorem property tax. The amount of revenue available to a school district is, however, largely determined by the state legislature. Under the Florida Education Finance Program (FEFP) (explained in greater detail on the previous page), the State determines the basic funding for a school district on a formula basis. It then requires the district to levy millages to pay the local share of the funding. School districts are given the option of levying additional "discretionary" local millage, with separate state limits set for operating and capital purposes. As a practical matter, the "discretionary" millage is essential for school district operations, and is generally levied at the state authorized levels. With the exception of PECO funds in FY18 all other state sources for capital purposes have been eliminated. Currently the majority source for capital comes from property
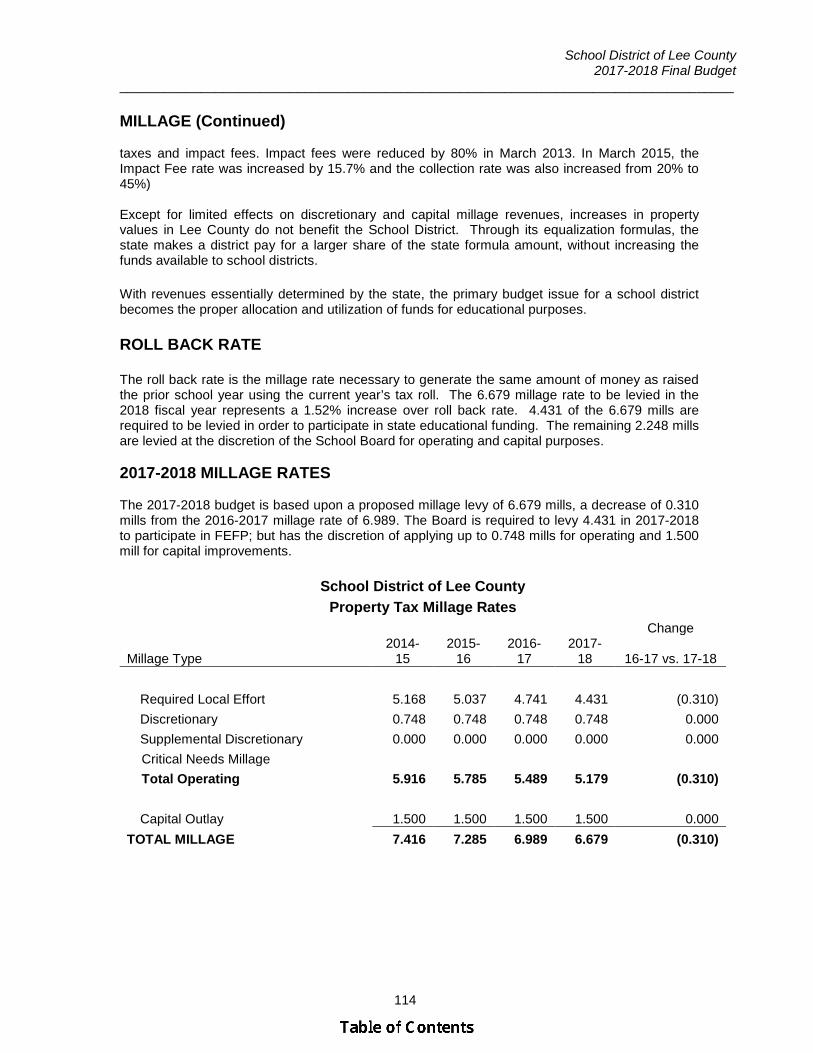
School District of Lee County 2017-2018 Final Budget
___________________________________________________________________________________
114
MILLAGE (Continued) taxes and impact fees. Impact fees were reduced by 80% in March 2013. In March 2015, the Impact Fee rate was increased by 15.7% and the collection rate was also increased from 20% to 45%) Except for limited effects on discretionary and capital millage revenues, increases in property values in Lee County do not benefit the School District. Through its equalization formulas, the state makes a district pay for a larger share of the state formula amount, without increasing the funds available to school districts. With revenues essentially determined by the state, the primary budget issue for a school district becomes the proper allocation and utilization of funds for educational purposes. ROLL BACK RATE The roll back rate is the millage rate necessary to generate the same amount of money as raised the prior school year using the current year’s tax roll. The 6.679 millage rate to be levied in the 2018 fiscal year represents a 1.52% increase over roll back rate. 4.431 of the 6.679 mills are required to be levied in order to participate in state educational funding. The remaining 2.248 mills are levied at the discretion of the School Board for operating and capital purposes.
2017-2018 MILLAGE RATES
The 2017-2018 budget is based upon a proposed millage levy of 6.679 mills, a decrease of 0.310 mills from the 2016-2017 millage rate of 6.989. The Board is required to levy 4.431 in 2017-2018 to participate in FEFP; but has the discretion of applying up to 0.748 mills for operating and 1.500 mill for capital improvements.
School District of Lee County
Property Tax Millage Rates Change
Millage Type 2014-
15 2015-
16 2016-
17 2017-
18 16-17 vs. 17-18
Required Local Effort 5.168 5.037 4.741 4.431 (0.310)
Discretionary 0.748 0.748 0.748 0.748 0.000
Supplemental Discretionary 0.000 0.000 0.000 0.000 0.000
Critical Needs Millage
Total Operating 5.916 5.785 5.489 5.179 (0.310)
Capital Outlay 1.500 1.500 1.500 1.500 0.000
TOTAL MILLAGE 7.416 7.285 6.989 6.679 (0.310)
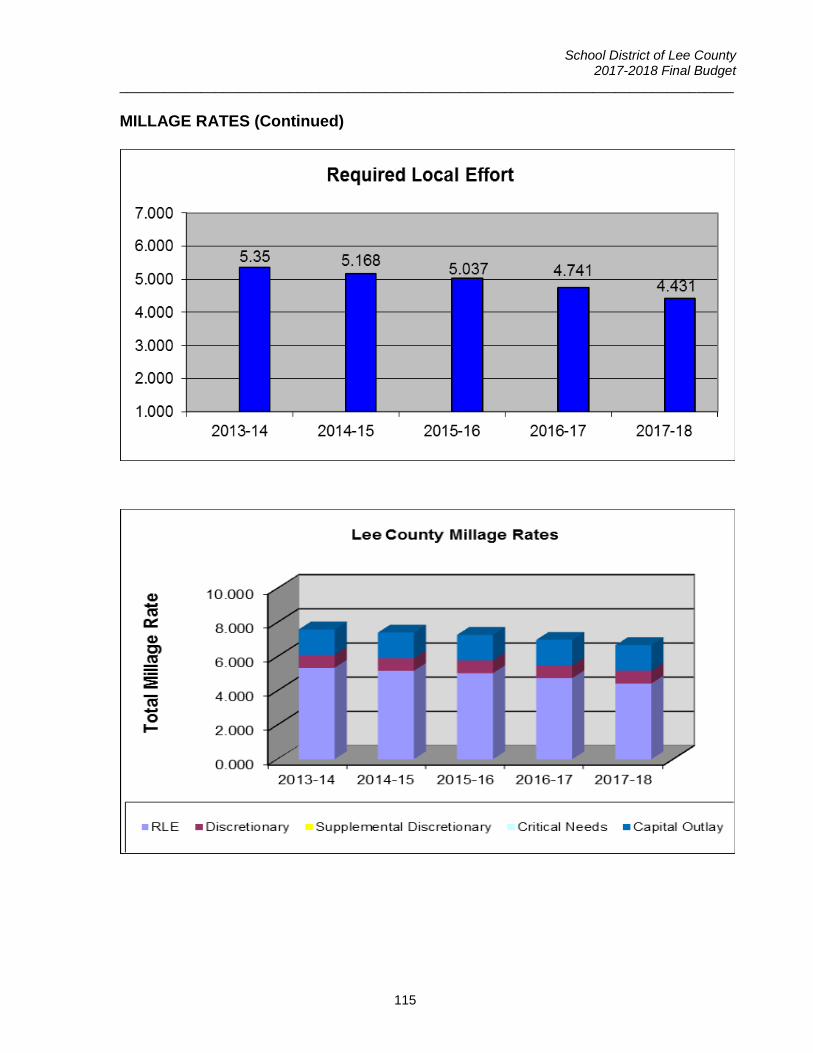
School District of Lee County 2017-2018 Final Budget
___________________________________________________________________________________
115
MILLAGE RATES (Continued)

School District of Lee County 2017-2018 Final Budget
___________________________________________________________________________________
116
LEE COUNTY SCHOOL TAX FOR 2017-2018 SCHOOL YEAR Homeowners whose taxable value increases by more than 2% such as those who are eligible for the homestead exemption and the Save Our Homes amendment that limits property valuation to a maximum 3% increase will see a slight decrease in their property taxes in the 2018 year, as illustrated below. Those whose values increased by up to 8.11% will see a tax increase.
on the Individual Taxpayer (Current and Prior Year) 3% Typical Valuation Increase
With 3% Valuation Increase
2016 Value Homestead
2016-17 Taxable Value
Tax at 6.989 Mills 2017 Value Homestead
2017-18 Taxable Value
Tax at 6.679 Mills
Tax Increase
(Decrease) A B C D A B C D E
$100,000 $(25,000) $75,000 $524.18 $103,000 $(25,000) $78,000 $520.96 ($3.22) $150,000 $(25,000) $125,000 $873.63 $154,500 $(25,000) $129,500 $864.93 ($8.70) $200,000 $(25,000) $175,000 $1,223.08 $206,000 $(25,000) $181,000 $1,208.90 ($14.18) $250,000 $(25,000) $225,000 $1,572.53 $257,500 $(25,000) $232,500 $1,552.87 ($19.66)
on the Individual Taxpayer (Current and Prior Year) 8.11% Typical Valuation Increase
With 8.11% Valuation Increase
2016 Value Homestead
2016-17 Taxable Value
Tax at 6.989 Mills 2017 Value Homestead
2017-18 Taxable Value
Tax at 6.679 Mills
Tax Increase
(Decrease) A B C D A B C D E
$100,000 $(25,000) $75,000 $524.18 $108,110 $(25,000) $83,110 $555.09 $30.92 $150,000 $(25,000) $125,000 $873.63 $162,165 $(25,000) $137,165 $916.13 $42.51 $200,000 $(25,000) $175,000 $1,223.08 $216,220 $(25,000) $191,220 $1,277.16 $54.09 $250,000 $(25,000) $225,000 $1,572.53 $270,275 $(25,000) $245,275 $1,638.19 $65.67

School District of Lee County 2017-2018 Final Budget
___________________________________________________________________________________
117
PROPERTY TAX ROLL The total property assessment for Lee County has increased by 8.11% between 2017 ($75.82 Billion) and 2018 ($81.97 Billion).
2014-2015 2015-2016 2016-2017
% Increase
(Decrease) from 2015-
16 2017-2018
% Increase
(Decrease) from 2016-
17 Property Value $64,429,903,676 $69,129,597,816 $75,824,368,848 9.68% $81,973,613,642 8.11%
Source: Lee County Property Appraiser
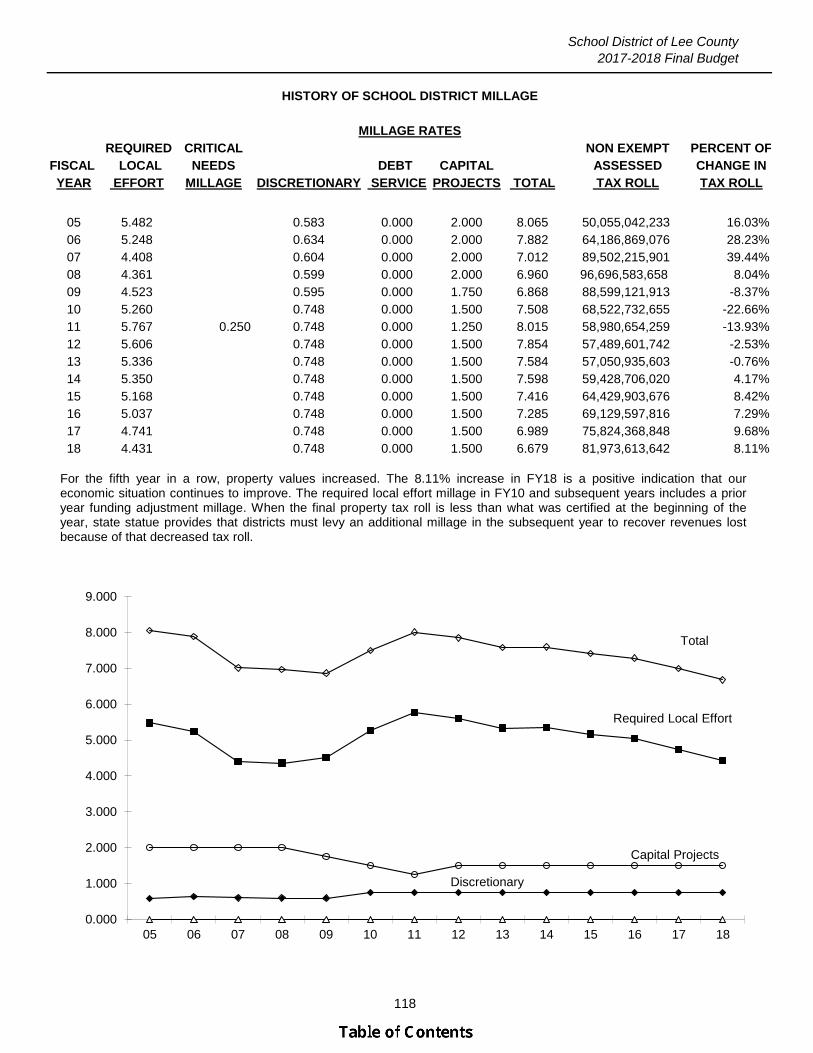
School District of Lee County2017-2018 Final Budget
118
REQUIRED CRITICAL NON EXEMPT PERCENT OFFISCAL LOCAL NEEDS DEBT CAPITAL ASSESSED CHANGE INYEAR EFFORT MILLAGE DISCRETIONARY SERVICE PROJECTS TOTAL TAX ROLL TAX ROLL
05 5.482 0.583 0.000 2.000 8.065 50,055,042,233 16.03%06 5.248 0.634 0.000 2.000 7.882 64,186,869,076 28.23%07 4.408 0.604 0.000 2.000 7.012 89,502,215,901 39.44%08 4.361 0.599 0.000 2.000 6.960 96,696,583,658 8.04%09 4.523 0.595 0.000 1.750 6.868 88,599,121,913 -8.37%10 5.260 0.748 0.000 1.500 7.508 68,522,732,655 -22.66%11 5.767 0.250 0.748 0.000 1.250 8.015 58,980,654,259 -13.93%12 5.606 0.748 0.000 1.500 7.854 57,489,601,742 -2.53%13 5.336 0.748 0.000 1.500 7.584 57,050,935,603 -0.76%14 5.350 0.748 0.000 1.500 7.598 59,428,706,020 4.17%15 5.168 0.748 0.000 1.500 7.416 64,429,903,676 8.42%16 5.037 0.748 0.000 1.500 7.285 69,129,597,816 7.29%17 4.741 0.748 0.000 1.500 6.989 75,824,368,848 9.68%18 4.431 0.748 0.000 1.500 6.679 81,973,613,642 8.11%
HISTORY OF SCHOOL DISTRICT MILLAGE
MILLAGE RATES
0.000
1.000
2.000
3.000
4.000
5.000
6.000
7.000
8.000
9.000
05 06 07 08 09 10 11 12 13 14 15 16 17 18
Total
Required Local Effort
Capital Projects
Discretionary
For the fifth year in a row, property values increased. The 8.11% increase in FY18 is a positive indication that our economic situation continues to improve. The required local effort millage in FY10 and subsequent years includes a prior year funding adjustment millage. When the final property tax roll is less than what was certified at the beginning of the year, state statue provides that districts must levy an additional millage in the subsequent year to recover revenues lost because of that decreased tax roll.

School District of Lee County 2017-2018 Final Budget
_____________________________________________________________________________
119
STUDENT ENROLLMENT PROJECTIONS Much of the school district’s funding is based on student enrollment projections, and the calculation of full time equivalent (FTE) students in each year. The District has several departments that work together to project FTE each year. The departments of Planning, Growth, and Capacity, Budget, and ESE, as well as representatives from departments that represent ESOL and vocational issues meet periodically to analyze student growth trends, housing and local economy trends to determine projected future student growth for the district. This information, along with information received from the Florida Department of Education FTE forecasting system, is used to create annual FTE projections. Calculation of capital outlay FTE (COFTE) is also an important step in the planning of district resources, as this COFTE plays a major role in determining where and when new schools will be built in our district. COFTE is an estimate of the amount of FTE that will be educated in school district owned facilities. Charter school students are not included in COFTE, as they are not educated in district owned facilities. COFTE is projected by the state, and is used by the district to project the number and location of schools that will be needed to service students. When Districts received capital outlay dollars from the state they used COFTE projections in their allocations as a basis for determining the amount of capital funding to allocate to districts. The COFTE projection is also used in the Educational Plant Survey, a document that justifies the number of schools to be built in the district in a five year time frame. That survey must be accepted and approved by the state before schools can be built.

School District of Lee County2017-2018 Final Budget
__________________________________________________________________________________________
120
Projected2013-14 2014-15 2015-16 2016-17 2017-18
Basic Ed PK-3 21,417.51 21,739.91 21,981.55 21,594.31 21,204.47Basic Ed 4-8 24,400.11 24,846.93 25,180.06 25,732.30 26,215.04Basic Ed 9-12 17,117.89 17,770.56 18,331.01 18,660.15 19,020.68ESOL 3,868.83 4,234.60 4,648.94 5,438.42 6,049.03 Exceptional Ed 17,404.73 17,664.62 17,758.73 17,688.92 18,083.69 Vocational Ed 1,964.65 2,077.88 2,169.10 2,037.90 2,146.67
TOTAL 86,173.72 88,334.50 90,069.39 91,152.00 92,719.58
All numbers shown are FTE, not a student count.
School Percentage AnnualYear Change Change
2013-14 1.9% 1,597.5
2014-15 2.5% 2,160.8
2015-16 2.0% 1,734.9
2016-17 1.2% 1,082.6
2017-18 (Projected) 1.7% 1,567.6
PROFILE OF ENROLLMENTFULL-TIME EQUIVALENT STUDENTS
Growth of FTE

121
STUDENT ENROLLMENTPre-Kindergarten - Grade 12
2002 though 2017 (ACTUAL); 2018 through 2020 (PROJECTED)
SCHOOL DISTRICT OF LEE COUNTY
Growth in enrollment is expected to continue over the next 3 years for Lee County schools based on District projections. These enrollment numbers include non-FTE Pre-K students.
40,000
45,000
50,000
55,000
60,000
65,000
70,000
75,000
80,000
85,000
90,000
95,000
100,000
105,000
110,000
60,450
2017-2018 93,584

SCHOOL DISTRICT OF LEE COUNTY ENROLLMENT HISTORY AND PROJECTION
2017-2018
GRADE
NON-FTE PK
FTE PK
TOTAL PK
K
1
2
3
4
5
12
2 SUB TOTAL
6
7
8
SUB TOTAL
9
10
11
12
SUB TOTAL
TOTAL
District
Actual Actual Actual Actual Actual Actual Actual Actual Actual Actual Actual Actual Actual Actual Actual Actual Forecast
01/02 02/03 03/04 04/05 05/06 06/07 07/08 08/09 09/10 10/11 11/12 12/13 13/14 14/15 15/16 16/17 17/18
1,005 947 670 645 793 757 887 968 1,000 1,080 1,062 1,082 1,108 1,068 1,129 1,129 864
638 631 686 851 858 849 791 722 937 986 949 780 706 780 857 876 668
1,643 1,578 1,356 1,496 1,651 1,606 1,678 1,690 1,937 2,066 2,011 1,862 1,814 1,848 1,986 2,005 1,532
4,371 4,741 5,055 5,721 6,360 6,854 6,756 6,394 6,248 6,448 6,625 7,098 6,990 6,596 6,613 6,665 6,666
4,568 4,619 5,106 5,512 5,917 6,531 6,656 6,420 6,361 6,205 6,459 6,669 7,096 7,139 6,846 6,755 6,914
4,634 4,671 4,908 5,450 5,832 6,050 6,327 6,384 6,347 6,379 6,294 6,472 6,646 7,235 7,332 6,919 6,941
4,601 4,822 5,515 5,608 6,104 6,312 6,294 6,420 6,535 6,575 6,649 6,544 6,890 7,118 7,673 7,777 7,571
4,791 4,733 4,563 5,313 5,535 6,043 5,920 5,877 6,204 6,356 6,329 6,466 6,336 6,609 6,893 7,259 7,487
4,725 5,021 5,016 4,943 5,570 5,747 6,080 5,820 5,994 6,255 6,474 6,465 6,589 6,532 6,757 6,959 7,450
29,333 30,185 31,519 34,043 36,969 39,143 39,711 39,005 39,626 40,284 40,841 41,576 42,361 43,077 44,100 44,339 44,561
5,050 5,032 5,370 5,553 5,440 6,029 5,868 6,115 5,954 6,064 6,306 6,546 6,475 6,681 6,621 6,805 7,078
4,968 5,165 5,242 5,629 5,851 5,681 5,953 5,690 6,067 5,970 6,130 6,385 6,640 6,618 6,866 6,706 6,967
4,747 4,995 5,340 5,497 5,760 5,780 5,489 5,701 5,729 6,122 6,063 6,272 6,533 6,864 6,822 7,026 6,946
14,765 15,192 15,952 16,679 17,051 17,490 17,310 17,506 17,750 18,156 18,499 19,203 19,648 20,163 20,309 20,537 20,991
5,454 5,594 5,949 6,483 6,621 6,920 6,011 5,673 6,001 5,826 6,427 6,160 6,411 6,768 7,024 6,885 7,123
4,037 4,433 4,818 5,079 5,621 5,591 5,918 5,824 5,636 5,979 5,873 6,389 6,233 6,468 6,897 7,119 6,876
3,578 3,770 4,120 4,495 4,801 5,086 5,424 5,520 5,671 5,435 5,932 5,804 6,282 6,170 6,460 6,841 7,012
3,283 3,626 3,756 4,071 4,282 4,502 5,072 5,447 5,799 6,095 6,087 6,455 6,321 6,707 6,568 6,944 7,021
16,352 17,423 18,643 20,128 21,325 22,099 22,425 22,464 23,107 23,335 24,319 24,808 25,247 26,113 26,949 27,789 28,032
60,450 62,800 66,114 70,850 75,345 78,732 79,446 78,975 80,483 81,775 83,659 85,587 87,256 89,353 91,358 92,665 93,584
The actual enrollment numbers represent a student count at a time certain (the 4th 20-day cycle).

Actual Actual Actual Actual Projected Projected Projected Projected Projected Projected Projected Projected Projected Projected Projected2013-14 2014-15 2015-16 2016-17 2017-18 2018-19 2019-20 2020-21 2021-22 2022-23 2023-24 2024-25 2025-26 2026-27 2027-28
Births* 7,290 6,629 6,360 6,364 6,310 6,418 6,314 6,702 6,784 6,925 7,142 7,362 7,585 7,798 7,987Grade PreK 654.34 657.67 673.57 697.89 698.25 713.82 739.53 751.70 771.26 795.16 819.39 843.24 865.22 885.49 905.33 Grade K 5,984.91 5,582.91 5,611.09 5,715.85 5,688.15 5,779.91 5,681.26 6,002.21 6,072.34 6,184.86 6,362.21 6,544.22 6,728.89 6,903.08 7,055.91 Grade 1 6,048.72 6,078.93 5,802.21 5,770.54 5,902.26 5,877.40 5,963.76 5,864.64 6,177.00 6,251.59 6,362.66 6,538.18 6,718.17 6,902.58 7,075.94 Grade 2 5,661.86 6,210.47 6,265.61 5,936.70 5,888.79 6,021.60 5,992.86 6,073.54 5,968.81 6,274.24 6,347.13 6,452.56 6,624.26 6,800.20 6,979.30 Grade 3 5,910.95 6,125.30 6,609.87 6,726.48 6,436.67 6,366.73 6,492.96 6,470.51 6,547.51 6,446.74 6,742.34 6,834.21 6,944.11 7,121.25 7,307.58 Grade 4 5,425.46 5,686.93 5,907.69 6,264.34 6,409.19 6,131.82 6,063.59 6,180.84 6,159.14 6,229.98 6,133.35 6,412.06 6,496.82 6,599.84 6,766.23 Grade 5 5,632.33 5,595.73 5,773.77 6,027.53 6,401.03 6,548.04 6,262.28 6,190.22 6,306.38 6,281.75 6,351.51 6,251.52 6,531.97 6,615.69 6,717.92 Grade 6 5,566.11 5,647.42 5,594.60 5,829.52 6,047.60 6,421.23 6,564.67 6,276.21 6,199.39 6,312.20 6,283.77 6,348.85 6,246.07 6,521.55 6,601.17 Grade 7 5,696.46 5,634.03 5,792.84 5,736.93 5,968.73 6,184.19 6,559.99 6,701.49 6,405.21 6,323.01 6,432.93 6,401.03 6,463.23 6,354.80 6,629.59 Grade 8 5,558.67 5,777.90 5,757.76 5,917.49 5,856.21 6,079.96 6,293.92 6,666.90 6,807.25 6,506.70 6,416.46 6,520.21 6,485.51 6,542.26 6,430.82 Grade 9 5,762.52 6,162.34 6,315.69 6,286.05 6,511.40 6,452.61 6,695.50 6,926.83 7,332.76 7,481.18 7,149.26 7,046.80 7,154.71 7,113.44 7,170.40 Grade 10 5,515.64 5,737.67 6,139.65 6,280.83 6,260.18 6,493.62 6,427.61 6,661.34 6,883.15 7,277.82 7,416.55 7,079.39 6,969.83 7,068.39 7,019.42 Grade 11 5,367.28 5,335.45 5,400.13 5,765.22 5,932.39 5,919.59 6,136.53 6,072.09 6,290.28 6,498.80 6,871.45 7,001.14 6,678.95 6,572.86 6,664.40 Grade 12 4,771.60 5,070.76 4,630.25 4,535.18 5,064.05 5,249.22 5,243.49 5,441.99 5,390.66 5,591.72 5,785.20 6,127.28 6,252.17 5,969.18 5,880.49 PreK-Grade 12 73,556.85 75,303.51 76,274.73 77,490.55 79,064.90 80,239.74 81,117.95 82,280.51 83,311.14 84,455.75 85,474.21 86,400.69 87,159.91 87,970.61 89,204.50
12
3
Grade Level SummaryPreK-Grade 5 35,318.57 35,937.94 36,643.81 37,139.33 37,424.34 37,439.32 37,196.24 37,533.66 38,002.44 38,464.32 39,118.59 39,875.99 40,909.44 41,828.13 42,808.21 Grades 6-8 16,821.24 17,059.35 17,145.20 17,483.94 17,872.54 18,685.38 19,418.58 19,644.60 19,411.85 19,141.91 19,133.16 19,270.09 19,194.81 19,418.61 19,661.58 Grades 9-12 21,417.04 22,306.22 22,485.72 22,867.28 23,768.02 24,115.04 24,503.13 25,102.25 25,896.85 26,849.52 27,222.46 27,254.61 27,055.66 26,723.87 26,734.71 PreK-Grade 12 73,556.85 75,303.51 76,274.73 77,490.55 79,064.90 80,239.74 81,117.95 82,280.51 83,311.14 84,455.75 85,474.21 86,400.69 87,159.91 87,970.61 89,204.50
Growth Summary **PreK-Grade 5 285.01 14.98 - 94.34 468.78 461.88 654.27 757.40 1,033.45 918.69 980.08 Grades 6-8 388.60 812.84 733.20 226.02 - - - - - 148.52 242.97 Grades 9-12 900.74 347.02 388.09 599.12 794.60 952.67 372.94 32.15 - - - PreK-Grade 12 1,574.35 1,174.84 1,121.29 919.48 1,263.38 1,414.55 1,027.21 789.55 1,033.45 1,067.21 1,223.05
* Birth data are lagged for kindergarten entrance. Births shown for 2014-15 are the birth data for the students who will enter kindergarten in 2014-15.
Students eligible to enter kindergarten in 2014-15 were born from September 1, 2008, through August 31, 2009.
** Growth is the difference between the current year and the highest of the three previous years.Negative differences are shown as -.
Lee
2017-18 to 2027-28 Capital Outlay FTE Forecast
School District of Lee County 2017-2018 Final Budget
_____________________________________________________________________________
124
PERSONNEL INFORMATION The following pages contain the salary schedules for all school district employees that are in effect at this time. At the time of print the District has not begun negotiations with its bargaining groups for 2017-2018. Teachers and other instructional staff are part of the TALC union (Teachers Association of Lee County). Under the Student Success Act, Lee County was required to implement a Grandfathered Salary Schedule for school employees hired before July 1, 2014 and is partially based upon an employees’ performance and includes differentiated pay based upon district-determined factors. For employees hired on or after July 1, 2014, and employees currently on an annual or probationary contract as of July 1, 2014, the District is required to establish a Performance Salary Schedule that approves annual salary adjustments for instructional personnel based upon performance determined under s. 1012.34, F.S. Support personnel are part of the SPALC union (Support Personnel Association of Lee County). Most jobs in the SPALC union are assigned a pay grade, and personnel are paid on the pay grade that is assigned to the particular job. At initial hire steps are granted to an employee according to years of experience. An individual is paid the hourly rate that corresponds to the applicable combination of pay grade and step. Steps are negotiated, and an individual moves up a step or the step is increased per a salary increase agreement. In 2017 the District and SPALC agreed to move forward with a Fixed Rate Salary Schedule. The first phase included 30 job classifications. The Market Rates will be reviewed on an annual basis and new job classifications will be added as the budget allows. New Hires on the Fixed Rate Salary Schedule are not eligible for the experience credit. The Supervisory, Technical, and Confidential salary schedule covers those employees who are not administrators, and not in the TALC or SPALC bargaining units. Each job is assigned a pay grade, and personnel are paid on the pay grade that is assigned to the particular job. At initial hire steps are granted to an employee according to years of experience. An individual is paid the hourly rate that corresponds to the applicable combination of pay grade and step. An individual moves up a step or the step is increased per a salary increase agreement. In 2017 the District initiated a Fixed Rate Salary Schedule. The first phase included 9 job classifications. The Market Rates will be reviewed on an annual basis and new job classifications will be added as the budget allows. New Hires on the Fixed Rate Salary Schedule are not eligible for the experience credit. The Administrative salary schedule is organized by pay grade and step as well. The salary schedule holds the daily rate of pay for each pay grade and step. Administrator salary increases are determined after all other salary schedules are negotiated and approved by the Board.

Creditable Years of
ExperienceCurrent Minimum Salary
4 - 9 Years 41,573.01$
10 - 12 Years 44,360.37$
13 - 15 Years 46,083.04$
16 - 18 Years 46,282.40$
19 - 21 Years 51,320.96$
22 - 25 Years 53,428.69$
26 - 27+ Years 56,820.32$
2016-17 Instructional Grandfathered Salary
Table
Updated 2/22/2017
Salaries listed are base salaries and do not account for additional
components of pay, such as salary supplements.
125
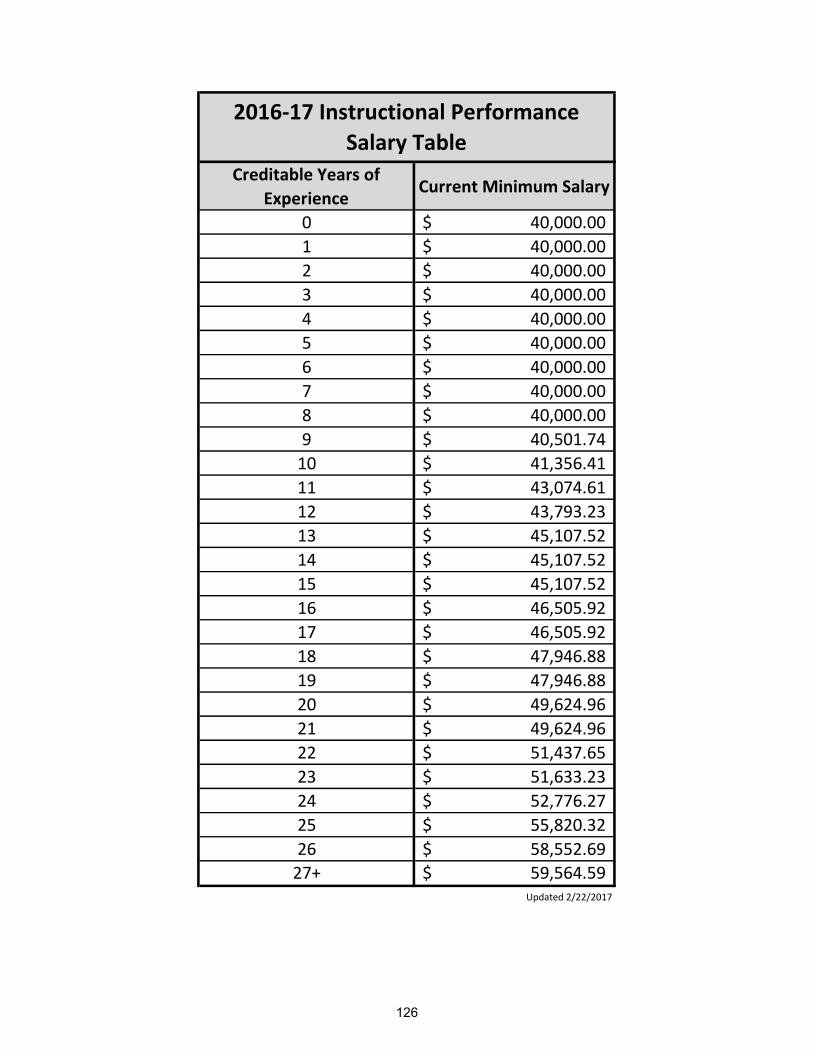
Creditable Years of
ExperienceCurrent Minimum Salary
0 40,000.00$
1 40,000.00$
2 40,000.00$
3 40,000.00$
4 40,000.00$
5 40,000.00$
6 40,000.00$
7 40,000.00$
8 40,000.00$
9 40,501.74$
10 41,356.41$
11 43,074.61$
12 43,793.23$
13 45,107.52$
14 45,107.52$
15 45,107.52$
16 46,505.92$
17 46,505.92$
18 47,946.88$
19 47,946.88$
20 49,624.96$
21 49,624.96$
22 51,437.65$
23 51,633.23$
24 52,776.27$
25 55,820.32$
26 58,552.69$
27+ 59,564.59$ Updated 2/22/2017
2016-17 Instructional Performance
Salary Table
126
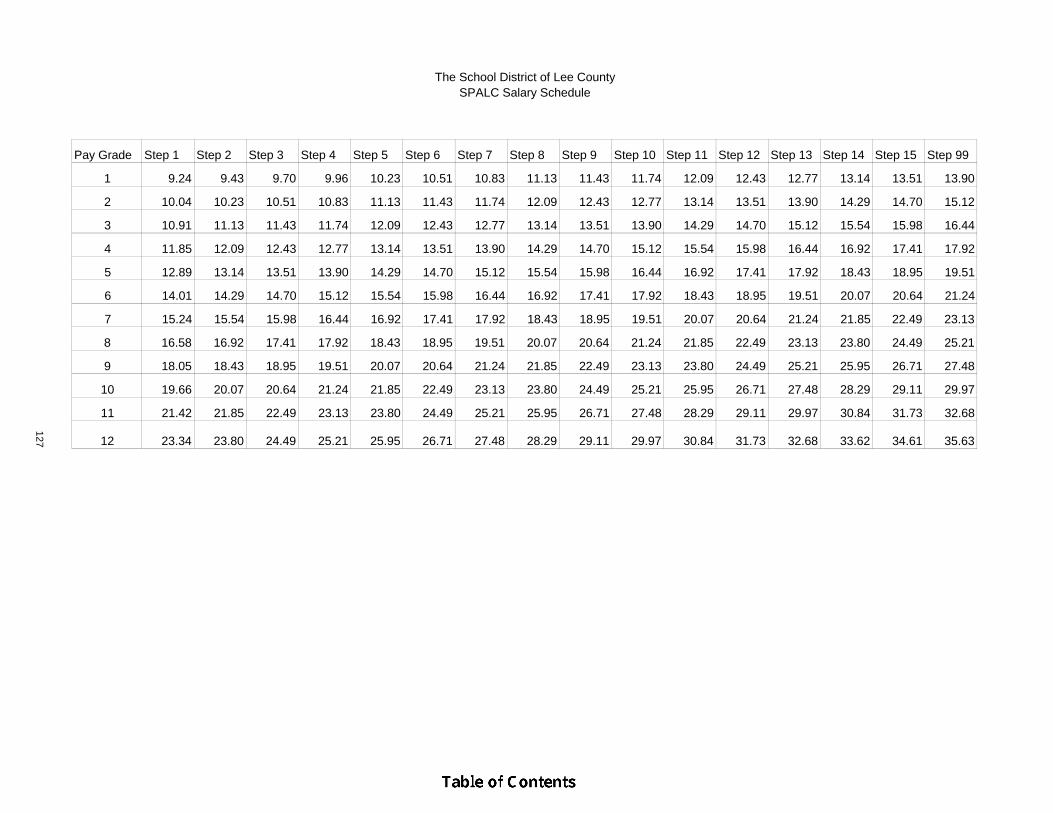
Pay Grade Step 1 Step 2 Step 3 Step 4 Step 5 Step 6 Step 7 Step 8 Step 9 Step 10 Step 11 Step 12 Step 13 Step 14 Step 15 Step 99
1 9.24 9.43 9.70 9.96 10.23 10.51 10.83 11.13 11.43 11.74 12.09 12.43 12.77 13.14 13.51 13.90
2 10.04 10.23 10.51 10.83 11.13 11.43 11.74 12.09 12.43 12.77 13.14 13.51 13.90 14.29 14.70 15.12
3 10.91 11.13 11.43 11.74 12.09 12.43 12.77 13.14 13.51 13.90 14.29 14.70 15.12 15.54 15.98 16.44
4 11.85 12.09 12.43 12.77 13.14 13.51 13.90 14.29 14.70 15.12 15.54 15.98 16.44 16.92 17.41 17.92
5 12.89 13.14 13.51 13.90 14.29 14.70 15.12 15.54 15.98 16.44 16.92 17.41 17.92 18.43 18.95 19.51
6 14.01 14.29 14.70 15.12 15.54 15.98 16.44 16.92 17.41 17.92 18.43 18.95 19.51 20.07 20.64 21.24
7 15.24 15.54 15.98 16.44 16.92 17.41 17.92 18.43 18.95 19.51 20.07 20.64 21.24 21.85 22.49 23.13
8 16.58 16.92 17.41 17.92 18.43 18.95 19.51 20.07 20.64 21.24 21.85 22.49 23.13 23.80 24.49 25.21
9 18.05 18.43 18.95 19.51 20.07 20.64 21.24 21.85 22.49 23.13 23.80 24.49 25.21 25.95 26.71 27.48
10 19.66 20.07 20.64 21.24 21.85 22.49 23.13 23.80 24.49 25.21 25.95 26.71 27.48 28.29 29.11 29.97
11 21.42 21.85 22.49 23.13 23.80 24.49 25.21 25.95 26.71 27.48 28.29 29.11 29.97 30.84 31.73 32.68
127 12 23.34 23.80 24.49 25.21 25.95 26.71 27.48 28.29 29.11 29.97 30.84 31.73 32.68 33.62 34.61 35.63
The School District of Lee CountySPALC Salary Schedule
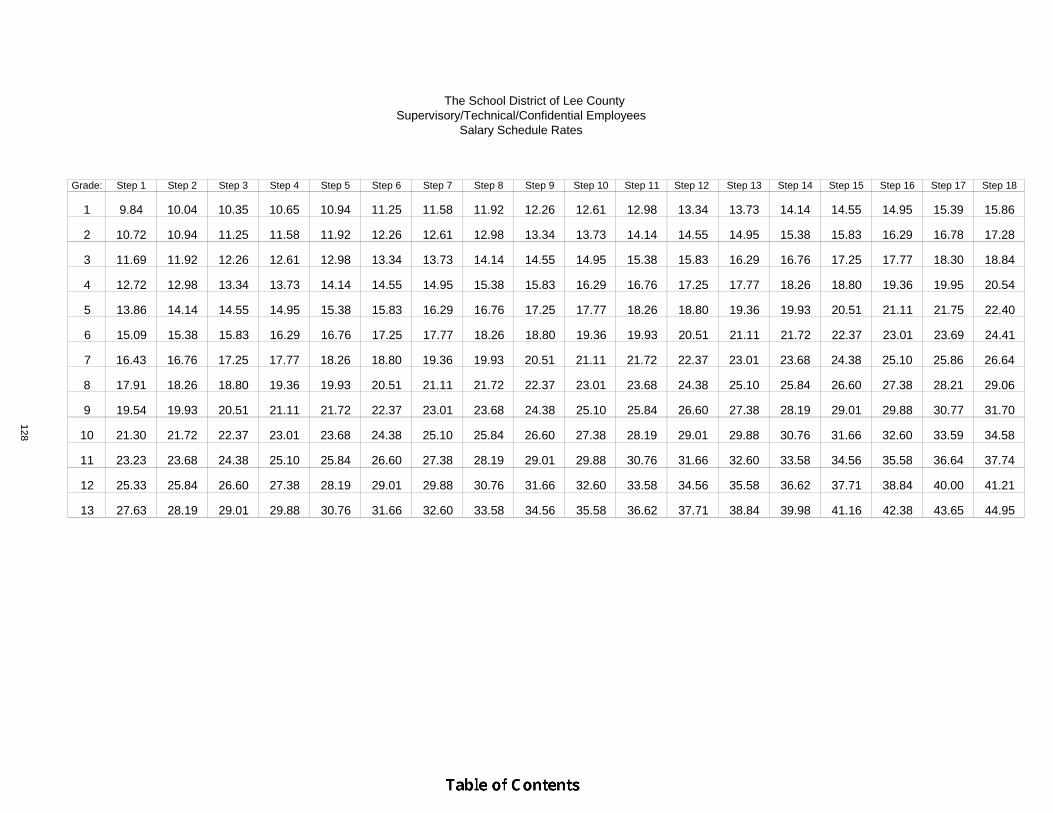
Grade: Step 1 Step 2 Step 3 Step 4 Step 5 Step 6 Step 7 Step 8 Step 9 Step 10 Step 11 Step 12 Step 13 Step 14 Step 15 Step 16 Step 17 Step 18
1 9.84 10.04 10.35 10.65 10.94 11.25 11.58 11.92 12.26 12.61 12.98 13.34 13.73 14.14 14.55 14.95 15.39 15.86
2 10.72 10.94 11.25 11.58 11.92 12.26 12.61 12.98 13.34 13.73 14.14 14.55 14.95 15.38 15.83 16.29 16.78 17.28
3 11.69 11.92 12.26 12.61 12.98 13.34 13.73 14.14 14.55 14.95 15.38 15.83 16.29 16.76 17.25 17.77 18.30 18.84
4 12.72 12.98 13.34 13.73 14.14 14.55 14.95 15.38 15.83 16.29 16.76 17.25 17.77 18.26 18.80 19.36 19.95 20.54
5 13.86 14.14 14.55 14.95 15.38 15.83 16.29 16.76 17.25 17.77 18.26 18.80 19.36 19.93 20.51 21.11 21.75 22.40
6 15.09 15.38 15.83 16.29 16.76 17.25 17.77 18.26 18.80 19.36 19.93 20.51 21.11 21.72 22.37 23.01 23.69 24.41
7 16.43 16.76 17.25 17.77 18.26 18.80 19.36 19.93 20.51 21.11 21.72 22.37 23.01 23.68 24.38 25.10 25.86 26.64
8 17.91 18.26 18.80 19.36 19.93 20.51 21.11 21.72 22.37 23.01 23.68 24.38 25.10 25.84 26.60 27.38 28.21 29.06
9 19.54 19.93 20.51 21.11 21.72 22.37 23.01 23.68 24.38 25.10 25.84 26.60 27.38 28.19 29.01 29.88 30.77 31.70
128 10 21.30 21.72 22.37 23.01 23.68 24.38 25.10 25.84 26.60 27.38 28.19 29.01 29.88 30.76 31.66 32.60 33.59 34.58
11 23.23 23.68 24.38 25.10 25.84 26.60 27.38 28.19 29.01 29.88 30.76 31.66 32.60 33.58 34.56 35.58 36.64 37.74
12 25.33 25.84 26.60 27.38 28.19 29.01 29.88 30.76 31.66 32.60 33.58 34.56 35.58 36.62 37.71 38.84 40.00 41.21
13 27.63 28.19 29.01 29.88 30.76 31.66 32.60 33.58 34.56 35.58 36.62 37.71 38.84 39.98 41.16 42.38 43.65 44.95
The School District of Lee CountySupervisory/Technical/Confidential Employees
Salary Schedule Rates
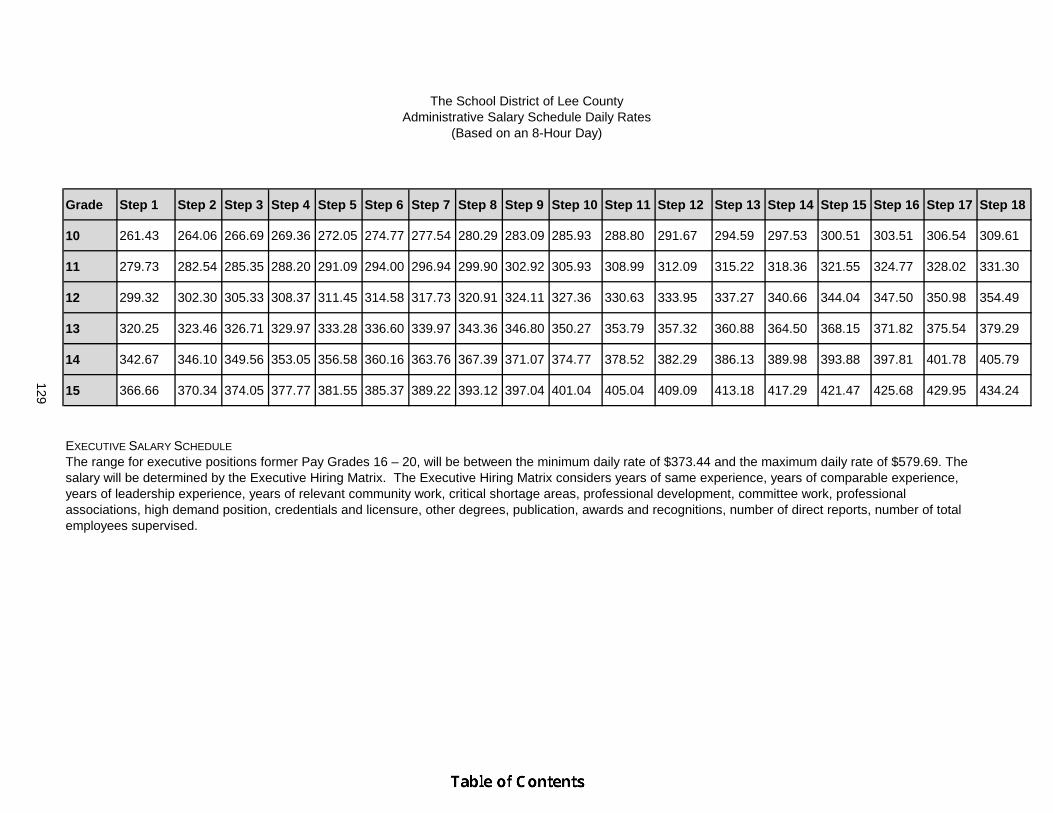
Grade Step 1 Step 2 Step 3 Step 4 Step 5 Step 6 Step 7 Step 8 Step 9 Step 10 Step 11 Step 12 Step 13 Step 14 Step 15 Step 16 Step 17 Step 18
10 261.43 264.06 266.69 269.36 272.05 274.77 277.54 280.29 283.09 285.93 288.80 291.67 294.59 297.53 300.51 303.51 306.54 309.61
11 279.73 282.54 285.35 288.20 291.09 294.00 296.94 299.90 302.92 305.93 308.99 312.09 315.22 318.36 321.55 324.77 328.02 331.30
12 299.32 302.30 305.33 308.37 311.45 314.58 317.73 320.91 324.11 327.36 330.63 333.95 337.27 340.66 344.04 347.50 350.98 354.49
13 320.25 323.46 326.71 329.97 333.28 336.60 339.97 343.36 346.80 350.27 353.79 357.32 360.88 364.50 368.15 371.82 375.54 379.29
14 342.67 346.10 349.56 353.05 356.58 360.16 363.76 367.39 371.07 374.77 378.52 382.29 386.13 389.98 393.88 397.81 401.78 405.79
129 15 366.66 370.34 374.05 377.77 381.55 385.37 389.22 393.12 397.04 401.04 405.04 409.09 413.18 417.29 421.47 425.68 429.95 434.24
EXECUTIVE SALARY SCHEDULE
The School District of Lee CountyAdministrative Salary Schedule Daily Rates
(Based on an 8-Hour Day)
The range for executive positions former Pay Grades 16 – 20, will be between the minimum daily rate of $373.44 and the maximum daily rate of $579.69. The salary will be determined by the Executive Hiring Matrix. The Executive Hiring Matrix considers years of same experience, years of comparable experience, years of leadership experience, years of relevant community work, critical shortage areas, professional development, committee work, professional associations, high demand position, credentials and licensure, other degrees, publication, awards and recognitions, number of direct reports, number of total employees supervised.
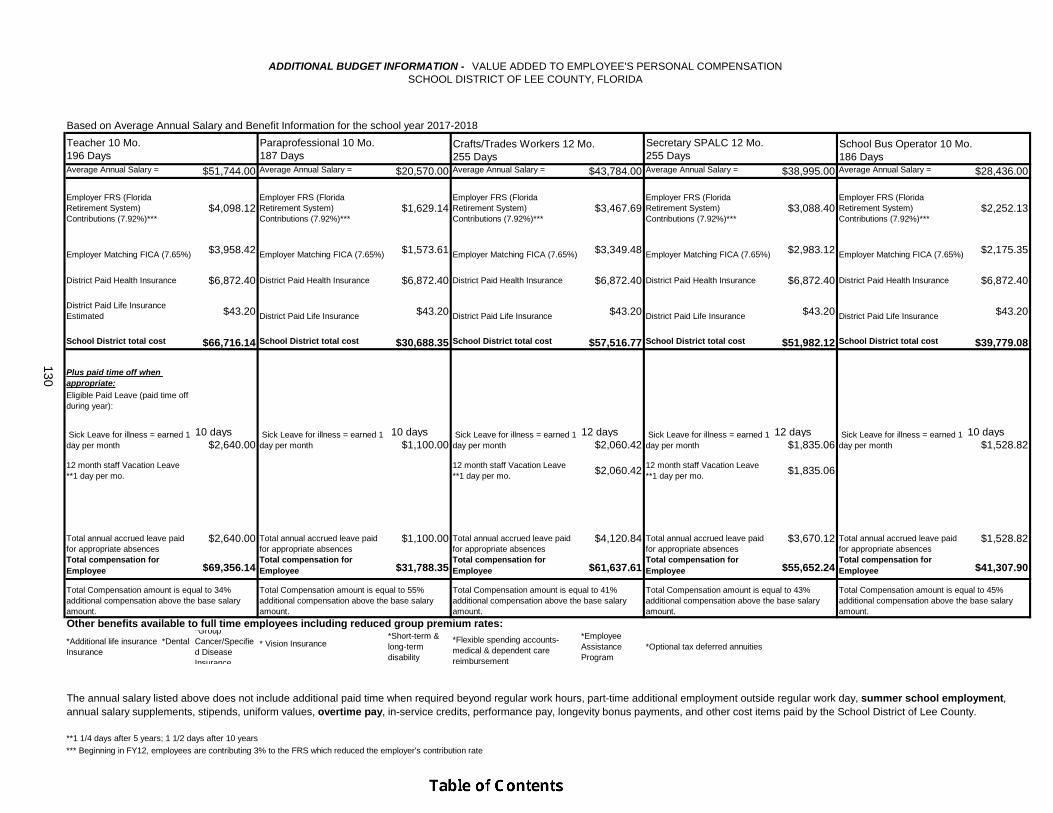
ADDITIONAL BUDGET INFORMATION - VALUE ADDED TO EMPLOYEE'S PERSONAL COMPENSATIONSCHOOL DISTRICT OF LEE COUNTY, FLORIDA
Based on Average Annual Salary and Benefit Information for the school year 2017-2018
Teacher 10 Mo. 196 Days
Paraprofessional 10 Mo. 187 Days
Secretary SPALC 12 Mo. 255 Days
Average Annual Salary = $51,744.00 Average Annual Salary = $20,570.00 Average Annual Salary = $43,784.00 Average Annual Salary = $38,995.00 Average Annual Salary = $28,436.00
Employer FRS (Florida Retirement System) Contributions (7.92%)***
$4,098.12Employer FRS (Florida Retirement System) Contributions (7.92%)***
$1,629.14Employer FRS (Florida Retirement System) Contributions (7.92%)***
$3,467.69Employer FRS (Florida Retirement System) Contributions (7.92%)***
$3,088.40Employer FRS (Florida Retirement System) Contributions (7.92%)***
$2,252.13
Employer Matching FICA (7.65%) $3,958.42 Employer Matching FICA (7.65%) $1,573.61 Employer Matching FICA (7.65%) $3,349.48 Employer Matching FICA (7.65%) $2,983.12 Employer Matching FICA (7.65%) $2,175.35
District Paid Health Insurance $6,872.40 District Paid Health Insurance $6,872.40 District Paid Health Insurance $6,872.40 District Paid Health Insurance $6,872.40 District Paid Health Insurance $6,872.40
District Paid Life Insurance Estimated $43.20 District Paid Life Insurance $43.20 District Paid Life Insurance $43.20 District Paid Life Insurance $43.20 District Paid Life Insurance $43.20
School District total cost $66,716.14 School District total cost $30,688.35 School District total cost $57,516.77 School District total cost $51,982.12 School District total cost $39,779.08
130 Plus paid time off when appropriate:Eligible Paid Leave (paid time off during year):
10 days 10 days 12 days 12 days 10 days
$2,640.00 $1,100.00 $2,060.42 $1,835.06 $1,528.82
12 month staff Vacation Leave **1 day per mo.
12 month staff Vacation Leave **1 day per mo. $2,060.42
12 month staff Vacation Leave **1 day per mo. $1,835.06
Total annual accrued leave paid for appropriate absences
$2,640.00 Total annual accrued leave paid for appropriate absences
$1,100.00 Total annual accrued leave paid for appropriate absences
$4,120.84 Total annual accrued leave paid for appropriate absences
$3,670.12 Total annual accrued leave paid for appropriate absences
$1,528.82
Total compensation for Employee $69,356.14
Total compensation for Employee $31,788.35
Total compensation for Employee $61,637.61
Total compensation for Employee $55,652.24
Total compensation for Employee $41,307.90
* Vision Insurance
**1 1/4 days after 5 years; 1 1/2 days after 10 years
*** Beginning in FY12, employees are contributing 3% to the FRS which reduced the employer's contribution rate
*Additional life insurance *Dental Insurance
Total Compensation amount is equal to 45% additional compensation above the base salary amount.
Sick Leave for illness = earned 1 day per month
School Bus Operator 10 Mo. 186 Days
Other benefits available to full time employees including reduced group premium rates:
*Flexible spending accounts-medical & dependent care reimbursement
*Employee Assistance Program
*Optional tax deferred annuities
Total Compensation amount is equal to 43% additional compensation above the base salary amount.
Crafts/Trades Workers 12 Mo. 255 Days
Sick Leave for illness = earned 1 day per month
Sick Leave for illness = earned 1 day per month
Sick Leave for illness = earned 1 day per month
*Short-term & long-term disability
The annual salary listed above does not include additional paid time when required beyond regular work hours, part-time additional employment outside regular work day, summer school employment, annual salary supplements, stipends, uniform values, overtime pay, in-service credits, performance pay, longevity bonus payments, and other cost items paid by the School District of Lee County.
Sick Leave for illness = earned 1 day per month
Total Compensation amount is equal to 34% additional compensation above the base salary amount.
Total Compensation amount is equal to 55% additional compensation above the base salary amount.
Total Compensation amount is equal to 41% additional compensation above the base salary amount.
*Group Cancer/Specified Disease Insurance
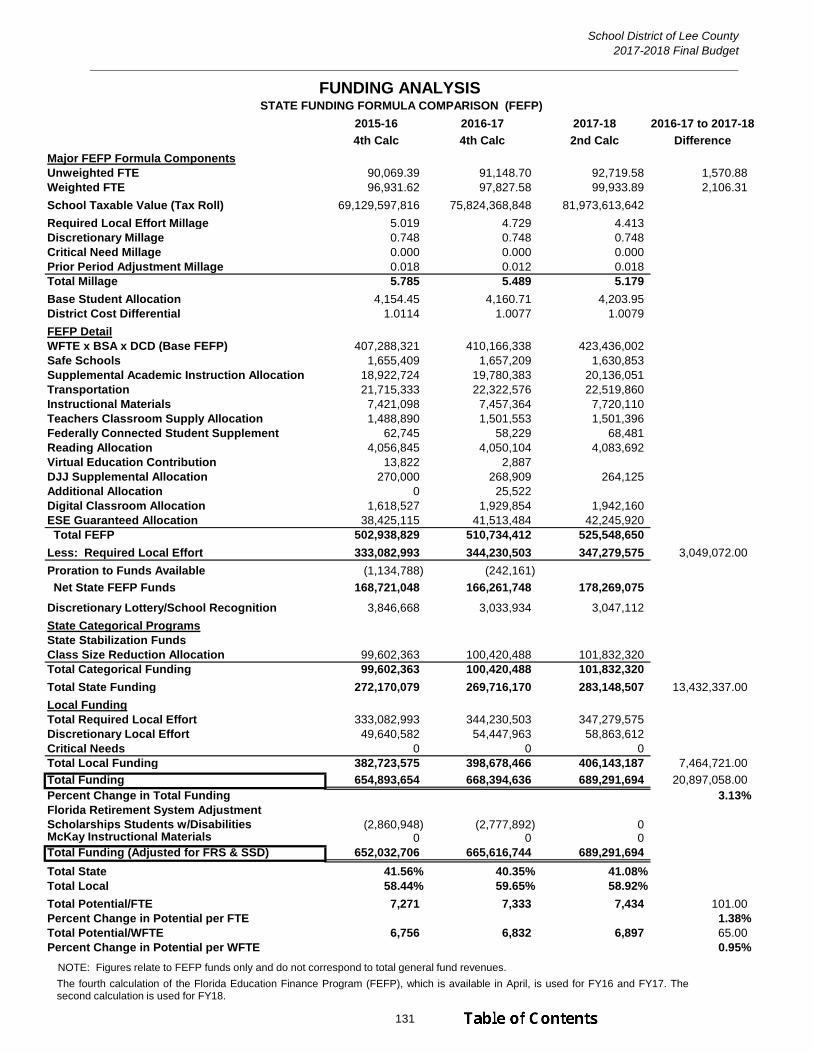
School District of Lee County2017-2018 Final Budget
___________________________________________________________________________________________________
131
2015-16 2016-17 2017-18 2016-17 to 2017-18
4th Calc 4th Calc 2nd Calc Difference
Major FEFP Formula ComponentsUnweighted FTE 90,069.39 91,148.70 92,719.58 1,570.88Weighted FTE 96,931.62 97,827.58 99,933.89 2,106.31
School Taxable Value (Tax Roll) 69,129,597,816 75,824,368,848 81,973,613,642
Required Local Effort Millage 5.019 4.729 4.413Discretionary Millage 0.748 0.748 0.748Critical Need Millage 0.000 0.000 0.000Prior Period Adjustment Millage 0.018 0.012 0.018Total Millage 5.785 5.489 5.179
Base Student Allocation 4,154.45 4,160.71 4,203.95District Cost Differential 1.0114 1.0077 1.0079
FEFP DetailWFTE x BSA x DCD (Base FEFP) 407,288,321 410,166,338 423,436,002Safe Schools 1,655,409 1,657,209 1,630,853Supplemental Academic Instruction Allocation 18,922,724 19,780,383 20,136,051Transportation 21,715,333 22,322,576 22,519,860Instructional Materials 7,421,098 7,457,364 7,720,110Teachers Classroom Supply Allocation 1,488,890 1,501,553 1,501,396Federally Connected Student Supplement 62,745 58,229 68,481Reading Allocation 4,056,845 4,050,104 4,083,692Virtual Education Contribution 13,822 2,887DJJ Supplemental Allocation 270,000 268,909 264,125Additional Allocation 0 25,522Digital Classroom Allocation 1,618,527 1,929,854 1,942,160ESE Guaranteed Allocation 38,425,115 41,513,484 42,245,920 Total FEFP 502,938,829 510,734,412 525,548,650
Less: Required Local Effort 333,082,993 344,230,503 347,279,575 3,049,072.00
Proration to Funds Available (1,134,788) (242,161)
Net State FEFP Funds 168,721,048 166,261,748 178,269,075
Discretionary Lottery/School Recognition 3,846,668 3,033,934 3,047,112
State Categorical ProgramsState Stabilization FundsClass Size Reduction Allocation 99,602,363 100,420,488 101,832,320Total Categorical Funding 99,602,363 100,420,488 101,832,320
Total State Funding 272,170,079 269,716,170 283,148,507 13,432,337.00
Local FundingTotal Required Local Effort 333,082,993 344,230,503 347,279,575Discretionary Local Effort 49,640,582 54,447,963 58,863,612Critical Needs 0 0 0Total Local Funding 382,723,575 398,678,466 406,143,187 7,464,721.00
Total Funding 654,893,654 668,394,636 689,291,694 20,897,058.00Percent Change in Total Funding 3.13%Florida Retirement System AdjustmentScholarships Students w/Disabilities (2,860,948) (2,777,892) 0McKay Instructional Materials 0 0 0Total Funding (Adjusted for FRS & SSD) 652,032,706 665,616,744 689,291,694
Total State 41.56% 40.35% 41.08%Total Local 58.44% 59.65% 58.92%
Total Potential/FTE 7,271 7,333 7,434 101.00Percent Change in Potential per FTE 1.38%Total Potential/WFTE 6,756 6,832 6,897 65.00Percent Change in Potential per WFTE 0.95%
FUNDING ANALYSIS STATE FUNDING FORMULA COMPARISON (FEFP)
NOTE: Figures relate to FEFP funds only and do not correspond to total general fund revenues.
The fourth calculation of the Florida Education Finance Program (FEFP), which is available in April, is used for FY16 and FY17. The second calculation is used for FY18.

School District of Lee County2017-2018 Final Budget
132
2014-15 2015-16 2016-17 2017-18 CHANGE PERCENT
STATE 263,284,842 272,170,079 269,716,170 283,148,507 13,432,337 4.98%LOCAL 365,425,796 382,723,575 398,678,466 406,143,187 7,464,721 1.87%TOTAL 628,710,638 654,893,654 668,394,636 689,291,694 20,897,058 3.13%
STATE VS LOCAL FUNDINGFEFP
2016-17 to 2017-18
0
50,000,000
100,000,000
150,000,000
200,000,000
250,000,000
300,000,000
350,000,000
400,000,000
450,000,000
STATE LOCAL
2014-15
2015-16
2016-17
2017-18
NOTE: Figures relate to FEFP funds only and do not correspond to total general fund revenues.
Total FEFP increased in 2017-18 by 3.13% The state revenues include the steady increase in the Amendment 9 mandate for Class Size Reduction which is $101,832,320 in 2017-18, (an increase of approximately $1.4M). Local property tax revenues continue to increase for the 4th year as local property tax rolls continue to grow.

School District of Lee County2017-2018 Final Budget
133
STATE FUNDING FORMULA COMPARISON
PER STUDENT (FEFP)
AnnualDollars percent
per unweighted increaseSchool Year full-time student -decrease2017- 2018 7,418 1.81%
2016-2017 7,286 1.24%
2015-2016 7,197 1.80%
2014-2015 7,070 0.94%
2013-2014 7,004 6.28%
2012-2013 6,590 2.00%
2011-2012 6,461 -10.55%
2010-2011 7,223 2.12%
2009-2010 7,073 -1.85%
2008-2009 7,206 -2.61%
2007-2008 7,399 4.23%
2006-2007 7,099 12.59%
2005-2006 6,305 7.68%
2004-2005 5,856 4.45%
2003-2004 5,606 5.39%
2002-2003 5,319 4.96%
Amounts exclude school recognition awards. School recognition awards are granted directly to individual schools, based on performance outcomes, to be used solely at the schools' discretion. Typically, schools have used these funds to provide bonuses to staff. Note: Figures relate to FEFP funds only and do not correspond to total general fund revenues. The fourth calculation is used for all prior years and the second FEFP calculation is used for 2017-18.
In 2005-2006 a next step in the Class Size Reduction mandate took place and the State gave additional dollars for Districts to meet the new school-wide average compliance level. Beginning in 2008-09 state funding decreased due to the decline in the economy. In 2009-10 the Legislature allowed Class Size Reduction to remain as an average per school due to the overall decrease in funding. Starting in 2010-11 the district allocated resources to schools to comply with the mandate to meet class sizes at the classroom level. In 2009-10 and 2010-11 there was help from the Federal government in the form of stimulus funds. In 2011-12 stimulus funds were no longer available and additional State budget cuts were also enacted causing a large decrease in per-student funding. The District began tapping into reserves in order to comply with the class size amendment and balance the budget. 2012-13 began a trend of increasing funds per student. Funds per student have just now in 2017-18 surpassed the 2007-08 per student level of funding. In 2013-14 a change in the class size amendment for "schools of choice" helped the District to meet the class size mandate and save reserves.
School District of Lee County 2017-2018 Final Budget
134
GLOSSARY OF TERMS This glossary contains definitions of selected terms used in this document necessary for common understandings concerning financial accounting procedures for the School District of Lee County. Several terms, which are not primarily financial accounting terms, have been included because of their significance for the budgeting process. The glossary is arranged alphabetically with appropriate cross-referencing where necessary. ACCOUNTING SYSTEMS The system used for recording and reporting of activities and events affecting the money of an administrative unit and its programs. Specifically, it describes: (1) what accounting records are to be maintained, how they will be maintained, and the procedures, methods, and forms to be used; (2) data recording, classifying, and summarizing activities or events; (3) analyzing and interpreting recorded data; and (4) preparing and initiating reports and statements which reflect conditions as of a given date, the results of operations for a specific period, and the evaluation of status and results of operation in terms of established objectives. ACCRUAL BASIS The basis of accounting under which revenues are recorded when levies are made and expenditures are recorded as soon as they result in liabilities, regardless of when the revenue is actually received or the payment is actually made. See also REVENUE and EXPENDITURES. ACCUMULATED DEPRECIATION The accumulation of systematic and rational allocations of the estimated cost of using capital assets, on a historical basis, over the useful lives of the capital assets. AD VALOREM TAXES Taxes levied based on the assessed valuation (less exemptions) of real property. ANCILLARY PLANT Comprises the building site and site improvements necessary to provide such facilities as vehicle maintenance, warehouses, maintenance, or administrative buildings essential to providing support services to an educational program. APPROPRIATION An authorization granted by a legislative body to make expenditures and to incur obligations for specific purposes. An appropriation is usually limited in amount and as to the time when it may be expended. APPROPRIATION ACCOUNT A budgetary account set up to record specific authorizations to spend. The account is created with original and any supplemental appropriations and is charged with expenditures and encumbrances. ASSESSED VALUATION A valuation set upon real estate by a government as a basis for levying taxes. AUXILIARY FACILITY The spaces located at educational plants that are not designed for student occupancy. AVERAGE DAILY ATTENDANCE (ADA) In a given school year, the average daily attendance for a given school is the aggregate day’s attendance of the school divided by the number of days school was actually in session. Only days in which the pupils were under the guidance and direction of teachers in the teaching process should be considered as days in session. AVERAGE DAILY MEMBERSHIP (ADM) The average number of students on the current roll of the school each day school is in session. Average daily membership equals aggregate day’s membership divided by the total number of days school is in session. Typically, average daily membership is calculated for the 180-day school year. However, these calculations may be for additional periods.
School District of Lee County 2017-2018 Final Budget
135
BALANCE SHEET A summarized statement, at a given date, of the financial position of a school system per fund and/or all funds combined showing assets, liabilities, reserves, and fund balance. BASE STUDENT ALLOCATION (BSA) The state dollar allocation under the Florida Education Finance Program (FEFP) for a student in a program with a weight of 1.000 (grades 4-8 Basic). The base student allocation is multiplied by program cost factors for each program to determine a total allocation based on weighted full time equivalent students (WFTE). BOARD Unless otherwise specified, refers to the district School Board. BOND A written promise to pay a specified sum of money, called the face value, at a fixed time in the future, called the date of maturity, and carrying interest at a fixed rate, usually payable periodically. The difference between a note and a bond is that the latter usually runs for a longer period and requires greater legal formality. BONDED DEBT The part of the School District debt that is covered by outstanding bonds of the School District. Sometimes it is called "funded debt". BONDS PAYABLE The face value of bonds issued and unpaid. BSA (See Base Student Allocation) BUDGET A plan of financial operation embodying an estimate of proposed expenditures for a given period or purpose and the proposed means of financing them. BUDGET, ADOPTED or BUDGET, FINAL The budget formally adopted by the School Board during a final public hearing in September and submitted to the Department of Education for approval. It serves as the approved financial plan for the operations of the School District for the fiscal year. BUDGET, PRELIMINARY Compilation of budget information in the early stages of budget preparation used for in-house budget review sessions. BUDGET, TENTATIVE The Superintendent's formal budget recommendation to the School Board pursuant to law. This takes place on or before August 3rd, before the first public hearing on the budget. Only expenditures that are essential to sustain the organization can be incurred against this budget since the School Board has not adopted it. BUDGET, TENTATIVE APPROVED The budget tentatively adopted at a public hearing in July. Expenditures may be legally incurred against this budget until adoption of the approved budget at the final public hearing in September. BUDGET AMENDMENT An administrative procedure used to revise a budgeted amount after the School Board of Lee County has adopted the budget. BUDGET CALENDAR The schedule of key dates used in the preparation and adoption of the budget.
School District of Lee County 2017-2018 Final Budget
136
BUDGET DOCUMENT The instrument used as a comprehensive financial plan of operations for the School District of Lee County. BUDGETARY CONTROL The control or management of the business affairs for the School District in accordance with an approved budget. The School District has a responsibility to keep expenditures within the authorized amounts. BUILDINGS A capital asset account, which reflects the acquisition value of permanent structures, used to house persons and property owned by the school system. If buildings are purchased or constructed, this account includes the purchase or contract price of all permanent buildings and fixtures attached to and forming a permanent part of such buildings. If buildings are acquired by gift, the account reflects their appraised value at the time of acquisition. CAPITAL ASSETS Land, buildings, machinery, furniture, and other equipment which the School District intends to hold or continue in use over a long period. "Capital" denotes probability or intent to continue use or possession and does not indicate immobility of an asset. CAPITAL EXPENDITURE Expenditures for the acquisition of fixed assets or additions to fixed assets. These are expenditures for land or existing buildings, improvements of grounds, construction of buildings, additions to buildings, remodeling of buildings, equipment and software. CAPITAL OUTLAYS Expenditures that result in the acquisition of or addition to capital assets. CAPITAL OUTLAY AND DEBT SERVICE (CO & DS) A source of fixed capital outlay revenue available to school districts through the constitutionally authorized Motor Vehicle License Revenue Tax. Revenues are used for educational facilities included on an approved Project Priority List and recommended area survey. These revenues may be bonded by local school districts. CAPITAL OUTLAY BOND ISSUE (COBI) The State Board of Education on behalf of the school districts may issue bonds on future revenue from the Motor Vehicle License Revenue annually. CAPITAL OUTLAY FTE (COFTE) The full time equivalents in a school district that are housed and educated in school district owned buildings. FTE generated by charter school students would be excluded from COFTE, as the students are not educated in school district owned buildings. COFTE is used as a basis to allocate capital funding to school districts. CAPITAL PROGRAM A plan for capital expenditures to be incurred each year over a fixed period of years to meet capital needs arising from the long-term work program. It sets forth each project or other contemplated expenditure in which the school system is to have a part and specifies the full resources estimated to be available to finance the projected expenditures. CAPITAL PROJECT Chapter 1013.64 of Florida Statutes refers to money appropriated from the Public Education Capital Outlay and Debt Service Trust Fund to the state system of public education and other educational agencies as authorized by the Legislature. CAPITAL PROJECT FUNDS Used to account for all resources used for acquiring capital sites, buildings, and equipment as specified by the five-year capital plan. Capital project funds are designated to account for acquisition or construction of capital outlay assets, which are not acquired directly by the general fund, special revenue funds, or enterprise funds. Under Florida Department of Education regulations, capital project funds may also be used for the maintenance, renovation, and repair of capital facilities.
School District of Lee County 2017-2018 Final Budget
137
CARRYFORWARD Unspent funds from the prior fiscal year that are required to be reallocated back to the school or department based on State or District policy. Currently, schools are allowed to carry over most funds in the general fund. CASH ACCOUNTING A basis of accounting in which transactions are recorded when cash is either received or expended. CERTIFICATES OF PARTICIPATION (COPs) Certificates of Participation are a form of lease-purchase agreement whereby the cost of a major capital expenditure can be spread over a pre-determined number of years. It is similar to bond financing; however, COPs are dependent on the appropriation of funds each year to cover the amount of payments required that year. For this reason, it is a somewhat higher risk for the investor and normally demands a somewhat higher interest rate than a bond. CERTIFIED TAXABLE VALUE The annual property tax value certified by the property appraiser of the county to the State Department of Revenue. CHART OF ACCOUNTS A list of accounts systematically arranged, applicable to a specific concern, giving account names and numbers. A chart of accounts, accompanied by descriptions of their use and of the general operation of the books of account, becomes a classification or manual of accounts. The chart of accounts is specified in the Department of Education "Red Book”. CHARTER SCHOOLS Charter schools are authorized as part of Florida’s program of public education and derive their funding from the state like public schools. Charter schools are, by definition, flexible and have freedom to set their own rules on such issues as curriculum, teaching style, personnel, and discipline. They are established and operated by teachers, administrators, and concerned citizens. Students must fulfill state requirements and pass statewide exams. CLASS SIZE REDUCTION (CSR), STATE AMENDMENT A State Constitutional amendment adopted in November, 2002 establishes the maximum number of students in core-curriculum courses assigned to a teacher in each of three grade levels: (1) Prekindergarten through 3rd grade, 18 students; (2) 4th through 8th grades, 22 students; (3) 9th through 12th grades, 25 students. COLLECTION RATE Pursuant to state statute, a collection rate of 96% is used to approximate the revenue to be collected from ad valorem taxes. CO & DS (see Capital Outlay and Debt Service) CONTRACT SERVICES Labor, material, and other costs for services rendered by personnel who are not on the payroll of the school system. COPs (see Certificates of Participation) CORE FACILITIES The media center, administration, cafeteria, toilet facilities, and circulation space of an educational plant. COST PER PUPIL Financial data (either budget or expenditures) for a given period divided by a pupil unit of measure (average daily membership, average daily attendance, etc.). DCD (See District Cost Differential)
School District of Lee County 2017-2018 Final Budget
138
DEBT An obligation resulting from the borrowing of money or from the purchase of goods and services. Debts of school systems include bonds, warrants, notes, etc. DEBT SERVICE FUND A fund established to account for the accumulation of resources for, and the payment of, long-term debt principal and interest. DISBURSEMENTS Payments for goods and services. DISTRICT COST DIFFERENTIAL (DCD) An adjustment to the gross Florida Educational Finance Program allocation based on cost-of-living differences in the 67 counties in the state as determined by the Florida Price Level Index. DISTRICT RESOURCE ALLOCATION (DRA) The DRA allocation process is the method used to allocate staff to the schools. It is based upon the concept that the teacher is the building block of the school system. The District Resource Allocation (DRA) is equivalent to the value of the projected average teacher cost, including benefits. EDUCATIONAL FACILITIES The buildings and equipment, structures, and special educational use areas that are built, installed, or established to serve primarily the educational purposes and secondarily the social and recreational purposes as authorized by the Florida Statutes and approved by school boards. EDUCATIONAL PLANT Comprises the educational facilities, site and site improvements necessary to accommodate students, faculty, administrators, staff, and the activities of the educational program of each plant. EDUCATIONAL PLANT SURVEY A systematic study of educational and ancillary plants often used to determine future needs for appropriate educational programs and services for each student. ELEMENTARY SCHOOL A school composed of Pre-kindergarten (PK) through grade five students. ENCUMBRANCES Legal commitments for unperformed contracts for goods or services. In budgetary accounting, encumbrances are recorded as a reduction of available appropriations to ensure that when the contract is fulfilled, funds will be available to pay the commitment. ENTERPRISE FUND Used to finance and account for the acquisition, operations, and maintenance of facilities and services that are entirely or significantly self-supportive by user charges. No enterprise funds are used by the School District. Under state regulations, the Commissioner of Education must approve any enterprise program.
EQUIPMENT Those moveable items used for school operations that are of a non-expendable and mechanical nature and perform a specific operation. Typewriters, projectors, computers, lathes, machinery, vehicles, etc., are classified as equipment. (Heating and air-conditioning systems, lighting fixtures and similar items permanently fixed to or within a building are considered part of the building.) ESE GUARANTEED ALLOCATION Funded through the FEFP, this guaranteed allocation, which is unchanged during the year, is based on the District’s projected membership of students formerly on the ESE Matrix of services in levels 1, 2, and 3 and is to be used to provide special education and related services for exceptional students.

School District of Lee County 2017-2018 Final Budget
139
ESOL An acronym that stands for English for Speakers of Other Languages. These are students who are not proficient in the English language. ESOL students are a weighted category of students in the FEFP system for which school districts receive weighted funding. EXCEPTIONAL STUDENT EDUCATION (ESE) Instruction and such related services as are necessary for the exceptional student to benefit from education. Exceptional students include students who are gifted and students with disabilities who are mentally handicapped, speech and language impaired, deaf or hard of hearing, visually impaired, dual sensory impaired, physically impaired, emotionally handicapped, specific learning disabled, hospital and homebound, autistic, and developmentally delayed. EXPENDITURES This includes total charges incurred, whether paid or unpaid, for current expenses, capital outlay, and debt service. FEDERAL REVENUE Revenue provided by the federal government. Expenditures made with this revenue are identifiable as federally supported expenditures. FEFP The Florida Educational Finance Program. See detailed explanation in the Policy and Process section of this budget book. FISCAL YEAR (FY) A twelve-month period of time to which the annual budget applies and at the end of which a school system determines its financial position and the results of its operations. The School District of Lee County operates on a fiscal year beginning July 1 and ending June 30. FIXED CAPITAL OUTLAY Includes fixed assets or real property. Land, new buildings, additions to buildings, replacement of buildings, and remodeling of real property that materially extends its useful life or materially improves or changes its functional use are examples of fixed capital outlay. FLORIDA VIRTUAL SCHOOL (FLVS) FLVS began as a pilot project in 1997 and is Florida’s first internet-based school. This school is open to students in grades six through twelve as well as adults seeking GED alternatives. This option is open to students in all 67 Florida school districts. Public, private, and home school students are eligible to enroll in these free courses. Students may take GED to honors to Advanced Placement courses. Successful completion of courses generates FTE for the Virtual School. Credits earned through the Virtual School are transferable to district schools. FRINGE BENEFITS Total employers share of F.I.C.A. taxes, insurance (hospitalization, life, disability, worker's compensation, unemployment), and retirement contributions made on behalf of employees.
FTE (FULL TIME EQUIVALENT) - ENROLLMENT A full definition of FTE may be found in Florida Statues 1011.61. In general terms, an FTE is one student in membership for one year, in one or more programs covered by the FEFP (Florida Education Finance Program). This equates to 900 hours of instruction for grades 4 through 12, and 720 hours of instruction for grades PK through 3, within a 180-day period. For official enrollment purposes, FTE's are counted four times during the school year.
FTE (FULL TIME EQUIVALENT) - POSITION A Full Time Equivalent Position, sometimes referred to as "FTE unit", is equal to an individual working the full number of daily hours and work days allotted for a given position classification. A full work year may vary from 186 to 255 workdays, depending on the effect of school calendars on individual position classifications. A full workday is set by definition and agreement, and is currently 7, 7 ½, or 8 hours depending on the job classification and requirements.

School District of Lee County 2017-2018 Final Budget
140
FTE, WEIGHTED (WEIGHTED FULL TIME EQUIVALENT), or WFTE A regular full time student in grades 4 through 8 is counted as one FTE. All other students are "weighted" to compensate for differing cost levels for different types of educational programs and students. For example, kindergarten children may require closer supervision, high school students may require more expensive lab equipment, and handicapped students may require special services. Weights to be assigned for calculating weighted FTE's are determined by the state and are used as the basis for state funding formulas. FUNCTION An accounting term relating to both the budget and financial report. A "function" is a grouping of activities being performed for which salaries and other types of direct costs are accounted for and expended. Functions and sub-functions consist of activities that have somewhat the same general operational objectives. FUND A fund is a self-balancing group of accounts in which transactions relating to a particular purpose or funding source may be segregated for improved accountability. See definitions of specific funds. FUND BALANCE The excess of assets of a fund over its liabilities and reserves. During the fiscal year prior to closing, it represents the excess of the fund's assets and estimated revenues for the period over its liabilities, reserves, and appropriations for the period. A fund balance is typically offset by reserves for specific purposes, such as payment of prior year encumbrances. GENERAL FUND The fund used to finance the ordinary operations of the school system. It is available for a legally authorized purpose and consists of money not specifically designated for some other particular purpose.
GOVERNMENTAL ACCOUNTING STANDARDS BOARD, STATEMENT 34 (GASB 34) This statement requires all governments, including special-purpose governments such as school districts, to implement a new financial reporting model. The model includes management’s discussion and analysis (MD & A), basic financial statements, notes to the financial statements, and certain other required supplementary information (RSI) other than MD & A. • MD & A is a component of RSI that provides a description of the government’s financial activities based on currently known facts, decisions, or conditions. • The basic financial statements include: 1) government-wide financial statements, 2) fund financial statements, and 3) notes to the financial statements. • RSI is supplementary financial information that is required to be presented with the basic financial statements. Required budgetary comparisons include the original and final budgets for the general fund and each major special revenue fund that has a legally adopted annual budget. GRANT Contributions of either money or material goods given by a contributing unit (public or private) to a receiving unit and for which the contributing unit expects no repayment. Grants may be for a specific or general purpose. HIGH SCHOOL A school composed of grades nine through twelve students. INSTRUCTION Direct interaction between students and classroom teachers, paraprofessionals and/or related staff involving teaching students in a teaching/learning environment in a systematic program designed to assist students in acquiring competency in knowledge, skills, and understanding. INSTRUCTIONAL MATERIALS - SUPPLIES An object of expenditure related to amounts paid for the acquisition of devices, content materials, methods, or experiences used for teaching and learning purposes. These include printed and non-printed sensory materials. INTERFUND TRANSFERS Amounts transferred from one fund to another within a fund group, i.e. debt service.

School District of Lee County 2017-2018 Final Budget
141
INTERNAL SERVICE FUND A fund established to finance and account for services and commodities furnished by a designated department or agency to other departments and agencies within a single governmental unit. The district's self-insured program is accounted for as an internal service fund.
INVOICE An itemized statement of merchandise shipped or sent to a purchaser, consignee, etc., showing the quantity, value or prices, and charges. KINDERGARTEN A group or class that is organized to provide educational experience for children for the year immediately preceding the first grade and conducted during the regular school year. LAND A capital asset account that reflects the acquisition value of land owned by a school system. If land is purchased, this account includes the purchase costs and other associated improvement costs that are incurred to put the land in condition for its intended use. If land is acquired by gift, the account reflects its appraised value at time of acquisition. LEVY (Verb) To impose taxes or special assessments. (Noun) The total of taxes or special assessments imposed by a governmental unit. LIABILITY INSURANCE Expenditures for insurance coverage of the school system, or its officers, against losses resulting from judgments awarded against the system. Also recorded here are any expenditure (not judgments) made in lieu of liability insurance. The School District of Lee County is self-insured and also has a purchased re-insurance policy. LOST AND DAMAGED TEXTBOOKS The cost of replacing lost or damaged textbooks so that inventories are maintained at prescribed levels. LONG-TERM DEBT Debt with a maturity of more than one year from the date of issuance. MAINTENANCE AND REPAIR The upkeep of educational and ancillary plants including, but not limited to, roof or roofing replacement short of complete replacement of membrane or structure; repainting of interior or exterior surfaces; resurfacing of floors; repair or replacement of glass; repair of hardware, furniture, equipment, electrical fixtures, and plumbing fixtures; and repair or resurfacing of parking lots, roads, and walkways. The terms “maintenance and repair” do not include custodial or grounds keeping functions or renovation except for the replacement of equipment with equal systems meeting current code requirements, provided that the replacement item places neither increased demand on utility services nor structural supports and does not adversely affect the function of safety-to-life systems. MIDDLE SCHOOL A school composed of grades six through eight students.
MILL The rate of taxation based on dollars per thousand of taxable assessed value. A mill is one-tenth of a cent ($.001). MILLAGE RATE The ad valorem tax rate expressed in terms of the levy per thousand dollars of taxable assessed value established by the governing authority each fiscal year.
MODIFIED ACCRUAL The method of accounting in which revenues are recognized when earned and available.

School District of Lee County 2017-2018 Final Budget
142
NEW CONSTRUCTION Any construction of a building or unit of a building whether the entire building is new or whether an entirely new addition is being connected to an existing building. OBJECT An accounting term used to describe the service or commodity obtained because of a specific expenditure or to describe a specific revenue source.
OBJECTIVE An aim or goal to be reached within a set defined time period. OTHER LOCAL RECEIPTS Included in these receipts is income from such items as compensation for property damage, tax, tuition, rent, etc.
PECO FUNDED PROJECTS Site and site improvements necessary to accommodate buildings, equipment, and other structures, and special educational use areas that are built, installed, or established to serve primarily the educational instructional program of the district school board, community college, or the state university that are funded through specific capital dollars received from the state. PER PUPIL (ALLOTMENT) An allotment to each school based on pupil enrollment.
PER PUPIL (EXPENDITURE) An accepted and commonly used norm to compare expenditures between school districts, state spending, and national spending.
PERSONNEL, ADMINISTRATIVE Personnel on the school payroll who are engaged in activities which have as their primary purpose the general regulation, direction, and control of the affairs of the School District that are system-wide and not confined to one school, subject, or narrow phase of school activity; for example, superintendent of schools. PERSONNEL, CLERICAL Personnel occupying positions that have as their major responsibilities the preparing, transferring, transcribing, systematizing, or preserving of written communications and records. PERSONNEL, HEALTH Persons in the field of physical and mental health such as physicians, psychiatrists, school nurses, dentists, dental hygienists, psychiatric social workers, and therapists, whose services are for individuals, although sometimes used for group activities. PERSONNEL, INSTRUCTIONAL Persons who render services dealing directly with the instruction of pupils. PERSONNEL, INSTRUCTIONAL STAFF Persons who manage, direct, and supervise the district-wide instructional program to improve the quality of instruction and the curriculum. Included here are supervisors of instruction, curriculum, research and development, etc. PERSONNEL, MAINTENANCE Personnel responsible for the repairing and upkeep of grounds, buildings, and equipment. PRE-ENCUMBRANCES A reduction of available appropriations created by a purchase requisition but not a legal commitment until approved. PROGRAM COST FACTOR A multiplier applied to unweighted FTE to represent varying costs of educational programs.
School District of Lee County 2017-2018 Final Budget
143
PROJECT A specific objective or objectives to be accomplished with funds or resources available. Budgets and actual revenue and expenditure records may be maintained by project. PROJECT PRIORITY LIST PROJECTS A project that is listed on a State Board of Education approved list of projects (PPL) that has been survey recommended and for which priority of need has been established by the board in accordance with Section 2.1(5) (d), State Requirements for Educational Facilities (SREF). PROPERTY INSURANCE Expenditures for all forms of insurance covering the loss of, or damage to, property of the school system from fire, theft, storm, or any other cause. Also recorded here are costs for appraisals of property for insurance purposes. The School District of Lee County is self-insured, with additional purchased self-insurance policies. PUBLIC EDUCATION CAPITAL OUTLAY (PECO) FUNDS These funds are appropriated annually to school districts, universities, colleges, and vocational/technical schools by the Legislature. The two main types of PECO funding are school maintenance and capital for additional student stations. Funding for this allocation comes from Gross Receipts taxes. PUPIL TRANSPORTATION SERVICES Consists of those activities involved with the conveyance of pupils to and from school activities, as provided by state law. Includes trips between home and school or trips to school activities. PURCHASE ORDER A document that authorizes the purchase of specified merchandise or the rendering of certain services and the charge for them. PURCHASED SERVICES Personal services rendered by personnel who are not on the District payroll. This includes services of architects, engineers, auditors, consultants, etc. REIMBURSEMENT Cash or other assets received as a payment for expenses incurred or services performed, or other expenditures made for or on behalf of another governmental unit or department, or for an individual, firm, or corporation. REMODELING A change to existing facilities by rearrangement of spaces and their use. Includes, but is not limited to, the conversion of two classrooms to a science laboratory or the conversion of a closed plan arrangement to an open plan configuration. RENOVATION The upgrading of existing facilities by installation or replacement of materials and equipment. Includes, but is not limited to, air-conditioning, heating, or ventilation equipment; fire alarm systems; emergency lighting; electrical systems; and complete roofing or roof replacement, including replacement of membrane or structure. RENTALS Expenditures for the lease or rental of land, buildings, or equipment for the temporary or long-term use by the school system. REQUIRED LOCAL EFFORT Funding under the FEFP (Florida Education Finance Program) is comprised of both state and local revenue sources. After the state has determined the full amount of FEFP funding for a district, it determines what part of the funding must be paid from local sources. The state then determines the millage rate necessary to raise the local source amount and requires the district to levy the millage necessary to collect that amount. REQUISITION Lists specific goods or services to be purchased. A requisition becomes a purchase order after all required approvals are obtained.

School District of Lee County 2017-2018 Final Budget
144
RESERVE An account used to indicate that a portion of fund balance is restricted for a specific purpose. RESERVE FOR ENCUMBRANCES A reserve representing the designation of a portion of a fund balance to provide for outstanding encumbrances. Separate accounts may be maintained for current and prior-year encumbrances. REVENUE Additions to the assets of a fund during a fiscal period that are available to finance the fund's expenditures. REVISED BUDGET An increase or decrease to the adopted budget. SALARIES Expenditures related to wages paid to District employees. SALE OF ASSETS These are the receipts from the sale of scrap materials and worn-out, obsolete, or unneeded equipment, buildings, or land declared surplus. SATISFACTORY EDUCATIONAL FACILITY A facility that has been recommended for continued use by an educational plant survey or that has been classified as satisfactory in the state inventory of educational facilities. SCHOOL A school is an organization of pupils for instructional purposes on an elementary, secondary, or other public school level. Each individual school is housed in a school plant of one or more buildings. SCHOOL BOARD OF LEE COUNTY The elected body created according to state law and vested with responsibilities for educational activities in the countywide School District. SCHOOL PLANT The site, buildings, and equipment constituting the physical facilities used by a single school or by two or more schools sharing the use of common facilities. SCHOOL SITE The land and all improvements to the site, other than structures, such as grading, drainage, drives, parking areas, walls, plantings, play courts, and play fields. SPECIAL REVENUE FUND A fund used to account for the proceeds of specific revenue sources (other than special assessments, expendable trusts, or for major capital projects) that are legally restricted to expenditures for specific purposes. In the School District of Lee County, most federal funds and the food service program are treated as special revenue funds.
STATE BOARD OF EDUCATION BOND (SBE) This bond is also known as Capital Outlay Bond Issue (COBI). See Capital Outlay Bond Issue definition. SUPPLEMENTAL ACADEMIC INSTRUCTION (SAI) This is restricted funding which provides flexibility for school districts to use funds to help students gain at least a year of knowledge for each year in school. Strategies may include, but are not limited to, regular school day programs, extended day and extended year programs, class size reduction, and intervention programs. SUPPLIES Expenditures for expendable items that are consumed, worn-out, or deteriorated by use or items that lose their identity through fabrication or incorporation into different or more complex units or substances. TAXES Compulsory charges levied by a governmental unit for financing services performed for the common benefit.

School District of Lee County 2017-2018 Final Budget
145
VOCATIONAL PROGRAM A program offered at a school that is organized for the primary purpose of offering education and training in one or more semi-skilled, skilled, or technical occupations. VOLUNTARY PREKINDERGARTEN (VPK) Florida voters passed a constitutional amendment in November 2002, requiring a free, voluntary prekindergarten program be in place by the fall of 2005. This program is designed to prepare four-year olds for kindergarten and build the foundation for their educational success. The program is voluntary for both children and providers. Public, private, and faith-based providers are eligible to deliver the program, as long as they meet minimum standards required by law. Parents have two options: a school-year program consisting of 540 instructional hours or a summer program of 300 instructional hours. WFTE, see FTE, weighted WORKFORCE DEVELOPMENT EDUCATION Adult postsecondary vocational and adult general education programs. All students of this type are reported through the Workforce Development Information System (WDIS). This funding exists outside the Florida Education Finance Program (FEFP).

School District of Lee County 2017-2018 Final Budget
146
Budget Department Contacts
Services Provided Person(s) Providing Service Contact Number(s)
Chief Financial Officer Dr. Ami Desamours 337-8217
Director, Business Services Kelly Letcher 337-8214
Elementary and K-8 School Contact Margie Rodriguez 337-8390
Middle School Contact Sarah Lazenby 337-8392
High School Contact Sarah Lazenby 337-8392
Special Centers Contact Sarah Lazenby 337-8392
Textbook Information Margie Rodriguez 337-8390
Dori Slosberg Fund
Dual Enrollment
Linda Cronk
Linda Cronk
337-8391
337-8391
Fee Based Information Melissa Rivera 337-8644
Object Codes Kelly Letcher 337-8214
Workforce Development Sarah Lazenby 337-8392
Contracted Sites
Charter Schools
Linda Cronk
Linda Cronk
337-8391
337-8391
Department Contacts Linda Cronk
Melissa Rivera
337-8391 337-8644
Master School ID File Melissa Rivera 337-8644
Debt & Capital Budgets Melissa Rivera 337-8644
337-8644 McKay Scholarships Melissa Rivera
FTE Linda Cronk 337-8391
Summer School Budgets Linda Cronk 337-8391
School Improvement (Lottery) Linda Cronk 337-8391
School Recognition Melissa Rivera 337-8644
Food Service & Internal Service Funds Linda Cronk 337-8391
Supplemental Academic Instruction (SAI) Margie Rodriguez
Sarah Lazenby 337-8390 337-8392
Overtime Kelly Letcher 337-8214
Vendors Sherry Pearsall 337-8648

147
School District of Lee County School Listing
WEST ZONE Elementary Schools
Caloosa Elementary 620 S. Del Prado Blvd. Cape Coral, FL 33990 Ph: 239-574-3113 Fax: 239-574-1449
Dr. Carrie D. Robinson Littleton Elementary 700 Hutto Road N. Fort Myers, FL 33903 Ph: 239-995-3800 Fax: 239-995-6551
Cape Elementary 4519 Vincennes Blvd. Cape Coral, FL 33904 Ph: 239-542-3551 Fax: 239-542-3264
Patriot Elementary 711 SW 18th Street Cape Coral, FL 33991 Ph: 239-242-1023 Fax: 239-242-1238
Diplomat Elementary 1115 NE 16th Terrace Cape Coral, FL 33909 Ph: 239-458-0033 Fax: 239-458-1697
Pelican Elementary 3525 SW 3rd Ave. Cape Coral, FL 33914 Ph: 239-549-4966 Fax: 239-549-4973
Gulf Elementary 3400 SW 17th Place Cape Coral, FL 33914 Ph: 239-549-2726 Fax: 239-549-2117
Skyline Elementary 620 SW 19th Street Cape Coral, FL 33991 Ph: 239-772-3223 Fax: 239-772-8934
Hancock Creek Elementary 1601 Skyline Drive N. Fort Myers, FL 33903 Ph: 239-995-3600 Fax: 239-995-7674
Trafalgar Elementary 1850 SW 20th Avenue Cape Coral, FL 33991 Ph: 239-283-3043 Fax: 239-282-5595
Hector A. Cafferata Jr. Elementary 250 Santa Barbara Boulevard, N. Cape Coral, FL 33993 Ph: 239-458-7391 Fax: 239-772-0749
Tropic Isles Elementary 5145 Orange Grove Blvd. N. Fort Myers, FL 33903 Ph: 239-995-4704 Fax: 239-997-2422
J. Colin English Elementary 20 Pine Island Rd. N. Fort Myers, FL 33903 Ph: 239-995-2258 Fax: 239-995-5681
North Fort Myers Academy for the Arts (K-8) 1856 Arts Way N. Fort Myers, FL 33917 Ph: 239-997-2131 Fax: 239-997-6762
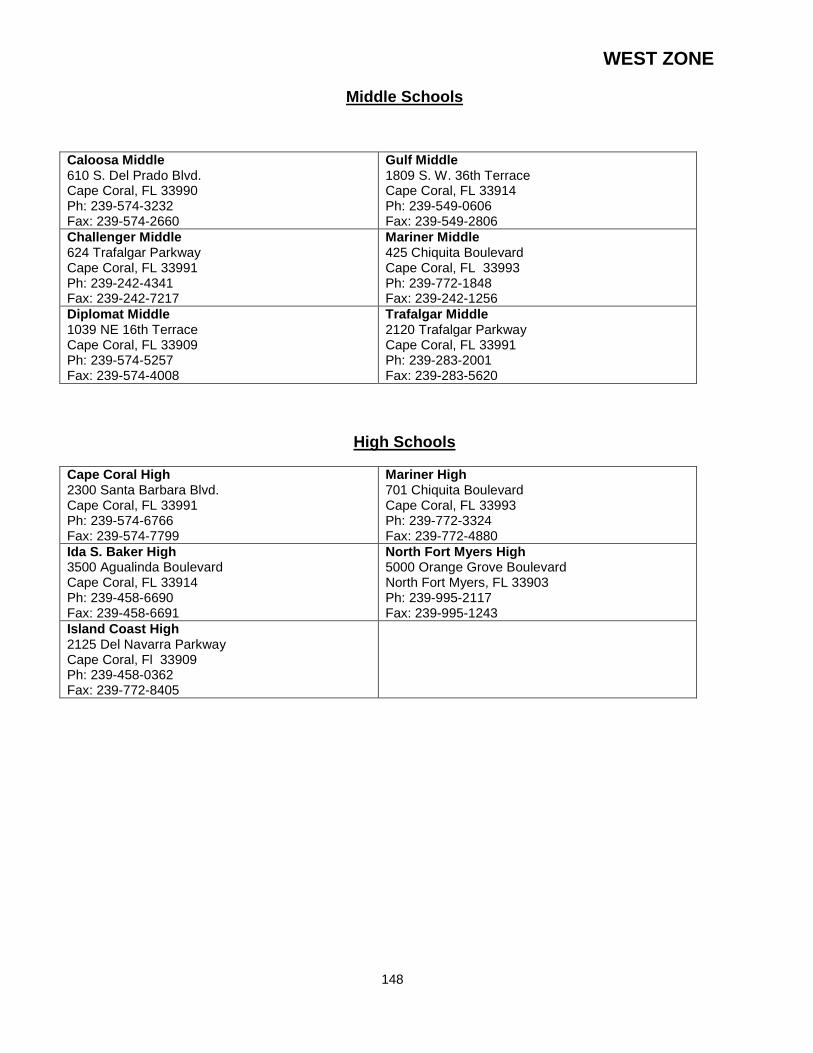
148
WEST ZONE
Middle Schools
Caloosa Middle 610 S. Del Prado Blvd. Cape Coral, FL 33990 Ph: 239-574-3232 Fax: 239-574-2660
Gulf Middle 1809 S. W. 36th Terrace Cape Coral, FL 33914 Ph: 239-549-0606 Fax: 239-549-2806
Challenger Middle 624 Trafalgar Parkway Cape Coral, FL 33991 Ph: 239-242-4341 Fax: 239-242-7217
Mariner Middle 425 Chiquita Boulevard Cape Coral, FL 33993 Ph: 239-772-1848 Fax: 239-242-1256
Diplomat Middle 1039 NE 16th Terrace Cape Coral, FL 33909 Ph: 239-574-5257 Fax: 239-574-4008
Trafalgar Middle 2120 Trafalgar Parkway Cape Coral, FL 33991 Ph: 239-283-2001 Fax: 239-283-5620
High Schools
Cape Coral High 2300 Santa Barbara Blvd. Cape Coral, FL 33991 Ph: 239-574-6766 Fax: 239-574-7799
Mariner High 701 Chiquita Boulevard Cape Coral, FL 33993 Ph: 239-772-3324 Fax: 239-772-4880
Ida S. Baker High 3500 Agualinda Boulevard Cape Coral, FL 33914 Ph: 239-458-6690 Fax: 239-458-6691
North Fort Myers High 5000 Orange Grove Boulevard North Fort Myers, FL 33903 Ph: 239-995-2117 Fax: 239-995-1243
Island Coast High 2125 Del Navarra Parkway Cape Coral, Fl 33909 Ph: 239-458-0362 Fax: 239-772-8405

149
EAST ZONE Elementary Schools
The Alva School (K-8) 17500 Church Avenue Alva, FL 33920 Ph: 239-728-2494 Fax: 239-728-3259
Mirror Lakes Elementary 525 Charwood Ave. S. Lehigh Acres, FL 33936 Ph: 239-369-2200 Fax: 239-369-0542
Bayshore Elementary 17050 Williams Rd. N. Fort Myers, FL 33917 Ph: 239-543-3663 Fax: 239-543-4040
Orange River Elementary 4501 Underwood Dr. Fort Myers, FL 33905 Ph: 239-694-1258 Fax: 239-694-8680
Edgewood Academy 3464 Edgewood Ave. Fort Myers, FL 33916 Ph: 239-334-6205 Fax: 239-334-6776
River Hall Elementary 2800 River Hall Parkway Alva, FL 33920 Ph: 239-693-0349 Fax: 239-693-5307
G. Weaver Hipps Elementary 1200 Homestead Road Lehigh Acres, FL 33936 Ph:239-368-7042 Fax:239-369-0469
Sunshine Elementary 601 Sara Avenue Lehigh Acres, FL 33971 Ph: 239-369-5836 Fax: 239-369-1455
Gateway Elementary 13280 Griffin Drive Fort Myers, FL 33913 Ph: 239-768-3737 Fax: 239-768-2967
Tice Elementary 4524 Tice Street Fort Myers, FL 33905 Ph: 239-694-1257 Fax: 239-694-8745
Harns Marsh Elementary 1800 Unice Avenue N. Lehigh Acres, FL 33971 Ph: 239-690-1249 Fax: 239-694-1325
Tortuga Preserve Elementary 1711 Gunnery Road N. Lehigh Acres, FL 33971 Ph: 239-693-5023 Fax: 239-693-5033
James Stephens International Academy 1333 Marsh Ave. Fort Myers, Fl 33905 Ph: 239-337-1333 Fax: 239-334-4144
Treeline Elementary 10900 Treeline Ave. Fort Myers, Fl 33913 Ph: 239-768-5208 Fax: 239-768-5415
Lehigh Elementary 200 Schoolside Court Lehigh Acres, FL 33936 Ph: 239-369-2477 Fax: 239-369-4506
Veterans Park Academy for the Arts (K-8) 49 Homestead Road South Lehigh Acres, FL 33936 Ph: 239-303-3003 Fax: 239-303-3075
Manatee Elementary 5301 Tice Street Fort Myers, FL 33905 Ph: 239-694-2097 Fax:239-694-4282

150
EAST ZONE
Middle Schools
Harns Marsh Middle 1820 Unice Ave. Lehigh Acres, FL 33971 Ph: 239-690-2025 Fax: 239-690-2028
Oak Hammock Middle 5321 Tice St. Fort Myers, Fl 33905 Ph: 239-693-0469 Fax: 239-694-4089
Lehigh Acres Middle 104 Arthur Avenue Lehigh Acres, FL 33936 Ph: 239-369-6108 Fax: 239-369-8808
Varsity Lakes Middle 801 Gunnery Road Lehigh Acres, FL 33971 Ph: 239-694-3464 Fax: 239-694-7093
High Schools
Dunbar High 3800 E. Edison Avenue Fort Myers, FL 33916 Ph: 239-461-5322 Fax: 239-461-5110
Lehigh Senior High 901 Gunnery Road Lehigh Acres, Fl 33971 Ph: 239-693-5353 Fax: 239-693-6702
East Lee County High School 715 Thomas-Sherwin Ave. Lehigh Acres, FL 33971 Ph: 239-369-2932 Fax: 239-369-3213
Riverdale High 2600 Buckingham Road Fort Myers, FL 33905 Ph: 239-694-4141 Fax: 239-694-3527
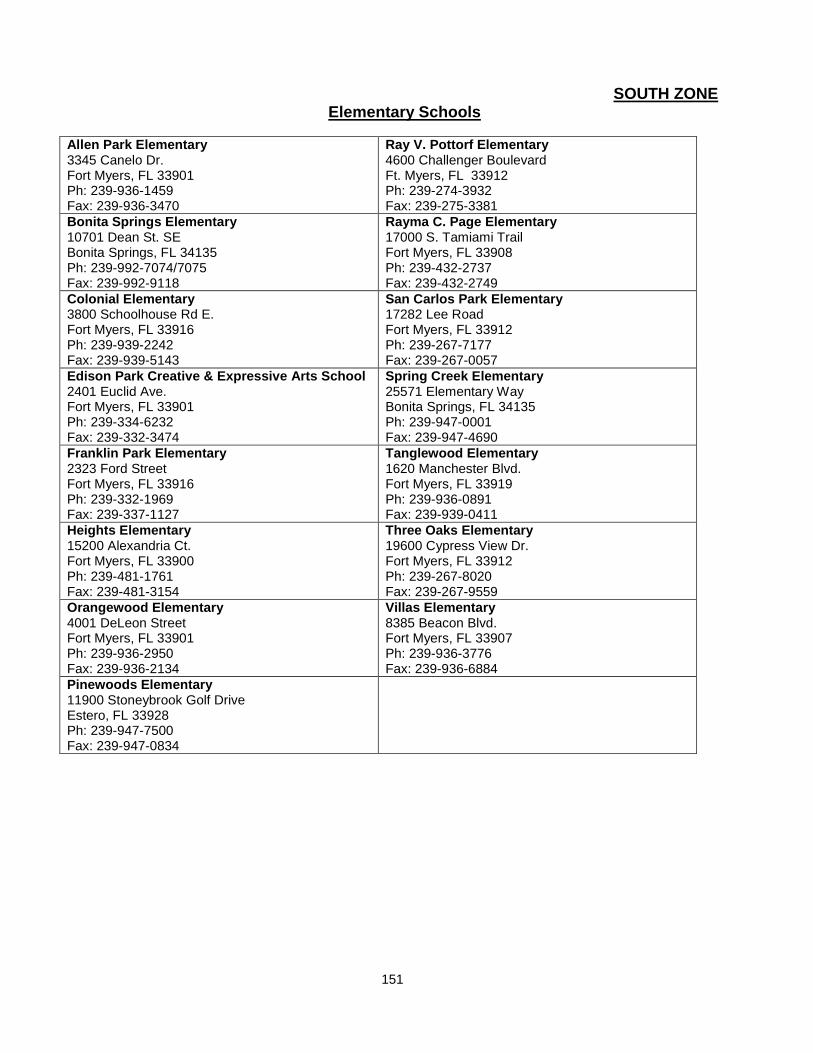
151
SOUTH ZONE Elementary Schools
Allen Park Elementary 3345 Canelo Dr. Fort Myers, FL 33901 Ph: 239-936-1459 Fax: 239-936-3470
Ray V. Pottorf Elementary 4600 Challenger Boulevard Ft. Myers, FL 33912 Ph: 239-274-3932 Fax: 239-275-3381
Bonita Springs Elementary 10701 Dean St. SE Bonita Springs, FL 34135 Ph: 239-992-7074/7075 Fax: 239-992-9118
Rayma C. Page Elementary 17000 S. Tamiami Trail Fort Myers, FL 33908 Ph: 239-432-2737 Fax: 239-432-2749
Colonial Elementary 3800 Schoolhouse Rd E. Fort Myers, FL 33916 Ph: 239-939-2242 Fax: 239-939-5143
San Carlos Park Elementary 17282 Lee Road Fort Myers, FL 33912 Ph: 239-267-7177 Fax: 239-267-0057
Edison Park Creative & Expressive Arts School 2401 Euclid Ave. Fort Myers, FL 33901 Ph: 239-334-6232 Fax: 239-332-3474
Spring Creek Elementary 25571 Elementary Way Bonita Springs, FL 34135 Ph: 239-947-0001 Fax: 239-947-4690
Franklin Park Elementary 2323 Ford Street Fort Myers, FL 33916 Ph: 239-332-1969 Fax: 239-337-1127
Tanglewood Elementary 1620 Manchester Blvd. Fort Myers, FL 33919 Ph: 239-936-0891 Fax: 239-939-0411
Heights Elementary 15200 Alexandria Ct. Fort Myers, FL 33900 Ph: 239-481-1761 Fax: 239-481-3154
Three Oaks Elementary 19600 Cypress View Dr. Fort Myers, FL 33912 Ph: 239-267-8020 Fax: 239-267-9559
Orangewood Elementary 4001 DeLeon Street Fort Myers, FL 33901 Ph: 239-936-2950 Fax: 239-936-2134
Villas Elementary 8385 Beacon Blvd. Fort Myers, FL 33907 Ph: 239-936-3776 Fax: 239-936-6884
Pinewoods Elementary 11900 Stoneybrook Golf Drive Estero, FL 33928 Ph: 239-947-7500 Fax: 239-947-0834

152
SOUTH ZONE
Middle Schools
Bonita Springs Middle Center for the Arts 10141 W. Terry St. Bonita Springs, FL 34135 Ph: 239-992-4422 Fax: 239-992-9157
Lexington Middle 16351 Summerlin Road Fort Myers, FL 33908 Ph: 239-454-6130 Fax: 239-489-3419
Cypress Lake Middle 8901 Cypress Lake Drive Fort Myers, FL 33919 Ph: 239-481-1533 Fax: 239-481-3121
Paul L. Dunbar Middle 4750 Winkler Avenue Ext. Fort Myers, FL 33966 Ph: 239-334-1357 Fax: 239-334-7633
Fort Myers Middle Academy 3050 Central Ave. Fort Myers, FL 33901 Ph: 239-936-1759 Fax: 239-936-4350
Three Oaks Middle 18500 Three Oaks Parkway Fort Myers, FL 33912 Ph: 239-267-5757 Fax: 239-267-4007
High Schools
Bonita Springs High 21807 Bode Blvd Estero, FL 33928 Ph: 239-495-3022 Fax: 239-495-3042
Cypress Lake High 6750 Panther Lane Fort Myers, FL 33919 Ph: 239-481-2233 Fax: 239-481-6094
Dunbar High 3800 E. Edison Avenue Fort Myers, FL 33916 Ph: 239-461-5322 Fax: 239-461-5110
Estero High 21900 River Ranch Road Estero, FL 33928 Ph: 239-947-9400 Fax: 239-947-5017
Fort Myers High 2635 Cortez Boulevard Fort Myers, FL 33901 Ph: 239-334-2167 Fax: 239-334-3095
South Fort Myers High 14020 Plantation Road Fort Myers, FL 33912 Ph: 239-561-0060 Fax: 239-561-3612
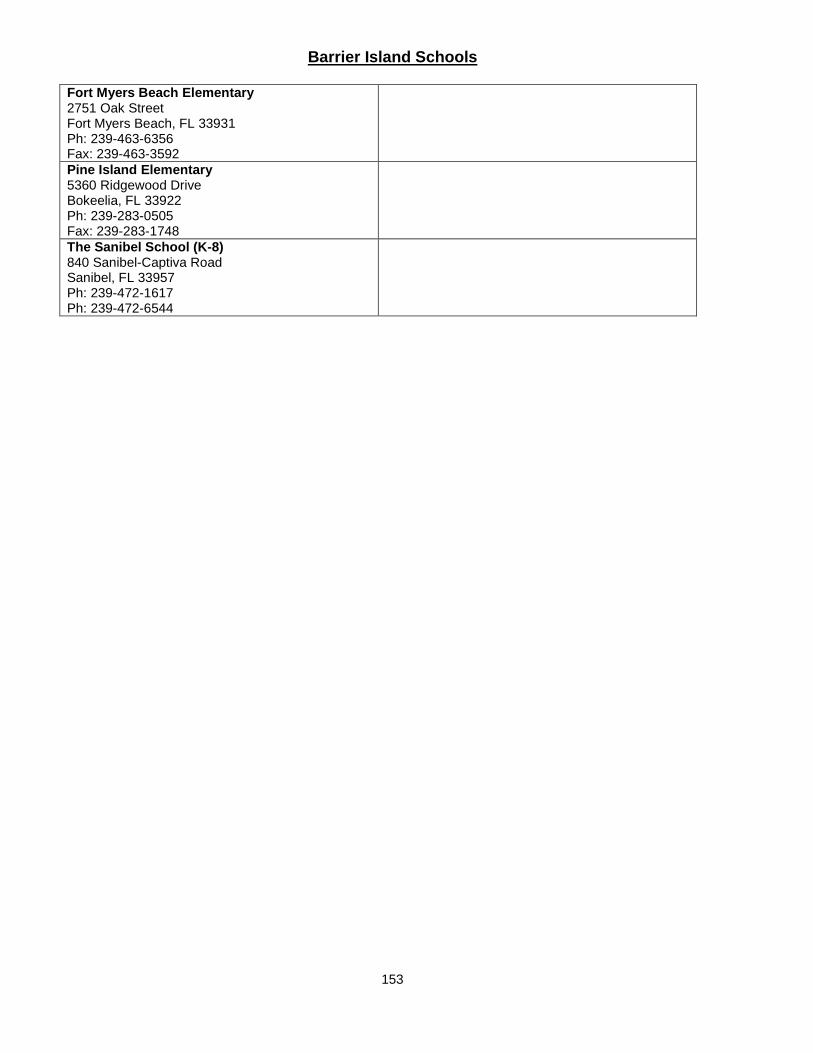
153
Barrier Island Schools
Fort Myers Beach Elementary 2751 Oak Street Fort Myers Beach, FL 33931 Ph: 239-463-6356 Fax: 239-463-3592
Pine Island Elementary 5360 Ridgewood Drive Bokeelia, FL 33922 Ph: 239-283-0505 Fax: 239-283-1748
The Sanibel School (K-8) 840 Sanibel-Captiva Road Sanibel, FL 33957 Ph: 239-472-1617 Ph: 239-472-6544

154
Special and Vocational Education Centers
Adult and Community Education 2855 Colonial Boulevard Fort Myers, FL 33966 Ph: 239-939-6310 Fax: 239-334-4568
Lee Virtual Instruction Program 2855 Colonial Boulevard Fort Myers, FL 33966 Ph: 239-337-8178 Fax:239-461-8451
AMIkids Southwest Florida 1190 Main Street Fort Myers Beach, FL 33931 Ph: 239-765-9696 Fax: 239-765-9688
PACE Center for Girls of Lee County 3800 Evans Avenue Fort Myers, FL 33901 Ph: 239-425-2366 Fax: 239-425-2365
Buckingham Exceptional Center 3291 Buckingham Road Fort Myers, FL 33905 Ph: 239-693-1233 Fax: 239-693-1690
Price Halfway House 2515 Ortiz Avenue Fort Myers, FL 33905 Ph: 239-332-6934 Fax: 239-332-2063
Cape Coral Technical College 360 Santa Barbara Boulevard N Cape Coral, FL 33993 Ph: 239-574-4440 Fax: 239-458-3721
Royal Palm Exceptional Center 3050 Indian Street Fort Myers, FL 33916 Ph: 239-337-3511 Fax: 239-337-3694
Dunbar Community School 1857 High Street Fort Myers, FL 33916 Ph: 239-334-2941 Fax: 239-334-3519
Success Academy 3650 Michigan Avenue Fort Myers, FL 33916 Ph: 239-334-3416 Fax: 239-334-7772
Early Childhood Learning Services 3650 Michigan Avenue, Suite 4 Fort Myers, FL 33966 Ph: 239-332-2512 Fax:239-334-2629
S.W. Florida Detention Center 2525 Ortiz Avenue Fort Myers, FL 33906 Ph: 239-332-6927 Fax: 239-332-6931
Ft. Myers Technical College 3800 Michigan Avenue Fort Myers, FL 33916 Ph: 239-334-4544 Fax: 239-332-4839
S.W. Florida Public Service Academy 4312 Michigan Avenue Fort Myers, FL 33905 Ph: 239-334-3897 Fax: 239-334-8794
Lee Adolescent Mothers Program (LAMP) 3650 Michigan Avenue, Suite 2 Fort Myers, FL 33616 Ph: 239-332-2526 Fax: 239-332-5028
Vince Smith Center 2450 Prince Street Fort Myers, FL 33916 Ph: 239-338-2306 Fax: 239-461-8451
Lee County Jail 2266 Second Street Fort Myers, FL 33901 Ph: 239-477-1764
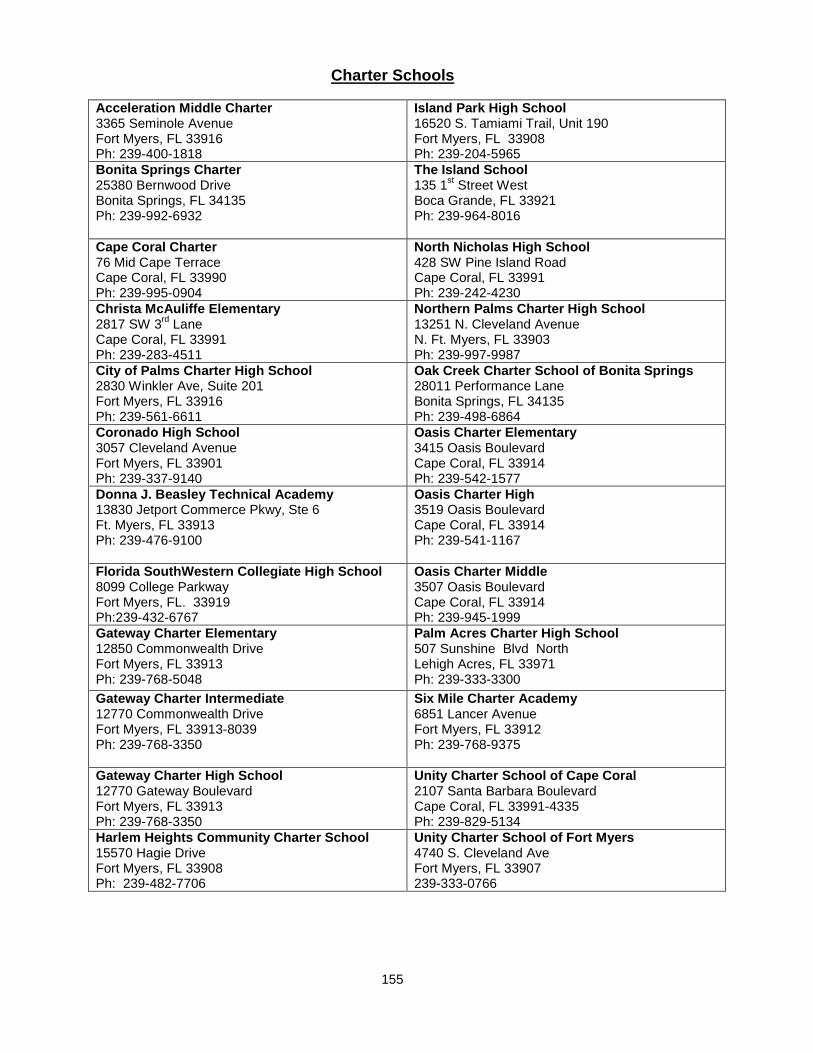
155
Charter Schools
Acceleration Middle Charter 3365 Seminole Avenue Fort Myers, FL 33916 Ph: 239-400-1818
Island Park High School 16520 S. Tamiami Trail, Unit 190 Fort Myers, FL 33908 Ph: 239-204-5965
Bonita Springs Charter 25380 Bernwood Drive Bonita Springs, FL 34135 Ph: 239-992-6932
The Island School 135 1st Street West Boca Grande, FL 33921 Ph: 239-964-8016
Cape Coral Charter 76 Mid Cape Terrace Cape Coral, FL 33990 Ph: 239-995-0904
North Nicholas High School 428 SW Pine Island Road Cape Coral, FL 33991 Ph: 239-242-4230
Christa McAuliffe Elementary 2817 SW 3rd Lane Cape Coral, FL 33991 Ph: 239-283-4511
Northern Palms Charter High School 13251 N. Cleveland Avenue N. Ft. Myers, FL 33903 Ph: 239-997-9987
City of Palms Charter High School 2830 Winkler Ave, Suite 201 Fort Myers, FL 33916 Ph: 239-561-6611
Oak Creek Charter School of Bonita Springs 28011 Performance Lane Bonita Springs, FL 34135 Ph: 239-498-6864
Coronado High School 3057 Cleveland Avenue Fort Myers, FL 33901 Ph: 239-337-9140
Oasis Charter Elementary 3415 Oasis Boulevard Cape Coral, FL 33914 Ph: 239-542-1577
Donna J. Beasley Technical Academy 13830 Jetport Commerce Pkwy, Ste 6 Ft. Myers, FL 33913 Ph: 239-476-9100
Oasis Charter High 3519 Oasis Boulevard Cape Coral, FL 33914 Ph: 239-541-1167
Florida SouthWestern Collegiate High School 8099 College Parkway Fort Myers, FL. 33919 Ph:239-432-6767
Oasis Charter Middle 3507 Oasis Boulevard Cape Coral, FL 33914 Ph: 239-945-1999
Gateway Charter Elementary 12850 Commonwealth Drive Fort Myers, FL 33913 Ph: 239-768-5048
Palm Acres Charter High School 507 Sunshine Blvd North Lehigh Acres, FL 33971 Ph: 239-333-3300
Gateway Charter Intermediate 12770 Commonwealth Drive Fort Myers, FL 33913-8039 Ph: 239-768-3350
Six Mile Charter Academy 6851 Lancer Avenue Fort Myers, FL 33912 Ph: 239-768-9375
Gateway Charter High School 12770 Gateway Boulevard Fort Myers, FL 33913 Ph: 239-768-3350
Unity Charter School of Cape Coral 2107 Santa Barbara Boulevard Cape Coral, FL 33991-4335 Ph: 239-829-5134
Harlem Heights Community Charter School 15570 Hagie Drive Fort Myers, FL 33908 Ph: 239-482-7706
Unity Charter School of Fort Myers 4740 S. Cleveland Ave Fort Myers, FL 33907 239-333-0766

Free school bus transportation is provided for students who live beyond two miles from their assigned school. Students residing in barrier island boundary areas of Fort Myers Beach, and Pine Island will attend their barrier island elementary school. Students residing in barrier island boundary area of Sanibel Island will attend their barrier island elementary and middle school.
WEST ZONEStudent Assignment Office
Cape Coral .................................................1Elementary Schools
Caloosa (U) ................................................5Cape ..........................................................6Diplomat (U) ..............................................8Gulf .........................................................16Hancock Creek ........................................17Hector A. Cafferata, Jr. (U) ........................40J. Colin English (U) (IB).............................19Littleton (U) ................................................9NFM Academy for the Arts (K-8) (A) (U) .....23Patriot ......................................................44Pelican .....................................................26Skyline ....................................................30Trafalgar (U) .............................................34Tropic Isles ..............................................38
Middle SchoolsCaloosa ......................................................3Challenger ................................................17Diplomat.....................................................5Gulf ...........................................................8Mariner (IB) ..............................................10NFM Academy for the Arts (K-8) (A) (U) ....23Trafalgar ..................................................13
High SchoolsCape Coral (IB) ..........................................1 Ida S. Baker (C) ........................................10Island Coast .............................................13Mariner .....................................................7North Fort Myers (A) (CA) ...........................8
SOUTH ZONEStudent Assignment Office
Fort Myers .................................................2Elementary Schools
Allen Park ..............................................1Bonita Springs (U) (A) ............................4Colonial (U) ............................................7Edison Park (A) ................................... 11Franklin Park (U) ................................. 13Heights (IB) .......................................... 18Orangewood ......................................... 25Pinewoods ........................................... 28Ray V. Pottorf ...................................... 41Rayma C. Page (U) ............................... 42San Carlos Park (U) (A) ........................ 29Spring Creek (U) .................................. 31Tanglewood .......................................... 33Three Oaks .......................................... 36Villas ................................................... 39
Middle SchoolsBonita Springs (A) ..................................2Cypress Lake (A) ....................................4Fort Myers Middle Academy (U) (T) ....... 16Lexington (IB) ...................................... 15Paul Laurence Dunbar ......................... 11Three Oaks (U) ..................................... 12
High SchoolsBonita Springs (9th grade only) ............ 14Cypress Lake (A) ....................................2Dunbar Zone Magnet (IB STEM) ............... 3Estero (CA) ............................................4Fort Myers (IB) .......................................5South Fort Myers (C) ............................ 11
EAST ZONEStudent Assignment Office
Lehigh Acres .............................................3Elementary Schools
Alva (K-8) .................................................2Bayshore (U) ............................................3Edgewood Academy (A) (U) ................... 10G. Weaver Hipps ...................................... 45Gateway ................................................15Harns Marsh .........................................43James Stephens Academy (U) ..................6Lehigh ...................................................20Manatee (U) ...........................................14Mirror Lakes (U) .....................................22Orange River (U) ....................................24River Hall (U) .........................................12Sunshine ...............................................32Tice (FL) .................................................37Tortuga Preserve (U)...............................46Treeline (U) ............................................35Veterans Park (K-8) (A) (U) .....................27
Middle SchoolsAlva (K-8) .................................................2Harns Marsh (STEM) (U) ........................28Lehigh Acres (U) .....................................14Oak Hammock (A) (U) ............................18Varsity Lakes (U)......................................7Veterans Park (K-8) (A) (U) .....................27
High SchoolsDunbar (IB STEM)......................................3East Lee County (C) (CA) ........................12Lehigh Senior (A) (CA) ..............................6Riverdale (IB) ...........................................9
(A) Arts Program; (C) Comprehensive Program; (IB) International Baccalaureate; (CA) Cambridge Program; (T) Technology Program;(STEM) Science, Technology, Engineering, Math; (FL) Foreign Language; (U) this school has a uniform clothing policy
THE SCHOOL DISTRICT OF LEE COUNTY
STUDENTASSIGNMENT
ZONES2017-2018
Elementary
Middle
Multi-LevelHigh
Multi-ZoneStudentAssignment Office
W-3
W-2
W-1
S-1
S-2
S-3
E-1
E-2E-3

The School District of Lee County
Mary Fischer District 1 (Chairman)
Jane E. Kuckel, PhD District 6 (Vice Chairman)
Melisa W. Giovannelli, District 2
Chris N. Patricca, District 3
Steven K. Teuber, District 4
Pamela H. LaRiviere, District 5
Cathleen O’Daniel Morgan, District 7
Dr. Gregory K. Adkins, Superintendent
www.leeschools.net
The School Board of Lee County, Florida, prohibits discriminationon the basis of age, color, disability, gender, national origin,
marital status, religion, or sexual orientation.
2855 Colonial BoulevardFort Myers, FL 33966-1012
(239) 334-1102

Division RequestEffective
DateDepartment
Unit Value moving forward
PositionWork Year
Pay Grade
Salary Sched
Vision 2020 Goal/Target
Superintendent New 9/6/2017 Communications 1.00 Coordinator - Communications 255 11 N 2.2Superintendent New 7/1/2017 Govt Relations and Community Eng 1.00 Executive Director 255 BSuperintendent New 7/1/2017 Govt Relations and Community Eng 1.00 Coordinator, Resource Development 255 BSuperintendent Reclassification 7/1/2017 Strategic Planning and Community 1.00 Executive Director to Director, Strategic Planning and Community 255 15 BAcademic Services New 9/6/2017 Academic Services 0.50 Community Program Administrator 255 12 BAcademic Services New 7/1/2017 Curriculum & Staff Dev - Elem 2.00 PD&L Specialist 226 I 1.3Academic Services New 7/1/2017 Curriculum & Staff Dev - Elem 1.00 Envir Ed Teacher on Special Assignment 196 I 1.3Academic Services Reclassification 7/1/2017 Curriculum & Staff Dev - Elem 1.00 Asst Principal on Assignment to Assistant Director 255 13 B 1.3Academic Services New 7/1/2017 Curriculum & Staff Dev - Second 2.00 PD&L Specialist 226 I 1.3Academic Services New 7/1/2017 Curriculum & Staff Dev - Second 1.00 Coordinator, Graduation 255 12 B 1.3Academic Services Reclassification 7/1/2017 Curriculum & Staff Dev - Middle 1.00 Coordinator to Director of Middle Level 255 15 BAcademic Services New 9/6/2017 Dept of Intervention 1.00 ESOL Compliance Specialist 255 6 C 1.3Academic Services New 7/1/2017 Dept of Intervention 1.00 Coordinator 255 12 B 1.3Academic Services New 9/6/2017 ESE 1.00 Teacher of the Visually Impaired 196 I 1.2Academic Services New 9/6/2017 ESE 1.00 Learning Resource Specialists for Inclusion 196 I 1.2Academic Services New 7/1/2017 ESE 1.00 Board Certified Behavior Analyst 196 I 1.2Academic Services New 7/1/2017 Health Services 2.20 School Nurse 196 I 3.5Academic Services New 9/6/2017 Psychological Services 1.00 TOA-Psychologists 206 IAcademic Services New 7/1/2017 Academic and Student Support Ser 1.00 Executive Director 255 BAcademic Services New 7/1/2017 Student Services 1.00 TCH Specialist Prevention 201 IAcademic Services New 7/1/2017 Student Welfare & Attendance 1.00 School Social Workers 196 I 2.1Business Services Deleted Position 7/1/2017 Internal Audit (0.50) Secretary to Director 255 6 NBusiness Services Reclassification 9/6/2017 Payroll 2.00 SPALC Secretary to Data Processor 255 5 N 3.3Human Resources New 7/1/2017 Human Resources 1.00 Coordinator Projects 255 12 B 3Human Resources New 7/1/2017 Professional Development & Recru 1.00 Assistant Director - Professional Development 255 13 BHuman Resources Reclassification 7/1/2017 Professional Development & Recru 1.00 Director Level II to Assistant Director of Recruitment 255 13 BHuman Resources New 7/1/2017 Professional Development & Recru 1.00 Executive Director Leadership, Professional Development and Re 255 M BHuman Resources New 7/1/2017 Professional Development & Recru 1.00 Secretary to Executive Director 255 7 NHuman Resources New 7/1/2017 Professional Development & Recru 2.00 Coordinator, Professional Development 255 12 BHuman Resources New 7/1/2017 Professional Development & Recru 4.00 Professional Development Coach 226 IHuman Resources New 9/6/2017 Professional Standards 1.00 Professional Standards & Equity Specialist 255 7 N 1.3Human Resources New 9/6/2017 Staffing & Talent Mgmt 1.00 Senior Manager 255 13 N 3.1Operations Reclassification 9/6/2017 Transportation 4.00 Clerk Typist (186 day) to Customer Service Rep (255 Day) 255 6 NInformation Systems Reclassification 7/1/2017 Infrastructure Services 1.00 Director Level I to Executive Director of Infrastructure services 255 M B
Information Systems New 9/6/2017 Innovation Services (ERP) 1.00 Analyst 255 12 N 4.2
Operations Deleted Position 7/1/2017 Facilities and Planning Developmen (1.00) Director of Facilities and Planning Development 255 15 NOperations Reclassification 9/6/2017 Facilities and Planning Developmen 1.00 Facilities Engineer to Senior Facilities Engineer 255 13 BBusiness Services New 7/1/2017 Food Service 1.00 Food & Nutrition Supervisor - Marketing & communications 255 10 N 4.5Business Services New 7/1/2017 Food Service 3.72 Food & Nutrition Traveling Food Service Worker 190 3 C 3.3Business Services New 7/1/2017 Food Service 3.00 Quality & Production Training Manager 196 8 N 4.5Academic Services New 7/1/2017 Curriculum & Staff Dev - Elem 1.00 PD&L Specialist 226 I 1.3Academic Services New 7/1/2017 Curriculum & Staff Dev - Secondary 1.00 PD&L Specialist 226 I 1.3Academic Services New 7/1/2017 ESE 1.00 Coordinator, ESE 255 12 B 1.2Academic Services New 9/6/2017 ESE 1.00 Learning Resource Specialists for Pre-K Classroom Support 196 I 1.2Academic Services New 9/6/2017 ESE 1.00 Staffing Specialist 196 I 1.2Academic Services New 9/6/2017 ESE 1.00 Learning Resource Specialists for Behavior 226 I 1.2Academic Services Reclassification 9/6/2017 ESE 1.00 Support Specialist - Change in work year from 255 to 216 216 5 C 1.3Academic Services New 7/1/2017 ESE 1.00 Board Certified Behavior Analyst 196 I 1.2Academic Services New 7/1/2017 Title I 1.00 ESOL Specialist TOA 196 I 1.3Academic Services New 9/6/2017 Early Childhood 1.00 Social Worker 196 I 1.2Academic Services New 9/6/2017 Early Childhood 1.00 Support Specialist 255 5 CAcademic Services New 9/6/2017 Early Childhood 1.00 Ed Para 187 5 C 1.2Academic Services Reclassification 9/6/2017 Early Childhood 0.80 Bookkeeper (216 day) to Accounting Clerk I (255 day) 255 6 CAcademic Services Reclassification 9/6/2017 Early Childhood 0.15 Bookkeeper (216 day) to Accounting Clerk I (255 day) 255 6 CAcademic Services Reclassification 9/6/2017 Early Childhood 0.05 Bookkeeper (216 day) to Accounting Clerk I (255 day) 255 6 CAcademic Services Reclassification 9/6/2017 Early Childhood 0.19 Social Worker (206 day) to Social Worker (196 day) 196 IAcademic Services Reclassification 9/6/2017 Early Childhood 0.31 Social Worker (206 day) to Social Worker (196 day) 196 IAcademic Services Reclassification 9/6/2017 Early Childhood 0.17 Social Worker (206 day) to Social Worker (196 day) 196 IAcademic Services Reclassification 9/6/2017 Early Childhood 1.00 Nurse LPN to Nurse RN 196 I 1.2Academic Services Reclassification 9/6/2017 Early Childhood 3.00 Nurse LPN to Early Childhood Family Advocate 187 6 C 1.2Academic Services Reclassification 7/1/2017 Early Childhood 0.63 Para HS Instructor to Teacher 196 I 1.1Academic Services Reclassification 7/1/2017 Early Childhood 0.37 Para HS Instructor to Teacher 196 I 1.1
FY18 REQUESTED POSITIONS CHANGES

ESE 524 Page 1
Please return completed form to: Florida Department of Education Office of Funding & Financial Reporting 325 West Gaines Street, Room 814 Tallahassee, Florida 32399-0400
FLORIDA DEPARTMENT OF EDUCATION RESOLUTION DETERMINING
REVENUES AND MILLAGES LEVIED
RESOLUTION OF THE DISTRICT SCHOOL BOARD OF LEE COUNTY, FLORIDA, DETERMINING THE AMOUNT OF REVENUES TO BE PRODUCED AND THE MILLAGE TO BE LEVIED FOR THE GENERAL FUND, FOR THE DISTRICT LOCAL CAPITAL IMPROVEMENT FUND AND FOR DISTRICT DEBT SERVICE FUNDS FOR THE FISCAL YEAR BEGINNING JULY 1, 2017, AND ENDING JUNE 30, 2018.
WHEREAS, section 1011.04, Florida Statutes, requires that, upon receipt of the certificate of the property appraiser giving the assessed valuation of the county and of each of the special tax school districts, the school board shall determine, by resolution, the amounts necessary to be raised for current operating purposes and for debt service funds and the millage to be levied for each such fund, including the voted millage; and WHEREAS, section 1011.71, Florida Statutes, provides for the amounts necessary to be raised for local capital improvement outlay and the millage to be levied; and WHEREAS, the certificate of the property appraiser has been received; THEREFORE, BE IT RESOLVED by the district school board that the amounts necessary to be raised as shown by the officially adopted budget and the millages necessary to be levied for each school fund of the district for the fiscal year are as follows:
1.
b) Description of levy
$ 81,973,613,642 $ 347,279,575 4.4130 mills
Prior-Period Funding$ mills
Total Required Millage $ 348,696,080 4.4310 mills
2.
b) Description of levy
$ 81,973,613,642 $ 58,863,613 0.7480 mills
3.
b) Description of levy
$ $ mills
$ mills
Required Local Effort
a) Certified taxable value
DISTRICT SCHOOL TAX (nonvoted levy)
Additional Operating
Discretionary Operating
Adjustment Millage
d) Millage levy
d) Millage levya) Certified taxable value
a) Certified taxable value
s. 1011.73(1), F.S.
Additional Capital Improvement
s. 1011.71(1), F.S.
ss. 1011.71(9) and 1011.73(2), F.S.
DISTRICT SCHOOL TAX DISCRETIONARY MILLAGE (nonvoted levy)
DISTRICT SCHOOL TAX ADDITIONAL MILLAGE (voted levy)
c) Amount to be raised
c) Amount to be raised
1,416,505 0.0180
c) Amount to be raised
d) Millage levy
s. 1011.62(4), F.S.
s. 1011.62(4)(e), F.S.
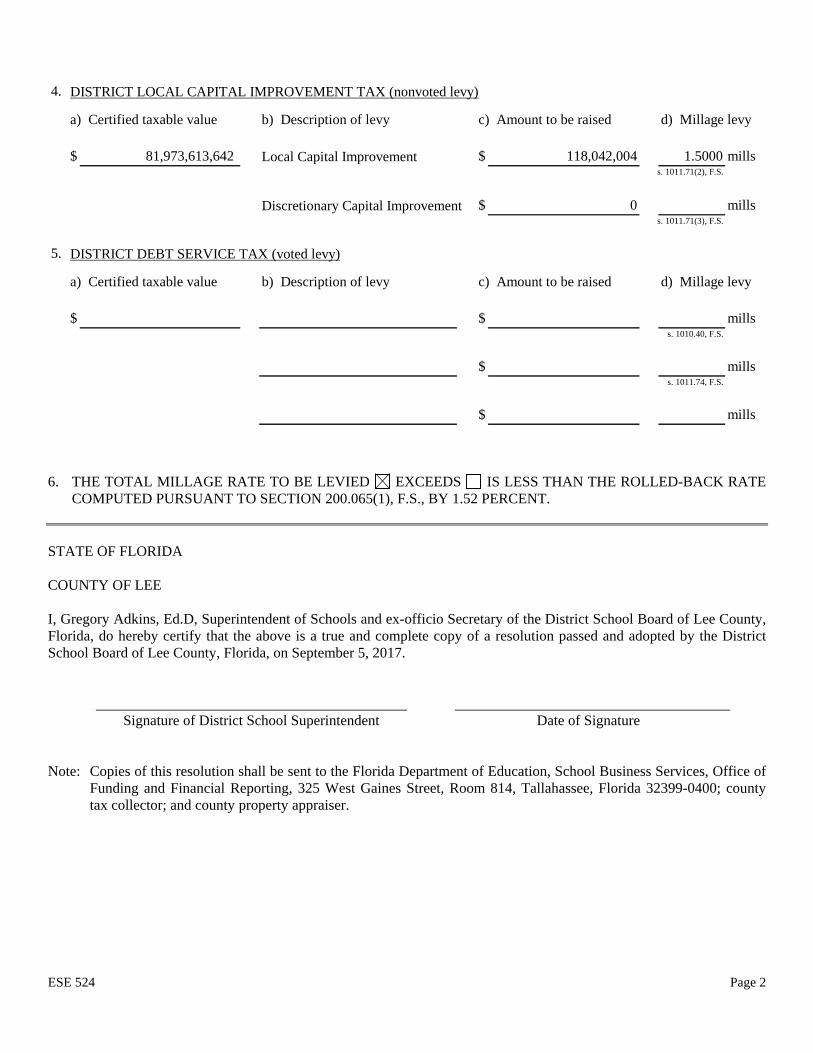
ESE 524 Page 2
4.
b) Description of levy
$ 81,973,613,642 $ 118,042,004 1.5000 mills
$ 0 mills
5.
b) Description of levy
$ $ mills
$ mills
$ mills
DISTRICT LOCAL CAPITAL IMPROVEMENT TAX (nonvoted levy)
DISTRICT DEBT SERVICE TAX (voted levy)
a) Certified taxable value
a) Certified taxable value
Local Capital Improvement
Discretionary Capital Improvement
c) Amount to be raised
s. 1010.40, F.S.
s. 1011.74, F.S.
c) Amount to be raised
d) Millage levy
d) Millage levy
s. 1011.71(2), F.S.
s. 1011.71(3), F.S.
6. THE TOTAL MILLAGE RATE TO BE LEVIED EXCEEDS IS LESS THAN THE ROLLED-BACK RATE
COMPUTED PURSUANT TO SECTION 200.065(1), F.S., BY 1.52 PERCENT. STATE OF FLORIDA COUNTY OF LEE I, Gregory Adkins, Ed.D, Superintendent of Schools and ex-officio Secretary of the District School Board of Lee County, Florida, do hereby certify that the above is a true and complete copy of a resolution passed and adopted by the District School Board of Lee County, Florida, on September 5, 2017. Signature of District School Superintendent Date of Signature Note: Copies of this resolution shall be sent to the Florida Department of Education, School Business Services, Office of
Funding and Financial Reporting, 325 West Gaines Street, Room 814, Tallahassee, Florida 32399-0400; county tax collector; and county property appraiser.
Vision: To be a world-class school system
The School District of Lee County 2855 Colonial Blvd. Fort Myers, Florida 33966 www.leeschools.net
Mary Fischer Chairman, District 1
Jane E. Kuckel, PhD Vice Chairman, District 6
Melisa W. Giovannelli District 2
Chris N. Patricca District 3
Steven K. Teuber District 4
Pamela H. LaRiviere District 5
Cathleen O'Daniel Morgan District 7
Gregory K. Adkins, Ed. D. Superintendent
Keith B. Martin, Esq. Board Attorney
A RESOLUTION OF THE LEE COUNTY SCHOOL BOARD ADOPTING THE FINAL MILLAGE RATES FOR
FISCAL YEAR 2017-2018 WHEREAS, the School Board of Lee County, Florida, did, pursuant to Chapters 200 and 1011, Florida Statutes, approve final millage rates for the fiscal year July 1, 2017 to June 30, 2018; and WHEREAS, at the public hearing and in full compliance with Chapter 200, Florida Statutes, the Lee County School Board adopted the final millage rates for fiscal year 2017-2018 in the amounts of: Proposed Amount Millage Levy To Be Raised Required Local Effort including Prior Period Funding Adjustment 4.431 $ 348,696,080 Basic Discretionary Operating 0.748 $ 58,863,613 Capital Outlay 1.500 $ 118,042,004 The total millage rate to be levied exceeds the roll-back rate by 1.52 percent. NOW THEREFORE, BE IT RESOLVED: That the Lee County School Board, adopted each final millage rate for the fiscal year July 1, 2017 to June 30, 2018 on September 5, 2017 by separate vote prior to adopting the final budget. ________________________ Board Representative

Vision: To be a world-class school system
The School District of Lee County 2855 Colonial Blvd. Fort Myers, Florida 33966 www.leeschools.net
Mary Fischer Chairman, District 1
Jane E. Kuckel, PhD Vice Chairman, District 6
Melisa W. Giovannelli District 2
Chris N. Patricca District 3
Steven K. Teuber District 4
Pamela H. LaRiviere District 5
Cathleen O'Daniel Morgan District 7
Gregory K. Adkins, Ed. D. Superintendent
Keith B. Martin, Esq. Board Attorney
RESOLUTION OF THE LEE COUNTY SCHOOL BOARD ADOPTING THE FINAL BUDGET FOR
FISCAL YEAR 2017-2018
WHEREAS, the School Board of Lee County, Florida, did, pursuant to Chapters 200 and 1011, Florida Statutes, approve final millage rates and final budget for the fiscal year July 1, 2017 to June 30, 2018; and
WHEREAS, the Lee County School Board set forth the appropriations and revenue estimate for the Budget for fiscal year 2017-2018.
WHEREAS, at the public hearing and in full compliance with Chapter 200, Florida Statutes, the Lee County School Board adopted the final millage rates and the budget in the amount of $1,508,771,993 for fiscal year 2017-2018. NOW THEREFORE, BE IT RESOLVED: That the attached budget of Lee County School Board, including the millage rates as set forth therein, is hereby adopted by the School Board of Lee County, on September 5, 2017, as a final budget for the categories indicated for the fiscal year July 1, 2017 to June 30, 2018. ________________________ Board Representative