Embed Size (px)
Citation preview


€fx iniu mivwiiwis

Digitized by the Internet Archive in 2019 with funding from
University of Alberta Libraries
https://archive.org/details/Roshak1973


THE UNIVERSITY OF ALBERTA
RELEASE FORM
NAME OF AUTHOR John Roshak
TITLE OF THESIS Some additional correlates
of complexity
DEGREE FOR WHICH THESIS WAS PRESENTED M. Ed.
YEAR THIS DEGREE GRANTED Spring, 1973
Permission is hereby granted to THE UNIVERSITY OF
ALBERTA LIBRARY to reproduce single copies of this
thesis and to lend or sell such copies for private,
scholarly or scientific research purposes only.
The author reserves other publication rights, and
neither the thesis nor extensive extracts from it may
be printed or otherwise reproduced without the author's
written permission.

%
>1
A
f
-V v

THE UNIVERSITY OF ALBERTA
SOME ADDITIONAL CORRELATES OF COMPLEXITY
by
JOHN ROSHAK
A THESIS
SUBMITTED TO THE FACULTY OE GRADUATE STUDIES AND RESEARCH
IN PARTIAL FULFILMENT OF THE REQUIREMENTS FOR THE DEGREE
OF MASTER OF EDUCATION
DEPARTMENT OF EDUCATIONAL PSYCHOLOGY
EDMONTON, ALBERTA
SPRING, 1973

. '■
’* • •
,

THE UNIVERSITY OP ALBERTA
FACULTY OF GRADUATE STUDIES AND RESEARCH
The undersigned certify that they have read,
and recommend to the Faculty of Graduate Studies and
Research, for acceptance, a thesis entitled MSome
Additional Correlates of Complexity” submitted by
John Roshak in partial fulfilment of the requirements
for the degree of Master of Education.


ABSTRACT
The correlation "between cognitive complexity and
certain environmental variables was examined using
396 Education freshmen, in order to develop a
nonpsychometric predictor of cognitive complexity as
an aid to teacher-trainee selection.
It was expected to find significant correlations
between cognitive complexity and Ss’ (l)sex, (2) faculty
of re-registration, (3) home address, (4) religion, (5)
country of birth, (6) continuity of education, (7) living
at home while attending university vs. living away from
home, (8) father’s occupation and (9) socio-economic status.
The only hypotheses supported were that Ss of foreign
birth tended to be more complex than j3s of Canadian birth
and that _Ss living away from home while attending univer¬
sity tended to greater complexity than those living at
home.
These results were explained in terms of content
domain specificity of the instrument used, and supporting
evidence was presented for this contention through the
use of another instrument.
It was concluded that, while the prediction of
cognitive complexity was not possible for the instruments
and other variables of the present study, the general
approach was worthy of possible further consideration.


TABLE OP CONTENTS
CHAPTER PACE
I. INTRODUCTION. 1
II. HYPOTHESES.16
III. METHOD. 22
IY. RESULTS.25
V. DISCUSSION.30
REFERENCES.37
APPENDIX 1
APPENDIX 2


LIST OP TABLES
TABLE I. Relationship between Religious
Behaviour and System Membership.15
TABLE II. Correlations between Cognitive
Complexity on the SAffT and CST with
Other Variables: Total Sample.26

i

CHAPTER I
INTRODUCTION
The success of a society is dependent upon the ability
of its members to function within it. As a society grows
more complex, this ability becomes increasingly dependent
upon the ability of the members of the society to deal
with increasingly larger amounts of data. In our society
the task of equipping its individual members with the
ability to deal with ever-increasing complexity, with ever-
increasing amounts of data, is largely entrusted to the
schools.
In this paper, we will attempt to define the type of
individual who can function in increasingly complex
situations, consider some of the factors that lead to the
formation of this type of individual, and attempt to
develop a method of selecting teachers who will be capable
of educating at least a portion of their students to the
point of fulfilling these criteria.
The search for the type of individual described is
not new. Terman, in his monumental G-enetic Studies of
Genius (1925-1959), defined the intelligent person as one
who was able to make use of concepts, to relate them to
one another (1956). A^s words are the tools most frequently
used in conceptual manipulation, Terman chose an instrument
strongly dependent on vocabulary to measure the range of
conceptual manipulation of which an individual was capable,
but did not concern himself with the ability to form novel


2
insights on the basis of material available.
Barron (1953) entered the area via an attempt to
construct a non-verbal analogue to the MMPI, but his
final instrument bore a closer resemblance to the Graves
Design Test (1959). Bindings for this study indicated
that Mcomplex" individuals—i.e. those who preferred
subtlety and asymmetry among the various stimulus figures—
tended to show greater creativity, flexibility of thought,
than those Ss who chose simple designs. "Complex" j3s
tended to be less dogmatic than "simple" £>s, but at the
same time resisted social pressure to conform in their
opinions in a social pressure situation. While the content
of Barron’s major instrument was concerned with esthetic
judgement, his "simple" and "complex" J3s bear considerable
resemblance to Harvey, Hunt & Schroder’s (1961) System 1
and 4 representatives, respectively.
A study of creativity vs. intelligence by Getzels &
Jackson (1962) showed one finding of interest here: while
the parents of both high intelligence and high creative
children showed more than average concern and gave more
than average care, the parents of the former group tended
to give far more direction to their children’s activities,
effecting control chiefly by means of approval/approval-
withdrawal; parents of the latter group tended to be
supportive of their children’s endeavours without a
concomitant superposition of their own values on the

1 ■
*» J . .
‘ . •
*
t
‘
... >*' *
A

3
direction of these efforts.
Harvey (1966), Harvey, Hunt & Schroder (1961) and
Schroder, Driver & Streufert (1967) investigated the area
o£ variously, cognitive/conceptual/integrative complexity—
an area closely related to the two lines of research
discussed above. Harvey ert al.(1961) were concerned with
those aspects of cognitive function that have to do with
the differentiation and integration of concepts. The
process was seen to be multi-dimensional and saccadic; the
most important dimension was held to be concreteness-
abstractness . These workers sought to
. . .demonstrate that in the progressive development from a state of conceptual undifferentiation to differentiation and integration, from greater concreteness to increased abstractness, the conceptual system tends to pass through certain plateus or stages of varying time and breadth. . . the individual first evolves concepts that he applies categorically and absolutely; then he passes through a state of negativism and self- assertion to the development of sympathy role- playing and taking turns on to a state of higher independence and relativism marked by greater self-sufficiency and adequacy in coping with complexity and change. . .
(Harvey, 1966, p. 44)
Harvey et al. (1961) presented extensive theoretical
and empirical bases from which four stages along the
developmental continuum described above were drawn.
Each stage was treated as a different conceptual system,
assumed to represent nodal points or ranges on the
continuous dimension between concreteness and abstractness.

■
*

4
The salient characteristics of these four Systems may be
summed up as follows (after Cornfield, 1967 and Harvey, 1966).
System 1 functioning, which lies toward the concrete
end of the concreteness-abstractness continuum of modes
of construing and relating to the world, is characterised
by high absolutism and closedness of beliefs; high
evaluativeness; high positive (sic ) dependence on
representatives of institutional authority; high identi¬
fication with social roles and status positions; high
conventionality; high etiinocentrism. In many respects,
System 1 functioning is related to the syndrome of
authoritarianism. Membership within this System is
assumed to evolve from a training history in which the
individual has been restricted in exploration of his
environment, especially that part of his world concerned
with values and power relationships. Along with minimal
exposure to diversity in relation to social norms, the
individual’s rewards and punishments are contingent upon
his ideas and approaches to problems conforming to the
omnipotently and omnisciently imposed standards of the
training agent.
System 2 functioning, above System 1 in abstractness,
is characterised by a high drive toward autonomy, and
avoidance of dependence on God, tradition, and most of
the referents that serve as positive guides for System 1
individuals. System 2 representatives, more than persons

'
.

5
of any other System, seem to he in a psychological vacuum,
guided more by rebellion against social prescriptions than
by positive adherence to personally derived standards.
Membership within this System is assumed to be a result of
capricious and arbitrary child-rearing practises which,
owing to failure to provide any stable or predictable
referent points in an unstructured world, present the
developing child with a diversity far in excess of the
optimal. While such vacillation and varied inputs tend to
result in higher differentiation than the training
environment of System 1 functioning, it also produces
deep feelings of uncertainty, distrust of authority,
rejection of the more socially approved guidelines to
action, while at the same time other stable referents
are lacking.
System 3 functioning, the next to highest level of
abstractness, is characterised by the development of
fairly high skills in effecting desired outcomes through
techniques of having others bring about these desired ends.
While oriented toward establishing dependencies on others
to avert the helplessness that would result from being
placed on his own, the System 3 representative nonetheless
develops more autonomous internal standards, especially in
the social sphere, than does the System 1 individual, and
more positive ties to the prevailing social norms than
does the System 2 person. Membership in System 3 is
*

6
assumed to evolve from a history of childhood over-
protection and over-indulgence which, with one or both
parents serving as a buffer between the individual and
environmental demands, prevents the child from exploring
his physical world and restricts the explorations of his
social world to activity relating to manipulating people
through dependency upon them.
The System 4 individual, who functions toward the
abstract end of the concreteness-abstractness continuum,
comes to have a highly integrated cognitive structure,
and is consequently more flexible, more creative and
more reflective in thought and action than are the members
of other Systems. More than persons of any of the other
Systems, the System 4 individual has a set of internal
standards that are more truly independent of external
criteria, in some cases coinciding with social definitions
and in others not. Membership within this System is
assumed to be the consequence of childhood freedom to
explore both the social and physical aspects of one’s
environment, to establish and to rely upon values
derived from one’s own experience and thought, and to
solve problems and evolve solutions without fear of
punishment for deviating from established truth. The
System 4 representative is the recipient of diversity
along with stability as a developing child, and is of
high perceived self-worth despite momentary frustrations
■
-

7
and deviation from the normative.
It is of interest that Systems 3 and 4 of Harvey
et al. (1961) coincide closely to the descriptions given
by Getzels & Jackson (1962) of high I. Q. and high
creativity individuals, respectively. Also of interest
is that the factors listed by both groups of researchers
as being of importance in the formation of these individuals
are in close agreement, to the point where one may equate
at least some of the efforts in the study of creativity
with parallel lines of research into complexity.
At this point it may be advisable to pause to examine
some of the factors that influence complexity, with a view
to later integration of these data with some of the fore¬
going in an effort to develop criteria for the screening
and identification of teacherrcandidates who are likely
to increase the complexity of their students.
The descriptions of the Systems of Harvey et al. (1961)
listed a number of factors that influence the complexity of
the individual. Little control can be exercised over those
factors that are a part of the home environment, but there
are indications that teacher behaviour does have influence
on pupil complexity. Getzels & Jackson (1962), Pavlovich
(1970) and Reynolds (1970) have variously reported that
pupils of creative/complex teachers tend to acquire this
trait. Unfortunately, other studies indicate that complex
teachers are rare: Harvey, Prather, White & Hoffmeister

8
(1968) found that out of 67 elementary teachers, some 50
belonged to System 1 (very concrete) while only 8 were
"weak instances’1 of System 4- (highly complex). The effects
on teaching performance of such a preponderance of simple
teachers may be deduced in part from a study by Joyce,
Lamb & Sibol (1966), who concluded, in part, that the
reason why teacher trainees are often unable to make
effective decisions when presented with behavioural data
may well be cognitive simplicity. Studies with complex
teachers (Harvey, White, Prather, Alter & Hoffmeister, 1966;
Harvey et_ al. , 1968), on the other hand, have indicated that
abstract teachers were more resourceful, less dictatorial
and less punitive than concrete teachers. The students of
the more complex teachers tended to be more involved, more
active, higher in achievement, and more abstract than those
of concrete teachers.
Individuals who differ in cognitive complexity are
also likely to differ over a considerable range of
behaviours. Various researchers have found that the level
of cognitive complexity relates to decision-making
behaviour (Sieber & Lanzetta, 1964, 1966; Stager, 1967);
problem-solving (Karlins, Coffman, Lamb & Schroder, 1967;
Sieber, 1964); and the toleration of stress (Driver, 1962;
Harvey & Ware, 1967). Harvey (1966) reported that Ss
of differing levels of complexity differed in cue
utilization, in the ability to change set, and in

•
l
' - -
•
«0
•
*
• »
•
*
1

9
creativity (pp. 54-55).
While the application of optimum amounts of stress
or environmental complexity will increase the level of
cognitive functioning of most individuals (Schroder, Driver,
& Streufert, 1967, p.40) up to a point, there is nothing
in the literature to indicate that the cognitive function
of an adult may he moved from the concrete to the abstract
with any degree of permanence. Nor are there any
indications that the cognitive function of an adult may
be shifted to a higher System. In the absence of any
available method of training teacher candidates for higher
complexity, the only avenue remaining if we wish to increase
the complexity of teachers is to select from the mass of
teacher trainee candidates those who are most complex, and
to screen out those who are most simple. A program of
testing each applicant for complexity would be possible,
but unwieldy. Par simpler in terms of time and cost would
be to examine the backgrounds of applicants for indicators
of cognitive complexity, and to use these indicators for
at least the initial screening.
Sex is one obvious source of possible variation, in
view both of the differing expectations of behaviour
assigned to the sexes and of the differing methods of
rearing applied to each sex. Little (1968, 1969) added
support for this contention in his finding that females
appear to be more complex than males when "psychological"

V
4

10
variables are considered, while males exhibit greater
complexity in dealing with material objects and events.
Support was added to the above contention by Rosen &
Connaway (1968) in their conclusion that categorizing
behaviour is susceptible to influence by instructions.
HInstruction” given to children may be expected to vary
not only with sex, but also with religion, socio-economic
status (Crliandi, 1969), sub-culture membership (Flores,
1969).
Attainment of concepts is dictated by the amount and
type of information available (Siegel, 1969), and the
latter factor is in turn influenced by a childrs home
environment, through which much information is filtered.
Both form and content of home environment are affected by
culture, socio-economic status, address, etc., insofar as
these latter factors affect information available. While
the effects that the foregoing factors may have on style
of child-rearing and consequent complexity of the adult
are largely self-evident, they are fairly well documented
in the literature (Harvey, 1966; Harvey _et al. , 1961;
Getzels & Jackson, 1962; Laing & Esterson, 1964; Qrliandi,
1969).
That problem-solving strategies used by simple and
complex individuals differ has been recognized, and the
question has been explored by Sieber & Lanzetta (1964),
with results largely in conformance with predictions made
f ' • I

11
by Harvey et al. (1961): persons having a history of
positive reinforcement for exploration of environments
and for elaboration of alternative means and goals of
problem solving will employ more complex strategies than
will persons who have been reinforced primarily for
employing strategies dictated by some other person. Later
support for this view was given by Biggs (1969), who added
in a discussion of coding and problem-solving strategies
that n. . . while there may be genetically determined
limits to the extent to which an individual can use these
strategies, it is also . . . clear that they are. . .
learnable, up to those limits.” That modeling may change
cognitive style (Rindberg, Parke & Hetherington, 1971)
points equally to the need for screening teacher candidates
and to the need to examine their school backgrounds: complex
candidates are likely to have had superior teachers. In
Alberta, where a chronic teacher shortage persisted until
only two years ago, it is likely that this factor will
be tied to candidates' addresses: teachers with a choice
of jobs prefer the higher pay and better working conditions
in urban schools in "good” districts, with the result that
deprived urban districts and rural schools, until recently,
were able to hire teachers who were demonstrably more poorly
qualified, or demonstrably poorer teachers, than those in
the cities.
That conditions of measurement of complexity will

1 '
-
• • ■' '
*

12
have a bearing on scores obtained has been posited by
Schroder et_ al. (1967), who held that arousal will have
an inverted U relationship to complexity. Miller (1968)
found that _Ss in a test situation were generally less
complex under stressful instructions: this being the case,
it may be supposed that adequate arousal is generated by
placement in a test situation, and that both instrument
and instructions selected should have as a criterion for
that selection that they be neutral or reassuring to Ss.
The ideal instrument to be used should perhaps not have
the format of a psychological test that might be used to
11 analyze" £>s, in their estimation.
fellas & G-aier (1970), along with earlier studies
by Barron (1953), Gough (1961) and MacKinnon (1961),
presented results that suggest strongly that the ideal
test stimuli for the measure of complexity are those that
are sufficiently ambiguous that the Sp may read into them
the degree of complexity that is optimum for them.
A possible candidate for such a stimulus situation
could be ranking/grouping/comparing nations, in that there
exist many possible criteria for comparison, the number of
which is limited only by the information-handling capacity
of the S. At the same time, there are within the culture
stereotypes of national characteristics, which present the
illusion of stimulus simplicity to those Ss who favour
this condition. One further advantage of the use of

.
V

13
nations as test stimuli in a complexity-measuring situation
is that there exists a substantial body of literature on
the use of this approach. Bower (1969), Driver (1962),
and Scott (1966? 1969), while employing different
techniques of analysis, have all reported success in
differentiating between levels of complexity using this
class of test stimuli. One weakness of this approach is
that the dimensionality of 2! judgement is affected by the
information he has: greater amounts of pertinent data
lead to greater complexity of judgement (Scott, 1962, 1963,
1969; Seferi, 1968). This point will be covered later,
under the discussion heading, but it seems not inappropriate
to mention it here.
The correlation found to exist between the complexity/
creativity of an individual and the field of endeavour
chosen by him (Maier, 1955; Maier & Hoffman, 1961) has
been found to hold true at the university undergraduate
level—Eisenman (1969) found that business majors tended
to be considerably less creative than English majors.
The latter result indicates that, if one wishes to increase
teacher complexity, it is appropriate to do so at the
university level. In the absence of adequate training
techniques, this may be accomplished by either attracting
more complex individuals to the teaching profession or by
screening out the less complex individuals from the mass
of applicants. If a significant correlation may be found

14
to exist between complexity and external criteria, the
tasks of attracting and screening may be much simplified
from what would be the case otherwise. Given a population
the characteristics of which are known, recruiting appeals
may be conducted with sufficient specificity to attract
mainly the desired individuals. Conversely, screening of
applicants on the basis of external criteria is much
simpler than is subjecting applicants to a battery of tests.
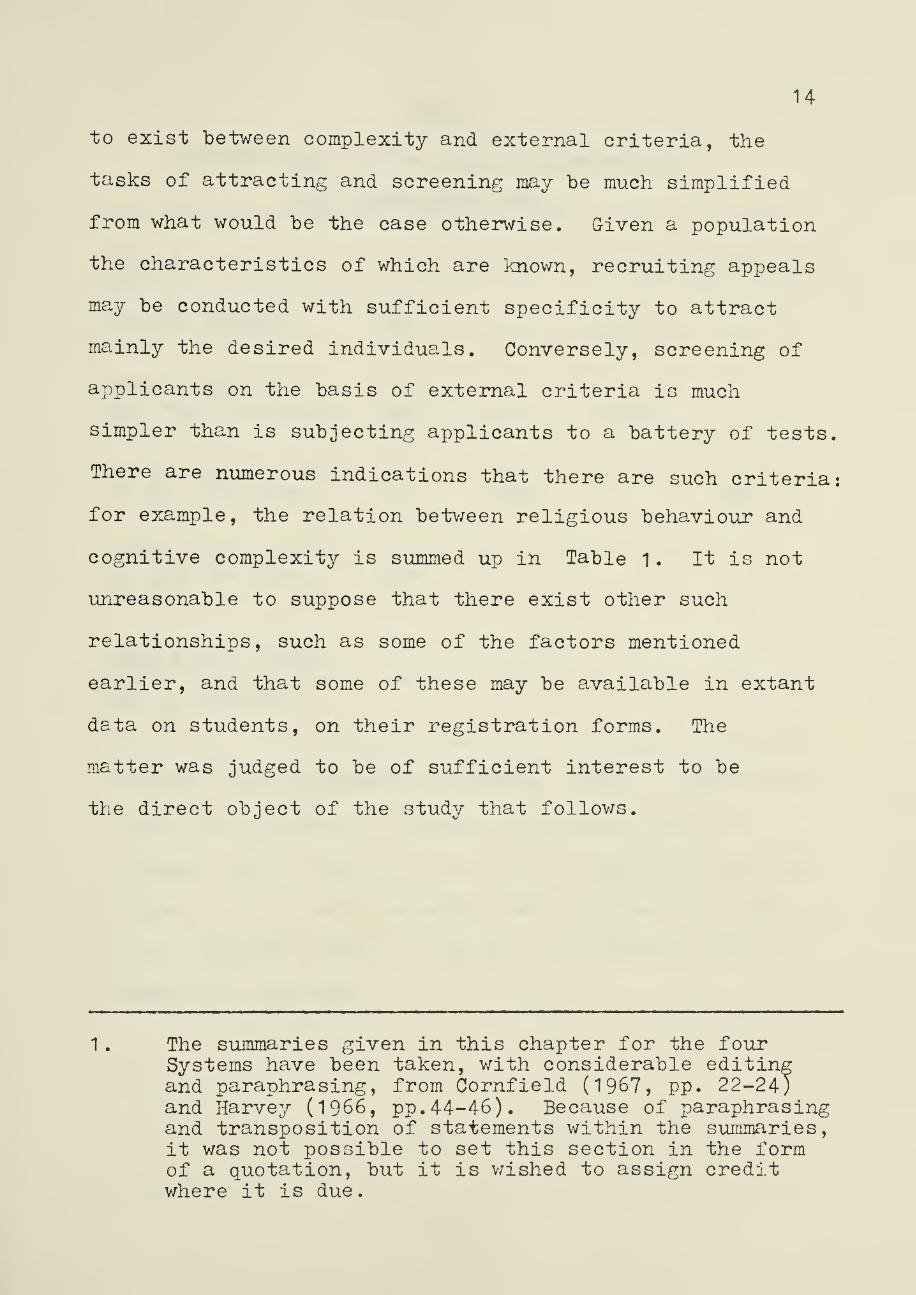
There are numerous indications that there are such criteria:
for example, the relation between religious behaviour and
cognitive complexity is summed up in Table 1. It is not
unreasonable to suppose that there exist other such
relationships, such as some of the factors mentioned
earlier, and that some of these may be available in extant
data on students, on their registration forms. The
matter was judged to be of sufficient interest to be
the direct object of the study that follows.
1 . The summaries given in this chapter for the four Systems have been taken, with considerable editing and paraphrasing, from Cornfield (1967, pp. 22-24; and Harvey (1966, pp.44-46). Because of paraphrasing and transposition of statements within the summaries, it was not possible to set this section in the form of a quotation, but it is wished to assign credit where it is due.
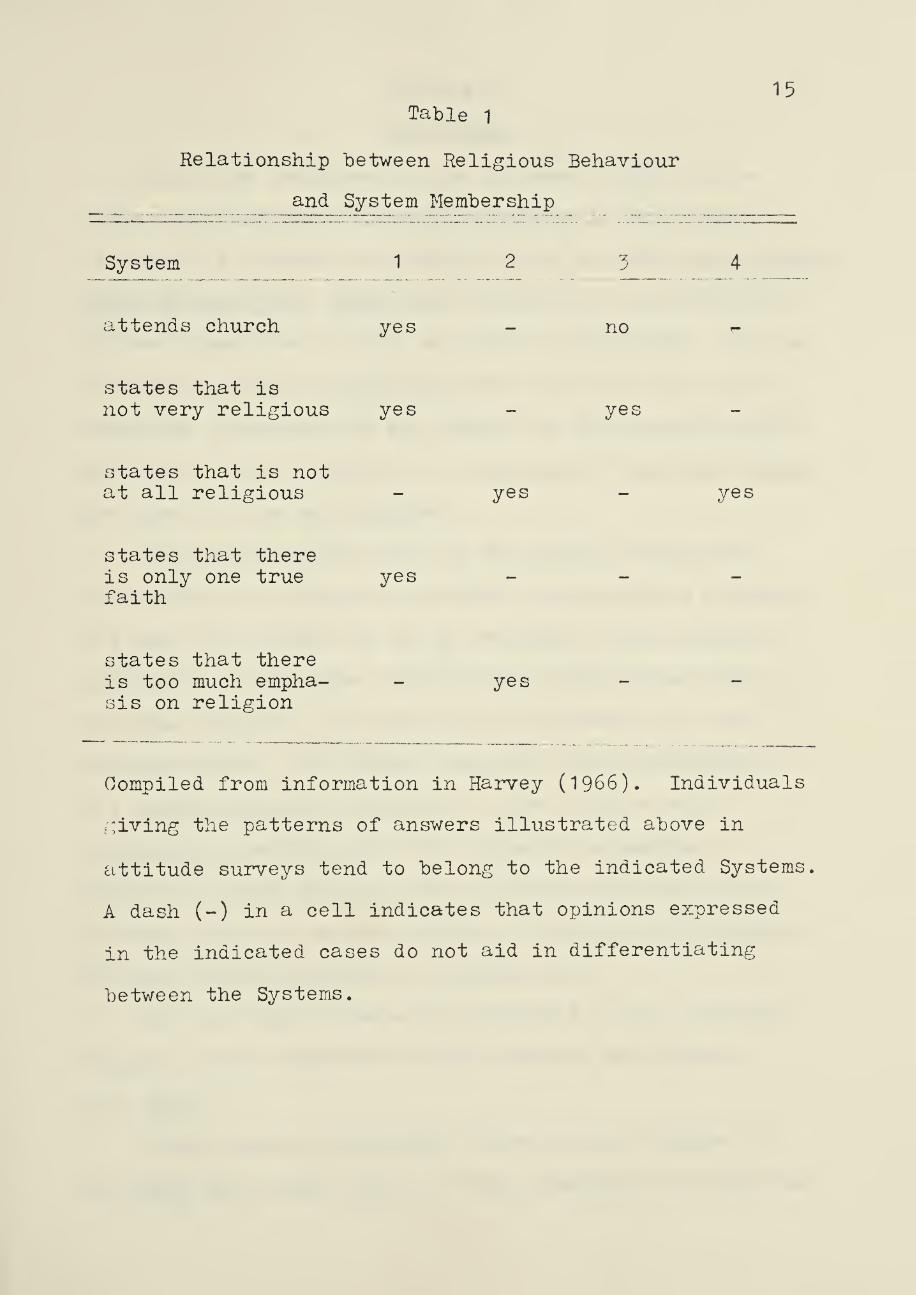
Table 1 15
Relationship between Religious Behaviour
and System Membership
System 1 2 ’X 4
attends church yes no
states that is not very religious yes yes
tates that is not at all religious yes yes
states that there is only one true yes faith
states that there is too much empha- - yes sis on religion
Compiled from information in Harvey (1966). Individuals
giving the patterns of answers illustrated above in
attitude surveys tend to belong to the indicated Systems.
A dash (-) in a cell indicates that opinions expressed
in the indicated cases do not aid in differentiating
between the Systems.

• ** ';
*
■ l
.
**
* »
< ■ • •
■*
■
*

CHAPTER II
HYPOTHESES
Among the instruments used by Bower (1969)* in a
study using freshmen Education students in the attempt
to isolate a general complexity factor was the Similarities
Among Rations Test (SANT)(See Appendix 1), an instrument
derived from Driver (1962) and Scott (1962-1969)* Scores
obtained by Bower on this test were used as a measure of
cognitive complexity of the sample for the present study.
Details of sample composition, scoring of tests and coding
are given in the next chapter.
The factors dealt with in the present study were
those obtainable from the students’ registration records:
(1) sex, (2) whether or not _Ss returned to the Faculty
of Education after the completion of their first year,
(3) home address, (4) religion, (5) Canadian vs. non-
Canadian birth, (6) whether education was interrupted,
(7) whether student continued to live at home while
attending university, and (8) father’s occupation.
Blishen's (1968) Revised Index of Socio-Economic Status
(9) was used as a measure of SES. Details on the coding
of these factors is given in Appendix 2.
On the basis of material presented in the previous
chapter, it was expected to find results as follows:
(1) Sex
Males would, in general, score as more complex on
the SANT than would females. This prediction is based on

«

17
work by Little (1968, 1969), who found that female
complexity was highest when dealing with interpersonal
variables, a universe of dimensions not of much use in the
present test situation. A significant positive correlation
between complexity as measured by the SANT (variance) score
and sex (0=female; 1=male) is expected.
(2) Faculty of Be-registration
Highly structured course settings may be expected to
appeal less to complex individuals than to those who are
accustomed to accept omniscient direction. It is expected
that a small negative correlation will be found between
return (=1) vs. non-return (=0) to Education for the term
following the one in which testing took place and measured
cognitive complexity. Only a small correlation is expected,
as factors such as economic exigency probably play a greater
role in determining continued enrollment than does interest.
(3) Home Address
Urban environments offer a greater variety of stimuli
relevant to the test situation than do small towns or
rural settings. It is thus expected that that there will
be a positive correlation between the size of the centre
in which the student was raised (l=rural; 4=large urban)
and his SANT-measured complexity.
(4) Religion
That religious behaviour is correlated with and
indicative of complexity has been established (cf. Table 1)

■

18
It is posited here that an extension of this principle
will also hold, that there is a positive correlation
between professed religion (sect, coded as 1=great
insistence on adherence to dogma; 9=low dogmatism) and
measured cognitive complexity. The more authoritarian
faiths, such as certain fundamentalist sects, demand of
their members unswerving belief in a set dogma; other
denominations are less rigid in this regard. The spectrum
of rigidity of dogma will, it is believed, be reflected
in the measured complexity of the communicants of the
various faiths.
(5) Birth
If Scott1s (1969) findings apply to informal learning
situations, exposure to more than one culture would tend
to increase the measured complexity of the S on the SANT.
Information about ethnic origin would have been of help
here, but this question is not asked on registration forms
after 1965. The remaining possible measure, the country
of birth, is not wholly satisfactory, since we are in
effect comparing a sub-population of individuals of a
multi-cultural background to a population which contains
an unknown proportion of individuals of a like background,
for this reason, we may expect at best to find only a
very small positive correlation between measured complexity
and foreign (=1) vs. Canadian (=0) birth.
One possible adjustment is the creation of an ad hoc

-
.
. •
0

19
sample consisting of Canadian-born £>s with Anglo-Saxon
surnames, and the subsequent comparison of this sample to
the foreign-born sample. This procedure will eliminate
most of the bias introduced by having an unknown proportion
of multi-cultural individuals in the standard population,
but will introduce the error of using only one sub-culture
out of the many in Alberta for a standard. Nonetheless,
it is expected that for the ad hoc sample the correlation
between foreign vs. Canadian birth and complexity will be
greater than in the former instance.
(6) Continuity of Education
Individuals who have interrrupted their education
may reasonably be expected to have been exposed to a
wider range of stimuli than have those who have maintained
a continuous school career. This exposure may be expected
to increase the complexity of affected £>s, and it is
expected that there will be a significant positive
correlation between continuous (=0) vs. interrupted (=1)
education and SANT-measured complexity.
(7) live Home?
Por any but an infant, new data from the home
environment are nearly nil. A person who lives away
from home, particularly, as in the case of many of the
present Ss, for the first time, will be exposed to new
data and/or to new relationships between known data.
Such a change may be expected to increase the measured

..
V
*
*

20
complexity of the affected Ss, and it is expected that
there will be a small positive correlation between
complexity and living at home (=0) vs. living away from
home (=1).
(8) Pather*s Occupation and (9) Blishen Scale
The last two variables to be considered in the
present study, father’s occupation and father’s socio¬
economic status (Revised Blishen Index, 1968), may be
considered together since the Blishen measure of SES is
derived from occupational categories. The major
distinction between the Blishen Index and the occupational
rating scale used for Father’s Occupation is that the
former is well-standardised, while the latter is an
experimental scale constructed for the present study
(see Appendix 2).
Since the range of data available to an individual
are to a considerable extent governed by the economic
and professional circumstances of his parents, it is
expected that a significant positive correlation will be
found, respectively, between father’s occupation (scaled
from 01=low to 69=high) and Blishen Index (1=low; 9=high),
and measured complexity. Details of both scales are given
in Appendix 2.
The foregoing hypotheses, it may be seen, are strongly
based on Harvey’s (1966) descriptions of the four Systems
and the circumstances postulated to lead to an individual’s
i •
*
* - r
1 ‘ ' t

21
classification within a given System. Since Conceptual
Systems Test scores were available for the sample, it was
decided to include these in the correlations to be made,
on the grounds that these latter scores, based as they
are on an instrument constructed on the basis of Harvey's
theory by that author, should also reflect the correlations
outlined above. A further benefit of this procedure, it
was felt, would be to provide a comparison of these two
instruments’ ability to predict external correlates to
cognitive complexity. ITo hypothesis about the superiority
of either instrument was drawn, as only a simple comparison,
rather than a statistical analysis of predictive validity,
was wanted.


CHAPTER III
METHOD
Subjects were 583 students enrolled in the first-
year Educational Psychology course (Ed. Psy. 269-271)
at the University of Alberta in the Pall term 1968-69.
Prom the total sample 51 Ss were dropped because SANT
scores were not available. Another 136 £>s were lost for
various reasons, such as unavailable registration forms,
incomplete records in the Paculty office, and grossly
incomplete registration forms, giving a net sample of
N-396.
Access to student registration forms was obtained
from the Student Records Office, Paculty of Education,
and information as to sex, return to the Paculty of
Education, home address, religion, country of birth,
interruption of education, whether student continued
to live at home, and father's occupation was gathered.
These data were coded as described in Appendix 2, and
Blishen’s Index was computed and assigned to each S
following published (1968) procedure.
Scores for the Similarities Among Nations Test were
obtained from Dr. Bower, as were two scores for each S
for the Conceptual Systems Test (see Appendix 1).
The SANT requires the subject to rate each of forty-
five pairs of nations on a seven-point scale from 1=
extremely similar to 7=extremely dissimilar. These 45
scores for each S were formed into a 10 x 10 matrix, with
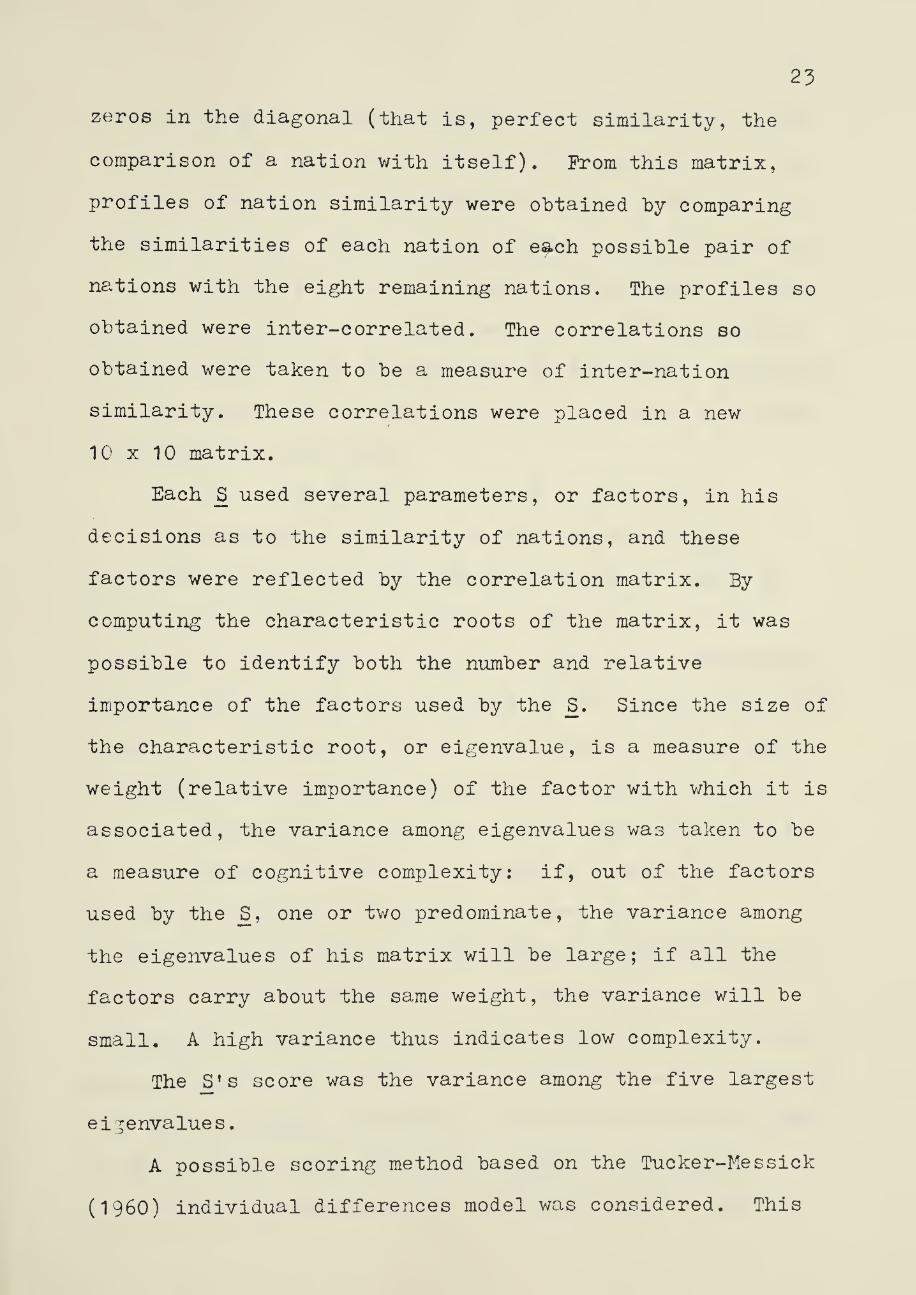
23
zeros in the diagonal (that is, perfect similarity, the
comparison of a nation with itself). From this matrix,
profiles of nation similarity were obtained by comparing
the similarities of each nation of e^ch possible pair of
nations with the eight remaining nations. The profiles so
obtained were inter-correlated. The correlations so
obtained were taken to be a measure of inter-nation
similarity. These correlations were placed in a new
10 x 10 matrix.
Each _S used several parameters, or factors, in his
decisions as to the similarity of nations, and these
factors were reflected by the correlation matrix. By
computing the characteristic roots of the matrix, it was
possible to identify both the number and relative
importance of the factors used by the S. Since the size of
the characteristic root, or eigenvalue, is a measure of the
weight (relative importance) of the factor with which it is
associated, the variance among eigenvalues was taken to be
a measure of cognitive complexity: if, out of the factors
used by the £[, one or two predominate, the variance among
the eigenvalues of his matrix will be large; if all the
factors carry about the same weight, the variance will be
small. A high variance thus indicates low complexity.
The _S’s score was the variance among the five largest
eigenvalues.
A possible scoring method based on the Tucker-Messick
(I960) individual differences model was considered. This

■

24
method relies on an earlier proof that factors with eigen¬
values of less than one do not play a significant part in
the £!’s judgement, and consists of a count of eigenvalues
greater than one. Since in the present study 3 judgements
were on the basis of only 10 stimuli, the number of eigen¬
values greater than one ranged only 2-4, from simple to
complex. This range of variation did not permit sufficient
discrimination for our purpose, and this method of scoring
was accordingly not used.
A copy of the SAHT may be found in Appendix 1 .
Two scores for each _S were obtained on the CST.
The Systems score was obtained by Bower on the basis of
information received from Harvey. Each of the 49 items
received a score from 1 completely disagree to 6=completely
agree, with items 42 and 44 scored in the reverse direction.
Means were obtained for the six subtests and the Ss were
classified into the four Systems on the basis of profile
means. Classification criteria may be found in Appendix 1.
The Combined score was obtained by summing the means
of the six subtests. This latter score, as yet not
published, was to offer the advantage of differentiation
between levels of complexity with considerably simpler
scoring, but Bower’s (1969) analysis indicated that it did
net measure the same factors as the Systems score, although
the two are highly correlated. The Combined score is used
in the present study as another measure of cognitive
complexity, supplementing the validated Systems score.

24a
On the CST, a Systems score of 1 indicates low
complexity and 4 indicates high complexity; on the
Combined score, high subtest scores indicate low
complexity.
The ad hoc. sample of uni-cultural vs. multi-cultural
Ss consisted of all 38 foreign-born _Ss and of 38 other Ss
with Anglo-Saxon surnames randomly drawn from the remaining
sample, for a total of N=76.

CHAPTER IV
RESULTS
A summary of the results obtained is presented in
Table 2. It will be noted that correlations of the
variables under study with CST scores are also included
in this table, in spite of the fact that the SANT is the
primary focus of the present study. The reason for this
inclusion is to permit observational comparison of the
respective ability of each instrument to predict the
variable under consideration. Two correlations for
each variable are given for the CST: CSTs and CSTc; the
former is the standard Systems score, and the latter the
experimental Combined score.
Correlation coefficients significantly differing from
zero were obtained between SANT and (1) sex, (2) foreign vs
Canadian birth (ad hoc, sample), and (3) living at home vs.
away from home. All other correlations were nonsignificant
In terms of the hypotheses stated, these results may
be interpreted as follows:
(1) Sex
This correlation, while highly significant, was in the
direction opposite to that predicted: females scored higher
than males on the SANT in measured complexity, leading to
the rejection of this hypothesis.
(2) Faculty of Re-registration
That there would be a small negative correlation
between complexity and return (=1) vs. non-return (=0) to


26
u CM i—I
8 O V\ lf\ *c\ H -4
• • •
a a
£ 0- u-\ rH O LT\
• ♦ •
A
C\J
<D rH rQ cti
EH
G O
£
■fl <D & i o $ > P P
bO O o C © ©
P © JQ G O
*H P © r-! © x. jh o o
© ©
rH X> © P U
§ ©
JC P o
jC -P
*s
*8
i
JU CM
-4 to o O- HO rH O « o
O o o o i
O CM • •
o o
ir\
8 O
rH vr\
V
trv O CM VfN
• « A A
tr\ O to
• • A A
rH rH o o
V
u-\ O rH CM
• •
A /\
CM O o r-
9 •
s © JS -p
I i t
1
c ro Eh! LT\ O E-* u-\ -4- -4 CM
if© -4" rH r- u'y C" CM
CO CO (A CO 83 r- o to vO CA CM CO o| CM O rH CM o o rH O
'—' • • • « • O . . • • a • *-< M o o c o
1 1 o o
1 o o o o o o
• c\ -4 rH ^
C Q ii n o V r^r fi » /—s
G *•» P © S •" rH P © •H *H © O 1! ©, xs O P P • ii p
p © © P O ^ o © © S~v o © • »» B © 1' rH G P i—1 Vh © rH «b s G » o a ll o •*> £ || O 5b © G P c G G
© sc rH P rH G P o P to p o c £ rH £*■» l( P © O p p p G *H p g XI • •V P o <tj >i P X! © © G P p © © o rH G G h0 hO £ x: G G P © G P P ii G Tj © <£ P *H O P © o P o O G U X Pn o & S rl X ^ ox C G O M © © '_•- © v-^ O © '—- p v—' O P VP > CO ft, X CK 00 o [2 L
ive
Hom
e?
0.0
10
>.3
5
0.1
03
<.0
2
(Liv
es
ho
me-
0;
0.0
^0
>.5
0
away
-1)
Co
nti
nu
ed overl
eaf


Correla
tion betw
een C
og
nit
ive
Com
ple
xit
y
on
27
<v
*4
CO
£0 +3 o E-*
CO o I—I S «5 > P <P X3 8 x: +3
CO o|
■B (fl
CO
0) x: -p
P CM
•< co >—' M
04
O CO E-h Eh CO CO O O
fl> | rH .O •3! P
>
o crv
'N
-4 CNi O
• o
OJ O <r\ u-\ o o
P| P| Q o
C o
•H •P
s. 3 o o
o sO
it -P
• *v CO
cn O r-i *H II
P £0 3 -P
P O *H a) xi Ph x: as r3 -p o 03 tx
o UA
-"S
OJ
"N.
o o
o I—I o
o
O £>- 7? ° O 0~\ 8 £
O ir\
O O rH C
T X uo
it * o
CO
T3
c •H
S O O
E- CO O
£>- -4
O O
o o ON j—| rH rH u~\ -4- -4 vO 1 O O 1
• • • # o c A O o
o o • e
V
O C“- tr\ O
« •
O rH
/•—v £ -P 03 £*■> CO
e-i CO r>
f co
o o x|
?l e o p
«M
c
£ *d cn a) p 3 feO
•H JXh


28
Education: rejected. The very small correlation observed
was far too small to be significant, (r=.02; £=.50)
(3) Home Address
That there would be a positive correlation between
home address (l=rural; 4=large urban) and SANT-measured
complexity: rejected. The observed correlation was too
small to indicate the possibility of a trend (r=.06; £>.15).
(4) Religion
That there would be a positive correlation between
cognitive complexity and professed faith (l=high insistence
on dogma; 9=low insistence on dogma); rejected. While the
observed correlation was in the direction predicted, it
was too low to be considered significant (r=.02; jd).44).
(5) Birth
That there would be a correlation between Canadian
(=0) vs. non-Canadian (=1) birth and complexity: the
correlation for the sample as a whole was r=.08 (£>.15).
The use of the ad hoc. sample raised r to .23 (£<•05).
(6) Continuity of Education
That measured complexity would increase with the
interruption of education: rejected. While the correlation
was in fact in the direction predicted, it was far too
small to permit the rejection of H0.
(7) Live Home?
That living at home (=0) vs. living away from home
(=1) would correlate positively with measured complexity

. - »
*
•
*
•
- « . .1
• '
- ‘ , ...' , ’
29
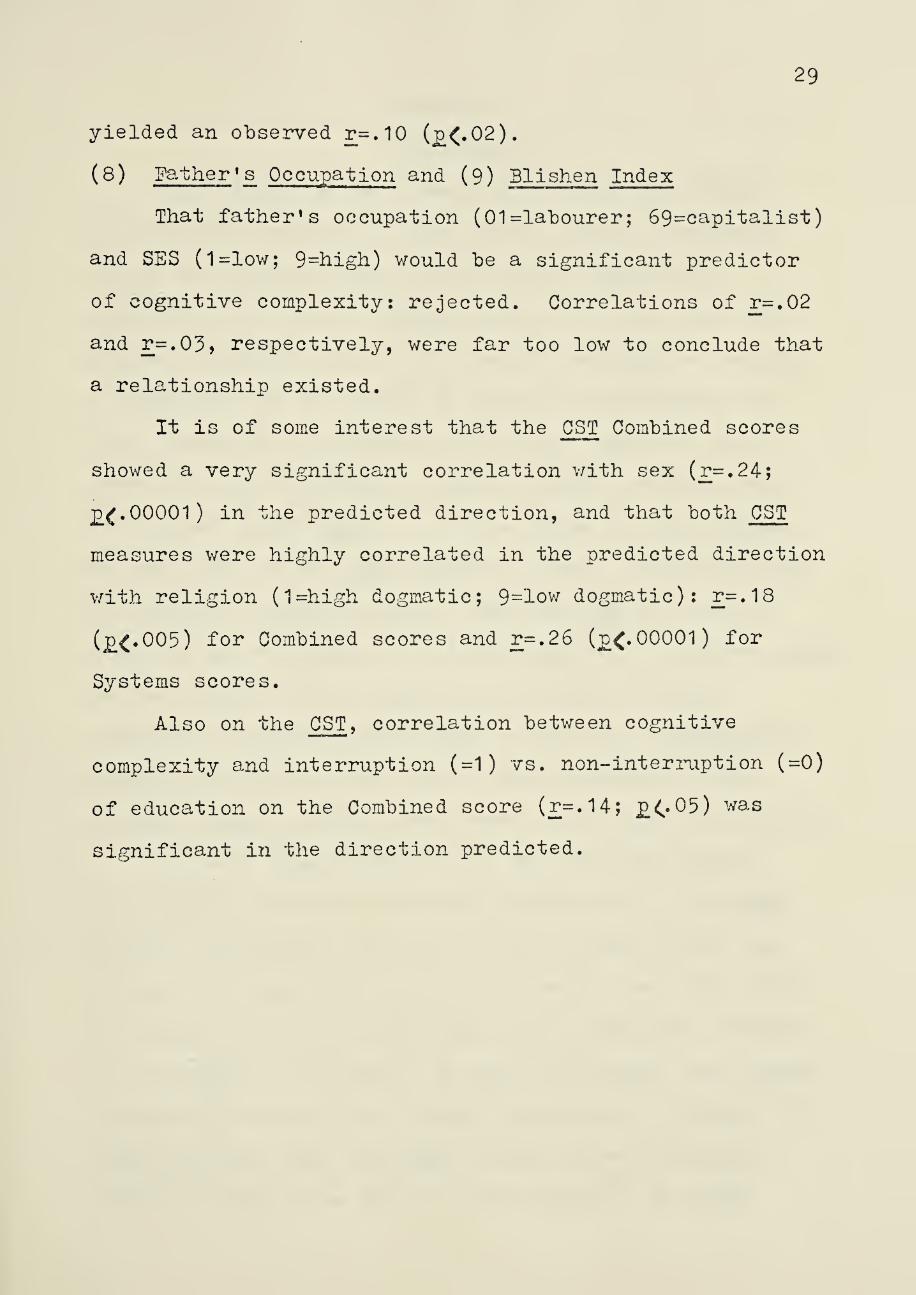
yielded an observed r=.10 (£<.02).
(8) Father *s Occupation and (9) Blishen Index
That father's occupation (01=labourer; 69=capitalist)
and SES (1=low; 9=high) would he a significant predictor
of cognitive complexity: rejected. Correlations of r=.02
and r=.03, respectively, were far too low to conclude that
a relationship existed.
It is of some interest that the CST Combined scores
showed a very significant correlation with sex (r=.24;
£<.00001) in the predicted direction, and that both CST
measures were highly correlated in the predicted direction
with religion (1=high dogmatic; 9=low dogmatic): r=.18
(£<.005) for Combined scores and r=.26 (£<.00001) for
Systems scores.
Also on the CST, correlation between cognitive
complexity and interruption (=1) vs. non-interruption (=0)
of education on the Combined score (r=.14; £<. 05) was
significant in the direction predicted.
•*
V . . • \
CHAPTER V
DISCUSSIOH
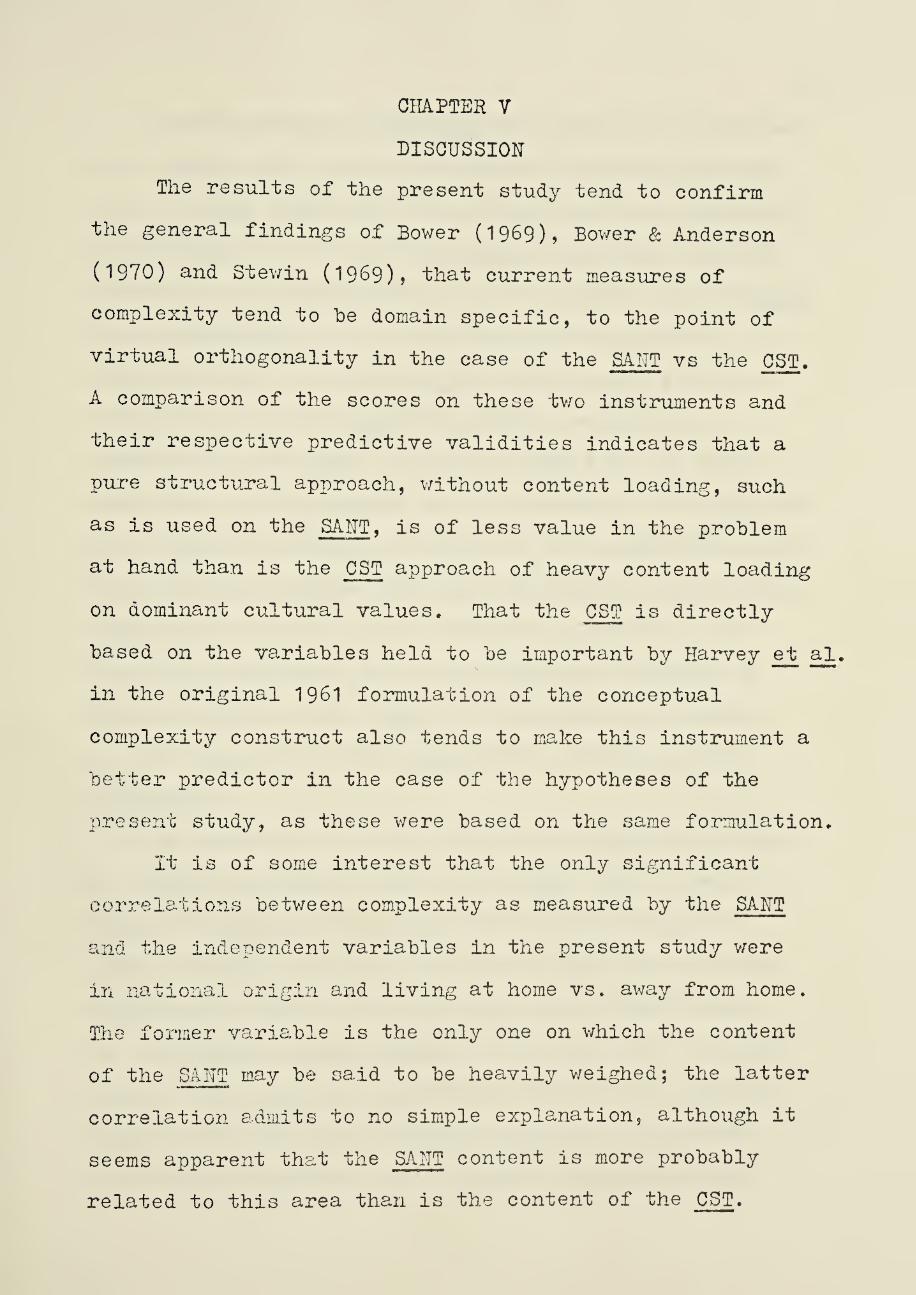
The results of the present study tend to confirm
the general findings of Bower (1969), Bower & Anderson
(1970) and Stewin (1969), that current measures of
complexity tend to be domain specific, to the point of
virtual orthogonality in the case of the SAHT vs the CST.
A comparison of the scores on these two instruments and
their respective predictive validities indicates that a
pure structural approach, without content loading, such
as is used on the SAITT, is of less value in the problem
at hand than is the CST approach of heavy content loading
on dominant cultural values. That the CST is directly
based on the variables held to be important by Harvey erfc al.
in the original 1961 formulation of the conceptual
complexity construct also tends to make this instrument a
better predictor in the case of the hypotheses of the
present study, as these were based on the same formulation.
It is of some interest that the only significant
correlations between complexity as measured by the SAHT
and the independent variables in the present study were
in national origin and living at home vs. away from home.
The former variable is the only one on which the content
of the SAHT may be said to be heavily weighed; the latter
correlation admits to no simple explanation, although it
seems apparent that the SAHT content is more probably
related to this area than is the content of the CST.

-
•-
l ■
,

31
Results obtained vis-a-vis the remaining hypotheses
also support this view: Correlations between professed
faith (l=high dogmatism; 9=low dogmatism) and complexity
on the CST are 0.18 and 0.2? (£«.01 Combined; £<.4.001,
Systems) vs. a correlation of 0.017 (£>.25) for the SANT.
For interruption (=1) vs. non-interruption (=0) of
education, the use of the CST Combined score yields a
correlation of 0.14 (£<(*05) against a negligible
correlation with SANT. Living at home (=0) vs. away
from home (=1) correlates with complexity on the SANT at
r=.10 (n<.01) against r=.04 (£>• 25) on the CST (Systems).
Sex correlates highly with both instruments, with highly
significant results on the Combined CST score in the
direction predicted, but in the opposite direction to
the prediction on the SANT. The remaining hypotheses
are not supported to any significant extent by either
instrument.
An examination of the instruments reveals a number
of social expectancy items on the CST. These items,
which are more-or-less evenly distributed among the
sub-tests which comprise the System score, would not be
expected to show a sex differentiation on this score.
In the Combined score, which is the sum of all sub-test
scores, the effect of these items accumulates, with the
result that this scale becomes sensitive to the fact
that social expectancy has a greater governance over

A
• f
. .

32
female than male behaviour in this society.
That no significant correlations were found between
cognitive complexity and return (=1) vs. non-return (=0)
to Education and home address (1=rural; 4=large urban)
may be assumed to be because the content of the items on
these instruments bears little, if any, relation to the
content implicit in these two variables.
That religion (l=high dogmatism; 9=low) correlated
highly with complexity on both the Combined and Systems
scores of the CST may be viewed in the same light: the
many items dealing with religion on this instrument
apparently tap the same content area as do professions
of faith.
heither SA.3TT nor CST contains items dealing with
social status, and this is perhaps the reason that
neither instrument differentiates between levels of
fathers* occupations or SES. It is, however, somewhat
surprising that the various value systems operating in
the strata of this society were not detected by the CST;
possibly such sensitivity is attainable only through a
greater specificity within the test items than that
instrument provides.
Interruption vs. non-interruption of education was
significantly correlated with complexity on the CST Combined,
but not on Systems, probably for much the same reasons given
for the similar effect on the correlation with sex, while

.
'

33
the significant correlation obtained between living at
home vs. away from home and complexity on the SAITT is
again probably due to the fact that the content of the
SANT permits the detection of changes in one’s world outlook
while the content of the CST is such that it does not.
In general, the results of the present study may be
held to have been useful in the attainment of the original
ends, although this usefulness is unfortunately in a
negative sense, that is, in the barring out of approaches.
We find that the instruments used in this study are not
capable of making useful discriminations between differences
in the population which are predicted in theory, and to
which they should be sensitive. Given that the views of
complexity upon which these instruments are based are not
without foundation in reality, we would be hard put to
explain why both SANT and CST do divide the population
into those segments predicted by theory. Under these
circumstances, the conclusion that the models used do, in
fact, have some correspondence to reality appears to be
inescapable, which observation leads in turn to an
examination of the instruments themselves. As has been
noted, both instruments do in fact partition the popiilation
into those segments predicted by theory. But this division
lacks generality: the borders of the segments appear to
follow the outlines of theory, but the division is specific
to the content domain of the instrument. The CST provides

* ■'
' y ” •
■
'■
• **
■v m
• 1
•i .
■

34
a measure of social complexity specific to J3s' views on
such subjects as religion, morality and orderliness, while
the SANT is specific to Ss’ world outlook within the
rather limited domain of inter- and intra-national affairs.
Scores for the latter instrument are also affected to a
considerable extent by interests and information on the
area of content, as has been shown by Scott’s (1965 and
subsequent) work with the Groups of Nations Test.
Given that content factors have, in fact, had an
effect on the measured complexity of _Ss in the present
study, the lack of predictive validity demonstrated by
both instruments becomes unsurprising. Further, since
the SANT and GST may be assumed to be representative of
the two broad approaches to the measure of cognitive
complexity, it may be concluded that within the range of
currently-available instruments within this area, no
instrument not constructed to tap the specific content
domains in question will meet the objectives of the present
study satisfactorily. These domains are those that operate
in the classroom to provide an environment conducive to
increasing the complexity of the student: empathy towards
one’s pupils and a concomitant understanding of means of
achieving specific educational objectives with specific
children; comprehension of subject matter to be taught and
of the alternate means it may be imparted; understanding of
the many roles played by the educator in the classroom and

■
*
■m

35
of the function played by these roles in the attainment
of objectives; grounding in the administrative and
political mechanisms of the school system and an
understanding of the use of these mechanisms in the
attainment of educational objectives.
The above listing of content domains is not, of course,
either exclusive or comprehensive, but may serve to
indicate at least the direction of an approach that may
produce an instrument useful in attaining the ends of the
present study. The results of the present study have not
yielded information of immediate practical applicability,
but have revealed that even at the present level of
development of test methods, some of the predicted
relationships do, in fact, exist; further, those
correlations which have been demonstrated have been found
to be in areas in which the content domains of the
instruments used overlap those of the hypotheses under
test.
While no recommendations can be made regarding the
feasibility of teacher selection through the use of
external criteria from this study, it is believed that
sufficient indications of the promise of this approach
have been shown to warrant further study.
Should such further research be undertaken in the
future, some direction to such studies may be taken from
the present work.


REFERENCES

/K

REFERENCES
Barron, F. Complexity and simplicity as a personality dimension. Journal of Abnormal and Social Psychology, 1953, 48,
Biggs, J. B. Coding and cognitive behaviour. British Journal of Psychology, 1969, 60, 287-WT
Blishen, B. R. A socio-economic index for occupations in Canada. In B. R. Blishen (Ed.), Canadian society sociological perspectives, third edition, loronto: Macmillan, 1*9*68’, pp. 741 — 753.
Bower, A. C. Cognitive complexity and association learning. Unpublished doctoral dissertation, University of Alberta, 1969.
Bower, A. C. and Anderson, C. C. A study of the construct validity of the Conceptual Systems Test. Canadian Journal of Behavioural Science, 1970, 3," 279-293 “ ~~~ ~ “ —
Corfield, V. K. The role of arousal and cognitive complexity in susceptability to social influence. Unpublished doctoral dissertation, University of Alberta, 1967.
Bellas, M. and Gaier, E. 1. Identification of creativity: the individual. Psychological Bulletin, 1970, 73, 55-73.
Briver, M. J. Conceptual structure and group processes in an~~Lntelrfiiat i on simulation. Part one : tEe perception oT "simulated nalTions. Princeton: Educational Testing Service, 1962.
Eisenman, R. Creativity and academic major: business versus English majors. Journal of Applied Psychology, 1969, 5_3, 392-595.~
Flores, M. B. Some differences in cognitive abilities between Canadian and Filipino students. Boctoral dissertation, University of Toronto, 1969. Bissertation Abstracts International, 1971-72,32, 30873“
Getzels, J. W. and Jackson, P. W. Creativity and intelligence. Hew York: Wiley," 19o2


38
Gough, H. G. Techniques for identifying the creative scientist. Conference on the creative person. Berkeley: University of California, Institute" of Personality Assessment and Research, 1961.
Graves, M. Design Judgment Test. Hew York: The
xperience,
___ _„ Psychological Corporation, 1959*
Harvey, 0. J. System structure, flexibility and creativity. In 0. J. Harvey (Ed.), Eg structure and adaptability. Hew York: Springer, 1966, pp.
Harvey, 0. J., Hunt, D. E. and Schroder, H. If. Conceptual systems and personality organization. Hew York: Wiley, 1961.
Harvey, 0. J., Prather, M., White, B. J., and Hoffmeister, J. K. Teacher’s beliefs, classroom atmosphere, and student behavior. American Educational Research Journal, 1968, 5, 151—1 So *
Harvey, 0. J. and Ware, R. Personality differences in dissonance reduction. Journal of Personality and Social Psychology, T9oT7~2> 227-230.
Harvey, 0. J., White, B. J., Prather, M., Alter, R. D., and Hoffmeister, J. K. Teacher’s belief systems and pre-school atmosphere. Journal
Joyce, B,
of Educational Psychology, 1966, 97, 373-381
R., Lamb, H., and Sibol, J. Conceptual development and information processing: a study of teachers. Journal of Educational Research, 1966, 59? 219-222.
Karlins, M. , Coffman, T., Lamb, H., and Schroder, H. M. The effect of conceptual complexity on information search in a complex problem¬ solving task. Psychonomic Science, 1967? 7.» 137-138.
Laing, R. D. and Esterson, A. Sanity, madness and the family. London: Tavistock, 1964. (Republished: London; Penguin Books, 1970)
Little, B. R. Pactors affecting use of psychological versus non-psychological constructs on the Rep Test. Bulletin of the British Psychological
Society, 1968, 21, 113.

r • •
- i

39
Little, B. R. Sex differences and comparability of three measures of cognitive complexity. Psychological Bulletin, 1969, 24, 607-609.
MacKinnon, D. W. The study of creativity and creativity in architects. In, Conference on the creative person. Berkeley: University of California Institute of Personality Assessment and Research, 1961.
MacKinnon, D. W. The creativity of architects. In C. W. Taylor (Ed.), Widening horizons of creativity, hew York: Wiley, 1964.
Maier, U, R. P. Psychology in industry (2nd edition),
Boston: Houghton Mifflin, 1955
Maier, IT. R. P, and Hoffman, L. R. Organization and creative problem solving. Journal of Applied Psychology, 1961, 45, 277-280.
Miller, A. G-. Psychological stress as a determinant of cognitive complexity. Psychological Reports, 1968, 23, 635-639.
Miller, A. C. Amount of information and stimulus valence as determinants of cognitive complexity. Journal of Personality, 1969, 37, 141-157.
Orliandi, L. R. Social class and structural patterns in divergent thinking of students in urban elementary schools. Doctoral dissertation, Dissertation Abstracts International, 1969-70,
30, 4282A (Abstract).
Pavlovich, H. S. Cognitive types of teachers and pupils in relation to classroom interaction. Doctoral dissertation, Dissertation Abstracts Internatio- nal, 1970-71, 32, 797A (IbsiraHTT-
Reynolds, R. J. Classroom verbal interaction as a function of instructor cognitive complexity. Journal of Teacher Education, 1970, 2J_, 59-64.
Rindberg, E. H., Parke, R. D., and Hetherington, E. M. Modification of impulsive and reflective cognitive styles through the observation of film mediated models. Developmental Psychology, 1971, 5, 369-377.

• -
. . :■
.

40
Rosen, A.
Schroder,
Scott, W.
Scott, W.
Scott, W.
Scott, W.
Scott, W.
Sieber, J
Sieber, J
Seferi, M
Siegel, I
and Connaway, R. S. Categorizing behavior and stimulus boundness. Psychological Reports, 1968, 23, 971-977. ‘-
H. M., Driver, M. J., and Streufert, S. Hunan Information Processing. ITew York: Holt, Rinehart & Winston, 1967.
A. Cognitive complexity and cognitive flexibility. Socionetry, 1962, 25, 405-414
A. Cognitive complexity and cognitive balance. Sociometry, 1963, 26, 66-74. (a)
A. Conceptualizing and measuring structural properties of cognition. In 0. J. Harvey (Sd.), Motivation and social interaction. Hew York: Ronald, 1963, pp. 266-288. (bY
A. Flexibility, rigidity, and adaptation: toward clarification of constructs. In 0. J. Harvey (Ed.), Experience, structure and adaptability. Hew York: Springer, 1966.
A. Structure of natural cognitions. Journal of personality and Social Psychology, 1969,
121, 261-178. . E. Problem solving behavior of teachers as a function of conceptual structure. Journal
of Research in Science Teaching, 1964, 2.,
64-68.
. S. and lanzetta, J. T. Conflict and conceptual structure as determinants of decision making behavior. Journal of Personality, 1964, 32, 622-641.
.: International and interpersonal cognitions. Boulder: University of Colorado, 1968. (Mimeo.)
. S. Concept attainment as a function of amount and form of information. Journal of Experimental Psychology, 1969, 81 Y^6T-T687


41
Stager, P. Conceptual level as a composition variable in small group decision making. Journal of Personality and Social Psychology, 1967, 5,, 152-161.
Stewin, L. S. Set characteristics of conceptual systems. Unpublished doctoral dissertation. University of Alberta, 1969.
Terman, L. M. Concept Mastery Test manual. New York: Psychological dorporation, T956T
Terman, L. M., Baldwin, B. T., Cox, C. M., Gillian, L. 0., Burks, B. S., Oden, M. H., and others. Genetic studies of genius. Stanford: Stanford
University Press, 1925-1959.
Tucker, L. R. and Messick, S. Individual differences in multidimensional scaling. Princeton: Educational Testing Service Research Memorandum 60-15, I960.


APPENDICES


43
APPENDIX 1
Instruments used to measure complexity
a. a copy of the Conceptual Systems Test
b. criteria for assignment to Systems on the Conceptual Systems Test
c. a copy of the Similarities Among Nations Test


ha m
Please indicate the extent to which you agree or disagree with each of the following statements by marking an ”XM in the appropriate place on the 6 point scale. There is no time limit. Have you any questions?
1. I believe that to attain my goals it is only necessary for me to live as God would have me live .
2. I like to have a place for everything and everything in its place .
3. Any written work that I do I like to have precise, neat, and well organized .
4. I like my friends to confide in me and to tell me their troubles
5. I like to join clubs or social groups ........
6. I like to makeaas many friends as I can...
7. I feel like telling other people off when I disagree with them ..
8. These days a person doesn’t really know whom he can count on..
9. In the final analysis events in the world will ultimately be in line with the master plan of God .
10. I like to keep my things neat and orderly on my desk and workspace ,,.♦
11. I don’t like for things to be uncertain and unpredictable .
12. I always like for other people to tell me their problems .
I enjoy very much being part of a group .
44
pi X\ iu
1 m M jO
lo X EH
I
i
i oil or
a *<1 XT’ 1—i. ^ ' JT-i jS
LIG
HT
LY
DIS
AG
RE
E
w w x c «c
£ x o M O) ul
a CJ <
*3 XJ X ’!■ <
1—1 s
X E-1 in
;
’
i ! ? f i | I
| 4
l ; >
i
1
i i i f
i t
K
|
5 1 i
i j
1
* j
! } l i
L
i
i
j
i 13.

J
*

14.
15.
1 6.
17.
18.
19.
20.
21. 22.
25.
24.
25.
26.
27.
I like to form new friendships
I feel like getting revenge when someone has insulted me ..
You sometimes can’t help wondering whether anything’s worthwhile anymore ..
The. way to peace in the world is through religion ...
I like to have my work organized and planned before beginning it ........
I find that a we11-organ!zed mode of life with regular hours is suitable to my personality ...
I like to help my friends when they are in trouble .....................
I like to meet new people..
I am a very sociable person who gets along with nearly everyone
I feel like making fun of people who do things that I regard as stupid .
It is safest to assume that all people have a vicious streak and it will come out when they are given a chance .
Guilt results of violation of God’s law ........
I like to keep my letters, bills, and other papers neatly arranged and filed according to some system ...
I like to have my meals organized and a definite time set aside for eating ..

■ vJ’

28.
29.
30.
31.
32.
33.
34.
35.
36.
37.
38.
39.
40.
41.
Contributing to human welfare is the most satisfying human endeavor ..
I feel at home with almost everyone and like to participate in what they are doing .
I like to criticize people who are in a position of authority ...
Anyone who completely trusts anyone else is asking for trouble ..
Marriage is the divine institution for the glorification of God .
I like to have my life so arranged that it runs smoothly and without much change in my plans .
I like to help other people who are less fortunate than I am ..
I like to start conversations ...
Politicians have to bribe people .
ITo man can be fully successful in life without belief or faith in divine guidance ......
I like to plan and organize the details of any work that I undertake .♦
I like to treat other people with kindness and sympathy...
I like to give lots of parties .
Most people can still be depended upon to see you through in a pinch ....
i
* , -

42.
43.
44.
45.
46.
47.
48.
49.
Sin is but a cultural concept built by man....
I like to sympathize with my friends when they are hurt or sick ......
I prefer to do things alone, rather than with my friends ...
The dictates of one’s religion should be followed with trusting faith .
I enjoy making sacrifices for the sake of happiness of others..
I think I have more friends than most people I know...
There are some things which God will never permit man to know .
I like to do things with my friends rather than by myself ....
[ST
RO
NG
LY
DIS
AG
RE
E!
DIS
AG
RE
E
[SL
IGH
TL
Y
DIS
AG
RE
E
SLIG
HT
LY
AG
RE
E"
|
S2
i STR
ON
GLY
AG
REE
i
>
L
47


48 Scoring the CST^
Each item of the GST was assigned a score from 1
for "Strongly Disagree" to 6 for "Strongly Agree" and
item scores were assigned to the six subtests, below.
Items 42 and 44 were scored in the reverse direction
(6 to 1).
Divine Fate Control
Items 1, 9, 17, 25,
32, 37, 42, 45,
48
Need to Help People
Items 4, 12, 20, 28,
34, 39, 43, 46
Interpersonal Aggression
Items 7, 15, 23, 30
Need for Structure Order
Items 2, 3, 10, 11,
18, 19, 26, 27,
33, 38
Need for People
Items 5, 6, 13, 14,
21, 22, 29, 35,
40, 44, 47, 49
General Pessimism (Anomie)
Items 8, 16, 24, 31 ,
36, 41
The means for the six subtests were obtained and
compared with the cutting points given below to determine
the _S’s System Glassification.
System 1 Ss were those who scored above 4.19 on
the Divine Fate Control subtest.
1. After Bower (1969) and Stewin (1969)

49
System 2 £>s were those who scored as follows:
less than or equal to 4.19 on Divine Pate Control; greater than 3.75 on Interpersonal Aggression; greater than 3.39 on General Pessimism
System 3 Ss were those whose score pattern was:
less than or equal to 4.19 on Divine Pate Control; less than or equal to 3.75 on Interpersonal Aggres¬
sion; greater than 4.10 on Need for People
System 4 Ss were those whose score pattern was:
less than or equal to 4.19 on Divine Pate Control; less than or equal to 4.10 on Need for Structure-
Order : less than or equal to 4.10 on Need for People; less than or equal to 3.37 on Interpersonal Aggres¬
sion
The Combined score for the CST consists simply of
the summed means of the six subtests.

•
•V
# \

50
SIMILARITIES AMONG- NATIONS
Form 1
Name
Instructions
On the next two pages you will find a list of nation pairs which include all possible pairing of the ten countries listed below.
Australia Brazil France Cuba U.S.S.R.
Red China Egypt India Sweden U.S.A.
Beside each pair is a 7 point scale which runs from "Extremely Similar" to "Extremely Dissimilar". Place a check mark in the position on the scale which you feel best represents your opinion as to how similar or dissimilar the two nations are with respect to their basic characteristics.
For instance, if you think that the important characteristics of the paired nations are very much alike, place a mark under "Extremely Similar". But if you think that the paired nations are very different, then place a check mark under "Extremely Dissimilar" . Y/here the two nations are about equal in differences and similarities, use the center of the scale, which is unmarked. There are 7 graduations of similarity, so try to make use of all 7 categories in making your judgements.
Do not spend too much time on any one of the pairs. Record your first impression. However, you may change a rating by erasing it and marking in your new opinion. There is no time limit.
TURN THE PAGE


Low rat.e each pair of no.tions as to their similarity on the ~T~-point scale. ~ ' ' ’ "*■ —■ ... n ii
Ration Pairs
1. Cuba - U.S.A.
2. Australia - U.S.S.R.
3. Australia - Sweden
4. Red China - France
5. U.S.S.R. - U.S.A.
6. Australia -- Brazil
7. France - India
8. U.S.A. - Red China
9. India - Australia
10. India - U.S.A.
11. Egypt - U.S.A.
12. U.S.S.R. - Egypt
13. Cuba - Sweden
14. Sweden - U.S.A.
15. Australia - Red China
16. Egypt - India
17. Brazil - Cuba
18. India - Brazil
19. India - U.S.S.R.
20. Brazil - Sweden
21. Egypt - Sweden TURN TEE
51
SIMILAR DISSIMILAR ,M 1.hi i ... — mmmmmtrn
E X T R E M i E i L ; Y ;
Q U I T E
s L i I !
H T L | Y
S L I G II T L Y
Q U I T E
E X T R E M E L Y
i f | _!
i 1 t j " j
] 1
j J
| . . .
i
1 ;
i I 1 | ,
r- *■"- —1 I ]
}
1 ;
a 1 0 \
i ......
;
Li i 1
j.. ? 1 1
1 1
! ! 1 |
j * i
1 !
»
|
' 1 1 I < i i
i i
L ■--
\ j
i 1 1 \
i . PAGE


SIMILAR DISSIMILAR
E E X s s X T L L T R j I I R E Q i Gr G Q E M u H H u M E I T T I E L T L L T L Y E Y Y E Y
22. Red China - U. S.S.R. |
23. Brazil - Red China i
24. Sweden - India
25. Egypt - Prance
26. Australia - Egypt i I
27. Cuba - Red China
28. U.S.A. - Australia
29. Prance - U.S.A.
30. Australia - Cuba 1
31. Prance - Australia j 1 1
32. Brazil - U. S.S.R.
33. Cuba - U. S.S.R. \
34. Red China - Egypt ! ;
-
35. Brazil - Prance 1
36. India - Cuba i
(
37. Sweden - Red China ! \
38. Prance - U.S.S.R.
39. Egypt - Cuba
Sweden - Prance
( t i
40. I
41. Brazil - Egypt
5
i
42. Prance - Cuba | i
!
43.
44.
U.S.A. - Brazil 1 i i
Sweden - U. S.S.R.
j 1
I J
45. Red China - India J 1 __1
END


APPENDIX 2
Scales used in coding data


SCALES 54
(1) Sex
0=F 1 =M
(2) Faculty of Re-registration
0=dropped out or transferred to another faculty 1=returned to Faculty of Education for at least one term
following that in which tests were administered
(5) Home Address
1=farm, rural, hamlet, village 2=towns to 5,000 population 3=small cities to 50,000 population 4=cities over 50,000 population
(4) Religion
1=fundamentalist (Adventist, Church of God, Full Gospel, 2=lslamic etc*) 3=estahlished fundamental faiths (Presbyterian, Lutheran) 4=Jewish* 5=old established faiths (Catholic, Orthodox) 6=establishea Protestant faiths (Anglican, United, etc.) 7=non-specified "Protestant1* 8=non-specified "Christian," Unitarian 9=agnostic, atheist, none
Faiths were rated by a panel of judges from 1=high to 9=low insistence upon adherence to dogma by a given religion.
* The panel reported some difficulty in placing the Jewish faith on the continuum, and this writer does not agree with the rating finally arrived upon. Since there were only 4 persons of Jewish faith in the total sample, the correctness of this particular rating is probably of little importance.
(5) Birth
0=0anadian born 1=foreign born
(6) Continuity of Education
0=continuous attendance 1=education interrupted for at least one year


(7) Live home? 55
0=lives at home while attending university 1=lives away from home while attending university
(8) Father* s Occupation
0 0 =une mp 1 oy e d 01 ^housewife 02=menial labour 03=semi-skilled 04=skilled labour
05=menial white collar 06=clerical 07=retired 08=business 09=professional
multipliers
00^lowest rank 10=independent of supervision 20=foreman/supervisor 30=administrator (at least two subordinate foremen) 40=manager of business 50=owner/manager of large concern 60=independently wealthy
This scale was composed by a panel of judges consisting of graduate students from this Department. In use, each occupation is rated using a two digit number made up of the first digit of the multiplier and the second digit of the occupation list. Thus, farmers, for example, would be rated 13.
(9) Bllshen Revised Socio-Economic Index (S5S)
This the standard Canadian scale of occupational ranking by occupation. The version used here (1967 revision) uses a decile division, but for the purposes of this study, because of the low number of respondents in the uppermost listings, it was decided to combine the two top deciles to yield a nine-point scale. Values assigned were from 1=membership in lowest decile through 9= membership in ninth and tenth deciles.
It would be tedious to reproduce the entire Index here, but a list of representative occupations within the nine categories used follows (After Blishen, 1968).
1=labourer, weaver, guide 6=millwright, postmaster, 2=tanner, knitter, cook foreman 3=postman, tailor, miner 7=mechanic, clerical, other 4=barbers, molders, boiler- foreman
maker 8=photographer, stenographer, 5=sales-clerk, plumber social worker
9=owners/man^gers, professors physicians, chemical eng.
■
'