Embed Size (px)
Citation preview

© 2015 Kaufman, Hall & Associates, LLC. All rights reserved.
Funds Transfer PricingKen Levey, Vice-President Financial Institutions

© 2016 Kaufman, Hall & Associates, LLC. All rights reserved.
As Vice President Financial Institutions, Ken focuses on shaping and executing Kaufman Hall’s
Axiom product and business development strategies for banks, credit unions and other
financial services industries. Ken brings over thirty years of experience working in the financial
services industry. Prior to joining Axiom EPM, Ken was the Senior Director for Banking
Analytics at SAP BusinessObjects. He was responsible for developing performance
management and analytic applications for the banking industry.
Ken started his career in financial services at Bear Stearns in New York and then became the
Vice President of Asset/Liability Management at Seamen’s Bank for Savings. For 17 years,
Ken held a senior position at IPS-Sendero (Fiserv) where he lead the development of their
Asset/Liability Management system and managed their ALM and Funds Transfer Pricing
implementation and consulting departments.
Ken Levey
Todays’ Speaker

© 2016 Kaufman, Hall & Associates, LLC. All rights reserved.
I. The Basic Tenets of Funds
Transfer Pricing
II. Next Steps in Analysis: Roadmap to
Decision Making
Agenda

© 2016 Kaufman, Hall & Associates, LLC. All rights reserved.
Net Interest Margin – What is it?
A measure of the difference between the interest income generated
on assets and the amount of interest paid out for liabilities, relative
to the amount of (interest-earning) assets
FTP Basic Tenets

© 2016 Kaufman, Hall & Associates, LLC. All rights reserved.
Net Interest Margin – Why is it important?
Net Interest Margin (NIM) typically represents between 50-85% of
a financial institution’s net income
If you are going to measure performance, and the majority of your
performance is derived from NIM, you need to accurately and
consistently calculate your NIM
FTP Basic Tenets

© 2016 Kaufman, Hall & Associates, LLC. All rights reserved.
What role does Funds Transfer Pricing play in NIM measurement?
Financial institutions can measure NIM at the institution level
However, if you want to measure NIM at a level lower than the institutional level; you need to
utilize Funds Transfer Pricing in order to do so
FTP Basic Tenets

© 2016 Kaufman, Hall & Associates, LLC. All rights reserved.
Funds Transfer Pricing Defined
Funds Transfer Pricing is an internal management information system designed to allocate
net interest margin (NIM) for every segment of a FI
Organizations
Products
Customers / Members
Liability Spread
Residual Spread
Asset Spread
Total
Financial
Institution
NIM
FTP Basic Tenets

© 2016 Kaufman, Hall & Associates, LLC. All rights reserved.
Measured on a historical basis supports profitability analysis
As it represents such a high percentage of total profitability it
really should be the first step in understanding all the
components of profitability
Which loan products are profitable?
Which branches are losing money?
Do deposits contribute to profits?
Which customers are profitable?
FTP Basic Tenets

© 2016 Kaufman, Hall & Associates, LLC. All rights reserved.
Measured on a forecasted basis to support strategic planning,
budgeting, forecasting and risk analysis
Enables an institution to plan and assess actual performance to the
plan based on profit, as opposed to volumes
Which products should you invest in?
Do you need to modify your pricing strategies?
Do your plans align with the strategic goals of the FI?
How did each branch perform according to plan?
Are you being appropriately compensated for credit risk?
Do you have an incentives aligned with your goals?
FTP Basic Tenets

© 2016 Kaufman, Hall & Associates, LLC. All rights reserved.
Goals & objectives
Accurately and rationally measure the cost or credit of funds in support of profitability,
strategic planning, and budgeting measurement & analysis
Margin management
Product pricing
Product and marketing strategies
Market strategies
Incentive compensation
Decentralized decision making
FTP Basic Tenets

© 2016 Kaufman, Hall & Associates, LLC. All rights reserved.
Strategic Planning Budgeting &
Forecasting
Profitability
Which products to invest in Set goals based on profit,
not volumes
Assess true sources of profits
Which products to get rid of Manage to plan based on
spread; not just yield or
cost of funds
Enable comparative analysis
Modify pricing strategies Identify opportunities to
improve based on forecast
Support profit-based incentive
compensation
Where are margin
improvements needed to
achieve strategic plan
Support in-cycle decision
making
Analyze profitability for all
segments (customers,
products, channels, branches,
officers, etc.)
Set specific incentive
based goals that align with
strategy
More accurate budgeting of
compensation
Distribute consistent,
quantitative-based results to
line managers
FTP Basic Tenets - Recap Matrix
© 2016 Kaufman, Hall & Associates, LLC. All rights reserved.
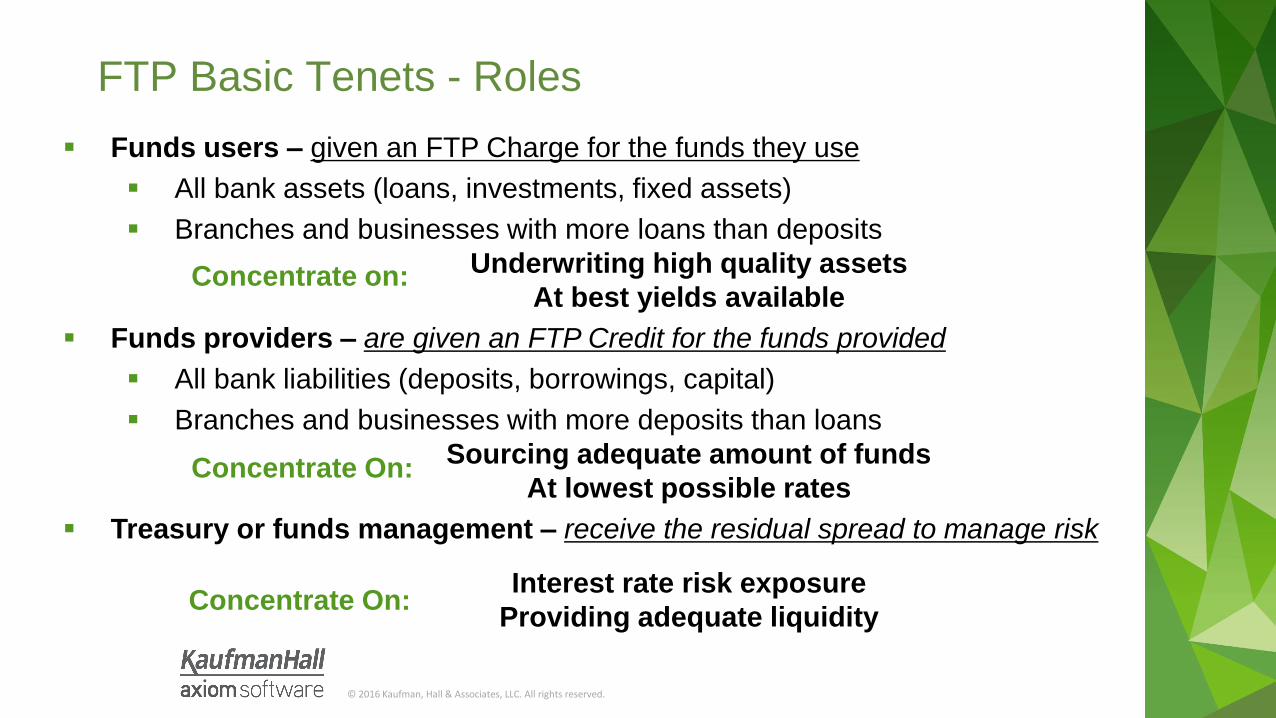
Funds users – given an FTP Charge for the funds they use
All bank assets (loans, investments, fixed assets)
Branches and businesses with more loans than deposits
Underwriting high quality assets
At best yields available
Funds providers – are given an FTP Credit for the funds provided
All bank liabilities (deposits, borrowings, capital)
Branches and businesses with more deposits than loans
Sourcing adequate amount of funds
At lowest possible rates
Treasury or funds management – receive the residual spread to manage risk
Interest rate risk exposure
Providing adequate liquidity
Concentrate on:
Concentrate On:
Concentrate On:
FTP Basic Tenets - Roles

© 2016 Kaufman, Hall & Associates, LLC. All rights reserved.
Role Description Concentration
Funds Users All asset generators / users• Loans, Investments, Fixed Assets
“Invest” in high quality assets
at the highest yields possible
Funds Providers All funds gatherers / sources• Savings, Checking, CDs,
Borrowings
Source necessary funds at
lowest cost possible
Treasury or
Funds Management
Money Center• Supplies funds to funds users
• Purchases funds from funds
gatherers
Manage risks• Interest rate risk
• Liquidity risk
FTP provides clarity and focus of the roles within a Financial Institution
FTP Basic Tenets - Recap

© 2016 Kaufman, Hall & Associates, LLC. All rights reserved.
Why Funds Transfer Pricing

© 2016 Kaufman, Hall & Associates, LLC. All rights reserved.
Category Product Balance Interest Rate
Assets: 3 Year Loan 100,000 4.55%
Liabilities: 6 month CD 100,000 1.15%
Margin:3.40%
Thirty years ago loan officers were thought to
bring all the “profit” to the bank – while deposit
gathers had a negative impact on bottom line
How profitable were the assets?
What value were deposits bringing to
the organization
BUT…
FTP – Allocating the Margin

© 2016 Kaufman, Hall & Associates, LLC. All rights reserved.
Category Product Balance Interest Rate FTP Rate Spread
Assets: 3 Year Loan 100,000 4.55% 3.30% 1.25%
Liabilities: 6 month CD 100,000 1.15% 2.10% 0.95%
Margin:3.40% 2.20%
What happened to the
1.20% (3.40% - 2.20%)?
The bank could get
an alternative
investment
The bank could go to the capital
markets and borrow funds
The introduction of FTP enabled financial institutions to apply a
cost/credit in order to value assets and liabilities, calculating a margin
for both
FTP – Allocating the Margin

© 2016 Kaufman, Hall & Associates, LLC. All rights reserved.
Category Product Balance Interest Rate FTP Rate Spread
Assets: 3 Year Loan 100,000 4.55% 3.30% 1.25%
Liabilities: 6 month CD 100,000 1.15% 2.10% 0.95%
Margin:3.40% 2.20%
What happened to the 1.20%
(3.40% - 2.20%)?
EXERCISE #1

© 2016 Kaufman, Hall & Associates, LLC. All rights reserved.
4.55% (Loan)
Time
Rate
Deposit Spread 0.95%
1.15% (Deposit)
3.40%2.10%
3.30%
FTP Curve
Financial risks are managed by the treasury / funding center*Residual Spread is also called the Funding Center Spread or IRR Spread.
Credit Spread 1.25%
Funds Users
Funds ProvidersTreasury/Funds
3.30-2.10
FTP Illustration
Residual Spread* 1.20%

FTP Methodologies
The Evolution of FTP

© 2016 Kaufman, Hall & Associates, LLC. All rights reserved.
What methods are available to transfer price the balance sheet?
Net Funds
Pool
Record Level - Match Term
FTP Methodologies

© 2016 Kaufman, Hall & Associates, LLC. All rights reserved.
Net funds used/provided approach
For each profit center net all assets and liabilities and ascribe a cost/credit to
shortage/excess of funding for the branch / unit
• Branch earns $134,732 in interest;
With the funds credit on ~$450K:
• Against $58,128 in interest expense
• for a Total Margin of $76,604
Branch is self-funding and providing excess
funds of ~$456K
Branch is ‘credited’
for excess funds at
a rate of 3.00%
FTP Methodologies – Net Funding

© 2016 Kaufman, Hall & Associates, LLC. All rights reserved.
Some basic flaws in Transfer Pricing the net position
It assumes all assets and liabilities bring the same value to the bank
It rewards the wrong behavior
It cannot be used to support a decentralized decision making process. Other monitoring systems and directives need to be implemented.
All assets/liabilities are repriced each period, so there’s a moving target for measuring performance (risk remains in the unit)
It is arbitrary. Which transfer rate or rates to use for the net funds amount is a very subjective decision.
Cost of funds overstates the loan profits
Yield on assets overstates the deposit profits
FTP Methodologies – Net Funding

© 2016 Kaufman, Hall & Associates, LLC. All rights reserved.
Pricing the net funds position is the easiest approach to implement
But it really can’t be used for decision making
How do we use the same rate to transfer price fixed rate auto loans as variable
rate commercial loans?
Does an overnight deposit have the same value as a 12 month term deposit?
FTP Methodologies – Net Funding

© 2016 Kaufman, Hall & Associates, LLC. All rights reserved.
• Simple to implement
• Simple to administer
• No distinction between value for
assets or liabilities
• Doesn’t support product pricing
• Risk remains with the branch /
unit
• Arbitrary in nature – no basis for
assignment of transfer rate
• Does not add value…not worth considering as a valid FTP approach
ConsPros
Recommendation
FTP Methodologies – Net Funding

© 2016 Kaufman, Hall & Associates, LLC. All rights reserved.
Pool based approach
Create funding pools such as short-term, medium-term and long-term
Assign each product or portfolio type to a pool
The pool rates are updated monthly
The spread earned on fixed rate assets and liabilities changes because the pool rate changes
Short Term Pool
Floating Rate Instr.
Overnight Funds
Short-Term Investments
Money Market Accounts
Medium Term Pool
Autos
Certificates
ARMs
US Securities
Long Term Pool
Conv. Mortgages
DDA
MBS Securities
Cash & Due
FTP Methodologies – Pool

© 2016 Kaufman, Hall & Associates, LLC. All rights reserved.
Little confidence in the numbers
Results tend to be skewed
Ignores historical rates
No buy-in from line managers
The results change from period to period…cannot be managed
Risk remains in the branches / units
Ignores economic characteristics of instruments
FTP Methodologies – Pool

© 2016 Kaufman, Hall & Associates, LLC. All rights reserved.
• Relatively easy to administer
• Attempts to broadly match term
• More realistic than a single rate
• Appropriate for certain product
types (non-maturity)
• Overly simplifies portfolios
• A “good” loan can become a
“bad” one
• Continuously changing results
• Too imprecise to make strategic
decisions
• Only use as an introduction to the overall concept
Only use as an introduction to the overall concept
ConsPros
Recommendation
FTP Methodologies – Pool

© 2016 Kaufman, Hall & Associates, LLC. All rights reserved.
Record level – matched term approach
Transfer price at the individual instrument / record level based on all individual
characteristics the instrument
Origination/Pricing date; Term; Options; etc.
Expected cash flows
Each account receives funding from a centralized “funding desk” at the point of
origination
Based on the unique attributes of that instrument
Based on alternative market investment rates / borrowing costs at that time
Which remains with it for ‘term’ of the instrument
FTP Methodologies – Matched Term

© 2016 Kaufman, Hall & Associates, LLC. All rights reserved.
Requires a funding desk function
An internal entity is established to receive the double-entry charges and credits
from funds providers and fund users
There will always be a balance in the funding center
The behavior of the funding center should emulate the ALM assessment of your
institution
Treasury is responsible for managing overall funding mismatch
Treasury acts as broker/dealer by “buying” all funds sourced and “selling”
all funds used at origination based on alternative market rates based on
characteristics of each deal
FTP Methodologies – Matched Term

© 2016 Kaufman, Hall & Associates, LLC. All rights reserved.
Borrower
%$
Bank Lending Unit Treasury Unit
$
%
Credit NIM
Deposit Gatherers
$
%
Depositor
%$
Deposit NIM
Residual Margin
Bank Net Interest Margin
FTP Methodologies – Matched Term

© 2016 Kaufman, Hall & Associates, LLC. All rights reserved.
Category Product Balance Interest Rate FTP Rate Spread
Assets: 3 Year Loan 100,000 4.55% 3.30% 1.25%
Liabilities: 6 month CD 100,000 1.15% 2.10% 0.95%
Margin:3.40% 2.20%
EXERCISE #2

© 2016 Kaufman, Hall & Associates, LLC. All rights reserved.
Borrower
%$
Bank Lending Unit Treasury Unit
$
%
Credit NIM
Deposit Gatherers
$
%
Depositor
%$
Deposit NIM
Residual Margin
Bank Net Interest Margin
EXERCISE #2

© 2016 Kaufman, Hall & Associates, LLC. All rights reserved.
• Manageability – spreads are locked in
for the ‘life’ of a transaction
• Consistency - Both sides of the balance
sheet are valued against a single market
yield curve
• Risk Isolation - Line areas are insulated
from interest rate risk changes
• Margin Management - Disaggregates
margin into its proper components &
supports improved decision making
• Flexibility - Supports performance
measurement at all levels
• More time consuming to implement
• More difficult to administer (BUT NOT TO
DEFEND)
• Requires specific software to calculate
(but these solutions can bring
efficiencies to the overall process)
• The most accurate and widely used method to calculate FTP
ConsPros
Recommendation
FTP Methodologies – Matched Term

© 2016 Kaufman, Hall & Associates, LLC. All rights reserved.
Each transaction needs to be individually priced due to differences in
origination date, cash flow and pricing characteristics
FTP Methodologies – Matched Term

© 2016 Kaufman, Hall & Associates, LLC. All rights reserved.
Assigned Rate Method
Term to Maturity Method
Cash Flow Method
Repricing Term Method
FTP Methodologies – Matched Term Methods

© 2016 Kaufman, Hall & Associates, LLC. All rights reserved.
Primarily used for floating rate instruments or ambiguous term accounts
Uses Key Rates or Blended Rates to assign transfer rates
For example; DDA accounts may have an FTP rate derived from 20% of an overnight rate and 80% of a
2-year rate
Rates can derived through correlation or regression analysis
Apply the rolling average of the key rate or blended rate for the implied period
This reduces the volatility of the applied FTP rate and will smooth it over the pricing period (i.e., the 3-
year rolling average of the 3-year rate)
Assign short term rate based on repricing characteristics and add transfer rate
adjustment to account for liquidity
Assigned Rate Method
Funds Transfer Pricing – Matched Term Methods

© 2016 Kaufman, Hall & Associates, LLC. All rights reserved.
Record level – matched-term approach
Transfer price at the customer record level based on
Origination/Pricing date – Historical Yield Curves are needed!
Expected cash flows
Optionality (i.e., prepay)
* FTP Rate remains constant for ‘term’ of the instrument
Matched-Term (Term to Maturity; Cash Flow Method; Repricing Term Method)
FTP Methodologies – Matched Term Methods

© 2016 Kaufman, Hall & Associates, LLC. All rights reserved.
MethodAssign
RateTerm-to-Maturity Cash flow
Repricing
Term
Rate Type Floating Fixed Fixed; Adj. Adj.
Amortization
TypeAll Bullet Amortizing Bullet; Amortizing
TermAssigned Life/
BlendedMaturity Maturity; Reprice Reprice
Pricing Date Business PeriodOrigination /
Rollover
Origination / Rollover;
Previous RepricePrevious Reprice
Standard
Accounts
Savings, Checking,
Home Equity,
Floating Notes
CDs, Bonds, etc.Auto, Mortgage and
Commercial Loans
ARMs, Adj.
Commercial Loans,
Adjustable Notes
FTP Methodologies – Methods Matrix

© 2016 Kaufman, Hall & Associates, LLC. All rights reserved.
Create an internal yield curve that reflects alternative market rates for
wholesale funding/investing*
Libor Swap
FHLB Advance Curve
Corporate Credit Union Curve
Additional key rates (standard indexes or blended rates to price accounts
tied to Assigned Rate Method)
Prime, Fed Funds, etc.
1 mo. FHLB; 3 mo. FHLB, etc.
Blended rates (30% Prime; 40% 3 mo. FHLB; 30% 1 yr. FHLB)
*Can be adjusted for your institution’s ability to borrow
Funds Transfer Pricing – What Rates

© 2016 Kaufman, Hall & Associates, LLC. All rights reserved.
EXERCISE #3
Loan Balance: $10,000 Principal at Maturity
Interest Rate: 4.50%
Term: 12 months

© 2016 Kaufman, Hall & Associates, LLC. All rights reserved.
EXERCISE #4
Loan Balance: $10,000 Amortizing
Interest Rate: 4.50%
Term: 12 months

© 2016 Kaufman, Hall & Associates, LLC. All rights reserved.
What have we covered so far?
What it is:
FTP – the allocation of the institution’s Net Interest Margin to every account in the institution to help support
overall performance analysis
Why it is important:
FTP is a key component of profitability, budgeting and planning
How it is done:
Fund Users – are charged a cost for funds provided to them
Funds Providers – are given a credit for funds they provide to the institution
Funding Center – is “paid” to manage the institution’s risk (buys and sells funds from funds users and
providers)
The different methodologies to calculate FTP, all based on the underlying characteristics of each account
Assigned Rate
Term to Maturity
Cash Flow
Reprice Term

© 2016 Kaufman, Hall & Associates, LLC. All rights reserved.
Funds Transfer Pricing – the process of charging fund users and crediting fund providers
Service Transfer Pricing – the process of allocating centralized costs to profit centers
based on consumption or use. (Note: there are also Direct Costs/Income associated with
products, organizational units, etc.)
Capital Allocation – the process of allocating capital to allow measurement on a risk/return
basis
Multi-dimensional Reporting – the ability to flexibly slice and dice information
Components of Profitability
FTP as part of an overall Profitability Framework

© 2016 Kaufman, Hall & Associates, LLC. All rights reserved.
EXERCISE #5
FTP Loans & Deposit
Service Transfers
Capital Allocation

© 2016 Kaufman, Hall & Associates, LLC. All rights reserved.
Recap – Implementation Objectives
Objectives for implementing a funds transfer pricing system
Provide an accurate allocation of the interest margin for profitability measurement
Provide an internal set of benchmark rates
Provide guidance when pricing new business
Evaluate investment and funding decisions

© 2016 Kaufman, Hall & Associates, LLC. All rights reserved.
Funds users’ focus
Underwriting high quality assets
At best yields available
Funds providers’ focus
Sourcing adequate amount of funds
At lowest possible rates
Treasury or funds management
Interest rate risk exposure
Providing adequate liquidity
Recap – Division of Responsibilities

© 2016 Kaufman, Hall & Associates, LLC. All rights reserved.
An effective transfer pricing analysis enables institutions to:
Increase profitability
Make better pricing decisions
Evaluate investment and funding decisions
Identify the sources of profits
Improve the budgeting process
Evaluate the treasury group’s performance
Provide focus for the different areas of the institution
Reward desired performance & behavior
Develop teamwork & cooperation
Foster internal communication
FTP – Overall Benefits

© 2016 Kaufman, Hall & Associates, LLC. All rights reserved.
EXERCISE #6 - GROUP

© 2016 Kaufman, Hall & Associates, LLC. All rights reserved.
End of Section 1

© 2016 Kaufman, Hall & Associates, LLC. All rights reserved.
I. The Basic Tenets of Funds Transfer
Pricing
II. Next Steps in Analysis: Roadmap
to Decision Making
Agenda

© 2016 Kaufman, Hall & Associates, LLC. All rights reserved.
Traditional FTP Reporting…
FTP Reporting

© 2016 Kaufman, Hall & Associates, LLC. All rights reserved.52
Funds Transfer Pricing Summary - Auto Loans - Fixed
FTP Reporting = Traditional Detail Record Report

© 2016 Kaufman, Hall & Associates, LLC. All rights reserved.53
FTP Reporting- Traditional GL Report

© 2016 Kaufman, Hall & Associates, LLC. All rights reserved.
FTP Reporting
What kind of decisions can be made based on these reports?
Current period only
One dimensional, no alternative analytics capability
Gives insight into the results of what remains in the portfolio, but not the “why’s” and “how’s”

© 2016 Kaufman, Hall & Associates, LLC. All rights reserved.
Are we getting value from the reports we produce?
Each of the previous reporting types are important, BUT
1. What value are we getting out of the information?
2. Are we using the information to make decisions?

© 2016 Kaufman, Hall & Associates, LLC. All rights reserved.
• How should information be
consumed
• What additional context is needed
• Data and report access
Considerations

57© 2016 Kaufman, Hall & Associates, LLC. All rights reserved.
Best Practices Overview
DescriptiveAnalytics
DiagnosticAnalytics
PrescriptiveAnalytics
Leve
l of
Sop
his
tica
tio
n
Strategic Value
PredictiveAnalytics
What happened?
Why did it happen?
What will happen?
What is the best outcome and how can we make it happen?

© 2016 Kaufman, Hall & Associates, LLC. All rights reserved.
How can we filter, segment, sort and use additional data fields to help
make FTP more analytically friendly to drive more informed decisions?
Analytical FTP

© 2016 Kaufman, Hall & Associates, LLC. All rights reserved.
Advance Reporting

© 2016 Kaufman, Hall & Associates, LLC. All rights reserved.
FTP Margin

© 2016 Kaufman, Hall & Associates, LLC. All rights reserved.
FTP Margin Report

© 2016 Kaufman, Hall & Associates, LLC. All rights reserved.
FTP Decomposition Report

© 2016 Kaufman, Hall & Associates, LLC. All rights reserved.
FTP Trend Report

© 2016 Kaufman, Hall & Associates, LLC. All rights reserved.
The FTP Margin Composition Dashboard allocates the institution’s Net Interest Margin into its FTP
adjusted components. The margin is distributed into its three core pieces - Asset Spread, Liability
Spread and Funding Center Spread for any historical/forecasted period.
FTP Margin Decomposition Dashboard

© 2016 Kaufman, Hall & Associates, LLC. All rights reserved.
FTP Margin Decomposition Dashboard

© 2016 Kaufman, Hall & Associates, LLC. All rights reserved.
The Portfolio Margin Report allows the comparison of FTP Margin/Spread for any product at the
department level to that same product for the entire institution. Management can quickly understand
how historical pricing decisions effect portfolio performance.
Product Margin Dashboard

© 2016 Kaufman, Hall & Associates, LLC. All rights reserved.
Product Margin Dashboard

© 2016 Kaufman, Hall & Associates, LLC. All rights reserved.68
Funds Transfer Pricing Summary - Consumer Loan - Fixed
FTP Report – Traditional Detail Record Report
© 2016 Kaufman, Hall & Associates, LLC. All rights reserved.
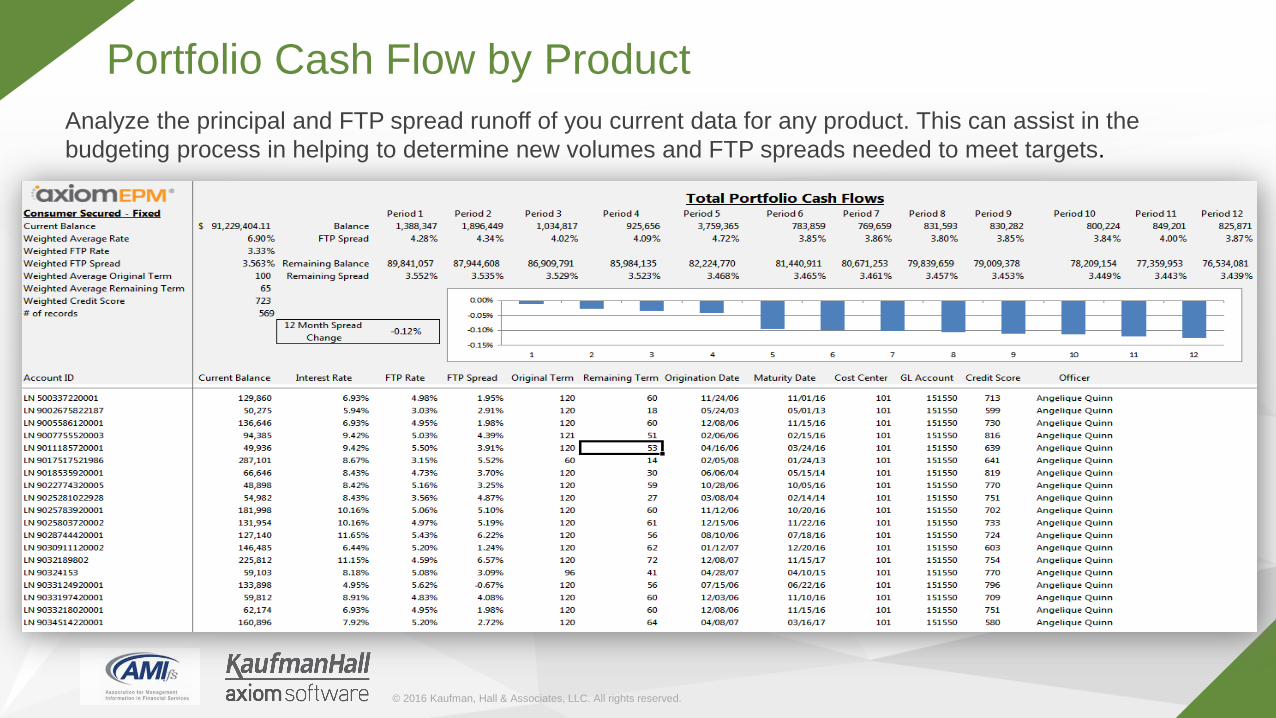
Analyze the principal and FTP spread runoff of you current data for any product. This can assist in the
budgeting process in helping to determine new volumes and FTP spreads needed to meet targets.
Portfolio Cash Flow by Product

© 2016 Kaufman, Hall & Associates, LLC. All rights reserved.
FTP Spread Simulation by Product

© 2016 Kaufman, Hall & Associates, LLC. All rights reserved.
Analyze the principal and FTP spread runoff of you current data for any department. This can assist in the
budgeting process in helping to determine new volumes and FTP spreads needed to meet targets.
Portfolio Cash Flow by Department

© 2016 Kaufman, Hall & Associates, LLC. All rights reserved.
The Portfolio Spread Credit Analysis report will analyze the risk-return profile (FTP Spread v Credit
Score) of any product in the institution. By reviewing the results in the graph, management can quickly
understand if risk based pricing is being deployed, within reason, in their pricing framework.
Portfolio Spread – Credit Analysis

© 2016 Kaufman, Hall & Associates, LLC. All rights reserved.
FTP SPREAD CREDIT ANALYSIS

© 2016 Kaufman, Hall & Associates, LLC. All rights reserved.74
Product Analysis

© 2016 Kaufman, Hall & Associates, LLC. All rights reserved.
FTP Spread Credit Analysis
© 2016 Kaufman, Hall & Associates, LLC. All rights reserved.
$92,745
4.79%
0.00%
2.00%
4.00%
6.00%
0
25,000
50,000
75,000
100,000
Consumer Fixed
Balance
Spread
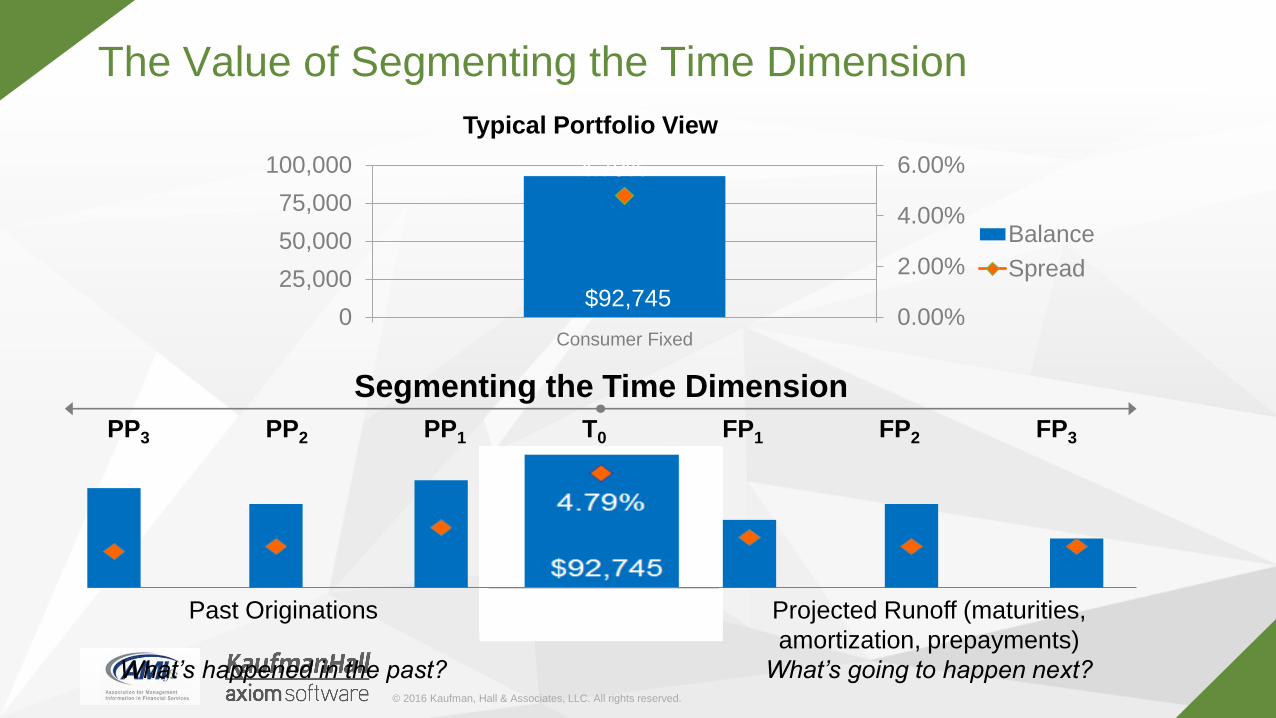
Typical Portfolio View
Segmenting the Time Dimension
PP3 PP2 PP1 T0 FP1 FP2 FP3
Projected Runoff (maturities,
amortization, prepayments)
Past Originations
What’s going to happen next?What’s happened in the past?
The Value of Segmenting the Time Dimension

© 2016 Kaufman, Hall & Associates, LLC. All rights reserved.
Analyze the principal and FTP spread runoff of you current data for any officer. This can assist in the
budgeting process in helping to determine new volumes and FTP spreads needed to meet targets.
Portfolio Cash Flow by Officer

© 2016 Kaufman, Hall & Associates, LLC. All rights reserved.
The New Origination Spread by Officer allows a manger to quickly rank which loan officers have
originated the most volumes in the defined time period. It will also rank the average FTP Spread that
has been booked for those volumes, so management can gain insight to the pricing decisions those
officers have made. This can be processed for any product type.
New Origination Spread by Officer

© 2016 Kaufman, Hall & Associates, LLC. All rights reserved.
Used in conjunction with the previous report (New Origination Spread by Officer), the Spread Trend
Report allows management to analyze an officer’s historical pricing trends by product for any
designated year.
Product Spread Trend by Officer

© 2016 Kaufman, Hall & Associates, LLC. All rights reserved.
Analyze the principal and FTP spread runoff of you current data for any officer This can assist in
the budgeting process in helping to determine new volumes and FTP spreads needed to meet
targets.
Portfolio Officer Analysis

© 2016 Kaufman, Hall & Associates, LLC. All rights reserved.
Segmenting the Time Dimension
PP 3 PP2 PP1 T0 FP1 FP2 FP2
Projected Runoff (maturities,
amortization, prepayments)
Past Originations
The Value of Segmenting the Time Dimension

© 2016 Kaufman, Hall & Associates, LLC. All rights reserved.
1. Underlying Data Structure – most FTP systems are
transaction/calculation oriented – not analytics oriented
2. System Integration – FTP information could enrich other
systems & processes but integration often proves
challenging (i.e. Budgeting, Incentive Compensation, Loan
Pricing)
3. Data integration – FTP systems often don’t include
important data elements that would improve analytics –
e.g. officer code or credit score
4. Reporting – reporting capabilities are often limited to
transaction or G/L focused reports not analytically focused
reports
What are the challenges to deriving more value
from FTP:
What’s Stopping Us?

© 2016 Kaufman, Hall & Associates, LLC. All rights reserved.
− Decomposing the margin
− Inclusion of additional fields allows for better visibility into the contributors of margin
− Standard FTP reports typically do not explain the “why” and cannot give insights into the “what will
be”
Advanced Analytics Recap
© 2016 Kaufman, Hall & Associates, LLC. All rights reserved.
Append additional fields to the transfer record
Credit Score, Risk Ratings
Officer
Zip Code
Sort and Filter – Don’t think of these as fields just to report on
Organizational Dimension (Market, Region, Line of Business, Branch)
Product Dimension (Category, Product, Sub-Product)
Officer Dimension (SVP, VP, Loan Officer)
Time Dimension: Reporting Period, QTD, YTD
Perform Segmentation Analysis on the Time Dimension
Historical – focusing on historical originations
Current – focusing on most recent period’s originations
Prospective – projecting changes looking forward at maturities
Risk Return Analysis
Insure a more risk based pricing mindset is being adopted by your institution
Incorporate FTP in other Systems or Processes
Forward Rate FTP in the budgeting process
FTP Spreads as part of the Incentive Compensation Management Process
On Demand Loan Pricing
Examples for Deriving More Value from FTP

© 2016 Kaufman, Hall & Associates, LLC. All rights reserved.
Focus should be on analyzing and using information, not just scrubbing and compiling data
Add data fields that enhance analysis
Look at projected maturities and historical trends to help focus on possible future trends
Analyze data by various dimensions (officer, product, organization)
Consider including FTP in other process (Budgeting, ICM)
Think outside system constraints…..
Recap

© 2016 Kaufman, Hall & Associates, LLC. All rights reserved.
End of Section 2