Embed Size (px)
Citation preview

Fulton County Schools
State of the Charter Report For School Year 2011/12

Executive Summary
Fulton County Schools (FCS) has included charter schools in its portfolio of school offerings for over a decade. In the 2011/12 school year, FCS authorized 12 charter schools. Approximately ten percent (10%) of FCS students attend charters. This report summarizes charter sector issues and trends as identified through FCS oversight. A companion piece, The Interim Compliance Report, is issued directly to the charter schools over the summer months. It identifies issues and trends specific to each individual school. This report is intended to inform the Fulton County Board of Education so they may make data based decisions regarding FCS charter schools.
Attendance Trend Analysis • The charter sector continues to experience strong community support as demonstrated by capacity
building attendance and significant wait lists. • The charter sector serves a more racially diverse student body and more students in poverty than the
system average. • Program attendance indicates that the school system serves students who qualify for special program
offerings at significantly higher rates than the charters.
Governance Performance Analysis • All governing boards are implementing the concepts in the FCS training program. • All governing boards are minimally compliant to federal Sunshine standards. • On-going training for experienced board members is needed.
Academic Performance Analysis
• Charter school performance is closely tied to the student body poverty levels. • Elementary charter school performance is not distinguishable from typical school performance. • Start up charter middle schools consistently perform as well or better than their typical school
counterparts in the areas analyzed, especially in the area of Math. • High school performance data is greatly impacted by various patterns of courses offerings and student
selection patterns based on the areas of academic emphasis in the schools. .
Financial Analysis • All charters, with the exception of FSAHS and Main Street Academy, reflect positive indicators in the
four areas of analysis. • Occupancy costs remain a concern for charters in the north Fulton communities. • Sustainability ratios indicate serious concerns for three schools.
Personnel Analysis
• Charter school salaries are consistently less than system salaries. • The percentage of charter teachers with certification is trending higher. • The sector continues to see a higher turnover rate and a teaching staff with low levels of experience than
the system. • Recent changes in the Georgia Professional Standards Commission will require more oversight on the
part of the system in the area of charter school personnel.
May 2013 Page 2

Introduction: Fulton County Schools (FCS) believes that every student should be educated to his/her fullest potential. To that end we recently became Georgia’s largest charter system. Under the terms of this five year performance contract with the Georgia Department of Education, we are implementing a five year plan of systemic innovations as well as creating pathways for community led school level innovations. Autonomous charter schools are a vital part of the FCS charter system plan. The framework breaking perspective that successful charter schools bring to our system will lead the system in cutting edge innovations that may be replicated at individual schools or may inform further systemic changes. The FCS collaborative approach to chartering has resulted in a selective and diverse portfolio of charter schools that serve over 10% of the students in our county. Additional charters may be added through either the General Application process or the newly added Request for Charter Petition process. This report summarizes sector issues and trends as identified through FCS oversight. Generally published in the winter, this year’s report was timed to coincide with the release of the new Georgia Career and College Readiness Performance Index. A companion piece, The Interim Compliance Report, is issued directly to the charter schools over the summer months. It identifies issues and trends specific to each individual school. Through these reports, charter schools are provided the information needed to support student success and refine their practices to improve performance. Also, systemic oversight provides the school system sufficient information to identify charters which do not meet expectations financially, operationally, or in the area of student performance and take steps to either remediate or close those charters. Conversely, the data indicating successful charters is used to inform the system about useful practices that may be applied to other FCS schools. Finally, the information in this report is intended to inform the Fulton County Board of Education so they may make data based decisions regarding these schools as it relates to their responsibility as authorizers. This annual State of the Charter School report includes the following sections for all charters:
1. Pull Out Sheets for Charter Contact Information and Charter Offerings page 4 2. Attendance Trend Analysis page 7 3. Governance Performance Analysis page 12 4. Academic Performance Analysis page 14
Since every conversion charter has delegated financial and personnel responsibilities to FCS, only the start up charter schools are reviewed in the following sections:
7. Financial Analysis page 19 8. Personnel Analysis page 23
Finally, a review of the major initiatives within the department to confirm alignment with FCBOE policy is presented in these sections.
9. Overview of Charter Department Events page 27 10. Appendices A through F page 30
Complete original databases are available upon request.
May 2013 Page 3

FCS Charter Summary Sheet
2012-2013 School Year Note: Riverwood International Charter and Spalding Drive Charter elected to join Cohort One and will cease being conversion charter schools. FSAHS has been recommended for termination and the State Board of Education decision is pending at this writing.
Start Up Charters Grades Innovations First Year Contract Term
Amana Academy http://www.amanaacademy.org/ 285 South Main Street, Alpharetta 30009 Mr. Ehab Jaleel 678-624-0989
K – 8 Expeditionary Learning Instructional Model Dual Language in middle school Single Gender Classes in middle school Teacher Looping Parent Governance Admission by Lottery
2005-06 6/09 – 7/14
Fulton Science Academy High School (TEACH) http://www.fultonteach.org 4100 Old Milton Parkway, Suite 100, Alpharetta 30005 Mr. Namik Sercan 770-475-3223
9 - 12 Increased use of technology Enhanced Course Selections TAG approaches in all classes Small class size Higher graduation standards Shared Governance between private non-profit and parents Admission by Lottery
06-07 6/10 – 7/15
Fulton Sunshine Academy www.fultonsunshine.org/ 1335 Northmeadow Parkway, Roswell 30076 Mr. Murat Cetin 770-410-1500
K – 5 Foundational Approaches in Science Teaching (FAST) and Connected Math (CMP) Curriculum
Mandatory Uniforms Shared Governance between private non-profit and parents Admission by Lottery
2010-2011 7/10-6/15
Hapeville Charter School http://www.fultonschools.org/
school/hapevillems
Hapeville MS Campus 3535 South Fulton Avenue,
Hapeville 30354 Ms. Marcia Lowe
404-767-7730
6 – 8
Foundational Approaches in Science Teaching FAST and Connected Math (CMP) Curriculum
Enhanced Course Selections Santilliana Spanish Dual Language Instruction Saturday classes for selected remediation and enhancement Shared Governance between non-profit and parents Mandatory Uniforms
2004-05 6/09 – 7/19
May 2013 Page 4

Hapeville Career Academy Campus
6045 Buffington Road, Union City 30349
Mr. Jannard Rainey 404-766-0101
9 - 12 Stand-alone Career Academy in partnership with the Airport and Atlanta Tech. in areas of Auto, Avionics, Dental, Paralegal, Patient Care.
Saturday classes for selected remediation and enhancement Shared Governance between non-profit and parents Mandatory Uniforms Admission by Lottery
KIPP South Fulton Academy http://www.kippsouthfulton.org 1286 E. Washington Avenue, East Point 30344 Mr. Jondre Pryor 678-278-0160
5 – 8 7:30 – 5:00 school day; 2 hours daily of homework; Mandatory Summer Session and bi-monthly Saturday School Strong discipline and behavior expectations Character Education Program: Family, Integrity, Responsibility, Excellence
(FIRE) Increased PE time Teachers on call 24/7 via individual cell phones No arts, music, etc. Shared Governance between non-profit and parents Admission by Lottery
2003-04 6/08 – 7/13
Main Street Academy www.tricitiescharter.org 3480 E. Main Street, College Park 30337 Mr. Jeff Homan 404-763-3900
K-8 Edison Learning Educational Management Company operates the school Extended School Year and Day World Language in all grades Mandatory Uniforms Parent Governance Admission by Lottery
2010-2011 7/10-6/15
Conversion Charters Grades Innovations First Year Charter
Term Spalding Drive Charter http://www.fultonschools.org/ school/spaldingdrivecharter/index.asp 130 W. Spalding Drive N.E., Sandy Springs 30328 Ms. Christine Young 770-551-5880
PK – 5 Student clustering based on ability Additional teacher training/endorsements and contracts required Enhanced technology use/Instructional methods Mandatory Uniforms Required parental involvement/Coordinator Additional Early Release Days/adapted school schedule Longitudinal student assessment practices in conjunction with e-portfolios Parent/Teacher Governance Enrollment county-wide if student body drops below 450
2002-03 6/09-7/14
May 2013 Page 5

Ridgeview Middle Charter http://www.fultonschools.org/ school/ridgeview 5340 S. Trimble Road, Sandy Springs 30342 Ms. Lisa Hastey 404-843-7710
6 – 8 IBO MYP Curriculum/Coordinator/Assessment cycles Mandatory Uniforms Heritage Language Program in Spanish Non-profit organization for competitive sports Monitored parental involvement Parent/Teacher Governance Enrollment state-wide if Governance Board allows
2006-07 6/06 – 7/17
Sandy Springs Middle www.ssmsonline.org 8750 Colonel Drive N.E., Sandy Springs 30350 OPEN 770-552-4970
6 – 8 Arts infused instructional methods Latin course offering Enhanced Middle School best practices Mandatory Uniforms Required parental involvement Parent/Teacher Governance Enrollment state-wide if Governance Board allows
2009-10 6/09 – 7/14
North Springs Charter http://www.northspringshigh. com 7447 Roswell Road, Sandy Springs 30328 Dr. Lisa Stueve 770-551-2490
9 – 12 Problem/Project based enhanced curriculum and instructional methods Four Houses of Instruction Enhanced Student Government involvement Enhanced tutoring for failing students Additional Early Release Days/Adapted Schedule Teacher Coach for additional teacher training/assessment Enhanced technology use/instructional methods Required parental involvement Parent/Teacher Governance Board Enrollment state-wide if Governance Board allows
2007-08 6/07 – 7/15
Riverwood International Charter http://www.riverwoodhs.org/ 5900 Raider Drive, Sandy Springs 30328 Mr. Chris Triolo 404-847-1980
9 - 12 IBO MYP/DP/ Curriculum/Coordinator/Assessment cycle Heritage Language Program Enhanced technology use/instructional methods Required parental involvement Parent/Teacher Governance Board Enrollment state-wide if Governance Board allows
2008-09 6/08 – 7/13
May 2013 Page 6

Attendance Trend Analysis Summary:
• The charter sector continues to experience strong community support as demonstrated by capacity building attendance and significant wait lists. The only exception to this pattern is Fulton Science Academy High School which is not meeting its attendance targets.
• The charter sector serves a more racially diverse student body and more students in poverty than the system average. Charters serve a significantly higher percentage of male students, with the exceptions being North Springs Charter High School and Hapeville Middle School.
• However, program attendance indicates that the school system serves students who qualify for special program offerings at significantly higher rates than the charters (i.e. Special Education, English to Speakers of Other Languages, etc.).
Fulton County Schools has included charter schools in its portfolio of school offerings for over a decade. In SY 11/12, FCS authorized 12 charter schools, seven start up and five conversion charters. Approximately 4,100 students attended start ups and 6,000 attended conversions; around 10% of FCS students attended charters. Start up charter schools are complete schools of choice meaning students from anywhere in the county system are eligible to apply. Conversion schools are limited schools of choice; the system requires that all students living in the charter’s transportation zone be given preferential enrollment status to the charter. If there are open slots, the conversion charter school governing board may control additional enrollment zones. As local families continue the pattern of returning to the public school system, the number of slots available to families living outside the conversion schools’ transportation zones is dwindling. Due to the county-wide nature of the charter attendance zones, analysis in this section will reflect county averages for SY 11/12. The actual number enrolled at a school may vary from month to month. All data was retrieved from the Fulton County Schools student information system for SY 11/12. (NOTE: The scale on the charts may vary.)
May 2013 Page - 7 -

Attendance Fundamentals
School # of Students Attendance Zone Grades Served
Amana Academy 649 County-wide K - 8 Fulton Science Academy
HS 249 County-wide 9 - 12
Fulton Sunshine 550 County-wide K - 5 Hapeville MS 543 County-wide 6 - 7
Hapeville Career Academy 674 County-wide 8 - 12
KIPP South Fulton Academy 319 County-wide 5 - 8
Main Street Academy 821 County-wide K - 8 North Springs Charter
High 1637 State-wide 9 - 12
Ridgeview Charter 946 State-wide 6 - 8 Riverwood International
Charter 1698 County-wide 9 - 12
Sandy Springs Middle Charter 891 County-wide 6 - 8
Spalding Drive Charter 499 Transportation Zone K - 5 Race/Subgroup Observations
0%
10%
20%
30%
40%
50%
60%
Student Race Percentages
Start Up
Conversion
FCS
• As a group, start up charters served a higher percentage of Black (56%) and Asian (14%) students than the FCS average (42% and 10% respectively). Start up charters located in the South Learning Community served a larger percentage of Black students (90%) than did those across the rest of the district. Similarly, start up charters located in the two
May 2013 Page - 8 -

north Learning Communities served a larger percentage of Asian students (28%) than did those across the rest of the district.
• Conversion schools served a higher percentage of Hispanic students (23%) than start ups (5%) or the system (13%).
• Conversion schools also served a higher percentage of White students (38%) than start ups (22%) or the system (32%).
• There was a significant entry of White students and a significant exit of Hispanic students in the transition from the conversion middle school to the conversion high school in both Riverwood and North Springs feeder patterns. The Black population remained stable.
Program Observations
0%
5%
10%
15%
20%
25%
Student Program Percentages
Start Up
Conversion
FCS
0%
5%
10%
15%
20%
25%
30%
35%
40%
45%
50%
Student Free & Reduced Averages
Start Up
Conversion
FCS
May 2013 Page - 9 -

• Charter schools seemed to attract students in a more concentrated program pattern than the system average. For example, some charters were strongly serving ESOL students (Ridgeview – 19% to the system’s 6%) while others were strongly serving students in poverty (Hapeville Middle – 80% to the system’s 45%). However, across the entire charter sector the percentage of students receiving services in the combined program category (33%) was smaller than the percentage of students receiving program services in the system average (59%).
• The start up charters had significantly lower percentages of students in the ESOL program (2%) as well as Limited English Program (4%). The system average was 6% and 9% respectively.
• Ridgeview Middle had the highest percentage of gifted students in the conversion schools with 25%. Twenty-seven percent (27%) of the student at Fulton Sunshine Academy were gifted, the highest of all start up schools. The system average was 21%. As a whole, both conversion and start up charters served a smaller percentage of gifted students than the system average.
• Both start up and conversions served a lower percentage of students in remedial programs than the system average. Additionally, both start up and conversion schools had lower percentages of students with special education needs than the system average.
• The charter sector served a slightly higher percentage of students in poverty that the system average. However, when analyzed by Learning Community, a more detailed understanding was revealed. Amana and Hapeville Middle both served a higher percentage of students in poverty than the average in their Learning Communities. Main Street Academy, Fulton Sunshine and Fulton Science High serve fewer students in poverty than the average in their Learning Communities. Both KIPP South Fulton and
May 2013 Page - 10 -

Hapeville Career Academy were fairly similar to their Learning Community in respects to poverty.
Male/Female Observations
0%
10%
20%
30%
40%
50%
60%
Female Male
Student Gender Percentages
Start Up
Conversion
FCS
• Charter schools as a sector serve a higher percentage of males than the FCS average, with start ups serving a higher percentage of males than conversions. Fulton Sunshine Academy (57%), Main Street Academy (55%) and Hapeville Career Academy (55%) serve males at an average much higher than FCS (51%).
• However, North Springs Charter High School (59%) serves a significantly higher female population than the FCS average (48%).
May 2013 Page - 11 -

Governance Performance Analysis
Summary: • Ninety-six percent (96%) of governing board members attended training. • Follow up observations indicate that all governing boards are implementing the
concepts in the training program with varying degrees of success. • To date, all governing boards are minimally compliant to federal Sunshine
standards. • The level of expertise and the degree of authority utilized varies greatly from charter to
charter. • On-going training for experienced board members is needed.
Charter law allows school systems to delegate certain specific responsibilities to local governing bodies as specified by the charter contract. According to O. C. G. A. 20-2-2062, "School level governance" means decision-making authority in:
• personnel decisions, • financial decisions, • curriculum and instruction, • resource allocation, • establishing and monitoring the achievement of school
improvement goals, and • school operations.
The district’s move to charter system status necessitates of clarification in terms.
• Local School Advisory Councils (LSACs) advise the principal. • School Governing Councils (SGCs) serve FCS typical schools in one of the three System
Cohorts. • Governing Boards (GB) serve charter schools.
Currently, over 90 volunteers serve on the governing boards in the 12 FCS charter schools. FCS conducted three (3) five hour training sessions for over 40 new governing board members to assist them in this important task. In September and November, governing board members attended a workshop held at Ridgeview Charter School. A December workshop was held at Central Office. The topics covered included: Governance Theory, Charter Law, Financial Practices, Performance Assessments, and Best Practices.
Additionally, governing boards are observed twice a year using the tool found in Appendix A. The purpose of the observation is to monitor compliance as well as observe and document best practices. Observations:
• Every charter was represented at the training as well as representatives from the pending Chattahoochee Hills Charter School. The KIPP SFA governing board is moving through the transition under their new charter contract and that new governing body will be trained and evaluated in SY 13/14.
May 2013 Page - 12 -

• Four (4) of the 90 FCS governing board members were not able to attend any of the three trainings. Non-compliance in this area will be indicated in each school’s Interim Compliance Report in June.
• Feedback results indicate that 89% of the new members believed the topics covered were useful. However, 22% wanted the training to be more detailed and less rushed.
• Beginning in February, the system began observations of governing board meetings and monitoring compliance under the Open Meetings Act. As of this writing all charter schools have had at least one observation.
May 2013 Page - 13 -

Academic Performance Analysis Summary:
• As with typical schools, charter school performance is closely tied to the poverty levels of the student body. However, KIPP South Fulton Academy and North Springs Charter High School consistently exceed expectations based on their poverty levels.
• Elementary charter school performance is not distinguishable from typical school performance in the areas reviewed. Indeed, in the “Exceeds” category of the CRCT, elementary charter schools consistently perform lower than similar typical schools, with Fulton Sunshine being the one exception and only in the area of 5th grade reading “Exceeds”.
• Start up charter middle schools consistently perform as well or better than their typical school counterparts in the areas analyzed, especially in the area of Math. Conversion middle charters perform in the same range as typical schools.
• High school performance data is greatly impacted by various patterns of courses offerings and student selection patterns based on the areas of academic emphasis in the schools. Those wishing to learn more about a specific high school are strongly encouraged to examine the CCRPI in detail. However, in the broadest of terms, North Springs Charter High School generally meets or exceeds expectations, Hapeville Career Academy generally does not meet expectations, and Riverwood and Fulton Science High are not distinguishable from similar typical schools.
• While this report reflects standardized tests scores primarily, the new CCRPI will add more depth and understanding of school performance. However, this CCRPI inaugural year will not provide a great deal of meaningful information until trend lines are established.
Charter schools are required to meet or exceed the same academic expectations as typical schools, are held accountable under the No Child Left Behind Act (NCLB), and are required to participate in all state mandated tests. Additional nationally normed tests such at the Iowa Test of Basic Skills (ITBS) can be selected by the charter governing body. FCS requires that charters also compare their student performance to similar typical FCS school performance. FCS has included the charter schools in our School Improvement Plan processes and in all academic reporting. The individual academic performance data for each school in FCS are also already available to the FCBOE and to each school through the FCS Accountability Office. The Georgia Department of Education has released the first-ever Georgia College and Career Ready Performance Index (CCRPI). The CCRPI is the new accountability system that replaces the No Child Left Behind (NCLB) Adequate Yearly Progress (AYP) measurement in Georgia. The CCRPI measures schools on a 100 point scale. The complete CCRPI Report is available on the Fulton County Schools website.
May 2013 Page - 14 -
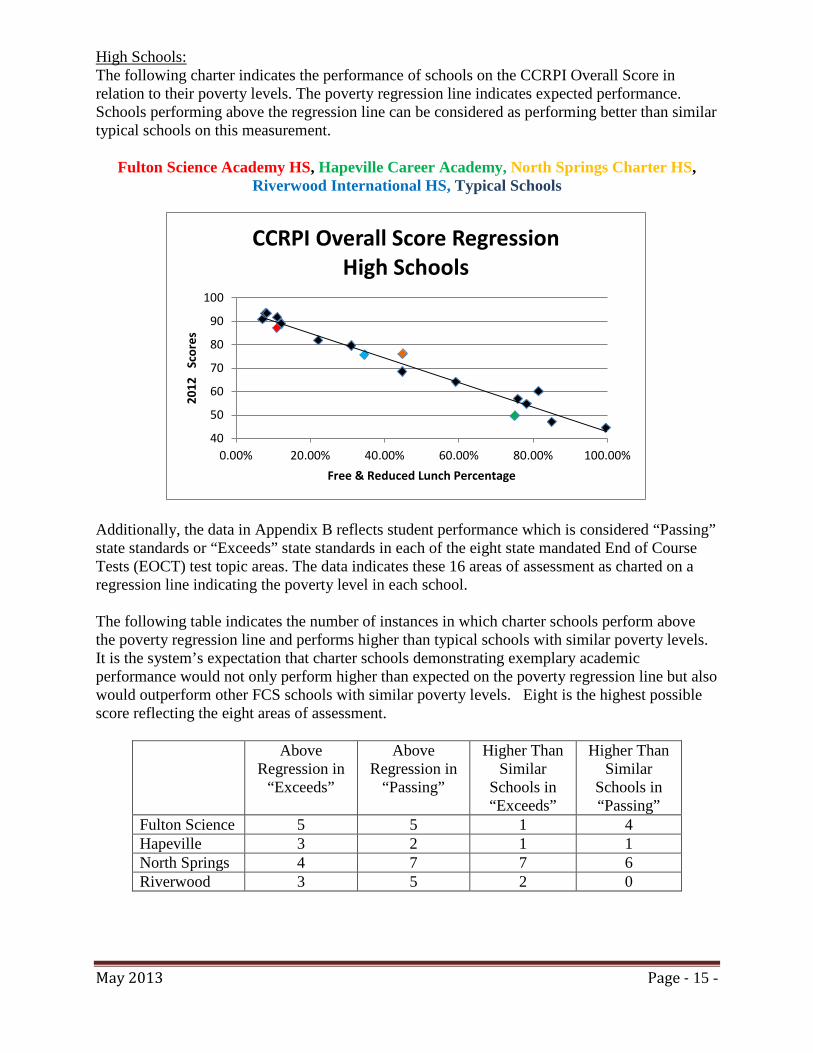
High Schools: The following charter indicates the performance of schools on the CCRPI Overall Score in relation to their poverty levels. The poverty regression line indicates expected performance. Schools performing above the regression line can be considered as performing better than similar typical schools on this measurement.
Fulton Science Academy HS, Hapeville Career Academy, North Springs Charter HS, Riverwood International HS, Typical Schools
Additionally, the data in Appendix B reflects student performance which is considered “Passing” state standards or “Exceeds” state standards in each of the eight state mandated End of Course Tests (EOCT) test topic areas. The data indicates these 16 areas of assessment as charted on a regression line indicating the poverty level in each school. The following table indicates the number of instances in which charter schools perform above the poverty regression line and performs higher than typical schools with similar poverty levels. It is the system’s expectation that charter schools demonstrating exemplary academic performance would not only perform higher than expected on the poverty regression line but also would outperform other FCS schools with similar poverty levels. Eight is the highest possible score reflecting the eight areas of assessment.
Above Regression in
“Exceeds”
Above Regression in
“Passing”
Higher Than Similar
Schools in “Exceeds”
Higher Than Similar
Schools in “Passing”
Fulton Science 5 5 1 4 Hapeville 3 2 1 1 North Springs 4 7 7 6 Riverwood 3 5 2 0
40
50
60
70
80
90
100
0.00% 20.00% 40.00% 60.00% 80.00% 100.00%
2012
Sc
ores
Free & Reduced Lunch Percentage
CCRPI Overall Score Regression High Schools
May 2013 Page - 15 -

Observations:
• FSAHS performs above expectations in a majority of EOCT areas given the poverty level but does not perform better than similar typical schools in both the CCRPI or in a majority of EOCT areas, especially in the “Exceeds” category.
• Hapeville Career Academy does not perform above expectations in a majority of EOCT areas given the poverty level and does not perform better than similar typical schools in the CCRPI or in a majority of EOCT areas. (Note: HCA is only in its third year of operations, so no Economics and Physical Science EOCTs were administered.)
• North Springs performs above expectations in both the CCRPI and in a majority of EOCT areas given the poverty level and performs better than similar typical schools in a majority of EOCT areas.
• Riverwood International performs above expectations in a majority of EOCT areas given the poverty levels in the “Passing” category, but does not perform better than similar typical schools in a majority of EOCT areas, especially in the “Exceeds” category. It performs as expected in the CCRPI.
Lower Schools The following charter indicates the performance of schools on the CCRPI Overall Score in relation to their poverty levels. The poverty regression line indicates expected performance. Schools performing above the regression line can be considered as performing better than similar typical schools on this measurement.
Amana Academy, KIPP South Fulton Academy, Main Street Academy, Sunshine , Typical Schools Academy
405060708090
100110
0.00% 20.00% 40.00% 60.00% 80.00% 100.00%
2012
Sc
ores
Free & Reduced Lunch Percentage
CCRPI Overall Score Regression Elementary Schools
May 2013 Page - 16 -

Amana Academy, Hapeville, KIPP South Fulton Academy, Main Street Academy,
Ridgeview, Sandy Springs, Typical Schools
The data in Appendix C indicates assessment in the state mandated Criterion Referenced Competency Tests (CRCT) in the areas of Math and Reading only. The data reflects student performance which is considered “Passing” state standards or “Exceeds” state standards. Performance is charted on a regression line indicating the poverty level in each school. The following chart indicates the number of instances in which charter schools perform above the poverty regression line and performs higher than typical schools with similar poverty levels. It is the system’s expectation that charter schools demonstrating exemplary academic performance would not only perform higher than expected on the poverty regression line but also would outperform other FCS schools with similar poverty levels. Two is the highest possible score reflecting the two areas of assessment (Math and Reading). A number of typical and charter schools in the county scored 100% in the “Passing” category and would, therefore not be able to perform “Higher than Similar Schools”. Those 100% scores are indicated.
Above Regression in
“Exceeds”
Above Regression in
“Passing”
Higher Than Similar
Schools in “Exceeds”
Higher Than Similar
Schools in “Passing”
CRCT 8th Amana 2 2 2 2 Hapeville MS 2 2 2 2 KIPP SFA 1 2 0 1 Ridgeview 1 0 0 0 Sandy Springs 1 1 0 0
405060708090
100110
0.00% 20.00% 40.00% 60.00% 80.00% 100.00%
2012
Sc
ores
Free & Reduced Lunch Percentage
CCRPI Overall Score Regression Middle Schools
May 2013 Page - 17 -

CRCT 5th Amana 0 1 0 0 (100%
Reading) Fulton Sunshine 1 1 0 0 (100%
Reading) KIPP SFA 2 0 0 0 Main Street 0 0 0 0
CRCT 3rd Amana 0 2 0 0 Fulton Sunshine 2 2 0 0 (100%
Reading) Main Street 0 2 0 0
Observations: The results of the CCRPI are reflective of the details in the CRCT. KIPP South Fulton and Hapeville Middle perform above the regression while Main Street Academy does not meet expectations. Amana, Ridgeview and Sandy Springs perform as expected.
8th Grade CRCT • The range was between 94% and 100% for all FCS middle schools 8th grade Reading in
the “Passing” category. The small range makes comparative statements in this area very challenging. However, it is an indication of the overall adequate performance of all FCS 8th grades in this area to include charter schools.
• Amana Academy and Hapeville Middle School are both performing above expectations consistently in 8th grade Math and Reading.
• Hapeville Middle far outperforms expectations in Math in the “Exceeds” area. Both Hapeville and KIPP SFA strongly outperform expectations in Math “Passing”.
• Ridgeview performance meets expectations in the Reading “Exceeds” area, but does not meet expectations in the other three areas shown.
• Sandy Springs Middle outperforms expectations in the Reading “Passing” area and meets expectations in Math “Passing”. The school meets expectations in both “Exceeds” areas.
5th Grade CRCT • Both Amana and Fulton Sunshine joined the numerous FCS typical schools scoring 100%
in the area of Reading “Passing”. • Amana did not meet expectations in the “Exceeds” category in either Math or Reading. • Main Street did not meet expectations in any of the areas shown. • Unlike 8th grade, KIPP SFA performs more strongly in the “Exceeds” than in the
“Passing” category in both Math and Reading. • Fulton Sunshine met expectations in Reading, but did not meet expectations in Math in
either “Passing” or “Exceeds”. 3rd Grade CRCT
• As in 5th grade, Amana met expectations in “Passing” but not in “Exceeds” in both Math and Reading.
• Fulton Sunshine and Main Street Academy performed in the same range as similar typical schools in all areas.
May 2013 Page - 18 -

Financial Analysis Summary:
• All charters, with the exception of FSAHS and Main Street Academy, reflect positive indicators in the four areas of analysis.
• Main Street Academy is trending toward an improved financial position in all indicators.
• Occupancy costs remain a concern for charters in the north Fulton communities. • Sustainability ratios indicate serious concerns for FSAHS, Fulton Sunshine
Academy and Main Street Academy. • The state requirement of annual audits results in a clear picture of charter financial health,
but the financial focus is always a year behind the actuals.
FCS start up charter schools are required to submit financial statements every month and their state Annual Audit each October 1. The May 2009 report from the National Consensus Panel on Charter School Operational Quality sponsored in part by the National Association of Charter School Authorizers indicated the Liquidity, Sustainability, and Occupancy Expenses were useful measures of a charter schools’ financial performance. Based on feedback from board members as well as the as the October 2010 charter case study from the Andrew Young School of Policy Studies at Georgia State University, a Debt – Asset measure has also been included. Additionally, this year a “Per Pupil Analysis” pilot is provided in Appendix E. These comparisons are designed to assist current schools in understanding their revenue and expenditures in comparison to the other charters in the district as well as provide valuable information to prospective charter petitioners. The start up charter schools’ governing board will be surveyed in the fall to determine if the tool is a useful addition to this report and if any alterations would be useful. 1. Liquidity Ratio compares a charter school’s assets (what they “own”) to liabilities (what they “owe”). The charter’s liquidity ratio is calculated as its total assets less its total liability as a percentage of their total expenses. A school with a high liquidity ratio is better able to raise additional capital, either through selling off or borrowing, against its assets.
Observations:
• Amana improved its liquidity ratio due in part to increase grant revenues for capital improvements and strong enrollment patterns.
Amana FSA HS Hapeville KIPP SFA Sunshine TMSA
2009 0.18 -0.02 1.74 0.17 2010 0.12 0.28 1.27 0.34 opened opened
2011 0.15 0.34 1.15 0.73 0.09 -0.06
2012 1.31 0.19 0.91 0.84 0.12 -0.02
May 2013 Page - 19 -

• FSAHS improved its liquidity ratio as a direct result of the FCBOE directive in 2009 to lower the charter’s liabilities as a condition of renewal. However, recent governing board decisions and the inability to increase student numbers has seen a significant decline in the school’s liquidity. Additionally, the school’s Annual Financial Audit only included the school’s default on a $19M bond as a subsequent event. The school’s ability to raise additional capital to finance additional activities will be impacted by the default.
• Hapeville’s liquidity ratio continues to decrease, due in part to the continued expansion in their programming.
• KIPP SFA improved its liquidity ratio. The charter’s assets have increased and the liabilities decreased while expenses have remained relatively the same. This is due in part to the school’s purchase of their facility and consolidation of back office services.
• Fulton Sunshine Academy is trending toward a stronger position. However, the school’s Annual Financial Audit only included the school’s default on a $19M bond as a subsequent event. The school’s ability to raise additional capital to finance additional activities will be impacted by the default.
• TMSA negative status is of concern. The governing board continues to restructure its contractual relationships to include its relationship with its Educational Management Organization to improve its liquidity.
2. Sustainability Ratio compares the amount of resources that are not already assigned such as to a loan payment (unrestricted assets) to the average monthly expenses. It indicates how many months a charter could financially function without revenue in a crisis. At least two month’s revenues are recommended by most analysts.
Amana FSA HS Hapeville KIPP SFA Sunshine TMSA
2009 2.18 -0.22 20.88 2.02
2010 1.41 3.39 15.26 4.11
2011 1.84 4.04 13.82 8.78 3.28 -0.75
2012 15.75 -0.64 10.93 10.09 0.49 -0.27 Observations:
• Amana restructured operations in anticipation of a major capital program during FY13-14.
• FSAHS saw a sharp decline and was not sustainable in FY12. • Hapeville continued to steadily work through their large resources and maintained the
school’s pattern of resource use. • KIPP SFA increased efficiency of their operations and began to reap the benefits of
improved facility management. • Fulton Sunshine saw a sharp decline in their sustainability and no longer met the
recommended two months revenues. • Although TMSA improved their ratio since FY11, it was not sustainable in FY12.
May 2013 Page - 20 -

3. Occupancy Expenses indicate the percentage of the charter schools’ total revenue that goes toward facility costs. The national average is between 15% and 20%.
Observations:
• Amana’s facility costs continued to climb. The school’s recent bond acquisition will address the rental costs of their current facility.
• The restructuring agreement FSAHS agreed to as part of their 2009 renewal was dependent on sharply improving attendance to decrease the percentage of their budget that would need to be devoted to facility rental. That increase in enrollment did not materialized according to their renewal plan and increased the strain on their overall budget in general and their facility costs in specific.
• Hapeville continued to maintain their occupancy expenses. • KIPP SFA continued to maintain their occupancy expenses. • Fulton Sunshine saw a sharp increase in their occupancy expenses due, in part, to
construction, which put a strain on their overall budget. The school paid above the national average in FY12 for Occupancy Expenses.
• The Main Street governing board continued to restructure its contractual relationships with the two churches from which it currently rents. It was paying well below national averages for these buildings. It is actively seeking alternatives to existing locations, but has been unable to secure additional capital to fund a new location.
4. Debt to Assets Ratio indicates the amount of debt in comparison to the amount of assets. A Debt to Assets ratio of 0 would indicate no debt. A ratio of 1.0 would indicate that for every one dollar of asset the charter is in debt one dollar. Private industry standard is to maintain a Debt Ratio less than 1.0.
•
Observations:
• Amana remained consistent with their previous year’s ratio. • FSAHS saw a sharp increase in their Debt to Assets ratio.
Amana FSA HS Hapeville KIPP SFA Sunshine TMSA
2009 17% 18% 4% 4% 2010 17% 17% 5% 5% 2011 17% 20% 6% 4% 14% 10%
2012 18% 23% 6% 5% 21% 6%
Amana FSA HS Hapeville KIPP SFA Sunshine TMSA
2009 0.12 1.07 0.11 0.75 2010 0.09 0.01 0.63 0.59 2011 0.09 0.06 0.61 0.36 0.24 1.16
2012 0.09 0.20 0.62 0.32 0.21 1.06
May 2013 Page - 21 -

• Hapeville pays a mortgage on two of their three facilities which can be seen in their higher debt ratio. Their ratio remained consistent with the previous year’s numbers.
• KIPP SFA was steadily decreasing their Debt to Assets Ratio in anticipation of completely paying off their facility in FY13.
• Fulton Sunshine’s ratio indicated a slight drop in FY12. • TMSA continued to operate in debt although they are trending in a positive direction.
May 2013 Page - 22 -

Personnel Analysis Summary:
• Charter school salaries are consistently less than system salaries with the biggest gap being in administration pay.
• Percentage of teachers with certification is trending higher, continuing a three year pattern.
• The sector continues to see a high turnover rate and a teaching staff with low levels of experience. Outliers to these trends are Amana Academy and KIPP South Fulton Academy.
• Recent changes in the Georgia Professional Standards Commission will require more oversight on the part of the system in the area of charter school personnel.
Start up charter school employees are not employed by Fulton County Schools and are under the control and management of the governing body of the charter. To meet our obligations to students and taxpayers, FCS does monitor the performance of these charter employees while still following the intent of the law that governing bodies have decision making authority in this area. Compliance Information: Due to the confidential nature of personnel records collected, the worksheets used to compile the data in this report will not be made public. However, the following represents the template given to the charters to gather and analyze the information.
School ID # Last Name First Name SSN Gender Race Date of Birth Full/Part Time Job Code Years with Charter Annual Salary Years of Teaching Experience
This information is gathered every October and March on every individual employed by the charter. Charter schools may hire un-certified teachers and administrators unless otherwise prohibited by the requirements of a specific federal program. However, teachers must be Highly Qualified (HQ) under the NCLB. To be considered “highly qualified” to teach in a public charter school in the State of Georgia, teachers of core academic subjects must meet all requirements except those pertaining to licensure or certification provided that the terms of the state-approved charter allow the school to exempt licensure or certification. New Georgia Professional Standards Commission (GaPSC) standards also require that non-certified charter school teachers obtain a Clearance Certificate at the time of employment. After
Primary Subject Matter Certified Certificate Type Certificate Field GAPSC APPROVED College/University Name Degree Level Academic Major(s) GACE Content SPED Multi-Subject Lifetime Certificate Retired Certified
May 2013 Page - 23 -

receiving the results of the fingerprinting and background checks, the school must submit the information electronically to the GaPSC via the appropriate online procedures available on gapsc.org. Upon successful review, the Clearance Certificate is issued to the charter school teacher for a five year term. Therefore, FCS personnel must now confirm the status of each teacher listed by the charter with the GaPSC database as well as perform a visual check of each schools fingerprint and background check personnel files annually. Observations:
• Per the FCS visual inspection, all charter schools had fingerprint and background checks on file for school personnel by October 2012. KIPP SFA is currently updating their records to be current upon the start of the new charter term in July 2013.
• While the state will accept five year terms for such checks, Amana Academy and Hapeville require their personnel be fingerprinted annually. FCS requires that all governing board members have such checks annually as well.
• All charters have been notified of the particular concerns regarding specific personnel and the one year timeline. They were included in the recent system-wide federal audit of personnel processes in the same manner as typical schools. Those results are pending as of this writing.
Personnel Trends: In addition to safety and compliance standards, FCS collects information on the salary levels and years’ experience of the teachers and staff at our charters. The purpose of this information is to inform the public of the use of taxpayer dollars as well as to inform prospective parents about the staffing situation as our charters. Finally, we hope that the comparative nature of the data will further inform governing boards in the FCS charter sector of the decision of the peers in the system as well as prospective petitioners as they consider their budgets. Start up charters do not follow FCS salary guidelines.
May 2013 Page - 24 -

Start up Charter School Employee Overview
*Does not include personnel employed by EMO. Charter Personnel Information based on GA CPI collected in March 2013.
Number Salary
% Teachers Certified
Years Experienced
Amana Teachers 53 AVERAGE $ 41,281.00
5
MODE $ 37,175.00 72% 2
Administrators 3 AVERAGE $ 88,910.67 Staff 17
Parapros 7
FSAHS Teachers 25 AVERAGE $ 33,199.00 72% 2
MODE $ 34,000.00
0
Administrators 1 AVERAGE $ 80,000.00 Staff 8
Parapros 0 Hapeville
Teachers 54 AVERAGE $ 45,211.00 69% 3
MODE $ 39,413.00
0
Administrators 5 AVERAGE $ 59,305.00 Staff 21
Parapros 5
KSFA* Teachers 15 AVERAGE $ 60,059.00 100% 9
MODE $ 49,580.00
5
Administrators 3 AVERAGE $ 54,820.00 Staff 10
Parapros 7 Sunshine
Teachers 35 AVERAGE $ 37,764.00 91% 4
MODE $ 38,000.00 1
Administrators 2 AVERAGE $ 67,500.00 Staff 17 Parapros 2 TMSA* Teachers 48 AVERAGE $ 44,191.00 92% 7
MODE $ 39,132.00
1
Administrators 3 AVERAGE $ 41,661.50 Staff 21
Parapros 3
May 2013 Page - 25 -

Observations:
• On average, 83% of charter school teachers are certified, an increase of 7% from last year.
• Most charter school teachers have 1 ½ years of teaching experience. • The average charter school teacher has been with their current charter school for two (2)
years. • The average charter school teacher earns $43,617 annually and the average administrator
earns $65,366. In FCS the average teacher salary is $52,952 and administrators earned $94,157.
• The salary differential for KIPP SFA is directly related to the extended school day (7:15 am to 5:00 pm) and school year (mandatory three week summer term).
May 2013 Page - 26 -

Significant Events in the FCS Charter Department Local Activities
• Charter System: o The department assisted with the processes leading to the approval of the FCS
Charter System application. FCS is the largest charter system in the state of Georgia at the time of this report.
o Under the system’s charter system restructuring plan, the department lost direct support of an area superintendent to advise and oversee the operations of the seven start up charter schools. A professional support position was added to the structure and the department was incorporated in the newly formed Strategy and Innovation Division.
• Closures: o Upon the non-renewal of Fulton Science Academy Middle School, the department
managed the processes to wind down operational and legal operations of the charter organization. Additionally, the department designed and implemented the processes to dispose of the school’s assets per federal and state law and assisted the FCS Warehouse in the open bidding process to reallocate those materials.
o The FCS Charter Department recommended termination of Fulton Science Academy High School due to academic, operational, financial and governance insufficiencies. That recommendation was approved by the FCBOE in December 2012 is still under consideration by the Georgia Department of Education as of this writing.
o Spalding Drive Charter School elected to self-terminate their contract in order to join Cohort One under the charter system. Riverwood International Charter School will not renew its charter contract which expires on June 30, 2013, and will join Cohort One at that time.
• Approvals: o The department recommended renewal of the South Fulton Academy (KIPP) and
the contract was approved by the FCBOE and the SBOE. o The newly approved Chattahoochee Hills Charter School decided to implement a
planning year. Staff is assisting them during the planning period. • Department Development:
o The department was audited by the National Association of Charter School Authorizers, the first time the FCS Charter Department had been audited since its inception in 1999. The largely positive report and recommendations for improvement are in Appendix F.
o The system was audited by the federal government in both Title I and in personnel regards compliance to No Child Left Behind. The system was held responsible for the status of the charter schools in both those audits.
State Activities
• This year there are been many new state initiatives about which the FCS Charter Department must inform and assist charter leadership. Some of these new initiatives include new standards for compliance in the areas of personnel as well as implementation of the Common Core curriculum and the related state evaluation systems for teachers and
May 2013 Page - 27 -

principals. Additionally, the new Georgia College and Career Ready Performance Index (CCRPI) will alter the assessment results for all schools in Georgia.
• An alternative avenue for charter approval in the state was approved by a constitutional amendment. The impact upon FCS charter petition processes is not clear at the time of this report.
• The GADOE revised its charter application. The FCS charter Department is currently revising the system application to align with the state application.
Future Activities
• The department will implement new initiatives as outlined in the department strategic plan.
• As the other FCS departments continue to revise their operations under the new charter system, the Charter Department will continue to alert charter school about the new expectations and processes being developed and assess if these new practices should pertain to charters and, if so, how.
• The GADOE Charter Department has been audited by the national Department of Education. As the GADOE alters its own practices in light of that audit, the FCS charter department will adjust practices to ensure a fruitful partnership with the state.
• The system’s first Request for Charter Petitions was issued in May 2013. This will result in a charter school specifically targeted to meet system identified needs opening in SY 15/16.
Interim Compliance Reports (Pending) All charter governing bodies will receive Interim Compliance Reports in June based on the school’s progress on the checklist items in SY 12/13. Depending on the nature of the compliance issue, a deadline for a remediation will be included in the Interim Compliance Report. Beginning in 2008 and in response to legislative changes, FCS and the charter schools in the system started to identify those areas of interaction that are mandated by law between any charter and its authorizing system. These FCS Departments offer full, in-kind services to charters and FCS requires complete compliance with the standards and practices of these departments based on federal and state law.
1. Governance: FCBOE, Superintendent 2. Central Office Administration: Assessment and Evaluation, Testing Materials
(CRCT, ITBS, SPED and TAG diagnostics), Student Information Systems (eSchool), Grant Development, Budget and Audit Services, Certification Services
3. Support Services: Exceptional Children (SEC), Charter Department, SST/504/RtI, GED/Homeless, Title I, GHSGT/Remediation, ESOL, Talented and Gifted, Early Childhood Special Programs
4. Facilities: Building Safety, Planning and Student Forecasting 5. Health and Safety: Student Safety, Health Services, Student Discipline (as it
relates to federal Due Process requirements) These FCS Departments offer optional and/or contract only services to start up and conversion schools based on the terms of the contract.
May 2013 Page - 28 -

• Communications • Professional Learning • Nutrition • Transportation • Virtual Campus • Night School • Intramurals • Teaching Museums
These FCS Departments offer limited services to charters based on the terms of the contract.
• Operations - FCS Foundation, Continuous Improvement, Financial Services, Payroll, Inventory Control, ERP System (SAP), Contracting/Purchasing
• Support Services- Extended Learning, Summer School, Social Work, Counseling • Curriculum - All Departments, Checkpoints Assessments, Textbooks • Human Resources- Personnel Services, Placement Office • Instructional Technology • Facilities
To monitor and facilitate these areas of interaction, the system and the charter schools constructed a checklist of compliance activities dealing with the major federal accountability reporting requirements located in Appendix D. This checklist does not represent all the compliance items that might be required by federal and state governments of a charter since individual schools and students will generate additional compliance requirements. However, this general listing can serve a vehicle to foster communication and transparency between the charter and the system in the area of general compliance.
6. The checklist of compliance activities was shared with all charter school principals in May 2012. Complete records of each charter school compliance items if available from the Charter Department.
7. A Final Compliance Report which will reflect the charters’ progress on items listed in the Interim Compliance Report will be sent to FCBOE in the fall of 2013 along with the most recent academic performance reports of the charters.
8. The Charter Department is constructing an electronic repository for a majority of the Compliance Items so that all charter and FCS staff may more easily confirm compliance and reference materials throughout the year.
May 2013 Page - 29 -

Appendix A
Fulton County Schools Charter Department
Charter School Governing Board Meeting Observation Form Charter School/s Governed:
Date of Meeting:
Start Time:
Meeting Location:
End Time:
Check the following if present: Mandatory ___ Meeting Agenda ___ Agenda on Website and/or Posted within O.C.G.A. § 50-14-1 ___ Public Meeting Notice ___ Minutes on Website and/or Posted within O.C.G.A. § 50-14-1 ___ Secretary Functions ___ Parent/Community Member Chair ___ Fingerprint and Background Check Available on Request ___ Prior Minutes Approval Optional ___ Access by the Public ___ Public Comment Period ___ Principal’s Report ___ Sign In Form ___ Communications Protocols Attendees (may not be exhaustive): Check If Known: Frequency of Meetings: ___ Monthly ___ Bi-Monthly ___ Quarterly ___ Other
May 2013 Page - 30 -

Communication Pattern*
Decision Making Evidence*
Feedback Mandatory Optional Commendations
May 2013 Page - 31 -
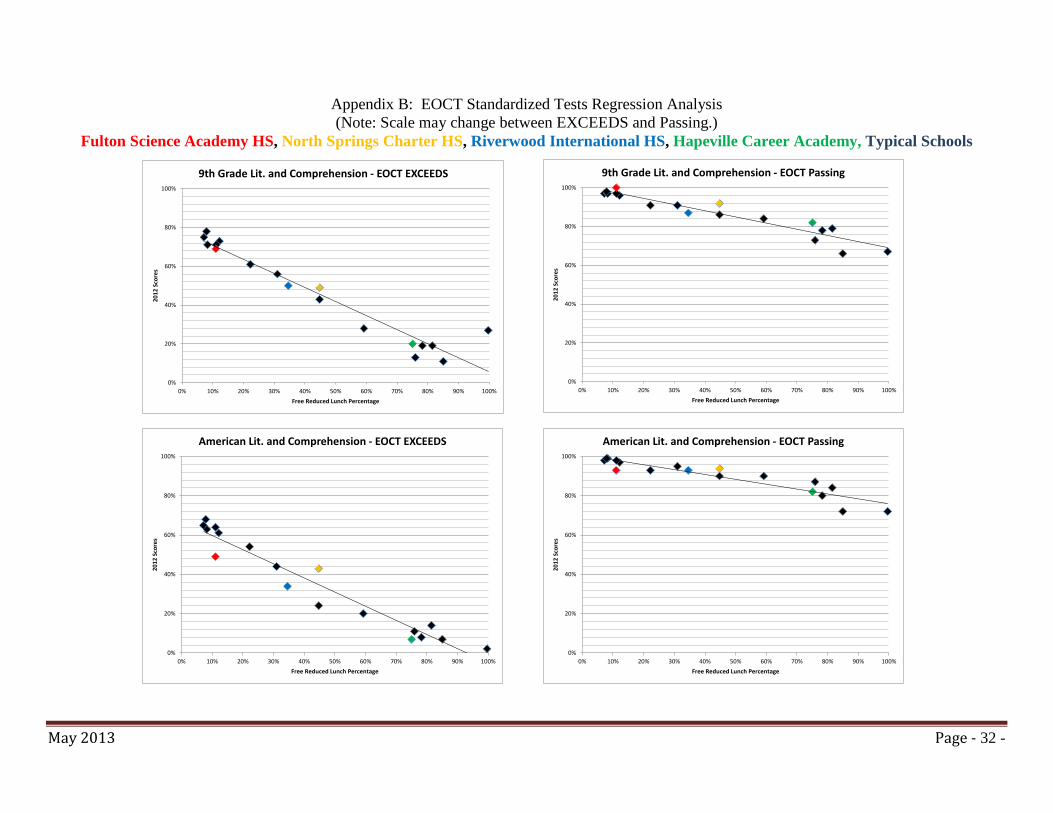
Appendix B: EOCT Standardized Tests Regression Analysis (Note: Scale may change between EXCEEDS and Passing.)
Fulton Science Academy HS, North Springs Charter HS, Riverwood International HS, Hapeville Career Academy, Typical Schools
0%
20%
40%
60%
80%
100%
0% 10% 20% 30% 40% 50% 60% 70% 80% 90% 100%
2012
Sco
res
Free Reduced Lunch Percentage
9th Grade Lit. and Comprehension - EOCT EXCEEDS
0%
20%
40%
60%
80%
100%
0% 10% 20% 30% 40% 50% 60% 70% 80% 90% 100%
2012
Sco
res
Free Reduced Lunch Percentage
American Lit. and Comprehension - EOCT EXCEEDS
0%
20%
40%
60%
80%
100%
0% 10% 20% 30% 40% 50% 60% 70% 80% 90% 100%
2012
Sco
res
Free Reduced Lunch Percentage
9th Grade Lit. and Comprehension - EOCT Passing
0%
20%
40%
60%
80%
100%
0% 10% 20% 30% 40% 50% 60% 70% 80% 90% 100%
2012
Sco
res
Free Reduced Lunch Percentage
American Lit. and Comprehension - EOCT Passing
May 2013 Page - 32 -

Fulton Science Academy HS, North Springs Charter HS, Riverwood International HS, Typical Schools (Note: Hapeville Career Academy did not take Physical Science in 2012.)
0%
20%
40%
60%
80%
100%
0% 10% 20% 30% 40% 50% 60% 70% 80% 90% 100%
2012
Sco
res
Free Reduced Lunch Percentage
Biology - EOCT EXCEEDS
0%
20%
40%
60%
80%
100%
0% 10% 20% 30% 40% 50% 60% 70% 80% 90% 100%
2012
Sco
res
Free Reduced Lunch Percentage
Physical Science - EOCT EXCEEDS
0%
20%
40%
60%
80%
100%
0% 10% 20% 30% 40% 50% 60% 70% 80% 90% 100%
2012
Sco
res
Free Reduced Lunch Percentage
Biology - EOCT Passing
0%
20%
40%
60%
80%
100%
0% 10% 20% 30% 40% 50% 60% 70% 80% 90% 100%
2012
Sco
res
Free Reduced Lunch Percentage
Physical Science - EOCT Passing
May 2013 Page - 33 -

Fulton Science Academy HS, North Springs Charter HS, Riverwood International HS, Typical Schools (Note: Hapeville Career Academy did not take Economics in 2012.)
0%
20%
40%
60%
80%
100%
0% 10% 20% 30% 40% 50% 60% 70% 80% 90% 100%
2012
Sco
res
Free Reduced Lunch Percentage
U.S. History- EOCT EXCEEDS
0%
20%
40%
60%
80%
100%
0% 10% 20% 30% 40% 50% 60% 70% 80% 90% 100%
2012
Sco
res
Free Reduced Lunch Percentage
Economics - EOCT EXCEEDS
0%
20%
40%
60%
80%
100%
0% 10% 20% 30% 40% 50% 60% 70% 80% 90% 100%
2012
Sco
res
Free Reduced Lunch Percentage
U.S. History- EOCT Passing
0%
20%
40%
60%
80%
100%
0% 10% 20% 30% 40% 50% 60% 70% 80% 90% 100%
2012
Sco
res
Free Reduced Lunch Percentage
Economics - EOCT Passing
May 2013 Page - 34 -

Fulton Science Academy HS, North Springs Charter HS, Riverwood International HS, Hapeville Career Academy, Typical Schools
0%
20%
40%
60%
80%
100%
0% 10% 20% 30% 40% 50% 60% 70% 80% 90% 100%
P201
2 Sc
ores
Free Reduced Lunch Percentage
GPS Algebra - EOCT EXCEEDS
0%
20%
40%
60%
80%
100%
0% 10% 20% 30% 40% 50% 60% 70% 80% 90% 100%
2012
Sco
res
Free Reduced Lunch Percentage
Geometry EOCT EXCEEDS
12%
85%
31%
11%
78%
11%
75%
45%
7%
76%
100%
8%
8%
45%
35%
22%
81%
0%
20%
40%
60%
80%
100%
0% 10% 20% 30% 40% 50% 60% 70% 80% 90% 100%
2012
Sco
res
Free Reduced Lunch Percentage
GPS Algebra - EOCT Passing
0%
20%
40%
60%
80%
100%
0% 10% 20% 30% 40% 50% 60% 70% 80% 90% 100%
2012
Sco
res
Free Reduced Lunch Percentage
Geometry- EOCT Passing
May 2013 Page - 35 -

Appendix C: CRCT Standardized Tests Regression Analysis Amana Academy, Hapeville, KIPP South Fulton Academy, Ridgeview, Sandy Springs, Typical Schools
(Note: Main Street Academy had no 8th graders in 2012.)
90%91%92%93%94%95%96%97%98%99%
100%
0% 20% 40% 60% 80% 100%
2012
Sco
res
Free and Reduced Percentage
CRCT 8th Grade Reading Passing
60%65%70%75%80%85%90%95%
100%
0% 20% 40% 60% 80% 100%
2012
Sco
res
Free and Reduced Percentage
CRCT 8th Grade Math Passing
0%
20%
40%
60%
80%
100%
0% 20% 40% 60% 80% 100%
2012
Sco
res
Free and Reduced Percentage
CRCT 8th Grade Reading EXCEEDS
0%
20%
40%
60%
80%
100%
0% 20% 40% 60% 80% 100%
2012
Sco
res
Free and Reduced Percentage
CRCT 8th Grade Math EXCEEDS
May 2013 Page - 36 -

Amana Academy, Fulton Sunshine Academy, MMaaiinn SSttrreeeett AAccaaddeemmyy, South Fulton Academy (KIPP), Typical Schools
80%
85%
90%
95%
100%
0% 20% 40% 60% 80% 100%
2012
Sco
res
Free and Reduced Percentage
CRCT 5th Grade Reading Passing
60%
70%
80%
90%
100%
0% 20% 40% 60% 80% 100%
2012
Sco
res
Free and Reduced Percentage
CRCT 5th Grade Math Passing
0%
20%
40%
60%
80%
100%
0% 20% 40% 60% 80% 100%
2012
Sco
res
Free and Reduced Percentage
CRCT 5th Grade Reading EXCEEDS
0%
20%
40%
60%
80%
100%
0% 20% 40% 60% 80% 100%
2012
Sco
res
Free and Reduced Percentage
CRCT 5th Grade Math EXCEEDS
May 2013 Page - 37 -

Amana Academy, Fulton Sunshine Academy, MMaaiinn SSttrreeeett AAccaaddeemmyy,, Typical Schools
70%
80%
90%
100%
0% 20% 40% 60% 80% 100%
2012
Sco
res
Free and Reduced Percentage
CRCT 3rd Grade Reading Passing
40%
50%
60%
70%
80%
90%
100%
0% 20% 40% 60% 80% 100%
2012
Sco
res
Free and Reduced Percentage
CRCT 3rd Grade Math Passing
0%
20%
40%
60%
80%
100%
0% 20% 40% 60% 80% 100%
2012
Sco
res
Free and Reduced Percentage
CRCT 3rd Grade Reading EXCEEDS
0%
20%
40%
60%
80%
100%
0% 20% 40% 60% 80% 100%
2012
Sco
res
Free and Reduced Percentage
CRCT 3rd Grade Math EXCEEDS
May 2013 Page - 38 -

Appendix D Start up Charter Per Pupil Analysis
Amana Fulton
Sunshine FSAHS KIPP SFA Hapeville TMSA
Per Pupil Amount
Monthly Revenue - Actuals
FCS Allocation $7,678.32 $6,496.98 $9,379.86 $8,440.64 $ 6,806.48 $7,230.38 Total Monthly Revenue - Actuals $8,598.40 $6,941.69 $9,647.78 $10,426.35 $ 7,834.30 $8,175.91 Monthly Expenditures - Actuals Personnel Subtotal $6,077.90 $4,209.38 $6,640.30 $8,897.14 $ 4,949.48 $5,473.79 Facility Subtotal $1,875.15 $1,701.37 $2,402.61 $578.79 $ 528.97 $692.91 Administration Subtotal $191.19 $133.72 $350.61 $1,494.00 $ 743.01 $1,212.81 Student Services Subtotal $580.57 $484.39 $308.41 $1,903.99 $ 1,380.63 $1,111.01
Percent of FCS Allocation
Monthly Revenue - Actuals
FCS Allocation 100% 100% 100% 100% 100% 100% Total Monthly Revenue - Actuals 112% 107% 103% 124% 115% 113% Monthly Expenditures - Actuals Personnel Subtotal 79% 65% 71% 105% 73% 76% Facility Subtotal 24% 26% 26% 7% 8% 10% Administration Subtotal 2% 2% 4% 18% 11% 17% Student Services Subtotal 8% 7% 3% 23% 20% 15%
May 2013 Page - 39 -

Appendix E
Start Up Compliance Checklist
for School Year 2012/13
Note: Given the flexibility in certain department meetings, this listing may change throughout the year.
CHARTER OBLIGATIONS DATE OF FCS
OBLIGATIONS ACCEPTABLE EVIDENCE
Non-Profit Status August 31 Copy of Certificate New Board Member Training Sept. 22; Oct 29 Sign In Sheet
Listing of Current Board Member Sept. 4 Excel Spreadsheet Evidence of SACS/ADvancED
Certification Sept. 4 Copy of Certificate Evidence of
Fingerprinting/Background Check Sept. 28 Visual inspection GB Approval of GADOE Report Sept. School Website Minutes, Agenda GB Approval of SIP and updates Sept., Jan., May School Website Minutes, Agenda
GB Approval of SOSA October School Website Minutes, Agenda GB Evidence of Budget
Construction February/March Rep. at budget review mtg. Response to Initial Compliance February/March Response from GB
GB Approval of Budget March/April School Website Minutes, Agenda Lottery Video, Results and Wait
List March 1 Video and Excel Spreadsheet Evidence of Open Meetings on going School Website Minutes, Agenda
Monthly Meetings TBD Copy of Sign In Sheet Submission of SIP and updates Oct., Jan., May SIP Form
GADOE Report Oct. 1 Copy of GADOE Report State of the School (SOSA) November Copy of Presentation
End of the year checklist items TBD Copy of checklist
Student Code August 30 Copy of Student Code School Safety Plan August 30 Notice from School Safety
Immunization Records August 30 eSchool records Varies by Charter September Copy of Schedule
Insurance September 24 Copy of Policy October Audit Oct. 1 Copy of Audit (electronic)
CPI Report October, March FCS Form Screening Training January Notice from Health Services
May 2013 Page 40

Affidavits Last Day of First Semester eSchool records Training and daily eSchool On-Going Report from Student Information
Evidence of Communications to Parents Regular Newsletter/ Website, etc.
Financial Reports 15th of each month Email Form State Mandated Testing Training Per notification from FCS Participant sign in sheet
Training Per notification from FCS Notice from SST/504/RtI Complete compliance Per notification from FCS Report from Title I Complete compliance Per notification from FCS Report from ESOL Department Complete compliance Per notification from FCS Report from SEC Department
When triggered by CRCT End of school year Copy of letter sent to parents As needed Annually Copy of safety letter
Insurance September 23 Copy of Policy State compliance March GADOE Best Practices Report*
Training and eSchool Review On-Going Report from TAG Training On-Going Notice from Media
Free/Reduced Lunch Report Monthly Federal Nutrition Form
optional End of school year Copy of letter sent to parents Varies by Charter Last Day of First Semester # of students, nature of service Varies by Charter Last Day of First Semester # of students, narrative Varies by Charter As Needed GADOE Relocation Packet
Varies by situation Per notification from FCS varies by situation
May 2013 Page 41

Appendix F National Association of Charter School Authorizers Executive Recommendations
(The entire report is available upon request.)
October 9, 2012
NACSA Authorizer Evaluation Report
Authorizer
Fulton County Schools
Board President Linda Schultz
Superintendent Robert Avossa
National Association of Charter School Authorizers
May 2013 Page 42

Contents Rating Categories 3
About the Authorizer 4
Executive Recommendations 7
1. Application Decision-Making 9
2. Performance Management Systems 17
3. Performance-Based Accountability 25
4. Autonomy 30
Sources 35
Biographies 36
NACSA Authorizer Evaluation Report: Fulton County Schools

Overview Rating Categories Authorization quality is rated in two categories:
Established Refers to the authorizer’s practices as set out “on paper” whether by policy, protocol, or other means. It also addresses the way that the authorizer communicates information about its practices to relevant stakeholders within the authorizing agency and to schools. This category rates the authorizer based on what it plans to do.
Applied Refers to the authorizer’s practices as applied. This category rates the authorizer based on what it actually does, in practice.
Within each part of the evaluation, the rating categories are defined more specifically with respect to the authorizer’s responsibilities in that area.
Rating System For each category (established or applied), the authorizer receives a rating as follows:
Well-Developed Commendable in that it meets or exceeds NACSA’s Principles & Standards.
Approaching Well-Developed Fundamentally sound in that it contains most aspects of a well-developed practice but requires one or more material modifications to meet NACSA’s Principles & Standards.
Partially Developed Incomplete in that it contains some aspects of a well-developed practice but is missing key components, is limited in its execution, or otherwise falls short of satisfying NACSA’s Principles & Standards.
Minimally Developed Inadequate in that the authorizer has minimally undertaken the practice or is carrying it out in a way that falls far short of satisfying NACSA’s Principles & Standards.
Undeveloped Wholly inadequate in that the authorizer has not undertaken the practice at all or is carrying it out in a way that is not recognizably connected to NACSA’s Principles & Standards.
NACSA Authorizer Evaluation Report: Fulton County Schools

Overview About the Authorizer
History and Structure Fulton County Schools (FCS) consists of two entirely separate pieces of geography, lying south and north of the city of Atlanta. It is an ethnically and economically diverse district serving more than 93,000 students, seeing significant growth while experiencing a drop in revenues due to the stressed economy.
FCS is overseen by a seven-member Board, elected by districts to four-year terms. Dr. Robert Avossa, who became the FCS Superintendent in 2011, is a veteran educator and a graduate of the Broad Superintendents Academy. The charter office itself is a one-person operation. Charter Coordinator Laura Stowell has been in place for four years, and in that time has reported to seven different supervisors through various reorganizations under three superintendents.
Portfolio Overview FCS has 6 start-up and 5 conversion charter schools together serving more than 9,000 students, about 10 percent of the district’s overall student population. There is one KIPP school and one managed by Edison Schools; the rest are community-based and self- managed. Start-up charters serve a lower percentage of Hispanic students and higher percentages of Black and Asian students than the FCS average; conversion charters serve nearly double the percentage of Hispanic students as does FCS generally. Both start-up and conversion schools have lower percentages of students with special education needs than the FCS average.
On May 10, Georgia’s State Board of Education approved Fulton County’s plan to create the state’s largest “charter system” in which every school will eventually have unprecedented local control over its budget, staffing, and teaching methods. One of the existing conversion charters has already announced plans to relinquish its charter and join the first cohort of “charter system” schools, and there is wide expectation the other conversions will shortly follow suit.
For that reason, in the balance of this report we will refer to start-up charters unless otherwise noted, since they will be the preponderant model in the “charter system” era.
School Performance Judging by the scatterplots included in FCS’s most recent “State of the Charter” report, the FCS charter schools generally mirror the performance of district schools with comparable populations (as determined through a regression for poverty levels.) Since CRCT results cannot be longitudinally linked, however, FCS does not provide student-level growth results, which are a more telling indicator of specific schools’ performance. (See Section 3.1 below for more on academic monitoring.)
District Authorizing Environment FCS is about to adopt new strategic plan, aiming to increase the graduation rate; improve college and career readiness; and eliminate the achievement gap. This plan and the move to a charter system involve significant internal reorganization. The district has been divided
NACSA Authorizer Evaluation Report: Fulton County Schools

Overview into 4 “Learning Communities” led by area superintendents; there has been a concerted reduction in central office expenditures, and a new office of Strategy and Innovation has been created, including a Knowledge Management officer who will track significant innovations and create diffusion strategies.
The ambitious reforms underway present enormous opportunities for charter schools as catalysts for innovation – but also raise significant questions. There are only 6 start-up charters currently, and one FCS official speculated that if district schools improved significantly, there might not be a need for more “no-excuses” charters. The Board already looks for “distinctive” qualities in charters they approve; in a more diversified “charter system,” new start-ups may be challenged to be more distinctive than their district counterparts.
By moving to a more strategic and targeted RFP-type application process, FCS is joining a trend among authorizers in seeking charters that address local needs. According to interviews for this report, the District also will remain open to strong applications for high- quality charters. Yet the Board has approved just 4 out of 30 applications since 2009, with approved charters often requiring significant re-drafting. As the Board moves to its new application approach, it should further clarify the standards for approval; allow for expanding or replicating charter school models that are effective in improving student achievement; and identify resources to support applicants in developing high quality petitions.
Finally, as noted, the charter office itself is essentially a one-person shop, with dotted lines to other offices that provide support. As will be shown, FCS conducts a great deal of monitoring activity resulting in a mass of information needing to be analyzed and acted on by the charter office Coordinator -- who is addressed or copied on roughly 500 emails a day between schools and the District. With this shop moving under the strategy and innovation banner, and with at least one additional staffer on the way, this burden can be reduced somewhat. Equally important is development of strategies for narrowing the focus to the essentials, and creating the space needed for more thoughtful, quality-oriented oversight.
External Authorizing Environment Georgia’s 1994 charter school law is ranked by the National Alliance for Public Charter Schools as the 15th strongest in the country, with high marks for autonomy, contracting requirements, and the absence of a state cap. The state is currently embroiled in controversy over the November 6 referendum that will decide whether to reinstate the Georgia Charter Schools Commission, which was struck down by the state Supreme Court in May 2011. FCS, its Board and Superintendent have taken a studiously neutral position on this matter.
A more direct impact on charters may be found in a March 30 decision by the US Department of Education to grant Georgia a broad waiver from the mandates of the No Child Left Behind Act. This will move the state to a new accountability program, with a College and Career Ready Performance Index (CCRPI) that will use multiple indicators to determine a school’s performance, rather than a single measure of test proficiency. The Index will be a weighted average of achievement, gap-closing, and “progress” or growth. Charter contracts will be redrawn to include these measures.
NACSA Authorizer Evaluation Report: Fulton County Schools

Overview Finally, under a new state charter office director, Georgia is moving toward a more rigorous definition of “high-quality” chartering, including insistence on meeting the academic performance goals in each contract.
These elements present a complex and challenging road ahead for Fulton County’s charter schools. It is good to see the district’s leadership welcome this evaluation as a step toward improving the critical role of professional authorizing practice in the months ahead.
NACSA Authorizer Evaluation Report: Fulton County Schools

Executive Recommendations
Executive Recommendations Ratings Summary
Established Applied
Application Decision-Making
Approaching Well-Developed
Approaching Well-Developed
Performance Management Systems
Partially Developed
Approaching Well-Developed
Performance-Based Accountability
Partially Developed
Approaching Well-Developed
Autonomy Approaching Well-Developed Approaching Well-Developed
Maintain Practice
The evaluation has identified the following policies and/or practices that the authorizer should maintain:
• Continue the supportive and thoughtful interactions with schools, as evidenced by
application memos, suggestions included in board monitoring documents, and other oversight documents.
• Continue and refine the district’s succinct and legible reporting on compliance measures.
• Continue to welcome high-quality charter applications that can bring new choices and healthy competition to the district.
Develop Practice
The evaluation has identified the following ways in which the authorizer should further develop promising practices:
• Affirm to the role of start-up charter schools in the forthcoming Charter System, and
develop marketing and application processes reflecting their priority role as catalysts for reform.
• Consult resources such as IFF, Denver, Chicago, and other authorizing districts to create a “Call for Quality Schools” that clearly identifies district needs but also welcomes strong, innovative charter schools.
Prioritize Practice
The evaluation has identified the following changes that should be priorities for addressing significant weaknesses or gaps in authorizing practices:
NACSA Authorizer Evaluation Report: Fulton County Schools

Executive Recommendations
• Develop a full Performance Framework that integrates indicators of performance, measures, and metrics in a single coherent structure that establishes clear judgment criteria for oversight actions, renewals and closures.
• Develop tools and strategies for providing feedback on program development and quality in addition to compliance information.
• Create a relentless culture of best practice in the district office, capitalizing on the new Strategy and Innovation structure and providing ample professional opportunities for staff.
NACSA Authorizer Evaluation Report: Fulton County Schools