Embed Size (px)
Citation preview

L
Blast and Impact on Buildingsdue to Aircraft Crashes
L.1 Introduction
A reference is made to the following publication of the author with T. Bangashfor the interaction analysis of impact and explosion-cum-fire for WTC towercollapsed under aircraft crashes:
Explosion-Resistant BuildingsSpringer-Verlag, Heidelberg 2006
Comprehensive programs under the title of BANG-F have been developedin Fortran. A brief of this work is reposted under this section together withadditional results which could not be published for technical reasons.
Aircraft/missile impact data analysis is now compiled in this book. Basicimpact dynamics is initially introduced. Data on civilian and military aircraftare given in detail so that they can be useful during the inputting of variouscomputer programs. Various equations have been developed for normal andoblique impact. Aircraft impacts on structures are introduced and analyticalmodel is devised for the formulation of various relevant computer programs.The load–time function has been established together with impact modellingdeveloped by a number of researchers. Military, air-force and navy missilesand impactors with their relative data are included. The damage scenariocan be checked by various noted empirical formulae devised for structuralperforation, penetration, scabbing, spalling and rupture. They are included inthis book.
Since the collapse of the WTC towers, it is now necessary to conclude achapter on aircraft hot fuel-structure interaction during aircraft impact con-ditions. A comprehensive investigation is reported in the above publication.The data on WTC towers and impactors are included in this section.
When impact, explosion along or in combination, occurs, fire is bellowed,together firing debris, as witnesses in WTC disaster scenario. Scattering fly-ing objects are the results. This section examines the identity of the formand location of unknown elements inside a given surrounding medium. It is

1184 L Blast and Impact on Buildings due to Aircraft Crashes
proposed to measure wave reflection data in space and time. Hybrid finiteelement/difference method is developed in three dimensions where scatter-ing can be performed with time periodic or known data in the form ofshort impulses. The basic mathematical tool was devised which amounts tonumerically solving the time dependent elastic wave equation with given mate-rial coefficients. Finally the scattering phenomenon of objects was achievedusing the TIME-DOMAIN approach. Program FEMVIEW was linked to viewthe damage scenario. The computerised version is identical to the actualWTC Scenario. Global analysis with Program BANG-F (Advanced versionof PROGRAM ISOPAR) has been performed.
For the analysis the reader is referred to Sect. 4.4 for the aircraft impactanalysis and its assumptions. Here those results are included which were leftbehind, when the book was published.
General Specifications
PassengersTypical 3-class configurationTypical 2-class configurationTypical 1-class configuration
181224up to 255
Cargo 2,875 cubic feet (81.4 cubic meters)
Engines’ Maximum ThrustPratt & Whitney PW4062General Electric CF6-80C2B7F
63,300 pounds (28,713 kilograms)62,100 pounds (28,169 kilograms)
395,000 pounds (179,170 kilograms)
23,980 U.S. gallons (90,770 liters)Maximum Fuel Capacity
Maximum Takeoff Weight
Maximum RangeTypical city pairs: New York-Beijing
Typical Cruise Speedat 35,000 feet
Basic DimensionsWing SpanOverall LengthTail HeightInterior Cabin Width
FEDERAL EMERGENCY MANAGEMENT AGENCY
0.80 Mach530 mph (850 km/h)
6,600 nautical miles12,200 kilometers
156 feet 1 inch (47.6 meters)159 feet 2 inches (48.5 meters)52 feet (15.8 meters)15 feet 6 inches (4.7 meters)
Boeing 767-200ER
Plate L.1. Aircraft information

L.3 Input Data and Gneral Analysis of WTC-1 and WTC-2 1185
L.2 Aircraft Information and Other Tower Data
Plate L.1 gives brief information on the technical data for Boeing 767-200ER.Plate L.2 gives a comparison of high rise buildings and aircraft sizes. Plate L.3gives a bird’s eye view of WTC complex. Plate L.4 gives a disaster scenarioafter the aircraft Boeing 767-200ER crashes.
L.3 Input Data and Gneral Analysis of WTC-1and WTC-2 (WORLD TRADE CENTRE)
L.3.1 Geometrical Data
The World Trade Centre and adjacent affected buildings were located onthe West Side of New York, adjacent to Hudson River at the south tip ofManhattan. Here geometrical details are given for only two buildings, namelyWTC-1 and WTC-2.
WTC-1:-
(a) Up to roof height = 1,368 ft = 417 mTotal main height:- Each floor height = 12 ft (3.675 m)Total floors = 110H = effective height = 402.335 m
(b) WTC-1Floor plan area:-Larger – 207 ft (63.1 m) × 207 ft (63.1m)Smaller –Regular service core – 87 ft (26.517 m) × 137 ft (41.7576 m)
= 1,107.31134 m2
Corners chamfered 6′–11′ (2,108mm)
WTC-2:-This building was 6 ft (1.829m) less than WTC-1H = effective height = 400.072 mUp to roof height = 415.1376 mAreas (same as of WTC-1)
L.3.2 Aircraft Impact Areas and Speed
L.3.2.1 American Airlines, (Flight 11) and United Airlines (Flight175)
Boeing 767-200 ER

1186 L Blast and Impact on Buildings due to Aircraft Crashes
0.0
35,000 lb (0.1)Maximum TakeoffWeightMaximum FuelCapacityCruise Speed
Relative amounts normalizedto B767-200ER
Floor plan area of WTC 1 and WTC 2
Floor plan area oftypical high-rise
1,000 gal (0.04)
275 mph (0.5)
336,000 lb (0.9)
23,000 gal (1.0)
607 moh (1.1)
395,000 lb
51´
17´
38´
53´
65´
79´
136´
159´
232´
239´
A380
B747-400
B767-200ER
B707
B-25
262´
213´
156´
131´
67´
24,000 gal
530 mph
875,000 lb (2.2)
57,300 gal (2.4)
567 mph (1.1)
1,235,000 lb (3.1)
82,000 gal (3.4)
540 mph (1.0)
0.0 1.0 2.0 3.0 4.0
1.0 2.0 3.0 4.0
Key
Plate L.2. Comparison of high rise building and aircraft sizes. US (FEMA) withcompliments

L.3 Input Data and Gneral Analysis of WTC-1 and WTC-2 1187
Plate L.3. A bird’s eye view of the WTC complex

1188 L Blast and Impact on Buildings due to Aircraft Crashes
Plate L.4. WTC tower without antenna – collapsed scenario: Tower 2

L.3 Input Data and Gneral Analysis of WTC-1 and WTC-2 1189
Maximum take-off weight = 178,170 kgGross weight = 124,284.3 kgMax range = 12,200 kmCruise speed = 850 km h−1 (530mph)Wing span = 156′1′′(47.6 m)Overall length = 159′2′′(48.5 m)Interior cabin width = 15′6′′(4.7 m)Aircraft area = 48.5 × 47.6 = 2,308.6 m2
Flight 11, departed time: 7.59 a.m. and crashed time 8.46 a.m.Flight 175, departed time: 8.14 a.m. and crashed time 9.03 a.m.
L.3.2.2 Impact Areas
1. North Tower WTC-1 = 4 × 12 = 48′ (14.6304 m)Height: Impacted Area between
Maximum Impact AreaImpact between floor 98 and 94 = 30 m2
Centred on north faceSpeed at impact = 470 km h−1 = 131.6 m s−1
(taken for the analysis)2. South Tower WTC-2
Floors under impact = 78–84 = 6 × 12 = 72′ (21.9456 m)Maximum Impact Area assumed as 30 m2
Speed at impact = 590 km h−1 = 165.2 m s−1
(taken for the analysis)
L.3.2.3 Time Durations
WTC-1 – 47min (2,820 s) collapsed at 10.29 a.m.Time duration 10.29− 8.46 a.m. = 1 h 43 min
= 1.717 h= 103.02 min= 6181.2 s
WTC-2 – 49min. (2,940 s) collapsed at 56min. after impact i.e. 9.03+56/60 =11.223 = 9.063 a.m., time at which collapse occur.
L.3.2.4 Load–Time Function
The load–time function as explained, in Fig. L.1 is to be created with Δt, thetime interval for the dynamic finite element will be the base values againstimpact loads Simpson rule or others can be used to develop the response ofthe entire structure of WTC-1 or WTC-2.
At the central zone, the impact corresponding to the air plane fuselage andengines is the worst zone. Away from the central zone, outer wing structurescreate also an impact zone.

1190 L Blast and Impact on Buildings due to Aircraft Crashes
rigid target
elastic springelasto-plastic spring
Forc
e (M
N)
Time (s) × 10-30 50 100 150 200 250 300 350
0
25
50
75
100
Fig. L.1.
L.3.2.5 Existing Loads on WTC-1 Apart from Thosedue to Aircraft Impact
The upper 55 stories of the building’s exterior-wall frame were explicitly mod-eled using beam and column elements. This encompassed the entire structureabove the zone of impact and about 20 stories below. The lower 55 stories ofthe exterior were modeled as a “boundary condition” consisting of a perime-ter super-beam that was 52 in. deep (1,321) and about 50 in. (5,270) wide,supported on a series of springs. A base spring was provided at each columnlocation to represent the axial stiffness of the columns from the 55th floordown to grade. The outrigger trusses at the top of the building were explicitlymodeled, using truss-type elements. The interior core columns were modeledas spring elements.
An initial analysis of the building was conducted to stimulate the pre-impact condition. In addition to the weight of the floor itself (approximately54 psf (259 kNm−2) at the building sides), a uniform floor loading of 12 psf(0.76 kNm−2) for partitions and an additional 20 psf was conservativelyassumed to represent furnishings and contents.
At the impact area, all columns are damaged. The assumption is valid inthe impact analysis.
L.3.2.6 Fireball and Temperature
Fireballs erupted and jet fuel across the impact floors and down interior shaftways igniting fire. The term fireball is used to describe deflagration or ignition

L.3 Input Data and Gneral Analysis of WTC-1 and WTC-2 1191
of fuel vapour cloud. As a result, give raged shroud out the upper floors ofthe Towers. Program BANG-FR is invoked to get necessary quantities interms of pressures of loads and are algebraically added to those pressuresproduced from aircraft-impact specifically floors receiving hot fuel and floorsshould be analysed using the above analysis. In this analysis for the jet-oil-tower structure interaction, based on FEMA Report −3,000 gallons escapedwith 4,000 gallons remained on the impacted floor. The total peak rate offire energy per Tower is assumed as 3–5 trillion Btu h−1 (1–1.56GW), with aceiling gas temperature 1,100◦C (2,000◦F). Growth of fire balls with final fullsize of 200 ft (60.96m) occur after 2 s.
L.3.2.7 Concentrated Loads
BANG-FR for fire analysis is initially concentrated on 80th floor level. Thecolumns above the damage area are predicted to act as tension members,transferring around 10% of the load carried by the damaged columns upwardto outrigger trusses and this load is assumed back on core columns.
Using BANG-FR and FEMVIEW as front ended an aircraft positioninginside the tower has been achieved in Fig. L.2 which is treated as a small chunkof the overall mesh generation scheme of the WTC-1 in Fig. L.3.
L.3.2.8 Chunks Dismantled
As predicted on site, chunks with dimensions around 12′ (305mm) have landedat a distance of 15 ft (4.572m) from the face of the building. The distance isassumed always for the computation of forces of chunks. The maximum lengthand width as observed were 40 ft (12.2m) and 30 ft (9.144m).
Fig. L.2. Aircraft positioning inside tower after impact on WTC-1 tower

1192 L Blast and Impact on Buildings due to Aircraft Crashes
Column idealisation
(a) (b)
Fig. L.3. (a) Complete mesh scheme of WTC-1 tower. (b) Finite element meshscheme for the WTC-1 analysis

L.3 Input Data and Gneral Analysis of WTC-1 and WTC-2 1193
L.3.3 Connection Details, Structural Sizes and Other Parameters
The behaviour of a typical fully rigid, partial strength wind-moment connec-tion about the strong axis of the column was studied. The connection of theW18×50 girder to the W15×426 column between girder line 7–8 at frame lineD on the 14 floor was modeled as a representative connection. The top and bot-tom moment plates (estimated as 5/8×6×24 in. (15.875×152×610 mm) and3/8×10-1/2×24 in. (0.56×267×610 mm), respectively, were welded to girderflanges with a 1/4-in. weld. The shear plate (estimated as 5/16 × 3 × 12 in.;1.938×15×300 mm) was bolted to each girder web with four 7/8 in. diameter(6.36mm) bolts. The designs of the bolts are taken to be A 370 bolts.
Similarly, the behaviour of a typically fully rigid, partial-strength wind-moment connection about the weak axis of the column was studied. Theconnection of the W24 × 68 girder to the W14 × 426 column between girderline C-D at frame line 7 on the 15th floor was modeled as a representativeconnection. The top and bottom moment plates were estimeted as 3/8× 12×14 in. (9.5 × 300 × 355 mm) with a 1/4-in. (6mm) weld with a 3/8 × 8 in.seat plate (12 × 125 × 355 mm). The connection capacity was estimated tobe 7.500 kip in.−1 (8,011.5KNm), thus confirming that the frame design wasgoverned by stiffness and not strength.
L.3.4 Columns, Plates and Spandrels
(a) The columns are built up by 4NO plates. 14′′ (955.6 mm)×14′′ (355.6 mm)welded plates spaced 3′ 4′′ (1, 016 mm)
Adjacent parameter columns are interconnected at each floor level bydeep spandrel plates of 52′′ (1,320.8mm) depth.
In alternative stories, an additional column can be found at the centreof each of the champfered building corners.
The Sect. A, the size is 13 1/2′′ (343 mm) with top plate 355.6 − 343 =
12.6 mm, and the width of this section is 14′′ (350.6 mm). The base of theexterior column is assumed to be 3NO 14′′ × 14′′ (356 × 356 mm) weldedtogether.
The vertical plate thickness 2 NO 1/2′′ (12 mm) = 25 total.
(b) The floor section is shown in Fig. L.5, with concrete thickness of the metaldeck. The main double truss has a total width of 2,032mm.
(c) The estimated openings in the exterior walls of WTC1 are given inPlate I.6.
Typical 3D analysis models of flange and shear plate moment-connections in Figs. L.4 and L.5 are adopted in the FEMA report andhave been re-examined in the current analysis the number of elementsand nodes can be estimated from these figures for local analysis. They aregiven in the separate section in the text.

1194 L Blast and Impact on Buildings due to Aircraft Crashes
HOTFLUID-STRUCTUREINTERACTION
Z
Y
X
Fig. L.4. 3D concrete floor (Full degith). (a) 3D concrete plan slab (hay)
Concrete slabMetal deckCenterline of main double truss
Transverse Truss1.015 m
Centerline
(1.015m)
Fig. L.5. Cross-section to main double trusses supporting concrete floor
(d) Section properties (AISC Manual)(i) W14 426 columns: weight w = 426 lb
Fy = 36 ksi; Kh with respect to ry axial load = 2,560 kipsF0y = 50 ksi; Kh with respect to ry axial load = 3,441 kipsA = 125 in.2; Kw = 1.875 in.Ix = 6,600 in.4; bf = 16.695 in.4; Iy = 2,360 in.4
rx = 4.34 in.; tf = 3.035 in.ryrx
= 1.67
bending factor{Bx = 0.177By = 0.442
L.3 Input Data and Gneral Analysis of WTC-1 and WTC-2 1195
F′ex (Kx L)2/102 kips = 547
F′ey (Ky L)2/102 kips = 195
(ii) W18 50 girders: weight w = 50 ft−1
flange width = 7 1/2′′; A = 147 in.2
Lc = 7.90 ft d = 18 in.LU = 11.0 ft tw = 0.355Span (ft) = 15 bf = 7.495 in.Span (ft) = 44 tf = 0.570 in.Fy = 36 ksiΔ = 0.03′′–2.64′′
Sx = 88.9 in.3
v = 92 kips
(iii) 14 ′′ × 14 ′′ Box section columnstw = wall inches = 0.625′′ (5/8′′)area = 32.4 in.2; I = 952 m4; S = 136 in.3
r = 5.42′′; J = 1,530 in.4; Z = 161 in.3
(iv) W24 68 ColumnsA = 20.1 m2
d = 23.73 in.; tw = 0.415; bf = 911 in.; tf = 0.585 in.Ixy = 18.30 in.4; S = 154 in.3; rx = 955 in.; Iy = 70.4 in.4;Sy = 15.3 in.3; ry = 1.87Fy = 20.2 ksi
(v) W14 193 ColumnsFy = 36 ksiA = 56.8 in.2
Ix = 2,400 in.4
Iy = 931 in.4
ry = 4.05 in.rxry
= 1.6
Bx = 0.183By = 0.477F′
ex (kxLx)2/102 kips = 438F′
ey (kyLy)2/102 kips = 170s = 54 in.3; rx = 955 in.; Iy = 70.4 in.4; sy = 15.3 in.3; by = 1.89d = 23.73 in.; tw = 0.415; bf = 911 in.; tf = 0.585 in.Ixy = 18.30 in.4; s = 54 in.3; rx = 955 in.; Iy = 70.4 in.4;sy = 15.3 in.3; by = 1.89
L.3.5 Typical Structural Details
Plate L.5 gives typical floor designs and Plate L.6 gives floor columns withdimensions. A damage scenario is given for WTC2 columns in Plate L.7.

1196 L Blast and Impact on Buildings due to Aircraft Crashes
Centerline of Tow
erD
iagonal Brace M
embers
Exterior W
all End D
etail
Centerline of E
xterior Colum
n3/8” G
usset Plate Welded to
Colum
n and Top Chord
Two 5/8” D
iameter B
oltsin Slotted H
olesFloor L
ine3’-4” (Typical)
Interior Wall E
nd DetailFloor L
ine
Centerline of Interior C
olumn
Seat with Stiffener
Plate
Two 5/8” D
iameter B
oltsIn Slotted H
oles
Welded
Channel
1.09”D
iameter
Rod
4”2’-5’
3/8” Plate
Rod D
iagonal(D
iameter V
aries)1.08” D
iameterB
ar
Two 7/8” D
iameter B
olts
Dam
ping Unit
Two 1” D
iameter
Bolts (A
490)B
”
2-8”
Intermediate
SupportA
ngle
Transverse
Truss
Main D
oubleT
russ
Centerlineof Tow
er
Plate L.5. WTC typical floors (FEMA)

L.3 Input Data and Gneral Analysis of WTC-1 and WTC-2 1197
Elevation
Floor
Floor
Floor
Floor
Floor
Floor
Floor
Floor
Floor(c) Undamaged columns at floor levelsprior to impact
(b) Damage scenario at WTC-1
100FL
99FL
98FL
97FL
96FL
95FL
94FL
93FL
(a) Impact damage to exterior columns on the south face of WTC 2.
Section A
Section B
1´-1½″
1´-2″
0´-11″
12´-
0 ″
6´-11″3´-4″Typical
B
A
1´-8″
10´-0″3´-4″ 3´-4″
GENERALNOTES:
(1) Column damage captured from photographs and enhanced videos.(2) Damage to column lines 413-418 at levels 81 and 82 is estimated.(3) There is not sufficient information to detail damage to column lines 408-411 at levels 83-84.
Plate L.6. Floor columns

1198 L Blast and Impact on Buildings due to Aircraft Crashes
0 0.1 0.2 0.3 0.4 0.5Time (s)
_1
0
1
2
3
4
5
6(×102)
Impa
ct loa
d (M
N)
98 F99 FTotal loadImpact load against rigid wall
WTC 1
Plate L.7. Impact load time histories
L.3.6 Analysis of Results
A comprehensive treatment of WTC towers and various analytical methodsand damage scenarios are given in the author’s book on
Explosion-Resistant Buildings(Springer Verlag, Heidelberg, January 2006)
Note: Here the additional results left over are given which could not bepublished at the time of the publication of the above book.
The towers were 417 and 415m high with a typical storey height of 3.676m.They were 63.1m square in plan with bevelled corners and a rectangular coremeasuring 26.5m wide and 41.8m long. The tubular building comprised of240 box columns located along the perimeter at intervals of 1.016m with steelspandrel beams carrying the horizontal design wind. The core was comprisedof 47 columns connected by small beams made of W-shape steel membersas given in Sect. L.3.4. The total building weight above ground evaluated forthe finite element analysis was estimated at 3,631MN. The dead and the liveloads were 2,900 and 741MN respectively giving a mean weight per unit floorarea to be evaluated as 8.31 kN/m−2.
The aircraft crash gives an impact load versus time history for 93–99thfloor in WTC-1 and 78–85th floors in WTC-2. Plate L.7 shows the impactload–time histories for both the tower.
The time of 0.4 s was considered for the nose of the aircraft to perforatethe building. The impact load duration was 0.25 s. For WTC-1, the aircrafttook 0.5 s for the aircraft nose to perforate the building. The duration ofthe impact load was prolonged to 0.5 s as the aircraft loses strength. Thevelocity–time curve has been evaluated in Plate L.8 for both the towers.They show velocity reduction values till the total aircraft collapse occurred

L.3 Input Data and Gneral Analysis of WTC-1 and WTC-2 1199
00.20 0.4 0.6 0.8
100
200
300
Time (sec)
Tail end of aircraftEngine
(Analysis)(Analysis)(Analysis)
WTC1 Nose of aircraft
Vel
ocity
(m/s
ec) x
x
xxx x x x
xxx
x
x
x
Plate L.8. Velocity reduction curve of aircraft
05
101520253035404550556065707580859095
100105110
0
5101520253035404550556065707580859095
100105110
(Floor) (Floor)
0 1 2 3 201
4 100806040(g)
WTC
1Acceleration
I
WTC
(cm)Displacement
I
Plate L.9. Maximum response acceleration and displacement
and finally destroyed in each tower case. Plate L.9 indicates the results ofmaximum response acceleration and displacement for both towers. ProgramBANG-F which is the advanced version of Program ISOPAR, was used to cal-culate the displacement-time histories for each floor. These curve are shown inPlate L.10.

1200 L Blast and Impact on Buildings due to Aircraft Crashes
Dis
plac
emen
t (cm
)D
ispl
acem
ent (
cm)
Time (s)
Time (s)
WTC2
WTC1
0_60
_40
_20
20
0
40
60
0 2 4 6 8 10_60
_40
_20
20
0
40
60
2 4 6 8 10
F 11F 21F 41F 51F 61
F 71F 81F 91F 101RF
F 11F 31F 41F 51F 61
F 71F 81F 91F 101RF
Plate L.10. Displacement time histories of each floor. F-Floor
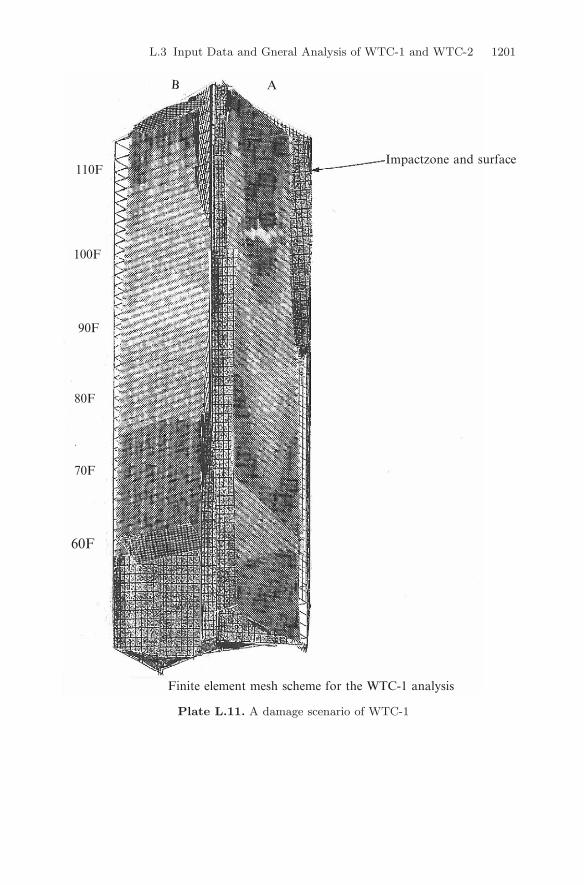
Plate L.11 shows the impact force damage for the WTC 1. Plates L.11and L.12 indicate the damage scenarios for WTC 1 towers using ProgramPATRAN. The computer versions of the damage scenarios are given in PlatesL.13 and L.14. It is to be reminded that fire generated is combined with impactdue to aircraft and the fire generated by air gushing through holes.
L.3 Input Data and Gneral Analysis of WTC-1 and WTC-2 1201
Finite element mesh scheme for the WTC-1 analysis
60F
70F
80F
90F
100F
Impactzone and surface110F
B A
Plate L.11. A damage scenario of WTC-1

1202 L Blast and Impact on Buildings due to Aircraft Crashes
C D
Plate L.12. A damage scenario of WTC-1

L.3 Input Data and Gneral Analysis of WTC-1 and WTC-2 1203
Fire zones
Defached elements
Firewiserete elements
Dert Particles
SamplecolumnsIntacfwefached
Plate L.13. Computed damage senario using finite element scannine

1204 L Blast and Impact on Buildings due to Aircraft Crashes
Plate L.14. W.T.C.1 on fire


