Embed Size (px)
Citation preview

Full year results presentationOctober 2016

02Redefine International P.L.C.
Full Year 2016 Results Presentation
Agenda
Introduction & highlights Mike Watters (CEO)
Financial results Donald Grant (CFO)
Capital markets & strategy Stephen Oakenfull (Deputy CEO)
Portfolio review Adrian Horsburgh (Property Director)
Outlook Mike Watters (CEO)
Q&A

03Redefine International P.L.C.
Full Year 2016 Results Presentation
Redefine International P.L.C.Who we are and what we do
Redefine International is a FTSE 250 UK Real Estate Investment Trust focused on income driven total returns and committed to delivering superior distributions to its shareholders throughout the property cycle.
Redefine International holds a primary listing on the London Stock Exchange and a secondary listing on the Johannesburg Stock Exchange. The Company is included within the EPRA and FTSE 250 indices.
Introduction

04Redefine International P.L.C.
Full Year 2016 Results Presentation
Completed 25 leases totalling £2.6m gross annualised rental income since EU referendum. Little evidence to suggest a material change in occupational demand
Operational highlights
• Completion and integration of transformational AUK acquisition
• Successful capital raise generated £115m
• Like‑for‑like occupancy at 97.7% (+20bps)
• £2.8m net profit from pre‑completion disposal of 16 Grosvenor Street
• Sale of 10 petrol filling stations for £12m, 6.0% above August 2015 book value
• Sale of legacy interest in The Hague
• Two properties disposed post year end for £14.9m, 11.7% premium to book value
Financial highlights
• Earnings available for distribution of £52.2m (+17.6%)
• EPS of 3.2p (in line)
• Full year dividend of 3.2p per share
• Portfolio valued at £1.5bn (+3.4% like‑for‑like)
• £148m AUK revolving facility providing flexibility
• LTV of 53.4%
• EPRA NAV per share 40.0p (‑2.4%)
• Weighted average cost of debt reduced to 3.4% (‑50bps)
HighlightsStrengthened portfolio delivers resilient income performance

St George’s Shopping Centre, Harrow
05Redefine International P.L.C.
Full Year 2016 Results Presentation
Financial results

06Redefine International P.L.C.
Full Year 2016 Results Presentation
Earnings available for distribution(including share of joint ventures)
+14.7%
ICR(1)
270%
+11.3%
+17.6%
2016 2015 Change £m £m £m
Net rental income 89.3 69.6 19.7
Investment and other income 3.6 11.4 (7.8)
Administrative costs and other fees (11.4) (11.4) —
Net finance expense (33.1) (30.7) (2.4)
Other items 1.0 5.5 (4.5)
Underlying earnings 49.4 44.4 5.0
Profit on disposal of 16 Grosvenor Street (non‑recurring) 2.8 — 2.8
Distributable earnings 52.2 44.4 7.8
Per share 3.2p 3.2p —
Dividend per share 3.2p 3.25p (0.05p)
EPRA cost ratio excl. direct vacancy costs 14.9% (2015: 15.3%)
(1) Interest cover ratio

07Redefine International P.L.C.
Full Year 2016 Results Presentation
AUK acquisitions
Other acquisitions
Disposals(prior year)
(5.8)
(4.4) (0.6)
Acquisitions(during 2015)
Disposals Developments UK Retail
65.4
0.3 0.3 0.3
Like-for-like+1.0%
0.3 0.39.6
(0.3)
UK Commercial
UK Hotels
Gross rental income
(Aug 2016)
EuropeLike-for-like(Aug 2015)
Like-for-like(Aug 2016)
64.8
Gross rental income
(Aug 2015)
75.6
Developments
21.0
96.6
Rental income(including share of joint ventures)
Like-for-like gross rental income (£m)

08Redefine International P.L.C.
Full Year 2016 Results Presentation
Valuations(including share of joint ventures)
(1) Surplus/(deficit) includes the effect of capital expenditure, tenant incentives and FX
Market Market EPRA value value Surplus/ Like‑for‑like net initial 2016 2015 (deficit)(1) movement yield £m £m £m % %
UK Retail 337.2 349.6 (15.5) (4.4) 6.3
UK Commercial 160.8 150.9 9.1 6.0 5.4
UK Hotels 229.2 234.7 (7.3) (3.1) 6.1
Total UK 727.2 735.2 (13.7) (1.9) 5.9
Europe 345.2 293.5 48.6 16.6 5.6
Total like‑for‑like 1,072.4 1,028.7 34.9 3.4
Acquisitions 456.6 —
Disposals — 15.9
Total property portfolio 1,529.0 1,044.6 5.8
€+0.3%
09Redefine International P.L.C.
Full Year 2016 Results Presentation
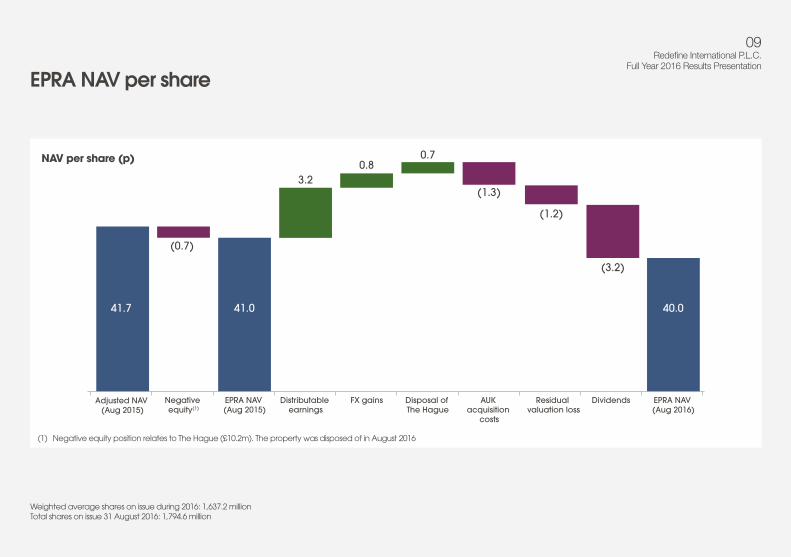
EPRA NAV per share
Weighted average shares on issue during 2016: 1,637.2 millionTotal shares on issue 31 August 2016: 1,794.6 million
(1.2)
AUK acquisition
costs
(0.7)
Negative equity(1)
3.2
Distributable earnings
0.80.7
FX gains Disposal of The Hague
(3.2)
Dividends
(1.3)
Residual valuation loss
EPRA NAV (Aug 2015)
41.0
Adjusted NAV (Aug 2015)
41.7
EPRA NAV (Aug 2016)
40.0
NAV per share (p)
(1) Negative equity position relates to The Hague (£10.2m). The property was disposed of in August 2016

10Redefine International P.L.C.
Full Year 2016 Results Presentation
Commitments of £15.8m and undrawn committed facilities of £23.0m
Cash flowTimely deployment of cash generated
Cash (Aug 2015)
93.6
Operatingcash flow
39.6
Placing (netproceeds)
109.1
Disposals
118.8
Debt drawn
332.5
Propertyacquisitions
& development
(489.9)
Debt repaid
(137.6)
Dividends
(29.4)Other(2.4)
23.057.3
Cash and available facilities
(Aug 2016)
34.3
Cash flow (£m)

11Redefine International P.L.C.
Full Year 2016 Results Presentation
An active year with facilities exceeding £160m repaid, prepaid or extended
Debt & gearing
Key statistics 2016 2015
LTV (%) 53.4 51.8
Weighted average debt maturity (years) 6.9 7.8
Weighted average interest rate (%) 3.4 3.9
Debt with interest rate protection (%) 95.4 94.7
Interest cover (times)(1) 2.7 2.3
(1) Group interest cover calculated as net rental income divided by net finance cost

12Redefine International P.L.C.
Full Year 2016 Results Presentation
Enfield Travelodge, London
Capital markets & strategy

13Redefine International P.L.C.
Full Year 2016 Results Presentation
Tailwinds
• Low interest rates
• Investment demand supported by:
• Depreciation of Sterling and foreign demand
• Demand for asset‑backed income returns
• Capital and occupational markets remain supportive
• 22% portfolio exposure to Euro supporting income and asset value
Headwinds
• Uncertainty following EU referendum
• Slow economic growth
• Continued structural change within retail sector
Market contextOutlook supportive of our income focused investment case
Schloss Strassen Shopping Center, Berlin, Germany

14Redefine International P.L.C.
Full Year 2016 Results Presentation
No material Sterling debt maturing until 2021 and near term Euro facilities presenting further upside
• Over £160m repaid, prepaid or extended
• 24% of gross debt has no LTV covenants
• Medium term opportunity to access debt capital markets
• Euro debt maturities represents opportunity to secure lower rates
Extending maturities at current lower ratesWeighted average debt maturity of 6.9 years
FY2017 FY2018 FY2019 FY2020 FY2025 FY2026FY2024FY2023FY2022FY2021
12.740.8
1.721.1
98.0
52.7
320.5
110.5
52.6
9.0
178.2
5.4
Debt maturity profile (£m)
GBP Euro
£17.2m extensions
agreed post year end

15Redefine International P.L.C.
Full Year 2016 Results Presentation
Medium term target to strengthen our balance sheet by incrementally reducing LTV to within target range of 40% – 50%
Successful track record in managing debt & gearingEfficient capital structure provides ability to capitalise on low interest rate environment
FY201140%
LTV (%)Weighted cost of debt (%)
60%
55%
50%
45%
65%
70%
75%
80%
85%
LTV (%)
75.4%
53.4%
3.4%
5.0%
Cost of debt (%)
5.5%
3.0%
3.5%
4.0%
4.5%
5.0%
FY2012 FY2013 FY2014 FY2015 FY2016
Historic weighted average cost of debt and LTV
• Cost of debt reduced by further 50 bps to 3.4%• All recent refinancing and extensions completed
at 2.3% average cost of debt
• AUK facility provides flexible capital structure and cost of debt efficiencies
• Over 95% of debt at fixed or capped rates

16Redefine International P.L.C.
Full Year 2016 Results Presentation
Resilient income profile with 20.5% of gross rental income coming up to its first break option in the next 5 years
Income securitySolid income visibility with WAULT of 7.8 years supported by diversified portfolio
FY2017 FY2018 FY2019 FY2020 FY2021 FY2026+FY2025FY2024FY2023FY2022
UK Retail UK Hotels EuropeUK Commercial
5.03.1
1.6
6.84.1
10.4 9.77.5 7.1
44.7
Tenant Profile
• Diverse and high quality sources of rental income
• Over 550 tenants
• Over 30% of portfolio subject to index‑linked rents
Top 10 tenantsAs at % of gross 31 August 2016 rental income Units
UK Government 5.4 10
B&Q 3.9 5
VBG(1) 3.5 4
Tesco 3.5 1
Edeka 3.3 34
Royal Mail 2.2 2
Primark 1.9 1
OBI 1.8 3
Debenhams 1.6 2
Wilko 1.6 4
(1) German government‑backed social insurance body
Lease expiries to first break by gross rental income (%)

17Redefine International P.L.C.
Full Year 2016 Results Presentation
Our strategy remains clearly focused on income-led total returns
Repositioning the portfolio for continued growthActively increasing our exposure to targeted sectors with positive growth expectations
Sector exposure 2016 2015 change by market value % % %
UK Shopping centres 22 33 (11)
UK Retail parks & other 14 — 14
UK Offices 16 12 4
UK Distribution & industrial 7 — 7
UK Automotive 4 4 —
UK Hotels 15 22 (7)
Germany 22 29 (7)
Overall 100 100 Camino Park, Crawley

18Redefine International P.L.C.
Full Year 2016 Results Presentation
Camino Park Distribution Centre, Crawley
Portfolio review

19Redefine International P.L.C.
Full Year 2016 Results Presentation
Solid market rental growth across all sectors, other than shopping centres
Uplift in ERV to £106.8m (+4.4%)Gross annualised rental income £105.9m (+£3.7%)
Breakdown of ERV movement (excluding FX)
UK Retail EuropeUK Commercial AUKUK Hotels
(£0.7m) (‑2.4%)
£0.1m (+0.7%)
£0.8m (+4.4%)
£0.2m (+1.0%)(1)
£0.9m (+3.2%)
(1) +£3.4m (+17.4%) including fx impact

20Redefine International P.L.C.
Full Year 2016 Results Presentation
• Reconfiguring and optimising space• Driving commercialisation revenues• Vacant BHS unit at Wigan
• Long term secure income
• Actively targeting food, daily needs, value and leisure tenants
• Closely tracking retail performance• Reduced overall portfolio exposure
Shopping centres: 22% by market valueImproved confidence from national operators willing to take additional space and renew leases
Near full occupancy 98.1% (+20bps)
Known sector headwinds Consumer shopping patterns continue to evolve challenging legacy retail as occupiers right size store portfolios
Long WAULTs 8.4 years

21Redefine International P.L.C.
Full Year 2016 Results Presentation
Retail parks and other retail: 14% by market valueFully occupied retail parks with strong tenant demand exceeding supply
Significant potential for residential development at Priory Retail Park, Merton
International discount fashion retailer in solicitor’s
hands in Derby
Increased opportunity for commercialisation
income across the retail park portfolio
Pre‑let expansions and occupier replacements
underway
National retail park vacancy at 14 year low
Banbury Cross Retail Park, Banbury
The Arches Retail Park, Watford
Priory Retail Park, Merton Albion Street, Derby
22Redefine International P.L.C.
Full Year 2016 Results Presentation
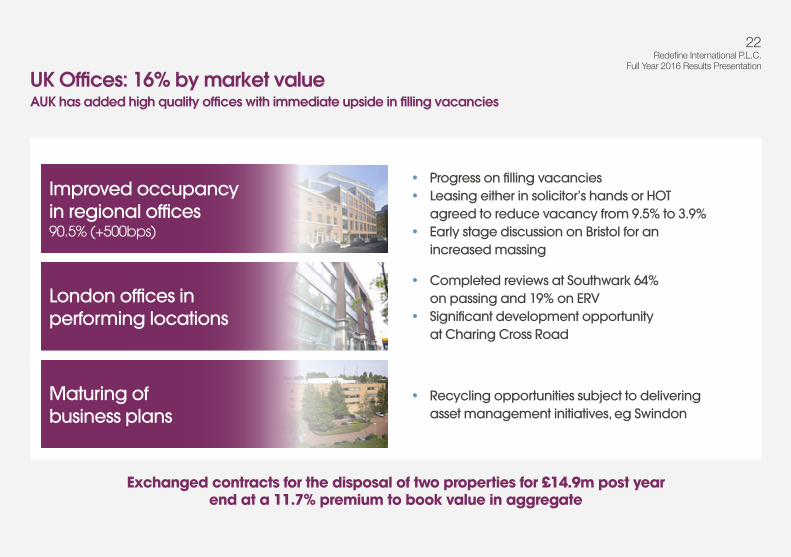
UK Offices: 16% by market valueAUK has added high quality offices with immediate upside in filling vacancies
• Progress on filling vacancies• Leasing either in solicitor’s hands or HOT
agreed to reduce vacancy from 9.5% to 3.9%• Early stage discussion on Bristol for an
increased massing
• Completed reviews at Southwark 64% on passing and 19% on ERV
• Significant development opportunity at Charing Cross Road
• Recycling opportunities subject to delivering asset management initiatives, eg Swindon
Exchanged contracts for the disposal of two properties for £14.9m post year end at a 11.7% premium to book value in aggregate
London offices in performing locations
Maturing of business plans
Improved occupancy in regional offices 90.5% (+500bps)

23Redefine International P.L.C.
Full Year 2016 Results Presentation
Actively increasing exposure to well-located distribution assets
Distribution, industrial and automotive: 11% by market valueDemand for distribution space exceeding supply
+30%
6.0 years WAULTAs reported 31 August 2016
4.6 years WAULTAs reported 31 August 2015
£11per sqft
Recently achieved on neighbouring pre‑let
£10.3per sqft
Achieved on latest agreed lease
£7.5per sqft
As reported on acquisition
Camino Park, Crawley(351,591 sqft)
Distribution and Industrial portfolio
Camino Park, Crawley

24Redefine International P.L.C.
Full Year 2016 Results Presentation
Outlook for limited service branded hotels remains supportive of income growth
• Large increase in London market supply of c.7,000 rooms (+5%)
• Aggregate demand remains > supply
• Mixed trading in our portfolio:
• London moderated in final quarter
• Edinburgh and Reading significantly above forecast
• Enfield Travelodge extension completed during the year
• Extension of 12 rooms in Southwark underway
• Considering other development opportunities
Hotels: 15% by market valueOver 1,000 rooms with further development opportunity
Holiday Inn Express, Southwark

25Redefine International P.L.C.
Full Year 2016 Results Presentation
Europe: 22% by market valueExposure to Germany balances current uncertainty in UK market
• Continued contracted and market rental growth• Improved tenant mix to drive footfall• Commercialisation opportunities
• Ingolstadt – Primark secured on £1.5m pre‑let• Supermarket expansions• Mid‑long term significant development
opportunity at Hamburg
• Solid investment market• Modest economic growth
Sector strategically offers solid cash on cash returns
Developments
Shopping centres near full occupancy 99.4% (‑20bps)
Market outlook remains supportive

26Redefine International P.L.C.
Full Year 2016 Results Presentation
Reduce exposure to maturing business plans
Increase investment in strong property fundamentals
Malthurst
Charing Cross
Watford
Camino
Swindon
Banbury
Acquire secure income streams, exposed to strong property fundamentals, with realisable income and value-add opportunities
Investment strategyEfforts focused on income‑led asset management initiatives informed by occupational demand
Recycle

Divider page titleDivider page subhead
27Redefine International P.L.C.
Full Year 2016 Results Presentation
27Redefine International P.L.C.
Full Year 2016 Results Presentation
Charing Cross Road, London
Outlook

28Redefine International P.L.C.
Full Year 2016 Results Presentation
• We have an opportunity to be the UK leading diversified income focused REIT
• Ongoing repositioning of the portfolio for continued growth
• Further strengthening of the balance sheet
• Long term commitment to deliver sustainable and growing income focused total returns
• Committed to deliver superior dividend returns measured against UK‑REITs
• Revisiting income‑led strategy and will update market in early 2017
Outlook
28Redefine International P.L.C.
Full Year 2016 Results Presentation
Queen’s Drive Retail Park, Kilmarnock

29Redefine International P.L.C.
Full Year 2016 Results Presentation
Mike WattersCEOe: [email protected]
Stephen OakenfullDeputy CEOe: [email protected]
Donald GrantCFOe: [email protected]
Adrian HorsburghProperty Directore: [email protected]
Janine AckermannHead of Investor Relations e: [email protected]
Redefine International P.L.C.2nd Floor, 30 Charles II StreetLondon SW1Y 4AEt: +44 (0) 20 7811 0100
Visit us online www.redefineinternational.com
@RedefinePLC
Redefine International
Redefine International Team

30Redefine International P.L.C.
Full Year 2016 Results Presentation
Appendices

31Redefine International P.L.C.
Full Year 2016 Results Presentation
Strong support despite volatile market backdrop testament to progress in reshaping portfolio and capital structure
• £115m raised in February 2016
• Over subscribed at issue price of 42.5p, 1.9% premium to previous Adjusted NAV
• £109.1m net proceeds used to part fund second tranche of AUK
Successful capital raiseSupport from existing shareholders and new investors
Sep 1580
Source: Factset indexed to 100
FTSE 100FTSE EPRA/NAREIT UK
85
90
95
100
105
110
Nov 15Oct 15 Dec 15 Jan 16 Feb 16 Mar 16 Apr 16
Market volatility since 31 August 2015

32Redefine International P.L.C.
Full Year 2016 Results Presentation
Over 95% of debt facilities have interest rate swaps or caps attached for the duration of the facility
Debt facilities
Economic Principal Share Cost of % Debt Principal debt Group Debt Analysis Ownership Lender Currency £m £m Maturity (%)
HSBC, RBS, AUK + other office 100.0% Barclays, Santander GBP 282.5 282.5 Sep 2020 2.8%AUK facility 282.5 282.5
Newington House, London 100.0% Allied Irish Bank (AIB) GBP 5.4 5.4 Dec 2019 3.6%26 The Esplanade 50.0% Lloyds Bank GBP 18.0 9.0 Dec 2022 6.1%UK Offices 23.4 14.4
Kwik Fit Portfolio 100.0% Aviva GBP 10.2 10.2 Jun 2029 6.4%Petrol Filling Stations 100.0% HSBC GBP 3.9 3.9 Jan 2019 4.2%UK Automotive 14.1 14.1
Grand Arcade, Wigan 100.0% Aviva GBP 73.0 73.0 Apr 2032 5.7%Weston Favell, Northampton 100.0% Aviva GBP 50.0 50.0 Nov 2038 5.7%Birchwood, Warrington 100.0% Aviva GBP 28.5 28.5 Sep 2035 6.1%Byron Place, Seaham 100.0% Aviva GBP 16.5 16.5 Sep 2031 6.4%St Georges, Harrow 100.0% Berlin Hyp GBP 38.0 38.0 Apr 2021 2.9%West Orchards, Coventry 100.0% Santander GBP 17.2 17.2 Dec 2018 4.5%UK Retail 223.2 223.2

33Redefine International P.L.C.
Full Year 2016 Results Presentation
Debt facilities continued
Economic Principal Share Cost of % Debt Principal debt Group Debt Analysis Ownership Lender Currency £m £m Maturity (%)
London Portfolio and Edinburgh 71.1% Aareal Bank GBP 110.5 110.5 Nov 2021 2.8%UK Hotels 110.5 110.5
Europe Bahnhof Altona, Hamburg 100.0% HSH Nordbank EUR 44.2 44.2 Feb 2020 3.7%City Arcaden, Ingolstadt 100.0% Commerzbank EUR 10.0 10.0 Dec 2016 1.0%Schloss Strassen Center, Berlin 100.0% HSH Nordbank EUR 52.7 52.7 Mar 2021 2.0%German Shopping Centres 106.9 106.9
Premium Portfolio 93.9% Munchener EUR 15.5 15.5 Feb 2020 1.3%OBI Portfolio 74.2% Bayern LB EUR 12.5 12.5 Oct 2017 1.2%Bremen/Lindenhoff 99.0% Bayern LB EUR 3.0 3.0 Sep 2019 2.0%Supermarkets and retail park portfolio 50.0% Berlin Hyp EUR 73.9 37.0 May 2020 1.4%Waldkraiburg 50.0% Bayern LB EUR 5.4 2.7 Jun 2017 2.6%Kaiserslautern 50.0% Bayern LB EUR 3.4 1.7 Sep 2017 2.6%Huckelhoven 50.0% Bayern LB EUR 6.4 3.2 Dec 2017 2.6%German Supermarkets & Retail Parks 120.1 75.6
VBG portfolio 49.0% DG Hyp EUR 47.8 23.4 Sep 2017 2.6%German Offices 47.8 23.4 Total (including share of joint ventures) 928.5 850.6

34Redefine International P.L.C.
Full Year 2016 Results Presentation
Bahnhof Center, Altona, Hamburg
Portfolio detail

35Redefine International P.L.C.
Full Year 2016 Results Presentation
AUK acquisition consistent with investment philosophy to invest in assets with resilient and growing income returns
• Portfolio value increased by c.50%
• Transaction completed in two tranches:
– Tranche I: 10 assets, completed in September and October 2015 for £256m
– Tranche II: 9 assets, completed in March 2016 for £205m
• High quality institutional assets, 75% located in economic growth areas
• Pre‑completion disposal of Grosvenor Street, London realising £2.8m net profit
Transformational milestone achieved with AUK
AUK Retail valued at £200m(1)
(8 properties)AUK Offices valued at £132m(1)
(6 properties)AUK Distribution & Other valued at £125m(1) (5 properties)
(1) Figures as at 31 August 2016

36Redefine International P.L.C.
Full Year 2016 Results Presentation
Balanced exposure to retail, commercial and hotel sectors, supported by sector specialist asset managers
Where we operateGeographical focus in Europe’s two largest economies
Germany
Europe
UK Retail
15%
22%
36%
27%
UK Commercial
Market value£1.5bn
UK Hotels
UK
London
Jersey
Key UK Commercial UK Retail Hotels AUK German assets

37Redefine International P.L.C.
Full Year 2016 Results Presentation
£1.5bn portfolio enhances ability to allocate & recycle capital into new opportunities to deliver the best risk adjusted returns
Portfolio repositioned for further income growthAUK improves portfolio exposure to sub‑sectors with good income and value growth prospects
• Exposure to assets with stronger fundamentals providing income‑led asset management opportunities
• More active capital recycling
• Investment market remains strong for secure income
• Disposals to focus on mature and underperforming assets
98%
inde
xed le
ases &
slow
eco
nom
ic recovery
Ass
et m
an
agement and
recy
cling
o
pportunities
Modes
t ren
tal g
row
th
and o
ptim
ising
spa
ce
Modest renta
l gro
wth
and optimisin
g spac
e
50% in high dema
nd se
cto
rs with positive outlook
59% growth in loca
tions with econom
ic growth outlook
Greater London
Big 6 UK cities
Big 5 German cities
UK South
Dominant regionalshopping centres
Other
UK Retail Parks
UK Regional Offices
UK Hotels
UK London Offices
Germany
Other
UK Distribution & Industrial
UK Automotive
UK Shopping Centres
15%29%
10%
11%9%
17%
24%
12%
10%22%
22%
6%
4%2%
7%
Market value by geography Market value by sector

38Redefine International P.L.C.
Full Year 2016 Results Presentation
Strategically targeted sectors
UK Retail – Market value £537m
UK Commercial – Market value £418m
UK Hotels – Market value £229m
Europe – Market value £345m
• 6 wholly‑owned regionally dominant shopping centres, tenanted by leading retailers including Tesco, Debenhams, Wilkos, Boots, H&M and TK Maxx
• 5 well located retail parks, of which 4 assets are in London, UK South and “Big 6” UK cities
• Other assets include high street retail assets and a retail warehouse
• 8 limited service hotels in Greater London and 1 hotel in Edinburgh
• Branded Holiday Inn, Holiday Inn Express, Crowne Plaza and DoubleTree by Hilton
• 25.3% holding in RedefineBDL, the UK’s largest independent hotel manager
• 15.5% holding in IHL, a hotel and leisure focused listed entity
• 4 Greater London offices some of which present alternate uses
• 20 regional offices, 5 AUK assets with high vacancies
• 2 well located distribution centres
• Vehicle dealership, service station and motor trade properties which provide defensive income on long leases, with leading brands including BP and Kwik Fit
• 87 properties in Germany
• Almost 50% by value contributed by 3 well located shopping centres in Berlin, Hamburg and Ingolstadt
• Other assets include retail parks, small discount supermarkets and government‑let offices
• Tenants are weighted to non‑discretionary food stores and discounters
Occupancy (%) 98.7
Lettable area (m2) 237,694
Annualised gross rental income (£m) 40.6
EPRA net initial yield (%) 6.3
# properties 14
WAULT (years) 8.8
Occupancy (%) 94.6
Lettable area (m2) 216,829
Annualised gross rental income (£m) 27.5
EPRA net initial yield (%) 5.4
# properties 64
WAULT (years) 6.1
Occupancy (%) 100.0
Lettable area (m2) 41,323
Annualised gross rental income (£m) 15.0
EPRA net initial yield (%) 6.1
# properties 9
WAULT (years) 10.3
Occupancy (%) 98.5
Lettable area (m2) 186,061
Annualised gross rental income (£m) 22.8
EPRA net initial yield (%) 5.6
# properties 87
WAULT (years) 6.5

39Redefine International P.L.C.
Full Year 2016 Results Presentation
Portfolio analysisPortfolio summary
Annualised EPRA Weighted Values as at % of portfolio by Market gross rental topped Reversionary average EPRA voids 31 August 2016 market value value (£m) Properties Area (m2) income (£m) ERV (£m) EPRA NIY up yield yield lease length (by ERV) Indexed
UK Shopping Centres 22% 337.2 6 157,175 26.4 27.3 6.3% 6.5% 7.6% 8.4 1.9% 21.9%UK Retail Parks 12% 168.5 5 50,971 11.7 10.7 6.2% 6.5% 5.9% 8.1 — 2.1%UK Retail – other 2% 31.4 3 29,548 2.5 2.3 7.2% 7.2% 6.8% 16.7 1.0% —UK Retail 36% 537.1 14 237,694 40.6 40.3 6.3% 6.5% 7.0% 8.8 1.3% 14.8%UK Offices – Greater London 6% 91.4 4 15,706 4.3 5.0 3.8% 4.3% 5.1% 6.3 — 36.6%UK Offices – Regional 10% 158.5 20 79,433 12.7 13.2 6.1% 7.0% 7.8% 4.2 9.5% 25.3%UK Distribution and Industrial 7% 100.3 4 98,991 6.2 7.0 5.5% 5.8% 6.5% 6.0 4.0% —UK Automotive 4% 67.3 36 22,699 4.3 3.4 5.9% 5.9% 4.8% 11.8 — 67.2%UK Commercial 27% 417.5 64 216,829 27.5 28.6 5.4% 5.9% 6.4% 6.1 5.4% 27.8%Greater London & RBDL portfolio 12% 183.9 7 29,426 12.3 12.0 6.2% 6.2% 6.1% 9.3 — —Edinburgh, DoubleTree by Hilton 2% 31.1 1 7,250 2.0 2.5 6.0% 6.0% 7.4% 9.5 — 4.4%London, Enfield Travelodge 1% 14.2 1 4,647 0.7 0.7 4.8% 4.8% 4.8% 30.9 — 100.0%UK Hotels 15% 229.2 9 41,323 15.0 15.2 6.1% 6.1% 6.2% 10.3 — 5.3%Total UK 78% 1,183.8 87 495,846 83.1 84.1 5.9% 6.2% 6.6% 8.2 2.5% 17.4%German Shopping Centres 10% 160.2 3 34,903 8.7 9.9 4.5% 4.5% 5.8% 5.0 0.6% 98.1%German Supermarkets and Retail Parks 9% 144.4 80 129,037 10.7 10.6 6.2% 6.2% 6.9% 7.5 2.1% 97.0%German Offices 3% 40.6 4 22,121 3.4 2.2 7.4% 7.4% 5.1% 6.9 2.7% 99.9%Europe 22% 345.2 87 186,061 22.8 22.7 5.6% 5.6% 6.2% 6.5 1.5% 97.9%Total 100% 1,529.0 174 681,907 105.9 106.8 5.8% 6.1% 6.5% 7.8 2.3% 34.7%
Wholly owned 91% 1,388.1 98 575,898 94.8 97.2 5.8% 6.0% 6.6% 7.8 2.4% 28.1%Held in joint ventures (proportionate) 9% 140.9 76 106,009 11.1 9.6 6.7% 7.7% 6.6% 8.0 1.3% 91.8%Portfolio (excl AUK) 70% 1,072.4 155 464,727 77.2 76.7 6.1% 6.2% 6.7% 7.9 1.3% 46.2%AUK portfolio 30% 456.6 19 217,180 28.7 30.1 5.1% 5.7% 6.2% 7.6 4.6% 4.0%

40Redefine International P.L.C.
Full Year 2016 Results Presentation
Top 20 assetsTop 20 assets make up >60% of total portfolio
Annualised EPRA Weighted Values as at % of portfolio by Market gross rental topped average EPRA voids 31 August 2016 market value value (£m) Area (m2) income (£m) ERV (£m) EPRA NIY up yield lease length (by ERV) Indexed
Wigan, Grand Arcade 6.4% 97.3 43,491 7.4 7.0 6.0% 6.3% 9.0 5.9% 18.2%Northampton, Weston Favell 5.5% 84.8 28,524 6.5 7.0 7.1% 7.1% 7.5 — 48.3%Berlin, Schloss Strassen Center 5.0% 76.6 18,860 4.4 4.4 5.0% 5.0% 5.3 1.0% 98.1%London, Harrow, St Georges 4.7% 72.6 20,202 4.8 4.9 5.3% 5.5% 5.3 0.1% 20.3%Hamburg, Bahnhof Center Altona 4.3% 65.1 15,074 3.9 3.7 5.2% 5.2% 4.9 0.5% 97.7%Banbury, Banbury Cross Retail Park 3.2% 49.0 15,845 3.7 3.3 6.4% 7.0% 6.1 — 6.5%London, Charing Cross Road 3.2% 49.0 3,776 1.8 2.3 2.6% 3.4% 5.2 — 32.3%London, Watford, The Arches Retail Park 3.0% 45.7 11,443 3.0 2.6 6.2% 6.2% 10.4 — —Crawley, Camino Park Distribution Centre 2.9% 45.0 32,664 2.7 3.2 5.1% 5.6% 6.6 — —Bridgwater, Express Park Distribution Centre 2.7% 41.0 46,961 2.7 2.8 6.3% 6.3% 5.3 — —Top 10 40.9% London, Southwark Holiday Inn Express 2.5% 38.2 3,936 2.4 2.6 5.9% 5.9% 9.3 — —London, Merton, Priory Retail Park 2.4% 36.9 6,533 2.2 2.0 5.5% 5.5% 9.2 — —Warrington, Birchwood 2.3% 35.4 34,583 2.9 3.2 6.8% 7.0% 14.6 1.8% 4.2%London, Earl’s Court Holiday Inn Express 2.0% 31.0 2,781 2.2 2.0 6.6% 6.6% 9.3 — —Edinburgh, DoubleTree by Hilton 2.0% 31.1 7,250 2.0 2.5 6.0% 6.0% 9.5 — 4.4%London, Limehouse Holiday Inn Express 1.8% 28.1 5,747 2.1 1.9 7.0% 7.0% 9.3 — —Coventry, West Orchards 1.8% 27.6 19,656 3.2 3.6 6.5% 7.6% 7.5 1.1% —Manchester, Deansgate Office 1.7% 25.5 7,776 1.4 2.2 3.3% 4.1% 4.1 19.8% —High Wycombe, Sytner Vehicle Dealership 1.6% 24.7 6,028 1.4 1.1 5.3% 5.3% 8.6 — —London, Royal Docks Holiday Inn Express 1.6% 23.9 4,561 1.8 1.6 6.9% 6.9% 9.3 — —Top 20 60.7%

41Redefine International P.L.C.
Full Year 2016 Results Presentation
UK Retail portfolio
% of portfolio Annualised EPRA Weighted UK Retail as at by market Market value gross rental EPRA topped Reversionary average Voids 31 August 2016 value (£m) Properties Area (m2) income (£m) ERV (£m) NIY up yield yield lease length (by ERV) Indexed
UK Shopping Centres 62.8% 337.2 6 157,175 26.4 27.3 6.3% 6.5% 7.6% 8.4 1.9% 21.9%UK Retail Parks 31.4% 168.5 5 50,971 11.7 10.7 6.2% 6.5% 5.9% 8.1 — 2.1%UK Retail – other 5.8% 31.4 3 29,548 2.5 2.3 7.2% 7.2% 6.8% 16.7 1.0% —UK Retail 100.0% 537.1 14 237,694 40.6 40.3 6.3% 6.5% 7.0% 8.8 1.3% 14.8%
Portfolio (excl AUK) 62.8% 337.2 6 157,175 26.4 27.3 6.3% 6.5% 7.6% 8.4 1.9% 21.9%AUK portfolio 37.2% 199.9 8 80,519 14.2 13.0 6.3% 6.6% 6.1% 9.6 0.2% 1.7%

42Redefine International P.L.C.
Full Year 2016 Results Presentation
UK Commercial portfolio
% of portfolio Annualised EPRA Weighted UK Commercial by market Market value gross rental EPRA topped Reversionary average Voids as at 31 August 2016 value (£m) Properties Area (m2) income (£m) ERV (£m) NIY up yield yield lease length (by ERV) Indexed
UK Offices – Greater London 21.9% 91.4 4 15,706 4.3 5.0 3.8% 4.3% 5.1% 6.3 — 36.6%UK Offices – Regional 38.0% 158.5 20 79,433 12.7 13.2 6.1% 7.0% 7.8% 4.2 9.5% 25.3%UK Offices 59.9% 249.9 24 95,139 17.0 18.2 5.3% 6.0% 6.8% 4.7 6.9% 28.2%UK Distribution and Industrial 24.0% 100.3 4 98,991 6.2 7.0 5.5% 5.8% 6.5% 6.0 4.0% —UK Automotive 16.1% 67.3 36 22,699 4.3 3.4 5.9% 5.9% 4.8% 11.8 — 67.2%UK Commercial 100.0% 417.5 64 216,829 27.5 28.6 5.4% 5.9% 6.4% 6.1 5.4% 27.8%
Wholly owned 97.2% 405.8 63 214,077 26.7 27.8 5.4% 5.9% 6.4% 6.1 5.5% 28.7%Held in joint ventures (proportionate) 2.8% 11.7 1 2,752 0.9 0.8 6.8% 6.8% 6.8% 6.3 — —
Portfolio (excl AUK) 38.5% 160.8 53 80,168 13.0 11.5 7.0% 7.2% 6.7% 6.6 1.5% 52.2%AUK portfolio 61.5% 256.7 11 136,661 14.5 17.1 4.4% 5.1% 6.3% 5.6 8.0% 6.1%

43Redefine International P.L.C.
Full Year 2016 Results Presentation
UK Hotel portfolio
% of portfolio Annualised EPRA Weighted UK Hotels by market Market value gross rental EPRA topped Reversionary average Voids as at 31 August 2016 value (£m) Properties Area (m2) income (£m) ERV (£m) NIY up yield yield lease length (by ERV) Indexed
Greater London RBDL portfolio 80.2% 183.9 7 29,426 12.3 12.0 6.2% 6.2% 6.1% 9.3 — —Edinburgh, DoubleTree by Hilton 13.6% 31.1 1 7,250 2.0 2.5 6.0% 6.0% 7.4% 9.5 — 4.4%RBDL Managed Hotels 93.8% 215.0 8 36,676 14.3 14.5 6.2% 6.2% 6.3% 9.3 — 0.6%London, Enfield Travelodge 6.2% 14.2 1 4,647 0.7 0.7 4.8% 4.8% 4.8% 30.9 — 100.0%UK Hotels 100.0% 229.2 9 41,323 15.0 15.2 6.1% 6.1% 6.2% 10.3 — 5.3%

44Redefine International P.L.C.
Full Year 2016 Results Presentation
European portfolio
% of portfolio Annualised EPRA Weighted Europe as at by market Market value gross rental EPRA topped Reversionary average Voids 31 August 2016 value (£m) Properties Area (m2) income (£m) ERV (£m) NIY up yield yield lease length (by ERV) Indexed
German Shopping Centres 46.4% 160.2 3 34,903 8.7 9.9 4.5% 4.5% 5.8% 5.0 0.6% 98.1%German Supermarkets and Retail Parks 41.8% 144.4 80 129,037 10.7 10.6 6.2% 6.2% 6.9% 7.5 2.1% 97.0%German Retail 88.2% 304.6 83 163,940 19.4 20.5 5.3% 5.3% 6.3% 6.4 1.4% 97.5%German Offices 11.8% 40.6 4 22,121 3.4 2.2 7.4% 7.4% 5.1% 6.9 2.7% 99.9%Europe 100.0% 345.2 87 186,061 22.8 22.7 5.6% 5.6% 6.2% 6.5 1.5% 97.9% Wholly owned 62.6% 216.0 12 82,804 12.6 13.9 4.9% 4.9% 6.0% 5.1 1.6% 96.5%Held in joint ventures (proportionate) 37.4% 129.2 75 103,257 10.2 8.8 6.7% 7.7% 6.6% 8.2 1.4% 99.5%

45Redefine International P.L.C.
Full Year 2016 Results Presentation
AUK portfolio detail
% of portfolio Annualised EPRA Weighted AUK portfolio as at by market Market value gross rental Gross EPRA topped Reversionary average Voids (by 31 August 2016 value (£m) Properties Area (m2) income (£m) ERV (£m) NIY up yield yield lease length gross ERV) Indexed
Retail Parks 36.9% 168.5 5 50,971 11.7 10.7 6.2% 6.5% 5.9% 8.1 — 2.1%Retail – Other 6.9% 31.4 3 29,548 2.5 2.3 7.2% 7.2% 6.8% 16.7 1.0% —Retail Portfolio 43.8% 199.9 8 80,519 14.2 13.0 6.3% 6.6% 6.1% 9.6 0.2% 1.7%Offices – Greater London 10.7% 49.0 1 3,776 1.8 2.3 2.6% 3.4% 4.4% 5.2 — 32.3%Offices – Regional 18.1% 82.7 5 27,866 5.2 6.7 3.9% 5.2% 7.6% 4.3 16.2% 6.2%Offices – Total 28.8% 131.7 6 31,642 7.0 9.0 3.4% 4.5% 6.4% 4.5 12.1% 12.9%Distribution and Industrial 22.0% 100.3 4 98,991 6.2 7.0 5.5% 5.8% 6.5% 6.0 4.0% —Automotive 5.4% 24.7 1 6,028 1.3 1.1 5.2% 5.2% 4.2% 8.6 — —Other – Total 27.4% 125.0 5 105,019 7.5 8.1 5.4% 5.7% 6.1% 6.5 3.5% —Commercial Portfolio 56.2% 256.7 11 136,661 14.5 17.1 4.4% 5.1% 6.3% 5.6 8.0% 6.1%Total Portfolio 100.0% 456.6 19 217,180 28.7 30.1 5.1% 5.7% 6.2% 7.6 4.6% 4.0%
Tranche I 53.8% 245.7 10 154,431 17.2 16.8 6.2% 6.5% 6.4% 8.1 1.8% 1.4%Tranche II 46.2% 210.9 9 62,749 11.5 13.3 4.1% 4.9% 5.9% 6.8 8.2% 7.8%
• Off‑market transaction achieved in a highly competitive UK property market
• Transaction to be completed in two tranches:
• Tranche 1 comprised 10 assets completed in October 2015 for £256.0m
• Tranche 2 made up of 9 assets completed in March 2016 for £204.7m
• High quality institutional assets of which 75% are located in economic growth areas
• All low yielding assets with high vacancies were strategically weighted to Tranche 2 and early progress has been made on filling vacancies
• 5.0% yield on acquisition expected to increase to 5.7% following early sale of Grosvenor Street, London, filling voids and run off of rent free periods
(1) Figures as at 31 August 2016

46Redefine International P.L.C.
Full Year 2016 Results Presentation
St George’s Shopping Centre, Harrow
Corporate overview

47Redefine International P.L.C.
Full Year 2016 Results Presentation
Committed to delivering superior distributions to shareholders
Delivered value throughout a five year transformation
(1) Market cap as at 21 October 2016
Significant efforts over the last 5 years have transformed both the corporate structure and asset base
• Reverse takeover of Wichford P.L.C.
• Admitted to Premium listing
• UK‑REIT conversion Internalisation of management
• JSE secondary listing
• Acquisition of Weston Favell Shopping Centre for £84m
• Repayment of over £250m of legacy financing facilities
• £127m equity raise
• German shopping centre acquisition €189m
• Included in the FTSE 250 and EPRA indices
• £55m equity raise
• Acquisition of German Retail Portfolio €157m
• Sold non‑core assets, including Cromwell and Swiss portfolio
• £70m equity raise • £115m equity raise
• £490m AUK acquisition
2011 2012 2013 2014 2015 2016
31 August 2011
Market Cap (£m) 227
Portfolio Value (£m) 1,077
Underlying distributable earnings (£m) 20.3
LTV (%) 75.4
31 August 2016
Market Cap(1) (£m) 789
Portfolio Value (£m) 1,529
Underlying distributable earnings (£m) 52.2
LTV (%) 53.4

48Redefine International P.L.C.
Full Year 2016 Results Presentation
• MBA and qualified engineer with a BSc Eng (Civil) Degree
• Over 27 years experience in the investment banking and real estate industries
• Joined Redefine International in 1998
• Qualified Chartered Surveyor
• Over 30 years of experience in the UK real estate sector
• Joined Redefine International in March 2014
• CFA with a BSc (Hons) Degree in Construction Management
• Over 16 years experience, including 10 years in the real estate sector
• Joined Redefine International in May 2007
• Qualified Chartered Accountant
• Over 20 years of experience, including 7 years in the real estate sector
• Joined Redefine International in August 2015
Presentation team
Mike Watters Chief Executive
Adrian Horsburgh Property Director
Stephen Oakenfull Deputy Chief Executive
Donald Grant Chief Financial Officer