Embed Size (px)
Citation preview

2016 Half Year
Results Presentation
Hastings Group Holdings plc
11 August 2016

Page 2 | 11 August 2016
Agenda
Overview and key achievements 3
Gary Hoffman
Group financials 8
Richard Hoskins
Summary and outlook 17
Gary Hoffman
Q&A 19
Page 3 | 11 August 2016
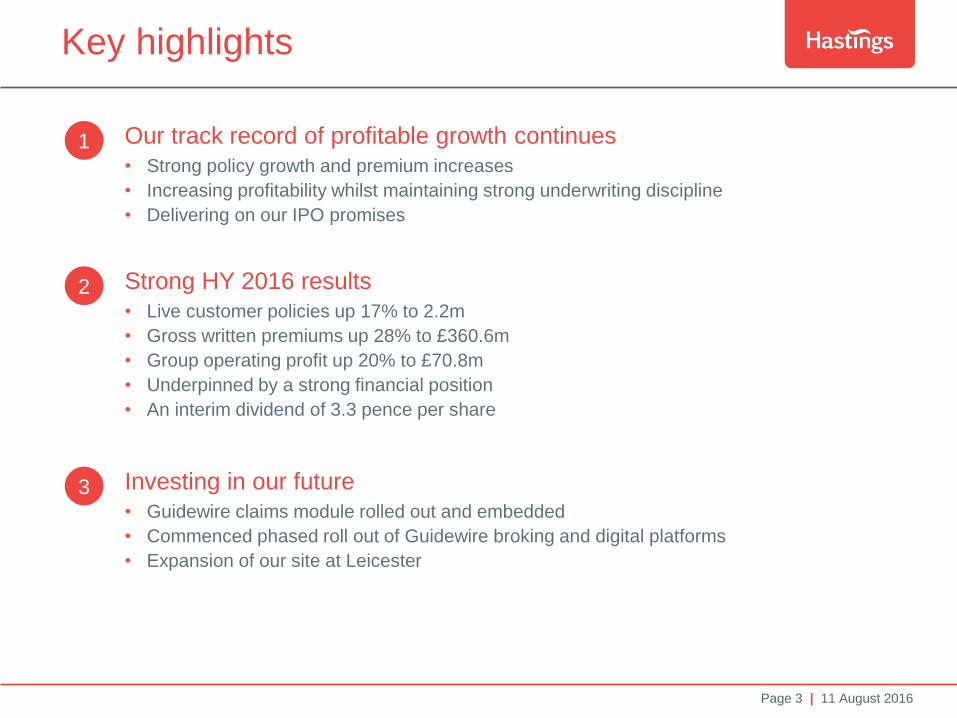
Key highlights
1 Our track record of profitable growth continues
• Strong policy growth and premium increases
• Increasing profitability whilst maintaining strong underwriting discipline
• Delivering on our IPO promises
3 Investing in our future
• Guidewire claims module rolled out and embedded
• Commenced phased roll out of Guidewire broking and digital platforms
• Expansion of our site at Leicester
2 Strong HY 2016 results
• Live customer policies up 17% to 2.2m
• Gross written premiums up 28% to £360.6m
• Group operating profit up 20% to £70.8m
• Underpinned by a strong financial position
• An interim dividend of 3.3 pence per share
Page 4 | 11 August 2016
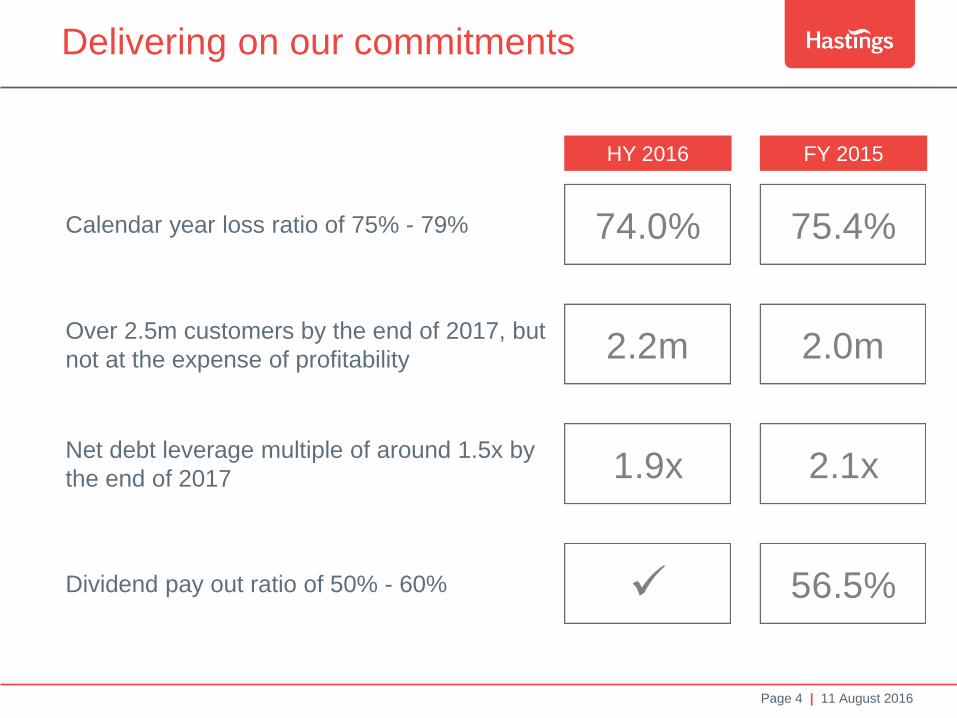
Delivering on our commitments
Calendar year loss ratio of 75% - 79%
Over 2.5m customers by the end of 2017, but
not at the expense of profitability
Net debt leverage multiple of around 1.5x by
the end of 2017
Dividend pay out ratio of 50% - 60%
HY 2016 FY 2015
74.0% 75.4%
2.2m 2.0m
1.9x 2.1x
56.5%
Page 5 | 11 August 2016
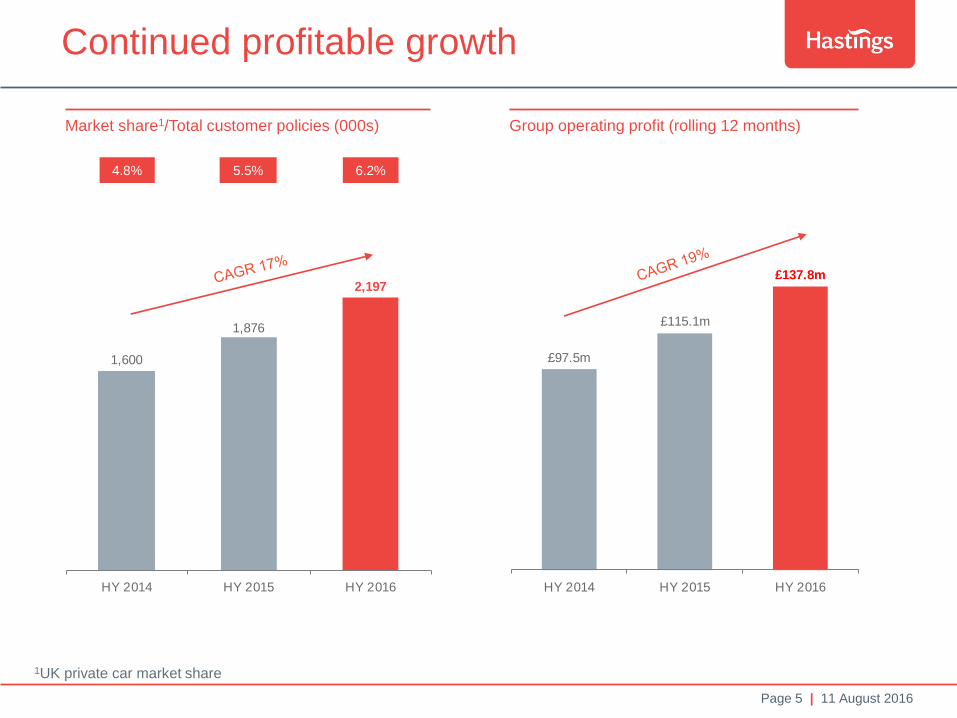
1,600
1,876
2,197
HY 2014 HY 2015 HY 2016
£97.5m
£115.1m
£137.8m
HY 2014 HY 2015 HY 2016
Continued profitable growth
Market share1/Total customer policies (000s) Group operating profit (rolling 12 months)
4.8% 5.5% 6.2%
1UK private car market share
Page 6 | 11 August 2016
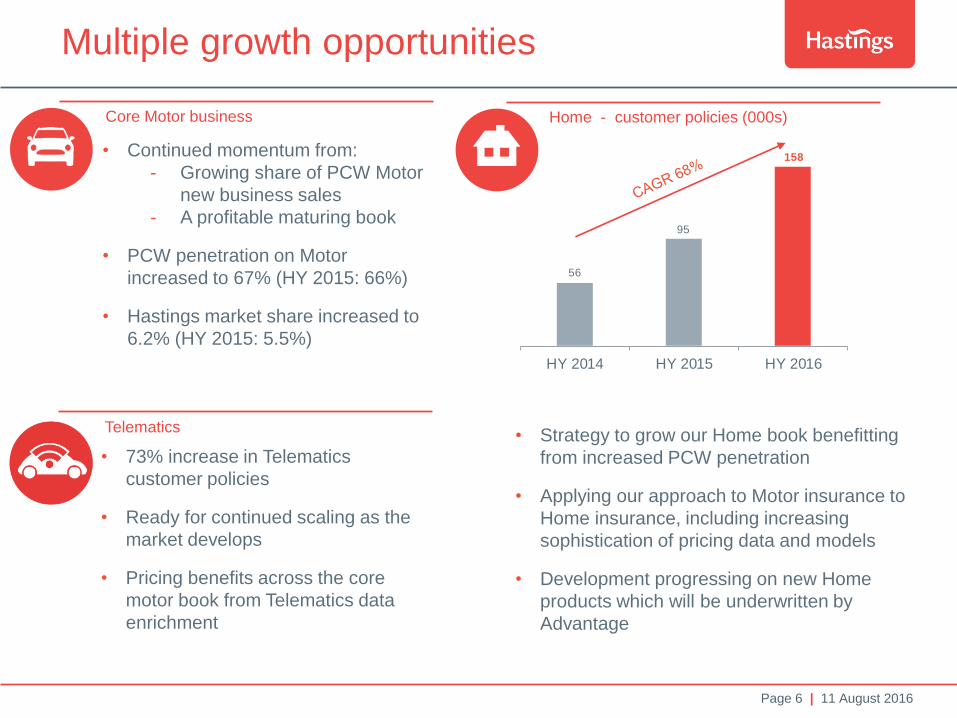
Multiple growth opportunities
• Strategy to grow our Home book benefitting
from increased PCW penetration
• Applying our approach to Motor insurance to
Home insurance, including increasing
sophistication of pricing data and models
• Development progressing on new Home
products which will be underwritten by
Advantage
56
95
158
HY 2014 HY 2015 HY 2016
Home - customer policies (000s) Core Motor business
• Continued momentum from:
- Growing share of PCW Motor
new business sales
- A profitable maturing book
• PCW penetration on Motor
increased to 67% (HY 2015: 66%)
• Hastings market share increased to
6.2% (HY 2015: 5.5%)
• 73% increase in Telematics
customer policies
• Ready for continued scaling as the
market develops
• Pricing benefits across the core
motor book from Telematics data
enrichment
Telematics
Page 7 | 11 August 2016
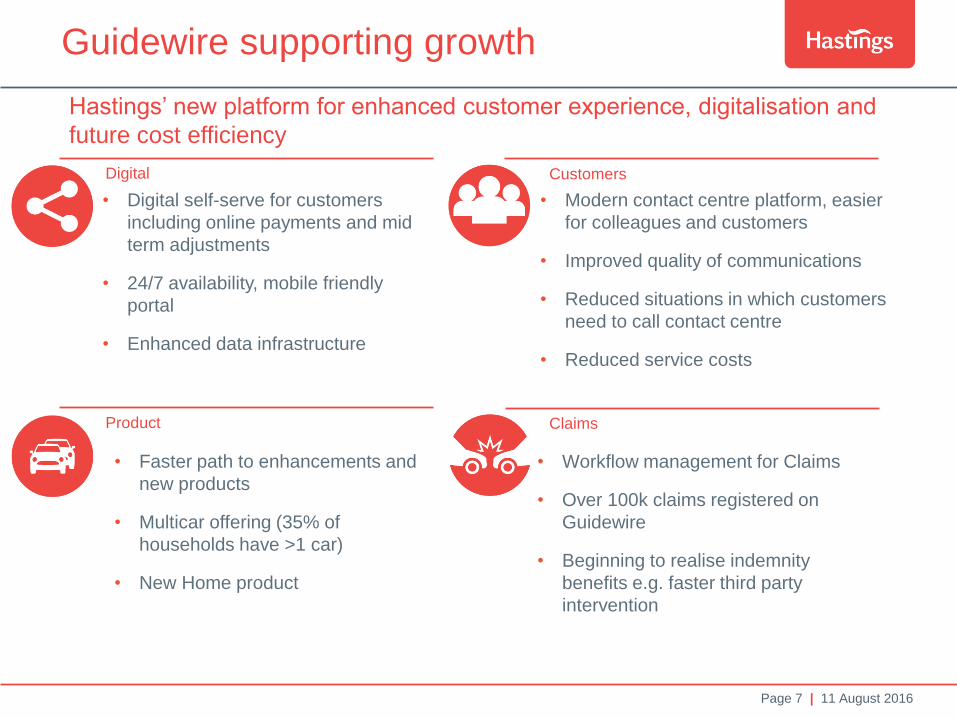
Guidewire supporting growth
• Digital self-serve for customers
including online payments and mid
term adjustments
• 24/7 availability, mobile friendly
portal
• Enhanced data infrastructure
• Modern contact centre platform, easier
for colleagues and customers
• Improved quality of communications
• Reduced situations in which customers
need to call contact centre
• Reduced service costs
• Faster path to enhancements and
new products
• Multicar offering (35% of
households have >1 car)
• New Home product
• Workflow management for Claims
• Over 100k claims registered on
Guidewire
• Beginning to realise indemnity
benefits e.g. faster third party
intervention
Customers Digital
Claims Product
Hastings’ new platform for enhanced customer experience, digitalisation and
future cost efficiency
Page 8 | 11 August 2016
Richard Hoskins
Group financials

Page 9 | 11 August 2016
£70.8m
74.0%
£49.1m
1.9x
156%
Financial highlights
Continued profitable growth with Group operating profit
increasing 20%
Calendar year loss ratio below the target range of 75% - 79%
Strong cash generation, supporting dividends, deleveraging
and investment in our business
Reduced due to ongoing profit growth combined with strong
cash generation
Strong Solvency II coverage ratio under the standard formula
Group operating profit:
Loss ratio:
Cash generated:
Net debt leverage multiple:
Solvency II:

Page 10 | 11 August 2016
Group results
• Increasing policy count
and premium increases
driving top line growth,
with GWP up 28%
• NEP growth of 32%
reflecting written
premium increases
earning through
• Strong Retail profit
growth
• Operating expense
increase reflects policy
count growth and
investment in the
business
• Net income and EPS up
55%, both benefiting from
strong Group operating
profit growth and lower
finance costs
1 Non IFRS EPS, based on shares in issue as at 30 June 2016
£m HY 2016 HY 2015
Gross written premiums 360.6 282.7 28%
Net earned premiums 156.1 118.0 32%
Retail income 112.0 89.3
Reinsurance and investment income 14.6 15.3
Net revenue 282.7 222.6 27%
Net insurance claims (115.5) (86.8)
Acquisition costs (25.2) (21.0)
Other operating expenses (71.2) (55.6)
Group operating profit 70.8 59.2 20%
Net income 51.9 33.5 55%
Adjusted EPS (pence)1 7.9 5.1 55%
Page 11 | 11 August 2016
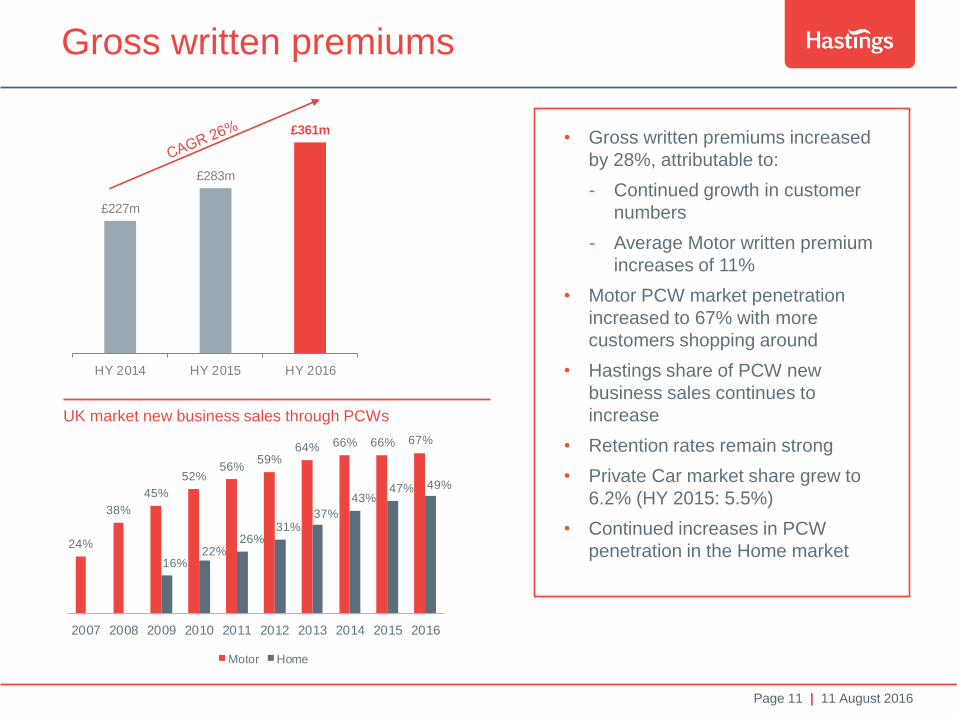
£227m
£283m
£361m
HY 2014 HY 2015 HY 2016
• Gross written premiums increased
by 28%, attributable to:
- Continued growth in customer
numbers
- Average Motor written premium
increases of 11%
• Motor PCW market penetration
increased to 67% with more
customers shopping around
• Hastings share of PCW new
business sales continues to
increase
• Retention rates remain strong
• Private Car market share grew to
6.2% (HY 2015: 5.5%)
• Continued increases in PCW
penetration in the Home market
Gross written premiums
UK market new business sales through PCWs
24%
38%
45%
52%56%
59%64% 66% 66% 67%
16%22%
26%31%
37%
43%47% 49%
2007 2008 2009 2010 2011 2012 2013 2014 2015 2016
Motor Home
Page 12 | 11 August 2016
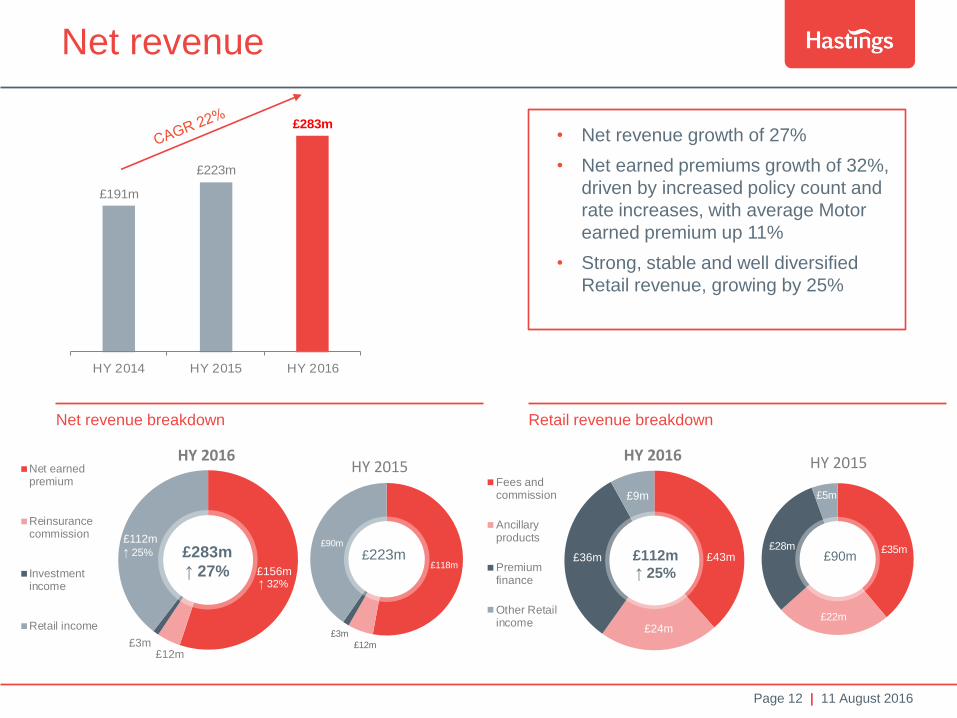
£156m
£12m£3m
£112m
HY 2016Net earnedpremium
Reinsurancecommission
Investmentincome
Retail income
£118m
£12m
£3m
£90m
HY 2015
£43m
£24m
£36m
£9m
HY 2016
Fees andcommission
Ancillaryproducts
Premiumfinance
Other Retailincome
£35m
£22m
£28m
£5m
HY 2015
£191m
£223m
£283m
HY 2014 HY 2015 HY 2016
Net revenue
Net revenue breakdown
• Net revenue growth of 27%
• Net earned premiums growth of 32%,
driven by increased policy count and
rate increases, with average Motor
earned premium up 11%
• Strong, stable and well diversified
Retail revenue, growing by 25%
Retail revenue breakdown
£283m
↑ 27%
£223m £90m £112m
↑ 25% ↑ 32%
↑ 25%

Page 13 | 11 August 2016
Combined operating ratio
Combined operating ratio
HY 2016 FY 2015
Written premium inflation 11% 10%
Earned premium inflation 11% 4%
Claims inflation 5% 5%
Premium & claims inflation
Calendar year loss ratio
• Combined operating ratio improved to
89.2%
• Accident year loss ratio reduced to
74.3% (2015: 79.9%) due to average
premium increasing at a faster rate
than claims inflation
• Prior year development impacted by
strengthening of large loss reserves
• Expense ratio reduced to 15.2%
benefitting from premiums growing at a
faster rate than expenses
73.6% 75.4% 74.0%
16.4% 15.9% 15.2%
90.0% 91.3% 89.2%
HY 2015 FY 2015 HY 2016
Expense ratio
Calendar yearloss ratio
HY 2015 FY 2015 HY 2016
Accident year
loss ratio1 79.9% 78.4% 74.3%
Prior year
development1(6.3%) (3.0%) (0.3%)
Calendar year
loss ratio73.6% 75.4% 74.0%
1 The accident year loss ratio and prior year development have been calculated as detailed in the interim financial statements
Page 14 | 11 August 2016
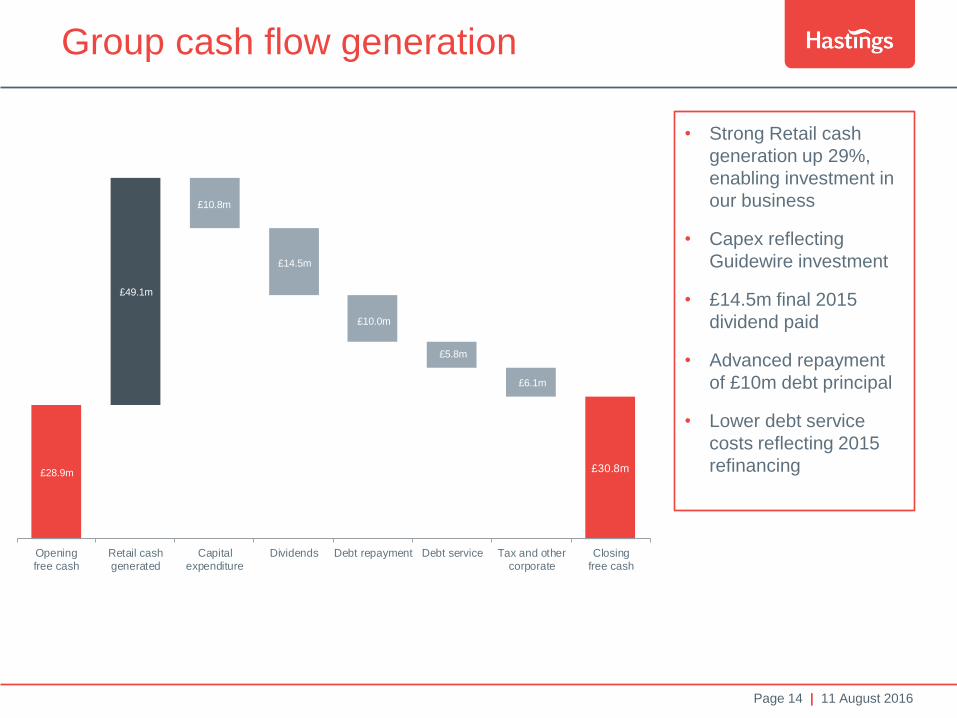
Group cash flow generation
• Strong Retail cash
generation up 29%,
enabling investment in
our business
• Capex reflecting
Guidewire investment
• £14.5m final 2015
dividend paid
• Advanced repayment
of £10m debt principal
• Lower debt service
costs reflecting 2015
refinancing
£28.9m £30.8m
£10.8m
£14.5m
£10.0m
£5.8m
£6.1m
£49.1m
Openingfree cash
Retail cashgenerated
Capitalexpenditure
Dividends Debt repayment Debt service Tax and othercorporate
Closingfree cash
Page 15 | 11 August 2016
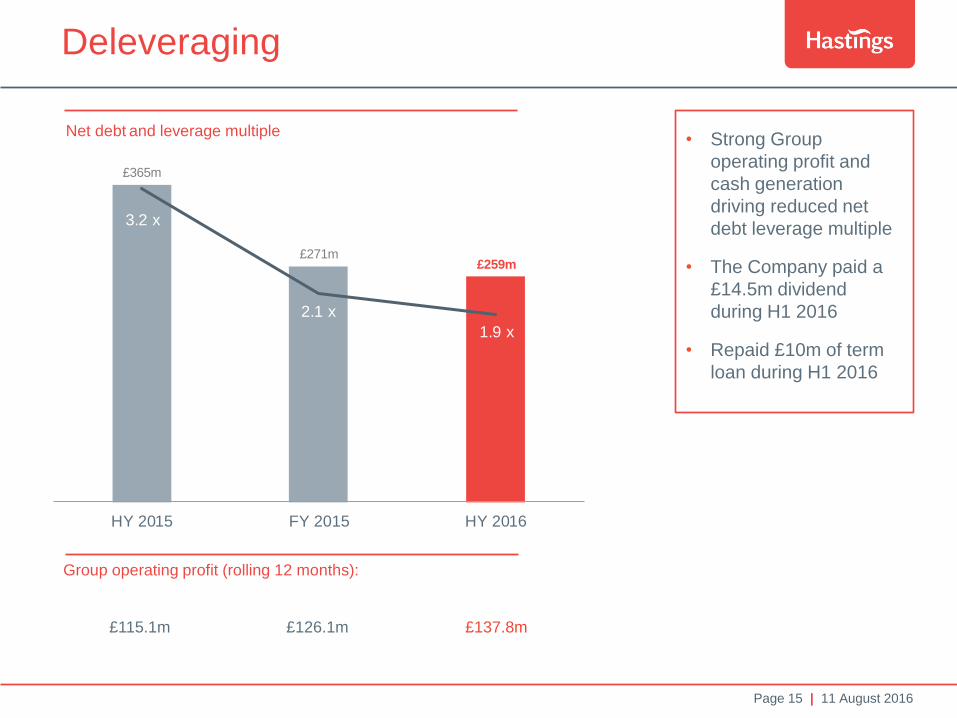
£365m
£271m£259m
3.2 x
2.1 x
1.9 x
0.0 x
0.5 x
1.0 x
1.5 x
2.0 x
2.5 x
3.0 x
3.5 x
0.0
50.0
100.0
150.0
200.0
250.0
300.0
350.0
400.0
HY 2015 FY 2015 HY 2016
Deleveraging
Net debt and leverage multiple
• Strong Group
operating profit and
cash generation
driving reduced net
debt leverage multiple
• The Company paid a
£14.5m dividend
during H1 2016
• Repaid £10m of term
loan during H1 2016
Group operating profit (rolling 12 months):
£115.1m £126.1m £137.8m
Page 16 | 11 August 2016
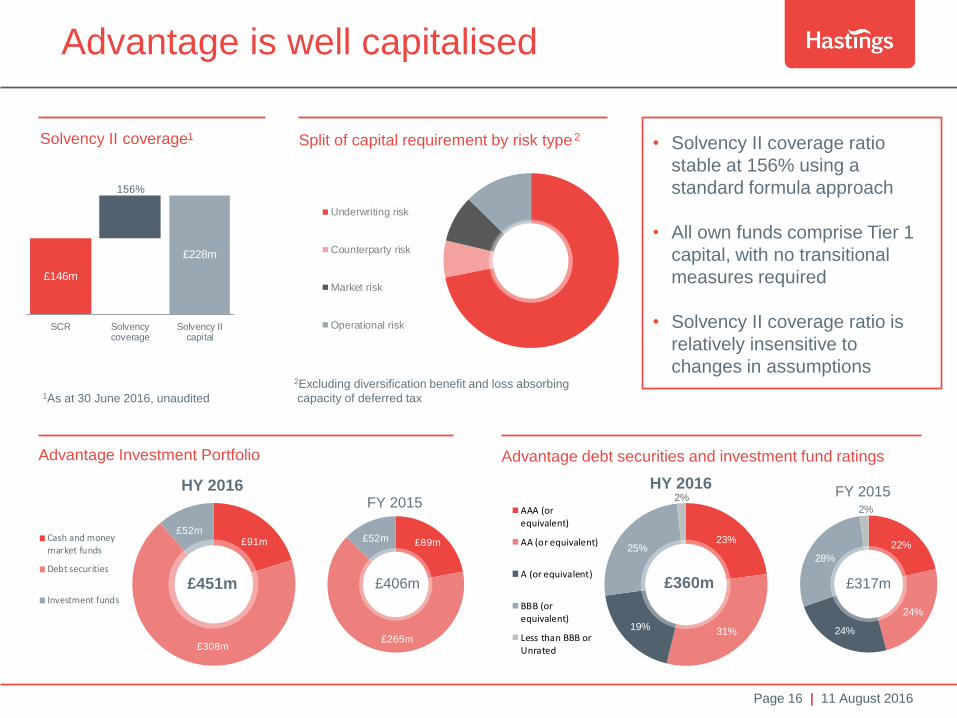
£89m
£265m
£52m£91m
£308m
£52mCash and moneymarket funds
Debt securities
Investment funds
22%
24%
24%
28%
2%
23%
31%19%
25%
2%
AAA (orequivalent)
AA (or equivalent)
A (or equivalent)
BBB (orequivalent)
Less than BBB orUnrated
£146m
156%
£228m
SCR Solvencycoverage
Solvency IIcapital
Underwriting risk
Counterparty risk
Market risk
Operational risk
Advantage is well capitalised
Solvency II coverage
1As at 30 June 2016, unaudited
1 Split of capital requirement by risk type 2
2Excluding diversification benefit and loss absorbing
capacity of deferred tax
Advantage Investment Portfolio Advantage debt securities and investment fund ratings
HY 2016
£406m £360m £317m £451m
FY 2015
HY 2016 FY 2015
• Solvency II coverage ratio
stable at 156% using a
standard formula approach
• All own funds comprise Tier 1
capital, with no transitional
measures required
• Solvency II coverage ratio is
relatively insensitive to
changes in assumptions
Page 17 | 11 August 2016
Gary Hoffman
Summary and outlook
Page 18 | 11 August 2016
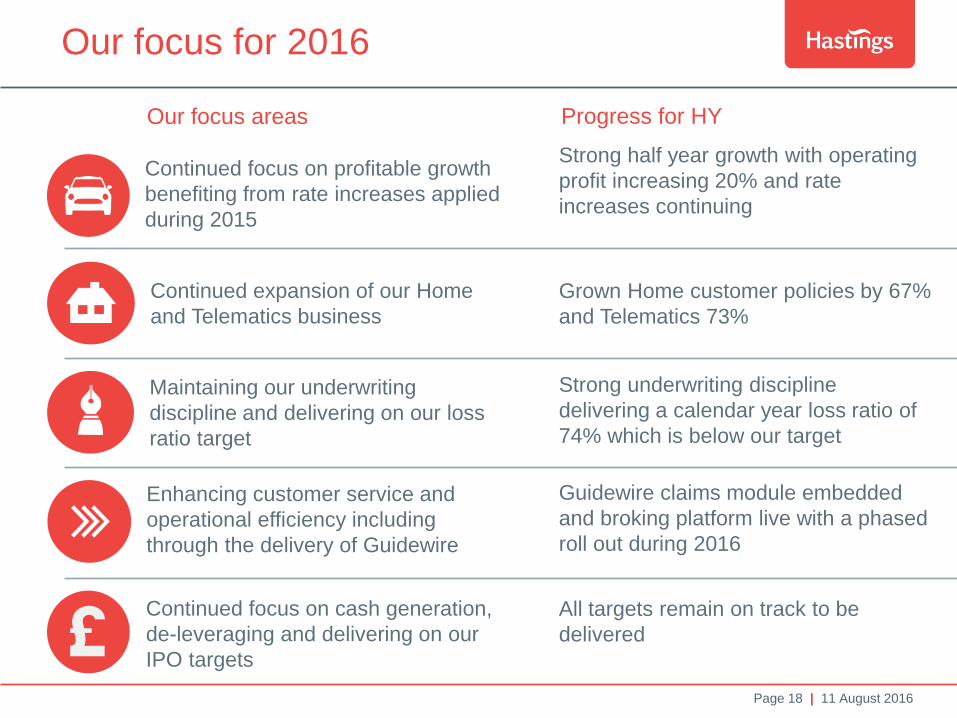
Our focus for 2016
Continued expansion of our Home
and Telematics business
Continued focus on profitable growth
benefiting from rate increases applied
during 2015
Enhancing customer service and
operational efficiency including
through the delivery of Guidewire
Maintaining our underwriting
discipline and delivering on our loss
ratio target
£ Continued focus on cash generation,
de-leveraging and delivering on our
IPO targets
Strong half year growth with operating
profit increasing 20% and rate
increases continuing
Grown Home customer policies by 67%
and Telematics 73%
Strong underwriting discipline
delivering a calendar year loss ratio of
74% which is below our target
Guidewire claims module embedded
and broking platform live with a phased
roll out during 2016
All targets remain on track to be
delivered
Our focus areas Progress for HY

Page 19 | 11 August 2016
Q&A
Page 20 | 11 August 2016
Appendix
Page 21 | 11 August 2016
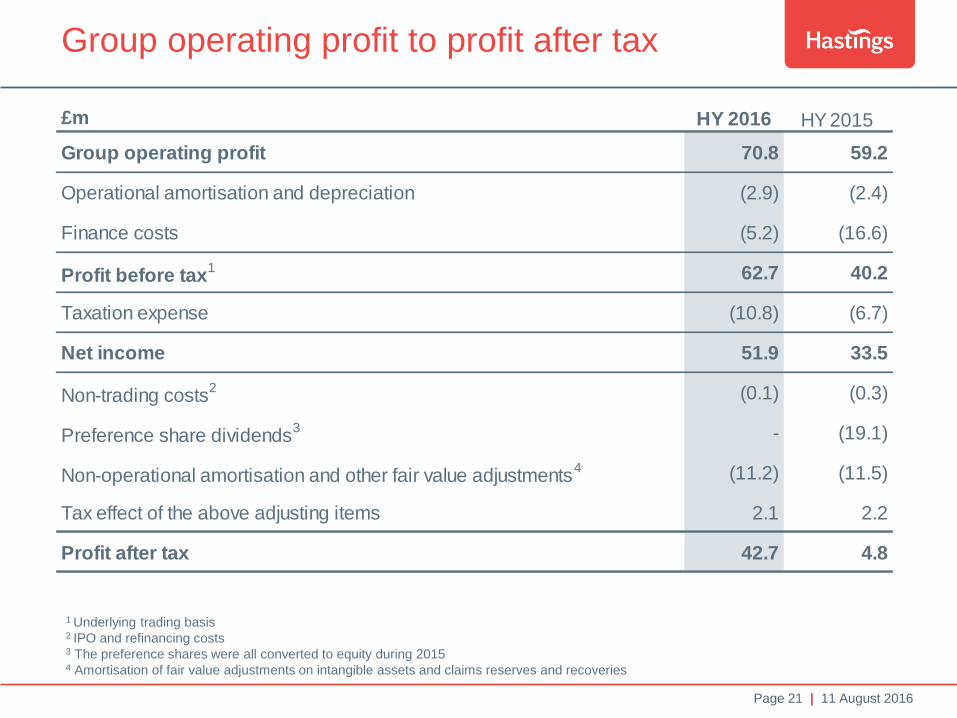
Group operating profit to profit after tax
1 Underlying trading basis
2 IPO and refinancing costs 3 The preference shares were all converted to equity during 2015 4 Amortisation of fair value adjustments on intangible assets and claims reserves and recoveries
£m HY 2016 HY 2015
Group operating profit 70.8 59.2
Operational amortisation and depreciation (2.9) (2.4)
Finance costs (5.2) (16.6)
Profit before tax1 62.7 40.2
Taxation expense (10.8) (6.7)
Net income 51.9 33.5
Non-trading costs2 (0.1) (0.3)
Preference share dividends3 - (19.1)
Non-operational amortisation and other fair value adjustments4 (11.2) (11.5)
Tax effect of the above adjusting items 2.1 2.2
Profit after tax 42.7 4.8
Page 22 | 11 August 2016
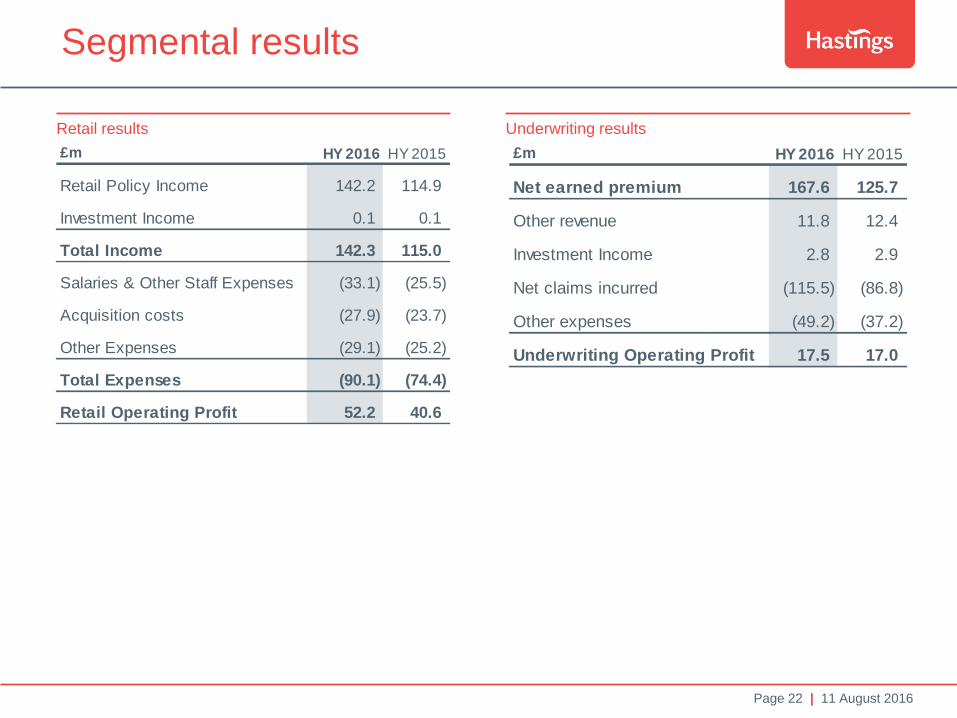
Segmental results
Underwriting results Retail results
£m HY 2016 HY 2015
Retail Policy Income 142.2 114.9
Investment Income 0.1 0.1
Total Income 142.3 115.0
Salaries & Other Staff Expenses (33.1) (25.5)
Acquisition costs (27.9) (23.7)
Other Expenses (29.1) (25.2)
Total Expenses (90.1) (74.4)
Retail Operating Profit 52.2 40.6
£m HY 2016 HY 2015
Net earned premium 167.6 125.7
Other revenue 11.8 12.4
Investment Income 2.8 2.9
Net claims incurred (115.5) (86.8)
Other expenses (49.2) (37.2)
Underwriting Operating Profit 17.5 17.0
Page 23 | 11 August 2016
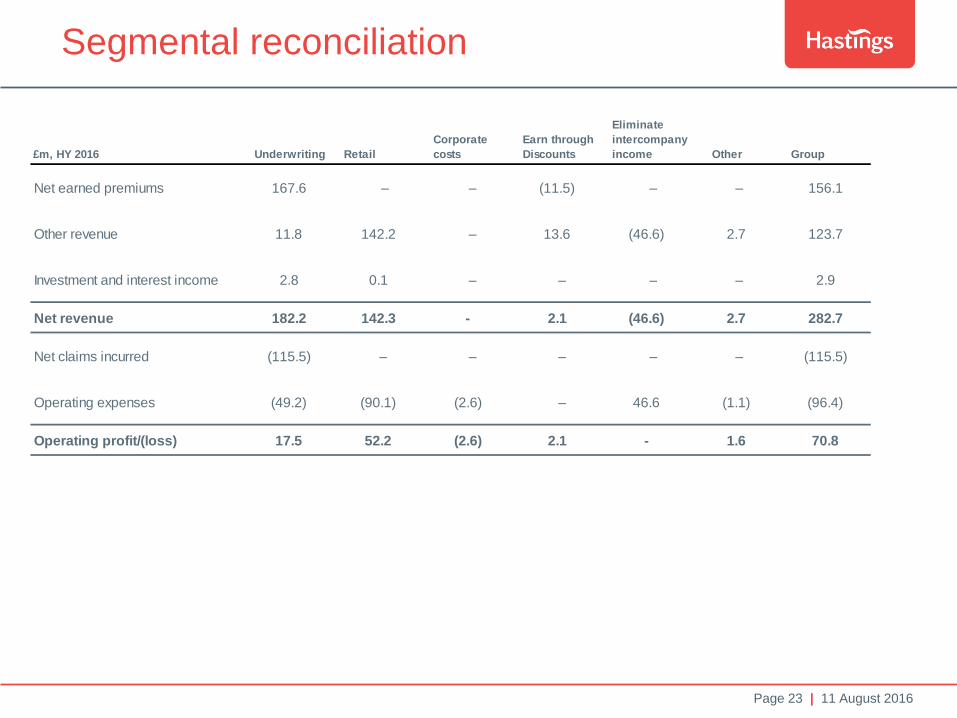
Segmental reconciliation
£m, HY 2016 Underwriting Retail
Corporate
costs
Earn through
Discounts
Eliminate
intercompany
income Other Group
Net earned premiums 167.6 – – (11.5) – – 156.1
Other revenue 11.8 142.2 – 13.6 (46.6) 2.7 123.7
Investment and interest income 2.8 0.1 – – – – 2.9
Net revenue 182.2 142.3 - 2.1 (46.6) 2.7 282.7
Net claims incurred (115.5) – – – – – (115.5)
Operating expenses (49.2) (90.1) (2.6) – 46.6 (1.1) (96.4)
Operating profit/(loss) 17.5 52.2 (2.6) 2.1 - 1.6 70.8
Page 24 | 11 August 2016
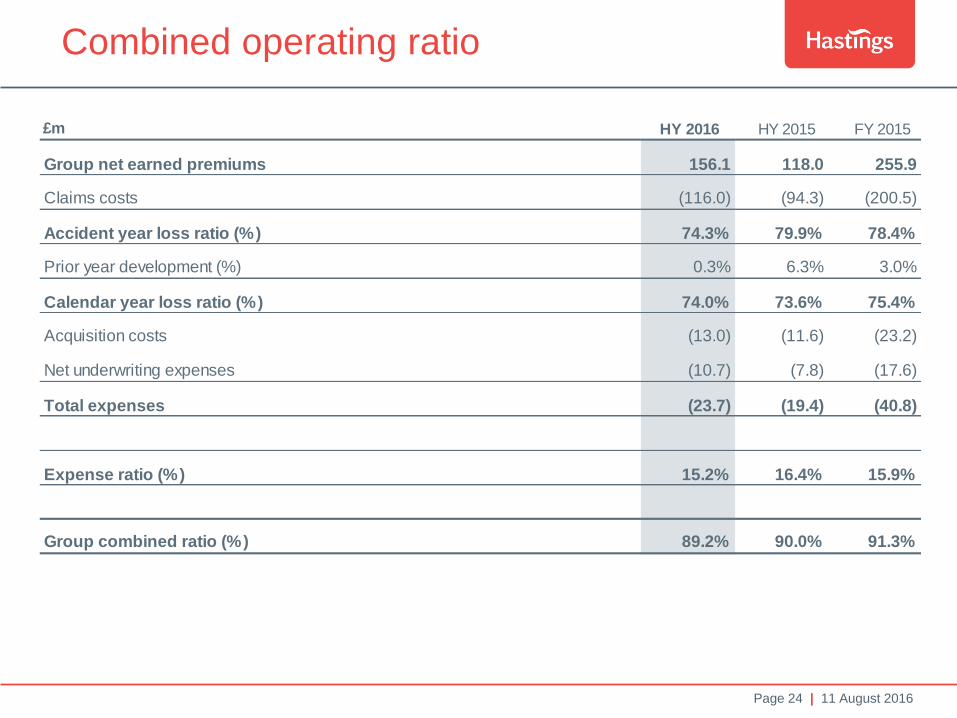
Combined operating ratio
£m HY 2016 HY 2015 FY 2015
Group net earned premiums 156.1 118.0 255.9
Claims costs (116.0) (94.3) (200.5)
Accident year loss ratio (%) 74.3% 79.9% 78.4%
Prior year development (%) 0.3% 6.3% 3.0%
Calendar year loss ratio (%) 74.0% 73.6% 75.4%
Acquisition costs (13.0) (11.6) (23.2)
Net underwriting expenses (10.7) (7.8) (17.6)
Total expenses (23.7) (19.4) (40.8)
Expense ratio (%) 15.2% 16.4% 15.9%
Group combined ratio (%) 89.2% 90.0% 91.3%
Page 25 | 11 August 2016
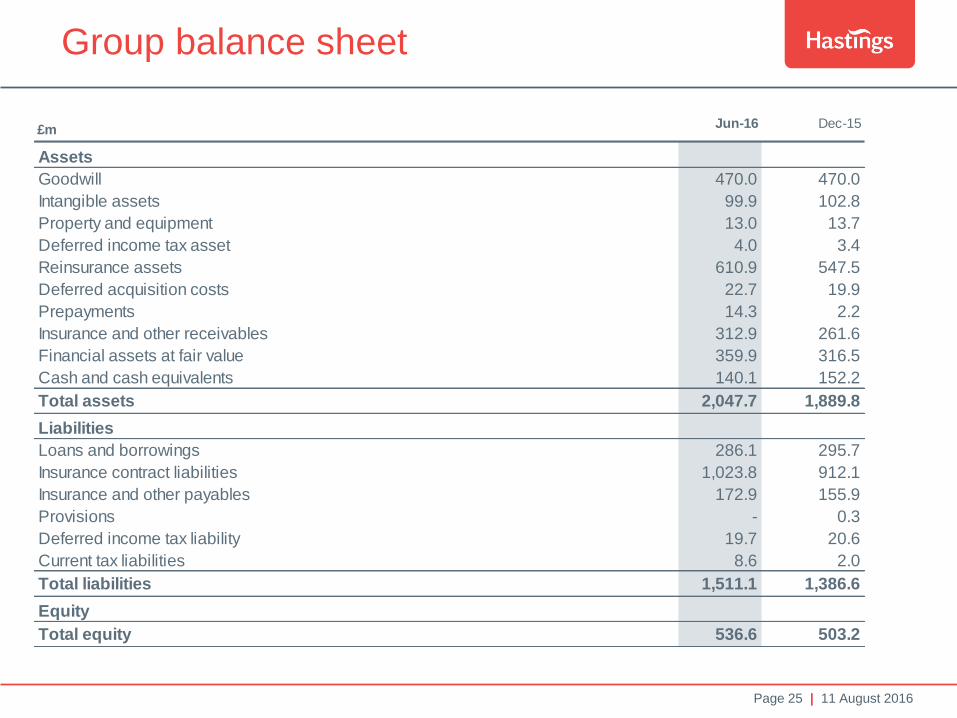
Group balance sheet
£m Jun-16 Dec-15
Assets
Goodwill 470.0 470.0
Intangible assets 99.9 102.8
Property and equipment 13.0 13.7
Deferred income tax asset 4.0 3.4
Reinsurance assets 610.9 547.5
Deferred acquisition costs 22.7 19.9
Prepayments 14.3 2.2
Insurance and other receivables 312.9 261.6
Financial assets at fair value 359.9 316.5
Cash and cash equivalents 140.1 152.2
Total assets 2,047.7 1,889.8
Liabilities
Loans and borrowings 286.1 295.7
Insurance contract liabilities 1,023.8 912.1
Insurance and other payables 172.9 155.9
Provisions - 0.3
Deferred income tax liability 19.7 20.6
Current tax liabilities 8.6 2.0
Total liabilities 1,511.1 1,386.6
Equity
Total equity 536.6 503.2
Page 26 | 11 August 2016
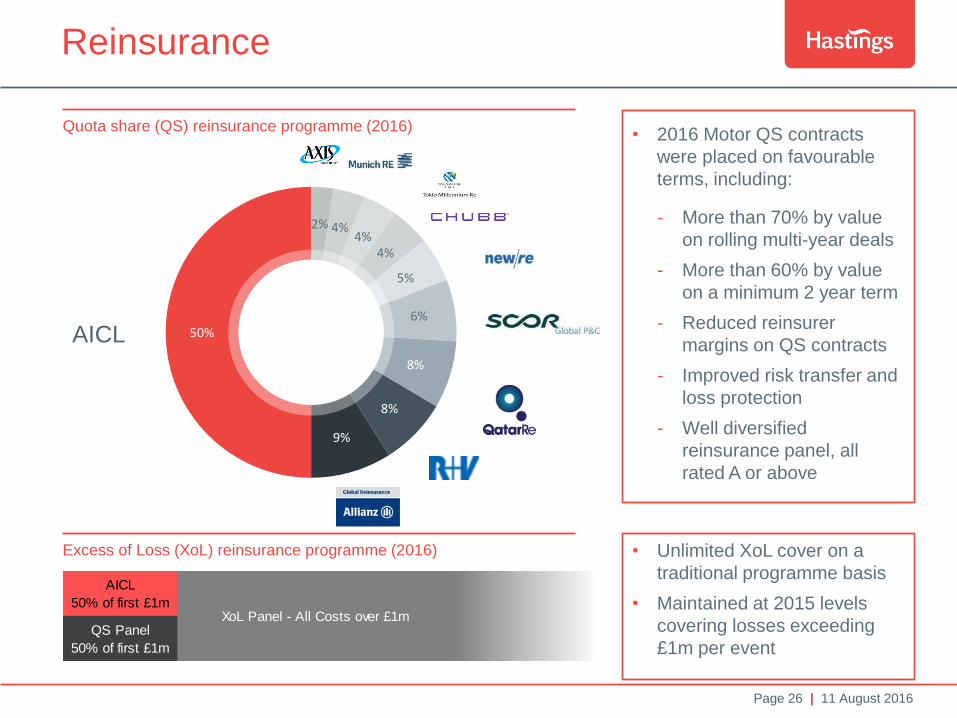
Reinsurance
Quota share (QS) reinsurance programme (2016)
AICL
2% 4% 4%
4%
5%
6%
8%
8%
9%
50%
AICL
50% of first £1m
QS Panel
50% of first £1m
XoL Panel - All Costs over £1m
• 2016 Motor QS contracts
were placed on favourable
terms, including:
- More than 70% by value
on rolling multi-year deals
- More than 60% by value
on a minimum 2 year term
- Reduced reinsurer
margins on QS contracts
- Improved risk transfer and
loss protection
- Well diversified
reinsurance panel, all
rated A or above
Excess of Loss (XoL) reinsurance programme (2016) • Unlimited XoL cover on a
traditional programme basis
• Maintained at 2015 levels
covering losses exceeding
£1m per event
Page 27 | 11 August 2016
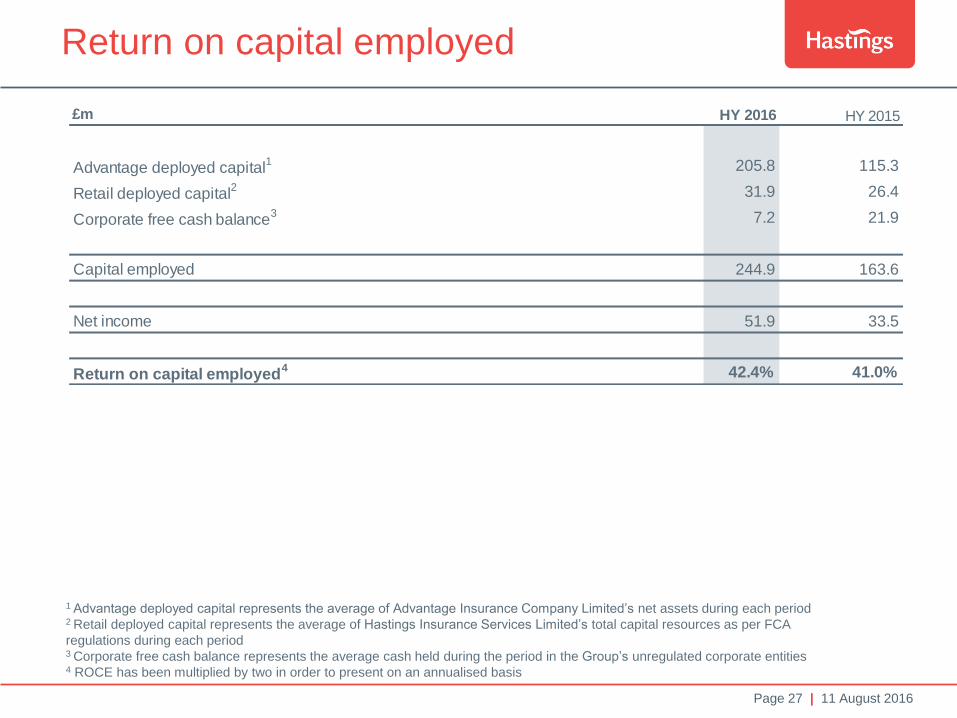
Return on capital employed
1 Advantage deployed capital represents the average of Advantage Insurance Company Limited’s net assets during each period 2 Retail deployed capital represents the average of Hastings Insurance Services Limited’s total capital resources as per FCA
regulations during each period 3 Corporate free cash balance represents the average cash held during the period in the Group’s unregulated corporate entities 4 ROCE has been multiplied by two in order to present on an annualised basis
£m HY 2016 HY 2015
Advantage deployed capital1 205.8 115.3
Retail deployed capital2 31.9 26.4
Corporate free cash balance3 7.2 21.9
Capital employed 244.9 163.6
Net income 51.9 33.5
Return on capital employed4 42.4% 41.0%
Page 28 | 11 August 2016
Disclaimer
This document, which has been issued by Hastings Group Holdings plc (“the Company”), has not been independently
verified and no representation or warranty, express or implied, is made by or on behalf of the Company or any of its
subsidiary undertakings and any of such person’s directors, officers, employees, agents, affiliates or advisers as to, and
no reliance should be placed on, the fairness, accuracy, completeness or correctness of the information or opinions
contained herein. None of the Company, its subsidiary undertakings, any of such person’s directors, officers,
employees, agents, affiliates, advisers or representatives shall have any liability whatsoever (in negligence or
otherwise) for any loss howsoever arising from any use of this document or its contents or otherwise arising in
connection with this document.
Unless otherwise stated, all financial statements contained herein are stated in accordance with generally accepted
accounting principles in the UK at the date hereof. This document includes IFRS and non-IFRS financial measures.
These supplemental financial measures should not be viewed in isolation or as alternatives to measures of the
Company’s net assets and financial position or results of operations as presented in accordance with IFRS in its
Consolidated Financial Statements. Other companies that report or describe similarly titled financial measures may
calculate them differently.
The forward-looking statements contained herein appear in a number of places and include, but are not limited to,
statements regarding the Company’s intentions, beliefs or current expectations concerning, amongst other things,
results of operations, financial condition, liquidity, prospects, growth and strategies. By their nature, forward-looking
statements involve risks and uncertainties because they relate to events or circumstances that may or may not occur in
the future. These statements have been prepared on the basis of a number of assumptions which may prove to be
incorrect, and accordingly, actual results may vary. The forward-looking statements only reflect the information available
as at the date of preparation of this document and, unless required by applicable law, the Company undertakes no
obligation to update or revise this information. Nothing in this document should be construed as a profit forecast. The
information, statements and opinions contained in this document do not constitute a public offer under any applicable
legislation or an offer to sell or solicitation of an offer to buy any securities or financial instruments or any advice or
recommendation with respect to such securities or other financial instruments in the United States, Canada, Japan or
any other jurisdiction. Past performance of the Company cannot be relied on as a guide to future performance.
The financial information set out in this document does not constitute the Company's statutory accounts in accordance
with section 423 Companies Act 2006 for the period ended 30 June 2016.