Embed Size (px)
Citation preview

Contents At a glance .................................................... 5
Executive summary ...................................... 6
Net interest income .................................... 12
Asset quality ............................................... 16
Non-interest income ................................... 18
Capital......................................................... 21
Costs .......................................................... 23
Return on equity ......................................... 26
4 | Major Australian Banks: Half Year 2017 Results Analysis
© 2017 KPMG, an Australian partnership and a member firm of the KPMG network of independent member firms affiliated with KPMG International Cooperative (“KPMG International”), a Swiss entity. All rights reserved. The KPMG name and logo and are registered trademarks or trademarks of KPMG International.
Liability limited by a scheme approved under Professional Standards Legislation.
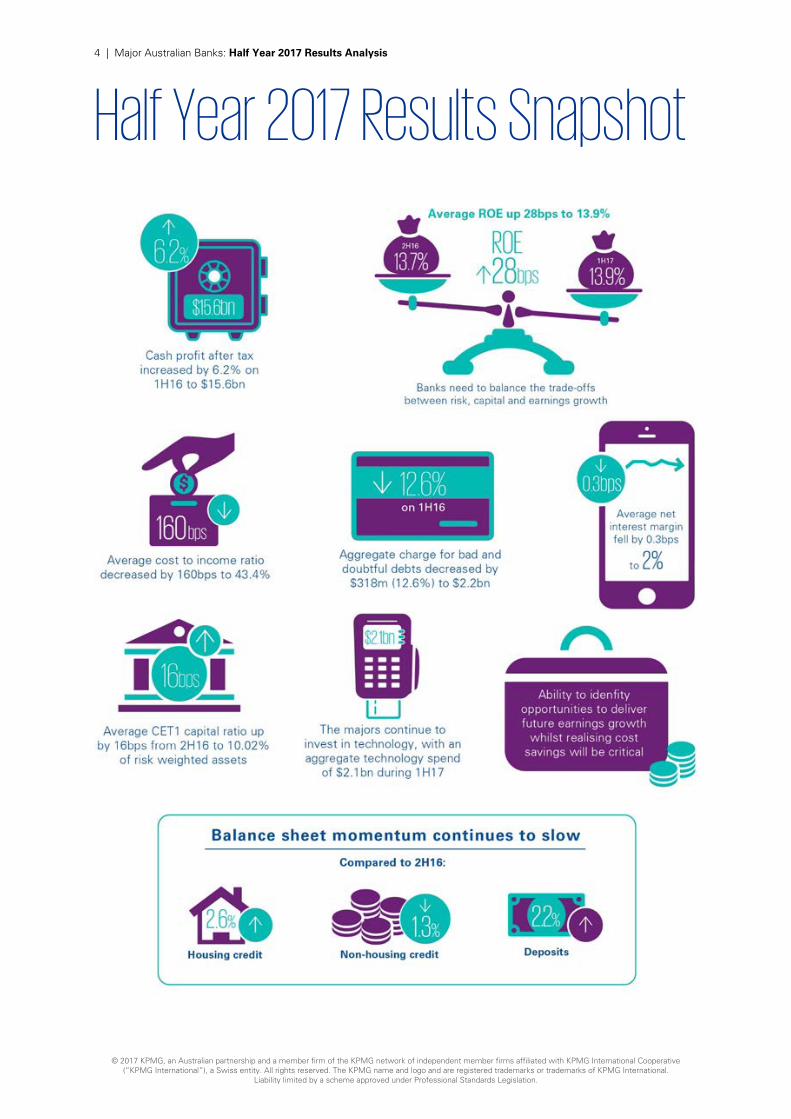
Half Year 2017 Results Snapshot
5 | Major Australian Banks: Half Year 2017 Results Analysis
© 2017 KPMG, an Australian partnership and a member firm of the KPMG network of independent member firms affiliated with KPMG International Cooperative (“KPMG International”), a Swiss entity. All rights reserved. The KPMG name and logo and are registered trademarks or trademarks of KPMG International.
Liability limited by a scheme approved under Professional Standards Legislation.
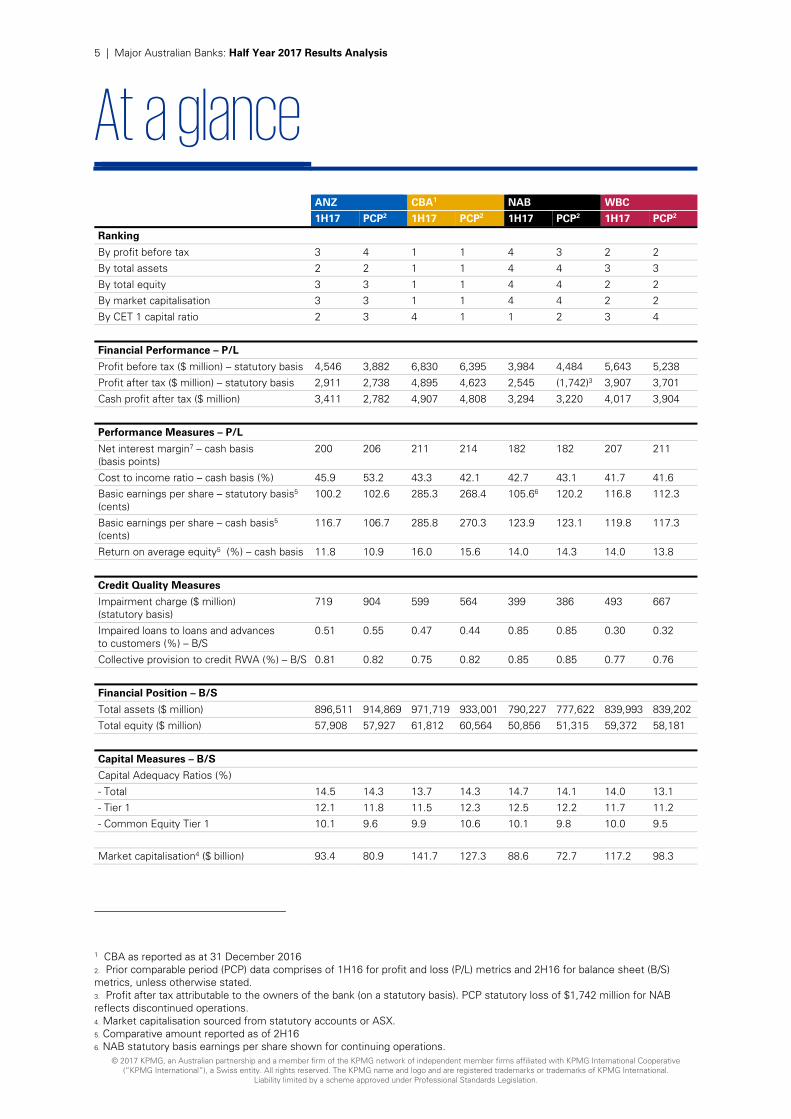
At a glance
ANZ CBA1 NAB WBC
1H17 PCP2 1H17 PCP2 1H17 PCP2 1H17 PCP2
Ranking
By profit before tax 3 4 1 1 4 3 2 2
By total assets 2 2 1 1 4 4 3 3
By total equity 3 3 1 1 4 4 2 2
By market capitalisation 3 3 1 1 4 4 2 2
By CET 1 capital ratio 2 3 4 1 1 2 3 4
Financial Performance – P/L
Profit before tax ($ million) – statutory basis 4,546 3,882 6,830 6,395 3,984 4,484 5,643 5,238
Profit after tax ($ million) – statutory basis 2,911 2,738 4,895 4,623 2,545 (1,742)3 3,907 3,701
Cash profit after tax ($ million) 3,411 2,782 4,907 4,808 3,294 3,220 4,017 3,904
Performance Measures – P/L
Net interest margin7 – cash basis (basis points)
200 206 211 214 182 182 207 211
Cost to income ratio – cash basis (%) 45.9 53.2 43.3 42.1 42.7 43.1 41.7 41.6
Basic earnings per share – statutory basis5 (cents)
100.2 102.6 285.3 268.4 105.66 120.2 116.8 112.3
Basic earnings per share – cash basis5 (cents)
116.7 106.7 285.8 270.3 123.9 123.1 119.8 117.3
Return on average equity5 (%) – cash basis 11.8 10.9 16.0 15.6 14.0 14.3 14.0 13.8
Credit Quality Measures
Impairment charge ($ million) (statutory basis)
719 904 599 564 399 386 493 667
Impaired loans to loans and advances to customers (%) – B/S
0.51 0.55 0.47 0.44 0.85 0.85 0.30 0.32
Collective provision to credit RWA (%) – B/S 0.81 0.82 0.75 0.82 0.85 0.85 0.77 0.76
Financial Position – B/S
Total assets ($ million) 896,511 914,869 971,719 933,001 790,227 777,622 839,993 839,202
Total equity ($ million) 57,908 57,927 61,812 60,564 50,856 51,315 59,372 58,181
Capital Measures – B/S
Capital Adequacy Ratios (%)
- Total 14.5 14.3 13.7 14.3 14.7 14.1 14.0 13.1
- Tier 1 12.1 11.8 11.5 12.3 12.5 12.2 11.7 11.2
- Common Equity Tier 1 10.1 9.6 9.9 10.6 10.1 9.8 10.0 9.5
Market capitalisation4 ($ billion) 93.4 80.9 141.7 127.3 88.6 72.7 117.2 98.3
1 CBA as reported as at 31 December 2016 2. Prior comparable period (PCP) data comprises of 1H16 for profit and loss (P/L) metrics and 2H16 for balance sheet (B/S) metrics, unless otherwise stated. 3. Profit after tax attributable to the owners of the bank (on a statutory basis). PCP statutory loss of $1,742 million for NAB reflects discontinued operations. 4. Market capitalisation sourced from statutory accounts or ASX. 5. Comparative amount reported as of 2H16 6. NAB statutory basis earnings per share shown for continuing operations.
6 | Major Australian Banks: Half Year 2017 Results Analysis
© 2017 KPMG, an Australian partnership and a member firm of the KPMG network of independent member firms affiliated with KPMG International Cooperative (“KPMG International”), a Swiss entity. All rights reserved. The KPMG name and logo and are registered trademarks or trademarks of KPMG International.
Liability limited by a scheme approved under Professional Standards Legislation.
Executive summary
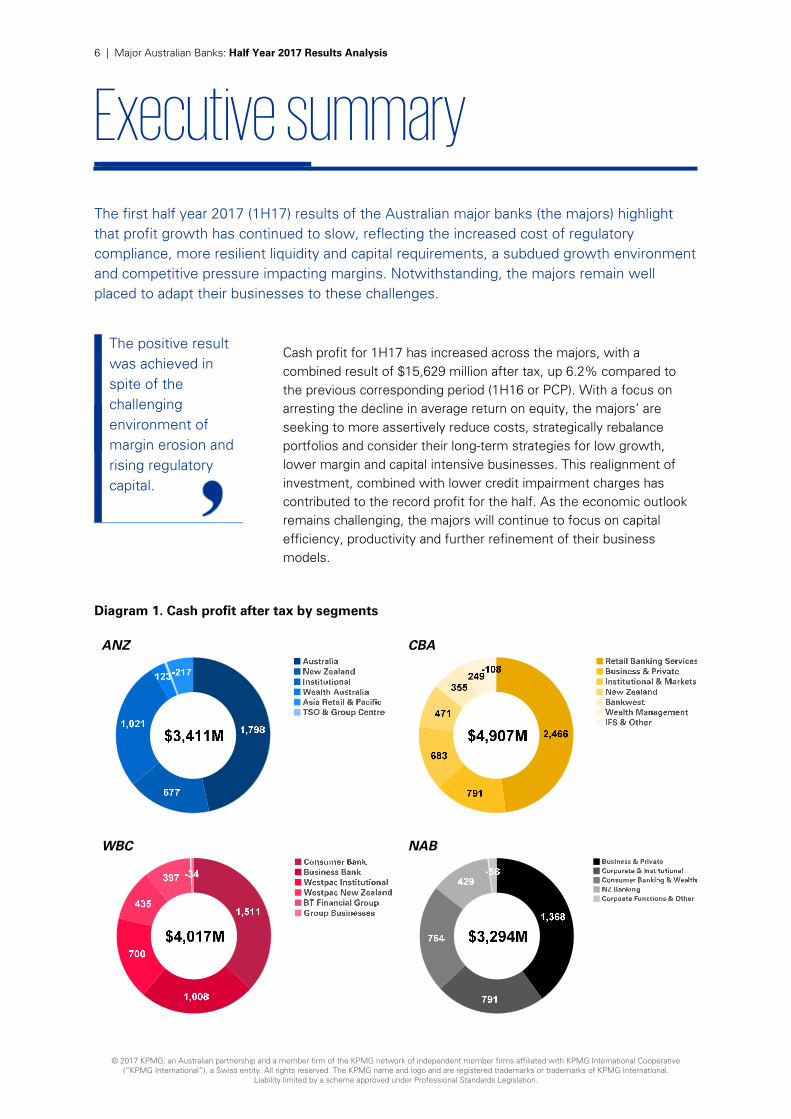
The first half year 2017 (1H17) results of the Australian major banks (the majors) highlight that profit growth has continued to slow, reflecting the increased cost of regulatory compliance, more resilient liquidity and capital requirements, a subdued growth environment and competitive pressure impacting margins. Notwithstanding, the majors remain well placed to adapt their businesses to these challenges.
Cash profit for 1H17 has increased across the majors, with a combined result of $15,629 million after tax, up 6.2% compared to the previous corresponding period (1H16 or PCP). With a focus on arresting the decline in average return on equity, the majors’ are seeking to more assertively reduce costs, strategically rebalance portfolios and consider their long-term strategies for low growth, lower margin and capital intensive businesses. This realignment of investment, combined with lower credit impairment charges has contributed to the record profit for the half. As the economic outlook remains challenging, the majors will continue to focus on capital efficiency, productivity and further refinement of their business models.
Diagram 1. Cash profit after tax by segments
ANZ
CBA
WBC NAB
The positive result was achieved in spite of the challenging environment of margin erosion and rising regulatory capital.
7 | Major Australian Banks: Half Year 2017 Results Analysis
© 2017 KPMG, an Australian partnership and a member firm of the KPMG network of independent member firms affiliated with KPMG International Cooperative (“KPMG International”), a Swiss entity. All rights reserved. The KPMG name and logo and are registered trademarks or trademarks of KPMG International.
Liability limited by a scheme approved under Professional Standards Legislation.
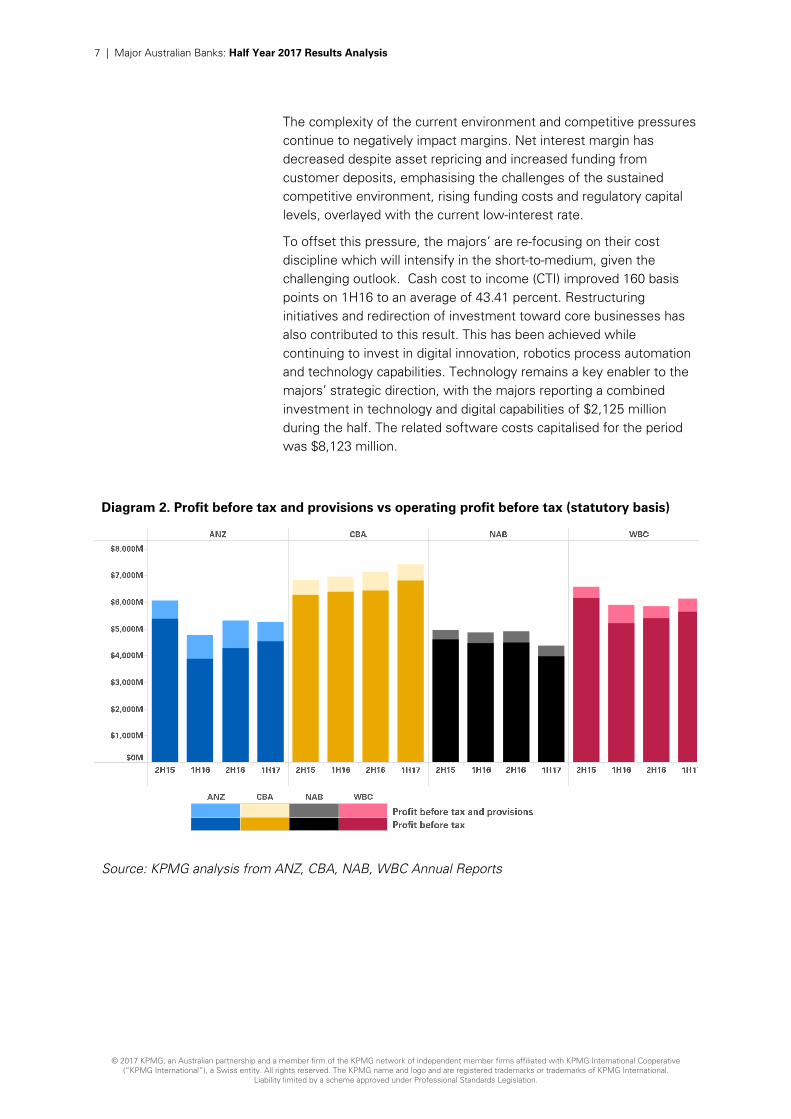
The complexity of the current environment and competitive pressures continue to negatively impact margins. Net interest margin has decreased despite asset repricing and increased funding from customer deposits, emphasising the challenges of the sustained competitive environment, rising funding costs and regulatory capital levels, overlayed with the current low-interest rate.
To offset this pressure, the majors’ are re-focusing on their cost discipline which will intensify in the short-to-medium, given the challenging outlook. Cash cost to income (CTI) improved 160 basis points on 1H16 to an average of 43.41 percent. Restructuring initiatives and redirection of investment toward core businesses has also contributed to this result. This has been achieved while continuing to invest in digital innovation, robotics process automation and technology capabilities. Technology remains a key enabler to the majors’ strategic direction, with the majors reporting a combined investment in technology and digital capabilities of $2,125 million during the half. The related software costs capitalised for the period was $8,123 million.
Diagram 2. Profit before tax and provisions vs operating profit before tax (statutory basis)
Source: KPMG analysis from ANZ, CBA, NAB, WBC Annual Reports
8 | Major Australian Banks: Half Year 2017 Results Analysis
© 2017 KPMG, an Australian partnership and a member firm of the KPMG network of independent member firms affiliated with KPMG International Cooperative (“KPMG International”), a Swiss entity. All rights reserved. The KPMG name and logo and are registered trademarks or trademarks of KPMG International.
Liability limited by a scheme approved under Professional Standards Legislation.
Key features of the combined result for HY17 include:
• Average Return on Equity (ROE) across the majors on a cash basis improved by 28 basis points on 2H16 to 13.94 percent, a good performance given ongoing pressure on capital;
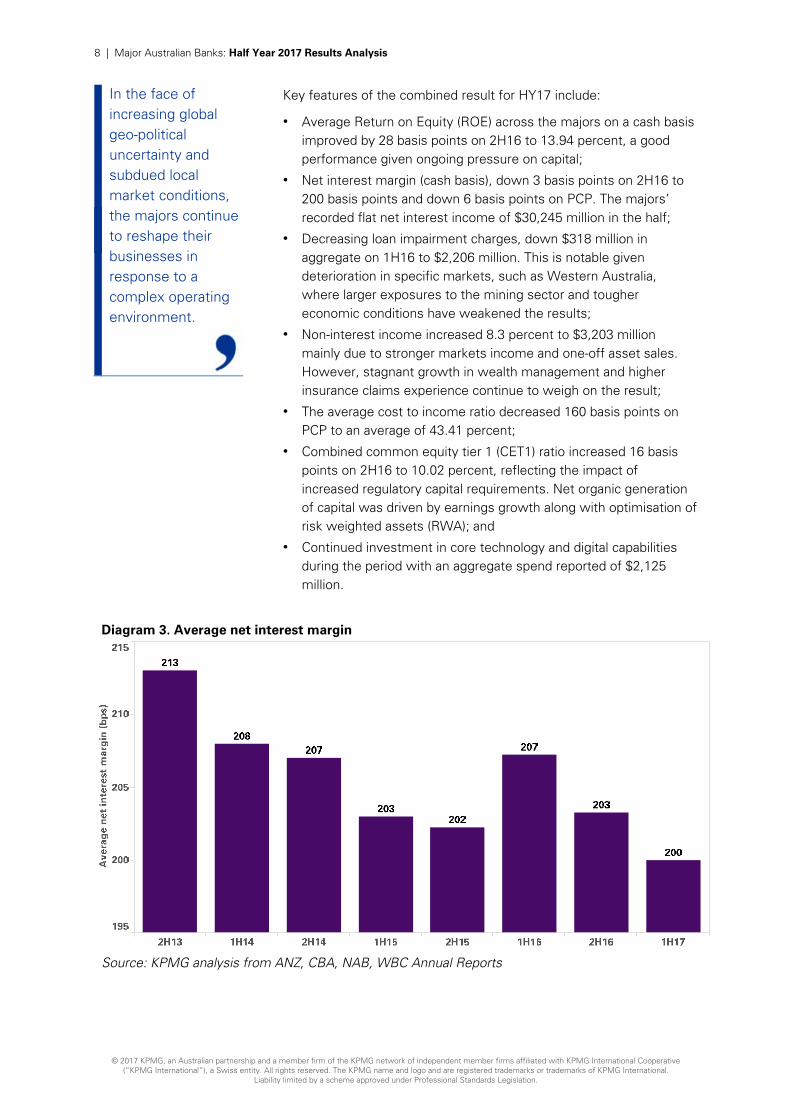
• Net interest margin (cash basis), down 3 basis points on 2H16 to 200 basis points and down 6 basis points on PCP. The majors’ recorded flat net interest income of $30,245 million in the half;
• Decreasing loan impairment charges, down $318 million in aggregate on 1H16 to $2,206 million. This is notable given deterioration in specific markets, such as Western Australia, where larger exposures to the mining sector and tougher economic conditions have weakened the results;
• Non-interest income increased 8.3 percent to $3,203 million mainly due to stronger markets income and one-off asset sales. However, stagnant growth in wealth management and higher insurance claims experience continue to weigh on the result;
• The average cost to income ratio decreased 160 basis points on PCP to an average of 43.41 percent;
• Combined common equity tier 1 (CET1) ratio increased 16 basis points on 2H16 to 10.02 percent, reflecting the impact of increased regulatory capital requirements. Net organic generation of capital was driven by earnings growth along with optimisation of risk weighted assets (RWA); and
• Continued investment in core technology and digital capabilities during the period with an aggregate spend reported of $2,125 million.
Diagram 3. Average net interest margin
Source: KPMG analysis from ANZ, CBA, NAB, WBC Annual Reports
In the face of increasing global geo-political uncertainty and subdued local market conditions, the majors continue to reshape their businesses in response to a complex operating environment.
9 | Major Australian Banks: Half Year 2017 Results Analysis
© 2017 KPMG, an Australian partnership and a member firm of the KPMG network of independent member firms affiliated with KPMG International Cooperative (“KPMG International”), a Swiss entity. All rights reserved. The KPMG name and logo and are registered trademarks or trademarks of KPMG International.
Liability limited by a scheme approved under Professional Standards Legislation.
Outlook
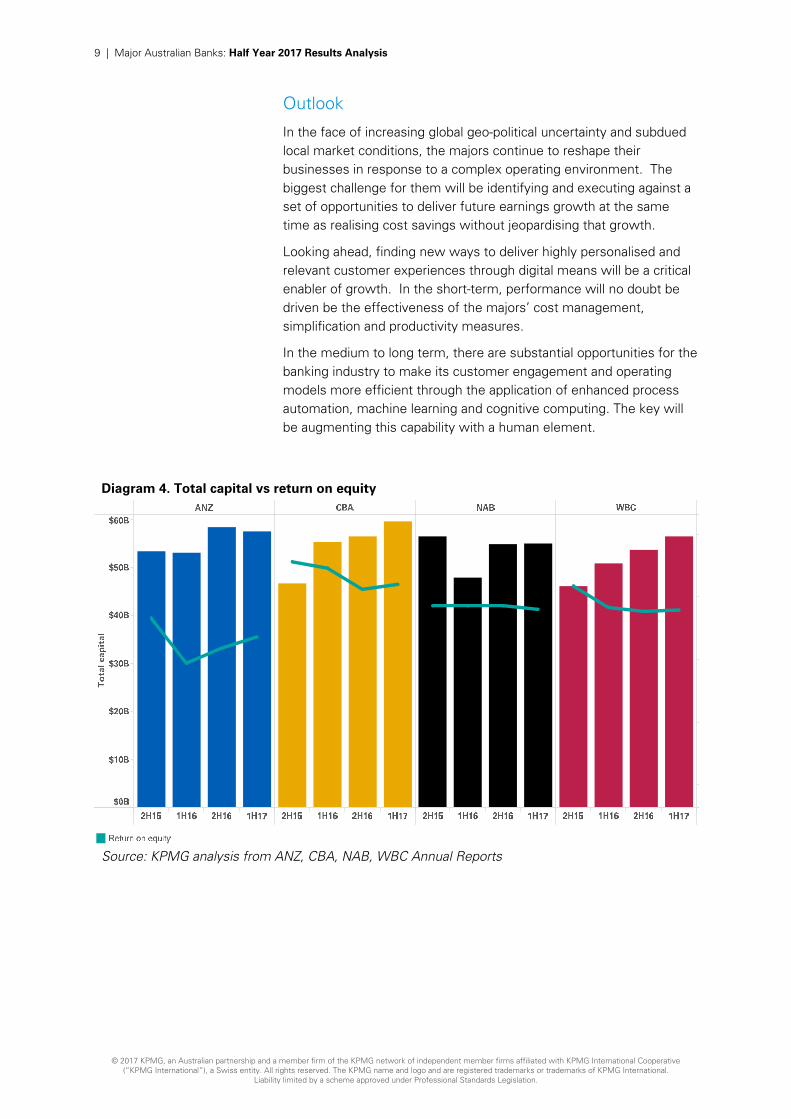
In the face of increasing global geo-political uncertainty and subdued local market conditions, the majors continue to reshape their businesses in response to a complex operating environment. The biggest challenge for them will be identifying and executing against a set of opportunities to deliver future earnings growth at the same time as realising cost savings without jeopardising that growth.
Looking ahead, finding new ways to deliver highly personalised and relevant customer experiences through digital means will be a critical enabler of growth. In the short-term, performance will no doubt be driven be the effectiveness of the majors’ cost management, simplification and productivity measures.
In the medium to long term, there are substantial opportunities for the banking industry to make its customer engagement and operating models more efficient through the application of enhanced process automation, machine learning and cognitive computing. The key will be augmenting this capability with a human element.
Diagram 4. Total capital vs return on equity
Source: KPMG analysis from ANZ, CBA, NAB, WBC Annual Reports
© 2017 KPMG, an Australian partnership and a member firm of the KPMG network of independent member firms affiliated with KPMG International Cooperative (“KPMG International”), a Swiss entity. All rights reserved. The KPMG name and logo and are registered trademarks or trademarks of KPMG International.
Liability limited by a scheme approved under Professional Standards Legislation.
Sustainable cost productivity demands a strategic lens Michael Rowland, Partner, Management Consulting, Financial Services
The major banks’ first half 2017 results reflect the new normal for Australian banking at the moment – slowing earnings growth; hoping that recent re-pricing, particularly of home loan portfolios, flows through to preserving margins and ROE, which have been under constant downward pressure in recent years.
As has become a hallmark of the industry, each of the major banks has demonstrated sound credit quality, cost discipline and an improving capital position. Looking ahead, stronger earnings growth will be critical to support improved industry returns.
In the current environment this means doing much more on cost productivity. The challenge is that most of the easy wins have been achieved. Our experience is that successful, sustainable cost productivity must be delivered as a result of strategic change – not as an end in itself.
Globally, KPMG observes that institutions winning in achieving sustainable cost reduction display the following common attributes:
• Transforming the organisation end to end along customer outcomes and journeys - creating truly compelling customer experiences across all channels and segments – rather than simply digitising legacy processes and services
• Simplifying the enterprise from the inside – out resulting in materially fewer products, policies, systems, and hierarchies (spans and layers become irrelevant) and thinning out the corporate centre
• Being truly omni-channel in response to customer and segment demands resulting in a seamless sales and servicing environment and a levelling of investment across physical and virtual footprints
© 2017 KPMG, an Australian partnership and a member firm of the KPMG network of independent member firms affiliated with KPMG International Cooperative (“KPMG International”), a Swiss entity. All rights reserved. The KPMG name and logo and are registered trademarks or trademarks of KPMG International.
Liability limited by a scheme approved under Professional Standards Legislation.
• Driving sales force effectiveness making it easy for customers to choose how they access products and services (and more than physical relationship management in commercial and wholesale banking)
• Radically reducing the cost of change through organisation flattening, prioritisation and embedding agile methodologies in and across all teams
These levers need to be supported by program attributes that support the delivery of a structural shift in an organisation’s cost base:
• Performance must be measured by outcome delivery, not process through measurable targets locked into personal scorecards supported by a robust benefits tracking mechanism
• Investment must be prioritised to drive delivery of strategic outcomes
• Operational businesses, not the corporate centre or support functions must be accountable for benefit delivery
• An agile approach to change together with rapid feedback loops is required
• A focus on tangible outcomes from investment in basic robotics automation in the short term and in parallel, exploring means to leverage structured and unstructured data to identify and explore use cases for the application of machine learning and artificial intelligence, to deliver a step-change in efficiency gains.
Australian banks have historically seen cost success as delivering in the range of $100m - $300m in cost savings per annum. In the future, success will be achieved by those banks that can transform the customer experience across channels and segments, and at the same time deliver sustainable, material cost savings of up to $400 million per annum as part of their ordinary operating rhythm.
12 | Major Australian Banks: Half Year 2017 Results Analysis
© 2017 KPMG, an Australian partnership and a member firm of the KPMG network of independent member firms affiliated with KPMG International Cooperative (“KPMG International”), a Swiss entity. All rights reserved. The KPMG name and logo and are registered trademarks or trademarks of KPMG International.
Liability limited by a scheme approved under Professional Standards Legislation.
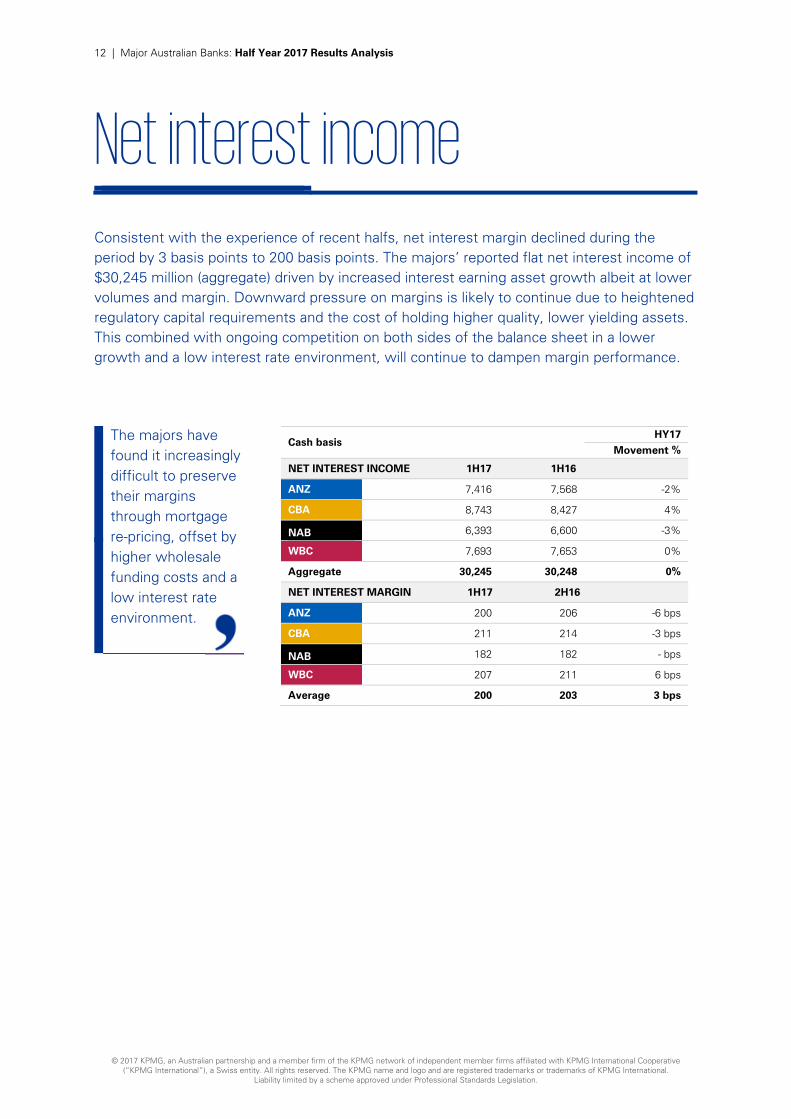
Net interest income
Consistent with the experience of recent halfs, net interest margin declined during the period by 3 basis points to 200 basis points. The majors’ reported flat net interest income of $30,245 million (aggregate) driven by increased interest earning asset growth albeit at lower volumes and margin. Downward pressure on margins is likely to continue due to heightened regulatory capital requirements and the cost of holding higher quality, lower yielding assets. This combined with ongoing competition on both sides of the balance sheet in a lower growth and a low interest rate environment, will continue to dampen margin performance.
The majors have found it increasingly difficult to preserve their margins through mortgage re-pricing, offset by higher wholesale funding costs and a low interest rate environment.
Cash basis HY17
Movement %
NET INTEREST INCOME 1H17 1H16
ANZ 7,416 7,568 -2%
CBA 8,743 8,427 4%
NAB 6,393 6,600 -3%
WBC 7,693 7,653 0%
Aggregate 30,245 30,248 0%
NET INTEREST MARGIN 1H17 2H16
ANZ 200 206 -6 bps
CBA 211 214 -3 bps
NAB 182 182 - bps
WBC 207 211 6 bps
Average 200 203 3 bps
13 | Major Australian Banks: Half Year 2017 Results Analysis
© 2017 KPMG, an Australian partnership and a member firm of the KPMG network of independent member firms affiliated with KPMG International Cooperative (“KPMG International”), a Swiss entity. All rights reserved. The KPMG name and logo and are registered trademarks or trademarks of KPMG International.
Liability limited by a scheme approved under Professional Standards Legislation.
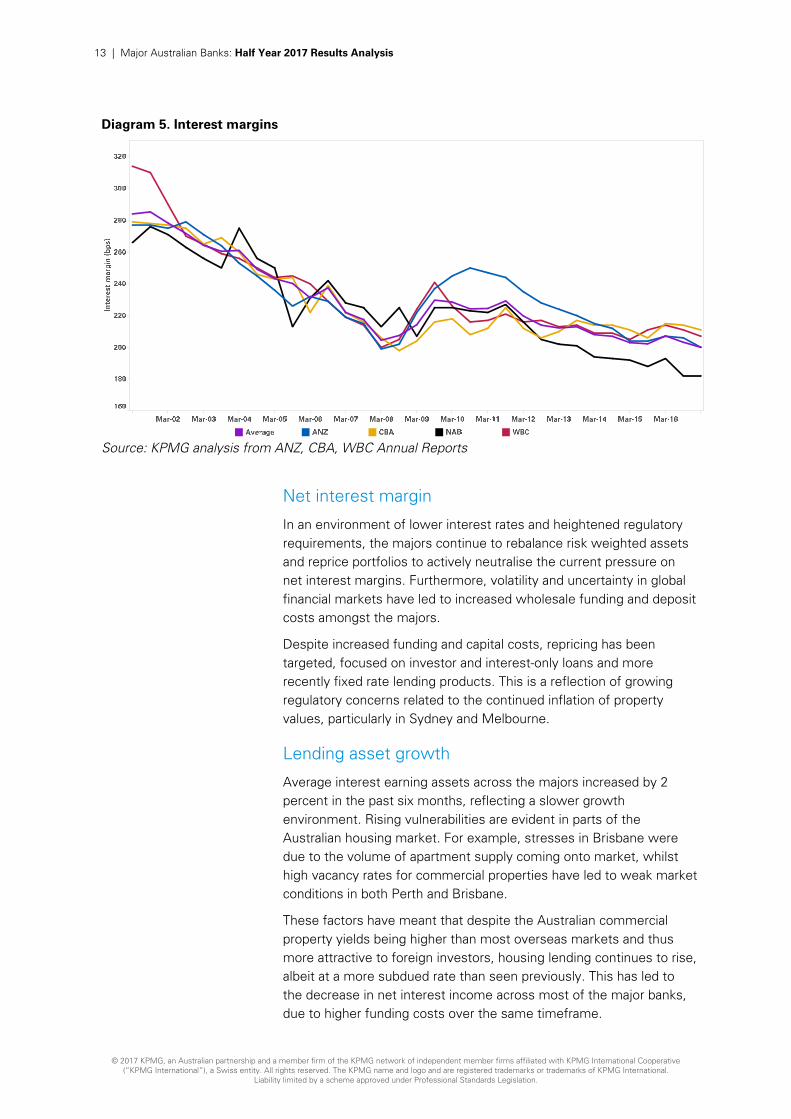
Diagram 5. Interest margins
Source: KPMG analysis from ANZ, CBA, WBC Annual Reports
Net interest margin
In an environment of lower interest rates and heightened regulatory requirements, the majors continue to rebalance risk weighted assets and reprice portfolios to actively neutralise the current pressure on net interest margins. Furthermore, volatility and uncertainty in global financial markets have led to increased wholesale funding and deposit costs amongst the majors.
Despite increased funding and capital costs, repricing has been targeted, focused on investor and interest-only loans and more recently fixed rate lending products. This is a reflection of growing regulatory concerns related to the continued inflation of property values, particularly in Sydney and Melbourne.
Lending asset growth
Average interest earning assets across the majors increased by 2 percent in the past six months, reflecting a slower growth environment. Rising vulnerabilities are evident in parts of the Australian housing market. For example, stresses in Brisbane were due to the volume of apartment supply coming onto market, whilst high vacancy rates for commercial properties have led to weak market conditions in both Perth and Brisbane.
These factors have meant that despite the Australian commercial property yields being higher than most overseas markets and thus more attractive to foreign investors, housing lending continues to rise, albeit at a more subdued rate than seen previously. This has led to the decrease in net interest income across most of the major banks, due to higher funding costs over the same timeframe.
14 | Major Australian Banks: Half Year 2017 Results Analysis
© 2017 KPMG, an Australian partnership and a member firm of the KPMG network of independent member firms affiliated with KPMG International Cooperative (“KPMG International”), a Swiss entity. All rights reserved. The KPMG name and logo and are registered trademarks or trademarks of KPMG International.
Liability limited by a scheme approved under Professional Standards Legislation.
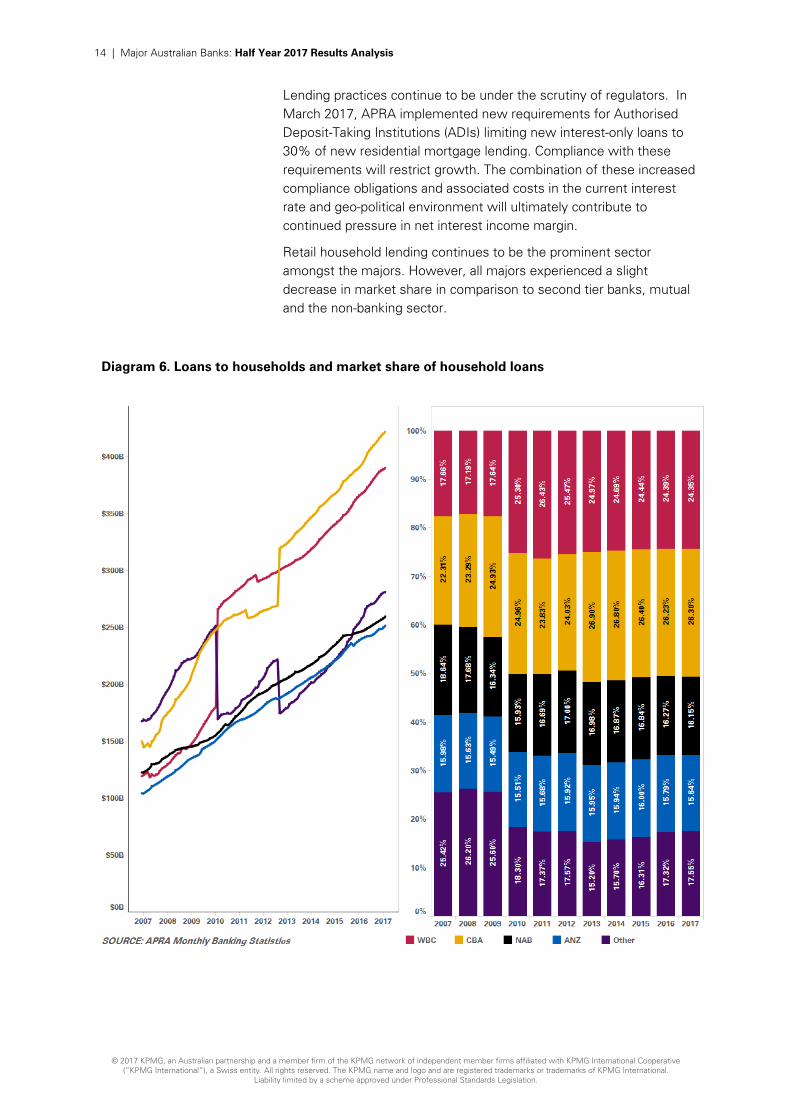
Lending practices continue to be under the scrutiny of regulators. In March 2017, APRA implemented new requirements for Authorised Deposit-Taking Institutions (ADIs) limiting new interest-only loans to 30% of new residential mortgage lending. Compliance with these requirements will restrict growth. The combination of these increased compliance obligations and associated costs in the current interest rate and geo-political environment will ultimately contribute to continued pressure in net interest income margin.
Retail household lending continues to be the prominent sector amongst the majors. However, all majors experienced a slight decrease in market share in comparison to second tier banks, mutual and the non-banking sector.
Diagram 6. Loans to households and market share of household loans
15 | Major Australian Banks: Half Year 2017 Results Analysis
© 2017 KPMG, an Australian partnership and a member firm of the KPMG network of independent member firms affiliated with KPMG International Cooperative (“KPMG International”), a Swiss entity. All rights reserved. The KPMG name and logo and are registered trademarks or trademarks of KPMG International.
Liability limited by a scheme approved under Professional Standards Legislation.
Funding mix
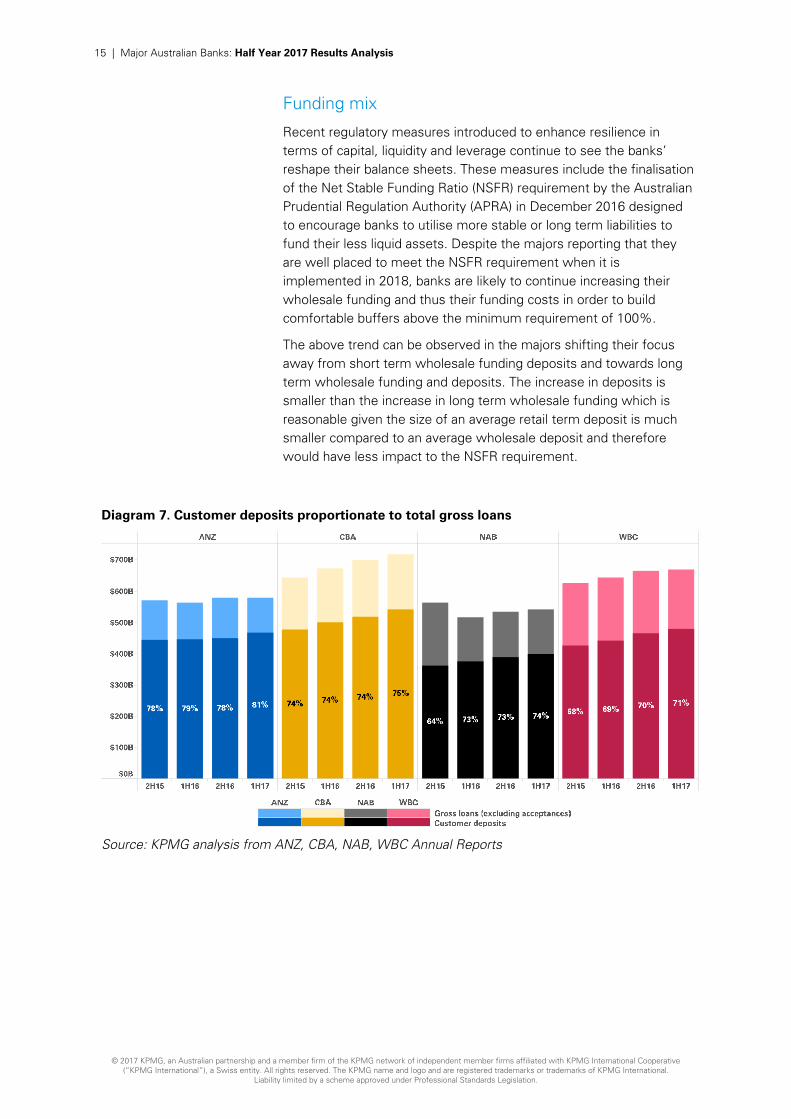
Recent regulatory measures introduced to enhance resilience in terms of capital, liquidity and leverage continue to see the banks’ reshape their balance sheets. These measures include the finalisation of the Net Stable Funding Ratio (NSFR) requirement by the Australian Prudential Regulation Authority (APRA) in December 2016 designed to encourage banks to utilise more stable or long term liabilities to fund their less liquid assets. Despite the majors reporting that they are well placed to meet the NSFR requirement when it is implemented in 2018, banks are likely to continue increasing their wholesale funding and thus their funding costs in order to build comfortable buffers above the minimum requirement of 100%.
The above trend can be observed in the majors shifting their focus away from short term wholesale funding deposits and towards long term wholesale funding and deposits. The increase in deposits is smaller than the increase in long term wholesale funding which is reasonable given the size of an average retail term deposit is much smaller compared to an average wholesale deposit and therefore would have less impact to the NSFR requirement.
Diagram 7. Customer deposits proportionate to total gross loans
Source: KPMG analysis from ANZ, CBA, NAB, WBC Annual Reports
16 | Major Australian Banks: Half Year 2017 Results Analysis
© 2017 KPMG, an Australian partnership and a member firm of the KPMG network of independent member firms affiliated with KPMG International Cooperative (“KPMG International”), a Swiss entity. All rights reserved. The KPMG name and logo and are registered trademarks or trademarks of KPMG International.
Liability limited by a scheme approved under Professional Standards Legislation.
Asset quality
Banks’ lending assets continue to perform relatively strongly. The majors’ reported charge for bad and doubtful debts remains low at an aggregate $2,206 million and impaired assets have stabilised over the past six months, after increasing in 2H16. The credit environment while demonstrating pockets of weakness, primarily in regions exposed to the mining sector, has been reported by the majors to be stable. The major banks aggregate charge for bad and doubtful debts decreased $318 million to $2,206 million in the first half.
Vulnerabilities related to household debt and the housing market more generally, appear not to be impacting the financial results of the majors. Household indebtedness continues to rise however indicators of household stress remain contained and low interest rates are supporting households’ ability to service debt and build buffers. Continued focus of the regulators on some of the riskier types of borrowing, such as interest-only and high loan-to-valuation lending, are being addressed by the majors’ through repricing and tightening lending practices. These activities, while impacting growth, will strengthen the resilience of the majors’ retail portfolios.
Investor activity and housing price growth, particularly in Sydney and Melbourne continues to be strong. However, this appears to be softening. According to recent RBA analysis, a large pipeline of new supply is entering the market and weighing on apartment prices and rents in Brisbane, while housing conditions remain weak in Perth. Focus continues on the performance of Sydney and Melbourne markets with constant speculation of a housing bubble. With strong asset performance, prudent provisioning and improved lending practices, the major banks remain well placed to manage these conditions.
Impaired assets have declined during the half driven by fewer large individual provisions across institutional portfolios and lower provisioning on mining and New Zealand dairy related exposures when compared to 2H16. Impaired assets, driven by exposure to weaker market conditions in Queensland, Western Australia and New Zealand, while down on 2H16, decreased $182 million on 1H16 to $6.5 billion (net basis). The majors have continued to focus on these stressed sectors and have maintained appropriate provisions and economic overlays against these portfolios. The improvement seen on these portfolios during the half is attributed to the continued run-off of loans, improved commodity prices and a stronger New Zealand dairy sector.
Concerns around high levels of household debt and the housing market more generally have increased, however the overall credit environment remains broadly stable. There are no major surprises in the half year result.
17 | Major Australian Banks: Half Year 2017 Results Analysis
© 2017 KPMG, an Australian partnership and a member firm of the KPMG network of independent member firms affiliated with KPMG International Cooperative (“KPMG International”), a Swiss entity. All rights reserved. The KPMG name and logo and are registered trademarks or trademarks of KPMG International.
Liability limited by a scheme approved under Professional Standards Legislation.
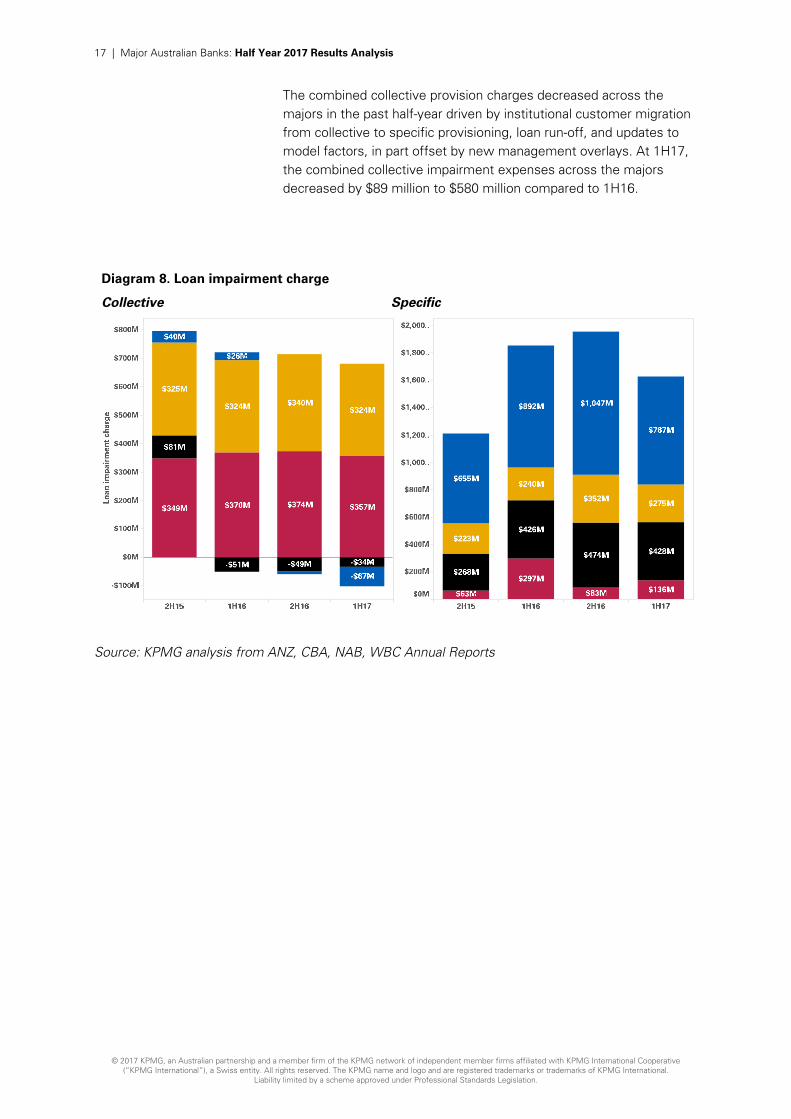
The combined collective provision charges decreased across the majors in the past half-year driven by institutional customer migration from collective to specific provisioning, loan run-off, and updates to model factors, in part offset by new management overlays. At 1H17, the combined collective impairment expenses across the majors decreased by $89 million to $580 million compared to 1H16.
Diagram 8. Loan impairment charge
Collective Specific
Source: KPMG analysis from ANZ, CBA, NAB, WBC Annual Reports
18 | Major Australian Banks: Half Year 2017 Results Analysis
© 2017 KPMG, an Australian partnership and a member firm of the KPMG network of independent member firms affiliated with KPMG International Cooperative (“KPMG International”), a Swiss entity. All rights reserved. The KPMG name and logo and are registered trademarks or trademarks of KPMG International.
Liability limited by a scheme approved under Professional Standards Legislation.
Non-interest income
The majors reported a combined increase in non-interest income of 8.3% to $12.8 billion mainly due to stronger markets income and one-off asset sales. However, stagnant growth in wealth management and higher insurance claims experience continue to drag on the result.
During the period, ANZ reported a $130 million increase in non-interest income, up 5 percent from the previous financial half year, primarily due to favourable trading conditions ($258 million) and derivative valuation adjustments ($197 million). One-off items, including a $324 million decrease related to the sale of the Company’s retail and wealth businesses in Asia, and a $114 million gain on sale of 100 Queen Street, Melbourne, impacted the result.
Similar to ANZ, CBA recorded a one-off item, related to the sale of the Group’s remaining investment in Visa Inc. ($397 million gain). This impacted CBA’s reported non-interest income which increased by $406 million (10 percent) to $4,399 million. A strong trading result driven by strong sales and trading performance, alongside increased commission income contributed to the favourable result.
NAB posted a $367 million increase in non-interest income primarily driven by an increase of $241 million due to favourable movements in economic hedges, in addition to an improved trading performance and higher fee income across the Group.
WBC reported an increase of $84 million during the half. Consistent with the other banks, WBC benefited from higher markets income offset, in part, by higher general insurance claims (Cyclone Debbie), lower advice income and margin impact of migrating to MySuper products.
Increased regulatory capital requirements are putting further pressure on their ability to grow and will ultimately inform their strategic decision-making, as they re-consider their approach to low growth, low return and capital intensive products and markets.
19 | Major Australian Banks: Half Year 2017 Results Analysis
© 2017 KPMG, an Australian partnership and a member firm of the KPMG network of independent member firms affiliated with KPMG International Cooperative (“KPMG International”), a Swiss entity. All rights reserved. The KPMG name and logo and are registered trademarks or trademarks of KPMG International.
Liability limited by a scheme approved under Professional Standards Legislation.
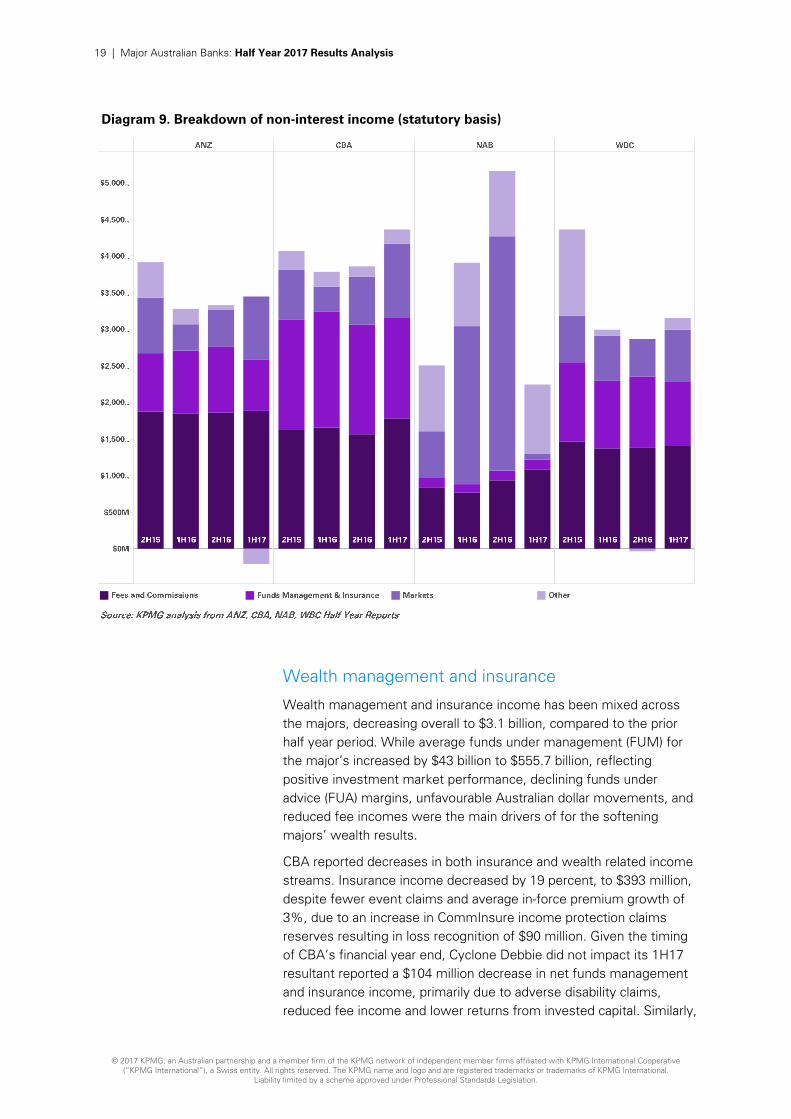
Diagram 9. Breakdown of non-interest income (statutory basis)
Wealth management and insurance
Wealth management and insurance income has been mixed across the majors, decreasing overall to $3.1 billion, compared to the prior half year period. While average funds under management (FUM) for the major’s increased by $43 billion to $555.7 billion, reflecting positive investment market performance, declining funds under advice (FUA) margins, unfavourable Australian dollar movements, and reduced fee incomes were the main drivers of for the softening majors’ wealth results.
CBA reported decreases in both insurance and wealth related income streams. Insurance income decreased by 19 percent, to $393 million, despite fewer event claims and average in-force premium growth of 3%, due to an increase in CommInsure income protection claims reserves resulting in loss recognition of $90 million. Given the timing of CBA’s financial year end, Cyclone Debbie did not impact its 1H17 resultant reported a $104 million decrease in net funds management and insurance income, primarily due to adverse disability claims, reduced fee income and lower returns from invested capital. Similarly,
20 | Major Australian Banks: Half Year 2017 Results Analysis
© 2017 KPMG, an Australian partnership and a member firm of the KPMG network of independent member firms affiliated with KPMG International Cooperative (“KPMG International”), a Swiss entity. All rights reserved. The KPMG name and logo and are registered trademarks or trademarks of KPMG International.
Liability limited by a scheme approved under Professional Standards Legislation.
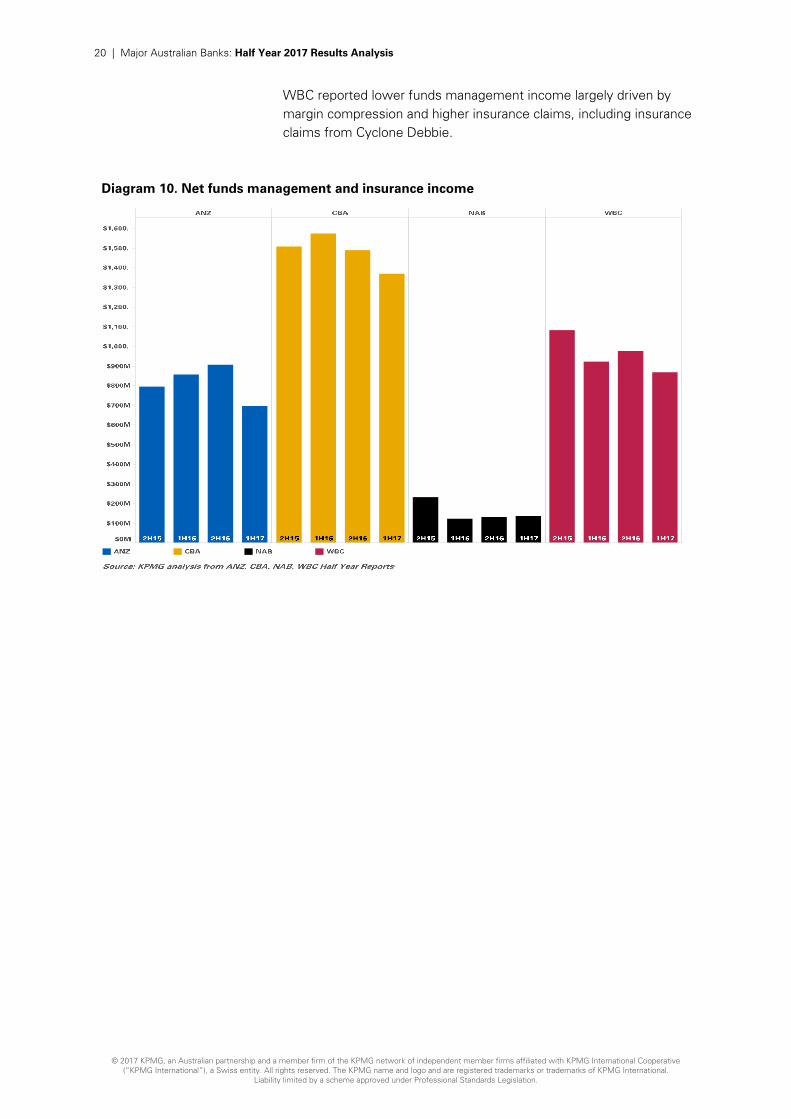
WBC reported lower funds management income largely driven by margin compression and higher insurance claims, including insurance claims from Cyclone Debbie.
Diagram 10. Net funds management and insurance income
21 | Major Australian Banks: Half Year 2017 Results Analysis
© 2017 KPMG, an Australian partnership and a member firm of the KPMG network of independent member firms affiliated with KPMG International Cooperative (“KPMG International”), a Swiss entity. All rights reserved. The KPMG name and logo and are registered trademarks or trademarks of KPMG International.
Liability limited by a scheme approved under Professional Standards Legislation.
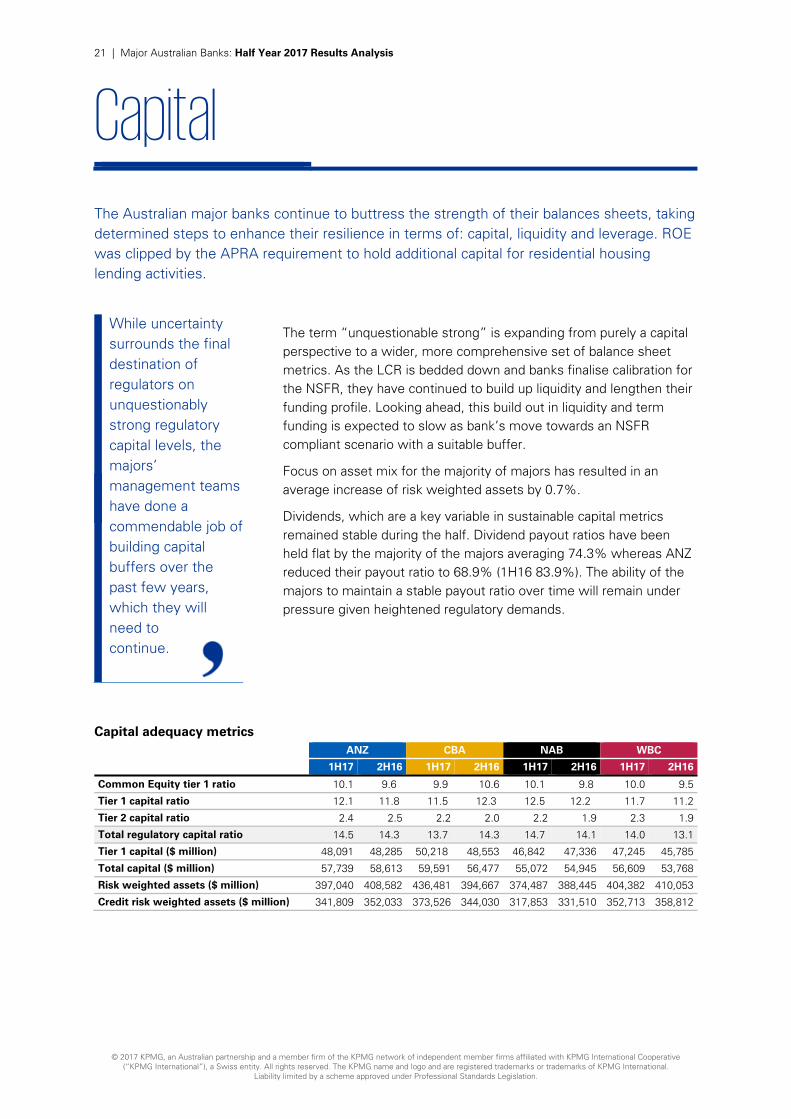
Capital
The Australian major banks continue to buttress the strength of their balances sheets, taking determined steps to enhance their resilience in terms of: capital, liquidity and leverage. ROE was clipped by the APRA requirement to hold additional capital for residential housing lending activities.
The term “unquestionable strong” is expanding from purely a capital perspective to a wider, more comprehensive set of balance sheet metrics. As the LCR is bedded down and banks finalise calibration for the NSFR, they have continued to build up liquidity and lengthen their funding profile. Looking ahead, this build out in liquidity and term funding is expected to slow as bank’s move towards an NSFR compliant scenario with a suitable buffer.
Focus on asset mix for the majority of majors has resulted in an average increase of risk weighted assets by 0.7%.
Dividends, which are a key variable in sustainable capital metrics remained stable during the half. Dividend payout ratios have been held flat by the majority of the majors averaging 74.3% whereas ANZ reduced their payout ratio to 68.9% (1H16 83.9%). The ability of the majors to maintain a stable payout ratio over time will remain under pressure given heightened regulatory demands.
Capital adequacy metrics ANZ CBA NAB WBC
1H17 2H16 1H17 2H16 1H17 2H16 1H17 2H16
Common Equity tier 1 ratio 10.1 9.6 9.9 10.6 10.1 9.8 10.0 9.5
Tier 1 capital ratio 12.1 11.8 11.5 12.3 12.5 12.2 11.7 11.2
Tier 2 capital ratio 2.4 2.5 2.2 2.0 2.2 1.9 2.3 1.9
Total regulatory capital ratio 14.5 14.3 13.7 14.3 14.7 14.1 14.0 13.1
Tier 1 capital ($ million) 48,091 48,285 50,218 48,553 46,842 47,336 47,245 45,785
Total capital ($ million) 57,739 58,613 59,591 56,477 55,072 54,945 56,609 53,768
Risk weighted assets ($ million) 397,040 408,582 436,481 394,667 374,487 388,445 404,382 410,053
Credit risk weighted assets ($ million) 341,809 352,033 373,526 344,030 317,853 331,510 352,713 358,812
While uncertainty surrounds the final destination of regulators on unquestionably strong regulatory capital levels, the majors’ management teams have done a commendable job of building capital buffers over the past few years, which they will need to continue.

22 | Major Australian Banks: Half Year 2017 Results Analysis
© 2017 KPMG, an Australian partnership and a member firm of the KPMG network of independent member firms affiliated with KPMG International Cooperative (“KPMG International”), a Swiss entity. All rights reserved. The KPMG name and logo and are registered trademarks or trademarks of KPMG International.
Liability limited by a scheme approved under Professional Standards Legislation.
The majors have each continued to maintain healthy buffers against specific Basel III ratios. However this requirement to hold high quality, low yield assets continues to slow earnings. We have observed the following:
• The Liquidity Coverage Ratio (the amount of high quality liquid assets held that can be used to meet the bank’s liquidity needs for a 30 day calendar liquidity stress scenario) is running at an average of 129 percent, in excess of the stipulated 100 percent minimum; and
• Leverage Ratio (the amount of Tier 1 capital held divided by average total consolidated assets of the bank) for the majors is at an average of 5.4 percent versus the currently agreed minimum requirement of 3 percent.
23 | Major Australian Banks: Half Year 2017 Results Analysis
© 2017 KPMG, an Australian partnership and a member firm of the KPMG network of independent member firms affiliated with KPMG International Cooperative (“KPMG International”), a Swiss entity. All rights reserved. The KPMG name and logo and are registered trademarks or trademarks of KPMG International.
Liability limited by a scheme approved under Professional Standards Legislation.
Costs
Cost management continues to be a focus across the majors with continued management efforts to arrest tightening margins and slowing earnings growth. In response, the majors continue to invest in technology and digital platforms to enhance customer experience while meeting the ongoing costs of regulatory change.
The average cost to income ratio on a cash basis decreased 160 basis points on PCP to 43.41 percent.
ANZ led the result with a reported improvement in its cost to income ratio of 730 basis points on PCP to 45.9 percent, largely as a result of the reduction in operating expenses due to non-recurring prior year initiatives such as higher software amortisation charges and restructuring costs.
The majors have reported that continued investment in digital technology, including initiatives to simplify processes and enhance the customer experience continues to improve efficiency and productivity. However, competing investment priorities remain as the majors continue to balance the need for investment in technology and digital capabilities to meet customer expectations, with the ongoing demands of regulatory compliance. While the majors continue to focus on maintaining operating costs, these have further been impacted by increased amortisation and restructuring expenses.
Other factors impacting on the cost of operating expenses can be attributed to the combination of a lower Australian dollar and rising consumer prices in the 2017 March quarter.
Technology
Increased technology costs have contributed to a higher average cost to income ratio across the majors as a result of the continued investment in innovation initiatives and investment in new technologies. The average increase for technology expenses is 0.97 percent. Increases in software amortisation expenses have been significant contributors.
The majors continue to invest in technology, with $8,123 million in software costs capitalised during 1H17. Key projects currently being undertaken by the majors’ include:
• investment in customer experience initiatives such as the New Payments Platform enabling real-time payments, integrated loan
The biggest challenge for them will be identifying and executing against a set of opportunities to deliver future earnings growth at the same time as realising cost savings without jeopardising growth.
24 | Major Australian Banks: Half Year 2017 Results Analysis
© 2017 KPMG, an Australian partnership and a member firm of the KPMG network of independent member firms affiliated with KPMG International Cooperative (“KPMG International”), a Swiss entity. All rights reserved. The KPMG name and logo and are registered trademarks or trademarks of KPMG International.
Liability limited by a scheme approved under Professional Standards Legislation.
origination and settlement platforms, mobile and digital technologies;
• productivity initiatives such as robotic processing; and
• compliance and security measures to satisfy new regulatory reporting obligations and safeguard information security.
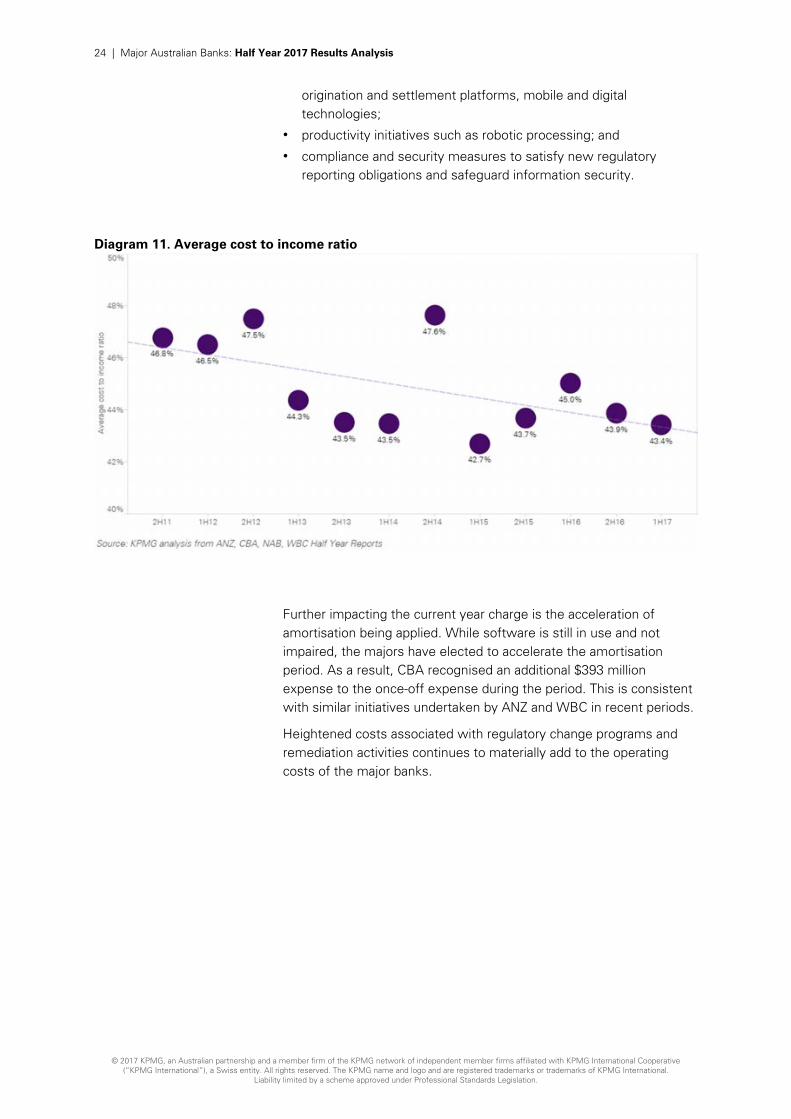
Diagram 11. Average cost to income ratio
Further impacting the current year charge is the acceleration of amortisation being applied. While software is still in use and not impaired, the majors have elected to accelerate the amortisation period. As a result, CBA recognised an additional $393 million expense to the once-off expense during the period. This is consistent with similar initiatives undertaken by ANZ and WBC in recent periods.
Heightened costs associated with regulatory change programs and remediation activities continues to materially add to the operating costs of the major banks.
25 | Major Australian Banks: Half Year 2017 Results Analysis
© 2017 KPMG, an Australian partnership and a member firm of the KPMG network of independent member firms affiliated with KPMG International Cooperative (“KPMG International”), a Swiss entity. All rights reserved. The KPMG name and logo and are registered trademarks or trademarks of KPMG International.
Liability limited by a scheme approved under Professional Standards Legislation.
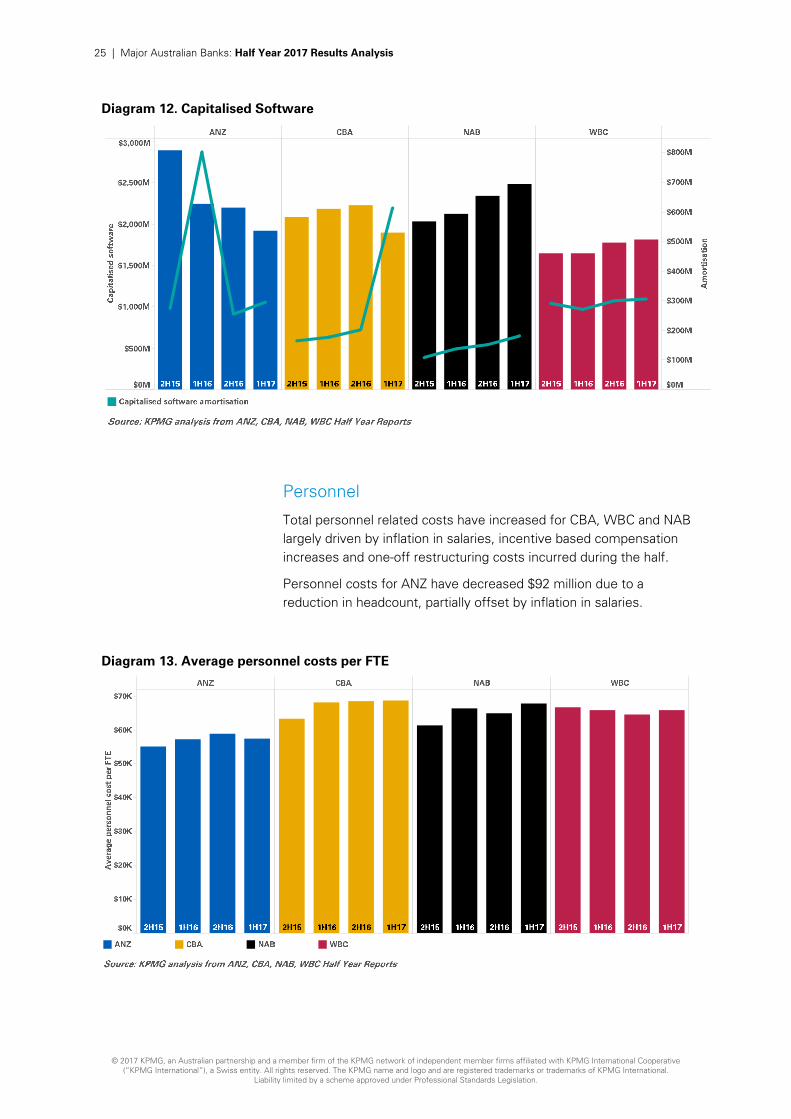
Diagram 12. Capitalised Software
Personnel
Total personnel related costs have increased for CBA, WBC and NAB largely driven by inflation in salaries, incentive based compensation increases and one-off restructuring costs incurred during the half.
Personnel costs for ANZ have decreased $92 million due to a reduction in headcount, partially offset by inflation in salaries.
Diagram 13. Average personnel costs per FTE
26 | Major Australian Banks: Half Year 2017 Results Analysis
© 2017 KPMG, an Australian partnership and a member firm of the KPMG network of independent member firms affiliated with KPMG International Cooperative (“KPMG International”), a Swiss entity. All rights reserved. The KPMG name and logo and are registered trademarks or trademarks of KPMG International.
Liability limited by a scheme approved under Professional Standards Legislation.
Return on equity
An environment of lower growth and increased regulatory requirements (requiring majors to hold higher levels of capital) is continuing to challenge the majors to maintain their historically high levels of industry returns.
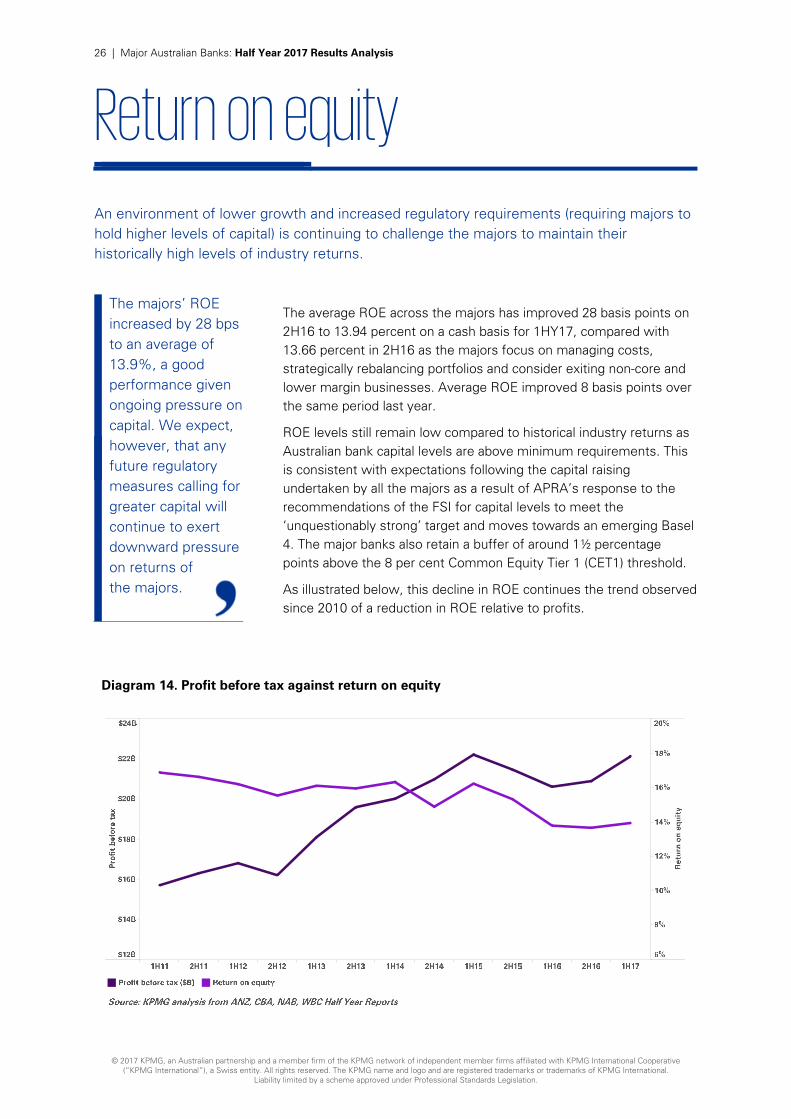
The average ROE across the majors has improved 28 basis points on 2H16 to 13.94 percent on a cash basis for 1HY17, compared with 13.66 percent in 2H16 as the majors focus on managing costs, strategically rebalancing portfolios and consider exiting non-core and lower margin businesses. Average ROE improved 8 basis points over the same period last year.
ROE levels still remain low compared to historical industry returns as Australian bank capital levels are above minimum requirements. This is consistent with expectations following the capital raising undertaken by all the majors as a result of APRA’s response to the recommendations of the FSI for capital levels to meet the ‘unquestionably strong’ target and moves towards an emerging Basel 4. The major banks also retain a buffer of around 1½ percentage points above the 8 per cent Common Equity Tier 1 (CET1) threshold.
As illustrated below, this decline in ROE continues the trend observed since 2010 of a reduction in ROE relative to profits.
Diagram 14. Profit before tax against return on equity
The majors’ ROE increased by 28 bps to an average of 13.9%, a good performance given ongoing pressure on capital. We expect, however, that any future regulatory measures calling for greater capital will continue to exert downward pressure on returns of the majors.
27 | Major Australian Banks: Half Year 2017 Results Analysis
© 2017 KPMG, an Australian partnership and a member firm of the KPMG network of independent member firms affiliated with KPMG International Cooperative (“KPMG International”), a Swiss entity. All rights reserved. The KPMG name and logo and are registered trademarks or trademarks of KPMG International.
Liability limited by a scheme approved under Professional Standards Legislation.
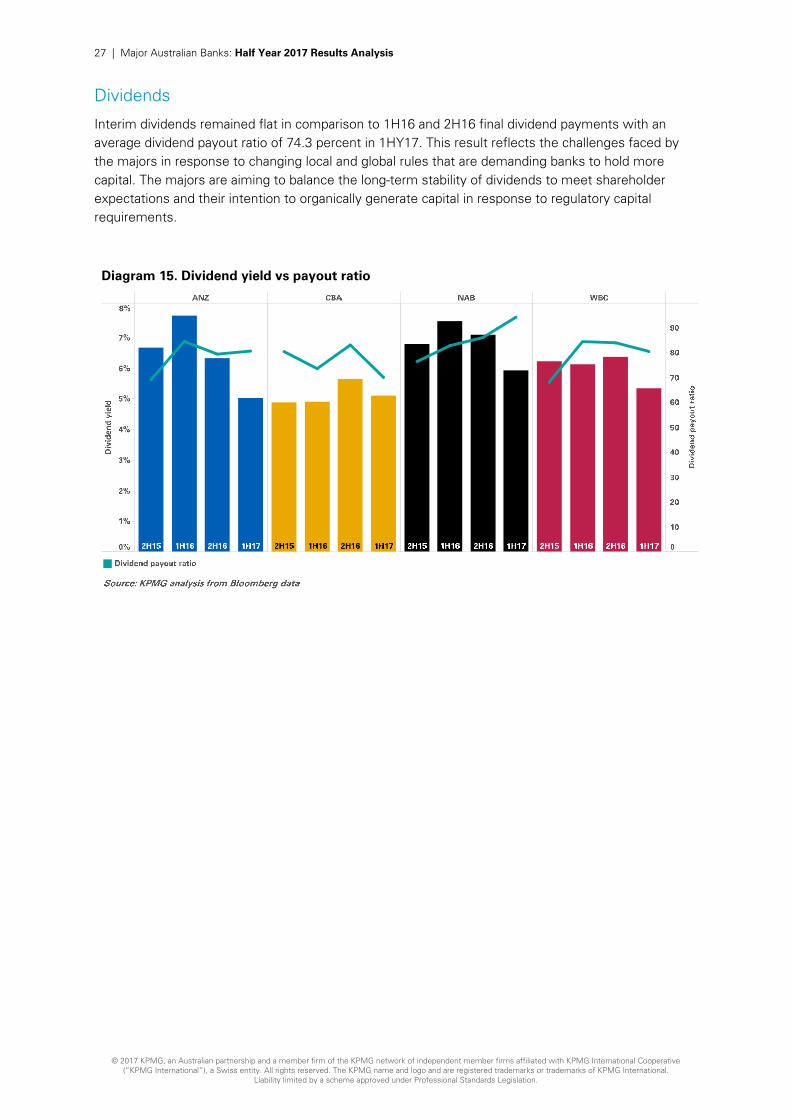
Dividends
Interim dividends remained flat in comparison to 1H16 and 2H16 final dividend payments with an average dividend payout ratio of 74.3 percent in 1HY17. This result reflects the challenges faced by the majors in response to changing local and global rules that are demanding banks to hold more capital. The majors are aiming to balance the long-term stability of dividends to meet shareholder expectations and their intention to organically generate capital in response to regulatory capital requirements.
Diagram 15. Dividend yield vs payout ratio

© 2017 KPMG, an Australian partnership and a member firm of the KPMG network of independent member firms affiliated with KPMG International Cooperative (“KPMG International”), a Swiss entity. All rights reserved. The KPMG name and logo and are registered trademarks or trademarks of KPMG International.
Liability limited by a scheme approved under Professional Standards Legislation.
Acknowledgements
The following KPMG staff have made a significant contribution to the development of this publication.
• Ben Flaherty
• Dimi Kumarasinghe
• Daphne Lam
• Eve Yee
• Sandy Menon
• Lina Liang
• Damian D’souza
• Stephen Bui
• Ashley Guo
• Giorgia Nasso
• Michael Rowland
• Michael Cunningham
• Chris Pedersen
www.kpmg.com.au
The information contained in this document is of a general nature and is not intended to address the objectives, financial situation or needs of any particular individual or entity. It is provided for information purposes only and does not constitute, nor should it be regarded in any manner whatsoever, as advice and is not intended to influence a person in making a decision, including, if applicable, in relation to any financial product or an interest in a financial product. Although we endeavour to provide accurate and timely information, there can be no guarantee that such information is accurate as of the date it is received or that it will continue to be accurate in the future. No one should act on such information without appropriate professional advice after a thorough examination of the particular situation.
To the extent permissible by law, KPMG and its associated entities shall not be liable for any errors, omissions, defects or misrepresentations in the information or for any loss or damage suffered by persons who use or rely on such information (including for reasons of negligence, negligent misstatement or otherwise).
© 2017 KPMG, an Australian partnership and a member firm of the KPMG network of independent member firms affiliated with KPMG International Cooperative (“KPMG International”), a Swiss entity. All rights reserved.
The KPMG name and logo and are registered trademarks or trademarks of KPMG International.
Liability limited by a scheme approved under Professional Standards Legislation.
May 2017
Contact us Ian Pollari National Banking Sector Leader +61 2 9335 8408 [email protected]
Andrew Yates Partner, Financial Services +61 2 9335 7545 [email protected]
kpmg.com/au/majorbanks