Embed Size (px)
DESCRIPTION
Full Year Results 2009. Amsterdam, March 2010. FY 2009. Summary Turnover Euro 738 million; 3% increase Gross profit Euro 152 million; 9% decrease Gross margin 21%; 2008 23% EBIT Euro 45.1 million; 27% decrease Brunel Netherlands: turnover - 10% Brunel Germany: turnover - 22% - PowerPoint PPT Presentation
Citation preview
Full YearResults2009
Amsterdam, March 2010

March 2010
FY 2009Summary
Turnover Euro 738 million; 3% increase
Gross profit Euro 152 million; 9% decrease
Gross margin 21%; 2008 23%
EBIT Euro 45.1 million; 27% decrease
Brunel Netherlands: turnover - 10%
Brunel Germany: turnover - 22%
Brunel Energy: turnover + 18%
Operational cash flow Euro 62 million, up from Euro 21 million 2008
March 2010
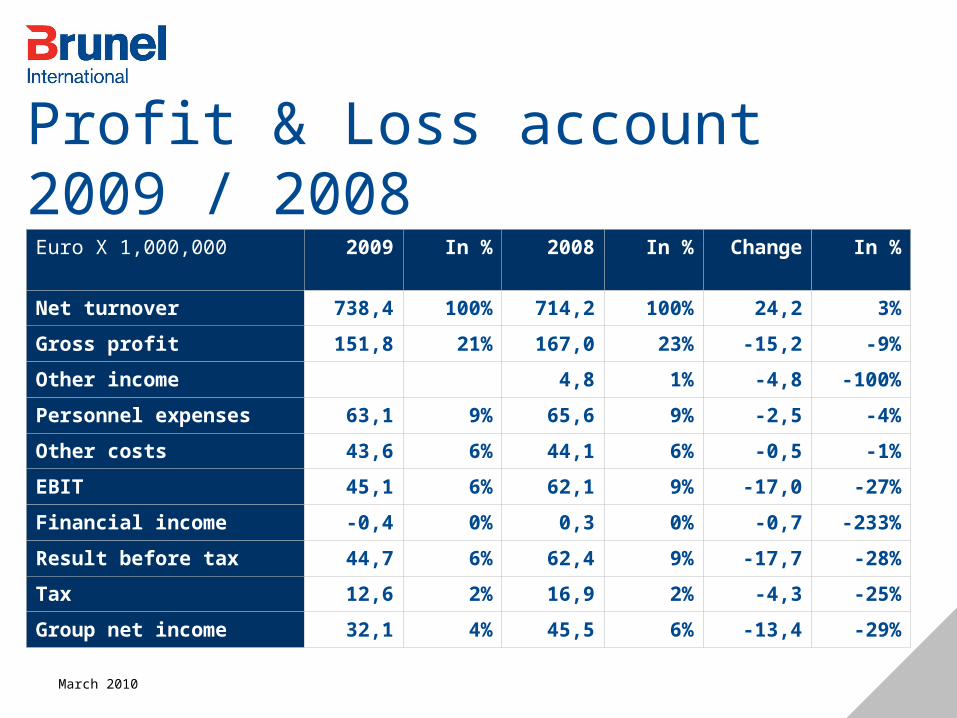
Profit & Loss account 2009 / 2008Euro X 1,000,000 2009 In % 2008 In % Change In %
Net turnover 738,4 100% 714,2 100% 24,2 3%
Gross profit 151,8 21% 167,0 23% -15,2 -9%
Other income 4,8 1% -4,8 -100%
Personnel expenses 63,1 9% 65,6 9% -2,5 -4%
Other costs 43,6 6% 44,1 6% -0,5 -1%
EBIT 45,1 6% 62,1 9% -17,0 -27%
Financial income -0,4 0% 0,3 0% -0,7 -233%
Result before tax 44,7 6% 62,4 9% -17,7 -28%
Tax 12,6 2% 16,9 2% -4,3 -25%
Group net income 32,1 4% 45,5 6% -13,4 -29%

March 2010
Q4 2009 vs. Q4 2008Summary
Turnover Euro 176 million; 11% decrease
Gross profit Euro 37 million; 16% decrease
Gross margin 21%; 2008 22%
EBIT Euro 10.1 million; 26% decrease
Brunel Netherlands: turnover - 16%
Brunel Germany: turnover - 22%
Brunel Energy: turnover - 5%

March 2010
Profit & Loss account 2009 / 2008Euro X 1,000,000 Q4 2009 In % Q4 2008 In % Change In %
Net turnover 175,8 100% 197,2 100% -21,3 -11%
Gross profit 36,5 21% 43,4 22% -6,9 -16%
Other income 2,1 1% -2,1 -100%
Personnel expenses 14,7 8% 17,4 9% -2,7 -16%
Other costs 11,7 7% 14,4 7% -2,7 -19%
EBIT 10,1 6% 13,6 7% -3,5 -26%
Financial income -1,4 -1% -0,3 0% -1,1 367%
Result before tax 8,7 5% 13,3 7% -4,6 -35%
Tax 1,8 1% 3,2 2% -1,4 -44%
Group net income 6,9 4% 10,1 5% -3,2 -32%
March 2010
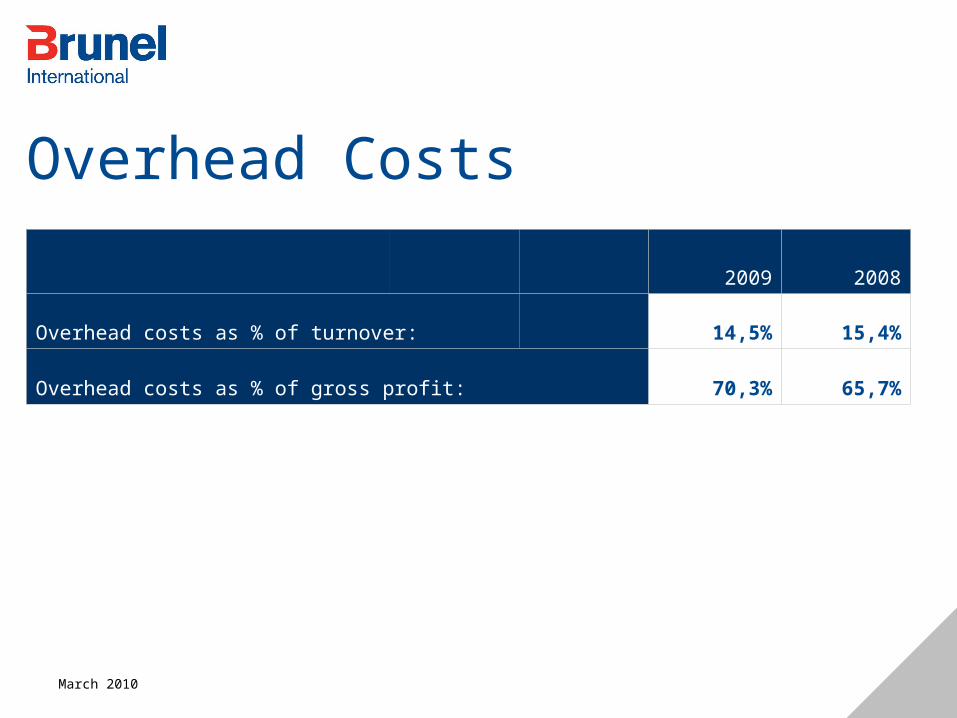
Overhead Costs
2009 2008
Overhead costs as % of turnover: 14,5% 15,4%
Overhead costs as % of gross profit: 70,3% 65,7%

March 2010
Workforce 2009 (average) 2009 2008
NL,DE,BE Energy Total NL,DE,BE Energy Total
Direct employees 3.145 3.635 6.780 3.596 3.269 6.865
Indirect employees 689 378 1.067 690 349 1.039
Avg. turnover per indirect employee
385 1.252 692 455 1.146 687
Avg. gross profit per indirect employee
132 161 142 166 150 161
March 2010
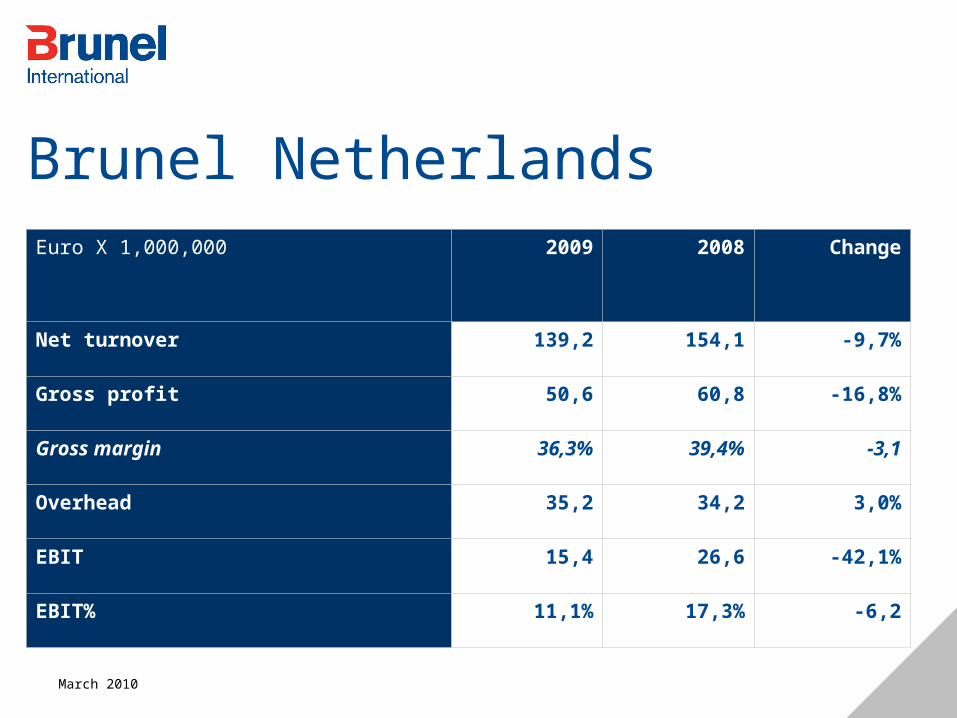
Brunel NetherlandsEuro X 1,000,000 2009 2008 Change
Net turnover 139,2 154,1 -9,7%
Gross profit 50,6 60,8 -16,8%
Gross margin 36,3% 39,4% -3,1
Overhead 35,2 34,2 3,0%
EBIT 15,4 26,6 -42,1%
EBIT% 11,1% 17,3% -6,2

March 2010
Brunel Netherlands FY 2009Summary
Decrease of turnover compared to 2008 - 10%
Gross Margin remains solid at 36.3% in 2009 (2008: 39.4%)
EBIT Euro 15.4 million (2008: Euro 26.6 million)
Taking into account the challenging market conditions Brunel Netherlands performed well in 2009
Gross Margin improved further to 38% in Q4, mainly due to higher productivity

March 2010
Brunel NetherlandsEuro X 1,000,000 Q4 2009 Q4 2008 Change
Net turnover 35,6 42,3 -15,8%
Gross profit 13,5 17,1 -21,1%
Gross margin 37,8% 40,5% -2,7
Overhead 9,7 9,7 0,0%
EBIT 3,8 7,4 -48,7%
EBIT% 10,6% 17,6% -7,0

March 2010
Brunel GermanyEuro X 1,000,000 2009 2008 Change
Net turnover 105,7 135,8 -22,2%
Gross profit 36,3 49,0 -25,9%
Other income 4,8 -100,0%
Gross margin 34,3% 36,1% -1,8
Overhead 34,9 37,4 -6,7%
EBIT 1,4 16,4 -91,5%
EBIT% 1,3% 12,1% -10,8
March 2010
Brunel Germany FY 2009Summary
German economy showed first signs of improvement in Q3
Turnover decrease 22%
Gross margin down 2% compared to 2008
Overhead costs in decline since January 2009
One off costs Euro 3 million full year (Euro 1 million in Q4)
March 2010
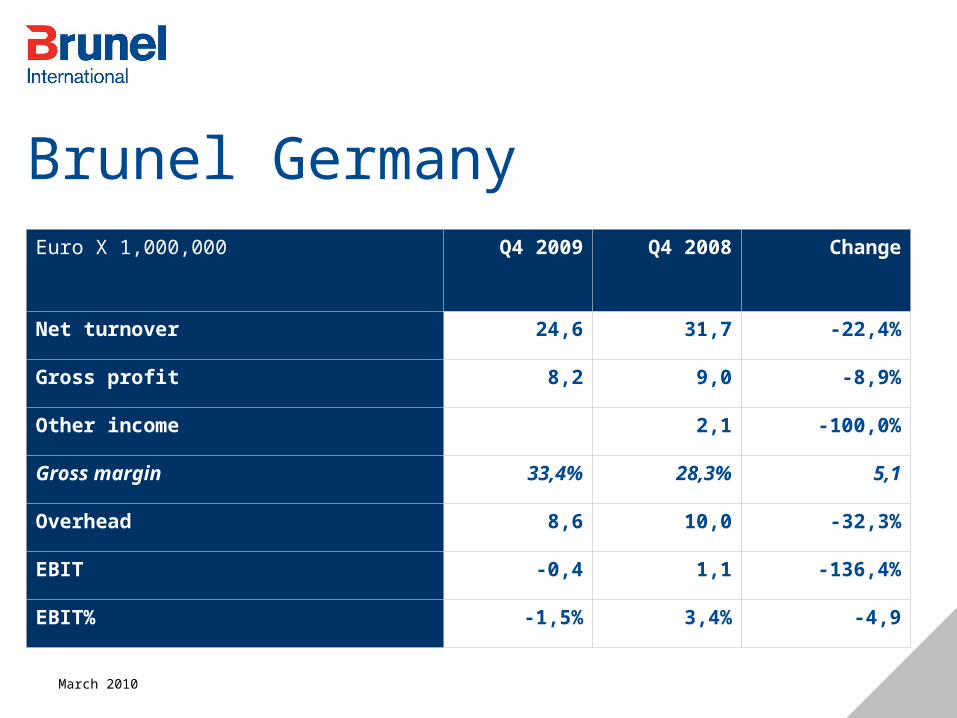
Brunel GermanyEuro X 1,000,000 Q4 2009 Q4 2008 Change
Net turnover 24,6 31,7 -22,4%
Gross profit 8,2 9,0 -8,9%
Other income 2,1 -100,0%
Gross margin 33,4% 28,3% 5,1
Overhead 8,6 10,0 -32,3%
EBIT -0,4 1,1 -136,4%
EBIT% -1,5% 3,4% -4,9
March 2010
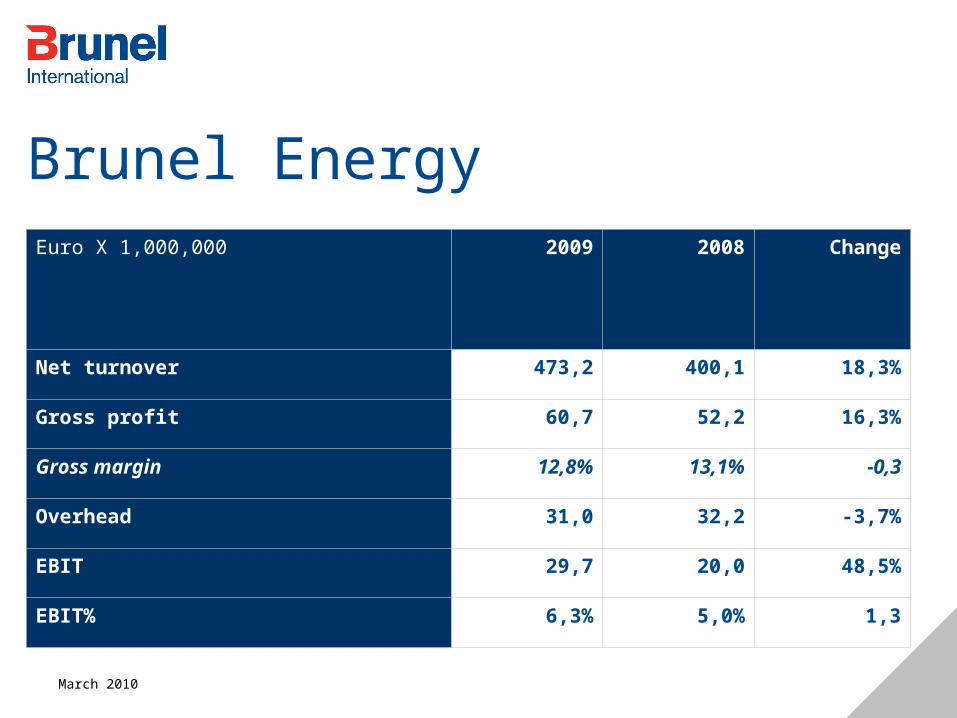
Brunel EnergyEuro X 1,000,000 2009 2008 Change
Net turnover 473,2 400,1 18,3%
Gross profit 60,7 52,2 16,3%
Gross margin 12,8% 13,1% -0,3
Overhead 31,0 32,2 -3,7%
EBIT 29,7 20,0 48,5%
EBIT% 6,3% 5,0% 1,3

March 2010
Brunel Energy FY 2009Summary
Turnover increase of 18% despite reluctance with investments by the Oil and Gas industry
Increase is driven by the Pluto project
Gross margin remains at 13%
Ebit up 49% to Euro 29.7 million as result of higher gross margin and lower overhead costs

March 2010
Brunel EnergyEuro X 1,000,000 Q4 2009 Q4 2008 Change
Net turnover 110,7 117,1 -5,5%
Gross profit 13,9 15,9 -12,6%
Gross margin 12,5% 13,6% -1,1
Overhead 7,0 9,7 -27,8%
EBIT 6,9 6,2 11,3%
EBIT% 6,3% 5,3% 1,0

March 2010
Balance sheetEuro X 1,000,000 2009 2008
Fixed/Intangible assets 28,9 19,6
Current assets 152,6 175,5
Cash 73,2 40,3
Total Assets 254,7 235,4
Group equity 180,9 163,8
Non-current liabilities 0,5 0,5
Current liabilities 73,3 71,1
Total Liabilities 254,7 235,4

March 2010
Balance sheet December 31, 2009
Summary
Strong balance sheet remains USP
Operational cash flow; Euro 62 million
Cash position Euro 73 million
Solvency remains high at 71%
Intangible assets up Euro 7.5 million, due to acquisition of “For all Finance”

March 2010
Brunel InternationalOutlook 2010
We remain positive about the future but we will not provide a quantitative outlook for 2010Demand in Europe for temporary professionals is recovering slowly Towards the end of the year Oil and Gas industry investments expected to increase