Embed Size (px)
Citation preview

FUEL BLENDING IN INDIA: LEARNINGS AND WAY FORWARD


FUEL BLENDING IN INDIA: LEARNINGS AND WAY FORWARD
10th Cross, Mayura Street, Papanna Layout, RMV
Extension Stage 2,Bangalore 560 094
College of Legal Studies, Kandoli Campus, University of Petroleum and
Energy Studies,Dehradun 248007
Suite 1-B, Plot No. 8-B, Main Mathura Road, New Delhi - 110014
C H A M B E R S
P L Radvocates & solicitors

Copyright with UPES, CSTEP and PLR Chambers © 2016: Except as permitted under applicable laws, no part of this publication may be otherwise reproduced, adapted or transmitted in any form by any process without the specific written consent of the UPES or CSTEP or PLR Chambers .
AUTHOR CREDITSSenior Contributors• Dr. Jai Asundi, Research Coordinator, Centre for Study of Science, Technology & Policy, Bengaluru• Prof. (Dr.) Tabrez Ahmad, Director, College of Legal Studies, University of Petroleum and Energy Studies, Dehradun• Mr. Suhaan Mukerji, Partner, PLR Chambers, New Delhi
University of Petroleum and Energy Studies, Dehradun• Dr. Azim B. Pathan, Assistant Professor, Environment and Climate Change Law, College of Legal Studies• Dr. Sujata Bali, Professor of Law, College of Legal Studies• Dr. Rituparna Das, Associate Professor, Management and Economics, College of Legal Studies • Dr. V. Chintala, Assistant Professor, College of Engineering Studies• Mr. Krishna Deo Singh Chauhan, Assistant Professor, College of Legal Studies
Centre for Study of Science, Technology & Policy, Bengaluru• Mohd. Sahil Ali, Senior Research Economist• Venkatesh Vunnam, Senior Research Engineer• Safinaz Saif, Research Consultant• Paresh Butolia, Research Consultant
PLR Chambers• Aditya Prakash Rao, Counsel• Tushar Mukherjee, Research Consultant• Aymen Mohammed, Associate• Harshdeep Singh, Associate• Shweta Malik, Research Assistant
Expert ConsultationsThe authors extend their appreciation to the following experts who were consulted during the preparation of this paper:• Dr. Varsha Joshi, Joint Secretary, Ministry of New and Renewable Energy, Government of India• Mr. Abhay Damle, Joint Secretary, Ministry of Road Transport and Highways• Mr. Abinash Verma, Director General, Indian Sugar Mills Association• Mr. Atanu Ganguli, Senior Director, Society for Indian Automobile Manufacturers• Mr. Subodh Kumar, General Manager, Alternate Energy & Sustainable Development, Indian Oil Corporation Ltd.• Mr. Y. B. Ramakrishna, Chairman, Working Group on Biofuels, Ministry of Petroleum and Natural Gas, Government of India• Prof. (Dr.) Vibha Dhawan, Senior Director, The Energy and Resources Institute
Furthermore, the authors would further like to thank the following:• All India Distillers’ Association• Indian Oil Corporation Limited• Indian Sugar Mills Association• Ministry of Agriculture, Government of India• Ministry of Environment, Forests and Climate Change• Ministry of New and Renewable Energy, Government of India• Ministry of Road Transport and Highways• NITI Aayog• Society of Indian Automobile Manufacturers• The Energy and Resources Institute• Working Group on Biofuels, Ministry of Petroleum and Natural Gas

FOREWORDIndia’s energy policy priorities reflect the need to move towards more sustainable sources of energy while also ensuring energy security. India is heavily dependent on international markets to meet its crude demand. Currently, India meets 84.5% of its crude oil demand through imports, leaving the country susceptible to global price fluctuations.
In order to achieve the twin objectives of energy security and sustainable energy, there has been increased focus on the potential of biofuels. Since biofuels are produced from renewable biological sources, their usage has the potential to reduce vehicular emissions while also ensuring significant foreign exchange savings, besides revitalising the rural economy.
Biofuels offer important economic opportunities across the value chain. Since biofuels are produced from agricultural by-products (such as molasses) and lignocellulosic biomass, they offer alternate sources of income to farmers. Furthermore, increasing expansion of biofuel processing and production facilities will further generate sustainable livelihood opportunities.
Besides investments in sugarcane research on improving crop yields and water usage, it is important that appropriate measures are taken to tap into the potential that second generation biofuels offer. Second generation biofuels are produced from non-edible sources such as lignocellulosic biomass, agricultural residues or waste, thus addressing food security concerns.
To this extent, India has made significant headway in the past year. For example, the Ministry of Petroleum and Natural Gas has assisted Public Sector Undertakings to set up twelve 2G commercial plants. These projects would significantly expand India’s 2G ethanol production capacities. Moreover, the Institute of Chemical Technology, Mumbai with support from the Department of Biotechnology, Ministry of Science and Technology has developed feedstock-independent technology that has been deployed in India’s first 2G ethanol demonstration plant in Kashipur, Uttarakhand. The technology is ready for scaling up and is capable of converting different types of agricultural residues including bagasse and cotton stalk. Praj Industries in Pune have also developed world class 2G technology and their demo plant is ready for commissioning.
In this regard, the present paper is timely as it provides a comprehensive overview of India’s biofuels policy and the Ethanol Blended Petrol Programme. The paper, using data, demonstrates significant advantages that fuel blending can offer and provides a roadmap on a broader shift towards a biofuels based economy. I congratulate the research team that has been instrumental in preparing this paper, and hope that this paper is used as a point of reference for policymakers, academics and other stakeholders.
(Mr. Y.B. Ramakrishna)Chairman, Working Group on Biofuels

Prof (Dr.) Tabrez AhmadDirector, College of Legal StudiesUniversity of Petroleum and Energy
We can create a more sustainable, cleaner and safer world by making wiser energy choices.-Robert Alan Silverstein
Today biofuels, and specifically ethanol are drawing renewed attention as an alternate to petroleum-derived gasoline in order to address energy security, energy costs, and global warming concerns associated with liquid fossil fuels.
It is noteworthy to take into consideration the emerging era of rapid transformation in the way in which economic and social development is being undertaken. Specifically, the significant growth in the transportation sector has seen a corresponding increase in demand for energy and fuel. Globally, transportation systems are generally dependent on fossil fuels, which have a significantly more harmful effect on the environment.
It is not surprising that most periods of accelerated industrial development have been correlative to the international price of crude oil. However, the increased attention to environment and climate change has propelled innumerable new approaches that can incentivise the application of long-time dormant technologies. One such example is the development of the biomass and biofuel industry, which is increasingly being seen as one of the solutions to energy insecurity. Moreover, many countries, developed and developing, have attempted to shift from a fossil fuel dependent economy to a biofuel based economy as a sustainable alternative.
Biofuel is a renewable fuel that is produced through biological processes, such as agriculture and anaerobic digestion, rather than geological processes, such as those involved in the production of fossil fuels. Biofuels can be derived directly from plants, or indirectly from agricultural, commercial, domestic and industrial wastes. Renewable biofuels generally involve contemporary carbon fixation, such as those that occur in plants or microalgae through the process of photosynthesis. The most commonly used biofuel is ethanol, which is produced from various feedstocks, such as sugarcane, maize and cassava.
The United States and Brazil, as the largest producers of ethanol have adopted robust policy measures for the promotion of ethanol in the transportation sector with a view to reduce dependence on fossil fuels. Similar policy approaches need to be tailored to India’s needs in order for it to move India’s rapidly expanding transportation towards greener alternatives.
The key to leveraging the economic, social and environmental benefits of ethanol would require India to develop flexible strategies aimed at incentivising industry and consumers to shift towards broader adoption of ethanol, bother as an oxygenate and as an alternate.
As this paper discusses, the social benefits of a broader biofuel programme include an expansion in livelihood opportunities. Similarly, economic benefits include significant opportunities across the value chain for farmers, and expansion of industrial development. The environmental benefits are significant

as well, wider ethanol usage has shown to substantially reduce harmful emissions and consequently improve air quality.
In the above said background, this paper has covered in its first chapter the background and history of the adoption of ethanol blending in India. The second chapter of this paper highlights some of the challenges to EBP program and different issues ranging from imposition of varied taxes upon the inter-state movement of ethanol, procedural difficulties and legislative and administrative issues in India. The third chapter has explored some of the potential economic and environmental advantages of adoption of ethanol as a biofuel in India. The fourth chapter documents global best practices and analyses the experience of three countries in specific: the United States, the Philippines and Brazil.
The final chapter sets out policy recommendations based on the roadblocks and hurdles identified in Chapter II, and further provides a comprehensive roadmap for the broader adoption of biofuels in the country.
It is necessary to note that, in view of India’s rapid economic growth, energy demand will continue to rise rapidly in the coming decades. There is no going back on the path and pace of economic progress that India has chosen for itself, especially after globalization. The increasing consumer demand of a developing nation add stress on limited sources of energy of any nation.
In order to meet these increasing demands, it is important that a gradual shift from fossil fuels to renewable fuels is made. However, this process is slow and expensive, and therefore it would be necessary to make appropriate investments that are aimed at increasing efficiency of existing sources of energy while, in parallel, enabling a shift towards sustainable resources.
India’s National Policy on Biofuels, 2009 does reflect these concerns and charts out ambitious goals in this regard. However, there is a need to ensure that implementation of these programs accounts for broader administrative and policy priorities, especially in the agricultural and transportation sectors.
In this context, this expert paper aims to present pragmatic measures and interventions that are specifically aimed at operationalizing the objectives of this expert paper.
Thanking you,
With Warm Regards,
Prof. Dr. Tabrez Ahmad

Dr. Anshu Bharadwaj Executive Director, CSTEP, Bengaluru
Liquid fuels are the primary source of energy in the transportation sector. The transportation energy demand continues to grow, especially in developing countries. Traditionally fossil fuels have been the primary sources of energy in transportation. However, biofuels have recently gained significant attention in recent years since they are considered as viable alternatives; they are produced from renewable sources and also address significant concerns relating to air quality and fuel efficiency.
Biofuels do, however, require careful examination. One, their use should not in any way conflict with food or animal feed production. The use of land should follow the principle “food, feed, then fuel”. Two, the case for biofuels should be based on a “life cycle” analysis. Three, in the past biofuel cultivation has often led to clearing of vast tracts of forest lands, which caused large upfront CO2 emissions.
It is very timely that UPES, CSTEP and PLR Chambers have embarked on this collaborative study to examine the viability of ethanol as a biofuel to meet India’s energy needs. The study specifically examines the significant opportunities that biofuels present and provides recommendations that are based on global best practices.
I congratulate the team involved in this study and hope that this study is utilised as a point of reference by all stakeholders, including policymakers, researchers and market participants.
(Dr. Anshu Bharadwaj)Executive Director, CSTEP


LEGISLATIONS
S.No Country Legislation Year
1. India Power Alcohol Act 1948
2. India Industries (Development and Regulation) Act 1951
3. India Air (Prevention and Control of Pollution) Act 1981
4. India Environment Protection Act 1986
5. IndiaThe Industries (Development and Regulation) Amendment Act
2016
6. Philippines Biofuels Act 2006
7. Philippines Clean Water Act 2004
8. USA Energy Tax Act 1978
9. USACrude Oil Windfall Profit Tax Act and the Energy Security Act
1980
10. USA Gasohol Competition Act 1980
11. USA Surface Transportation Assistance Act 1982
12. USA Tax Reform Act 1984
13. USA Alternate Motor Fuels Act 1988
14. USA Omnibus Budget Reconciliation Act 1990
15. USA Clean Air Act Amendments 1990
16. USA Energy Policy Act 1992
17. USA Transportation Efficiency Act of the 21st Century 1998
18. USA Agriculture Appropriations Act1999-2000
19. USA American Jobs Creation Act 2004
20. USA Energy Policy Act 2005
21. USA The Energy Independence and Security Act 2007

ABBREVIATIONS
S.No Abbreviation Full Form
1. % Percentage
2. $ United States Dollar
3. € Euro
4. ANP Agencia Nacional do Petroleo
5. AUD Australian Dollar
6. ASEAN Association of South East Asian Nations
7. BNDES National Bank For Social and Development
8. BIS Bureau of Indian Standards
9. BRL Brazilian Real
10. BS-III Bharat Stage (BS) III
11. BS- IV Bharat Stage (BS) IV
12. Btu/lb British Thermal Unit Per Pound
13. CAD Canadian Dollar
14. CAGR Compound Annual Growth Rate
15. CAMEX Chamber of Foreign Trade
16. CCEA Cabinet Committee on Economic Affairs
17. CCS Carbon Capture and Storage
18. CENPES Centro de Pesquisas e Desenvolvimento
19. CEX Education & Higher Education Cess
20. CIF Cost, Insurance and Freight
21. CIFD Cost, Insurance, Freight and Duty
22. CIMA Conselho Interministerial de Acucar e Alcool
23. CNG Compressed Natural Gas
24. CO Carbon Mono Oxide
25. CO2 Carbon Dioxide
26. CO2e Carbon Dioxide Emissions
27. COP Conference of the Parties

S.No Abbreviation Full Form
28. CTC Centralized Traffic Control
29. DoE Department of Energy
30. DoT Department of Transport
31. E10 10% Ethanol blended with 90% petrol
32. E100 100% Ethanol blended with 0% petrol
33. E15 15% Ethanol blended with 85% petrol
34. E20 20% Ethanol blended with 80% petrol
35. E25 25% Ethanol blended with 75% petrol
36. E30 30% Ethanol blended with 70% petrol
37. E50 50% Ethanol blended with 50% petrol
38. E70 70% Ethanol blended with 30% petrol
39. E5 5% Ethanol blended with 95% petrol
40. E85 85% Ethanol blended with 15% petrol
41. EBP Ethanol Blended Petrol
42. ecoABC Eco Agriculture Biofuels Capital Initiative
43. EESI Environment and Energy Study Institute
44. EIA Energy Information Administration
45. EPAct Energy Policy Act
46. ERFA Ethanol Renewable Fuel Association
47. EU European Union
48. FAME Fatty Acid Methyl Ester
49. FAO Food and Agricultural Organization
50. FAQ Frequently Asked Questions
51. FFVs Flex Fuel Vehicles
52. FGP Factory Gate Price
53. FOREX Foreign Exchange
54. FRP Fair and Remunerative Price
55. GHG Green House Gases
56. GDP Gross Domestic Product
57. GIS Geographic Information System

S.No Abbreviation Full Form
58. GoB Government of Brazil
59. GST Goods and Services Tax
60. Ha Hectare
61. HC Hydrocarbon
62. IAA Instituto do Acucar e Alcool
63. ICCT International Council on Clean Transportation
64. IEA International Energy Agency
65. IISR Indian Institute for Sugarcane Research
66. INDCs Intended Nationally Determined Contributions
67. INR Indian National Rupee
68. IPCC Intergovernmental Panel on Climate Change
69. IPI Imposto Sobre Produtos Industrializados
70. ISMA Indian Sugar Mills Association
71. KERC Karnataka Electricity Regulatory Commission
72. Kcal Kilocalorie
73. Kh Henry’s Constant
74. Kilo Kilogram
75. Km Kilometre
76. Koc Partition Coefficient
77. KSCST Karnataka State Council for Science and Technology
78. LLC Limited Liability Company
79. LOI Letter of Intent
80. LPG Liquified Petroleum Gas
81. Ltr Litre
82. MAPA Ministry of Agriculture, Livestock and Supply
83. MFN Most Favoured Nation
84. Mg/l Milligram per Litre
85. MNRE Ministry of New and Renewable Energy
86. MoEFCC Ministry of Enviroment, Forests and Climate Change
87. MoDIC Ministry of Development, Industry and Commerce

S.No Abbreviation Full Form
88. MON Motor Octane Number
89. MoRTH Ministry of Road, Transport and Highways
90. MoSPI Ministry of Statistics and Programme Implementation
91. Mt Metric Tons
92. MTBE Methyl Tertiary Butyl Ether
93. N/A Not Applicable
94. NBB National Biofuel Board
95. NBEP National Biomass Expansion Program
96. NITI National Institute for Transforming India
97. NO2 Nitrogen Dioxide
98. NOCs No Objection Certificates
99. NPRM Notice of Proposed Rule Making
100. OECD Organisation For Economic Co-operation and Development
101. OMCs Oil Marketing Companies
102. R&D Research and Development
103. RE Renewable Energy
104. RFA Renewable Fuels Association
105. RFS Renewable Fuel Standard
106. RINs Renewable Identification Numbers
107. RON Research Octane Number
108. RPS Redundant Power Supply
109. SAP State Advised Price
110. SEB State Electricity Boards
111. SI Spark Ignition
112. SIAM Society of Indian Automobile Manufacturers
113. Sl. No. Serial Number
114. TDoT Tennessee Department of Transport
115. TERI The Energy and Resources Institute
116. THB Thai Baht
117. UNEP United Nations Environment Programme

S.No Abbreviation Full Form
118. USA United States of America
119. USD United States Dollar
120. USDA United States’ Department of Agriculture
121. VAT Value Added Tax
122. VEETC Volumetric Ethanol Excise Tax Credit
123. VOC Volatile Organic Compound
124. WTI West Texas Intermediate
125. 2G Second Generation

LIST OF FIGURES
Figure 1: Global Biofuel Market 24
Figure 2: Global Bioethanol Growth 31
Figure 3: World Bioethanol Production 31
Figure 4: ISMA Contracted Amounts for Ethanol Blending 33
Figure 5: Ethanol Consumption and Blending Ratios in India 35
Figure 6: CO Emissions in E0 and E10 Scenarios 53
Figure 7: NOx Emissions in E0 and E10 Scenarios 53
Figure 8: Cost of Production of Petrol and Importing Ethanol 56
Figure 9: Net Reduction in Import Bill at Various Ethanol Blends 57
Figure 10: Global Ethanol Blending Targets and Achievements 62
Figure 11: Global Ethanol Production by Country/Region and Year 62
Figure 12: Production and Import of Ethanol in Philippines 72
Figure 13: Ethanol Blending Rates in Philippines 72
Figure 14: Brazil’s Ethanol Blending Performance 75
Figure 15: Ethanol Types and their use in Brazil 75
Figure 16: Ethanol Production by Different Feedstocks in Brazil 76
Figure 17: Historical Ethanol Production and Policies 77
Figure 18: MTBE And Ethanol Blending in USA 78
Figure 19: Summary of Key Legislation Related to Ethanol 79
Figure 20: Global Crude Oil, Domestic Petroleum Price and Imported Ethanol Price Variation
98

LIST OF TABLES
Table 1: Representation of Biofuels 25
Table 2: Comparison of MTBE and Ethanol Characteristics 27
Table 3: Fuel Characteristics of Petrol, Ethanol and E85 28
Table 4: Estimation of Emissions from Petrol and Flex-Fuel Vehicles
29
Table 5: Fuel Consumption and Efficiency for Different Ethanol Blends
30
Table 6: Snapshot of the History of Ethanol Blending in India 34
Table 7: Duties and Taxes Imposed by States for Ethanol Transport in India 37
Table 8: Legal Framework for Ethanol Blending in India 38
Table 9: Roles Of Various Stakeholders in the EBP Programme 40
Table 10: Ethanol Procurement Quantities and Prices 43
Table 11: Ethanol Requirements and Purchases by OMCs 44
Table 12: Projected Crude and Petrol Demands 45
Table 13: Projected Blending Ethanol Demands 46
Table 14: Projected Supply and Sector-Wise Demand of Ethanol in India 46
Table 15: Payments Due by Sugar Mills to Farmers 50
Table 16: Avoided CO2e Emissions in Different Blending Scenarios 52
Table 17: Avoided SO2 Emissions in Different Blending Scenarios 53
Table 18: Projected Prices for Various Ratios of the EBP Programme 54
Table 19: Annual FOREX Savings Due to Ethanol Blending 55
Table 20: Export Incomes from Surplus Petrol Due to Blending 55

Table 21: Historical Import and Export Prices of Petrol 56
Table 22: Potential Reduction in Petrol Imports from Blending
57
Table 23: Economic Impact of Ethanol Production by Country 58
Table 24: Ethanol Blending Mandates Around the World 61
Table 25: Major Ethanol Feedstocks Around the World 63
Table 26: Comparison of Efficiency and Yield of Different Ethanol Feedstocks
64
Table 27: Impact of Blended Ethanol on Vehicles 66
Table 28: Summary of Best Practices for the Promotion of Ethanol Blended Fuels
68
Table 29: Global Ethanol Production for Fuel Use 69
Table 30: Roadmap for the EBP Programme 88
Table 31: Price Determination of Petrol 99
Table 32: State Wise Sugarcane Production and Ethanol Production Capacity
100
Table 33: Economic Analysis of Production of Ethanol From Standalone Distilleries and Sugar Mills
101
Table 34: Import Duties on Fuel Ethanol 102


CONTENTSExecutive Summary 22
1. Fuel Blending: The Story so Far 24
2. Challenges to India’s EBP Programme 35
3. Biofuels: Opportunities and Benefits 51
4. Global Best Practices 61
5. Towards Fulfilling India’s Biofuel Promise 80
References 90
Annexure 98

22
EXECUTIVE SUMMARYBiofuels have received global attention recently as governments across the world seek to address fuel efficiency, air quality and energy security. Biofuels are produced from renewable biological sources and are considered viable alternatives or supplements to fossil-fuels. In order to support a broader shift towards biofuels, governments have introduced various policy measures; some of these include mandatory fuel blending programs, incentives for flex-fuel vehicles and agricultural subsidies for farmers. The Government of India in January 2003 launched its Ethanol Blended Petrol (EBP) Programme for 5% ethanol blended petrol. India’s EBP Programme sought to improve fuel efficiency and ensure protection from the price shocks of the global crude market. In 2009, the Government of India introduced a National Policy on Biofuels. The Policy focussed on further encouraging biofuel usage and reducing the prevailing dependence on fossil fuels, while it sought to mitigate environmental and fuel efficiency concerns. The Policy also recognised the significant opportunity that biofuels offer to India’s agricultural and industrial sectors.
The policy has received fresh impetus with the recent initiative of the government to expand domestic capacity. In the past year (2015-16), the Government of India has made significant investments in improving storage and blending infrastructure. Further public investments (to the tune of INR 7000 crore) are being made in supporting second generation biofuels processing and production. This alone is expected to generate an additional 350 million litres of ethanol by 2019.
The National Policy on Biofuels has set a target of 20% blending of biofuels, both for bio-diesel and bioethanol. However, India has managed to achieve an average blending rate of close to 5% for the first time only in 2016. Our nation’s domestic ethanol capacity stands at approximately 2240 million litres annually. It is projected that there will be a supply deficit of 822 million litres (27%) when demand for chemicals and potable alcohol is taken into account. In addition to this supply deficit, certain market and regulatory hurdles also contribute to limiting the potential of the country’s EBP Programme.
To succeed, the EBP Programme requires an integrated approach across its value chain. The varied administrative and duty requirements by each of the different states needs to be addressed. These requirements, in conjunction with a disjointed pricing framework has in the past dissuaded sugar mills from directing their supplies towards blending. Of significance is the difficulty in sourcing domestically produced ethanol. Existing domestic ethanol supplies are closely linked to the cyclical nature of sugarcane harvests in the country, which results in market uncertainty.
Biofuels offer significant economic and environmental benefits. For example, there are substantial environmental emissions savings of CO2 and local pollutants from the use of blended fuel. It is projected that CO2 emissions can be reduced up to 10.41 million ton CO2e by 2021-2022 at a 20% blending rate for ethanol. (See Section 3.1).
Successful implementation of the government’s EBP Programme will also result in considerable foreign exchange savings. India could reduce its import bill by up to 39, 812.5 crore rupees by 2021-22 when ethanol blending is factored in. The expert paper further estimates significant potential for an overall improvement in balance of trade with increased blending in the context of an expected recovery in

23
global crude oil prices.
In order to leverage these advantages, a cogent and consistent framework is necessary in programme implementation. Based on international best practice and expert inputs from stakeholders, this paper seeks to propose a comprehensive roadmap for a biofuels-based economy.
The proposed roadmap bases its recommendations on both a quantitative and qualitative analysis. The recommendations identify existing hurdles to implementation and map it against international case studies where similar difficulties had also existed. Internationally, the approach in programme implementation has focused on flexibility in procurement and production processes in the short-term, while supporting simultaneous expansion of domestic capacity. A similar approach has been suggested in this paper, where, in the short term procurement processes must be source and feedstock-neutral while simultaneously ensuring the expansion of domestic production and a fair price for domestic suppliers.
The roadmap envisages that fiscal and financial measures are complemented by public investments that support next generation technology, while stabilising the existing value chain. The recommendations, therefore, focus on establishing a flexible logistics framework for transportation and storage of ethanol for blending (for example, creating a unified permits system for inter-state movement of ethanol) and creating a market for hybrid and flex fuel vehicles by encouraging automobile manufacturers and consumers to shift preferences.
Since the current pricing mechanism of ethanol for blending also results in supply shortfalls, it has been suggested that, besides rationalisation of the taxation framework for blending, the pricing mechanism must be dynamic and linked to existing market conditions Price setting must account for shifts in agricultural markets, transportation and transaction costs.
This paper, therefore, envisages that achieving blending rate targets must only be the first step in a broader shift towards an economy based on biofuels. For such a shift, it would be important to see India’s National Policy on Biofuels and the EBP Programme in the broader context of India’s public policy priorities. To that extent, this paper attempts to chart the history of biofuels in the country (and abroad) in Chapter I. This is followed by a comprehensive overview of existing regulatory and market barriers in the implementation of the fuel blending programme in Chapter II. Chapter III identifies potential economic, environmental and technological advantages that biofuels offer in achieving some of the public policy objectives set out by the Government of India. Furthermore, Chapter IV comprehensively looks at international best practice in this area and specifically looks at the experience of Brazil, the Philippines and the United States in so far as their implementation of fuel blending programs is concerned. Based on the above study of challenges and opportunities, Chapter V provides recommendations to existing barriers while providing a roadmap that establishes milestones for our transition to a biofuels based economy.

24
1. FUEL BLENDING: THE STORY SO FARGovernments across the world have faced significant problems in the transportation sector, ranging from improving energy security, bringing down vehicular emissions to reducing and mitigating Greenhouse Gas (GHG) emissions. This has led to renewed attempts to identify alternatives to fuels that presently dominate the transportation sector. These alternatives have ranged from Compressed Natural Gas (CNG) to Liquefied Petroleum Gas (LPG) and even electric vehicles. Since certain biofuels are liquid fuels that are largely compatible with existing vehicular technology, they are considered a viable alternative to fossil fuels (International Energy Agency, 2004). Worldwide, amongst biofuels, ethanol is the most widely used in transportation, with corn-derived ethanol being produced in the United States of America (USA) since the early 1980s and sugarcane-derived ethanol being produced in Brazil since the 1970s (International Energy Agency, 2004).
Biofuels first made their appearance in the 19th century when Samuel Morey developed an engine in 1826 that ran on ethanol and turpentine. Further, in the 1900s, ethanol production from corn was made feasible (Ethanol history, 2010-11; Western New York Energy LLC, 2016; Pacific Biodiesel, 2016). Until the 1940s, biofuels were considered to be viable transport fuels, but falling fossil fuel prices hindered their further development (International Energy Agency (IEA), 2011).
Interest in commercial production of biofuels for use in transportation was revived in the mid-1970s, when ethanol began to be produced from sugarcane in Brazil and then from corn in the USA. In most parts of the world, the growth in biofuel production has over the past decade been the fastest ever, supported by ambitious government policies aimed at mitigating environmental degradation and improving energy efficiency (International Energy Agency (IEA), 2011). It is evident from Figure 1 that the global biofuel market has increased from INR 1 trillion in 2005 to INR 6.5 trillion in 2013 and is expected to grow with a Compounded Annual Growth Rate (CAGR) of 14% during 2015 – 2020 (Sapp, 2016; Statista, 2014; OECD Library, 2015).
FIGURE 1: GLOBAL BIOFUEL MARKET
ETHANOL BIODIESELGLOBAL BIOFUEL MARKET
100
90
7
6
5
4
3
2
1
0
80
70
60
50
40
30
20
10
2005 2006 2007 2008 2009 2010 2011 2012 2013
INR/
LUTR
E
INR
TRIL
LIO
N
1.01.4
1.7
2.3
3.0
3.8
5.6
6.46.5

1st Generation• Derived from surplus edible plant produce. • Ethanol produced by fermentation.• Feedstocks: wheat, sugarcane, oil seeds.
4th Generation• Produced from algae that feed on captured and stored CO2.
3rd Generation• Produced from resilient organisms like algae, which can be grown using sunlight, CO2 and brackish water.
2nd Generation• Produced from non-edible crops.• Leads to change in land use
I II
III IV
25
1.1 DIFFERENT KINDS OF BIOFUELS
Biofuels, either in liquid form or gaseous form, are transportation fuels derived from renewable biological sources (International Energy Agency, 2004). Biofuels are commonly divided into first, second, third, and fourth generation biofuels.
First-generation biofuels are produced predominantly from food crops such as grains, sugar beet, and oil seeds. Some of the most common examples of first generation biofuels include sugarcane ethanol in India and Brazil, corn ethanol in the USA, rapeseed oil biodiesel in Germany, and palm biodiesel in Malaysia (Taylor, 2008). Advanced biofuels, i.e., the second, third and fourth generation biofuels, include biofuels based on feedstock like lignocellulosic biomass, which include cellulosic ethanol, biomass-to-liquid diesel, and bio-synthetic gas (International Energy Agency (IEA), 2011).
Second-generation biofuels are produced from lignocellulosic biomass, enabling the use of non-edible feedstocks, thereby limiting direct competition between resources necessary for food and those required for energy security. Second-generation biofuels can be further classified into biochemical or thermo-chemical based on the process used to convert the biomass into fuel. Second-generation ethanol or butanol is produced using biochemical processing. However, as explained subsequently in this paper, the commercial viability of second generation biofuels is still being debated.
Third-generation biofuels are high energy renewable feedstocks engineered from algae, which grow on non-arable land with limited water base, sunlight and carbon dioxide (CO2).
Fourth-generation biofuels produce sustainable energy by utilising captured and stored CO2. This carbon capture makes the biofuel production carbon negative rather than simply carbon neutral, as it is ‘locks’ away more carbon than it produces. A representation of the liquid biofuels is in Table 1.
Table 1: Representation of Biofuels
Biofuels can be divided into first-, second-, third- and fourth-generation biofuels, based on the source from which they are derived. While first generation biofuels are being promoted by several countries as sustainable alternative fuel, the commercial viability of next-generation biofuels is still being explored.

Bioethanol is generally produced through the fermentation of sugar present in various types of biomass1. The most efficient way to produce ethanol is to utilise biomass, which contains six-carbon sugars that can be fermented directly to ethanol. Sugarcane and sugar beets contain a substantial amount of sugar and are used prominently to produce ethanol through fermentation. In certain markets like the USA (which primarily uses corn) and through Europe (where wheat and barley are used), bioethanol is produced from the starch component of these grain crops (Larsen, Johansen, & Schramm, 2009).
Traditionally, ethanol has been used by the potable liquor industry. It also has significant chemical and industrial applications, which includes manufacture of pharmaceuticals, cosmetics, detergents, paints, and chemical intermediates such as polymers and plastics. The demand for ethanol to fulfil the country’s Ethanol Blended Petrol (EBP) Programme has led to an increase in the domestic demand for ethanol, resulting in increased competition between the sectors that use ethanol as a primary input.
1 Feedstocks for bioethanol include sugar-rich biomass, mainly sugar beet and sugarcane; Starch-rich biomass, grain (e.g., barley, wheat, corn, rice), potatoes, sorghum, cassava; and Cellulose-rich biomass, straw, wood (residues), corn cobs and stalks, grass, paper, etc.
26
1.2 ETHANOL AS A BIOFUEL
In India, the procurement of ethanol for blending from refined sugar and sugarcane juice is not permitted. Instead, the production process is based wholly on molasses which is a by-product of sugar manufacturing. The use of other non-food feedstocks like cellulosic and ligno-cellulosic materials, including the petrochemical route, is also gaining traction for the production of ethanol (Saon Ray, 2011).

Methyl tertiary-butyl ether or MTBE has almost exclusively been used as a fuel additive in motor vehicles. In recent years, however, MTBE has lost its popularity as it poses direct risks to the environment. Widespread oil spills and storage tank leaks have contaminated groundwater. The global demand for MTBEs has declined over the last decade in large developed markets such as the USA and Canada following its classification as a pollutant and its ban in blending with petrol.
27
1.2.1 PHYSICAL AND CHEMICAL CHARACTERISTICS OF ETHANOL
Characteristics Description MTBE Ethanol
Water Solubility (mg/l): Dissolving
potential in water
Solubility of oxygenates in
water is much higher than
that of the hydrocarbon
components of petrol
43000 to
54300Miscible
Partition Coefficient (Koc):
Tendency to adsorb into soil
particles from water
High adsorption slows the
travelling of the component in
the ground water flow.
1.0 to 1.1 0.20 to 1.21
Vapour pressure: Ability to
vaporise
Ability to vaporise from its
liquid form into the gas phase 245 to 256 49 to 56.5
Henry’s Constant (Kh):
Volatilisation from ground water
into soil gas
High Kh values facilitate
a component’s volatilisation
from ground water into soil
gas.
0.023 to 0.21 0.00021 to 0.00026
Biodegradability: capability of the
soil and ground water microbes
to break down a component.
Petrol hydrocarbons and
alcohols are relatively easily
biodegraded, whereas ether
oxygenates’ biodegradation
rates in natural conditions tend
to be lower.
1.09 1.04
Research Octane Number and
Motor Octane Number
Anti-knocking property of a
fuel
117 to
121 and
99 to 103
respectively
120 to 135 and 100
to 106 respectively.
Octane rating of
E0=87.4, E10=88.2,
E15=92.6, E30=94.4
Ethanol is classified as an oxygenate which helps improve fuel efficiency and control emissions. As ethanol is less toxic and cleaner in terms of reducing emissions, it is a preferred oxygenate vis-à-vis methyl tertiary butyl ether (MTBE) (Larsen, Johansen, & Schramm, 2009). This is why it has increasingly started replacing hydrocarbon octane sources such as MTBE and aromatics like benzene which are highly toxic and pose a significant risk to the quality of the air and the water making it unfit for human consumption. (Renewable Fuel Association, 2016). A comparison of the characteristics of MTBE and ethanol is shown in Table 2 (Environmental and Energy Study Institute, 2015; The European Fuel Oxegenates Association, 2002).
Table 2: Comparison of MTBE and Ethanol Characteristics

28
Property Ethanol Petrol E85
Octane No. (RON+MON)*/2 98 – 100 86 - 94 96
Lower heating Value (Kcal/kg.) 6393 10285 6950
Litre Equivalent 1.5 1 1.4
Km / Litre as Compared to Petrol 70% 100% 72%
Fuel Tank Size 1.5 1 1.4
Air/Fuel Ratio 9 14.7 10
Vehicle Power 5% more Standard 3 - 5% more
*RON-Research Octane Number, MON-Motor Octane Number
It is clear from Table 2 that ethanol vaporises faster and is highly miscible in groundwater. However, due to its high degradability, ethanol degrades faster than MTBE and hence prevents groundwater contamination. As MTBE does not biodegrade easily, it has led to the contamination of drinking water. Therefore, most states in the USA have banned its use and major oil companies shifted to using ethanol as an alternative, being a more sustainable and safer oxygenate (Renewable Fuel Association, 2016). Additionally, ethanol increases the Octane rating of the fuel promoting better combustion with reduced carbon monoxide (CO) emissions.
With a global increase in the use of Flex Fuel Vehicles (FFVs), ethanol is being used in greater proportions, by consumers with access to E85 and other flex fuels. With options up to E85 being more widely available at fuel stations in the USA, bioethanol has increasingly begun to gain traction as a mainstream fuel option for consumers (Renewable Fuel Association, 2016).
Biofuels, in general, are seen as advantageous, amongst other reasons, because they are a sustainable source of energy (Guarieiro, 2013). Similarly, it has been found that blending ethanol with petroleum fuels results in lower emissions of carbon monoxide, sulphur oxide, and particulate matter (International Energy Agency, 2004).
Use of biofuels such as ethanol also helps in saving a significant amount of foreign exchange, by diversifying the country’s energy basket (Ministry of Petroleum & Natural Gas, 2015). Production of biofuels also results in the creation of additional product markets for farmers, thus ushering in a new source of economic benefits and more employment opportunities to rural communities (International Energy Agency, 2004).
Table 3: Fuel Characteristics of Petrol, Ethanol and E85
Table 3 shows how higher octane value (Renewable Fuel Association, 2016) of ethanol improves the vehicular power, but specific fuel consumption increases with the increase in ethanol concentration in the fuel (Institute for Powertrains and Automotive Technology, 2014). This has further been discussed in Section 4.2.4 which deals with the concept of an ‘ethanol blend wall’.

Characteristics of ethanol: • Ethanol is a sustainable source of energy, increasing engine efficiency and power of petrol engines. • Diversification of the country’s energy basket contributes to varied sources for rural employment and therefore, economic growth.• The argument for the shift to bioethanol is strengthened by increased awareness of the adverse effects of MTBE on air and water quality. • The shift is further emboldened by an increase in the use of FFVs, globally.
29
Kind of Vehicle Fuel TypeEmission (%) Ethanol
CO HC NOX
Light/Private Vehicles Petrol 46.65 14.47 5.72
Flex Fuel 13.27 6.81 2.46
Heavy/ Commercial Vehicles Petrol 5.42 1.76 0.72
Flex Fuel 0.6 0.3 0.11
Motor Cycles Petrol 15.56 12.92 1.15
Flex Fuel 0.04 0.04 0.01
Specifically, ethanol promotes a higher tolerance for engine gas recirculation ratios, which reduces nitrogen oxides (NOx), hydrocarbons and carbon monoxide emissions in FFVs as shown in Table 4.
Table 4: Estimation of Emissions from Petrol and Flex-Fuel Vehicles
1.2.2 ENGINE PERFORMANCE
Ethanol blends significantly increase engine efficiency and power of petrol engines. Various studies attribute this increase in efficiency to ethanol’s superior fuel octane rating as compared to petrol (Larsen, Johansen, & Schramm, 2009).
Table 5 illustrates the specific consumption and engine efficiency for different ethanol blends as against petrol (Institute for Powertrains and Automotive Technology, 2014).
BIOETHANOL
ACCOUNTED FOR 74%
BIODIESEL
ACCOUNTED FOR 23%.
127.7 BILLION LITRES IN 2014
30
1.3 GLOBAL BIOFUEL PRODUCTION
Table 5: Fuel Consumption and Efficiency for Different Ethanol Blends
Fuel Type Specific Fuel Engine Efficiency (%)
E0 100.0 100
E5/10 101.1 101.8
E20/25 103.1 105.1
E30/50/70 111.0 105.4
E85 125.2 106.2
E100 140.3 109.1
As per the Planning Commission report released in 2003, ethanol blended with petrol provides better results as compared to its other substitutes such as methanol (Planning Commission, 2003). The vapour pressure and flammability of ethanol is lower as compared to that of petrol. These factors result in an overall reduction in emissions and hence minimise the risk of fire in the vehicles. One of the many advantages of ethanol is that it does not result in the formation of gum. Therefore, there is no requirement for the addition of anti-oxidants and other detergent additives. However, in stakeholder consultations, Mr. Atanu Ganguli, Senior Director General, the Society of Indian Automobile Manufacturers (SIAM) highlighted the importance of maintaining consistency in ethanol content in order to enable manufacturers to design engines with the matching blend of ethanol and also make the material used in the vehicle compatible to that blend. Inconsistent ethanol blends tend to harm the engine and reduce its durability.
Out of 127.7 billion litres of global biofuel production in 2014, bioethanol accounted for 74% and biodiesel (largely from fatty acid methyl ester (FAME)) for 23% of production, respectively. (Renewable Energy Policy Network for the 21st Century, 2015). Historical trends of global bioethanol growth in different countries along with projected estimates for the year 2020 are shown in Figure 2.
Figure 2 shows how the USA and Brazil have dominated the global ethanol market, accounting for over 80% of the ethanol production (Renewable Energy Policy Network for the 21st Century, 2015; Renewable Fuels Association, 2015).

31
FIGURE 2: GLOBAL BIOETHANOL GROWTH
YEAR 2000 YEAR 2010 YEAR 2020
10 20 30 40 50 60 70Billion Litres
USA
BRAZIL
CHINA
INDIA
EU
OTHERS
Figure 3 shows how global bioethanol production has increased from 50 billion litres in 2007 to 97 billion litres in 2015, registering a healthy growth of 9% per annum (Urbanchuk J. M., 2012; Renewable Fuel Association, 2016).
The European Union (led by Germany and France), China, Canada, and Thailand were some of the other countries with significant bioethanol production (Energy Information Administration, 2016). The Philippines followed a model of supporting the growth of domestic ethanol production while simultaneously fulfilling its blending mandate by procuring from global markets (International Trade Administration, 2015). While India experienced a 46% increase in fuel ethanol usage in 2014, the absolute use still remains lower than the requirements (Energy Information Administration, 2016). A country-wise analysis of fuel ethanol usage and integration as a transportation fuel is provided subsequently in Chapter 4 of this paper.
FIGURE 3: WORLD BIOETHANOL PRODUCTION2007 2008 2009 2010 2011 2012 2013 2014 2015
120
100
80
60
40
20
0
50
6777
88 89 93 97
85 82
Billi
on L
itre
s

32
1.4 HISTORY OF ETHANOL BLENDING IN INDIA
Maharashtra, Gujarat, Goa, Uttar Pradesh, Haryana, Punjab, Karnataka, Andhra Pradesh, Tamil Nadu, and four Union Territories - Chandigarh, Puducherry, Dadra & Nagar Haveli, Daman and Diu (Saon Ray, 2011). In 2003, however, the Planning Commission’s report recommended a phased implementation programme to blend biofuels with petrol and diesel.
During 2004-05, due to a supply shortage, the ethanol-blending mandate was made optional. However, it was resumed in 2006, and was further extended to Uttaranchal, Delhi, Himachal Pradesh, Madhya Pradesh, Chhattisgarh, Kerala, Rajasthan, West Bengal, Odisha, Bihar, and Jharkhand (Saon Ray, 2011) The entire north-eastern region, Jammu and Kashmir, and Andaman and Nicobar Islands were left out of the EBP Programme (Ministry of Petroleum & Natural Gas, 2015). In 2009, the National Biofuel Policy was announced, which mandated a phased implementation of ethanol blending in petrol in various states. The blending level of bioethanol at 5% with petrol was made mandatory from October 2008, and the National Biofuel Policy set out an indicative target of 20% blending of biofuels, both for bio-diesel and bioethanol, by 2017 (Saon Ray, 2011).
Amongst other things, the National Policy on Biofuels set out the following objectives: • To meet the energy needs of India’s rural population and create employment opportunities;• To address global concerns by tightening automotive vehicle emission standards to curb air pollution;• To reduce the dependence on import of fossil fuels, providing a higher degree of National Energy Security;• To derive biofuels from non-edible feedstock on degraded soils or wastelands unsuited to agriculture, avoiding a possible conflict between food and fuel;• Optimum development of indigenous biomass and promotion of next generation biofuels (Ministry of New & Renewable Energy, 2009).
In India, ethanol blending with petrol was recognised in the Power Alcohol Act, 1948 where the blending of molasses-based ethanol (power alcohol) with petrol was emphasised. The main objectives of the Act were to bring down the price of sugar, trim wastage of molasses and reduce dependence on petrol imports (G Basavaraj, 2012). After India’s economic liberalisation in 1990s, the Act was repealed in 2000.
In 2001, the feasibility of blending ethanol in petrol was examined with the launch of three pilot projects at Miraj and Manmad in Maharashtra and Bareilly in Uttar Pradesh (Naik, 2001).
The EBP Programme was launched in January 2003 for the sale of 5% ethanol blended petrol. The EBP Programme was launched in nine states -
Qua
ntit
y of
eth
anol
con
trac
ted
(mill
ionl
itre
s)
33
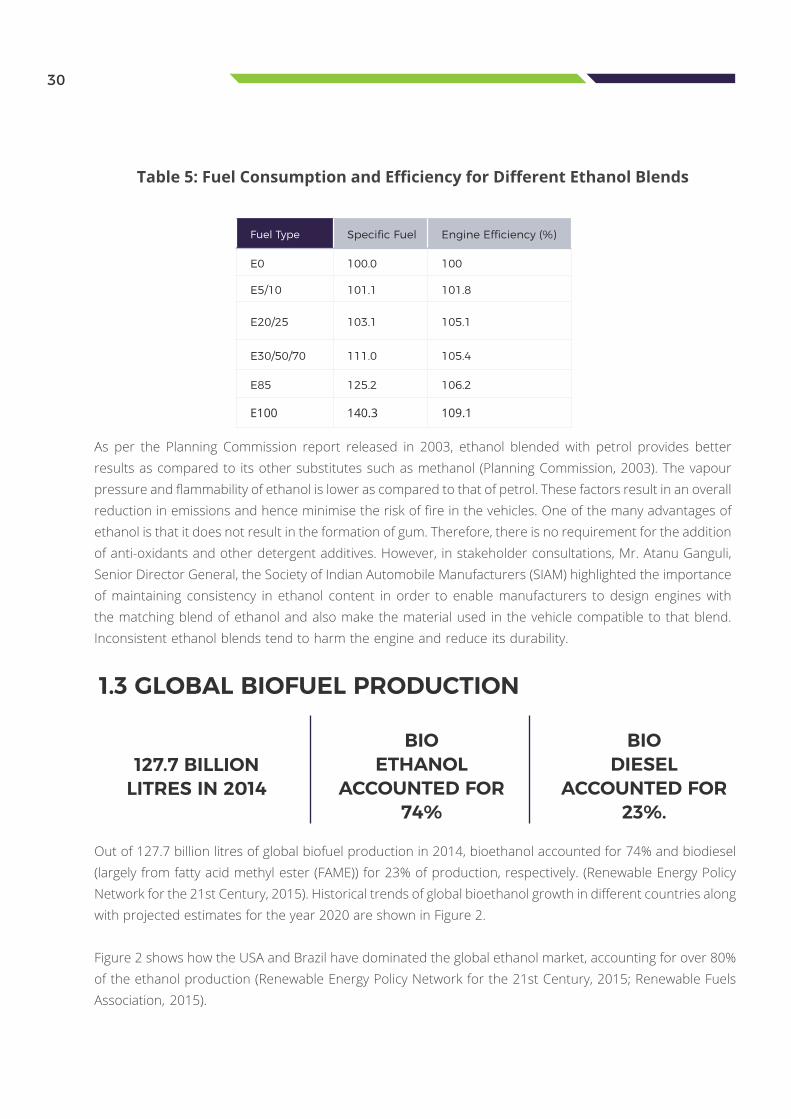
In 2010, the government fixed an ad-hoc provisional procurement price of INR 27 per litre for ethanol by Oil Marketing Companies (OMCs). A decision was taken to constitute an expert committee to determine the formula or principle for fixing the price of ethanol (Government of India-Ministry of Petroleum & Natural Gas, 2010). In 2012, the Cabinet Committee on Economic Affairs (CCEA) decided that a stable EBP Programme would ensure sustainable benefits for sugarcane farmers across the nation, and the 5% mandatory ethanol blending with petrol should be implemented across the country and that the purchase price of ethanol would be decided between OMCs and the suppliers of ethanol (Aradhey, 2013). A Gazette Notification was issued, directing OMCs to sell ethanol blended petrol with percentage of ethanol up to 10% and as per the Bureau of Indian Standard (BIS) specifications (Ministry of Petroleum and Natural Gas, 2015).
In 2014, in order to offer OMCs and suppliers clear signals, the CCEA fixed ethanol prices based on the distance of the mill/distillery from the OMC depot/installation (Cabinet Committee on Economic Affairs (CCEA), 2014).
In April 2015, the 12.36% central excise duty levied on ethanol supplied for blending with petrol for the upcoming season (October-September) was removed, and the price benefit for the same was to be passed on to the sugar mills/distilleries (Economic Times, 2015). In August 2016, this excise duty concession was withdrawn (Mukherjee, 2016).
In October 2016, the CCEA revised the pricing policy for the period 2016-2017 wherein the administered price of ethanol was revised to INR 39 per litre (Cabinet Committee on Economic Affairs (CCEA), 2016).
Figure 4 shows the change in pricing decisions with respect to the EBP Programme and corresponding ethanol supply for the programme by members of the Indian Sugar Mills Association (ISMA) (Shree Renuka Sugars, 2015). It is clear that the exemption from central excise duty is reflected in the substantial increase in quantity contracted.
FIGURE 4: ISMA CONTRACTED AMOUNTS FOR ETHANOL BLENDING
1800
1600
1400
1200
1000
800
600
400
200
0 2011-12 2012-13 2013-14 2014-15 2015-16
Exemption from Central Excise Duty
Changed to fixed price policy. Price not linked to crude
Changedto market driven
price
Fixed price
413.9
382.2 300.6
674.1
1200

34
The Government of India has also prioritised second generation biofuels produced from jatropha and other agricultural residues like bagasse, rice and wheat straw, bamboo, cotton stalk, corn stover and wood chips. However, as stated during our stakeholder consultations with Mr. Subodh Kumar, General Manager, Indian Oil Corporation Limited, their viability and potential for scaling needs to be analysed further (Ministry of Petroleum & Natural Gas, 2014).
While significant steps have been taken towards improving ethanol blending ratios, the EBP Programme continues to face significant challenges. These have been discussed in the following chapters.
A chronology of history of ethanol blending in India since 2001 is shown in Table 6.
Table 6: Snapshot of the History of Ethanol Blending in India
Cabinet Committee on Economic Affairs (CCEA) decides purchase price of ethanol would be decided between the OMCs and the suppliers of ethanol
2012
Launch of Ethanol Blended Petrol (EBP) Programme for sale of 5% ethanol blended petrol in 9 states and 4 union territories
2003
Launch of three pilot projects at Miraj and Manmad in Maharashtra and Bareilly in Uttar Pradesh to examine the feasibility of ethanol blending
2001
Central excise duty exemption removed.
Price of ethanol revised to INR 39 per litre for the 2016-17 sugar season
2016Price of ethanol fixed depending upon the distance of sugar mill from the depot/installation of the OMCs
2014
Relaunch of EBP Programme in 20 states and 4 union territories
2006
National Biofuels Policy released 2009
Provisional ad-hoc procurement price of ethanol set at INR 27 per litre
2010
Central excise duty levied on ethanol supplied for blending with petrol exempted
2015
35
2. CHALLENGES TO INDIA’S EBP PROGRAMME
In 2009, 5% mandatory blending of ethanol with petrol was reiterated by the CCEA. However,
notwithstanding the fact that blending mandates were laid down by the government, even
today blended petrol is available only in 13 states (Government of India, 2014).
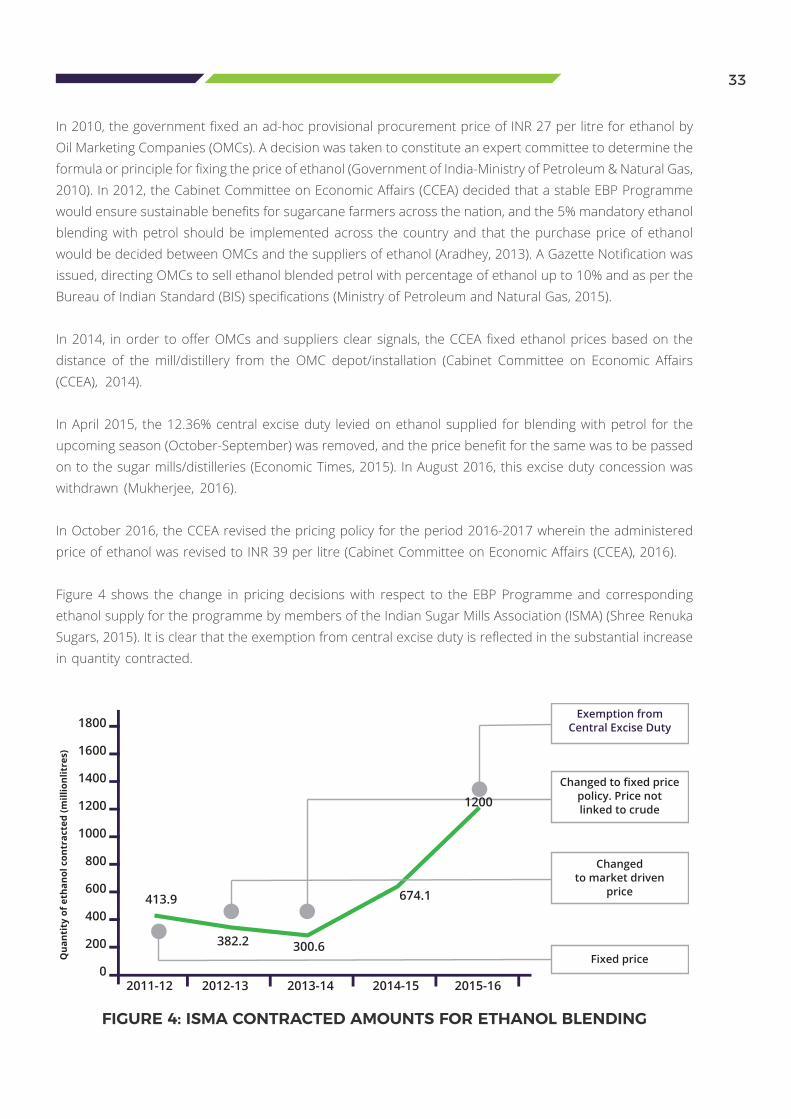
As of 2014-15, the OMCs achieved an average blending percentage of only 2.3% (Ministry of Petroleum & Natural Gas, 2016). It was projected that India would achieve the target of 5% blending by September 2016, far below the projected target of 20% set in the National Policy on Biofuels (Jha, 2016).
However, it is unfortunate that the EBP Programme which sought to diversify India’s fuel basket and reduce emissions has been hamstrung by regulatory and market barriers that hamper ease of doing business in this sector. This section of the paper provides an overview of the gaps in programme implementation and outlines the need for a comprehensive and coherent policy framework to achieve the various priorities of the government of India in this regard. Figure 5 shows how between 2008 and 2015, the maximum achieved blending rate was been less than half of the minimum percentage of blending envisaged during the EBP Programme.
FIGURE 5: ETHANOL CONSUMPTION AND BLENDING RATIOS IN INDIA
Cons
umpt
ion
(Bill
ion
Litr
es) Blending (%
)
2008 2009 2010 2011 2012 2013 2014 2015
0.8
0.7
0.6
0.5
0.4
0.3
0.2
0.1
0.0
1.81.8
0.6
0.3
1.4
1.6
1.4
2.3
FUEL ETHANOL (BILLION LITRES) BLEND RATE %

36
2.1 CENTRE-STATE COORDINATION
2.1.1 PROCEDURAL DIFFICULTIES IMPACTING PROGRAMME IMPLEMENTATION
Across the EBP Programme’s value chain, the following procedural difficulties are significant barriers to supply and procurement:
• Procedural formalities for obtaining various licenses from different authorities; • Quarterly permissions mandated by excise departments; • Requirement of and delay in the issuance of No Objection Certificates (NOCs) and other permits for inter-state movement of ethanol;• Export permits only issued for one month at a time, leading to wastage of time for procuring permits frequently; • Lack of uniformity in the taxes/duties levied by different States.
Apart from this, sugar mills have the additional responsibility of obtaining these NOCs from OMCs for consignments that are then required to be channelled through various state administrative offices. Due to procedural difficulties faced by the sugar mills in this process, their ability to supply required quantities of ethanol in time is hindered and puts them at the risk of forfeiture of guarantees for non-fulfilment of orders (Ministry of Petroleum & Natural Gas, 2015).
However, it must be noted that despite attempts at improving coordination between the union and the states, there has been limited traction in creating a unified and integrated framework to address these issues (Ministry of Petroleum & Natural Gas, 2015).
2.1.2 INCONSISTENT TAXATION FRAMEWORK
Due to the inconsistency of ethanol supply in most states, inter-state movement of ethanol plays an important role in ensuring its availability across different states in the country. One of the major problems being faced by OMCs and ethanol suppliers is the varying structure of taxes and duties levied by the states. For the inter-state movement of ethanol, dispatching states levy an export fee while the receiving state levies an import fee. In our stakeholder consultations with Mr. Abinash Verma, Director General, ISMA, it was highlighted that the extent of these duties varies from state to state, thus leading to further difficulties for OMCs and the suppliers (Table 7). The absence of standardisation in tax rates for inter-state movement of ethanol makes ethanol availability uneven across different states, resulting in difficulties in implementing the blending mandate. Moreover, since ethanol is not available in all states, the implementation of these duties discourages seam less inter-state movement of ethanol for blending purposes and the creation of a unified national market.

37
Table 7: Duties and Taxes Imposed by States for Ethanol Transport in India
8.0
IMPORT1.0
HARYANA
5.50
5.50
TAMIL NADU
ANDHRA PRADESH
WEST BENGAL
KARNATAKA
MAHARASHTRA
GUJARAT
0.50
1.50
0.30
5.000.50
5.00
1%
0.56
KERALA
1.50
1.0
0.25
2.0
1.10
1.50
5.00
1.50
3.0
1.0
RAJASTHAN
1.0
MADHYA PRADESH
JHARKHAND
BIHAR
UTTAR PRADESH
DELHI
UTTARAKHAND
PUNJAB
1.0
0.50 0.15
0.150.80
IMPORT DUTY (INR / Litre)
KEY
EXPORT DUTY (INR / Litre)
VAT ON INTRA-STATE MOVEMENT (%)
TRANSPORT FEE
%
ENTRY FEE
ADMINISTRATIVE CHARGES
PURCHASE TAX ON INTRA-STATE MOVEMENT
LICENSE FEE
DENATURANT FEE

38
2.1.3 LEGISLATIVE AND ADMINISTRATIVE ISSUES
As mentioned above, under the current tax regime, states levy an import duty and export duty on inter-state movement of goods. In May 2016, an amendment to the Industries (Development and Regulation) Act, 1951 was passed as a consequence of which the authority to regulate ‘potable alcohol’ was transferred to states. (Government of India, 2015).
The First Schedule of the Act lists industries where the Union is competent to regulate. The amendment clarified that “fermentation industries (other than potable alcohol)” would remain under the control of the union, while states would have the power to regulate fermentation industries relating solely to potable alcohol. (The Gazette of India, 2016).
Table 8: Legal Framework for Ethanol Blending in India
Thus, the states exercise jurisdiction only over potable alcohol i.e. alcohol fit for human consumption, while regulation and taxation of fuel ethanol would be kept outside the purview of states and within the jurisdiction of the centre (Ministry of Petroleum & Natural Gas, 2015).
Sl. No. Legal Framework Impact
1.The Industries (Development and
Regulation) Amendment Act, 2016
“Fermentation Industries (other than potable
alcohol)” was inserted in the First Schedule which
lists industries under the control of the Union.
2.
Entry 51 of List II of the Constitution Duties of excise on the following goods
manufactured or produced in the State and
countervailing duties at the same or lower rates
on similar goods manufactured or produced
elsewhere in India:-
(a) alcoholic liquors for human consumption
Entry 52 of List I of the Constitution Industries, the control of which by the Union is
declared by Parliament by law to be expedient in
the public interest.
Entry 97 of List I of the Constitution Any other matter not enumerated in List II or List
III including any tax not mentioned in either of
those Lists.

39
Overall, the institutional framework in India to execute the EBP Programme is not integrated. There are a number of government bodies or ministries involved in the entire process of ethanol blending. All these ministries oversee specific aspects of the overall programme, limiting the scope of comprehensive interventions in terms of implementation.
For instance, the Ministry of Food, Consumer Affairs and Public Distribution is responsible for setting standards for biofuels, the Ministry of Agriculture is responsible for the research and development for sugar and alcohol production whereas the state governments are responsible for overall agricultural policy (including the permits for the establishment of new sugar mills). The Ministry of Petroleum and Natural Gas, Ministry of New and Renewable Energy, and Ministry of Road Transport and Highways are also involved in decision making of some or the other aspects of this programme. The mechanism for seamless and timely inter-ministerial coordination is ambiguous and lacks consistency. The following Table 9 provides a division of the roles of the various stakeholders in the overall implementation of the EBP Programme.
Sl. No. Legal Framework Impact
3.
Synthetics & Chemicals v. State of Uttar
Pradesh
The State Legislature had no authority to levy
duty or tax on alcohol which is not for human
consumption as that could only be levied by the
Centre.
Bihar Distillery &Ors. v. Union of India
&Ors.
Where the removal is for industrial purposes (other
than the manufacture or potable liquor), the levy
of duties of excise and all other control shall be of
the Union but where the removal/clearance is for
obtaining or manufacturing potable liquors, the levy
of duties of excise and all other control shall be that
of the States.
4.
Environment Protection Act, 1986 & Air
(Prevention and Control of Pollution) Act,
1981
Empower the central government to frame rules to
prevent environment degradation and air pollution.

The EBP Programme’s implementation is fragmented and a variety of organisations and ministries are responsible for different aspects of the Programme, both at the Centre and the State level. The lack of consistency limits the potential of the EBP Programme.
40
Table 9: Roles of Various Stakeholders in the EBP Programme
Ministry of Petroleum and
Natural GasResponsible for pricing,
supply distribution, marketing of ethanol, and setting blending targets.
Ministry of New and Renewable
EnergyOverall coordination concerning biofuels
which includes research on the efficacy of the
existing biofuels policy, and research on next-generation
feedstocks.
Ministry of Road Transport and
HighwaysResponsible for laying
down emissions norms for ethanol-blended
vehicles, and encourage optimisation of engines
in line with newer technologies.
Ministry of Agriculture
Development and research on sugarcane in
coordination with the Indian Council on
Agricultural Research and Indian Institute of
Sugarcane Research.
Ministry of Environment and
Forests Monitor the public health
and environmental benefits from increased use of ethanol blends
vis-à-vis petroleum fuels.
Ministry of Consumer Affairs,
Food and Public Distribution
Laying down specifications, standards and codes and ensuring
quality control of bio-fuels for end uses.
NITI AayogProvide policy
recommendations in coordination with
independent research organisations to MNRE
on the National Policy of Biofuels as well as sustainable and
achievable targets for the EBP Programme.
State governments
Relax and ease procedures relating to inter-state movement and supply of ethanol and establishment of
sugar mills.
GOVERNMENT

41
Society for Indian Automobile
ManufacturersCoordinate with individual
automobile manufacturers as well as MoRTH in order to
optimise engines suitable for the required ethanol blends as
well in consonance with the prevailing emission norms.
Coordinate and represent to MoRTH technical information
on ideal ethanol blends in order to maximise engine
efficiency.
Indian Sugar Mills Association
Responsible to ensure consistent supply of
ethanol to OMCs as well as ensuring that sugar
mills remunerate farmers on time.
Oil Marketing Companies
Procurement guarantee of ethanol supplied by the sugar mills in order
to achieve the mandated blending rate.
Establishment of refineries in different
parts of the country for blending through existing
technologies as well as refineries for blending
through next-generation technologies.
INDUSTRY
Indian Institute of Sugarcane
Research Identify technology and
measures to improve the efficiency and yield of ethanol
production from existing sources and feedstocks. In collaboration with MNRE,
research into identification of the most efficacious
next-generation technologies available and suitable for
ethanol production as well as measures to improve.
Indian Council of Agricultural
ResearchResearch on sugarcane in coordination with the Ministry of Agriculture.
The Energy Resources Institute
Research on next generation technologies
for the production of ethanol.
RESEARCHINSTITUTES

42
2.2 ETHANOL PRICING
At present, given the strong linkage of the EBP Programme to the domestic sugar industry, the price of ethanol is impacted by the price of sugarcane and the demand for sugar. The The fair and remunerative price (FRP) is first set by CCEA, Government of India, to fix the minimum or base price of sugarcane, which the sugar mill owners have to pay to sugarcane producers. The State Advised Price (SAP) is set by state governing bodies, which results in a wide variation in the prices of molasses and sugarcane from state to state. The price of production of sugarcane varies from state to state owing to variation in soil quality, climate, fertilizer requirement, water availability and productivity level, based on which the state governing bodies decide on the SAP. This pricing mechanism is further complicated by varying rates of taxation across every ethanol producing state (Table 7).
In order to meet the ethanol demand for blending, OMCs float annual tenders for ethanol procurement. However, the procurement price ceiling is decided by the OMCs and the quantity of ethanol that is ultimately offered to OMCs substantially differs from the quantity tendered. This is primarily because the price quoted by sugar mills is usually higher than the price set by OMCs. For example, in 2014, the first tender was floated in January and the price at which ethanol was purchased was in the range of INR 39-42 per litre, which was within the range of the price ceiling set by the OMCs i.e. INR 44 per litre. Because of this price ceiling set by the OMCs and the inconsistency with the price quoted by the sugar mills, OMCs rejected around 360 million litres of ethanol from sugar mills (Saon Ray, 2011).
In December 2014, the Government of India adopted a fixed pricing policy for bioethanol where the price range was set between INR 48.5-49.5 per litre, which was nevertheless 20% more than the then existing cost to Indian refineries for producing petrol (refer Annexure), given the prevailing low price of crude (Press Trust of India, 2016).
Table 10 shows the prices at which ethanol has been procured by the OMCs in the last decade (Ministry of Petroleum & Natural Gas, 2015; Ministry of Petroleum & Natural Gas, 2016).

43
Table 10: Ethanol Procurement Quantities and Prices
2006-07
2014-15
2009-10
2015-16
2010-11
2012-13
2011-12
2013-14
Actual Procurement (Million Litres) - 587Procurement Price/Litre - 21.5
Actual Procurement (Million Litres) - 360Procurement Price/Litre - 27
Actual Procurement (Million Litres) - 550Procurement Price/Litre - 27
Actual Procurement (Million Litres) - 0Procurement Price/Litre - 27
Actual Procurement (Million Litres) - 260Procurement Price/Litre - 27
Actual Procurement (Million Litres) - 674Procurement Price/Litre - 48.50 - 49.50
Actual Procurement (Million Litres) - 470Procurement Price/Litre - 39.45
Actual Procurement (Million Litres) - 1330Procurement Price/Litre - 48.50 - 49.50

44
Till 2012-13, prices of ethanol were determined at the sugar mill gate and transportation charges and taxes were reimbursed separately. From 2013-14 onwards, transportation costs have been factored in, and the OMC gate prices are being considered instead.
Even so, the benchmark price set by the OMCs is one of the major reasons for the deficit in ethanol supply. Often, sugar mills have produced sufficient ethanol to meet the purposes of blending with petrol but the difference in the price demanded by sugar mills and the benchmark price set by OMCs is usually too high. This discourages sugar mill owners from diverting ethanol produced by them for fuel blending. From our stakeholder consultations with Mr. Abinash Verma, Director General, ISMA, it was stated that a significant problem plaguing the sector is the delay in payments to sugar mills by OMCs which results in a financial deficit for the sugar industry. These two issues together make them reluctant to supply ethanol for blending.
In November 2012, the CCEA decided that the import of ethanol would be allowed in order to meet the shortfall in domestic supply. In pursuance of this, the OMCs floated tenders for the procurement of ethanol. However, owing to severe drought in the USA which reduced corn yields, and resulted in high prices of corn, ranging between INR 69.45 to INR 91.98/litre, these orders were never finalised. In comparison, domestically produced ethanol was available at a price of INR 27 per litre in the same period.
The CCEA subsequently decided that in light of the high price of imported ethanol, it would be procured from domestic sources (Ministry of Petroleum & Natural Gas, 2015). Therefore, as the situation stands, imported ethanol is not allowed for blending with petrol unless government-owned petroleum companies float an expression of interest/global tender and ethanol exporter bids are competitive when compared with domestic prices.
2.3 SOURCING OF ETHANOLThe poor blending ratios highlighted in Figure 5 are mirrored by the fact that OMCs have consistently fallen short in being able to procure the domestic ethanol supply necessary to meet the EBP Programme’s requirements by significant amounts (over 60%, as per Table 10). This is owing to various reasons such as pricing mismatch, inadequate supply or number of offers, ineffective tendering mechanisms etc. (Ministry of Petroleum & Natural Gas, 2015). Table 11 highlights these aspects.
2006-09 2009-10 2010-11 2011-12 2012-13 2013-14
Oil Industry Requirement
(Million Litre)1820 690 1050 1010 1030 1400
Quantity Finalized (Million Litre) 1470 280 550 410 320 650
Actual Procurement (Million Litre) 587 550 360 260 0 470
% of Required Quantity 32 8 34 26 0 34
Procured Price INR/Litre
(Sugar factory gate price)21.5 27 27 27 27 * 39.5
* 2013-14 price is at the OMC gate, whereas other prices are exclusive of transportation costs
Table 11: Ethanol Requirements and Purchases by OMCs

2 As against this, OMCs required approximately 1330 million litres of ethanol to achieve 5% blending
Currently, domestic ethanol capacity stands at approximately 2240 million litres annually. There are 130 sugar mills that produce the bulk of ethanol (close to 2000 million litres) and another 240 million litres are produced by standalone distilleries.
45
Currently, domestic ethanol capacity stands at approximately 2240 million litres annually. There are 130 sugar mills that produce the bulk of ethanol (close to 2000million litres) and another 240million litres are produced by standalone distilleries. In the period 2012-14, against the tender requirements floated by the OMCs for a total of 2979 million litres, offers were received for only 1221.7 million litres. Out of this amount, only 703.7 million litres was finalised2 (Ministry of Petroleum & Natural Gas, 2015).
In comparison, most of the country’s crude oil demands are met through imports and given that the demand for petroleum in the country has been increasing annually, India will have to continuously increase its expenditure on imports as well as production.
It is expected that prices of crude oil will steadily rise as oversupply tapers in the future (Deloitte, 2016). Going forward, the demand for petrol and its corresponding demand for crude oil is calculated in Table 12 (Ministry of Petroleum and Natural Gas, 2016).
YearCrude Price (WTI Spot) $
per barrel
Crude
Price(INR/
Litre)
Petrol Demand
(Million litres)
Crude Required
(Million litres)*
2016-17 47 19.7 30,649 67,733
2017-18 49 20.5 33,280 73,548
2018-19 55 23.1 36,075 79,725
2019-20 63 26.2 39,042 86,283
2020-21 70 29.3 42,191 93,243
2021-22 75 31.4 45,659 1,00,908
*1 barrel of crude oil yields approximately 19 gallons of petrol (U.S Energy Information Administration,
2015)
Table 12: Projected Crude and Petrol Demands
It is clear that the crude oil prices and petroleum demand in the country is expected to increase by around 1.5 times the current market situation, which could significantly inflate trade deficits. A boost to the EBP Programme can therefore impact this equation significantly help in reducing the country’s exclusive dependence on petrol.
The quantity of ethanol required to meet different blending ratios each year has been calculated and set out in Table 13.

46
Based on an assessment of historical growth of molasses production (Indian Sugarmills Association), we estimate that ethanol supply will grow at a CAGR of 3.2% till 2021-22 as per current policies (Indian Sugarmills Association, 2016). The industrial and potable sectors are expected to grow at 3.5% and 3% respectively (Saon Ray, 2011).
That said, at the current blending target of 5%, local ethanol supply is still insufficient to meet even this benchmarked demand, especially since ethanol is also required by other important sectors like the industrial chemicals and potable liquor industries (Table 14).
YearPetroleum
DemandE5 Demand E10 Demand E15 Demand E20 Demand
2016-17 30,649 1,532 3,065 4,597 6,130
2017-18 33,280 1,664 3,328 4,992 6,656
2018-19 36,075 1,804 3,608 5,411 7,215
2019-20 39,042 1,952 3,904 5,856 7,808
2020-21 42,191 2,110 4,219 6,329 8,438
2021-22 45,659 2,283 4,566 6,849 9,132
All values are in million litres
Table 13: Projected Blending Ethanol Demands
Year Supply Blending* Industrial Potable Total Demand Deficit % Deficit
2016-17 2,993 1,532 1,252 1,030 3,815 822 21%
2017-18 3,089 1,664 1,296 1,061 4,021 933 23%
2018-19 3,187 1,803 1,342 1,093 4,238 1,051 25%
2019-20 3,289 1,952 1,389 1,126 4,466 1,177 26%
2020-21 3,395 2,109 1,437 1,159 4,706 1,311 28%
2021-22 3,503 2,283 1,487 1,194 4,964 1,461 29%
*Ethanol demand is projected using the expected growth in petrol demand in the given period
All the quantities above are in million litres. CAGR of ethanol -3.2%
Table 14: Projected Supply and Sector-Wise Demand of Ethanol in India

47
From Table 14, a deficit of 1,461 million litres (29%) is projected by 2022 at a blending rate of 5%. Therefore, it will be difficult to completely meet the domestic ethanol demand across the board in the future, unless we realign our policy and liberalise ethanol production and procurement. The market stress is already beginning to be felt as chemical industries have begun approaching the courts alleging that sugar mills are colluding with the OMCs to divert ethanol for the purposes of blending (Economic Times, 2014). The Supreme Court is currently adjudicating a case filed by India Glycols alleging collusion between sugar mills and OMCs that has restricted supply to the chemical industry.
2.4 TRANSPORTATION AND STORAGETransportation costs continue to be a significant barrier to incentivising supply of ethanol for EBP Programme. Though the distance between suppliers and blending points is an important factor in the mechanism for determining the price of ethanol being supplied, the mechanism for pricing ethanol does not factor in distances beyond 450 kms. Therefore, sugar mills cannot recover the cost of transporting ethanol beyond 450 kms. A vexing problem, especially since ethanol has to be transported from high sugarcane yielding states to states with very limited capacities and this is a primary reason for the poor response by sugar mill to tenders floated by the OMCs. Since sugar mills regularly supply to destinations over 500kms away, the price fixed by the government based on distance proves to be a loss-making project for the sugar mills.
As mentioned earlier, sugar mills and sugarcane plantations are not uniformly distributed across the country. States like Uttar Pradesh and Maharashtra have a higher capacity and are amongst the highest sugarcane-producing states (Table 32). Therefore they are capable of meeting the ethanol demand for blending within their states. However, states like Rajasthan and Madhya Pradesh do not have sufficient sugarcane production to meet both the food and industrial demands of sugar and alcohol, respectively.
In order to achieve a uniform blending percentage across the country, it is required that ethanol is made available in sufficient quantity for which transportation of both the raw material (molasses/sugarcane) or the intermediate product must be made more efficient and less cumbersome. For example, if the EBP Programme is to branch out to the North-eastern region, transportation costs would require to be rationalised as the north-east of India has no sugarcane cultivation.
The difficulties in transportation are further exacerbated by inadequate storage facilities at sugar mills. The absence of adequate storage capacity means sugar mills have to suffer demurrages while waiting to deliver ethanol to OMCs. OMCs take delivery of ethanol only to the extent to which they require at a point in time, rejecting any excess supplied by sugar mills (Ministry of Petroleum & Natural Gas, 2015-16). In this context,
In order to achieve a uniform blending percentage across the country, it is required that ethanol is made available in sufficient quantity for which transportation of both the raw material (molasses/sugarcane) or the intermediate product must be made more efficient and less cumbersome. For example, if the EBP Programme is to branch out to the north-eastern region, transportation costs would require to be rationalised as the north-east of India has no sugarcane cultivation.

48
OMCs stated that since their storage capacity is limited to meeting blending requirements for periods of 15-35 days at a time, they are unable to build buffer stocks for the future for periods in time that extend beyond this limit. (Ministry of Petroleum & Natural Gas, 2015).
Lastly, the procedural delay in obtaining permits and licenses for ethanol transportation and storage also lead to inefficiencies in the EBP Programme. Most states have short validity periods for their permits and licenses for transporting ethanol. This makes it tedious for transporters who have to renew their licenses frequently. This is exacerbated by the fact that the procedures for renewal are time-consuming and adds to the delay in supply of ethanol to the importing state. For example, in Uttar Pradesh an export permit is only valid for 30 days (Saon Ray, 2011). Similar is the case with Tamil Nadu and other ethanol-rich states that are major exporters to other states.
2.5 MARKET HURDLES
Transportation costs for distances exceeding 450 kilometres were not factored into the pricing of ethanol, which hindered the achievement of a uniform level of blending across the nation by discouraging inter-state movement of ethanol. Inadequacy in storage facilities further inhibits transportation of large quantities of ethanol between sugar mills and OMCs.
Ethanol in India is primarily used in three sectors – 45% is used in the potable liquor sector, 40% is used in the alcohol-based chemical industry while the remaining is used for blending with petrol and other purposes (Saon Ray, 2011).
The potable liquor industry has a market value of INR 300 billion and has had consistent growth of approximately 7-10% annually (Saon Ray, 2011). The alcohol-based chemical industry on the other hand is estimated to be worth approximately INR 45000 million with around 20 facilities engaged in the manufacture of chemicals (Saon Ray, 2011).
In this context, sugar mills lack incentives for fuel ethanol due to high demand of ethanol from other profitable sectors which significantly hinders the progress of the EBP Programme (Ministry of Petroleum & Natural Gas, 2015).

49
Another challenge to be overcome in order for the EBP Programme to succeed is resolving the various market anomalies that are part and parcel of the industry today, including irregular payment cycles to farmers by sugar mills. Farmers are often not paid on time (or not paid at all) by the mill owners and middlemen, especially when sugar is hoarded to be appropriately traded in a speculative market. As a consequence, farmers are unable to continue to cultivate sugarcane in an economically sustainable manner.
For example, over the last 4-5 years, despite a surplus production of sugarcane, the price of sugarcane has been rising. The sugarcane surplus resulted in a sugar surplus, leading to a free-fall in local sugar prices. This severely affected the financial condition of most of the mills, resulting in significant arrears in payments to farmers. In 2015, sugar prices had fallen while sugarcane prices had gone up by more than 50% since the 2009-10 crushing season (Economic Times, 2015).
As illustrated in Table 15, due to such drastic fluctuations in the price of sugarcane and sugar over the last few years, there are many mill owners who are yet to clear the dues to farmers, even in the year 2013-14 and earlier (Ministry of Consumer Affairs,Food and Public Distribution, 2016). The longer such cycles last, the greater is the debt owed to sugarcane growers by mill owners.
It is observed that most of the states still owe farmers payments from the year 2013-14 (Table 15) which is one of the reason why sugarcane farmers are often constrained to shift to other crops.
Based on the discussion presented above, the following conclusions can be drawn: firstly, the EBP Programme is currently closely linked to agricultural policy and agricultural markets. This has resulted in inconsistent supply cycles and perennial shortfalls; secondly, demand for ethanol from other sectors (non-blending) will continue to grow; thirdly, the nature of problems faced by the sector is often inter-linked, such that they reinforce one-another. An integrated approach that is centrally coordinated, which retains a limited flexibility at the state-level to accommodate identified diversities is necessary to solve these challenges. Therefore, meeting the EBP Programme targets will require us to revamp production and procurement policies and practices, which limit access to raw material essential for blending.
The profitability of applications of ethanol in the alcohol and chemical industries disincentivises sugar mills to supply ethanol to OMCs for the purposes of blending.
Further, a price mismatch between sugarcane and sugar over the past 5 years has adversely affected the financial conditions of sugar mills, and consequently of sugarcane farmers.

50
State 2013-14 2014-15 2015-16 Total
Punjab - 0.1 46.6 46.6
Haryana - 1.1 45.2 46.3
Rajasthan - - - -
Uttar Pradesh 11.2 59.9 729.4 800.6
Uttarakhand 2.5 3.5 36.3 42.3
Madhya Pradesh 1.3 - 17.8 19.1
Gujarat 1.3 0.1 48.6 50.1
Maharashtra 8.1 25 313.40 346.5
Bihar 4.1 2.9 - 7
Andhra Pradesh - 3.9 33 37
Telangana - 1.2 - 1.2
Karnataka 31.2 29.5 - 60.8
Tamil Nadu 27.8 31.8 69 128.6
Odisha 0.3 0.1 2.9 3.2
West Bengal - 0.2 - 0.2
Puducherry 0.9 - - 0.9
Goa - - 0.2 0.2
Chhattisgarh - - 4.4 4.4
Total 88.9 159.2 1346.9 1595
All numbers in INR (in million)
Table 15: Payments Due by Sugar Mills to Farmers

India has initiated significant measures to counter the growth of vehicular emissions. These include: • Phased implementation of Bharat Stage emission standards to regulate vehicular emissions (Central Pollution Control Board, 2016).• The Auto Fuel and Vision Policy 2025 advocated for the increased use of alternative fuels in order to reduce impact on the environment (Government of India, 2014).
51
3. BIOFUELS: OPPORTUNITIES AND BENEFITS
Various studies have found that the production of first-generation biofuels from existing feedstock results in a 20-60% emission reduction in comparison to fossil fuels, excluding carbon releases from land-use change (Food and Agricultural Organization (FAO), 2008). However, there are significant differences in the amount of GHG reduction for different feedstocks, be it corn, sugarcane or sugar beets. Studies have found that the reduction of GHG emissions per kilometre varied from about 30% for grain ethanol in the European Union (EU), up to 50% for corn ethanol in the USA to 40% for sugar beet in the EU and 93% for sugarcane in Brazil (Steenblik, 2007; Mueller, 2016). Ministry of Statistics and Programme Implementation (MoSPI) acknowledges that the burning of petroleum by the
3.1 ENVIRONMENTAL BENEFITS
Therefore, an all-round increase in the use of ethanol has the potential to play a significant role in reducing emissions from the transportation sector and is one of the reasons why India had established ambitious
transport sector “significantly contributes” towards global warming, and also labelled transport the fastest-growing emission sector (Ministry of Statistics and Programme Implementation, 2015).
At the COP21 summit, India announced plans to cut its CO2 emissions per unit of GDP by as much as 35% from 2005 levels by 2030 (United Nations Framework Convention on Climate Change, 2015). In furtherance of its Nationally Determined Contributions, special focus is being paid to the energy-related sectors by the Ministry of Environment, Forests and Climate Change (MoEFCC), which is responsible for over 80% of India’s GHG emissions.
Worldwide, ethanol is the most widely used biofuel in transportation (Renewable Energy Policy Network for the 21st Century, 2015). There are many reasons for this, including environmental benefits, health benefits, economic benefits, and the development of sustainable agricultural markets for crops that are sources of ethanol.

52
This section discusses the projected emissions savings of CO2 and local pollutants by using different ratios of blended ethanol.
3.1.1.1 CO2 EMISSIONS
3.1.1 PROJECTIONS OF CO2 AND LOCAL POLLUTANT EMISSION REDUCTIONS
Year
Ethanol required for different blending
scenarios, million ltAvoided CO2e emission, million tons
5% 10% 15% 20% 5% 10% 15% 20%
2016-17 1,532 3,065 4,597 6,130 1.75 3.49 5.24 6.99
2017-18 1,664 3,328 4,992 6,656 1.90 3.79 5.69 7.59
2018-19 1,804 3,608 5,411 7,215 2.06 4.11 6.17 8.23
2019-20 1,952 3,904 5,856 7,808 2.23 4.45 6.68 8.90
2020-21 2,110 4,219 6,329 8,438 2.41 4.81 7.22 9.62
2021-22 2,283 4,566 6,849 9,132 2.60 5.21 7.81 10.41
Table 16: CO2e Emissions Avoided Through Different Blending Scenarios
3.1.1.2 SULPHUR DIOXIDE (SO2) EMISSIONS
blending targets under the EBP Programme. The Intergovernmental Panel on Climate Change (IPCC) recognizes that biofuels have direct fuel-cycle GHG emissions that are typically 30–90% lower per kilometre travelled than those for petrol or diesel fuels (Cambridge University Press, 2014).
Avoided carbon emission by utilizing one litre of ethanol is approximately 1.14 kg CO2e (Gunitilake, 2014). Table 16 shows the projections of ethanol required for different percentages of blending and the corresponding GHG emission reduction till 2022. CO2 emissions can be reduced up to 10.41 Mt CO2e by 2021-2022 (Table 16).
Similarly, SO2 emissions have been estimated for different blending scenarios. The sulphur content of Bharat Stage (BS)-III standard petrol, which is the dominant variety of petrol in India, is 150 ppm (ICCT, 2016). Based on our calculations, using 1 litre of ethanol can avoid 0.22 grams of SO2 emissions. Table 17 provides the SO2 emissions avoided for different blending scenarios. SO2 emission reduction is estimated to be 1.97 kilo tons by 2022 at 20% blending of ethanol.
Ethanol, being a low-carbon emissions fuel is a good candidate for generation of carbon credits. As such, the production of biofuels can be incentivized by the cap and trade mechanism of emissions trading, which sets a limit on emissions and allows for unused emission credits to be traded. Ethanol production facilities can also be good candidates for the Clean Development Mechanism and Joint Implementation programmes under the Kyoto Protocol, which allow certain countries to implement emissions reduction projects in developing countries or make transnational investments to generate certified emission reduction (CERs).

53
Year
Avoided SO2 emissions for different
blending scenarios, k ton
5% 10% 15% 20%
2016-17 0.33 0.66 0.99 1.32
2017-18 0.36 0.72 1.08 1.44
2018-19 0.39 0.78 1.17 1.56
2019-20 0.42 0.84 1.26 1.69
2020-21 0.46 0.91 1.37 1.82
2021-22 0.49 0.99 1.48 1.97
Table 17: Avoided SO2 Emissions in Different Blending Scenarios
Carbon Monoxide is formed due to incomplete fuel combustion, and nitrogen oxides (NO and NO2) are formed by the oxidation of nitrogen from the air in the combustion process. An important parameter for the formation of nitrogen oxides (NOx) is the combustion temperature i.e. increased combustion temperature results in increased NOx emissions.
Based on our analysis of future emissions in the transport sector, petrol-based CO and NOx emissions are shown in Figure 6 and Figure 7. These account for other improvements in the transport sector such as better fuel standards, fuel efficient vehicular technologies and mass transport measures such as buses and metros.
However, ethanol blended petrol (E10) reduces the CO emission by 15%, but increases NOx emission by 14% compared to petrol (E0) (Naidenko, 2009; Ministry of Petroleum & Natural Gas, 2015-16). These comparisons also depend on the engine technology, vehicle type and driving conditions. Figure 6 and Figure 7 show the possible impact of E10 on the quantities of CO and NOx emissions in the future.
3.1.1.3 CO AND NOX EMISSIONS
FIGURE 6: CO EMISSIONS INE0 AND E10 SCENARIOS
2017 2020 2025 2030
4500
4000
3500
3000
2500
2000
1500
500
3957 3938 E0
E10
3348 3288
2795
19511658
3363
FIGURE 7: NOX EMISSIONS INE0 AND E10 SCENARIOS
2017 2020 2025 2030
4500
4000
3500
3000
2500
2000
1500
500
2593
2964 28143216
2886
32983059
2677
CO, (
k To
n)
NO
x (k Ton)

54
3.2 TRADE BALANCE IMPROVEMENTIndia is now the world’s third largest importer of crude oil, recently surpassing Japan (Chowdhuri, 2014). India met 84.5% of its refinery requirements in 2012-13 solely through foreign crude oil, with 77% of that used for domestic consumption, while the remaining quantity was exported (Petroleum Planning and Analysis Cell, 2016).
In this context, it is estimated that a successful implementation of the EBP Programme would result in significant foreign exchange savings. The Auto Fuel Vision policy states that if India achieves 10% blending, it could save approximately USD 377 million in foreign-exchange (FOREX) (Government of India, 2014).
Table 18 shows how higher blending can progressively reduce the final cost of petrol in the future as crude prices are expected to rise. Though the amount of crude oil required cannot be compromised, since crude processing delivers products other than petrol, it is accurate to say that the amount of petrol saved through blending can also be exported to earn additional revenues.
Table 18: Projected Prices for Various Ratios of the EBP Programme
Year 2016-17 2017-18 2018-19 2019-20 2020-21 2021-22
Petrol Price (1) 62.73 63.79 66.99 70.98 74.97 77.63
Average Ethanol Price^ 34.7 34.7 34.7 34.7 34.7 34.7
E5 Price (2) 61.3 62.3 65.3 69.1 72.9 75.4
Price difference (2)-(1) 1.43 1.49 1.69 1.88 2.07 2.23
E10 Price (3) 59.9 60.8 63.7 67.3 70.9 73.3
Price difference (3)-(1) 2.83 2.99 3.29 3.68 4.07 4.33
E15 Price (4) 58.5 59.4 62.1 65.5 68.9 71.1
Price difference (4)-(1) 4.23 4.39 4.89 5.48 6.07 6.53
E20 Price (5) 57.1 57.9 60.5 63.7 66.9 69
Price difference (5)-(1) 5.63 5.89 6.49 7.28 8.07 8.63
All prices are in INR/litre; INR: USD = 66.64 (as on 30/09/16)
^Average price of ethanol over last 10 years

55
Table 19: Annual FOREX Savings Due to Ethanol Blending
Year 2016-17 2017-18 2018-19 2019-20
2016-17 2.19 8.67 19.45 34.51
2017-18 2.48 9.95 21.91 39.20
2018-19 3.05 11.87 26.46 46.83
2019-20 3.67 14.37 32.09 56.84
2020-21 4.37 17.17 38.42 68.09
2021-22 5.09 19.77 44.72 78.81
All values in INR Billion
Table 20 gives an estimate of the revenue that can be generated by exporting the petrol saved through various levels of blending.
Table 20: Export Incomes from Surplus Petrol Obtained Through Blending
Year E5 E10 E15 E20
2016-17 34 69 103 137
2017-18 41 83 124 166
2018-19 50 101 151 202
2019-20 62 124 186 248
2020-21 75 150 225 300
2021-22 87 174 261 348
All values in INR Billion
Table 19 and Table 20 show how sourcing ethanol from international markets to fulfil our EBP Programme helps in improving the trade balance from both the perspective of spending and revenues.
Eventually, OMCs may face the choice of importing ethanol for blending or continue to manufacture pure petrol. Figure 8 plots the cost of producing petrol (crude and refining costs have been mentioned in Table 31) and imported ethanol prices.
Based on the price difference between pure petrol and ethanol-blended petrol as mentioned in Table 18, the total annual savings can be estimated as shown in Table 19.

56
Figure 8 shows how global crude oil price recovery will result in a situation whereby it will be cheaper to directly import ethanol for blending than producing petrol from crude. At this stage, it will be economically attractive for OMCs to blend more ethanol.
Given that India also directly imports petrol from the international market, the amount of petrol saved due to ethanol blending can be seen as reducing the import bill of petrol owing to differential prices in the market. The past trends of import and export prices of petrol have been provided in Table 21(Petroleum Planning and Analysis Cell, 2016).
FIGURE 8: COST OF PRODUCTION OF PETROL AND IMPORTING ETHANOL
Table 21: Historical Import and Export Prices of Petrol
YearImport Price of Petrol
(INR/Litre)
Export Price of Petrol
(INR/Litre)
2004-05 15.7 14.2
2005-06 19.3 17.6
2006-07 23.0 20.6
2007-08 25.3 23.3
2008-09 28.6 23.9
2009-10 24.0 23.3
2010-11 27.6 26.6
2011-12 37.0 37.2
2012-13 44.2 41.8
2013-14 46.0 44.5
2014-15 45.2 37.3
2015-16 30.4 25.9
2016 2017 2018 2019 2020 2021 2022
40
35
30
25
20
PETROL PRODUCTION COST
IMPORTED ETHANOL PRICE

57
Table 22: Potential Reduction in Petrol Imports from Blending
YearImport Cost (USD
per barrel)E5 E10 E15 E20
2016-17 62.8 603 1,206 1,810 2,413
2017-18 69.9 729 1,459 2,188 2,917
2018-19 78.5 887 1,775 2,662 3,549
2019-20 89.2 1,091 2,183 3,274 4,365
2020-21 99.9 1,321 2,641 3,963 5,284
2021-22 107.1 1,532 3,063 4,595 6,125
^All amounts in USD Million unless mentioned otherwise
FIGURE 9: NET REDUCTION IN IMPORT BILL AT VARIOUS ETHANOL BLENDS
Analogous to Figure 8, Figure 9 demonstrates that lower international crude (and therefore petrol) prices currently prevalent will initially result in higher net import spending until 2018-19, when the price advantage of imported ethanol kicks in, leading to much higher surpluses thereafter.
Therefore, it can be demonstrated that importing ethanol for the EBP Programme will eventually lead to positive FOREX outcomes. However, this would require a cogent, long-term strategy around source-neutral ethanol production and procurement, which is discussed in Chapter 5.
Net
Red
ucti
on in
Impo
rts
(USD
Bill
ion)
1.5
1.0
0.5
0.0
- 0.5
- 1.0
2016-17 2017-18 2018-19 2019-20 2020-21 2021-22
E20 BLEND
E15 BLEND
E10 BLEND
E5 BLEND
Since ethanol is replaced in 1:1 ratio with petrol, the quantity of ethanol blended for each blending ratio is equal to the quantity of petrol saved. Petrol saved due to blending can be considered as compensation for the imported petrol. Table 22 gives an estimate of the amount of reduction that can be achieved in the import bill if ethanol blending is factored in.
The relative impact of importing ethanol versus petrol on import bill is shown in Figure 9.
58
3.3 EMPLOYMENT OPPORTUNITIESIn 2015, the ethanol industry in the USA contributed to 85,967 direct jobs and 271,400 indirect and induced jobs. This led to a contribution of USD 44 billion to the country’s GDP and USD 10 billion in tax revenue (Renewable Fuel Association, 2016). The direct job benefit is concentrated heavily in the manufacturing and agriculture sectors (Urbanchuk J. M., 2016).
Similarly in Brazil, ethanol production has created an estimated one million jobs and reduced the cost of oil imports by USD 43.5 billion between 1976 and 2000 (American Diplomacy, 2008). This is because the productivity of Brazil’s soil is very high, requiring almost no additional inputs, and with sugarcane crops being rain fed over time. This plays a major
Table 23: Economic Impact of Ethanol Production by Country
Country
2010
Output
(Million
Litres)
2020
Output
(Million
Litres)
2010
Output
(Million
Dollars)
2020
Output
(Million
Dollars)
2010 Jobs
(‘000)
2020 Jobs
(‘000)
USA 50 64 129 171 401 435
Brazil 26 50 111 208 444 676
EU-27 5 16 17 63 69 205
role in making Brazil one of the most efficient producers of bioethanol (American Diplomacy, 2008). It also enables Brazil to realise competitive advantages by creating more job opportunities, particularly in upstream sectors.
The USA experience has shown how the upstream livestock industry also benefits from increased ethanol production, leading to greater livestock feed. In the USA, for every bushel of corn processed by an ethanol plant, approximately 7.7kgs of animal feed is produced (Renewable Fuel Standards, 2016). In Denmark, integrated ethanol production significantly utilised waste water and other materials (Larsen, Johansen, & Schramm, 2009).
Table 23 shows the contribution of ethanol production to output and direct employment in the economies of select nations (Urbanchuk J. M., 2012). This demonstrates the significant potential in ethanol production. This demonstrates the significant potential of employment generation in ethanol production.

59
Country
2010
Output
(Million
Litres)
2020
Output
(Million
Litres)
2010
Output
(Million
Dollars)
2020
Output
(Million
Dollars)
2010 Jobs
(‘000)
2020 Jobs
(‘000)
China 2 8 5 25 21 83
India 1.9 2.2 8 9 32 36
Canada 1 2 4 8 14 27
Other 7 12 27 40 106 132
Total 93 155 302 525 1087 1594
India is the largest consumer of sugar, and its second largest producer in the world after Brazil. Presently, the industry, worth approximately INR 800,000 million, supports the livelihood of close to 50 million sugarcane farmers and around half a million workers directly employed in sugar mills (Department of Food & Public Distribution, 2012).
An increased demand for ethanol production could significantly impact the demand and supply of sugar in the country. However, the cyclical nature of sugarcane harvests has hampered the industry’s stable growth (United Nations Environment Programme, 2015). In years where there has been a sugarcane surplus, it has further contributed to instability in sugar prices. In this light, the EBP Programme may play a significant role by providing sugar mills a stable demand source, to efficiently allocate surplus capacity.
3.4 DIVERSIFICATION OF SUGAR-RELATED MARKETS
INDIA is the largest consumer of sugar in the world
HALF A MILLION directly employed workers
50 MILLION sugarcane farmers
INR 800,000 MILLION worth industry
As discussed in Chapter 5, one of the ways in which sugar mills could utilise their capacities more efficiently is by diverting excess sugarcane juice towards ethanol production. This would ensure that sugar prices do not taper while, generating sufficient revenues for sugar mills to make payments to farmers.

60
3.5 SECOND GENERATION BIOFUELSThe primary challenges plaguing the cellulosic biofuel industry revolve around issues of scalability. The supply chain usually involves collection, processing and transportation of feedstock, its pre-treatment and final processing at bio-refineries (United Nations Environment Programme, 2014). Therefore, it becomes crucial to investigate potential locations and sizes for refinery facilities to optimise the process.
It is believed that enhanced processing capacities, improved conversion efficiencies and financial incentives under the National Biofuel Policy can potentially make second generation biofuels commercially competitive (United Nations Environment Programme, 2014). Their improved commercial viability can open up a host of new opportunities in skilling, infrastructure and low-carbon transport. In fact, as stated in our stakeholder consultations with Mr. Y.B. Ramakrishna, Chairman, Working Group on Biofuels, the Ministry of Petroleum and Natural Gas has directed OMCs to set up twelve second-generation commercial plants across the country in order to fast-track the process of a shift to next-generation technologies.
There is no shying away from the fact that technology plays a central role in the production of ethanol from either first-generation or second generation sources. However, the technology for second generation production of ethanol is at a nascent stage of research and development. In India, however, significant developments have been made. These include the setting up of a technology demonstration plant at Kashipur in Uttarakhand which has the ability to convert biomass into ethanol in a period of 18 hours, wherein traditionally, this process takes about 4-5 days. Similarly, as stated during our stakeholder consultations with Mr. Y.B. Ramakarishna, Chairman, Working Group on Biofuels, there have been more than INR 7000 core investments made into advanced technologies which will result in 350 million litres of 2G Ethanol availability in 2-3 years.
While these investments are encouraging in the long run, the production of ethanol from first generation sources, i.e., molasses has already been undertaken on a large scale. Thus, it is important that investments in the production of first-generation biofuels are first stabilised. Simultaneously, frameworks supporting research and development in second generation biofuels need to be developed. This approach is reflected in global policy measures, some of which are outlined in the subsequent chapter.
Diversification of ethanol-related markets can be achieved by diverting excess sugarcane juice for the production of ethanol. Further, by integrating standalone sugar mills with ethanol distilleries and incentivising standalone mills to set up processing capacities can decrease production costs.
Further, it must be noted that profit margins for sugar mills could be increased by integrating standalone sugar mills with ethanol distilleries, as the production costs for integrated sugar mills happen to be lower than standalone ethanol distilleries (Table 33). Therefore, financial support and incentives for standalone sugar mills to set up processing capacities would further reduce costs.

61
The biofuel industry is projected to grow from USD 168.18 billion in 2016 to USD 246.52 billion by 2024 at a CAGR of 4.92% (Biofuels International, 2016). This growth in biofuel production will primarily be driven by strong regulatory and legislative interventions. At present, 64 countries have biofuel mandates and targets (Lane, 2016). Table 24 shows the ethanol blending mandates around the world (Global Renewable Fuels Alliance, 2016; Bob Katter, 2015).
4. GLOBAL BEST PRACTICES4.1 BLENDING MANDATES ACROSS THE WORLD
Table 24: Ethanol Blending Mandates Around the World
Country Blending Mandates
Brazil 27%
Paraguay 24%
USA, Argentina, Jamaica, Columbia, Belgium, Angola, Kenya, Malawi,
Mozambique, South Africa, Zambia, Zimbabwe, China, India, Philippines10%
Peru 8%
Poland 7.10%
Costa Rica, France 7%
Portugal 6.75%
Slovenia 6.50%
Finland, Ireland, New South Whales 6%
Austria, Bulgaria, Czech Republic, Denmark, Estonia, Greece, Hungary, Latvia,
Lithuania, Luxembourg, Slovakia5.75%
Canada, Chile, Panama, Uruguay, Italy, Norway, Romania, Sweden, Ethiopia,
Sudan, Thailand, Vietnam5%
United Kingdom 4.75%
Spain 4.10%
Netherlands 3.50%
Indonesia, Japan 3%
Germany 2.80%
Cyprus 2.50%
Mexico, Turkey 2%
Malta 1.25%
Nigeria 5-10%
Fiji 5-10%

62
Blending mandates through legislative interventions are being implemented in 13 countries in the Americas, 12 in the Asia-Pacific, 11 in Africa and the Indian Ocean, and 2 from non-EU countries in Europe. Figure 10 shows the ethanol blending targets achieved by some countries in 2015. Paraguay, Thailand and Canada have surpassed their targets.
FIGURE 10: GLOBAL ETHANOL BLENDING TARGETS AND ACHIEVEMENTS
In Brazil, ethanol blending is mandatory in petrol vehicles, with the use of E25, i.e., 25% anhydrous ethanol and 75% petrol and E100 (UN-Energy Knowledge Network, 2011). In the USA and Sweden, Flex Fuel Vehicles (FFVs) currently on the road are compatible with blends ranging from 0-85% ethanol content. These vehicles have demonstrated the technical feasibility of running on ethanol fuels with a high renewable content, at no higher cost (Larsen, Johansen, & Schramm, 2009). In several other countries, the use of E5 and E10 are mandatory.
Figure 11 shows the key contributors to global ethanol production between 2007 and 2015.
FIGURE 11: GLOBAL ETHANOL PRODUCTION BY COUNTRY/REGION AND YEAR
It is worthy to note that the regions with highest demand of ethanol (Brazil and the USA) are also, by far, the top contributors to global ethanol production.
0 5 10 15 20 25 30
BRAZIL
CHINA
USA
GERMANY
EU
INDIA
PERU
PARAGUAY
ARGENTINA
THAILAND
CANADA
AUSTRALIA
272.19.9
6.33.6
2.87.8
27.39.7
14.46.3
0.1
% B
lend
ing
BLENDING TARGETS %
ACHIEVED BLENDING %
120
100
80
60
40
20
2007 2008 2009 2010 2011 2012 2013 2014 2015
Prod
ucti
on (B
illio
n lit
res)
REST OF THE WORLD CANADA CHINA EUROPE BRAZIL USA

63
4.2 KEY CONSIDERATIONS FOR BEST PRACTICESThis section highlights the actions taken across several countries to promote ethanol blending along the specific defined criteria.
4.2.1 FEEDSTOCK FOR ETHANOL
The choice of biofuel feedstocks varies across the world, as shown in Table 25, with the most popular among them being sugarcane. In Thailand, Brazil, Columbia and India, sugarcane is the major bioethanol feedstock. In Brazil and Columbia, unlike India, a large quantity of ethanol is produced from sugarcane juice. In the USA, corn is the primary ethanol crop. Across Europe, ethanol is predominantly made from wheat, beet, molasses and barley (Ethanol Renewable Fuel Association, 2016).
Table 25: Major Ethanol Feedstocks Around The World
CountryFuel ethanol production
in 2016 (Billion litres)Major feedstock
USA 56.0 58% Maize
Brazil 26.8 28% Sugarcane, sugarcane molasses
EU 5.2 5% Beet, beet molasses, wheat, maize
China 3.1 3% Maize, wheat, sugarcane, beet molasses
Canada 1.6 2% Maize
Thailand 1.3 1% Sugarcane molasses, cassava
Argentina 0.8 1% Maize, molasses
India 0.8 1% Sugarcane molasses
Rest of the world 1.5 2% Sugarcane molasses
Sugarcane-based ethanol gives seven times higher output energy per unit input as compared to other food crops. Corn-based ethanol requires high energy for processing starch to sugar and then sugar to ethanol. On average, a hectare of sugarcane produces more than twice the ethanol than its corn-based counterpart. The comparative yield and conversion efficiencies of different feedstocks for ethanol production are mentioned in Table 26 (Food and Agricultural Organization (FAO), 2008).

64
Table 26: Comparison of Efficiency and Yield of Different Ethanol Feedstocks
4.2.2 INCENTIVE AND SUPPORT FRAMEWORKThe impetus for the growth in ethanol-blending programs is primarily through governmental incentives. Furthermore, program implementation often focuses on removing sectoral roadblocks (such as through tax exemptions/waivers) and encouraging private sector investments.
For example, Brazil implemented a Land Clearing Policy, providing incentives for sugarcane production in the 1970s and early 1980s. This propelled Brazilian sugarcane production to its current position (Valdes, 2011). The National Bank for Social and Economic Development (BNDES) provides specific credit lines for sugar, ethanol, and bioenergy industries to fund investments in sugarcane production, expansion of industrial capacity for sugar and ethanol, cogeneration, logistics and multimodal transportation in Brazil. In the 1990s, Brazil made temporary reductions in its Impostosobre Produtos Industrializados (IPI) tax for the automobile industry to encourage household ethanol consumption through the purchase of new FFVs (Rebecca, 2013; Cynthia, 2016) Similarly, Brazil even exempted ethanol from federal tax till 2012 while imposing it on petrol. (Barros, Biofuels Annual-Brazil 2015, 2015).
The US enacted the Crude Oil Windfall Profit Tax Act in 1980, which provided tax exemptions on ethanol since1992 (California Energy Commission, 2004). The Gasohol Competition Act of 1980 banned petrol marketing practices that discouraged the use of ethanol-blended petrol.
Crop
Global/
National
estimates
Crop yield
(Ton/ha)
Conversion efficiency
(Litres/ton)
Biofuel yield
(Litres/ha)
Sugar beet Global 46 110 5,060
Sugarcane Global 65 70 4,550
Sugarcane Brazil 73.5 74.5 5,476
Sugarcane
molassesIndia 60.7 74.5 4,522
Cassava Global 12 180 2,070
Maize Global 4.9 400 1,960
Maize USA 9.4 399 3,751
Rice Global 4.2 430 1,806
Wheat Global 2.8 340 952
Sorghum Global 1.3 380 494
It is apparent from Table 26 that sugar beet and sugarcane give greater yields of biofuel than other feedstocks, while other major food crops as feedstocks are not as effective and give lower bioethanol yields.

65
In Argentina, the Secretariat of Agriculture, Livestock, Fisheries and Food established the National Biofuels Programme—Programa Nacional de Biocombustibles—in 2006 (Charlotta Jull et.al, 2007) to promote the production and sustainable use of biofuels over a 15-year period. The program provided incentives to the biofuels industry in Argentina, such as exemption of Value Added Tax (VAT) and excise tax, and corporate tax for three years.
The Canadian government introduced a USD 200 million, four year capital grant programme, the eco Agriculture Biofuels Capital Initiative (ecoABC) to provide funding for the construction and expansion of cellulosic bioethanol production facilities. In the ecoENERGY initiative, up to USD 1.5 billion investments were planned (2007-16) to boost Canada’s production of biofuels (Global CCS Institute, 2016). Canada also provided excise tax exemptions of USD 0.10 per litre for bioethanol (World Energy Council, 2010). The National Biomass Expansion Program (NBEP) provides USD 140 million in contingent loan guarantees for new plants that produce bioethanol from biomass material such as crop residues (World Energy Council, 2010).
4.2.3 CAPACITY BUILDING AND TECHNOLOGY
Globally, interventions in technology and capacity building have taken various forms. Some support mechanisms include improving accessibility to requisite machinery in order to improve the quality and efficiency of fuel-grade ethanol. On the demand side, these interventions include ensuring that on-road vehicles are adaptable to run on designated fuel standards.
For example, since 1976, Brazil mandated a blend of 10-25% anhydrous ethanol with petrol, requiring only minor adjustments to regular petrol motors (Soya Bean & Corn Advisor, 2016). In the early 2000s, vehicle manufacturers of Brazil like Chevrolet, Ford, Fiat, Peugeot, Renault, Volkswagen, Honda, Mitsubishi, Toyota, and Citroen developed FFVs that can run on any proportion of petrol (E10-E25 blend) and hydrous ethanol (E100) (Soya Bean & Corn Advisor, 2016).
Another example is the Paraguayan distillery, Destisur, which was required to fulfil an order for four billion litres of ethanol in 2006. Destisur received technical support from Brazilian experts to improve yields. The project also helped producers with logistics to avoid delays in delivering raw materials to the plant, improved access to loans, and expanding their farmed areas. With the Paraguayan government’s assistance on technology access, Destisur could dramatically increase
its yield from 44 to 58 litre of ethanol per ton of sugarcane (United States Agency for International Development, 2007).

3 E85 is a petrol-ethanol blend containing 51% to 83% ethanol, depending on geography and season (Alternative Fuels Data Center, 2016)4 Few blended pump stations also dispense E15, E40, and E50
66
4.2.4 BLEND WALL FOR ETHANOL
Blend wall is the maximum quantity of ethanol that can be blended into each gallon of motor fuel (Renewable Fuel Association , 2016). Vehicles support certain blends, beyond which the fuel efficiency decreases. Blending mandates must be implemented based on the flexibility of the engines to adapt to blending ratios (U.S.Energy Information Administration, 2016).
According to the Energy Information Administration (EIA), all petrol vehicles can use E10 (10% ethanol blended with 90% petrol). Only light-duty vehicles with a model year 2001 or greater can use E15.3 Blending pumps allow a consumer to select their blend according to manufacturer’s recommendations or their preference (Country Partners Cooperative, 2014). E10, E20, E30, E85 and Pure gasoline or E0 are the most commonly available blends.4 (Alternative Fuels Data Center, 2012).
Table 27 highlights the benefits and drawbacks of blended-ethanol petrol (World Energy Council, 2010). While it helps to improve the engine combustion efficiency, storage and corrosion issues are likely to damage the engine if the blends used are above recommended blending proportions.
Table 27: Impact of Blended Ethanol on Vehicles
Categories Benefits Drawbacks
Advantages Reason Disadvantages Reason
Engine
performance
Better
combustion
efficiency
High engine
compression ratio
due to high octane
number.
Less power output
Less heating
value (per
mass)
Emissions
Lower HC, VOC,
SOx and CO
emissions
More complete
combustion due
to high volume of
oxygenates present.
Higher aldehydes, methane,
ethylene and acetone
emissions.
Higher carcinogenic
evaporative emissions for
low to medium blends
Unique
ethanol
oxidation
path. High
evaporative
pressure.
Engine
durability
E20 can reduce
injector tip for a
petrol direct
injection
engine.
Synergistic effects of
high latent heat and
aromatic and sulphur
content reductions
Vapour lock (only for
the blends with small-to
medium
ethanol fractions)
High volatility
Presence of
water oxy
polarity/water
contamination
Storage and
Handling Leakage from storage
corrosion
Water content
and electricity
conductivity

67
FFVs have an internal combustion engine which is capable of operating on petrol and any blend of petrol and ethanol up to E85 (or flex fuel). In 2010, there were about seven million FFVs used in the USA, running on fuel with 85% bioethanol (E85).
However, current warranties for conventional vehicles do not cover damages if cars are run on bioethanol higher than E10 (World Energy Council, 2010). In Brazil, conventional petrol vehicles are designed to run on a high bioethanol content in petrol (E25), which are considered too high to replicate worldwide (World Energy Council, 2010).
4.2.5 ETHANOL TRADE POLICY
Globally, governments have considered ethanol procurement from international markets keeping in mind broader priorities. Some jurisdictions impose import duties with a view to prevent dependence on imported ethanol. Other jurisdictions have introduced fixed pricing mechanisms in order to support domestic ethanol suppliers. In contrast, some countries, in order to support their domestic blending program and achieve the targets they have set for themselves, have favoured liberalizing their policy regarding ethanol import.
For example, the Biofuels Act, 2006 of Philippines permitted ethanol imports for up to four years after the implementation of the Act. Additionally, it included provisions for duty-free imports and VAT exemption on all types of agricultural inputs and machinery for the plantation of biofuel feedstocks. Similarly, the biofuels market in Argentina is highly regulated and features investment subsidies, tax reliefs, distribution quotas and other instruments.
In contrast, Nigeria’s policy on incentives for biofuel production is geared towards leveraging its vast arable land and agricultural economy to produce and export ethanol and intermediate goods for the international economy (World Energy Council, 2010).
Mexico is in a similar position to that of India today. Much of the ethanol produced is used by the pharmaceutical and liquor industries. Mexico meets 50% of its bioethanol requirement from imports. Ethanol prices in Mexico are still far from competitive as compared to more technologically advanced countries like the USA or Brazil (World Energy Council, 2010).
The duties and taxes on fuel ethanol across different countries are provided in the Annexure.
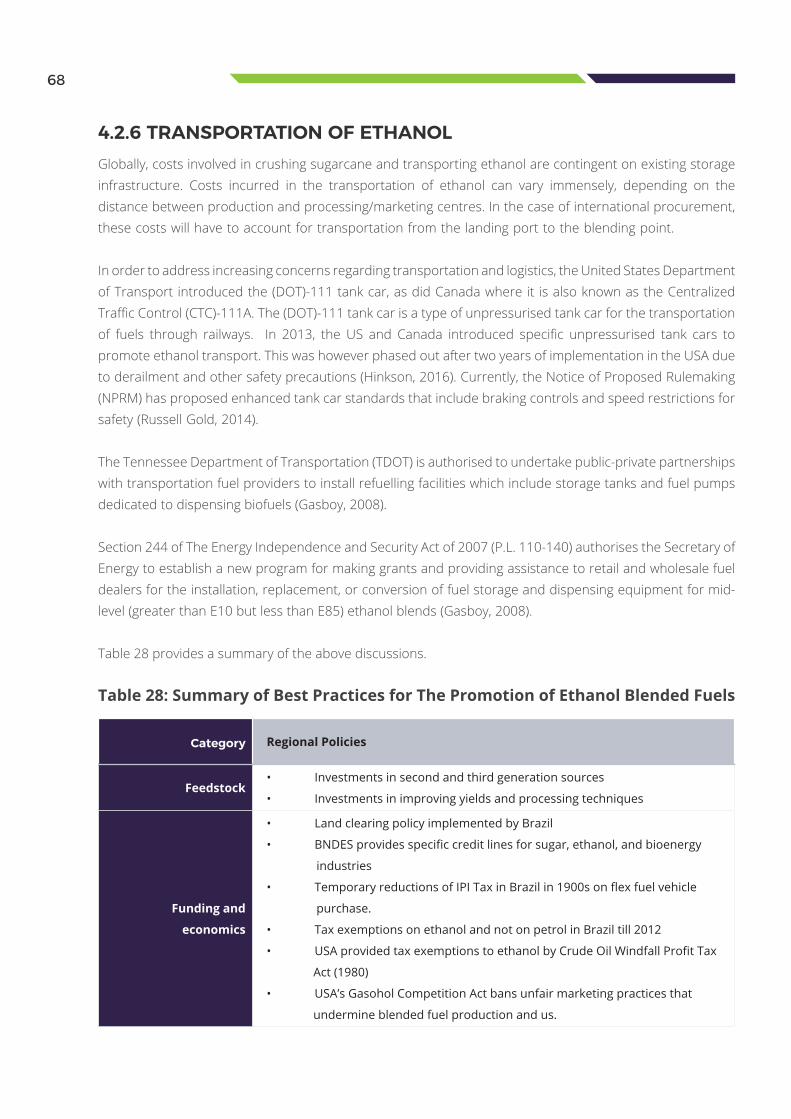
68
Table 28: Summary of Best Practices for The Promotion of Ethanol Blended Fuels
Category Regional Policies
Feedstock• Investments in second and third generation sources
• Investments in improving yields and processing techniques
Funding and
economics
• Land clearing policy implemented by Brazil
• BNDES provides specific credit lines for sugar, ethanol, and bioenergy
industries
• Temporary reductions of IPI Tax in Brazil in 1900s on flex fuel vehicle
purchase.
• Tax exemptions on ethanol and not on petrol in Brazil till 2012
• USA provided tax exemptions to ethanol by Crude Oil Windfall Profit Tax
Act (1980)
• USA’s Gasohol Competition Act bans unfair marketing practices that
undermine blended fuel production and us.
4.2.6 TRANSPORTATION OF ETHANOLGlobally, costs involved in crushing sugarcane and transporting ethanol are contingent on existing storage infrastructure. Costs incurred in the transportation of ethanol can vary immensely, depending on the distance between production and processing/marketing centres. In the case of international procurement, these costs will have to account for transportation from the landing port to the blending point.
In order to address increasing concerns regarding transportation and logistics, the United States Department of Transport introduced the (DOT)-111 tank car, as did Canada where it is also known as the Centralized Traffic Control (CTC)-111A. The (DOT)-111 tank car is a type of unpressurised tank car for the transportation of fuels through railways. In 2013, the US and Canada introduced specific unpressurised tank cars to promote ethanol transport. This was however phased out after two years of implementation in the USA due to derailment and other safety precautions (Hinkson, 2016). Currently, the Notice of Proposed Rulemaking (NPRM) has proposed enhanced tank car standards that include braking controls and speed restrictions for safety (Russell Gold, 2014).
The Tennessee Department of Transportation (TDOT) is authorised to undertake public-private partnerships with transportation fuel providers to install refuelling facilities which include storage tanks and fuel pumps dedicated to dispensing biofuels (Gasboy, 2008).
Section 244 of The Energy Independence and Security Act of 2007 (P.L. 110-140) authorises the Secretary of Energy to establish a new program for making grants and providing assistance to retail and wholesale fuel dealers for the installation, replacement, or conversion of fuel storage and dispensing equipment for mid-level (greater than E10 but less than E85) ethanol blends (Gasboy, 2008).
Table 28 provides a summary of the above discussions.

69
Category Regional Policies
Transportation of raw
source
• Introduction of DOT-111 and CTC-11A by USA and Canada.
• Public-private partnerships through TDOT to install refuelling facilities
including storage tanks
Blend wall for ethanol
• E10 for vehicles modelled in the year 2000 and older
• E15 for vehicles newer than 2001
• E85 for flex fuel vehicles
Technology
• Since 1976, Brazil has carried out minor adjustments petrol motors to
adapt to higher blending ratios.
• Introduction of flex fuel vehicles in early 2000s
• Investments in improving crop yields
• Investments in research and development
Trade economics
• Paraguay does not export ethanol to support domestic programme
• Philippines provides for duty-free importation of ethanol till four years
post policy implementation.
4.3 GLOBAL ETHANOL PRODUCTION AND TRADEGlobal ethanol production leapfrogged from 49 billion litres in 2007 to 113.5 billion litres in 2012. However, it registered a drop in 2013 to 104 billion litres, before continuing the upward trend to reach 115 billion litres in 2015.
Table 29 represents global ethanol production trends for fuel use.
Table 29: Global Ethanol Production for Fuel Use
Year Total ethanol use (Billion litres)Ethanol used for fuel
(Billion litres)% ethanol used for fuel
2000 29.2 17.1 59%
2008 81.1 66.8 82%
2009 91.9 75.3 82%
2010 99.4 86.9 87%
2011 105.6 84.6 80%
2012 113.5 82.4 73%
2013 104.9 88.7 85%
2014 112.1 84.1 75%
2015 115.1 84.4 73%

70
In an effort to meet the rising demand for fuel, Brazil started importing ethanol from 2010 and became a net ethanol importer. Since then, the USA has been the world’s largest ethanol exporter and the largest supplier of ethanol to Brazil. The export market is a crucial source of demand for USA’s ethanol, with approximately 850 million gallons (Ethanolrfa, 2016) shipped to more than 50 countries in 2015. The USA currently exports 30% of the total ethanol export to Canada, 14% to Brazil, 6% to India, 7% to South Korea, 8% to China, 8% to the Philippines and the remaining quantity to the rest of the world (United States Department of Agriculture, 2016).
Though the USA and Brazil will continue to have a large share of global ethanol production, other countries like China, Argentina and the EU are making strides towards self-sufficiency. In China, for example, sorghum, cassava and other non-grain feedstocks are increasingly being considered for ethanol production. Furthermore, although corn-based ethanol was prohibited till 2016, it is now being used to absorb surplus corn stocks (Shuping & Aizhu, 2015).
While India is the second largest sugarcane producer, it has had a disappointing record in bioethanol production owing primarily to the challenges described in Chapter 2. Thailand introduced E85 vehicles supported by state subsidies provided by the State Oil Fund. These allowances make the E85 blends 20-40% cheaper than the old E10 in Thailand, which stimulated production (Voegele, 2015).
4.4 COUNTRY CASE STUDIES
The following section examines the policies in three key ethanol producing countries—the Philippines, Brazil and the US.
to reduce their fossil fuel dependence and promote cleaner sources of energy through various means, including biofuel development.
The Department of Energy (DoE) formulated the Philippines Biofuel Program in line with the Philippines Energy Plan. The DoE also established biofuel quality standards in consonance with its domestic standards. Additionally, the DoE was responsible for establishing guidelines for the transport, storage and handling of biofuels. The DoE was also authorized to prevent sales of non-compliant fuels and impose penalties against defaulters.
The Biofuels Act, passed in 2006, came into effect from January 2007 (Congress of the Philippines, 2006). It sought to achieve at least 5% ethanol blending by February 2009 and 10% blending by 2011. According to its National Renewable Energy Program, the Philippines aspires to mandate E20 by 2020 and E85 by 2025. Through the course of its implementation, the plan is to phase out the use of all harmful petrol additives, not just limited to MTBE.
4.4.1 PHILIPPINESIn 2007, the Philippines, 10 ASEAN members and other Asian economies including China, India, Japan, Australia, South Korea and New Zealand signed the Cebu Declaration on the East Asian Energy Security Pact (NTI , 2016). These countries agreed

71
The 2006 Act established time-bound policy mandates. It mandated that all liquid fuels for motors and engines sold in the Philippines must contain locally-sourced biofuel components. It also maintained that the annual volume of petrol fuel sold by every oil company should conform to the Philippines National Standard within two years of its implementation.
Within four years, the National Biofuel Board (NBB) was directed to determine the feasibility of and thereafter recommend to the DoE a minimum of 10% blend of bioethanol by volume. In the event of a domestic shortage, it permitted the import of bioethanol.
Since blending requirement in the short-term could not be met locally, the Act permitted ethanol imports for up to four years. In addition, the 2006 Act permitted duty-free import and exemption from VAT for all types of agricultural inputs and machinery for the plantation of biofuels.
The key incentives offered by the government for biofuel development have been summarized below.
• Duly registered RE developers received income tax holidays for the first seven years of commercial operations. • Raw materials used in the production of biofuels such as coconut, jatropha, sugarcane, cassava, corn, and sweet sorghum are exempt from VAT.• The specific tax on local or imported biofuels component was waived off. However, petrol and diesel fuel are subjected to the prevailing specific tax rate. • Development Bank of the Philippines, Land Bank of the Philippines, Quedancor and other government financial institutions extended financing to Filipino citizens amounting to at least 60% of the capital stock engaged in production, storage, handling and transport of feedstock and processing facilities certified by the DoE.• Under the Philippines’ Clean Water Act, all effluent such as distillery that was re-used as liquid fertilizers and/or for other agricultural purposes was exempted from wastewater charges.
These specific policy interventions helped create an enabling framework for the Philippines to achieve the targeted blending standards. The framework accounted for variables in program implementation in both the short and medium term (such as domestic shortfall in ethanol supply). It also introduced a comprehensive set of incentives and investments aimed at supporting the domestic industry. It can be seen that a multi-pronged and integrated approach was critical in the successful implementation of the program. The success of this policy approach is reflected in the fact that the Philippines was able to progressively indigenize domestic ethanol production, thereby achieving its stated objectives of energy security within timelines.
• Philippines’ Department of Energy formulated the Philippines Biofuel Program and established biofuel quality standards in consonance with its domestic standards. The DoE also established guidelines for transport, storage and handling of biofuels.• Philippines plans to mandate E20 by 2020 and E85 by 2025.• The government has also offered incentives for biofuel development, including but not limited to tax benefits and exemptions along with financing assistance.

72
FIGURE 12: PRODUCTION AND IMPORT OF ETHANOL IN PHILIPPINES
FIGURE 13: ETHANOL BLENDING RATES IN PHILIPPINES
600
500
400
300
200
100
0
2008 2009 2010 2011 2012 2013 2014 2015 2016
ETHANOL PRODUCTION
ETHANOL IMPORTS
Mill
ion
litre
s
12
10
8
6
4
2
0
2008 2009 2010 2011 2012 2013 2014 2015 2016
Blen
ding
(%)
Figure 12 shows that most of the Philippines’ fuel demand is met from imports. Thailand was one of the principal exporters of ethanol to the Philippines till 2012, after which it preferred to use the ethanol for its own domestic applications (Reuters Africa, 2011). Today, the Philippines imports ethanol from the USA at a 10% tariff rate, with an additional 1% tax for ethanol imports specifically for its blending program (International Trade Administration, 2015).
Figure 13 indicates the blending rate achieved by the Philippines. It is seen that the blending rate has increased continuously, except in 2015 when oil prices decreased and created a larger demand for petrol over ethanol. The Philippines managed to achieve its blending mandate of 10% in 2016 (Table 24).

73
The first mandate for using ethanol blend of 4.5% was put into force in 1977 by the Brazilian government under the Pró-Álcool (National Ethanol Program) launched in 1975 (Feller & Tom, 2006). Currently, ethanol blends are set at 27% (Sergio, 2016). Pró-Álcool was adopted to reduce dependence on foreign crude oil, following the first oil shock after the Yom Kippur War of 1973, which saw the price of oil jump from USD 2 to USD12 per gallon. In order to bring the trade balance as well as inflation under control, investments in the development of renewable resources, including ethanol, were necessary.
The development of Pró-Álcool in Brazil can broadly be categorized into four phases (Gueiros, 2013).
I. Phase 1 - Pró-Álcool expansion (1975-79): Brazil’s only priority was to produce 3 billion litres of anhydrous ethanol by 1980, to blend with petrol, up from less than a billion litres in 1975 to be blended with petrol. The Government of Brazil (GoB) would set the price of ethanol through the Instituto do Acucar e Alcool (IAA), an agency responsible for regulating the sugar and ethanol sector, defining export quotas, and subsidizing the industry. In the next ten years, USD 16 billion was invested in genetic research to improve sugarcane yield, subsidize the ethanol sector, and underwrite low-interest financing for new agricultural machinery. The ethanol industry expanded because of the IAA’s programs, and because excess sugarcane was available due to sugar prices decreasing internationally.
II. Phase 2 - Peak in and slowdown of biofuel expansion (1979-1986): In 1979 the Iran-Iraq war contributed to oil prices escalating to USD 30 a barrel and thus resulting in what is referred to as the second oil shock. Initiating Pró-Álcool’s second phase, with an ambitious goal to increase ethanol production to 10.7 billion litres by 1985, GoB began the production of hydrated ethanol for consumption by the recently developed motor vehicles fuelled exclusively by ethanol.
In 1979, major automobile manufacturers signed an agreement with the Brazilian government setting massive production goals for ethanol-fuelled cars. Ethanol production in autonomous distilleries was then initiated. To overcome consumer inertia, several measures to incentivize the purchase of ethanol-compatible vehicles were implemented.
A minimum blend mandate of 20% anhydrous ethanol was set for all petrol consumed in the country. Hydrated ethanol pumps in gas stations became mandatory. Ethanol-fuelled taxis were granted tax exemption. The price of ethanol could not exceed 65% of the price of petrol. Ethanol-fuelled vehicles reached 88.5% of total stock in 1984 from 28.5% in 1980.
As oil prices stabilized, sugar prices and ethanol prices began to rise resulting in reduced investments in Pró-Álcool from 1985 onwards.
III. Phase 3 - Crisis and Deregulation (1986-2003): The third phase was marked by a crisis. High international sugar prices spurred the ethanol industry to turn to sugar production. In 1986, the volume of ethanol consumed did not increase from the previous year. This crisis in supply led to Brazil initiating imports of ethanol in 1989.
4.4.2 BRAZIL

74
In 1990, the IAA was extinguished and the ethanol sector was deregulated. By 1994, only 12.2% of the motor vehicles sold in Brazil were ethanol-only vehicles.
However, in a policy rollback, the Pro-Ethanol Law (1993) mandated blending of 22% ethanol, incentivizing ethanol blends for environmental reasons rather than economic reasons.
In 1997, the federal government created ‘Agencia Nacional do Petroleo’ (ANP) to regulate and monitor the exploitation, production, transportation and distribution of ethanol. In 1999, ethanol prices were deregulated.
IV. Phase 4 (2003 to Present) - In 2003, the government called for the development of a commercially viable flex-fuel engine that could run on petrol, hydrated ethanol, or any blend of petrol and anhydrous ethanol, propelling ethanol back into the centre stage. By 2006, seven in every ten vehicles sold in Brazil had flex-fuel engines.
A Regional Producer Subsidy was the only direct subsidy introduced to balance differences in the production cost in low and high productivity areas. Under this, 27,000 growers from Brazil’s draught stricken north-eastern region were offered an economic subvention of BRL 12 per metric ton of sugarcane in 2014.
In March 2015, after several short- and long-term studies to determine the impact of increased ethanol blends on petrol engines by the Brazilian Oil Company Research Centre (Petrobras/CENPES), Inter-ministerial Sugar and Ethanol Council (Conselho Interministerial de Acucar e Alcool – CIMA), etc., an increase in the blending ratio to 27% was authorized (Barros, Biofuels Annual-Brazil 2015, 2015).
In 1979 the Iran-Iraq war contributed to oil prices escalating to USD 30 a barrel and thus resulting in what is referred to as the second oil shock.
By 2006, seven in every ten vehicles sold in Brazil had flex-fuel engines. A Regional Producer Subsidy was the only direct subsidy introduced to balance differences in the production cost in low and high productivity areas.
USD 16 billion was invested in genetic research to improve sugarcane yield, subsidize the ethanol sector, and underwrite low-interest financing for new agricultural machinery.
IRAN- IRAQ WAR, INCREASE OIL PRICE
FLEX FUEL ENGINES, 7 OUT OF
10
$16BILLION
INVESTED
Figure 14 provides the year-wise outcomes of the four phases described above.

75
Owing to the diversity in Brazil’s auto market, certain automobiles can operate on purely hydrous ethanol, whereas anhydrous ethanol is blended with petrol according to the government blending standards. Figure 15 represents the utilisation of different fuel-ethanol types in Brazil (Barros, Brazil Biofuels-Annual Report 2012, 2012).
FIGURE 14: BRAZIL’S ETHANOL BLENDING PERFORMANCE
FIGURE 15: ETHANOL TYPES AND THEIR USE IN BRAZIL
To support the use of ethanol over petroleum, Brazil levied a federal tax on petrol while exempting ethanol till 2012. Individual states have taxes varying from 12% to 27% for ethanol (Maria, Strengthening Brazil’s Global Competitiveness in Ethanol: What are the Next Steps?, 2015) and 25% to 31% for petrol, for circulation of goods and services, shifting the terms of trade towards ethanol.
Brazil also made temporary reductions in IPI tax for its automobile industry to encourage household ethanol consumption through the purchase of new FFVs (Rebecca, 2013; Cynthia, 2016). The prices of petrol and ethanol were fixed such that hydrous ethanol was sold for 59% of the government-set price at the pump to encourage wholesale consumption (Anuszka, 2008).
30
25
20
15
10
5
0
2008 2009 2010 2011 2012 2013 2014 2015 2016
6
13
6
16
7
15
8
11
8
11
10
12
11
13
11
18
11
14
HYDROUS ANHYDROUS
100908070605040302010
0
2008 2009 2010 2011 2012 2013 2014 2015 2016
78
90
74
54 47 52 54
7062
ANHYDROUS BLENDING RATES FOR NON FLEX FUELSFLEX FUEL VEHICLES

76
According to the Southern Market Agreement, Mercosul, the import tariff for ethanol is 20%. However, since April 2010, ethanol has been included in Brazil’s “list of exceptions” and the import tariff has been cut to zero. Since then, the Ministry of Development, Industry and Commerce (MDIC)/Chamber of Foreign Trade (CAMEX) maintained the zero import tariffs for ethanol till December 31, 2015.
The National Bank for Social and Economic Development (BNDES) provides specific credit lines for sugar, ethanol, and bioenergy industries to fund investments in sugarcane production, expansion of industrial capacity for sugar and ethanol, cogeneration, logistics and multimodal transportation.
As shown in Figure 16, second-generation cellulosic feedstock has been considered for ethanol production since 2015.
FIGURE 16: ETHANOL PRODUCTION BY DIFFERENT FEEDSTOCKS IN BRAZIL
The Brazilian government ensures use-neutrality in production, making no distinction between ethanol produced for the purposes of fuel, industrial use or potable use. The individual plants decide to produce sugar and ethanol in the theoretical ratio of 40:60, switching between sugar-predominant and ethanol-predominant production from harvest to harvest depending on the terms of trade (Agro Chart, 2015).
In conclusion, Brazil’s overarching approach was always contextualized with broader public policy objectives. For example, the initial thrust for its ethanol program was focused on insulating itself from the volatility of the global crude oil market, while subsequently, the approach was focused on environmental protection and supporting domestic industry. By entrusting a single body with implementation, this policy approach ensured that the program was not subject to administrative lapses. Lastly, this approach ensured parallel support and coordination frameworks for various stakeholders, including farmers, ethanol suppliers and automobile manufacturers, while also incentivizing consumers to shift preferences.
1ST GENERATION 2ND GENERATION
35
30
25
20
15
2008 2009 2010 2011 2012 2013 2014 2015 2016
76543210
1st
Gen
erat
ion
(Bill
ion
Litr
es)
2nd Generation (M
illion Litres)
• Brazil through the Pró- Álcool (their national program) in 1975 pledged to reduce dependence on foreign crude fuels. • Recently, in 2003, the government called for development of commercially viable flex- fuel engines that could run on petrol, hydrated ethanol or any blend. Achieving a remarkable figure of 7 in 10 vehicles being sold with flex fuel engines by 2006.• Brazil also provided tax exemptions and specific credit lines to sugar, ethanol and bioenergy industries.

77
The US is the largest producer and consumer of ethanol in the world. It produces around 58% of global ethanol. Corn has been the bedrock of ethanol production, which has grown from about 6 billion litres in 2000 to 53 billion litres in 2015. The growing ethanol market has benefited crop farmers by providing buoyancy to corn and associated commodity prices, and therefore the rural economy. Ethanol has become an important component of the USA’s environmental policy and a significant source of motor fuel.
Figure 17 depicts the ethanol production from 1975 to 2015 and key policies in the USA (Duffield J. A., 2015). The major policies affecting biofuel production and consumption are discussed thereafter.
4.4.3 UNITED STATES OF AMERICA
Subsidies for ethanol production in the USA began with the Energy Tax Act of 1978. This granted a USD 0.04 per gallon reduction in the motor fuels excise tax for E10 petrol. The excise tax subsidy rate was adjusted frequently till 2004, when it was replaced by Volumetric Ethanol Excise Tax Credit (VEETC). Between 1978 and 2004, the ethanol subsidy ranged from USD 0.4-0.6 per gallon.
From the late 1990s, farm legislation started to focus on renewable energy expansion. A provision in the US Department of Agriculture’s Appropriations Act (1999-2000) authorized the development of projects for harvesting biomass on waste lands. The US Department of Agriculture (USDA) also initiated the Commodity Credit Corporation Bioenergy Program to accelerate demand, alleviate crop surpluses and encourage production of biofuels from corn and other sources. USDA made cash payments to eligible ethanol and biodiesel producers who expanded the production facilities.
Renewable energy and agriculture sectors truly came together under the 2002 Farm Bill, which had a range of programs to promote bioenergy by providing up to USD 150 million per year in funding between 2003 and 2006. The 2008 Farm Bill continued to support renewable energy programs. However, most of USDA’s energy programs are aimed at advanced biofuels made from waste products, woody biomass, and other non-food sources (Duffield J. A., 2015).
FIGURE 17: HISTORICAL ETHANOL PRODUCTION AND POLICIES
60
50
40
30
20
10
01975 1978 1981 1984 1987 1990 1993 1996 1999 2002 2005 2008 2011 2014
Gasohol Excise tax concession l in 1978
In 2005, the Energy Policy Act targeted 28 billion litres by 2012
2008 Farm Bill
In 1992, Tax deductions on E85 vehicles
In 2004, the $0.51 VEETC was created
In 1999, California passed law to phase out MTBE
Billi
on L
itre
s

78
The American Jobs Creation Act of 2004 (Jobs Act) included several important energy provisions. This Act created the Volumetric Ethanol Excise Tax Credit (VEETC) that changed the basis of tax credit for ethanol on a volumetric basis instead of on mandated blends. VEETC provided oil companies the flexibility to blend any amount of ethanol into petrol to meet their octane and oxygenate needs, as long as ethanol did not exceed 10% in the blend (E10).
The Energy Policy Act (EPAct) of 2005 supported ethanol-blended fuel over MTBE as an additive. This law addressed the MTBE issue for the first time and effectively eliminated its future use in the USA. The Act also encouraged the use of ethanol by passing a Renewable Fuel Standard (RFS) with biofuel blending mandates. Expansion of RFS was made under the Energy Independence and Security Act of 2007 (RFS2).
Figure 18 shows how MTBE production was effectively eliminated in 2006-07, which corresponds with the high growth phase of ethanol.
RFS2 provisioned for 36 billion gallons of mandatory minimum annual volumes of renewable fuel to be used in national transportation fuel supplies through 2022 (Environment and Energy Study Institute (EESI), 2015). Of this, 15 billion gallons would be produced from corn starch ethanol, 16 billion gallons from cellulosic feedstocks and the remainder from advanced fuels and biomass diesel.
The US Environmental Protection Agency (EPA) uses Renewable Identification Numbers (RINs) to monitor the fuel compliance with the RFS2 mandates. The refiners or blenders need to demonstrate they have met the RFS quota by submission of RINs. With a well-designed trading and penalty structure, RFS compliance has generally been met in the US.
The technological set-backs in producing fuels from cellulose, draught, falling fuel prices and a well-funded campaign against biofuels from the oil industry led to a demand to cut RFS2 mandates (Sugarcane: A project of UNICA and ApexBrasil, 2015).
FIGURE 18: MTBE AND ETHANOL BLENDING IN USA
60
50
40
30
20
10
01978 1980 1982 1984 1986 1988 1990 1992 1994 1996 1998 2000 2002 2004 2006 2008 2010 2012 2014
Prod
ucti
on (B
illio
n lit
res)
ETHANOL MTBE
• USA is the largest producer and consumer of ethanol in the world, producing 58% of global ethanol.• Corn has been the bedrock of ethanol production and has benefited to crop farmers by providing buoyancy to corn and associated commodity prices and therefore, the rural economy.• USA has provided incentives through various acts in different domains to encourage use of ethanol and ethanol blended fuels.

79
Figure 19 shows the summary of key legislations related to ethanol from 1978 to 2005 (Tyner, 2006).
Ethanol tax incentive was extended to last until the year 2000 but decreased to $0.54 per gallon of ethanol
Omnibus Budget Reconciliation Act
Promoted energy conservation and domestic fuel development
Crude Oil Windfall Profit Tax Act and the Energy Security Act
Reduction of federal motor fuel excise tax on gasohol(E10) by $0.04 per gallon (translates to $0.4 per gallon of pure ethanol)
Energy Tax Act of 1978
Ethanol subsidies extended till the year 2007 but reduced to $0.51 per gallon of ethanol by 2005
Transportation Efficiency Act of the 21st Century
Acknowledged contribution of motor fuels to air pollution
Clean Air Act amendments
Increased tax exemption to $0.50 per gallon of ethanol and increased the petrol excise tax to $0.09 per gallon
Surface Transportation Assistance Act
Increased tax exemption to $0.06 per gallon of blended petrol
Tax Reform Act
Created research and development programs and provided fuel economy credits to automakers for manufacturing alternative-fuelled vehicles including E85s
Alternative Motor Fuels Act
Promoted the use of E85 ethanol blends and tax deductions allowed on vehicles that could run on E85
Energy Policy Act
Established the Renewable Fuel Standard starting at 4 billion gallons in 2006 and rising to 7.5 billion in 2012
Energy Policy ActChanged the mechanism of the ethanol subsidy to a blender tax credit instead of the previous excise tax exemption. Also extended the ethanol tax exemption to 2010
Jobs Creation Act
1978
1990
1980
19881984
1982
1990 1992 1998
2005 2004
While the USA has maintained a dominant position over the global biofuel market, developing countries like Brazil and the Philippines have shown how adaptability and resilience are the foundational pillars of a robust blending program based on national priorities. Paraguay, Thailand and Canada out-performed their blending targets on the back of clear policy direction and coordinated decision making. While case studies around the world show that there is no one-size-fits-all solution, successful blending program have sustained and thrived on bold and decisive steps taken by governments that have demonstrated the conviction to achieve clear policy objectives.
FIGURE 19: SUMMARY OF KEY LEGISLATION RELATED TO ETHANOL

80
This chapter aims to identify a set of recommendations that will help in potentially overcoming the challenges to ethanol blending in India. It elaborates on the solutions to deficiencies in the existing institutional framework, pricing/incentive mechanisms, transportation/storage arrangements, and market and value-chain linkages that have hampered the EBP Programme. In light of the international success stories discussed in the preceding chapter, this chapter contextualizes India’s unique opportunities to fill policy gaps, in a time-bound manner.
Based on these recommendations, this chapter also provides a roadmap to enable India to move towards the development of a biofuel-based economy. The recommendations in this chapter are based on stakeholder consultations with key government departments and ministries, and market participants. Furthermore, the recommendations reflect the global best practices that have been identified in the previous chapter.
From the country case studies mentioned in Chapter 4, there are certain policy approaches adopted by these countries that can be identified. While reliance is placed on these approaches, the recommendations provided in this chapter have been contextualized in order to reflect India’s domestic policy priorities as well.
The following best practices have been adopted by jurisdictions with successful ethanol-blending programs:
(1) Integration with public policy goals: Ethanol blending mandates are implemented keeping underlying policy priorities and objectives under consideration. For example, Brazil’s program was primarily focused on providing a safe harbour to its economy from unpredictable shocks in the global crude oil market. Other countries, including the Philippines, have implemented these mandates in order to further their environmental and industrial policy goals. Unless the broader policy objectives are clear and well recognized, implementation of blending programs tend to be ad-hoc and inconsistent.
(2) Implementation and administration: While ethanol blending programs often have significant advantages and provide substantial opportunities to key stakeholders, they may be stymied by a lack of institutional capacity in implementation. In order to leverage these opportunities, effective implementation of the program is paramount. Countries with successful programs have often created enabling frameworks wherein a particular agency or department is entrusted with overall implementation and coordination. However, this in itself is not sufficient unless there are simultaneous interventions that are made towards supporting research and development, incentives focusing on demand-side issues and allowing for flexibility in program implementation in the short run.
(3) Sustaining implementation: Even when jurisdictions have achieved blending rates, they have focused on sustaining these gains while accounting for variations in market conditions. It is important that program implementation allows for flexibility in order to adjust the program’s implementation to ground realities. For example, the Philippines ensured that a shortfall in domestic supply does not result in inconsistent implementation of its blending program, while focusing on incentives for the domestic industry.
5. TOWARDS FULFILLING INDIA’S BIOFUEL PROMISE

81
Through the application of these recommendations, it is possible to frame suitable policy measures related to ethanol—from the allocation of sugarcane, to marketing and distribution/sales of ethanol.
5.1 INSTITUTIONAL FRAMEWORK5.1.1 JURISDICTION ISSUES
In the context of overlapping jurisdictions over the production, processing and distribution of alcohol between the Centre and states, the Parliamentary Standing Committee on Petroleum and Natural Gas acknowledges that the Centre must exercise jurisdiction over the regulation of the bioethanol sector. With this, the procedural difficulties could be streamlined and the existing tax structure rationalized in order to align it with the objectives of the EBP Programme.
Additionally, the statutory provisions and the Supreme Court’s decisions as discussed in Table 9 provide a strong basis on which the central government may exclusively regulate ethanol production, transportation and blending with petrol. This significantly reduces regulatory uncertainty and jurisdictional confusion, and provides a clear direction and coherence to the EBP Programme. However, due consideration to local conditions in matters such as pricing (State Advised Price) may be retained and synchronized with national provisions such as Fixed Remunerative Price for sugarcane.
5.1.2 CONSTITUTION OF AN EMPOWERED BODY
Given the absence of a singular priority that defines India’s EBP Programme and the complex governance system at the national level regarding production, procurement and allocation of ethanol, conflicting interests of participating ministries have complicated the implementation of India’s ethanol blending program. It is important that there is policy clarity and a rationale for the EBP Programme. Further, it is more important that a standalone strategy is developed that is decoupled from legacy considerations. Therefore, it is recommended that a fulltime empowered decision-making body is constituted for effective implementation of the EBP Programme.
Although a National Biofuel Coordination Committee and a Biofuel Steering Committee have been constituted under the National Policy on Biofuels, neither committee possesses executive decision-making authority and are limited to playing analytical and advisory roles.
The empowered body must be entrusted with two broad functions: • Firstly, the implementation of the program (including procurement, blending and distribution) • Secondly, the coordination and feedback between various ministries.
This empowered body would mainly aim at preventing the effects of institutional and procedural issues on the EBP Programme. Additionally, provide strategies through periodic gap assessment to strictly implement the EBP Programme by bridging the supply shortfall.

82
In the context of costs involved in the processing and transport of ethanol, it is important to note the positive correlation (Figure 4) between the exemption of central excise duty on ethanol (charged at 12.5%) and the increased supply of ethanol. In the absence of this exemption, suppliers have little incentive to direct ethanol towards the EBP Programme.
The exemption of central excise duty provided an advantage of INR 5 per litre of ethanol to sugar mill and distillery owners. As demonstrated earlier, such an exemption has had a significant positive impact on the OMCs’ ability to procure ethanol in higher quantities. Accounting for future contingencies, the exemption could be phased out over a period of five years.
5.2 ETHANOL PRICING AND TAXES5.2.1 EXEMPTION FROM EXCISE DUTY
5.2.2 PRICING STRATEGYIn August 2016, the procurement price of ethanol was revised to INR 39 per litre. The Government of India, while providing context on the revision, stated that this revision was made keeping in mind a fall in crude oil prices, under-recoveries by OMCs and a recovery in sugar prices that would work in the favour of sugar mills. Furthermore, it introduced the scope for a mid-term revision of this price during the ethanol price period, “depending upon prevailing economic situation and other relevant factors”. Thus an element of uncertainty was introduced in the market and the potential for a rational pricing framework was limited.
As demonstrated in Chapter 3, a key function of fuel ethanol would be to reduce the negative impact of crude volatility. Linking ethanol pricing to crude oil markets will erode the economic advantage of ethanol
In 2015, ethanol cost around INR 45-46 per litre at the mill gate which was then sold to OMC depots at INR 48-49 per litre (Mukherjee, Excise duty concession on ethanol withdrawn for sugar mills, 2016). This price was revised in August 2016 to INR 39 per litre. If the excise duty is exempted, it improves the margins of mill owners supplying to OMCs. OMCs should also maintain strict adherence to the prices set by the CCEA to prevent a repetition of past performance in procurement.
Further, it is paramount to ensure that under the new GST regime, blending ethanol is subject to uniformity of concessions across jurisdictions. Refunds for duties/charges on input goods and services used for ethanol production should be made available to ethanol suppliers in a hassle-free manner. Additionally, it must be recognized that the excise duty framework would also be subsumed under the GST regime. Therefore, it is important that fuel ethanol suppliers may avail an exemption on such duties in order to ensure cost recovery.

83
5.3 TRANSPORTATION AND STORAGE5.3.1 INTER-STATE MOVEMENT OF ETHANOLIn order to ensure seamless mill-to-refinery movement of ethanol, it is important that the transport of ethanol from producing to non-producing states be simplified, especially for its processing into fuel-grade ethanol, to be used for blending. It should be noted that permits required for inter-state movement of ethanol are linked to states’ concerns in ensuring stable ethanol supply for local industries, since the potable alcohol industry is a significant source of revenue.
In order to balance states’ concerns with efficiency requirements, a unified permits system for the EBP Programme may be devised. This online system may simply require a certification from procuring entities (OMCs) to suppliers (mills and distilleries). This certification could replace the requirement of physical No Objection Certificates under the current regime.
The duration of the permits for transporting ethanol should be extended to an annual basis, since bureaucratic hassle in renewal of licenses and permits can lead to avoidable delays.
Further, OMCs need to have functional depots in the vicinity of sugar mills or distilleries, where the cost (including mark-ups) of ethanol can be fully realized as set by the CCEA, including transportation and other charges/taxes.
and stymie the EBP Programme. This could drive the mills and distilleries to sell elsewhere. A rational pricing policy in the current context should aim at securing supplies of ethanol and ensuring market stability.
During stakeholder consultation with Ms. Varsha Joshi, Joint Secretary, Ministry of New and Renewable Energy (discussions on 21 September 2016), it was stated that a scientific approach to price setting that accounts for fluctuations in agricultural markets, transportation costs and international markets is necessary. The prices and even pricing mechanisms should undergo periodic reviews for market corrections. However, it must be ensured that review of pricing is not arbitrary and unpredictable. In order to do so, the objectives of the pricing policy should be transparent and fair. Therefore, it is necessary that there is a gradual process of decoupling considerations external to OMCs from pricing determinations. This would ensure that OMCs are in a position to procure ethanol for the long term with assured sustainability in supply and stability in prices.
5.3.2 BLENDING AT PETROL STATIONSFrom our stakeholder consultations with Karnataka State Council for Science and Technology, it was stated that in order to account for variations in geography and infrastructure, permitting blending facilities at petrol stations must be considered. This would ensure that only the specific amount of ethanol will be transported to each of the stations according to their capacity.
Since the process of blending is not technically demanding, it can be carried out at petrol stations without much difficulty. Storage arrangements at OMCs have largely been inadequate;

84
they can hold only few days of ethanol reserves. This issue has contributed to suboptimal outcomes. Blending at stations will also address the storage constraints at OMCs since petrol stations can better estimate and purchase adequate amounts for blending on a regular basis without the risk of demurrage.
Apart from solving storage issues, the aforementioned approach is likely to reduce transportation costs since ethanol need not be transported in bulk all the way to the oil terminal, often located at considerably long distances. The proposed approach will lower loads and distances. It has been observed that an increase in the load of a carrier results in significant reduction in fuel economy, i.e., for each 10,000 pound increase in load, the fuel economy drops by 5% (Good Year Tyres and Rubber Company, 2008).
Distributed supply of ethanol-blended petrol to fuelling stations involves lesser average load on trucks/carriers and therefore lowers specific fuel costs, compared to bulk transportation of ethanol from distilleries to OMC terminals and its further transportation to fuelling stations. However, it is also true that this measure will lead to increase in the number of trips, while the trip lengths will considerably reduce. The overall effect of these measures needs to be studied on a case-by-case basis.
A thorough study of existing infrastructure and logistics needs to be undertaken to obtain the most efficient transport and logistics arrangements. The framework should be flexible to obtain optimum solutions based on the relative distances between distilleries, OMCs and fuelling stations.
5.4 ETHANOL SOURCESSection 2.3 of this paper demonstrates how future ethanol production in the country will not be able to support even current levels of blending. This is of serious concern since the EBP Programme was envisaged to largely be driven by domestic production. On the other hand, it is shown in Section 3.2 that importing ethanol to replace petrol will lead to trade balance improvements over the medium term, with the extent of this benefit directly proportional to the level of import demand (and therefore to blending rates).
Over-reliance on any one route will not solve India’s fuel ethanol supply shortfall. Therefore, it is important that ethanol procurement is undertaken with a view towards diversification and cost-effectiveness with a stated priority to enable energy security. Planned and coordinated efforts can only help meeting ethanol blending targets.
5.4.1 SUPPORTING DOMESTIC CAPACITYIn our stakeholder consultations with Mr. Subodh Kumar, General Manager, Indian Oil Corporation Limited it was stated that, apart from reduction of emissions, the key objective of the EBP Programme was to reduce the dependence on imported crude oil. However, the OMCs’ sole reliance on domestic ethanol supply has resulted in inconsistent outcomes.
Therefore, it is important that investments and support mechanisms must be devised in order to support the domestic industry. Some of these measures include investments in R&D in processing technology as well as sugarcane yields, and financial incentives to suppliers and domestic processing units (including standalone distilleries).
Since many states are facing the problem of oversupply of sugarcane, direct ethanol production from sugarcane juice could result in effective utilisation of excess cane. One ton of sugarcane produces around

85
5.4.2 PROCUREMENT FROM INTERNATIONAL MARKETSAs crude oil prices recover globally, the case for imported ethanol will become immediately apparent. Decadal trends in global crude and ethanol prices (Annexure) also show how ethanol will be a good bet against crude price inflation. However, it is important to have a well-informed procurement strategy for imported ethanol. After accounting for future shortfalls based on past data, this could take the shape of long-term contracts to obtain maximum price advantage over crude oil or petrol, with scheduled and unscheduled reviews. In our stakeholder consultations, an expert from NITI Aayog opined that for a diversified energy basket and to address balance of payments in the long term, a source-neutral procurement strategy should be adopted, which could also potentially improve domestic competitiveness and reduce potential competition of agricultural resources between food
5.4.3 INVESTING ABROADAnother means for the government to help Indian companies obtain ethanol is by supporting them to
72 litres of hydrous ethanol (95% anhydrous), thus 35.1 Mt (10% of total 351 Mt) of cane can produce 2,527 million litres of ethanol. This is equivalent to 2,393 million litres of anhydrous ethanol.
Sugarcane bagasse could be an alternative option for ethanol production due to its easy availability at sugar mills.5 By allocating surplus quantity of bagasse for ethanol production, there is a potential to increase the ethanol production in sugar mills. By utilising only 10% of the currently available bagasse, approximately 1,300 million litres of ethanol can be produced (Bharadwaj, 2007).
Furthermore, in order to expand domestic production, it may also be an appropriate time to encourage domestic processing units to acquire intermediate products internationally that may be processed to fuel-grade ethanol domestically.
and fuel production.
The Standing Committee on Petroleum and Natural Gas also stated that the last time a global tender was offered for import of fuel ethanol was over two years ago. However, this was at a time when the global market conditions were not conducive for competitive procurement. In this light, it would be appropriate that prevailing prices of ethanol in the international markets are tracked in order to allow import of ethanol for blending in favourable times. Thus, it must be underscored that any international procurement policy for ethanol must recognise that long-term procurement contracts lead to competitive price discovery for OMCs; while ad-hoc procurement measures result in unpredictable and ineffective price discovery.
5 Cellulose content in bagasse is approximately 35%
86
acquire plantations in sugarcane rich countries and have integrated distilleries. There are a handful of Indian companies that have sugarcane plantations abroad. For example, Renuka Sugar has four plantations in Brazil along with its own distilleries (Shree Renuka Sugars Limited).
Owing to irregularities in rainfall, and water and land shortages domestically, companies planning sugarcane plantations or distilleries abroad should be provided incentives and relaxations in import duties. The ethanol produced via this route should be prioritized for the EBP Programme.
Another advantage of encouraging Indian-owned plantations abroad is the regular ethanol supply due to complementary sugarcane crushing season in major sugarcane-producing countries like Brazil. Also, since sugarcane is a highly water-demanding crop and expanding the area under cultivation in India is relatively difficult, this step can be promoted to ensure stable supply of ethanol throughout the year.
5.6 SPURRING DOMESTIC RESEARCH AND DEVELOPMENT5.6.1 R&D IN SUGARCANE PRODUCTION EFFICIENCY
5.5 MARKET HURDLES5.5.1 DIVERSIFYING MARKETSTaking into account the financial problems faced by the key stakeholders in the supply chain such as farmers and sugar mills, the upstream prices and supply allocation need to be streamlined. In order to minimise losses and delay in payments during periods of depressed sugar prices, surplus sugarcane juice can be diverted for ethanol production to stabilize sugar prices and enhance domestic supply.
5.5.2 SUPPORTING COGENERATIONSugar mills have been involved in cogeneration since bagasse is available in plenty as a by-product. To reduce the economic burden on sugar mills, it is suggested that surplus power from cogeneration in sugar mills be purchased on priority by State Electricity Boards (SEBs). The revenue generated from this can be used to clear the arrears in payments owed to sugarcane growers and sustain the value chain.
One such case is in Karnataka, the third largest sugarcane producer, where about 30 private sugar mills in Karnataka have offered to sell 500 MW of power using bagasse cogeneration. The Karnataka Electricity Regulatory Commission (KERC) fixed INR 4.67 as the tariff payable for the short-term power the utilities bought from private generators, including sugar mills, for the period between September 2015 and May 2016 (Press Trust of India, 2016).
5.5.3 SUPPORTING FARMERSFarmers involved in the cultivation of sugarcane must be provided with the necessary inputs at affordable rates so as to encourage them to follow the cultivation cycle of sugarcane without switching to other crops. In order to ensure viability of sugarcane cultivation, farmers must be protected from the vagaries of nature and other exogenous circumstances by providing adequate irrigation and resilience support.
Sugarcane has a long germination time of about 40-45 days. The Indian Institute for Sugarcane Research (IISR) is undertaking research to reduce the germination time of sugarcane to approximately 20-25 days. Research is being conducted to improve sugarcane yields to 110 tons per hectare by 2030 (Indian Institute

87
of Sugarcane Research, 2011).
Domestically, there needs to be greater emphasis on developing and disseminating efficient input technologies such as fast germinating and high-yielding varieties in order to achieve a greater level of
5.6.2 DIVERSIFYING FEEDSTOCKThe Parliamentary Standing Committee on Petroleum and Natural Gas has noted that the OMCs’ sole reliance on molasses for ethanol can potentially limit the EBP Programme. The Standing Committee has encouraged the production of ethanol from a variety of feedstocks based on edible/non-edible products. It has also acknowledged that more resources need to be allocated for research and development on this subject. The Committee recommended setting up of an industry working group to study the feasibility of ethanol production from other sources.
In this regard, it must be noted that ethanol is currently produced from C-Heavy molasses or “final molasses”. C-heavy molasses is the end product in sugarcane processing. However, B-heavy molasses is an intermediate product which has the potential to increase existing ethanol production substantially. It was stated in our stakeholder consultations with Mr. Abinash Verma, Director General, ISMA that a movement towards B-heavy molasses alone can potentially improve the supply position from 3,120 million litres currently, up to 5,850 million litres.
Similarly, the National Policy on Biofuels encourages the use of new and second generation feedstocks, advanced technologies and conversion processes (Ministry of New & Renewable Energy, 2009). The policy also proposed a National Biofuel Fund to provide financial incentives for the same. Till date, however, there has been no specific fund allocation for this purpose.
While these technologies are still only at research and development stage, adequate emphasis on this aspect can significantly boost India’s ethanol production in the longer term (Ministry of Petroleum & Natural Gas, 2015). In the shorter term, it thus becomes important to encourage the use of technology to produce greater yields of sugarcane for ethanol production and make the process more efficient. During our stakeholder consultations with Ms. Varsha Joshi, Joint Secretary, Ministry of New and Renewable Energy (discussions on 21 September 2016), it was stated that second generation technologies have the potential to complement first-generation technologies and, while broadening the resource base by utilising otherwise unusable biomass, also contribute to the local economy by augmenting farmer incomes.
sugarcane production to meet the requirements of the ethanol industry.
There is also an increasing need to mechanise sugarcane production across the production cycle, from the initial stages of planting to harvesting and loading. Mechanisation will help improve the overall energy use efficiency of sugarcane-based farming (Indian Institute of Sugarcane Research, 2011).
Furthermore, as sugarcane production is water intensive, stakeholder consultations with Prof. (Dr.) Vibha Dhawan, Senior
Director, The Energy and Resources Institute (TERI) reveal that there exist technologies which have the potential to increase sugarcane yield while also using 40-60% less water. The suitability of these technologies to Indian conditions and technology transfer mechanisms should be studied.

88
Timeline/
Category
Short Term
(0-2 years)
Medium Term
(2-5 years)
Long Term
(5-7 years)
Fiscal and
Financial
• Rationalise excise duty on
ethanol
• Debt relief for sugarcane
farmers
• Concessional loans for
distilleries supplying to OMCs
and interest-free debt for
standalone mills to establish
distilleries
• Interest-free loans to
standalone mills in order to
establish distilleries
• Explore hedging options against price fluctuations of
imported ethanol
• Duty exemption on ethanol supplied for the EBP
Programme
Next
Generation
Biofuels
Identification of technologies
and sources for second-
generation ethanol for state
adoption
• Pilot-scale projects
on second- and third-
generation biofuel
• Scale-up next generation
technologies to reduce
dependence on
agricultural markets
Technological • Explore blend wall for
ethanol based on existing
vehicular technologies
• Develop a roadmap for
scaling-up blending rates in
partnership with MoRTH.
• Investments in
sugarcane research to
improve crop efficiency
• Pilot testing of FFVs and
hybrid vehicles
• Develop indigenous
manufacturing capabilities
that support higher blend
rates
The subsequent table presents a roadmap that has been prepared on the basis of these recommendations. The roadmap charts short-term, medium-term and long-term milestones with respect to certain key measures - fiscal, financial, technological, logistics, market practices and next generation biofuels. The roadmap accounts for specific roadblocks that have been identified and provides specific institutional interventions that may be necessary for a shift towards a broader biofuels-based economy. The roadmap also relies on the abovementioned global best practices with regard to fuel blending, and proposes solutions incorporating concerns of key stakeholders.
While in the short-term, the focus is on supporting and stabilising existing capacity potential, the medium-term focuses on institutional interventions that are necessary to create an enabling environment for some of the desired outcomes. The long-term recommendations are aimed at laying the foundation for a shift solely from fuel blending towards enabling India’s global leadership in biofuels.
Table 30: Roadmap for the EBP Programme

89
Timeline/
Category
Short Term
(0-2 years)
Medium Term
(2-5 years)
Long Term
(5-7 years)
Technological Utilise ‘Make in India’ program
to absorb efficient ethanol
production technologies.
• Programs to phase out MTBE
usage including investments
in technology upgrade at
refineries/depots
• Encourage increased
production of ethanol
from intermediate
(B-heavy) molasses
• Incentive framework for
FFVs and hybrids including
incentives for consumers
to shift preferences
Markets • Set procurement targets for
OMCs and production targets
for suppliers
• Explore long-term
international procurement
contracts subject to periodic
pricing review to meet
shortfall
• Offer stable price signals
for domestic markets to
overcome variability in
sugarcane production
• Ease procurement
bottlenecks for non-sugarcane
producing states
• Establish and
implement fair pricing
mechanisms across the
value chain for the EBP
Programme
• Offer more advanced
choices by supporting
FFVs and compatible
facilities at petrol pumps
• Ease regulatory
provisions to ensure
competitiveness with
global markets
• Export surplus petrol
obtained due to blending
Logistics • Review existing transport
and storage arrangements
and mandate capacity
expansion, if required
• Allow flexibility to petrol
pumps to procure ethanol
directly from distilleries in the
vicinity
• Single window online
certification system for inter-
state ethanol movement
• Explore alternate,
efficient modes such
as railways and inland
water transport
• Develop and use GIS-
enabled optimization
techniques for location,
transport and storage
decisions

90
Agro Chart. (2015). Brazil Biofuels Annual . Retrieved September 15, 2016, from http://www.agrochart.com/en/news/2616/brazil-biofuels-annual-aug-2015.htmlAlternative Fuels Data Center. (2012, April 2). Blender Pump Dispensers. Retrieved Oct 14, 2016, from U.S.Department of Energy: Alternative Fuels Data CenterAlternative Fuels Data Center. (2016). (U.S.Department of Energy ) Retrieved Oct 14, 2016, from U.S.Department of Energy: http://www.afdc.energy.gov/fuels/ethanol_e85.htmlAmerican Diplomacy. (2008). Reflections of United States-Brazil Cooperation on Biofuels. Retrieved from American Diplomacy: http://www.unc.edu/depts/diplomat/item/2008/1012/comm/langevin_biofeul.htmlAnuszka, M. (2008). Biofuels:Facing the new environmental challenges. Futures & Options World. Retrieved from http://www.fow.com/1973026/Biofuels-Facing-the-new-environmental-challenges.htmlAradhey, A. (2013). Biofuels Annual. Global Agricultural Information Network. Retrieved from http://gain.fas.usda.gov/Recent%20GAIN%20Publications/Biofuels%20Annual_New%20Delhi_India_8-13-2013.pdfBarros, S. (2012). Brazil Biofuels-Annual Report 2012. Sao Paulo: Global Agricultural Information Network. Retrieved from http://gain.fas.usda.gov/Recent%20GAIN%20Publications/Biofuels%20Annual_Sao%20Paulo%20ATO_Brazil_8-21-2012.pdfBarros, S. (2015). Biofuels Annual-Brazil 2015. Global Agricultural Information Network. Retrieved from http://gain.fas.usda.gov/Recent%20GAIN%20Publications/Biofuels%20Annual_Sao%20Paulo%20ATO_Brazil_8-4-2015.pdfBharadwaj, A. E. (2007). Scoping Technology Options for India’s Oil Security: Part I – Ethanol for Petrol. 92.Biofuels International. (2016, April 15). Market study: Global biofuels market to grow to $246bn by 2024. Retrieved September 22, 2016, from http://biofuels-news.com/display_news/10395/Market_study__Global_biofuels_market_to_grow_to__246bn_by_2024/Bob Katter. (2015). 2015 World Biofuels’ Incorporation Rates. Retrieved from www.bobkatter.com: http://www.bobkatter.com.au/page/attachment/23/2015-world-ethanol-mapCabinet Committee on Economic Affairs (CCEA). (2014). Press Information Bureau Government of India Cabinet Committee on Economic Affairs (CCEA). Government of India. Retrieved from http://pib.nic.in/newsite/PrintRelease.aspx?relid=113063Cabinet Committee on Economic Affairs (CCEA). (2016). Cabinet approves revision of ethanol price for supply to Public Sector Oil Marketing Companies. Government of India. Retrieved from http://pib.nic.in/newsite/PrintRelease.aspx?relid=151608California Energy Commission. (2004). Ethanol Fuel Incentives Applied in the U.S. California: California Energy Commission. Retrieved from http://www.energy.ca.gov/reports/2004-02-03_600-04-001.PDFCambridge University Press. (2014). Climate Change 2014 Mitigation of Climate Change. Cambridge University Press. Retrieved from https://www.ipcc.ch/pdf/assessment-report/ar5/wg3/ipcc_wg3_ar5_full.pdfCentral Pollution Control Board. (2016). Vehicular Exhaust. Retrieved from Central Pollution Control
REFERENCES

91
Board: http://www.cpcb.nic.in/Vehicular_Exhaust.phpCharlotta Jull et.al. (2007). Recent Trends in The Law and Policy of Bioenergy Production, Promotion and Use. United nations: FAO. Retrieved from http://www.fao.org/3/a-bb101e.pdfChowdhuri, R. D. (2014). India overtakes Japan as world’s No.3 crude importer. Retrieved from Reuters: http://in.reuters.com/article/india-japan-crude-oil-import-idINDEEA0T06Q20140130Congress of the Philippines. (2006). Republic Act No 9367. Manila: Congress of The Philippines. Retrieved from https://www.senate.gov.ph/republic_acts/ra%209367.pdfCountry Partners Cooperative. (2014, March 1). Will the Ethanol “Blend Wall” Block Biofuels Growth? Retrieved from Country Partners Cooperative: http://www.countrypartnerscoop.com/News/Will-the-Ethanol-Blend-Wall-Block-Biofuels-Growth-2014-01-03/1185CSTEP. (2015). Quality of Life for All: A Sustainable Development Framework for India’s Climate Policy. Bangalore: CSTEP. Retrieved from http://www.cstep.in/uploads/default/files/publications/stuff/58fc41cccff9acf678dea2ffa24f8f28.pdfDeloitte. (2016). Price Forecast March 31, 2016. California: Deloitte. Retrieved from https://www2.deloitte.com/content/dam/Deloitte/ca/Documents/resource-evaluation-and-advisory/ca-en-rea-price-forecast-march-2016.PDFDepartment of Food & Public Distribution. (2012). Sugar and SugarCane Policy. Retrieved from http://dfpd.nic.in/sugar-sugarcane-policy.htmDuffield, J. A. (2015). U.S. Ethanol: An Examination of Policy, Production, Use, Distribution and Market Interactions. United States Department of Agriculture. Retrieved from http://www.usda.gov/oce/reports/energy/EthanolExamination102015.pdfEconomic Times. (2014, April 23). Government’s ethanol fuel blending plan falls short of target. Economic Times.Economic Times. (2015, October 20). Government may pay sugarcane growers direct to help mills. India: Economic Times. Retrieved from http://economictimes.indiatimes.com/news/economy/agriculture/government-may-pay-sugarcane-growers-direct-to-help-mills/articleshow/49471266.cmsEconomic Times. (2016, April 19). Govt urges industry to boost ethanol output;assures purchase. Economic Times.Energy Information Administration. (2016). Petrol and other liquids. Energy Information Administration. Retrieved from https://www.eia.gov/dnav/pet/PET_MOVE_EXPC_A_EPOOXE_EEX_MBBL_M.htmEnvironment and Energy Study Institute (EESI). (2015). EPA Releases Renewable Fuel Volumes:But You May Ask Yourself, Just How did we get here? Washington DC: EESI. Retrieved from www.eesi.org/articles/view/epa-releases-renewable-fuel-volumes-but-you-may-ask-yourself-just-how-did-wEnvironmental and Energy Study Institute. (2015). Fact Sheet: High Octane Fuels: Challenges & Opportunities. Environmental and Energy Study Institute. Retrieved from http://www.eesi.org/papers/view/fact-sheet-high-octane-fuels-challenges-opportunitiesEthanol history. (2010-11). Ethanol History - From Alcohol to Car Fuel. (ethanolhistory) Retrieved 2010-11, from Ethanol history: http://www.ethanolhistory.com/Ethanol Renewable Fuel Association. (2016). Retrieved September 20, 2016, from Ethanolrfa: http://ethanolrfa.org/resources/industry/statistics/#1454098996479-8715d404-e546Ethanolrfa. (2016, February). Ethanol Exports & Imports: Octane Drives Export Growth. Retrieved September 16, 2016, from http://www.ethanolrfa.org/wp-content/uploads/2016/02/2016-Issue-Brief_

92
Ethanol-Exports-and-Imports.pdfFeller, G., & Tom, P. (2006, December 15). What Brazil can teach the U.S. about energy and ethanol. GRIST.Food and Agricultural Organization (FAO). (2008). Biofuels:Prospects,Risk &Opportunities. Rome: Food and Agricultural Organization of United Nations. Retrieved from ftp://ftp.fao.org/docrep/fao/011/i0100e/i0100e.pdfG Basavaraj, P. P. (2012). A Review of the National Biofuel Policy in India: A critique of the Need to Promote Alternative Feedstocks. Patancheru, Andhra Pradesh: International Crops Research Institute for the Semi Acrid Tropics. Retrieved from http://oar.icrisat.org/6520/1/WPS_34.pdfGasboy. (2008, May). Federal Ethanol Infrastructure Incentives and Legislation. Retrieved from Gasboy: www.veeder.com/gold/download.cfm?doc_id=9510Global CCS Institute. (2016). Canada. Retrieved Oct 14, 2016, from Global CCS Institute: http://hub.globalccsinstitute.com/publications/biofuels-policies-standards-and-technologies/canadaGlobal Renewable Fuels Alliance. (2016, Jan 03). Global Biofuel Mandates. Retrieved from Global Renewable Fuels Alliance: http://globalrfa.org/biofuels-map/Gonsalves B, J. (2006). An Assessment of the biofuel industry in India. United Nations Conference on Trade and Development. Geneva: United Nations.Good Year Tyres and Rubber Company. (2008, March). Factors affecting Truck Fuel Economy. Retrieved from https://www.goodyeartrucktires.com/pdf/resources/publications/factors_affecting_truck_fuel_economy.pdfGovernment of India. (2014). Auto Fuel Vision and Policy 2025. Retrieved from http://petroleum.nic.in/docs/autopol.pdfGovernment of India. (2015). Amendment in the First Schedule of Industries (Development and Regulation) Act, 1951 to transfer the authority to regulate ‘potable alcohol’ to States . Press Information Bureau Government of India. Retrieved from http://pib.nic.in/newsite/PrintRelease.aspx?relid=126745Government of India-Ministry of Petroleum & Natural Gas. (2010). Implementation of Ethanol Blended Petrol (EBP) Programme in the country (Except North-Eastern States, J&K, Andaman & Nicobar and Lakshdweep). Government of India-Ministry of Petroleum & Natural Gas. Retrieved from http://www.pib.nic.in/newsite/erelease.aspx?relid=64787Guarieiro, L. L. (2013). Vehicle Emissions: What Will Change with Use of Biofuels? In Biofuels - Economy, Environment and Sustainability. Brazil: INTECH. Retrieved from http://cdn.intechopen.com/pdfs-wm/42164.pdfGueiros, D. N. (2013). The Evolution of the Brazilian Regulation of Ethanol and Possible Lessons for the United States. CASSUTO_FINAL. Retrieved from https://hosted.law.wisc.edu/wordpress/wilj/files/2014/04/Cassuto_print.pdfGunitilake, H. (2014). Energy Security, Food Security and Economics of Sugarcane Bioethanol in India. Journal of Sustainable Development, 7(1). Retrieved from https://www.adb.org/sites/default/files/publication/28880/economics-wp255.pdfHinkson, K. (2016, July 26). Why is Canada phasing out the DOT-111 rail cars early? Retrieved from CBC News: http://www.cbc.ca/news/canada/montreal/dot-111-rail-car-replace-tc-117-1.3694729Ibeto, A. O. (2010, October 12). A Global Overview of Biomass Potentials for Bioethanol Productions: A Renewable Alternative Fuel. Science Alert.ICCT. (2016, October 16). India: Fuels: Diesel and Gasoline. Retrieved from http://transportpolicy.net:

93
http://transportpolicy.net/index.php?title=India:_Fuels:_Diesel_and_GasolineIndian Institute of Sugarcane Research. (2011). Vision 2030. Indian Institute of Sugarcane Research. Retrieved from http://www.iisr.nic.in/IISRVision2030.pdfIndian Sugarmills Association. (2016). Statistics: Indian Sugar Mills Association. Retrieved October 2016, from www.indiansugar.com: http://www.indiansugar.com/Statics.aspxIndiansugar.com. (2016). List of Ethanol Producers 2015-16. Retrieved from indiansugar.com: www.indiansugar.com/PDFS/List-ethanol_producers-2015-16.pdfInstitute for Powertrains and Automotive Technology. (2014). Meta-analysis for an E20/25 technical development study - Task 2: Meta-analysis of E20/25 trial reports and associated data. Institute for Powertrains and Automotive Technology. Retrieved from https://ec.europa.eu/energy/sites/ener/files/documents/Meta-Analysis_ReportFinal.pdfInternational Energy Agency (IEA). (2011). Technology Roadmap-Biofuels for Transport. France: International Energy Agency (IEA). Retrieved from http://www.iea.org/publications/freepublications/publication/biofuels_roadmap_web.pdfInternational Energy Agency. (2004). Biofuels for Transport: An International Perspective. International Energy Agency. Retrieved from http://www.cti2000.it/Bionett/All-2004-004%20IEA%20biofuels%20report.pdfInternational Trade Administration. (2015). 2015 Top Markets Report-Renewable Fuels. U.S.: International Trade Administration. Retrieved from http://trade.gov/topmarkets/pdf/Renewable_Fuels_Top_Markets_Report.pdfJha, D. K. (2016). After 3 years of trying, India to achieve 5% ethanol blending. Business Standard. Retrieved from http://www.business-standard.com/article/markets/after-3-years-of-trying-india-to-achieve-5-ethanol-blending-116042000303_1.htmlLane, J. (2016, January 03). Biofuel Mandates Around the World;2016. Retrieved from Biofuel Digest: http://www.biofuelsdigest.com/bdigest/2016/01/03/biofuels-mandates-around-the-world-2016/Larsen, U., Johansen, T., & Schramm, J. (2009). Ethanol as a Future Fuel for Road Transportation. Technical University of Denmark (DTU)-IEA-AMF. Retrieved from http://orbit.dtu.dk/files/5237040/annex35report_final.pdfMaria, A. A. (2015). Strengthening Brazil’s Global Competitiveness in Ethanol: What are the Next Steps? 4th Annual EU Biofuels Seminar. Geneva.Ministry of Consumer Affairs, Food and Public Distribution. (2016, February). Payment of Outstanding dues of Sugarcane Growers. Retrieved October 15, 2016, from www.indiansugar.com: http://www.indiansugar.com/PDFS/PAYMENT_OF_OUTSTANDING_DUES_OF_SUGARCANE_GROWERS-_RS-BS.pdfMinistry of New & Renewable Energy. (2009). National Policy on Biofuels. Retrieved from http://mnre.gov.in/file-manager/UserFiles/biofuel_policy.pdfMinistry of Petroleum & Natural Gas. (2014). Ethanol Blended Petrol & Bio diesel Policy. New Delhi: Ministry of Petroleum & Natural Gas. Retrieved from http://164.100.47.134/lsscommittee/Petroleum%20&%20Natural%20Gas/16_Petroleum_And_Natural_Gas_7.pdfMinistry of Petroleum & Natural Gas. (2015). Standing Committee on Petroleum & Natural Gas (2014-15). New Delhi: Lok Sabha Secretariat. Retrieved from http://164.100.47.134/lsscommittee/Petroleum%20&%20Natural%20Gas/16_Petroleum_And_Natural_Gas_7.pdfMinistry of Petroleum & Natural Gas. (2015). Standing Committee on Petroleum & Natural Gas

94
(2015-16). New Delhi: Lok Sabha Secretariat. Retrieved from http://164.100.47.134/lsscommittee/Petroleum%20&%20Natural%20Gas/16_Petroleum_And_Natural_Gas_11.pdfMinistry of Petroleum & Natural Gas. (2016). Press Information Bureau Government of India Ministry of Petroleum & Natural Gas. Ministry of Petroleum & Natural Gas. Retrieved from http://pib.nic.in/newsite/PrintRelease.aspx?relid=145333Ministry of Petroleum and Natural Gas. (2015). The Gazette of India-REGD. NO. D. L.-33004/99. Retrieved from http://petroleum.nic.in/docs/dist/GSR%20621%20(E)%2010.08.2015.pdfMinistry of Petroleum and Natural Gas. (2016, October 4). Demand Projection XII and XIII Plan, Forecast and Analysis: Petroleum Planning and Analysis Cell. Retrieved October 2016, from ppac.org.in: http://ppac.org.in/content/7_1_ForecastandAnalysis.aspxMinistry of Statistics and Programme Implementation. (2015). Statistics Related to Climate Change - India. New Delhi: Ministry of Statistics and Programme Implementation. Retrieved from http://mospi.nic.in/Mospi_New/upload/climateChangeStat2015.pdfMukherjee, S. (2016, August 12). Excise duty concession on ethanol withdrawn for sugar mills. Business Standard. Retrieved from http://www.business-standard.com/article/economy-policy/excise-duty-concession-on-ethanol-withdrawn-for-sugar-mills-116081201357_1.htmlNaidenko, O. V. (2009). Ethanol-Gasoline Fuel Blends May Cause Human Health Risks and Engine Issues. Washington DC: Environmental Working Group. Retrieved from http://www.ewg.org/sites/default/files/ethanol-gasoline-white-paper.pdfNaik, R. (2001). Use ethanol, reduce oil imports and help sugarcane farmers. Retrieved from Press Information Bureau: http://pib.nic.in/feature/feyr2001/fjun2001/f210620011.htmlNTI . (2016, May 09). ASEAN Regional Forum (ARF) Membership. Retrieved from NTI Build a safer world: http://www.nti.org/learn/treaties-and-regimes/association-southeast-asian-nations-asean/OECD Library. (2015). Development of the world ethanol market . Retrieved from OECD Library: http://dx.doi.org/10.1787/agr-outl-data-enOrganisation for Economic Co-operation and Development. (2015). OECD-FAO Agricultural Outlook 2015. OECD-FAO. doi:04/06/2015Pacific Biodiesel. (2016, Oct 23). History of Biodiesel fuel. Retrieved from Pacific Biodiesel: http://www.biodiesel.com/biodiesel/history/Petroleum Planning and Analysis Cell. (2016, August 3). Petroluem: Petroleum Planning and Analysis Cell. Retrieved October 2016, from www.ppac.org.in: http://ppac.org.in/content/212_1_ImportExport.aspxPitney Bowes-Global Trade Solutions. (2016). https://www.dutycalculator.com/hs-lookup/9828/hs-tariff-code-for-ethanol-96/. Retrieved 10 19, 2016, from Pitney Bowes-Global Trade Solutions: http://www.agricultura.gov.br/arq_editor/file/Desenvolvimento_Sustentavel/Agroenergia/anuario_agroenergia/Planning Commission, Report of the Committee on the Development of Biofuels, 2003Press Trust of India. (2016, September 22). ‘Buy power, help us pay cane farmers’. India: Economic Times.Press Trust of India. (2016, August 11). Government to align ethanol prices with global market. Economic Times.Rebecca, D. (2013, June 4). Tax reduction for the Automotive Industry in Brazil. The Brazil Business. Retrieved September 2016

95
Renewable Energy Policy Network for the 21st Century. (2015). RENEWABLES 2015-Global Status Report. Renewable Energy Policy Network for the 21st Century. Retrieved from http://www.ren21.net/wp-content/uploads/2015/07/REN12-GSR2015_Onlinebook_low1.pdfRenewable Fuel Association. (2016). Blend Wall. Retrieved 2016, from Renewable Fuel Association : http://ethanolrfa.org/issues/blend-wall/Renewable Fuel Association. (2016). Fueling a High Octane Future. United States: Renewable Fuel Association. Retrieved from http://www.ethanolrfa.org/wp-content/uploads/2016/02/Ethanol-Industry-Outlook-2016.pdfRenewable Fuel Association. (2016). World Fuel Ethanol Production. Washington DC: Renewable Fuel association. Retrieved from http://ethanolrfa.org/resources/industry/statistics/#1454098996479-8715d404-e546Renewable Fuel Standards. (2016). How is energy made? Retrieved Oct 20, 2016, from Renewable Fuel Standards: http://ethanolrfa.org/how-ethanol-is-made/Renewable Fuels Association. (2015). World Fuel Ethanol Production by Country or Region (Million Gallons). USA. Retrieved from http://ethanolrfa.org/resources/industry/statistics/#1454099788442-e48b2782-ea53Reuters Africa. (2011, November 30). Thailand to stop selling 91-octane gasoline next October. Retrieved September 22, 2016, from http://af.reuters.com/article/energyOilNews/idAFL4E7MU14Y20111130Rica, J. P. (2007). Biofuels Program in Brazil and Colombia: an implementation analysis, results and prospects. Biblioteca Digital.Russell Gold, B. M. (2014, July). U.S. Seeks New Rules for Rail Transport of Fuel. The Wall Street Journal. Retrieved from http://www.wsj.com/articles/u-s-to-propose-new-rules-for-moving-fuel-by-rail-1406122667Saon Ray, S. M. (2011). Ethanol Blending Policy in India: Demand and Supply Issues. ICRIER. Retrieved from http://icrier.org/pdf/Policy_Series_No_9.pdfSapp, M. (2016, January 5). Global biorefinery market seen growing 14% CAGR through 2020. Retrieved from Biofuels Digest: http://www.biofuelsdigest.com/bdigest/2016/01/05/global-biorefinery-market-seen-growing-14-cagr-through-2020/Sergio, B. (2016). Brazil Biofuels Annual: Annual Report 2016. Sao Paulo: Global Agricultural Information Network.Shree Renuka Sugars. (2015). Refining Sugar Redefining Sustainability. Shree Renuka Sugars Limited. Retrieved from http://www.bseindia.com/bseplus/AnnualReport/532670/5326700316.pdfShree Renuka Sugars Limited. (n.d.). About Us: Shree Renuka Sugars Limited. Retrieved September 2016, from Shree Renuka Sugars Limited: http://www.renukasugars.com/en/company-overview.htmlShuping, N., & Aizhu, C. (2015). China to revive corn-based ethanol amid record high stocks. Beijing: Reuters. Retrieved from http://in.reuters.com/article/china-ethanol-idINL3N12G19820151016Soya Bean & Corn Advisor. (2016). Brazil vs. United States Ethanol Industries. Retrieved Oct 14, 2016, from Soya Bean & Corn Advisor: http://www.soybeansandcorn.com/Brazil-US-Ethanol-ProductionStatista. (2014). Global biofuels market size from 2005 to 2013 (in billion U.S. dollars). Retrieved from Statista: https://www.statista.com/statistics/217179/global-biofuels-market-size/Steenblik, R. D. (2007). Biofuels: Is the cure worse than the disease? Organization for Economic Cooperation and Development. Retrieved from http://www.oecd.org/sd-roundtable/39411732.pdf

96
Steffen Mueller. (2016). Greenhouse Gas Life Cycle Analysis of US-Produced Corn Ethanol for Export to Global MarketsTaylor, R. S. (2008). From 1st to 2nd Generation Biofuel Technologies. France: International Energy Agency and IEA Bioenergy. Retrieved from https://www.iea.org/publications/freepublications/publication/2nd_Biofuel_Gen.pdfThe European Fuel Oxegenates Association. (2002). The MTBE Resource Guide. The European Fuel Oxegenates Association. Retrieved from http://www.unep.org/transport/pcfv/PDF/PubEFOAMTBE.pdfThe Gazette of India. (2016). The Industries (Development and Regulation) Ammendment Act. REGISTERED NO. DL—(N)04/0007/2003—16. The Gazette of India. Retrieved from http://www.indiacode.nic.in/acts-in-pdf/2016/201627.pdfTyner, W. E. (2006). Bio Energy. Retrieved October 2016, from Purdue University: https://www.extension.purdue.edu/extmedia/id/id-342-w.pdfU.S Energy Information Administration. (2015, September). FAQS: U.S Energy Information Administration. Retrieved September 2016, from www.eia.gov: https://www.eia.gov/tools/faqs/faq.cfm?id=327&t=9U.S.Energy Information Administration. (2016). Ethanol as a transportation fuel. Retrieved from U.S.Energy Information Administration: http://www.eia.gov/energyexplained/index.cfm?page=biofuel_ethanol_useUN-Energy Knowledge Network. (2011, January 8). Ethanol fuel in Brazil. Retrieved from http://www.un-energy.org/stories/38-ethanol-fuel-in-brazilUnited Nations Environment Programme. (2014). Second-Generation Biofuel Potential in India: Sustainability and Cost Considerations. United Nations Environment Programme. Retrieved from http://www.unep.org/transport/lowcarbon/PDFs/Biofuels_Report.pdfUnited Nations Environment Programme. (2015). Promoting Low Carbon Transport in India. United Nations Environment Programme. Retrieved from http://www.unep.org/transport/lowcarbon/PDFs/Biofuel_Roadmap_for_India.pdfUnited Nations Framework Convention on Climate Change. (2015). India’s Intended Nationally Determined Contribution on Climate Change. United Nations Framework Convention on Climate Change. Retrieved from http://www4.unfccc.int/submissions/INDC/Published%20Documents/India/1/INDIA%20INDC%20TO%20UNFCCC.pdfUnited States Agency for International Development. (2007). Paraguay Poverty Reduction Program. United States Agency for International Development. Retrieved from http://pdf.usaid.gov/pdf_docs/Pdacl272.pdfUnited States Department of Agriculture. (2016, August 8). Data:Foreign Agricultural Services United States Department of Agriculture. (Foreign Agricultural Services, United States Department of Agriculture) Retrieved September 16, 2016, from http://www.fas.usda.gov/data/us-ethanol-exports-remain-strong-markets-diversify-2015Urbanchuk, J. M. (2012). Contribution of Biofuels to the Global Economy. Cardno Entrix. Retrieved from http://globalrfa.org/file_download/2Urbanchuk, J. M. (2016). Contribution of ethanol industry to the economy of United States in 2015. ABF Economics. Retrieved from http://www.ethanolrfa.org/wp-content/uploads/2016/02/Ethanol-Economic-Impact-for-2015.pdfValdes, C. (2011). Brazil’s Ethanol Industry: Looking Forward . United States Department of Agriculture.

97
Retrieved from http://www.ers.usda.gov/media/126865/bio02.pdfVoegele, E. (2015, August 10). Thailand ethanol production, consumption expected to increase. Ethanol Producer Magazine. Retrieved from http://ethanolproducer.com/articles/12518/thailand-ethanol-production-consumption-expected-to-increaseWestern New York Energy LLC. (2016). Ethanol’s Past. Retrieved Oct 23, 2016, from Western New York Energy LLC: http://www.wnyenergy.com/index.php?pr=Ethanols_PastWorld Energy Council. (2010). Biofuels: Policies, Standards and Technologies. World Energy Council. Retrieved from https://www.worldenergy.org/wp-content/uploads/2012/10/PUB_Biofuels_Policies_Standards_and_Technologies_2010_WEC.pdf

98
Figure 20 shows annual variation of petroleum, crude oil and ethanol prices (Organisation for Economic Co-operation and Development, 2015). As per the pricing mechanism in India, the price set for ethanol is around INR 48.5- 49.5 per litre whereas the imported ethanol is available for INR 30 per litre. Thus, the price difference between the locally produced ethanol and the imported ethanol is approximately INR 18-20 per litre.
ANNEXURE
HISTORICAL TRENDS IN CRUDE, PETROLEUM AND ETHANOL PRICES
FIGURE 20: GLOBAL CRUDE OIL, DOMESTIC PETROLEUM PRICE AND IMPORTED ETHANOL PRICE VARIATION
Historically, the standard deviation in the price of crude and ethanol was INR 8.94 per litre and INR 2.62 per litre. Given the fact that, crude oil prices are expected to rise in the future, to as much as $ 75 per barrel by 2022, and ethanol prices are projected to remain more or less stable. There is an opportunity to take advantage of this expected trend in the global ethanol market and explore entering into long-term procurement deals, which will lead to stable supply and greater price certainty at reduced ethanol prices.
PROJECTING FUTURE DOMESTIC PETROLEUM PRICES
Based on future crude price projections, domestic petroleum prices are projected in Table 31assuming costs, duties and taxes remain at today’s level (mycarhelpline.com, 2016).
50
45
40
35
30
25
20
15
10
2007 2008 2009 2010 2011 2012 2013 2014 2015
INR/
LUTR
E
WORLD CRUDE PRICE
GASOLINEPRICE
WORLD ETHANOLPRICE

99
Table 31: Price Determination of Petrol
Year
Crude
Price
(INR/
Litre)
Refinery
Cost
(INR/
litre)
Transportation,
Freight, Landing
to dealers
Additional
Excise
duty (INR/
litre)
Commission
to Petrol
Pump Dealers
(INR/litre)
VAT
(at
27%)
Petrol
price
(INR/
litre)
2016-17 19.7 3.73 2.68 21.48 2.29 12.85 62.73
2017-18 20.5 3.73 2.68 21.48 2.29 13.08 63.79
2018-19 23.1 3.73 2.68 21.48 2.29 13.75 66.99
2019-20 26.2 3.73 2.68 21.48 2.29 14.60 70.98
2020-21 29.3 3.73 2.68 21.48 2.29 15.45 74.97
2021-22 31.4 3.73 2.68 21.48 2.29 16.02 77.63
^ At an INR: USD exchange rate of 66.64 (as on 30/09/16)
SUGARCANE AND ETHANOL PRODUCTION CAPACITY IN DIFFERENT STATES
The annual sugarcane production and ethanol production capacity in carious Indian states are given in Table 32 (Indiansugar.com, 2016). There are few states which have the sugarcane plantation, but do not have any distilleries for downstream processing of sugarcane.
At the time of low crude prices, taxes and duties are seen to contribute more to final prices of petroleum in India. Transportation and Freight charges are also likely to change in the near future, more specifically increase with time. If the crude prices increase at a rate higher than what is expected to follow, then the final price of petroleum is tend to increase significantly affecting the consumer’s severely.

100
Table 32: State Wise Sugarcane Production & Ethanol Production Capacity
StatesSugarcane Production
(million tonnes)
Ethanol Production Capacity(million litres per
annum)
AP 9.9 145
Assam 1 -
Bihar 14.0 90
Chhattisgarh 0.03 -
Gujarat 14.3 92
Himachal 0.04 -
Haryana 7.16 12
Jharkhand 0.47 -
Karnataka 43.8 294
Madhya Pradesh 4.6 -
Maharashtra 84.7 791
Odisha 0.72 -
Punjab 7.04 16
Rajasthan 0.41 -
Sikkim - 18
Tamil Nadu 28.09 86
Telangana 3.34 41
Uttar Pradesh 133.06 635
Uttarakhand 6.16 8
West Bengal 2.1 -
Others 1.03 -

101
COST OF SUGAR FROM INTEGRATED MILLS VERSUS STANDALONE DISTILLERIESThough a large number of states cultivate sugarcane, owing to the fluctuating market and prices of sugar and ethanol region-wise, relatively lesser states are involved in downstream processing of sugarcane.Ethanol obtained from standalone distilleries is costlier than that obtained from integrated sugar mills.
An obvious advantage of an integrated distillery unit in sugar mills is that procurement of molasses is not required from a separate source, which saves the transportation cost of the feedstock. Most sugar mills are involved in cogeneration using bagasse thus reducing the costs of fuel and electricity for the distillery unit.
Table 33 shows the comparative study for determining the cost of ethanol from both its sources (Gonsalves B, 2006).
Table 33: Economic Analysis of Production of Ethanol from Standalone Distilleries and Sugar Mills
CostsStandalone
Distillery
Integrated with Sugar
Production
Cost of Molasses per tonne
Transportation Cost per tonne
Total
6,000
150
6,150
6,000
0
6,000
Recovery of ethanol per tonne of molasses 220 220
INR/litre INR/litre
Molasses cost after milling
Steam Cost at rice husk INR 1700/ton
Power Cost at INR 6.5 kWh
Chemical Cost
Labour Cost
Repair Maintenance
Total Direct Cost
27.95
0.85
0.85
0.3
0.4
0.2
30.56
27.27
0
0
0.3
0.4
0.2
28.17
Finance & Other Costs
Indirect costs, including overheads
Interest@9% for borrowed capital of INR 72
million
Interest@15% for working capital for one month
of molasses and ethanol
Depreciation@10% for INR 120 million
Total finance & other costs
0.56
0.72
0.6
1.33
3.21
0.28
0.96
0.2
1.33
2.77
Total Cost 36.98 33.71
*All the above costs are updated as per current scenario

102
As a result of the factors outlined above, cost of ethanol produced in integrated plants is lesser than those incurred by stand-alone distilleries. This is why OMCs prefers integrated distilleries to participate in the tender for procurement of ethanol for blending.
Table 34: Import Duties on Fuel Ethanol
Country
MFN duty rate
import
restrictions
Sales tax Additional duties & taxes Country specific
Brazil 20%Depends on
province
• Airport fee (50% (Storage fee + Handling fee))
• Storage fee (1% CIFD)
• Handling fee (US$0.015 per KG)
• Declaration fee (BRL185.00)
• IPI (0% CIFD)
China 40% 17%• Consumption tax (5%)
• Parcel Tax (30%)
USA 2.50% Depends on state • Merchandise Processing Fee
Germany€19.20 per
hectolitres19% • Excise (€13.03 per litre of alcohol)
India 150% No sales tax
• Landing charges (1% CIF)
• CESS (3% (Duty + CEX (Education & Higher
Education CESS) + Countervailing duty))
• Additional Countervailing Duty (4% (CIFD +
Landing charges + Countervailing duty + CESS +
CEX (Education & Higher Education CESS)
• CEX (Education & Higher Education CESS) (3%
Countervailing duty)
Peru 6% 16%
• Excise (20%)
• Municipal tax (2% (CIFD + Excise + Tariff
surcharge))
Paraguay 20% 10%
Argentina 20% 21% • Statistical fee (0.5% CIF)
Thailand0% + THB 80.00 per
litre7%
• Excise (0.1%, subject to minimum of THB
0.0500 per litre)
• Interior tax (10% of Excise)
TAXES AND DUTIES ON ETHANOL IMPORTS ACROSS THE WORLDTable 34 represents the duties and taxes across different countries (Pitney Bowes-Global Trade Solutions, 2016).

103
Country
MFN duty rate
import
restrictions
Sales tax Additional duties & taxes Country specific
Canada0% + CA$0.0492
per litre of
Depends on
province
• Excise (CA$11.696 per litre of alcohol above
0%abv)
Australia5% + AU$81.21 per
litre of alcohol 10% • Import Processing Charge (AU$50.00)
Philippines 10% 12%

FUEL BLENDING IN INDIA: LEARNINGS AND WAY FORWARD
10th Cross, Mayura Street, Papanna Layout, RMV
Extension Stage 2,Bangalore 560 094
College of Legal Studies, Kandoli Campus, University of Petroleum and
Energy Studies,Dehradun 248007
Suite 1-B, Plot No. 8-B, Main Mathura Road, New Delhi - 110014
C H A M B E R S
P L Radvocates & solicitors