Embed Size (px)
Citation preview

All ACP Commodities Programme
Pacific Region
Fruit & Vegetables
SECTOR STRATEGY for SAMOA
July 2009
Apia, Samoa
Government of Samoa

2
Note to the readers and purpose of this document
As part of the EU funded All ACP Agriculture Commodities Programme (AAACP) for the Pacific Region, the
Ministry of Agriculture of Samoa and the sector stakeholders in collaboration with the International Trade
Centre (ITC) in Geneva, Switzerland, have undertaken the development of a Comprehensive Sector Strategy for
Fruits and Vegetables.
The emphasis on Fruit and Vegetables came out of the EU/AAACP Pacific Kick-Off Workshop held in Samoa
in February 2008, where areas and sectors of priority were identified to implement sustainable commodity
strategies.
Representatives from the agricultural sectors in the Pacific countries including farmers, processors, retailers,
government officials and regional institutions selected Fruits and Vegetables for Samoa based on factors such as
market demand and potential, developmental impact, existing development initiatives already focusing on
sectors and motivation of stakeholders.
The Sector Strategy for F&V was developed by a stakeholder run Coordinating Committee and by the Ministry
of Agriculture. This was done by using ITC‟s market-led participatory approach. It focuses on domestic,
regional and international market and social development objectives and is aligned to existing initiatives such as
the Strategic Development of Samoa or the National Export Strategy for Samoa. The F&V will also be an
integral part of the Agricultural Sector Plan currently being developed by the Ministry of Agriculture.
The emphasis is on revitalising the fruits and vegetable industry through the value-chain approach thus targeting
farmers, private sector enterprises, processors, buyers, policy makers and support institutions.
Under the ACP programme, Food and Agriculture Organisation of the United Nations (FAO) based in Rome
provided support to ITC and the sector stakeholders for the development of the current strategy. The World
Bank also contributed with information and support form specialist.
The purpose of this document is to guide and support the development of the Fruit and Vegetable industry by
providing a framework and a plan and by articulating value chain actors, private sector, existing resources,
development activities and donor support.

3
The present strategy has been put together by the stakeholders of the fruits and vegetables
sector and the Samoan institutions.
With support from: All ACP Agricultural Commodities Programme Financed by the European Commission In collaboration with: The International Trade Centre (ITC) UNCTAD
World Bank FAO
For information on the methodology used for the development of this strategy, please contact:
International Trade Centre Bureau of Policy and Programmes Export Strategy Tel: +41 22 730 0111 Fax: +41 22 730 0575 Web: http://www.intracen.org E-mail: [email protected]
The designations used and the presentation in this report do not imply an expression of an opinion on behalf of the ITC about the legal status of the countries, territories, cities or areas, about their legal authority, or about the delimitation of their borders or territorial limits. This report was not officially edited by the ITC

4
Acknowledgements
A full list of contributory participants is included in Appendix 2. In addition, the Government of Samoa wishes
to thank the following institutions and individuals
Coordinating Committee Members
Papalii Grant Percival
Edwin Tamasese
Karen Mapusua
Nynette Sass
Peseta Frank Fong
Ricky Westerlund
Aiolupotea Jeff Atoa
Noumea Simi
Government Authorities participating in the opening of Workshops
Honourable Tuilaepa Lupesoliai Sailele Malielegaoi, Prime Minister
Honourable Taua Kitiona Tavaga Seuala, Minister of Agriculture
Asuao Kirifi, CEO Ministry of Agriculture
Support Team Leasiolagi Seiuli, Ministry of Agriculture
Mose Malaga, Ministry of Agriculture
Galumalemana Steven Percival, „Growing the Future‟ Film Director
Collaborating Institutions Samoa Hotel Association
Samoa Umbrella non-Governmental Organizations (SUNGO)
Samoa Manufacturers and Exporters Association (SAME)
Women in Business Development Inc (WIBDi)
David Hunter, University of the South pacific (USP)
University of South Pacific Students participating in all workshops
South Pacific Commision (SPC)
Thomas Opperer, EC Delegation Samoa
Annick Villarosa, EC Delegation Fiji
Richard Markham, ACIAR
Tillmann Bruett, UNDP Pacific Centre
Georgina Bonin, Naheed Haque, UNDP Samoa
Viwanou Gnasounou, ACP Secretariat
David Trafford, Farmer Joe
ITC Specialists
Hernan Manson, Team leader for Samoa , Adviser for Value Chain and Strategy Development
Antony Sandana, Senior Commodity Officer
Charles Barkla, Consultant
Laisene Samuelu, ITC National Consultant
FAO Specialists Jamie Morrison, Chief Economist FAO
Federica Angelucci, Finance and Risk Management, FAO
5
VISION for the Fruit and Vegetable Sector
A competitive and sustainable sector growing the future for a healthy and wealthy Samoa
MISSION
To establish the fruit and vegetable sector as a major economic vehicle in achieving the
objectives of the Samoa Development Strategy by 2012 and enabling it‟s Millennium
Development Goals by 2020

6

7
Index
NOTE TO THE READERS AND PURPOSE OF THIS DOCUMENT ..................................................................................... 2
ACKNOWLEDGEMENTS ......................................................................................................................................... 3
VISION FOR THE FRUIT AND VEGETABLE SECTOR .............................................................................................. 5
MISSION ............................................................................................................................................................ 5
INDEX .................................................................................................................................................................. 7
EXECUTIVE SUMMARY ......................................................................................................................................... 9
MESSAGE FROM THE MINISTRY OF AGRICULTURE ............................................................................................. 12
MESSAGE FROM THE INTERNATIONAL TRADE CENTRE ...................................................................................... 12
PURPOSE OF THE STRATEGY AND TIME FRAME ................................................................................................... 13
SPECIFIC GOALS, IMPACT AND BENEFICIARIES .................................................................................................. 13
Overall Development goal and beneficiaries ............................................................................................... 13
Targets .......................................................................................................................................................... 13
Anticipated Impact of strategy implementation ............................................................................................ 14
THE CURRENT SITUATION: F&V SECTOR BACKGROUND ................................................................................... 16
Snapshot of the Macro Situation ................................................................................................................... 16
The Fruit and Vegetable sector situation...................................................................................................... 17
Domestic market dynamics ........................................................................................................................... 19
Issues Affecting the Sector Value Chain ....................................................................................................... 21
EXISTING PROJECTS AND RESOURCES AVAILABLE ............................................................................................ 22
THE FUTURE FOR THE F&V SECTOR ................................................................................................................... 24
Target Markets .............................................................................................................................................. 24
STRATEGIC OBJECTIVES AND INTERVENTIONS ................................................................................................... 26
Objective 1: Improve coordination in the sector to successfully implement the F&V Strategy ................... 26
Objective 2: Improve market intelligence and dissemination across the whole value chain ....................... 29
Objective 3. Build a supply sub-sector that will guarantee consistent and continuous supply of fresh fruit
and vegetables ............................................................................................................................................... 32
Objective 4. Improve performance by building a sector that is well trained and supported by a well
developed and properly executed capability plan ........................................................................................ 35
Objective 5. Improve financial situation of sector enterprises ..................................................................... 37

8
Objective 6. Promote integrated management of resources to ensure sustainability of the fruit and
vegetable sector ............................................................................................................................................ 40
Objective 7. Strengthen Samoa Association of Manufacturers and Exporters to provide services that will
increase returns and overall value addition for sector ................................................................................. 41
IMPLEMENTATION PLANS ................................................................................................................................... 42
RESOURCES NEEDED .......................................................................................................................................... 43
Optimistic scenario optimistic ...................................................................................................................... 44
Pessimistic scenario ...................................................................................................................................... 45
NCCS & IMPLEMENTATION FRAMEWORK ......................................................................................................... 47
Key Sector Performance Indicators .............................................................................................................. 48
Progress Monitoring and Reporting Schedule ............................................................................................. 49
ANNEXES ........................................................................................................................................................... 51
APPENDIX 1: PRIORITY AND COST PER ACTIVITY (PRIORITIZED IMPLEMENTATION PLAN) .................................. 52
APPENDIX 2: LIST OF STAKEHOLDERS FOR WORKSHOP 1 AND 2 ......................................................................... 71
APPENDIX 3: PAST AND CURRENT DEVELOPMENT ACTIVITIES ............................................................................ 77
APPENDIX 4: PROGRESS TOWARD THE MILLENNIUM DEVELOPMENT GOALS AND TARGETS .............................. 81
APPENDIX 5: LAND TENURE SYSTEMS IN SAMOA ............................................................................................... 84
APPENDIX 6: F&V VALUE CHAIN MAPS AND ISSUES .......................................................................................... 85
APPENDIX 7: AVERAGE ANNUAL QUANTITY AND CIF VALUE OF VEGETABLE IMPORTS ..................................... 90
APPENDIX 8: AVERAGE ANNUAL QUANTITY AND CIF VALUE OF FRUIT IMPORTS .............................................. 91
APPENDIX 9: GLOSSARY .................................................................................................................................... 92

9
Executive Summary
Impact and Beneficiaries:
The 2005 agricultural survey identified 17,829 agriculturally active households in Samoa, as those who are
involved in agriculture of some sort. This represents 77% of the total households surveyed and is the basis for
the opening assumption that over 50,000 people and their dependants rely in some measure on the productivity
of the agriculture sector. In terms of impact, this implies that at least one third of the population derives at least
part of their income from farming.
The economic benefits of a successful fruit and vegetable sector are obvious and all Samoans will see their life
style improved both socially and materially through the successful development of the fruit and vegetable
sector.
Global and Sector Situation:
Samoa is not exempt from the current global economic environment. Overall consumption is forecast to drop by
4.1% in 2009 due to falls in earned incomes including a drop in remittances resulting from the global recession,
weak employment in New Zealand and Australia, workforce reduction in the tuna cannery industry in American
Samoa and the automotive wire factory in Apia1.
In light of the expected impact of the above forecasts, the fruit and vegetable sector takes on a renewed
importance as a key economic driver and in ensuring ongoing food and nutritional security.
Economic reforms during the 1990‟s placed Samoa among the fastest growing Pacific Island economies.
Currently, the Samoan economy is experiencing an increasing balance of payments deficit as a result of a
liquidity squeeze and reduced growth. Samoa‟s economic performance remains highly vulnerable to economic
shocks and natural disasters. Additionally, private sector growth is restricted, constrained by a narrow resource
base, high inflation, limited infrastructure, a shortage of investment, isolation, dependence on fuel imports, a
lack of skilled labour and a small domestic market.
Samoa‟s primary industries are an important contributor to the national economy, accounting for over 50% of
total exports and contributing to 10 % of GDP. With 77% of the country‟s households being agriculturally
active, the primary industries are also very important for national food security and are the foundation of
traditional community life.
The Strategy for the Development of Samoa (SDS) is the overarching multi-year plan (2009-2015) for the
country based on the long-term vision of „improved quality of life for all‟. Agricultural and rural development
figures prominently in the SDSs2.
The fruit and vegetable sector offers a diverse range of produce to develop a stronger fresh and processed food
industry that shall contribute significantly in positioning Samoa as the leading economy in the Pacific.
1 http://www.mof.gov.ws/uploads/budget_address_2009-2010.pdf
2 The ADB estimated that in 2004 20% of the population was below the Basic Needs Poverty Line and 9% below the Food Poverty
Line, and that 6% lived on less than US$1.0 per day. Of the 34,000 living below the Basic Needs Poverty Line 73% were found in
rural areas.

10
The Strategy response and objectives:
This strategy is a comprehensive way to address critical factors that impact on the development of the Samoan
fruit and vegetable sector. It identifies target markets and associated value chain issues that impede efficiency
and growth. In order to reduce the gap in performance, prioritised response activities have been developed and
categorized into seven objectives.
The seven key objectives are:
1. Improve coordination in the sector to successfully implement the Fruit and Vegetable Strategy
2. Improve market intelligence, promotion and dissemination across the whole value chain
3. Build a supply sub sector that can guarantee consistent quality and supply of fresh fruit and vegetables
4. Build a sector that is well trained and supported by a comprehensive and properly executed capability
plan
5. Improve financial situation of sector farmers and enterprises
6. Promote Integrated Management of resources to ensure sustainability of the fruit and vegetable sector
7. Strengthen Samoa Association for Manufacturers and Exporters (SAME) to provide services that will
increase returns and overall value addition for sector
The target Markets:
The strategy covers the development of the domestic and export markets to create demand to meet increased
supply that will become available as a result of the actions that result from the activity plans.
As a first priority, target market segments include local hotels, supermarkets and restaurants particularly for
crops and products that are currently being imported but could be produced locally.
The 2009 market demand survey that was prepared by USP as an input to the strategy workshop 1 clearly
identified that over 80% of hotels and restaurants surveyed will stop buying imported product if locally
produced competitively priced, similar quality alternatives are made available.
Additionally, niche exports to the regional markets, and the Pacific Rim are key to ensuring long-term
sustainability and commercial viability of the sector. Development of an export sector will be achievable based
on a more stable domestic market. The main areas of focus for exports are Organic fruits and vegetables and
specialty produce such as tonic juices.
The timeframe foresees strategy implementation in five years 2009- 2014. It is expected that it will create a
platform for future growth in the sector beyond the period of the plan.
Implementation of key activities
The inconsistency of supply, quality, volume and price variations of fruit and vegetables is the reason for the
lack of growth and local consumption in the fruit and vegetable supply chain.

11
Key activities under each objective will be piloted with an identified core group of beneficiaries including
buyers, processors and farmers. Successful experiences and results will be replicated with other groups of
beneficiaries as implementation rolls out.
As decided in the stakeholder workshops priority has been given to developing a value chain that shall be based
on consistent and quality fruit and vegetables supplied into the market through a pilot grading and quality centre
that will provide logistical (pick up, post harvest handling, grading, sorting, delivery) services to farmers and
buyers and in turn provide additional support services such as finance, training and agronomic support.
Expected outcomes
If the F&V sector strategy is implemented it is anticipated that the overall sector contribution to GDP will
increase to approximately 10% over the next 5 years.
However its impact on MDG‟s will be substantially greater because the economic impact will be at the rural and
subsistence level.3
The Strategy Management Framework
The Fruit and Vegetable Strategy Development Coordinating Committee was appointed by stakeholders and is
composed by representatives from the value chain including farmers, processors, and tourism industry, NGO‟s
and the Ministries of Agriculture and Finance.
The Coordinating Committee has been responsible for the development of the strategy and has articulated
communications with stakeholders, Government Authorities and Implementing Partners. In March 2009
Cabinet has confirmed the role of the committee in managing implementation and monitoring progress.
3 The impact on MDG‟s has been estimated and categorized for each of the relevant activities in the implementation plan and can be consulted in the
Strategy Document.

12
Message from the Ministry of Agriculture
Agricultural development continues to be a key focus area for the Strategy of the Development of Samoa (SDS)
for 2005-2008 and 2008-2012 and the Millennium Development Goals (MDG‟s). The Development of the Fruit
and Vegetable Sector Strategy is therefore an achieved Milestone as it provides direction to the Ministry and the
private sector in accelerating economic growth and sustained macroeconomic stability.
In order for Agriculture to grow in a sustainable manner, there is a need for an increased emphasis on
commercial production with associated value addition and well-managed supply chains. Such a concept is fully
recognized in this Strategy.
At present, there is a substantial amount of unused arable land that is available for cultivation. Somewhere
between 160,000 and 200,000 hectares of Samoa‟s total land area is assessed as suitable for agriculture and the
1999 Agriculture Census indicates that only about 53,400 hectares (including fallow land) were in use with low
levels of productivity. The latter can be improved with numerous technologies and agronomic practices that are
available to farmers.
The Ministry of Agriculture and Fisheries (MAF) is to provide full support in the implementation of the
activities in partnership with the Private sector and the Coordinating Committee.
Message from the International Trade Centre
The EU funded All ACP Agricultural Commodities Programme was launched in the Pacific in a Regional Kick-
Off Workshop held in Samoa in February 2008. Less than a year later, more than 120 Fruit and Vegetable
sector stakeholders in cooperation with the Government of Samoa accomplished the development of a
comprehensive market led strategy and implementation plan.
The International Trade Centre (ITC) wishes to acknowledge and commend all the effort put into the
development of this strategy and implementation plan. The process has already begun to show sprouts
particularly in the area of fostering private-public partnerships and in achieving improved articulation and
organisation of value chain actors through the Coordinating Committee.
Beneficiaries have been included from the design phase and have directly interacted with the ACP Programme
Implementing Partners in determining priority activities and delivery mechanisms. Furthermore, the strategy
has also enabled stronger coordination and linkages with regional organisations and other donor bodies outside
of the ACP Programme but most important the strategy is actually responding to market potential and will
increase overall sector performance.
The Coordinating Committee presented the strategy outputs to Honourable Tuilaepa Prime Minister and
Cabinet members on 18th
March 2009 and on the official launch event hold in July 9th
2009. This also reflects
success in securing high-level support and in addressing the crosscutting needs of the strategy.
The Challenge ahead is to successfully implement and coordinate of activities is the challenge ahead to ensure a
meaningful impact in the development of the farming community villages as well as Samoan industry. The
strategy and implementation plan developed by Samoa is a solid tool that will allow the Coordinating
Committee and Government to do so.

13
Purpose of the Strategy and time frame
The strategy has been designed based on current and future market potential using the International Trade
Centre‟s Participatory methodology. Value chain Diagnosis against market and buyer requirements has been the
basis to design response activities to improve overall sector performance.
The Strategy has three main overall objectives, targeting productive, social and health areas.
1. To enable the sector to become a more significant contributor to the Samoan economy by better
capitalizing on existing and future market opportunities and attracting direct investment
2. To articulate and implement value chain actors to address the main issues and challenges faced by the
sector in order to respond to market requirements
3. To engage and mobilise Government and Development and assistance partners for support in the
implementation of the strategy.
The time frame for implementation of the strategy is of 5 years ending in 2014. Regular implementation
progress report meetings to Cabinet and Sector stakeholders will take place every three months and the strategy
will be reviewed and adapted as needed.
Specific Goals, Impact and Beneficiaries
Overall Development goal and beneficiaries
The overall development goal is to improve the livelihood, health and economic situation of the Samoan people
by raising the production and consumption levels of fruit and vegetables and its value added products. Annex 4
has classified each one of the Strategy objectives and relevant activities regarding its contribution to the
Millennium Development Goals.
Targets
If the F&V sector strategy is implemented it is anticipated that the overall sector contribution to GDP will
increase in approximately 10% over the next 5 years.
However its impact on MDG‟s will be substantially greater because the economic impact will be at the rural and
subsistence level.4
The implementation of the sector strategy targets to improve delivery and quality of fruits and vegetables not
only for the consumers who will benefit from a wider range choices on offer contributing to improvements to
health and nutrition needs, but also the processors by increasing returns from exports and improved sustainable
development options for Samoa.
4 The impact on MDG‟s has been estimated and categorized for each of the relevant activities in the implementation plan and can be consulted in the
Strategy Document.

14
Overall Targets
Target 2009-2015
Increase in commercial production output 50%
Increase in number of commercial farmers
and land utilisation
By 100% (Mixed cropping from 10,000 ha
to 20,000ha)
Import substitution for fresh 85% of current imports of F&V produced
locally (excluding produce that does not
grow)
Increase in Processing activities 15% of total processed foods consumed
produced locally
Increase in Exports 50 Million Tala (FOB)
Decrease of Lifestyle diseases (NCD’s) by
improved diets
Decrease of NCD’s related to healthier
eating by 2015
Productive targets
Increased rural employment opportunities by 2014
Improved village and rural economies through increased production and therefore gate and specific
market sales by 2014
15% reduction in processed fruit and vegetable imports by 2014
25% reduction in fresh fruit and vegetable imports by 2014
SAT$50 million in fruit and vegetable export earning by 2014
Social targets
Increase fruit and vegetable consumption by halving the percentage of people who ate less than 5 of the
combined servings from 33 to 15% within the next 3-5 years.
Reduction in non-communicable diseases
Reverse the current prevalent trend of obesity among the men (quadrupled) and women (doubled) in
Samoa within the next 3-5 years.
Anticipated Impact of strategy implementation
A more productive fruit and vegetable sector and industry will enhance the economic well being of Samoa.
Farmers, their families and their villages will enjoy diversified income streams. Individually and collectively,
they will be able to negotiate more effectively with both suppliers and their customers. They will be able to
better plan and finance their planting and harvesting cycles. They will be better organised both individually and
collectively to meet the challenges in providing their customers with what they want, when they want it.
Processors will benefit similarly. They will be better placed to source fruit and vegetables locally. They will be
better able to specify grades of quality and delivery schedules. They will be able to plan their inputs and
resource needs, as well as access to funding.

15
Buyers will benefit from being able to plan their activities and promotions around a more secure supply of fruit
and vegetables. The 2009 market demand survey that was prepared by USP as an input to the strategy workshop
1 clearly identified that over 80% of hotels and restaurants surveyed would stop buying imported product if a
satisfactory locally produced competitively priced alternatives were made available.
The national economy will benefit through increased production in the sector due to at least 50% reduction of
foreign exchange losses for sector products from import substitution. Increases in government revenue will
additionally be sourced through taxation earnings with increased domestic employment using GST, employee,
and company taxes from both farmers and secondary processors. Increased exports will also provide support in
foreign reserve earnings.
Consumers will benefit economically from a regular, lower cost supply of fresh fruit and vegetables which will
provide added health and social benefits.
Social Benefits
On a social level as returns to farmers improve every level of society that has an interest in agriculture will feel
more secure and better able to plan for the future. Increasing value of property (e.g. fruit trees and taro plants)
provides land holders a sense of security. Samoa has traditionally had a robust social structure that provides for
community needs and protection. The ability of families to contribute resources to this system both sustains the
system but helps ensure security for all within it.
Increased opportunities to earn cash in agriculture will also encourage young people to remain in the village
further strengthening family and social structures and reducing the social pressures in town areas created by
urban drift. Employment opportunities would also be diversified with work created in cultivation, harvesting
and post-harvest activities, which expands the range of opportunities available to young people.
Health Benefits
These diseases are now the leading cause of death in Samoa as obesity rates have grown from 25.5% in 1978 to
67.5% in 2001, among the highest rates in the world. As a result, Government has identified health as one of its
priority focus areas in the last two triennia covered by the SDS. The strengthening of health promotion and
primordial prevention is also an important strategic area in the SDS 2008-2010‟
Samoa is burdened by rapidly increasing levels of food and nutrition related diseases (including diabetes,
hypertension, obesity, coronary heart disease), which impact negatively on the health system, families and the
national economy.
The impact on the overall health of Samoans of increased regular consumption of fresh fruit and vegetables
cannot be under-estimated. Campaigns to encourage increased daily intake of fruit and vegetables are under
way all over the world. The Samoan government has already put in place programmes along these lines and this
strategy will contribute strongly to the existing campaigns.
Sustainable land use
By ensuring appropriate agricultural technologies are utilised, the entire value chain will benefit due to
sustainable land use. This will ensure higher crop yields over the long term, increasing farmer incomes and
sustaining the value chain into the future.

16
The current situation: F&V Sector Background5
Snapshot of the Macro Situation
Gross Domestic Product (GDP) has shown signs of contraction for the first time in over a 10-year period.
Imports have slowed down resulting in a 15% downward revision of revenues expected for 2009/10. Import
prices and inflation rates have continued to climb while re-manufactured exports have declined due to reduced
demand in the auto industry in Australia.
Samoa‟s macroeconomic performance remains vulnerable to economic shocks and natural disasters. Continued
growth in the economy will be linked to the continued development of the agricultural sector. Samoa remains
heavily dependant on overseas development assistance (US$30.8 million in 2004) and remittances (US$248
million or 25 % GDP in 2005). Official GoS debt stood at US$157 million in 2004 or 35% of GDP.
Multilateral and bilateral loans account for over 90% of this debt.
Agriculture‟s contribution to GDP has decreased in recent years from 14.9% in 1995, to 6% in 2007. The
ongoing decline of the agricultural sector‟s importance has been accompanied by a restructuring of the sector,
as the coconut and taro sub-sectors are no longer as dominant as they were in the past.
The 40% of the population that lives in and around Apia generate 70% of the GDP thereby creating significant
urban/ rural disparity.
Agriculture still provides a livelihood to 77% of the population, and Samoa displays a high level of food
security. Coverage of national food requirements however is decreasing and food imports are rising (rice,
mutton flaps, chicken wings, eggs, etc.). The situation could be reversed since the country can produce a wide
array of animal and plant food products. The degree of food self-sufficiency could be greatly increased given
the national potential and that agriculture is one of the pillars of traditional community life.
The 2005 agricultural survey identified 17,829 agriculturally active households in Samoa, as those who are
involved in agriculture of some sort. Other recent estimations account for 37000 smallholder farmers and 960
commercial farmers.
There is limited processing of fruit and vegetables in Samoa. Taro and banana chips are produced. As at March
2009, the main success of this sector is the export of Noni juice to Japan and the USA.
5 Section developed using information available in the World Bank Mission Report submitted to Ministry of Agriculture in June 2009
and in the ITC / FAO preparatory information report submitted to sector stakeholders during workshop 1.

17
Significant amounts of fruit and vegetables are imported into Samoa. For the year 2007, according to ITC
statistics, the value of imports of fresh and processed fruits and vegetables was approximately USD1.5 million.
According to the Samoa Central Bank 2007 report, the imports of vegetables and fruits was just under SAT$4
million and SAT 1.8 million, respectively.
Table 2: Brief Context on Global and national economy
6
Land Area (km2): 2,820 Population (No.): 180,741 (2006)
21% in Apia urban area
Density (inhabitants/km2): 65 (2004 estimate) Rural Population (% of total population): 78
GDP (US$ million): 532.0 (2006) GDP per cap (US$): 2,872 (2007)
Budget allocation agriculture (2008/09):
SAT12.37 million (US$ 4.95 m)
% of Total Budget 1.8%
Primary Sector GDP (% of total GDP):
11.4 % (2006)
Ag 6.7 %
.
The Fruit and Vegetable sector situation
Land Use
Only 80,500 ha or about 28% of the total land mass is under regular agricultural or livestock production. An FAO funded
GPS Mapping Study of Samoa completed in 2004 provides details on land use and gives the following distribution of the
total land mass across land use categories:
53,000 ha or 18.6% is under (sole) plantation crops;
10,000 ha or 3.6% is under mixed cropping;
17,500 ha or 6.2% is classified as grassland;
192,000 ha or 68% is classified as forestry, secondary forestry or scrub
10,800 ha or only 3.2% has no agricultural potential being either urban land, barren land (lava) lakes or wetlands.
Annex 5 provides more details on the land use in Samoa.
Agricultural Practices and Farming Systems
Agriculture in Samoa is a smallholder activity, practiced using labour intensive technologies.
Farm size is typically less than 10 acres. Soils are of volcanic origin and generally very fertile. Farmers use a variety of
mixed cropping techniques for ground crops (e.g., taro with other crops), ground crops in association with tree crops (e.g.,
taro under bananas), or „stage‟ cropping of tree crops (typically cocoa under coconut); cattle raising is often integrated
with tree crops (typically cattle grazing under coconuts trees).
The above practices combine with the ubiquitous presence of boulders and rocks due to past volcanic activity to hinder
mechanization.
6 Sources: SDS 2008-20012; Samoa Census of Population and Housing 2006; Samoa Budget Statement 2008/09; Asian Development
Bank 2005. Key Indicators of Developing Asian and Pacific Countries (ADB); Central Bank of Samoa Bulletin, March 2008

18
The recent increase in the prices of agricultural chemicals and imported food items is encouraging the return of village
communities to traditional ways of cultivating land and favouring the consumption of local vs. imported foodstuffs. This
trend is an asset for organically certified agriculture that has great potential for expansion on niche markets overseas.
The downside is the availability and cost of labour. With young people migrating to Apia or overseas, and typically
showing a lesser interest in farming activities, labour is becoming a constraint. The incentive for increasing agricultural
productivity will be an adequate remuneration of labour in the context of the manual labor intensive technologies used.
Of the 17,829 rural households, 14,000 households produce entirely or mainly for home consumption. An increasing
fraction of farmers are becoming market oriented and about 2,500 households (11%) are deemed commercial or semi-
commercial producers.
Farmers increasingly need to meet cash requirements to pay for basic services (e.g., electricity) and basic amenities and
foodstuffs that they buy from the market. This has had a positive impact in getting farmers connected to the market.
However, the fact that farmers can cover their cash needs through remittances gives them an incentive to market their
surplus production only to the extent that prices cover their reservation wage (or opportunity cost of their labour in terms
of other potential economic activities and/or leisure time).
Production
The production figures below from FAO‟s FAOSTAT are based on projections from the last agricultural census
in 1999. While these projected figures did not foresee a great increase in production for both fruit and
vegetables into the 2000‟s, what has been observed over the last 10 years challenges these projections.
Figure 1: Fruits and Vegetable Production from 1995-2007
Though production being sold may not have been consistently increasing over this period, Fugalei market sales
nevertheless indicate some increase in production and in the diversity of varieties being produced.
Data on production yields and area harvested of fruits and vegetables in Samoa is limited. Information on fruit
and vegetables grown and sold in the local market was not specifically measured in the 1999 census and 2002
Fruit and Vegetable Production
0
1000
2000
3000
4000
5000
6000
7000
8000
9000
10000
Year
To
nn
es
Avocados - Production (tonnes) 800 800 800 800 900 1000 1000 1000 1000 1000 1000 1000 1150
Citrus fruit, nec - Production (tonnes) 625 625 650 650 650 650 650 650 650 650 650 650 690
Fruit, nec(618) - Production (tonnes) 6000 7000 8000 8700 9000 9000 9000 9000 9000 9000 9000 9200 9300
Guavas, mangoes, mangosteens - Production (tonnes) 4000 5000 5200 4000 4000 4000 4000 4000 4000 4000 4000 4000 4000
Papayas - Production (tonnes) 4400 3900 3600 3600 3500 3600 3600 3600 3600 3600 3600 3700 3800
Pepper (Piper spp.) - Production (tonnes) 6 6 6 6 6 6 7 7 7 7 7 7 7
Pineapples - Production (tonnes) 4000 4500 4500 4500 4500 4000 4300 4600 4600 4600 4600 4600 4600
Vegetables, nec(462) - Production (tonnes) 760 760 810 810 850 900 1000 1000 1000 1000 1000 1000 1000
1995 1996 1997 1998 1999 2000 2001 2002 2003 2004 2005 2006 2007

19
and 2005 agricultural surveys. However, an agricultural census planned for November 2009 should provide
more information specific to the sub sector.
There are systemic issues which impact on production, for example access to land for commercial farming.
Traditional and cultural considerations can discourage land clearance for new plantings and this has contributed
to a lack of product diversification until very recent times.
Organic Production
The organic agriculture sub sector has grown from zero in 1999 to 204 certified farms as of March 2009, with
another 150 expected to enter the certification system by mid 2009. The number of suppliers for the pilot
domestic “Organic Farmers Market” which happen last Friday of every month and a weekly “Organic Basket”
delivery programme has also grown from zero in December 2007 to 36 farmers in May 2009.
Currently demand exceeds supply for the Farmers market and Basket service and these pilots are expected to
expand as production increases. Exports crops and products include cocoa, coconut and coconut products, nonu
and bananas. Unpublished data showed tangible impacts of this growth such as home improvements, people
going back to the land instead of seeking paid employment in town, regular income, better management and use
of remittances to focus on socio cultural commitments while income earned funds daily needs such as school
fees, food and electricity.
Value addition
There is limited processing of fruit and vegetables in Samoa but high demand for processed products that is
currently mainly satisfied through imports although there is scope for local production with minimum
investment in some categories.
As of March 2009, the main success of this sector is the export of Nonu (Morinda citrifolia), juice to Japan and
the USA. Exports peaked in 2005 at just above SAT$8 million but have fallen to approximately half this value
in 2008. As a measure of the success of this product, it represented 8% of total Samoan exports during the
period from July 2008 to July 2009.7 Taro and banana chips are also produced. The strategy intends to increase
availability of inputs enabling the further development of value added activities for the fruit and vegetable
sector.
Domestic market dynamics
Samoa has grown fruit and vegetables since the islands were originally populated. There has been a stronger
vegetable than fruit cultivation in the past. However, data show very clearly a dramatic decrease in the
consumption of traditional foods, which include fruits and vegetables with the exception of taro and banana,
which have experienced an increase of consumption from 1991 to 2003.
Imports
Significant amounts of fruit and vegetables are imported into Samoa. According to the Samoa Central Bank
2007 report, the imports of vegetables and fruits was just under SAT$4 million and SAT 1.8 million,
7 Central Bank, National Export Strategy of Samoa

20
respectively. The substitution of imports by local production has been identified as a possible growth
opportunity for the fruit and vegetable sector. Annex 7 and 8 provide values for the imports (2002-2008) by HS
category.
Figure 2: Total vegetable imports into Samoa from 2002-2007
Figure 2: Total fruit imports into Samoa from 2002-2007
Total Vegetable Imports
0
200000
400000
600000
800000
1000000
1200000
1400000
1600000
1800000
2002 2003 2004 2005 2006 2007
Year
kg
0
500000
1000000
1500000
2000000
2500000
3000000
3500000
4000000
4500000
S$ Quantity
Value CIF
Total Fruit Imports
0
50000
100000
150000
200000
250000
300000
350000
400000
450000
500000
2002 2003 2004 2005 2006 2007
Year
kg
0
200000
400000
600000
800000
1000000
1200000
1400000
1600000
1800000
2000000
S$
Quantity
Value CIF

21
Issues Affecting the Sector Value Chain
Issues constraining development of the Fruit and Vegetable sector were identified8 at all points of the value
chain from production inputs and land resource issues through financing and marketing access to consumer
education and preference. Annex 6 provides Value chain maps from the workshops.
Many of these issues are interlinked and interdependent and are related to the market and buyer requirements.
Hence the need for a comprehensive and holistic strategy and a broad based cross sector approach to addressing
these issues.
The issues that were identified fall into broad categories and are identified below.
1- Inefficient Trade Facilitation and high transport costs
2- Limited market access (distribution channels for fresh produce)
Lack of market information: grade & standards, prices, buyer requirements, quantities, etc
Low level of awareness and compliance for market standards
No investment in branding and few marketing or promotion skills
3- No policy alignment with private sector priorities and business objectives
Low levels of farmer organisation
No coordinated management of natural resources such as water, arable land and tourism use.
4- Ineffective agronomic support services
Seed production and sourcing not linked to market variety requirements
Inconsistent supply of raw material and inputs and fragmented farmer base
No access to quality inputs and no packaging material produced on the island
5- Lack of access to Finance due to high interest rates and inability to use customary land as collateral
Lack of adapted appropriate technologies at all levels (esp. packaging)
Cultural systems defeating/discouraging entrepreneurial culture in rural communities
High cost of vegetables restricting the amount of vegetables included in the local diet despite awareness
of contribution to healthy eating
Little awareness of healthy eating and nutrition.
8 During the strategy development workshops, by the stakeholder run working groups and through the value chain analysis studies.

22
Existing Projects and Resources Available9
Foreign technical assistance to the sector has been focused until now on improving fundamental supply side
capabilities. The strategy aims to develop a stronger link between market and business development objectives
and requirements and supply activities. Furthermore, developments programs relevant to the agricultural sector
have acknowledged the need for institutional capacity building, key technical support, private sector promotion
and environmental matters.
The level of support on the part of the donor community (approximately US$1-2 million per annum in recent
years) has been limited as compared with the health and education sectors (and to a lesser extent telecom) that
have received the majority of external funding.
In recent years, the MAF received substantial support for capacity building (AusAID Institutional Strengthening
Project, 2002-2007). Currently, the bulk of the support to the agricultural sector is through support to the small
business development (ADB Small Business Development Project, EU Micro-Projects, NZAID and UNDP
Private Sector Support Facility).
Both the Government of Samoa and donors have acknowledged the need for more coordination in interventions
in the agricultural sector and expressed interest in a programmatic approach as framework for external aid in
that sector.
External grants are projected to increase to $152 m representing a rise of 37% over 2008/09. The Agriculture
Sector is allocated a budget of approximately $11.11 million Tala.
The Government is also consulting closely with the World Bank on a substantial investment of US $18.0
million to revitalize Agriculture.
While it is difficult to specify an amount that is allocated specifically to fruits and vegetables, the nature of
farming in Samoa would suggest that the approximate amount of development resources available to the Fruit
and Vegetable Sector is approximately 10 million USD.
9 Section developed using information made available by the Ministry of Agriculture and extracted from the World Bank Mission
Report submitted to MAF in June 2009 and from the ITC / FAO preparatory information report submitted to sector stakeholders
during workshop 1

23
Below is a brief description of the donor programs in the agriculture sector. More details are provided in the
annex 3: Past, current and proposed agricultural projects with external donors and implementing partners
Ausaid: Agricultural Sector Development Strategy 2005-2007: Under the 2005-2007 SDS strategies to
enhance the growth of the agricultural sector were identified and implemented. These strategies included:
(i) enhancing food security; (ii) promoting commercial investment and diversification of crop production,
including high value perishable products for both domestic market and exports; (iii) supporting commercial
investment in livestock and fisheries production; (iv) promoting the sustainable use of forestry resources;
and (v) strengthening of the Ministry of Agriculture‟s capacity for planning, budget management and
Monitoring & Evaluation under the AUSAid supported Institutional Strengthening Program (ISP, 2002-
2007).
EU (i) support to export promotion of crops through the High Temperature Fast Air (HFTA) quarantine
program (completed); (ii) Micro-projects (SR12 million, ongoing); multi-sector including and prominently
agriculture production and agro-processing; and (iii) Implementation of the fruits and vegetables strategy,
ongoing through the International Trade Centre (ITC) under the Agricultural Diversification for the African,
Caribbean and Pacific countries (AAACP);
FAO (i) country support under the regional food security program ($170,000); (ii) TA to assist the Research
and Development Institute (RDIS) for horticulture and food technology; (iii) Technical Cooperation
Program (TCP to assist MAF in the preparation of the Agriculture Sector Review and (v) telefood program.
ADB: Small Business Development Project (US$4.1, completed, emphasis is on rural sector enterprises;
NZAID (NZ$250,000) & UNDP (US$95,000): Private Sector Support Facility (PSSF), with emphasis on
agriculture commercial value chains;
GEF: Small grant scheme (US$400,000), community-based projects including organic farming activities.
SPC: FACT project

24
The future for the F&V sector
Target Markets
The committee and sector stakeholders have reviewed current supply and demand patterns of both fresh and
processed F&V products and identified the following areas listed below as targets for the strategy:
Domestic market and Import Substitution
Priority number one is related to import substitution particularly of fresh and processed fruits and vegetables.
This would see improvements in the sustainable delivery of product and improved quality assurance. The
current imports of fresh fruits and vegetables are about $5,800,000 per annum. In addition there is a growing
market as the Tourism sector has continued to grow in the current global environment. At present in the first 3
months of 2009 the market has expanded 27% over the same period during 2008.
Processors also need to reduce the reliance on processed food imports that can be viably and sustainably
replaced by local equivalent produced products. This market accounts for 20% of total imports.
Export
Existing export markets need to have improved supply chains with stringent quality assurance processes to
enable continued improvements in their niche market access. Fresh fruit and vegetable market access protocols
have enabled development of markets for organic fair trade products with Europe and New Zealand. The Fair
Trade market has grown by 70% in New Zealand under the period march 2008 to March 2009.
Exports of processed fruits and vegetables have increased over the second half of 2008 and have continued to
grow sustainably in the first half of 2009. The growth potential for enhancing and developing this market has
been addressed in this strategic plan in order to ensure the distribution of wealth down the value chain.
The processors are also pursuing diversification of processed products to enable sustainable development of the
products and improved market linkages.

25
Market segments
Focus Phase 1
2009-2011
Phase2
2012-2014
Domestic market
Fresh
Supermarkets, hotels, restaurants, school
canteens, markets, institutional catering
Domestic market
Processed
Supermarkets, hotels, restaurants, school
canteens, markets, institutional catering
Exports Fresh Tokelau, American Samoa, Cook Island,
Australia, New Zealand (Samoan
community)
New Zealand & USA,
Australia (general),
Processed exports USA (incl American Samoa), Japan,
Tokelau, Tonga, Fiji, Australia, New
Zealand (Samoan community)
New Zealand, USA
Australia, EU
In consultation with the local buyers and consumers the following list of products was established for the local
markets. The markets were also separated in terms of volumes required and modes of delivery. Some of these
products are currently the focus of commodity chain studies to further ensure sustainability of supplies.
During the strategy development workshops and follow up meetings the importers and wholesalers also
identified the products having high potential for processing in Samoa including the quantities needed.
Potential product opportunities
Focus Phase 1
2009-2012
Phase 2
2013-2014
Domestic
market Fresh
Eggplant, cabbages, citrus,
potatoes, lettuce, herbs,
tomatoes, capsicums, mangos,
pineapples, papaya, cucumber,
banana, breadfruit
Onions, carrots, garlic, apples,
oranges, celery, mangosteen
Domestic
market
Processed
Chutneys, Honey, Jams, Snack
foods & Chips, Dried fruit,
Fruit Juices Frozen potatoes and
vegetables, dried vegetables,
Bottled & Canned fruit, sauces,
Chilli & Tomato Sauce
Exports Fresh Organic (Bananas, Coffee,
cocoa, coconut), cabbages,
tomatoes, lettuce, cucumbers,
capsicums, limes, pomelo,
grapefruits
Organic and exotic high value fruit,
organic herbs
Processed
exports
Noni Juice, coconut oil, coconut
water, Snack foods & chips,
fruits (banana, pineapple), flour
Organic line extensions, sauces,
canned and frozen fruits and
vegetables dried fruits, desiccated
coconut, vacuum pack taro and
yams

26
The strategy covers a period of five years and is divided into 2 phases:
Phase 1: 2009-2011
This first phase will end at the same time as the completion of the current SDS plan. This phase will commence
with a major demand (buyer quantities and requirements) and supply (availability of produce) information-
gathering exercise that will set the strategy in motion. It will also identify systemic and sectoral fundamentals
such as access to land, water and transport.
The existing business will be complemented by increased fresh and processed exports to Pacific neighbours. A
thorough review of the strategy is foreseen for the end of phase one.
Phase 2: 2012-2014
This phase will see a stronger focus on expansion to new markets, in particular niche or specialty in New
Zealand and Australia. This phase will see a consolidation of the activities from the first phase.
Strategic Objectives and interventions
In order to respond to the demands and needs of the identified markets, the implementation plan included in a
later section in this document has identified strategies, concrete actions and their corresponding implementing
partners.
This section will provide a brief overview of each of the 7 objectives in the strategy by describing each of the
sub-objectives and detailed activities in them. It is important to note that in this section the objectives, sub-
objectives and activities and are shown in a logical order but not in a priority order.
The Annex 1 shows the activities in the order of priority together with their estimated cost for implementation
(a three-year rolling budget developed).
Objective 1: Improve coordination in the sector to successfully implement the F&V Strategy
Currently, the fruit and vegetable sector is dependent on a series of individual spheres that often are not well related to
each other and thus the need for improved coordination across Ministries, development agencies and other stakeholders.
The first task will be to communicate the way forward to stakeholders and implementing partners. It is expected that
government policy will be aligned across government agencies as well as the private sector. The private sector will have
greater input into the setting of government policy to create better enabling environment, to allow the strategy to achieve
its goals. The strategy implementation will be closely monitored at all stages.
Sub Objectives in the Implementation plan: Anticipated results from development activities Communication to stakeholders The majority of individual farmers can articulate why and
how they have changed their working practices by end
2010
Set up monitoring and implementation framework for the
Strategy
A framework is in place and working by January 2010,
respected by major donors and government agencies as a
mechanism for monitoring and implementation
coordination
Policy coherence and linkages to other initiatives The strategy is used as a basis to ensure coherence between

27
policy design, social & economic development and market
aspirations of the private sector at least between 2009 and
2012.
Capacity building for policy design and implementation
National fruit & vegetable chain stakeholders and donors use
the strategy as an input to national and regional development
planning and policy-making – recognised by adequate
government and donor backing at least between 2009 and
2012.
Activities under Objective 1 listed below
Co
mm
un
icati
on
to
sta
keh
old
ers
1.2 After strategy endorsement by cabinet and launch, organise 2 stakeholder meetings in Upolu and in Savaii to encourage ownership and communicate objectives to farmer communities
1.3 Select potential opportunities for presenting strategy in existing government forums (e.g. World Food Day, MWCD meetings, Environment Week, Measina forum) to successfully coordinate and promote the implementation of activities
1.4 Plan for periodical update of strategy implementation progress to stakeholders using media and communication tools such as brochures, DVD, internet, radio, tv)
Set
up
a m
on
ito
rin
g a
nd
imp
lem
en
tati
on
fram
ew
ork
fo
r th
e
str
ate
gy
1.5 Create or adopt an implementation and monitoring framework to enable Coordinating Committee to evaluate and follow up on implementation of the strategy and make required changes in light of the evolving sector
1.6 In cooperation with the Aid Coordinating Unit of MoF and MAF, develop an operative budget for the implementation of the strategy and validate list of existing and potential donors and partners for implementation
1.7 Table progress reports on the implementation of the Fruit and Vegetable Sector Strategy and highlight key issues that require cross ministerial support and involvement at the Trade, Commerce and Industry Development Board (TCI) meetings and/or Cabinet Development Committee on a regular basis
Po
lic
y C
oh
ere
nce
an
d l
inkag
e t
o o
ther
init
iati
ves
1.8 F&V coordinating committee to engage Ministry CEO's (MCIL, Health, MAF, MOF, MNREM) to achieve and sustain cross ministerial support and involvement
1.9 Analyze current legislations, policies, regulations, and any strategies that impinge upon Fruit & Vegetable Sector and determine areas of conflict and potential synergies. (national, regional, international) Investigate alternative formulations (if need be) that will contribute positively to the success of the F&V strategy implementation.
1.10 Align F&V strategy with the overall strategy for the development of Samoa (SDS) Ensure link between the Fruit & Vegetable Sector Strategy with the Agricultural development plan, the National Export Strategy and SROS Plan, Health Sector Plan, MWCSD Sector Plan, Water Sector Plan and MNRE Cooperate Plan. Ensure sector priorities are represented in the Improving Policy Development and Coordination Reform Program (Ref: PO44)
1.11 Strengthen mechanisms for dialogue with private sector and other governments in the region for integration into bilateral and regional policy processes related to fruit and vegetable sector
Cap
acit
y
bu
ild
ing
for
po
lic
y
desi
gn
an
d
imp
l
em
e
nta
ti
on
1.12 Conduct a needs assessment on the requirements regarding capacity building to formulate and implement policy measures for the sector

28
1.13 Conduct tailored national level training to strengthen capacity of government officials and private sector to contribute to policy formulation Link capacity building to the use of PITIC national and regional tools and services (trade commissioners, SOPAC,SPC, USP, PIFS etc)

29
Objective 2: Improve market intelligence and dissemination across the whole value chain
The type of information needed has been identified through value chain studies and market research. Data
collection and analysis are crucial to build an accessible pool of knowledge for the fruit and vegetable sector.
The information has to be made „user friendly‟ and readily available by more traditional means as well as
electronically. This sharing of information will include promotional campaigns both at international and
domestic levels. In Samoa the objective is to reinforce the current work by the Ministry of Health through a
campaign to increase the consumption of fruit and vegetables, which will improve the dietary habits of the
nation.
Sub Objectives:
Determine data needs
Improve data collection and analysis
Improve information dissemination
Promotion of Fruits and Vegetables
De
term
ine d
ata
ne
ed
s
2.1 Map the Value Chain for representative fruits and vegetables (including processed product chains) to determine key market intelligence requirements Check past census/surveys for unused/unreported data and revisit existing databases Potential information requirements: -Market analysis and buyer requirements (identification of market potential and returns); types of varieties and product forms, consumer taste, (eg seasonal requirements, quality standards, post harvest standards & quarantine requirements) -Supply capacity, number and location of farmers (Crop type/variety production data, area planted, yields, monthly production volumes, commercial and households production) -Market monitoring (real-time price, volumes information) / Market Information -Directory of existing support services and of existing funding or grants mechanism and exporters
2.2 Develop an action plan for the provision of market intelligence in cooperation with Statistic department, Samoa Central Bank and Ministry of revenue, MAF Identify existing government agencies or sector associations that could collect, maintain and/or disseminate components of database information.
Imp
rov
e d
ata
co
lle
cti
on
an
d
an
aly
sis
2.3 Assess possibility of private sector provision of data and collection, maintenance and/or dissemination and select potential partners
2.4 Adapt existing census questionnaires and create additional targeted surveys to wholesalers and commercial farmers to create baseline information. Improve Frequency of agricultural census to 5 years and of pest and disease database to 2 years
2.5 Conduct demand & supply studies for a range of existing and potential products and gather information in: Local hotels, restaurants and supermarkets, Regional and international markets
2.6 Conduct annual workshop for key stakeholders for building capacity in data collection/dissemination and analysis

30

31
Continuation of Objective 2 Activities
Imp
rov
e
info
rma
tio
n
dis
se
min
ati
on
2.7 Develop dissemination techniques to reach farmers using radio and community meetings Identify targeted and simple information for improved production planning and linkage to market
2.8 Improve dissemination of market intelligence to domestic buyers, wholesalers and exporters through email and internet
Pro
mo
tio
n o
f F
ruit
s a
nd
Veg
eta
ble
s
2.9 Based on market information (local and international) set up a promotion strategy for each targeted market segment (Domestic and Export)
2.10 Develop promotional point of sale materials to be displayed in hotels, restaurants, Supermarkets, F&V markets and stalls to communicate contribution of fruit and vegetable sector to farmer community livelihoods, promotion of healthy eating and import substitution
2.11 Encourage Chefs and food and beverage mangers to try local foods and adapt their procurement practices and recipes including traditional and exotic Samoan produce.
2.12 Develop and conduct a campaign to promote the consumption of fruits and vegetables as part of a healthy diet: TV health and cooking programmes(including O le Kuka Samoa and the Challenge) School and work place canteen and lunch program Ministry of Health Exercise programs
2.13 Promote backyard gardening for consumption of fruits and vegetables
2.14 Incorporate the Samoan quality standard Logo (Loto nuu) to promote fruit and vegetable fresh and processed produce

32
Objective 3. Build a supply sub-sector that will guarantee consistent and continuous supply of fresh fruit and vegetables
The need for markets to get supplied consistently with quality fruit is the reason for the lack of growth and local
consumption in the fruit and vegetable supply chain. This objective is proposing a two tiered approach to the issue
tackling Community / Smallholder and Commercial Farmers.
Service oriented Collection Points: The development shall be based on consistent and quality supplied fruit and
vegetables into the market through a pilot grading and quality centre. A feasibility study for developing private sector
based service centre is currently being undertaken. It is envisaged that this centre would provide support and services to
farmers and buyers covering the value chain from production to market.
The establishment of this commercially driven system is certainly the pivotal point for most of the activities and
objectives in the strategy. In a way this objective has the potential to drive the implementation of the others: for the
commercial service centre to work at a profit and deliver to market it need to articulate Finance, Information, Training,
GAP and Agronomic Support, Soil and farming system management and coordination across actors.
Several ad-hoc meetings between the Coordinating Committee, Interested buyers (restaurants, hotels, processors,
supermarkets and exporters) have been to define the modus-operandi for the implementation of this objective.
The produce shall be picked up from the village farmers through the local village stores and from the Commercial farmers
and then graded and offered to the hospitality, retail and processing industry.
This objective will be piloted by the Coordinating Committee with initially a group of selected farmers and a group of
selected buyers based on selected crops and products. If the business model is successful, then it is envisaged that it will
be replicated and expanded.
The main services provided will be related to Information dissemination (price, quantities needed, quality, transport
availability) through mobile phones; cooling, grading, and sorting. One of the most capital services to be provided is the
pick-up and delivery. Such support would enable farmers to meet customers‟ quality requirements and allow appropriate
planning for planting.
The grading process provided by the service centre will create and enforce strict quality standards on all produce agreed to
with the buyers. The service centre will have the opportunity to negotiate better prices for lower or processing grades with
processors thus also becoming a channel for fruit that would otherwise remain unsold or rot.
On a second phase, the services provided would relate to providing finance, inputs and agronomic service support in
cooperation with extension officers.
Improvement of Production and Agricultural Practices: Conventional Agriculture is completely inappropriate for the
shallow topsoil‟s in Samoa. Initial Value Chain Study inspections of farms have determined capacity limitations and
identified deficiencies in the conventional agricultural practices currently in use. Land usage technologies developed in
countries such as New Zealand and Australia which have the advantage of much deeper topsoils (6 – 15 feet) destroy the
Samoan topsoil within very short periods. Consequently agronomic services catered under the strategy implementation
will be adapted.
One of the key suggestions in implementation is to explore the use of raised beds using artificial soil mediums to ensure
less cost of production (tilling and clearing the land) and higher and more consistent yields. A model farm has also been
established in line with Objective 4 of the current strategy.
It is also important to strengthen the farmers associations and groups collaborate to achieve this objective.

33
Sub Objectives:
Viability of collection points or service centres/ and their potential roles explored to reduce post harvest
loss.
Strengthen farmer associations to improve production and market linkages
Quality compliance and standards
Access to appropriate Inputs for sustainable cropping
Improve Research and development
Ex
plo
re V
iab
ilit
y a
nd
Pilo
t c
olle
cti
on
po
ints
or
serv
ice c
en
tre
s t
o
red
uc
e p
os
t h
arv
est
los
s
3.1 Assess the feasibility of commercially driven pack houses and post harvest service centres defining clearly the roles of and type of services that will be provided to Value Chain operators and the structure in which these centres will be operated and managed (farmer associations and / or NGO's and / or private sector)
3.2 If feasibility study is positive define and agree with Ministry of Agriculture the potential role and type of services that could be provided to farmers, processors and buyers. Core services provided could include: Collection, cooling, grading sorting, packing, distribution, manage hubbing and bulking of production outputs. Also finance and admin support services Expanded services could include: Marketing of produce, training for farmers on quality and management, information collection and dissemination, Finance/credit lines and collateral provision, common sourcing of supplies, bulk buying of inputs, seeds and packaging and inviting technical (national/regional/international) consultants in the field of growing, post harvest handling Longer term functions: Increase overall volume and integrate independent farmers, empower farmer community bargaining skills, Maximize efficiency by working together and sourcing commonly, Share market and buyer demand information, encourage first stage food processing in co
3.3 Determine the best mechanism for funding the centers to cover costs while not charging users excessively (e.g. commissions perceived from successful commercial operations and annual contribution by farmer members and buyers)
3.4 Determine the potential for small holder and community farmer collaboration, ownership and use of services and possibly distribute shares of centre to farmers based on production volumes
3.5 Based on farmer and buyer agreements, determine the most appropriate location for one pilot centre in Upolu Pilot the service Centre model Starting with a pilot run with a selected group of 10-20 farmers and selected buyers to enable the development of a viable framework or contract that can be used effectively between suppliers and buyers who will be using the centres. Develop and define appropriate contractual arrangements adapted to the Samoan context

34
Str
en
gth
en
fa
rmer
as
so
cia
tio
ns t
o im
pro
ve
pro
du
cti
on
an
d m
ark
et
lin
kag
es
3.6 Provide start up operational funding to the farmers association office (ie for computer
facilities and overheads)
3.7 Strengthen management capacity of farmers associations by providing targeted training (i.e. "institutional strengthening programme")
3.8 Support the development of a members database including production area, crops, soil, water, seasonalties
3.9 Strengthen farmer groups and networks (in cooperation with MAF, villages, private sector and potential buyers) to implement sharing of equipment, experiences and knowledge through service centre and market visits Encourage the formation of farmer associations in rural locations of Samoa. Support network coordination through an umbrella organization.
3.10 Improve farmer associations’ capacity in post-harvest handling practices at the farm and use service centres to distribute to markets.
3.11 Improve linkages and cooperation between farmers associations and crops division advisory services Develop a system of field attachments for extension officers
Qu
ality
co
mp
lian
ce a
nd
sta
nd
ard
s
3.12 Promote and apply national food safety standards and operational procedures including CODEX and good agricultural practices across the whole value chain Strengthen implementation of current programs for standards/quality assurance (international certification requirements to increase compliance) Put in place mechanisms to Identify different market opportunities across the Value Chain based on quality produced
Acce
ss t
o
ap
pro
pri
ate
Inp
uts
fo
r
su
sta
inab
le
cro
pp
ing
3.13 Determine farm inputs required and tender for agricultural input suppliers to better align based on market requirements (including imported supplies)
3.14 Review the role of the agricultural store and propose restructuring
Imp
rove R
es
earc
h a
nd
Develo
pm
en
t
3.15 Produce information on and apply suitable technologies to extend season and thereby window of opportunity (de-greening of citrus)
3.16 Evaluate options for development and multiplication of fruit and vegetable seeds/rootstock appropriate for Samoan agriculture Undertake a feasibility study for commercially driven propagation and nurseries
3.17 Link educational and scientific institutions to farmers, farmer groups, and service centres in order to promote on farm research Initiate mobile farmer field training for improved replication of seed propagation techniques

35
Objective 4. Improve performance by building a sector that is well trained and supported by a well developed and properly executed capability plan
Every stakeholder in the supply chain identified training as a key requirement. This objective calls first for an
audit of training needs for the productive and government implementing partners. Following the audit, the
training providers will be identified to understand what can and should be made available. Once the needs are
established, a menu of training options will be offered to the sector. However the underlying principle of the
strategy needs calls for practical training at all levels using model farms and very concise modules that can be
delivered on site (for example in farms or factories). Sub Objectives:
Identification of training needs
Delivery of Training at support service level
Delivery of training at farmer level
Delivery of Training at Cross cutting level
Delivery of Training at Processor level
Iden
tifi
cati
on
of
train
ing
need
s
4.1
Conduct a comprehensive needs assessment of training requirements for the fruit and vegetable sector based on market and buyer requirements, for the entire value chain from producer to buyer and consumer. Identify successful training institutions and approaches and explore opportunities for replication. Identify which government and relevant agencies require specialized training to deliver market driven services
4.2
Develop a training and capacity building action plan per segment (farmer, extension, processor, buyer, cross cutting). Estimate resources needed and identify support service providers for delivery of training. Segment training activities according to short term and long term modules and include both theory and practical hands on material.
Deliv
ery
of
train
ing
at
farm
er
level
4.3 In cooperation with the MAF, villages, private sector and buyers, develop or improve approach towards a more commercially driven hands on methodology for training farmers
4.4
Identify a group of farmers for pilot testing training. Reinforce on site training at the farms & provide basic management skills including record keeping. Specific on-field training on pest disease management and planting and on post harvest handling, Training on choosing the best varieties, seeds and inputs and what effect it can have on your yield and income. Ensure close follow up by extension officer / service centre: before fertilizer is applied, before harvest and when pest is detected.
4.5 Identify and commit successful farmers to serve as a model to disseminate experience and training to inspire other farmers.
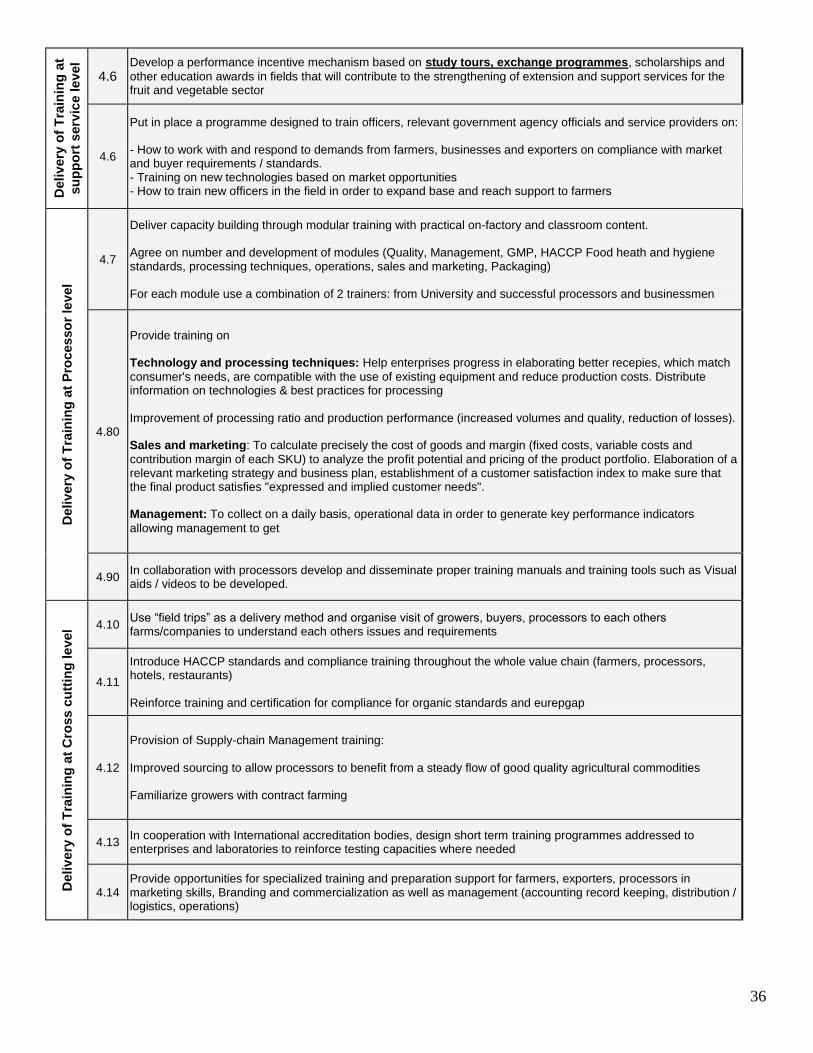
36
Deliv
ery
of
Tra
inin
g a
t
su
pp
ort
serv
ice le
vel
4.6 Develop a performance incentive mechanism based on study tours, exchange programmes, scholarships and
other education awards in fields that will contribute to the strengthening of extension and support services for the fruit and vegetable sector
4.6
Put in place a programme designed to train officers, relevant government agency officials and service providers on: - How to work with and respond to demands from farmers, businesses and exporters on compliance with market and buyer requirements / standards. - Training on new technologies based on market opportunities - How to train new officers in the field in order to expand base and reach support to farmers
Deliv
ery
of
Tra
inin
g a
t P
rocesso
r le
vel
4.7
Deliver capacity building through modular training with practical on-factory and classroom content. Agree on number and development of modules (Quality, Management, GMP, HACCP Food heath and hygiene standards, processing techniques, operations, sales and marketing, Packaging) For each module use a combination of 2 trainers: from University and successful processors and businessmen
4.80
Provide training on Technology and processing techniques: Help enterprises progress in elaborating better recepies, which match
consumer's needs, are compatible with the use of existing equipment and reduce production costs. Distribute information on technologies & best practices for processing Improvement of processing ratio and production performance (increased volumes and quality, reduction of losses). Sales and marketing: To calculate precisely the cost of goods and margin (fixed costs, variable costs and
contribution margin of each SKU) to analyze the profit potential and pricing of the product portfolio. Elaboration of a relevant marketing strategy and business plan, establishment of a customer satisfaction index to make sure that the final product satisfies "expressed and implied customer needs". Management: To collect on a daily basis, operational data in order to generate key performance indicators
allowing management to get
4.90 In collaboration with processors develop and disseminate proper training manuals and training tools such as Visual aids / videos to be developed.
Deliv
ery
of
Tra
inin
g a
t C
ross c
utt
ing
le
vel 4.10
Use “field trips” as a delivery method and organise visit of growers, buyers, processors to each others farms/companies to understand each others issues and requirements
4.11
Introduce HACCP standards and compliance training throughout the whole value chain (farmers, processors, hotels, restaurants) Reinforce training and certification for compliance for organic standards and eurepgap
4.12
Provision of Supply-chain Management training: Improved sourcing to allow processors to benefit from a steady flow of good quality agricultural commodities Familiarize growers with contract farming
4.13 In cooperation with International accreditation bodies, design short term training programmes addressed to enterprises and laboratories to reinforce testing capacities where needed
4.14 Provide opportunities for specialized training and preparation support for farmers, exporters, processors in marketing skills, Branding and commercialization as well as management (accounting record keeping, distribution / logistics, operations)

37
Objective 5. Improve financial situation of sector enterprises10
This objective calls first for an audit of existing financing options for the fruit and vegetable sector because the
actual financing mechanism available are not specifically catered to solve the needs (conditions, interest rates,
repayment terms, and risk evaluation) of the sector and the stakeholders.
The objective also foresees special recognition of the needs of the fruit and vegetables sector such as long time
lags from planting to harvest with some crops. The objective is targeting smallholder finance as well as working
capital finance and export finance.
Training is foreseen to up-skill farmers and enterprises in making requests for finance. It will include advice on
how to assess risk from a commercial perspective. There will be a disaster risk profile for Samoa to plan
contingencies.
Additionally promotion for Foreign Direct Investment and national private sector investment is also a priority.
The overall situation: A credit information system and a law that protects lenders and borrowers rights is not
yet operational in Samoa. This is an essential element to stimulate formal credit to the agri-business sector. The
Banks also need to take into account the high risks associated with the nature of this sector. These risks have
contributed to a high rate of default loans, which at end of fiscal year 2007 represented 68% of total default loan
repayments.
The share of loans by commercial banks to the agricultural sector has progressively decreased in the last decade
from 2 to 1.5 percent of total loan amount, against a significant increase of the construction sector and “other
activities” which are mainly loans to private individuals11
.
Currently the Central Bank of Samoa has estimated that a wide proportion (75 million Tala) of the money
available for loans is not being currently used or disbursed into loans by the financial institutions.12
In order to solve the current lack of commercial funding and the high cost of it, the strategy is proposing
to provide funding to farmers using innovative mechanisms and concentrating in the buyers and input
suppliers as imbedded actors in the value chain capable of taking a financial scheme management role.
Access to Finance and Collateral: Apart from the lack of experience of commercial banks to provide loans to
the agriculture sector stakeholders the lack of collateral is one of the key issues. A contract (subscribed by a
farmer or a farmer association), to deliver a certain amount of produce at an agreed date and with specific
quality requirement, could be considered by banks as an income generating activity/transaction that increases
the probability of repayment of credit by the farmer in the future.
Currently the Development Bank of Samoa guarantees for loans and there aren‟t any fixed criteria that regulate the release
of guarantees. The lack of selection criteria among loans reflects on the significant default rate by clients, especially the
agriculture and fishery sector.
10
As an Input to the strategy development FAO conducted a desk research study in Samoa: Supply chain finance and risk
management for Samoa‟s fruit and vegetable sector: issues, constraints and potential solutions. Some extracts are used to describe this
objective. 11
Pacific Economic Bulletin, 2007 12
Central Bank of Samoa, Press Release Observer newspaper July 2009

38
On the overall policy level this strategy is proposing to make credit to the economic sector more effective by reviewing
and define objective criteria to be followed when approving a loan guarantee. This review will be done jointly by Private
sector and the Samoa Development Bank.
Finally this objective is considering developing viable and sustainable livelihoods for the rural farmers by providing price
stabilization on the products by providing stable prices based on profitability margins. Also direct credit lines will be
made available for technology investment by processors and farmers.
Pilot of a delivery mechanism through the commercially driven Agri-business Centres (Objective 3): As explained
above, the strategy will explore innovative schemes and mechanisms to provide funding to farmers. The commercially
driven service centre will be imbedded in the value chain and will therefore have a trust / contractual relationship with
both the farmers and the buyers. This would allow to run a profitable business and also to provide funding, for example
through provision of inputs and credit to smallholders who would in term sell the produce to the centre. The Centre would
also hedge different price risks by finding different markets (processing, export, fresh hotels, fresh and processed
supermarkets).
Weather Risk management: The analysis of weather risk exposure and feasible tool shall be conducted at all levels:
micro, meso and macro and for all risk layers. With reference to risk layers, a clear definition of the border between the
risks that are insurable from those that are not insurable (because of their high frequency and the magnitude of losses they
entail) will also be done.
The most viable solution to manage disaster risks -probably at a regional level- is to conceive financing instruments that
are a combination of national budgets with external financing (donors) together with private sector funding (international
re-insurance companies). Sub Objectives:
Undertake Situational Analyses
Develop and implement finance delivery mechanisms
Improve access to finance
Increase levels of investment
Policy and legislative change
Introduce Risk management facilities
Un
dert
ak
e
Sit
uati
on
al
An
aly
sis
5.1 Conduct finance needs and risk exposure assessments for representative fruit and vegetable value chains, (including existing grant schemes)
5.2 Together with the Aid Coordination Division and the MOF identify and consolidate a list of financing bodies or institutions targeting agriculture sector and SME finance at a national and regional level that can fund the different stages of the Value Chain
Develo
p a
nd
im
ple
men
t
fin
an
ce d
eli
ve
ry m
ech
an
ism
s 5.3 For the selected products, develop appropriate finance tools (for example, using the contract as
collateral and/or risk management products, programs such as factoring, the use of remittances and insurance products) for value chain stakeholders: Commercial farmers, Small holder farmers, SME processors/ exporters On this basis, develop a SIMPLE and PRACTICAL model or template contract that would suit both the farmers and buyers (SBEC model)
5.4 Explore using contract, solid business plans and micro-insurance (purchased by individual stakeholders) as collateral in order to guarantee better access to finance for individual farmers directly or through service centre or farmer association
5.5 Create a flexible and operative system of low rate seasonal credit and simplify enterprise access to credit resources during peak periods for the purchase of inputs.

39
Imp
rove
acce
ss t
o
fin
an
ce
5.6 Encourage banks to use value chain approaches to assess risk, and evaluate exposure, based on a complete understanding of the enterprise’s position and linkages to other activities in the chain.
5.7 Ensure provision of information, through SFA, MAF, Service providers, on how to access existing training on business planning, and funding proposal writing
Intr
od
uce R
isk
man
ag
em
en
t
facilit
ies
5.8 Based on the risk profile, design risk management tools and procedures to manage the different risk layers (national, meso and micro level) and facilitate credit uptake, respectively
5.9 Conduct a study on the feasibility of creating a multi-sector disaster aid facility
5.10 Evaluate the establishment of a disaster risk management fund at a regional level to provide local and international insurance companies an incentive to insure the agricultural sector and to provide clear definition of the kind of risks that are being covered
Incre
ase l
ev
els
of
inv
estm
en
t
5.11 Provide price incentives or in kind incentives to small farmers to increase their investment in technology/quality inputs
5.12 Make available direct credit lines and financial schemes to chain stakeholders at an affordable cost by reducing interest rates and improving repayment terms on loans from development banks.
5.13 Encourage SME's to purchase capital equipment for primary processing and value addition using time-bound lower rate loans and tax incentives. Investigate possibility of establishing mutual funds through Producer Organizations for larger investments
5.14 Seek assistance for processors to explore relevant available technology and market development needed for appropriate follow-up, evaluation and information dissemination CDE/PSSF/PIFS/PITIC
5.15 Establish a technology support fund, accessible to farmers, SMEs or export companies that have an identified a potential market and the right technology to scale up production and improve the quality to take advantage of this market
Po
lic
y a
nd
leg
isla
tive c
han
ge
5.16 Engage farmers and private sector stakeholders in the next review of Development Bank of Samoa legislation in order to provide inputs relevant to improved access to finance
5.17 Encourage access to finance through government policy and strengthen support to specialized finance agencies
5.18 Together with the Aid Cooperation division and the MOF, develop a plan to engage regional & international commercial and development banks as potential funding partners for the implementation of the strategy

40
Objective 6. Promote integrated management of resources to ensure sustainability of the fruit and vegetable sector
An efficient fruit and vegetable sector can only be established with an efficient enabling environment. This objective first
addresses the attitudes of Samoans towards the career of farming and also seeks to support the entrepreneurial drive and
risk aversion. The status needs to be lifted to ensure a regular supply of new entrants, particularly young farmers to the
profession. The underlying principle is that farming will attract youth only if it is associated with making money, having a
decent standard of lifestyle and not having high entrance costs (ie availability of lease land).
The objective also explores potential responses to basic needs for the sector such as access to arable land, security from
theft, transport infrastructure and regularly available water and power. In Samoa, about 80% of land is under customary
ownership, while 16% is owned by the Government, and about 4% is freehold. Traditionally, customary ownership is
vested in the matai (elected head of an extended family) or a local chief. Tackling the problems of a customary system is
difficult and highly sensitive, and it is not surprising that the Government has moved cautiously on resolving land issues.
Research into improvements in crop varieties based on market requirements needs to be increased. The involvement of
both the public and private sectors in research activities is also key.
Sub Objectives:
Access to land and improved utilisation
Change of Mindset and ownership of farming
Water supply and irrigation
Ch
an
ge o
f M
ind
set
an
d o
wn
ers
hip
of
farm
ing
6.1 Develop an aggressive awareness campaign on the lifestyle and potential economic benefits of engaging in Agribusiness activities
6.2 Include Entrepreneurship and leadership training in high schools and through NGO's
6.3 Identify one pilot village to provide fencing based on potential and commitment Investigate how to provide free fencing and through which institution and what impact it will have Establish a mechanism to repay fencing tied to profit and village council/project leader/government
Wate
r su
pp
ly a
nd
irri
gati
on
6.4 Contribute and provide inputs to the development and implementation of the National water management strategy in relation to F&V sector needs (areas covered, water harvesting, water collection, water storage, water use, irrigation)
6.5 Document and monitor the volume of water use in fruit and vegetable production (irrigation, cleaning after harvest, cleaning of processing/packing area etc)
6.6 Pilot test water harvesting in pools to avoid water shortage during dry season
6.7 Dialogue with Samoa Water Authority to find ways for improving processing firm access to potable water
Acce
ss t
o lan
d a
nd
imp
roved
uti
lizati
on
6.8 Explore leasing of customary and government land for commercial fruit and vegetable production and processing
6.9 Document comparative production and income figures from farms that have removed rocks and those that have not (helps promotion of good management tools in doing successful commercial farming); Develop a business model and include projection of income generation opportunities arising from the use /lease of land for fruit and vegetable production
6.10 Pilot using alternative technology such as production above the ground in beds to reduce effort needed to remove rocks. If successful replicate and train other farmers
6.11 Where customary land is used for commercial production of fruit and vegetables, draft a template contract between farmers and land owners for customary land to be signed by the lawyers to make it binding

41
Objective 7. Strengthen Samoa Association of Manufacturers and Exporters to provide services that will increase returns and overall value addition for sector
The Strategic Development of Samoa document recognises that the private sector is the engine of growth.
Private sector involvement is key to the sustainable and successful development of market outlets for any
surplus fruit and vegetable production particularly related to value addition through processing.
The capacity of SAME members to manufacture ranges of fruit and vegetable based products will be built up by
an institutional strengthening programme. This will supply the domestic market and explore the offshore
potential.
SAME‟s mandate needs to be reviewed and its resources strengthened to allow it to perform the tasks foreseen
for it and most important to deliver the quality service Samoan processing SME‟s need.
Sub Objectives:
SAME membership and services
Funding of SAME
Strengthening SAME's Capacity
Pilot expansion of services
Increase processing in Samoa
SA
ME
mem
bers
hip
an
d s
erv
ices
7.1
Develop a mandate and vision for SAME in consultation with stakeholders and clearly define core services in the strategic plan Services to be provided by SAME: Distribution of information: Market information, Quality assurance processes (ISO), HACCP, Direct enterprise support and hands on training (Production, Costing and Pricing, Occupational health and safety, Product development, advocating and lobbying for sector interests
7.2 Strengthen SAME by aligning / redefining its governance structure to its mandate and to the services to be provided (corporate plan)
7.3
Segment SAME's members in terms of services to be provided and intensity of support required. (General members: Monthly review, market information and sector news, Core members: Intensive follow up and support in operations, market access and product development)
Fu
nd
ing
of
SA
ME
7.4
Develop costing and pricing of SAME services and explore tying member contributions to results of SAME support (commission or fees pegged to increase of sales) Explore tying SAME services to a commercially driven model of return where, if SAME helps increase profit, then processors pay commission
Str
en
gth
e
nin
g
SA
ME
's
Cap
acit
y
7.5 Develop a mid-term staffing programme and define Job descriptions and roles in order to deliver SAME services
7.6 Enhance product development capacity built in SAME in cooperation with SROS.
Pilo
t
exp
an
si
on
of
serv
ice
s
7.7 Select a pilot group of processing firms and focus SAME's efforts in order to achieve maximum impact on those firms

42
Implementation Plans
Please refer to the A3 version of the Implementation plan attached at the end of this document

43
Resources Needed
In order to fully implement all the activities under the current strategy and implementation plan, a revolving 3-
year budget has been prepared by the Coordinating Committee. The budget and the detail of costing per activity
can be consulted in the Annex 1.
The total amount of funding needed accounts for 52, 234 Million Samoan TALA. The table below provides the
detail per objective and year.
Total Year One Year Two Year Three
Objective One: $ 512,200 $ 133.000 $ 239,600 $ 139,600
Objective Two: $ 696,000 $ 515,000 $ 88,000 $ 93,000
Objective three: $ 4.580.000 $ 2,085,000 $ 1,260,000 $ 1,235,000
Objective four: $ 3,284,000 $ 1,980,000 $ 652,000 $ 652,000
Objective five: $40,992,000 $13,697,000 $13,615,000 $13,680,000
Objective Six: $ 540,000 $ 110,000 $ 380,000 $ 50,000
Objective Seven: $ 1,630,000 $ 730,000 $ 450,000 $ 450,000
Total: $52,234,200 $19,250,000 $16,684,600 $16,299,600
As discussed in the existing resources section in this document some resources are already available through
existing development activities and projects.
The way forward for the successful implementation and resource allocation to this strategy is currently being
discussed with the Aid Coordination branch of the Ministry of Finance.
The funding needs reflect the starting point for the fruit and vegetable sector and industry. As explained in the
sector situation section of this strategy the F&V sector has received hardly any direct investment in the past and
the funding allocated has not successfully delivered the expected results.
The funding requirements also reflect part –but not all- of what is needed to make the sector more competitive
and to enable it to substantially contribute to the Government‟s and MDG goals. It is clear that one of the
essential components needed is already existing and that is the private sector leadership together with the
mobilisation of the sector stakeholders towards a common goal and market / development objective.

44
Forecasts of evolution of Fruit and Vegetable market
The present uncertainty surrounding the global economic situation makes forecasting an inexact science.
The Horizon one: (2009-2012) scenario shows a dramatic slowdown in global demand of almost every non-
essential purchase. This affects fruit and vegetables all around the world. Local and seasonal (i.e. low cost)
produce seems to be still on shopping lists, but many previously popular imported or exotic produce has
suffered major declines in sales and therefore prices.
In the short term, there will be fewer opportunities to develop a broad range of fruit and vegetable exports. The
major exception at the present time appears to be the export of Noni juice, which occupied 8% of total Samoan
exports in the period July 2008 – January 2009.
Additionally in the short term, availability of credit through the traditional banking system is under threat even
more when the fruit and vegetable sector activities require specific financing tools.
The pressure on governments all over the world to prop up their local economies could potentially lead to
reductions in overseas aid and assistance. Some governments are already realigning their priorities, which may,
in this medium term, affect the amount of aid that is available to Samoa. Additionally in 2010, Samoa will be
upgraded to „developing country‟ status from the present category of „least developed country (LDC)
The Horizon two: (2012-2014) scenario could be that the world economy starts to rebuild wealth and demand
increases across the board and consumer confidence returns. A well executed programme of domestic market
improvements in the fruit and vegetable sector in the earlier phases will set up a good platform for exports when
the up-turn in demand returns.
The scenarios are based on a number of assumptions that are listed below.
Optimistic scenario optimistic
Increased investment in the production of fruits and vegetable productivity rises
Fruit and vegetable farmers can be persuaded to invest in their business
Fruit and vegetable farmers gaining access to and propagating the required basic planting material such
as seeds, seedlings, fertilizers, herbicides, pesticides etc
Fruit and vegetable farmers gaining the funding to support improved work practices
Fruit and vegetable farmers become better organized and acquire better business management skills
Fruit and vegetable farmers achieving improved working relationships with their customers to
understand and meet their requirements
Processors improve their operational practices and overall quality of production
Processors improve their operational practices by investing in technological improvements
Both farmers and processors gaining access to adequate funding on reasonable terms
Buyers support the efforts of farmers and processors and buy local wherever feasible
Lower cost vegetables become available to consumers, which combined with vegetable consumption
promotion, will increase the level of vegetable consumption in the Samoan diet.

45
Table 7: Financial impact (optimistic) – SAT$ pa
Focus Phase 1
2009-2012
Phase 2
2012-2014
Domestic market
Fresh
SAT$2.5million SAT$6.0million
Domestic market
Processed
SAT$1.00million SAT$5.0million
Exports Fresh SAT$250k SAT$1.0million
Processed exports SAT$1.0million SAT$5.0million
Total increase per
annum
SAT$4.75million SAT$17million
The optimistic projects of the financial impact resulting from the strategy foresee an annual increase of
SAT$17.0million per annum by phase two of the implementation process. It should be stressed that this figure
does not represent a ceiling, as the actual result could be much higher. The fresh market will benefit from an
extra SAT$2.5million in the first period of the plan. Approximately 50% will come from a reduction in imports
and the balance from increased domestic consumption.
By the end of the plan, under the optimistic option, imports will be reduced by SAT$2.5 million, which is the
total value of current fruit and vegetable imports in the categories, which can be grown in Samoa. The balance
will represent a 25% increase in domestic consumption by value. In volume terms, the figure will be higher as
consumption of homegrown produce is also expected to rise.
The figures for processed fruit and vegetables are even higher. They assume a very significant increase in the
availability of processed grade fruit. This will give processors confidence to increase their operations and
develop markets both in Samoa and overseas. A positive impact of SAT$10million per annum is expected –
50% from both domestic and export sales. Import substitution of sauces and fruit juices and export sales of
canned and/or frozen exotic fruit will represent the bulk of the increase in the processed sector. Present levels of
imports suggest that there is SAT$500k per annum available by way in import substitution for sauces and
juices.
A marketing campaign for Samoan organic processed products will compliment a sister campaign for fresh
organic produce for export. The figure of SAT$1.0million for exports of fresh fruit and vegetable exports may
seem less than ambitious. It is reasonable given the difficulties of exporting to regional overseas markets. To
obtain this level on a sustainable basis will be a great achievement
Pessimistic scenario
The quantity and quality consistency of fruit and vegetables does not improve within the expected time
frames
Fruit and vegetable farmers do not achieve improved returns from their land
Fruit and vegetable farmers do not invest in training, new seeds and business practices
Fruit and vegetable farmers stick to their old practices and remain fragmented and supply driven
Processors do not invest in training and work practice or technological improvements
Finance for investment in the growing and processing sector is either not readily available or it is too
costly
It is likely that neighbouring countries, which are overcoming these difficulties quicker than Samoa, will
attract the bulk of foreign investments to the region
Tax proceeds will reduce and unemployment in the city suburbs will increase leading to unrest and
increased poverty

46
The result would be a weaker growing sector that would have both financial and social repercussions. Imports
of produce, which could be grown in Samoa, would rise and inward investment in other areas could probably be
negatively affected too.
We have taken the assumptions above and projected below the financial implications of the pessimistic
scenario.
Table 8: Financial impact (pessimistic) – SAT$ pa
Focus Phase 1
2009-2012
Phase 2
2012-2014
Domestic market
Fresh
SAT$1.0 million SAT$1.0 million
Domestic market
Processed
SAT$250k SAT$250k
Exports Fresh Nil impact Nil impact
Processed exports SAT$500k SAT$500k
Total increase per
annum
SAT$1.75million SAT$1.75million
The pessimistic projections assume an impact of just under SAT1.75million per annum by the end of the
implementation period. Positive impacts come from a gradual reduction in the level of imports of fresh produce
and some import substitution of processed foods and growth in export of this category. The domestic fresh
market figures assume a contribution of approximately 50% from import substitution with the other 50%
coming from local market consumption growth.
As far as processed fruit and vegetables are concerned, the pessimistic figures foresee an initial spurt in the
manufacture and marketing of processed foods, largely driven by extra quantities of processed grade fruit and
vegetables becoming available.
Fresh exports are seen as remaining very low and deriving no increase as a result of the implementation of the
strategy. As with processed foods, increased quantities of processing grade fruit will allow a lower cost of fruit
for use in preserves (organic or conventional). However, the pessimistic assumption is that there will be no
marketing activity outside Samoa to stimulate demand and that product development will be slow.
This is likely to be the worst-case scenario if the strategy is implemented. The benefits are still worth having but
should be evaluated against the likely results from the optimistic scenario.
Possible external shocks: The comment on the forecasts relates to the known issues and circumstances relating
to the sector. However, the possibility of a severe shock to the fruit and vegetable sector in Samoa cannot be
discounted. Some of these have occurred within recent memory. They can be divided into externally and
internally caused and fall into three categories: Climate and environmentally driven – cyclones, drought,
disease, pollution, earthquakes. Some fall back positions will be factored in activity 5.13 and in the Risk
Management strategies that will be put in place.

47
NCCS & Implementation Framework
The Fruit and Vegetable Strategy Development Coordinating Committee has operated on a voluntary basis and
was appointed by stakeholders in July 2008.
It is comprised of representation of farmers, processors, tourism industry, support services and the Ministry of
Agriculture.
The Committee has driven the development of the strategy and ensured the necessary involvement of and
communication with stakeholders, donors and authorities.
The Coordinating Committee was also responsible for the overall quality and relevance of the strategy as well
as for maintaining and generating the necessary ownership among stakeholders for successful implementation.
Towards the implementation of the Strategy the Coordinating Committee has been assigned the role of
managing the implementation and monitoring progress. This was a stakeholder decision backed by Cabinet.
The proposed Implementation and monitoring framework is detailed below
High Level Support
Honourable Prime Minister
Coordinating
Committee
Secretariat and
operations
Stakeholders
GOV Agencies
Donor’s
NGO’s
Other IO’s and
Regional bodies
CSO’s /CBO’s
STRATEGY Implementation
Ministries
Agriculture
MCIL
Finance
Health
Women
Donors and
Funding
Implementing
partners
Buyers
High Level Support
Honourable Prime Minister
Coordinating
Committee
Coordinating
Committee
Secretariat and
operations
Secretariat and
operations
StakeholdersStakeholders
GOV Agencies
Donor’s
NGO’s
Other IO’s and
Regional bodies
CSO’s /CBO’s
STRATEGY Implementation
Ministries
Agriculture
MCIL
Finance
Health
Women
Donors and
Funding
Implementing
partners
Buyers

48
NCCS Committee Members
Chairman of the Committee
Samoa Association of
Manufacturers and exporters Grant Percival [email protected]
Vice chair of Committee
Private Farmer Edwin Tamasese [email protected]
Farmer Association Ricky Westerlund [email protected]
Farmer Association Jeff Atoa [email protected]
Women in Business
Development Inc. Karen Mapusua [email protected]
Ministry of Agriculture Afele Faiilagi [email protected]
Ministry of Finance
Aid Coordination Division Noumea Simi [email protected]
Samoa Hotel Association Nynette Sass [email protected]
Ministry of Agriculture Frank FONG [email protected]
The Coordinating Committee will oversee the overall implementation of the activities under this strategy and
will interact in cooperation with the Aid Coordination unit MOF (as shown in the diagram above) with all
implementing partners and donors.
Key Sector Performance Indicators
Below are a set of performance indicators that offer a framework for evaluation. They will be converted to more
precise measurable indicators in the future .
Number, potential and actual production capacity and employment in the enterprises in the sector
Structure, quality and number of new investments in the fruit and vegetable products sector
Demand for support services from farmers and Associations
Demand for training courses and business mentoring activities
Measurable quality characteristics across the sector‟s production
Disbursement to enterprises of credit by registered development financing institutions
Volume of new and top grade seed delivered to farmers
Productivity of fruit and vegetable farmers per hectare and estimated profitability per hectare
Increase in land under fruit and vegetable production
Reduction in value and volumes of fruit and vegetable imports
Increased domestic fresh fruit and vegetable consumption
Appearance of fruit and vegetables at point of sale
Acceptable price - competitive
Compliance with national and international standards
Perceived quality of fruit and vegetables by consumers
Export readiness

49
Progress Monitoring and Reporting Schedule
As stated, the F&VSS Coordination Committee has the responsibility to coordinate and to monitor the
strategy‟s implementation. The monitoring of the working plan progress will follow the schedule below:
Phase 1 2009-2012
Three monthly interim progress evaluations and an executive review should be made after 12 months to
ascertain if any slippage in delivery is taking place. The report will be sent to the Samoan Government
(Ministry of Agriculture), to the ACP Programme Coordination Unit and to the ITC.
At the end of the first stage – upon completion of the first two years, the strategy monitoring team will present a
detailed analytical report about the realisation of the measures foreseen in the strategy and the implementation
plan. This will include achieved results, efficiency of financial resources and investments utilised during Phase
1.
They will also provide an assessment of the changes to markets and the business environment and their likely
impact on the strategy and the outcomes. This report will be sent to the Samoan Government (Ministry of
Agriculture) and the ITC
Phase 2 2012-2014
For Phase 2, F&V Strategy Coordinating Committee will update the implementation plan for the final three
years. This will be done after the completion of the review of the key market indicators, the business
environment and the effectiveness of activities implemented in Phase 1.
After the completion of Phase 2, F&VSSCC will present to the Samoan Government and the ITC a detailed
report about implementation of the strategy, progress and successes that have been achieved. It will also include
analysed trends of fruit and vegetable domestic market as well as development of an export sector. It will
comment on shortcomings found and failures as well as offering solutions.

50
Complete Implementation Plans

51
Annexes

52
Appendix 1: Priority and cost per activity (Prioritized Implementation plan)

53
Activity Number
Activity Resources needed
Progress indicators Budget 2009\2010\2011
1.1 Develop a vision for the Fruit and Vegetable sector
Define concrete targets and milestones for the strategy (at the social,
economic and productive level) and set 2014 as a time frame for the
full implementation of the strategy
None Vision validated and agreed by
stakeholders
Definition of quantitative targets
agreed by stakeholders, Committee
and MAF
0/0/0
1.5
Create or adopt an implementation and monitoring framework to
enable Coordinating Committee to evaluate and follow up on
implementation of the strategy and make required changes in light of
the evolving sector
Office space,
communicatio
ns and
operational
budget
Secretarial/
steering
committee
allowances
Monitoring framework approved
by Cabinet
Institutionalised Coordinating
committee
Office $18,000pa,
Telephone\stationary\ computer
and ancillaries $18,000pa
Committee Allowances $30,000
$66,000\$72,600\$72,600.
1.6
In cooperation with the Aid Coordinating Unit of MoF and MAF,
develop an operative budget for the implementation of the strategy and
validate list of existing and potential donors and partners for
implementation
None
Costing and budget for
Implementation available per
activity
1.7 Table progress reports on the implementation of the Fruit and
Vegetable Sector Strategy and highlight key issues that require cross
ministerial support and involvement at the Trade, Commerce and
Industry Development Board (TCI) meetings and/or Cabinet
Development Committee on a regular basis
Printing costs
2 Progress report tabled at CDC
and TCI meetings in 2009
Incorporated in 1.5
1.2 After strategy endorsement by cabinet and launch, organise 2
stakeholder meetings in Upolu and in Savaii to encourage ownership
and communicate objectives to farmer communities
Venue,
stationeries,
transport cost
Presentations to stakeholders done
Attendance of a representative
number of farmers
$52,000 for all four
$52,000/$52,000/$52,000

54
Activity Number
Activity Resources needed
Progress indicators Budget 2009\2010\2011
1.3 Select potential opportunities for presenting strategy in existing
government forums (e.g. World Food Day, MWCD meetings,
Environment Week, Measina forum) to successfully coordinate and
promote the implementation of activities
Information
and
communicatio
n material
(printing,
designing)
Present in at least 5 forums in
2009/2010/2011
$7,500/$7,500/$7,500
1.4 Plan for periodical update of strategy implementation progress to
stakeholders using media and communication tools such as brochures,
DVD, internet, radio, tv)
Information
and
communicatio
n material
(printing,
designing)
Communication of progress every
two months via TV and radio
Publication of briefing brochures
$7,500/$7,500/$7,500
2.1 Map the Value Chain for representative fruits and vegetables
(including processed product chains) to determine key market
intelligence requirements
Check past census/surveys for unused/unreported data and revisit
existing databases
Potential information requirements:
-Market analysis and buyer requirements (identification of market
potential and returns); types of varieties and product forms, consumer
taste, (eg seasonal requirements, quality standards, post harvest
standards & quarantine requirements)
-Supply capacity, number and location of farmers (Crop type/variety
production data, area planted, yields, monthly production volumes,
commercial and households production)
-Market monitoring (real-time price, volumes information) / Market
Information
-Directory of existing support services and of existing funding or
grants mechanism and exporters"
Technical
expertise
Needs assessment completed
Strengthening activities identified
5 fruits analysed and 5
vegetables in first year and
subsequent years
$50,000/$50,000/$50,000

55
Activity Number
Activity Resources needed
Progress indicators Budget 2009\2010\2011
2.2 "Develop an action plan for the provision of market intelligence in
cooperation with Statistic department, Samoa Central Bank and
Ministry of revenue, MAF
Identify existing government agencies or sector associations that could
collect, maintain and/or disseminate components of database
information
None
Action Plan approved and
operationalised by relevant
Ministry agencies
5.1 Conduct finance needs and risk exposure assessments for
representative fruit and vegetable value chains, (including existing
grant schemes)
technical
expertise
2 Value chains mapped-
1 of a fruit and 1 of a vegetable
See 2.1 above
5.2
Together with the Aid Coordination Division and the MOF identify
and consolidate a list of financing bodies or institutions targeting
agriculture sector and SME finance at a national and regional level that
can fund the different stages of the Value Chain
None
List completed
See 5.1 and 2.1
2.3
Assess possibility of private sector provision of data and collection,
maintenance and/or dissemination and select potential partners
Study
List of private sector enterprises
that will collect and provide data
Definition on type of data and
frequency
$45,000, then $10,000pa
2.4
Adapt existing census questionnaires and create additional targeted
surveys to wholesalers and commercial farmers to create baseline
information.
Improve Frequency of agricultural census to 5 years and of pest and
disease database to 2 years
None
Policy and Planning MAF to
submit request for improved
frequency of surveys
Submission to Cabinet by Minister
and CEO of Agriculture
Resources allocated and
completion of Agricultural Census
for 2010
2.5
Conduct demand & supply studies for a range of existing and potential
products and gather information in: Local hotels, restaurants and
supermarkets, Regional and international markets
Resources and
team for data
collection
Demand and Supply studies
completed
Replication and update of studies
annually
Study done fully first year,
update with sample second year,
full study alternative year
$10,000/$5,000/$5,000

56
Activity Number
Activity Resources needed
Progress indicators Budget 2009\2010\2011
2.6
Conduct annual workshop for key stakeholders for building capacity in
data collection/dissemination and analysis
Specialists in
Data
Collection and
analysis
Key stakeholders trained and data
collection methods improved
Improved data Analysis and use
for decision making
Workshop training by SBS in 1st
and 3rd
year
$10,000/$5,000/$10,000
2.7
"Develop dissemination techniques to reach farmers using radio and
community meetings
Identify targeted and simple information for improved production
planning and linkage to market"
Dissemination
costs and
material
production
costs
Information disseminated through
radio, news papers and community
meetings on a regular basis
Adoption by farmers
Improved farming planning
Weekly news broadcast
$15,000/$10,000/$8,000
2.8
Improve dissemination of market intelligence to domestic buyers,
wholesalers and exporters through email and internet
Dissemination
costs and
material
production
costs
Market information disseminated
and used by buyers
Monthly newsletter sent via
email/internet /radio
$10,000/$8,000/$10,000
4.1
Conduct a comprehensive needs assessment of training requirements
for the fruit and vegetable sector based on market and buyer
requirements, for the entire value chain from producer to buyer and
consumer.
Identify successful training institutions and approaches and explore
opportunities for replication.
Identify which government and relevant agencies require specialised
training to deliver market driven services
Human
resources
Report completed
Target agencies involved and
mobilised
Study of needs assessment/
production of unit modules for
the various chain members
$50,000/ $30,000/ $30,000
4.2
Develop a training and capacity building action plan per segment (farmer,
extension, processor, buyer, cross cutting).
Estimate resources needed and identify support service providers for delivery
of training. Segment training activities according to short term and long term
modules and include both theory and practical hands on material.
Human
resources
Work plan agreed
Detailed Costing of initiative
Sectoral Capability Plan initiated
Chain members are provided
with unit modules and assisted
to achieve pass rates
$30,000/$40,000/$40,000

57
Activity Number
Activity Resources needed
Progress indicators Budget 2009\2010\2011
3.1
Assess the feasibility of commercially driven pack houses and post
harvest service centres defining clearly the roles of and type of
services that will be provided to Value Chain operators and the
structure in which these centres will be operated and managed (farmer
associations and / or NGO's and / or private sector)
Supply Chain
&
Agribusiness
specialists
Feasibility report completed
Recommendations and activities
for piloting service centres
$1,000 for study
3.2
"If feasibility study is positive define and agree with Ministry of
Agriculture the potential role and type of services that could be
provided to farmers, processors and buyers.
Core services provided could include: Collection, cooling, grading
sorting, packing, distribution, manages hubbing and bulking of
production outputs. Also finance and admin support services
Expanded services could include: Marketing of produce, training for
farmers on quality and management, information collection and
dissemination, Finance/credit lines and collateral provision, common
sourcing of supplies, bulk buying of inputs, seeds and packaging and
inviting technical (national/regional/international) consultants in the
field of growing, post harvest handling
Longer term functions: Increase overall volume and integrate
independent farmers, empower farmer community bargaining skills,
Maximize efficiency by working together and sourcing commonly,
Share market and buyer demand information, encourage first stage
food processing in communities for Profitable utilisation of excess
produce/value addition (spices, sun dry, stir fry, soup mixes, juices,
etc.) under food safe, clean conditions, Better control cold chain
operations and reduce quality loss risks,
Plan the best route to markets, establish cold chain shared networks,
Small farmers to source collectively and access inputs at cheaper cost"
Supply Chain
&
Agribusiness
specialists
Definition and agreement of
services provided by centre
Agreement on next steps and work
plan for setting up centres
Core Service Costs
Infrastructure costs such as
coolers, vehicles for collection
and human resource costs such
as grading, packing,
distribution, finance and
administration
$269,000/$100,000/$100,000Na
tional Export Authority mandate
can be expanded to cover
import substitution
Farmer training in growing,
quality control, management,
data receipt and dissemination,
can be outsourced. Cost through
provision of services from NEA
- $180,000 pa
Training on post harvest
handling and opportunities for
value added
$180,000 pa.
Total costs
$629,000/$460,000/$460,000

58
Activity Number
Activity Resources needed
Progress indicators Budget 2009\2010\2011
3.3
Determine the best mechanism for funding the centres to cover costs
while not charging users excessively (e.g. commissions perceived
from successful commercial operations and annual contribution by
farmer members and buyers)
Finance and
business
planning
specialists
Commercially viable finance plan
for centre
See 3.1
3.4
Determine the potential for small holder and community farmer
collaboration, ownership and use of services and possibly distribute
shares of centre to farmers based on production volumes
None Small holder farmer inclusion plan
3.5
"Based on farmer and buyer agreements, determine the most
appropriate location for one pilot centre in Upolu
Pilot the service Centre model Starting with a pilot run with a selected
group of 10-20 farmers and selected buyers to enable the development
of a viable framework or contract that can be used effectively between
suppliers and buyers who will be using the centres.
Develop and define appropriate contractual arrangements adapted to
the Samoan context"
Resources for
centre piloting
Location determined in agreement
with farmer association and buyers
Identification of farmers and
buyers that will participate in pilot
experience
Set up of Centre
First commercial operations
Housing, land, vehicle, staff,
sorting, packing, cooling
$550,000/$150,000/$150,000
3.12
Promote and apply national food safety standards and operational
procedures including CODEX and good agricultural practices across
the whole value chain
Strengthen implementation of current programs for standards /quality
assurance (international certification requirements to increase
compliance)
Put in place mechanisms to Identify different market opportunities
across the Value Chain based on quality produced
Development
of necessary
processes,
Compliance
and auditing
systems
Standards in place and enforced
Quality improved in F&V fresh
and processed
MAF to develop HACCP
training and quality assurance
services for farmers on good
agricultural practises including
but not limited to post harvest
handling. Sorting centres and
food processors given their
limited numbers to seek ISO
accreditation.
Accreditation costs:
$100,000/$50,000/$25,000

59
Activity Number
Activity Resources needed
Progress indicators Budget 2009\2010\2011
4.5
"Identify a group of farmers for pilot testing training.
Reinforce on site training at the farms & provide basic management
skills including record keeping.
Specific on-field training on pest disease management and planting
and on post harvest handling,
Training on choosing the best varieties, seeds and inputs and what
effect that can have on your yield and income.
Ensure close follow up by extension officer / service centre: before
fertiliser is applied, before harvest and when pest is detected.
Costs for
trainees,
trainer cost,
extension staff
extra costs
Stationeries
Successful farmers identified and
contributing to training
10 meetings for 10 farmers per
meeting- $10,000pa
Stationeries $2000pa
4.6
Put in place a programme designed to train officers, relevant
government agency officials and service providers on:
- How to work with and respond to demands from farmers, businesses
and exporters on compliance with market and buyer requirements /
standards.
- Training on new technologies based on market opportunities
- How to train new officers in the field in order to expand base and
reach support to farmers
Resources to
develop or
adapt training
modules
Information on
successful
training
modules
Training modules developed
Funding for delivery secured
Identification of trainers
Monthly training for extension
officers and agency officials
$20,000pa
3.13
Determine farm inputs required and tender for agricultural input
suppliers to better align based on market requirements (including
imported supplies)
Information List of input requirements
Regular revision of lists
Tendering of supply requirements
$100,000
Tendering costs- $1000
3.14
Review the role of the agricultural store and propose restructuring Reviewer
(review to be
based on how
the VC is
being affected)
Recommendations implemented
based on review
More efficient supply of inputs
$7000
4.3
In cooperation with the MAF, villages, private sector and buyers,
develop or improve approach towards a more commercially driven
hands on methodology for training farmers
Human
resources
modules
Support services have hands on
training plans in place. Training
delivery mechanism is pilot tested
Refer 4.5&4.6
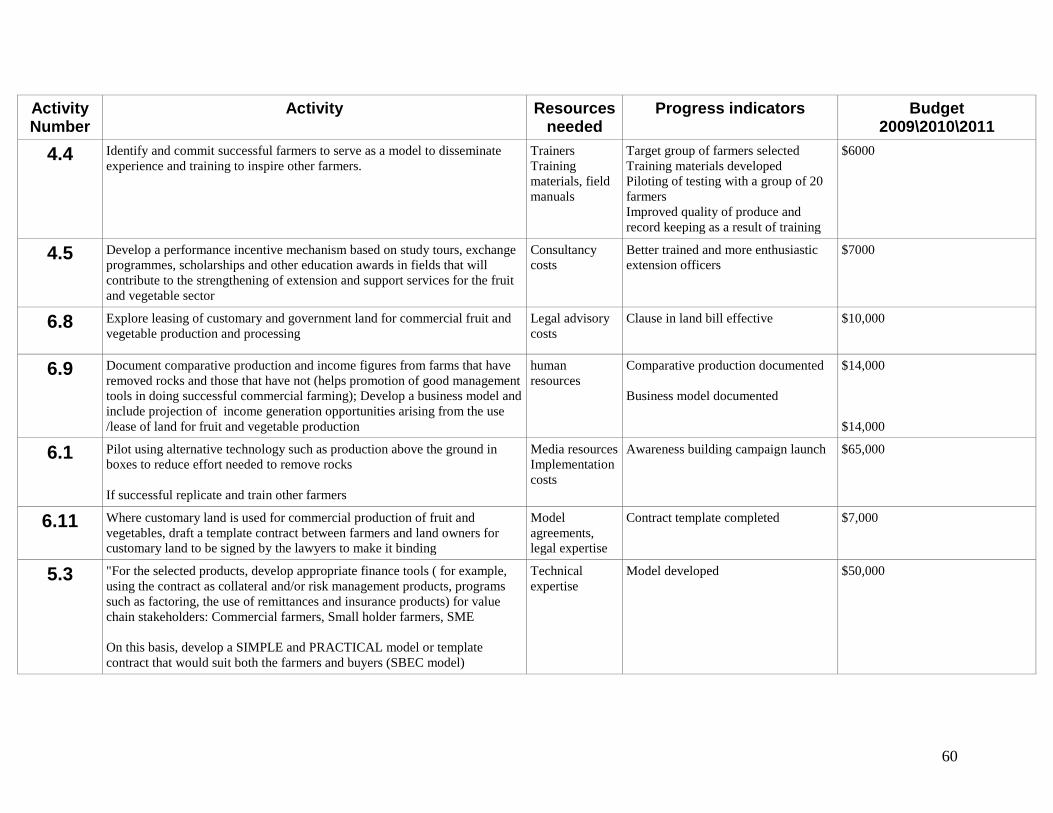
60
Activity Number
Activity Resources needed
Progress indicators Budget 2009\2010\2011
4.4
Identify and commit successful farmers to serve as a model to disseminate
experience and training to inspire other farmers.
Trainers
Training
materials, field
manuals
Target group of farmers selected
Training materials developed
Piloting of testing with a group of 20
farmers
Improved quality of produce and
record keeping as a result of training
$6000
4.5
Develop a performance incentive mechanism based on study tours, exchange
programmes, scholarships and other education awards in fields that will
contribute to the strengthening of extension and support services for the fruit
and vegetable sector
Consultancy
costs
Better trained and more enthusiastic
extension officers
$7000
6.8
Explore leasing of customary and government land for commercial fruit and
vegetable production and processing
Legal advisory
costs
Clause in land bill effective
$10,000
6.9
Document comparative production and income figures from farms that have
removed rocks and those that have not (helps promotion of good management
tools in doing successful commercial farming); Develop a business model and
include projection of income generation opportunities arising from the use
/lease of land for fruit and vegetable production
human
resources
Comparative production documented
Business model documented
$14,000
$14,000
6.1
Pilot using alternative technology such as production above the ground in
boxes to reduce effort needed to remove rocks
If successful replicate and train other farmers
Media resources
Implementation
costs
Awareness building campaign launch $65,000
6.11
Where customary land is used for commercial production of fruit and
vegetables, draft a template contract between farmers and land owners for
customary land to be signed by the lawyers to make it binding
Model
agreements,
legal expertise
Contract template completed $7,000
5.3
"For the selected products, develop appropriate finance tools ( for example,
using the contract as collateral and/or risk management products, programs
such as factoring, the use of remittances and insurance products) for value
chain stakeholders: Commercial farmers, Small holder farmers, SME
On this basis, develop a SIMPLE and PRACTICAL model or template
contract that would suit both the farmers and buyers (SBEC model)
Technical
expertise
Model developed $50,000

61
Activity Number
Activity Resources needed
Progress indicators Budget 2009\2010\2011
5.4
Explore using contract, solid business plans and micro-insurance
(purchased by individual stakeholders) as collateral in order to
guarantee better access to finance for individual farmers directly or
through service centre or farmer association
technical
expertise
Model tested
Increased number of farmers
accessing affordable finance
$10,000
5.5
Create a flexible and operative system of low rate seasonal credit and
simplify enterprise access to credit resources during peak periods for
the purchase of inputs.
None
DBS to
investigate
Constant credit offer
Easy access to finance for input
purchasing
$5,000
5.6
Encourage banks/donors to use value chain approaches to assess risk,
and evaluate exposure, based on a complete understanding of the
enterprise‟s position and linkages to other activities in the chain.
None
Bank assessors
training
Banks evaluating risk exposure
using value chain approach
Increased credit to farmers
$22,000
5.7 Ensure provision of information, through SFA, MAF, Service
providers, on how to accessing business planning, and funding
proposal writing
None
Communicatio
n resources
a measured increase in number of
business plans financed
$10,000
5.11
Provide price incentives or in kind incentives to small farmers to
increase their investment in technology/quality inputs
Budgetary
resources
Cabinet Submission completed $10, 000,000pa
5.12
"Make available direct credit lines and financial schemes to chain
stakeholders at an affordable cost by reducing interest rates and
improving repayment terms on loans from development banks.
Budgetary
resources
Cabinet Submission completed $2,000,000pa
5.13
"Encourage SME's to purchase capital equipment for primary
processing and value addition using time-bound lower rate loans and
tax incentives.
Investigate possibility of establishing mutual funds through Producer
Organisations for larger investments
Budgetary
resources
Policy paper for CDC completed See 5.12
5.14
Seek assistance for processors to explore relevant available technology
and market development needed for appropriate follow-up, evaluation
and information dissemination CDE/PSSF/PIFS/PITIC
Training
consultancies
Proposal for financial assistance
Completed
$100,000pa

62
Activity Number
Activity Resources needed
Progress indicators Budget 2009\2010\2011
5.15
Establish a technology support fund, accessible to farmers, SMEs or export
companies that have an identified a potential market and the right technology
to scale up production and improve the quality to take advantage of this
market
Grants,
operational
costs
Cabinet Submission completed $1.5million pa
3.6
Provide start up operational funding to the farmers association office (ie for
computer facilities and overheads)
EU Micro
Projects
EU micro project proposal drafted,
submitted and approved
Funding disbursed
Farmer association office operational
$17,000
3.7
Strengthen management capacity of farmers associations by providing
targeted training (i.e. "institutional strengthening programme")
FAO/ EU ACP Improved performance in management
of resources and members
Increased membership
Increased funding proposals approved
$300,000pa
3.8
Support the development of a members database including production area,
crops, soil, water, seasonalities
FAO/ EU ACP Database created and operational
Database updated regularly
$300,000pa
3.9
Strengthen farmer groups and networks (in cooperation with MAF, villages,
private sector and potential buyers) to implement sharing of equipment,
experiences and knowledge through existing networks
Training
Number of farmer groups and
networks established
Training visits of farmers to point of
sales and buyers
Sharing of equipment
See above
3.1
Improve capacity in post-harvest handling practices at the farm to enable to
distribution to markets.
Supply Chain &
Agribusiness
specialists
Feasibility report completed tied in to
the VC analysis
$5,000
3.11
Improve linkages and cooperation between farmers associations and crops
division advisory services
Develop a system of field attachments for extension officers
communication,
building
relationships,
trust
4 sessions with
motivational
speakers
Increase farmer efficiency as a result
of extension service training
$20,000

63
Activity Number
Activity Resources needed
Progress indicators Budget 2009\2010\2011
4.1
Use “field trips” as a delivery method and organise visit of growers, buyers,
processors to each others farms/companies to understand each others issues
and requirements
Human
resources
transport
Report completed
Target agencies involved and
mobilised
$15,000
4.11
Introduce HACCP standards and compliance training throughout the whole
value chain (farmers, processors, hotels, restaurants)
Reinforce training and certification for compliance for organic standards and
eurogap
Access to
Standards (ISO,
HACCP)
Technical
expertise
Introduction of HACCP and other in
training curricula
Increase in number of certified farms
and processor
$1.5million then $500,000pa as
maintenance thereafter
4.12
Provision of Supply-chain Management training:
Improved sourcing to allow processors to benefit from a steady flow of good
quality agricultural commodities
Familiarize growers with contract farming
Human
resources
About
mechanism
Improved supply chain management
resulting in decreasing costs
4.13
In cooperation with International accreditation bodies, design short term
training programmes addressed to enterprises and laboratories to reinforce
testing capacities where needed
Resources and
technical
assistance for
accreditation
Increase in number of accredited labs
and enterprises
Reduction of testing done abroad
4.14
Provide opportunities for specialised training and preparation support for
farmers, exporters, processors in marketing skills, Branding and
commercialisation as well as management (accounting record keeping,
distribution / logistics, operations)
Human
resources
For farmers-
only in context
of actual
markets
2 specialised
training per
segment
Training proposal completed and
submitted for funding
$50,000pa
3.15
Produce information on and apply suitable technologies to extend season and
thereby window of opportunity (de-greening of citrus)
Specialists in
Research &
Development in
Fruits and
Vegetables
Suitable postharvest technologies
identified
$20,000

64
Activity Number
Activity Resources needed
Progress indicators Budget 2009\2010\2011
3.16
Evaluate options for development and multiplication of fruit and vegetable
seeds/rootstock appropriate for Samoan agriculture
Create a business plan demonstrating feasibility of commercial nurseries
Specialists in
Research &
Development in
Fruits and
Vegetables
Business plan developed and showing
positive returns
$15,000
3.17
Link educational and scientific institutions to farmers , farmer groups, and
service centres in order to promote on farm research
Initiate mobile farmer field training for improved replication of seed
propagation techniques
Equipment and
Training
materials,
transport
A measured increase in the number of
on-farm research among fruits and
vegetable farmers
$20,000
4.7
"Deliver capacity building through modular training with practical on-factory
and classroom content.
Agree on number and development of modules (Quality, Management, GMP,
HACCP Food heath and hygiene standards,processing techniques, operations,
sales and marketing, Packaging)
For each module use a combination of 2 trainers: from University and
successful processors and businessmen
Resources to
develop or
adapt training
modules
Information on
successful
training
modules
Training modules developed
Funding for delivery secured
Identification of trainers
$20,000
4.8
"Provide training on
Technology and processing techniques: Help enterprises progress in
elaborating better recipes, which match consumer's needs, are compatible
with the use of existing equipment and reduce production costs. Distribute
information on technologies & best practices for processing
Improvement of processing ratio and production performance (increased
volumes and quality, reduction of losses).
Sales and marketing: To calculate precisely the cost of goods and margin
(fixed costs, variable costs and contribution margin of each SKU) to analyse
the profit potential and pricing of the product portfolio. Elaboration of a
relevant marketing strategy and business plan, establishment of a customer
satisfaction index to make sure that the final product satisfies.
Trainers
Training
materials, field
manuals
Delivery of 45 training to a selected
group of processors
$250,000

65
Activity Number
Activity Resources needed
Progress indicators Budget 2009\2010\2011
4.9
In collaboration with processors develop and disseminate proper
training manuals and training tools such as Visual aids / dvds to be
developed.
Human
resources
Development and successful
testing of materials
$20,000pa
7.1
Develop a mandate and vision for SAME in consultation with
stakeholders and clearly define core services in the strategic plan
Services to be provided by SAME:
Distribution of information: Market information, Quality assurance
processes (ISO), HACCP, Direct enterprise support and hands on
training (Production, Costing and Pricing, Occupational health and
safety, Product development, advocating and lobbying for sector
interests
Meeting costs,
human
resources
Vision established for SAME
Action plan for SAME drafted
$450,000, then maintenance at
$250,000pa
7.2 Strengthen SAME by aligning / redefining its governance structure to
its mandate and to the services to be provided (corporate plan)
meeting costs,
human
resources
SAME structure & Corporate Plan
finalised
$15,000
7.3
Segment SAME's members in terms of services to be provided and
intensity of support required.
(General members: Monthly review, market information and sector
news , Core members: Intensive follow up and support in operations,
market access and product development)
meeting costs,
human
resources
SAME members segmented
according to needs
$15,000
7.4
Develop costing and pricing of SAME services and explore tying
member contributions to results of SAME support (comission or fees
pegged to increase of sales)
Explore tying SAME services to a commercially driven model of
return where, if SAME helps increase profit, then processors pay
commission
Human
resources
Costing and pricing of services
agreed by members
$25,000
7.5
Develop a mid-term staffing programme and define Job descriptions
and roles in order to deliver SAME services
Human
resources
Job descriptions completed $25,000
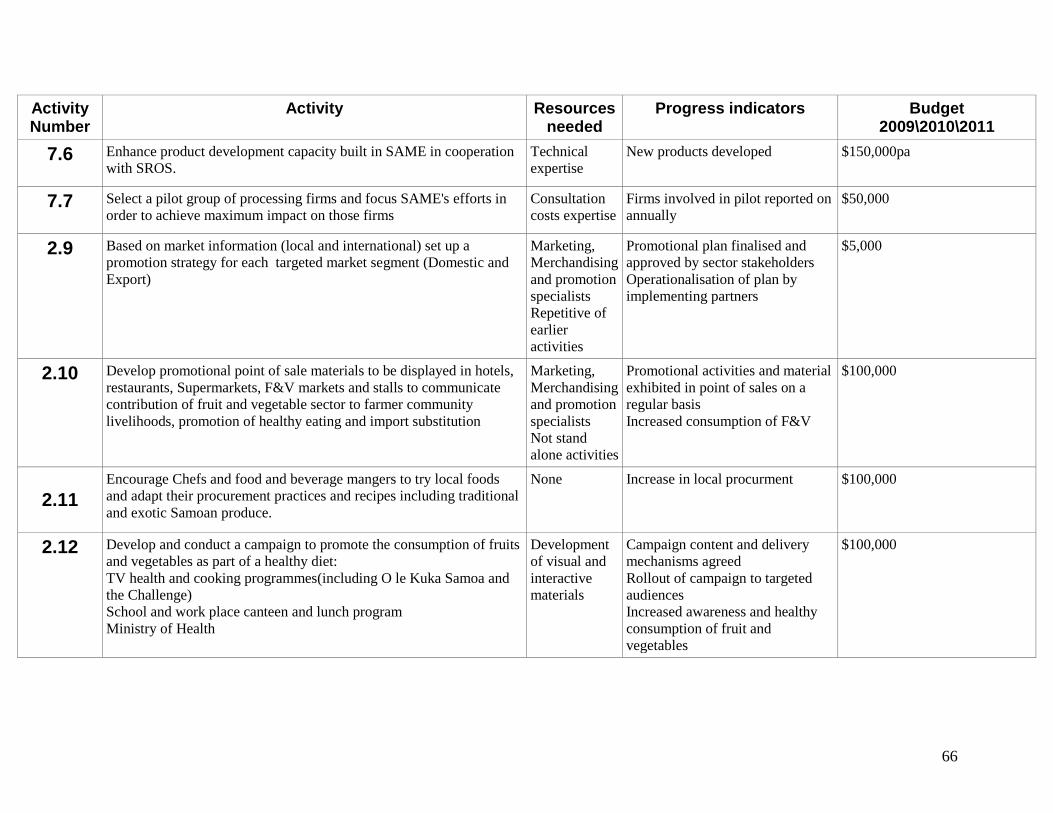
66
Activity Number
Activity Resources needed
Progress indicators Budget 2009\2010\2011
7.6
Enhance product development capacity built in SAME in cooperation
with SROS.
Technical
expertise
New products developed $150,000pa
7.7
Select a pilot group of processing firms and focus SAME's efforts in
order to achieve maximum impact on those firms
Consultation
costs expertise
Firms involved in pilot reported on
annually
$50,000
2.9
Based on market information (local and international) set up a
promotion strategy for each targeted market segment (Domestic and
Export)
Marketing,
Merchandising
and promotion
specialists
Repetitive of
earlier
activities
Promotional plan finalised and
approved by sector stakeholders
Operationalisation of plan by
implementing partners
$5,000
2.10
Develop promotional point of sale materials to be displayed in hotels,
restaurants, Supermarkets, F&V markets and stalls to communicate
contribution of fruit and vegetable sector to farmer community
livelihoods, promotion of healthy eating and import substitution
Marketing,
Merchandising
and promotion
specialists
Not stand
alone activities
Promotional activities and material
exhibited in point of sales on a
regular basis
Increased consumption of F&V
$100,000
2.11
Encourage Chefs and food and beverage mangers to try local foods
and adapt their procurement practices and recipes including traditional
and exotic Samoan produce.
None
Increase in local procurment $100,000
2.12
Develop and conduct a campaign to promote the consumption of fruits
and vegetables as part of a healthy diet:
TV health and cooking programmes(including O le Kuka Samoa and
the Challenge)
School and work place canteen and lunch program
Ministry of Health
Development
of visual and
interactive
materials
Campaign content and delivery
mechanisms agreed
Rollout of campaign to targeted
audiences
Increased awareness and healthy
consumption of fruit and
vegetables
$100,000

67
Activity Number
Activity Resources needed
Progress indicators Budget 2009\2010\2011
2.13
Promote backyard gardening for consumption of fruits and vegetables Seeds, tools,
planting
information
materials,
cooking
instructions
Measured increase in subsistence
planting and consumption of
locally grown F&V's
$70,000
2.14
Incorporate the Samoan quality standard Logo (Loto nuu) to promote
fruit and vegetable fresh and processed produce
None Use of Samoan logo by industry Refer activities on sales and
marketing activities
Year 2
1.12
Conduct a needs assessment on the requirements regarding capacity
building to formulate and implement policy measures for the sector
Specialist in
policy review
and policy
design training
Analysis & report completed
Matrix with synergies and conflicts
Suggested alternative formulations
$50,000
1.13
Conduct tailored national level training to strengthen capacity of
government officials and private sector to contribute to policy
formulation
Link capacity building to the use of PITIC national and regional tools
and services (trade commissioners, SOPAC
Training and
delivery
mechanism
Trainings delivered against needs
assessment
$50,000
1.8
F&V coordinating committee to engage Ministry CEO's (MCIL,
Health, MAF, MOF, MNREM) to achieve and sustain cross
ministerial support and involvement
Regular meetings with CEO's of
Ministries
Minutes of meetings and action
points tabled
1.9
Analyse current legislations, policies, regulations, and any strategies
that impinge upon Fruit & Vegetable Sector and determine areas of
conflict and potential synergies. (national, regional, international)
Investigate alternative formulations (if need
Specialist in
policy review
and legislation
review
Analysis & report completed
Matrix with synergies and conflicts
Suggested alternative formulations

68
Activity Number
Activity Resources needed
Progress indicators Budget 2009\2010\2011
1.10
Align F&V strategy with the overall strategy for the development of
Samoa (SDS)
Ensure link between the Fruit & Vegetable Sector Strategy with the
Agricultural development plan, the National Export Strategy and
SROS Plan, Health Sector Plan, MWCSD Sector Plan, Water Sector
Plan and MNRE Cooperate Plan.
Ensure sector priorities are represented in the Improving Policy
Development and Coordination Reform Program (Ref: PO44)
None Key F&V strategic priorities
included in the documents
(Agricultural sector plan)
Alignment of implementation
proposals for F&V with existing
plans and strategies (ie: SDS,
SROS, MNRE)
1.11
Strengthen mechanisms for dialogue with private sector and other
governments in the region for integration into bilateral and regional
policy processes related to fruit and vegetable sector
Platforms for
dialogue and
information
Private public dialogue meetings
held
F&V Strategy tabled in the Head
of Agriculture Ministerial meeting
May 2009 and in other similar
meetings
Development of project Proposal
5.16
Engage farmers and private sector stakeholders in the next review of
Development Bank of Samoa legislation in order to provide inputs
relevant to improved access to finance
None
Report costing
Sector members participate in
next SDB Review
$5000
5.17
Encourage access to finance through government policy and
strengthen support to specialized finance agencies
Cabinet
submission
Cabinet Submission completed
5.18
Together with the Aid Cooperation division and the MOF, develop a
plan to engage regional & international commercial and development
banks as potential funding partners for the implementation of the
strategy
Technical
expertise
Plan initiated $10,000
6.1
Develop an aggressive awareness campaign on the lifestyle and
potential economic benefits of engaging in Agribusiness activities
Media
resources
Awareness building campaign
launch
$100,000

69
Activity Number
Activity Resources needed
Progress indicators Budget 2009\2010\2011
6.2
Include Entrepreneurship and leadership training in high schools and
through NGO's
Training
materials and
packages,
human
resources
Inclusion of entrepreneurship in
curricula of various courses
Consultancy fees $100,000
Publishing costs $30,000
Training of trainers- $50,000
6.3
Identify one pilot village to provide fencing based on potential and
commitment
Investigate how to provide free fencing and through which institution
and what impact it will have
Establish a mechanism to repay fencing tied to profit and village
council/project leader/government
Fencing Piloting of free fencing increasing
ownership and quality of produce
Part of the package that includes
the rock removal or boxing and
soil build up technology
6.4
Contribute and provide inputs to the development and implementation
of the National water management strategy in relation to F&V sector
needs (areas covered, water harvesting, water collection, water storage,
water use, irrigation)
None Fruit and vegetable sector priorities
represented in Water management
strategy
Part of the model farms
showcasing these packaged
technology e.g.irrigation
6.5
Document and monitor the volume of water use in fruit and vegetable
production (irrigation, cleaning after harvest, cleaning of
processing/packing area etc)
Technical
know how
Annual Volumes calculated and
reported
Deliberate survey to track a
selected sample over a specified
duration (12 months, 24
months)
6.6
Pilot test water harvesting in pools to avoid water shortage during dry
season
Infrastructure Success of a pilot water harvest
irrigated farm
$50,000

70
Activity Number
Activity Resources needed
Progress indicators Budget 2009\2010\2011
6.7
Dialogue with Samoa Water Authority to find ways for improving
processing firm access to potable water for small processors
For haccp compliant processors,ensure filtration systems are in place
Action plan
for improved
access to
potable water
Funding needs
identified
Project
proposal
submitted
List of technologies completed $50,000
Year 3
5.8
Based on the risk profile, design risk management tools and
procedures to manage the different risk layers (national, meso and
micro level) and facilitate credit uptake, respectively
Risk
management
expert
Credit update improved $50,000
5.9
Conduct a study on the feasibility of creating a multi-sector disaster
aid facility
Risk
management
expert
Study report completed Part of 5.8
5.10
Evaluate the establishment of a disaster risk management fund at a
regional level to provide local and international insurance companies
an incentive to insure the agricultural sector and to provide clear
definition of the kind of risks that are being covered
Technical
expertise
Evaluation available $30,000

71
Appendix 2: List of stakeholders for workshop 1 and 2
Stakeholder list for Strategy Development Workshop 1 (October 2008)
Name position/institution Savaii/Upolu Email
Misiolo Sofe self-employed Upolu Farmer
Aukusitino Rasch DBS- ACEO Research Upolu ACEO
Demetrius Taofiga DeAl Restaurant Upolu [email protected] Manager
Henry Levasa
Ministry of Women and
Social and Community
Development Upolu [email protected] Staff
Dorothy Tofilau
Ministry of Women and
Social and Community
Development Upolu Staff
Toleafoa Winterstein self-employed Upolu [email protected] Farmer
Leuluai Lydia Hazelman self-employed Upolu Farmer
Tone Neru self-employed Upolu Farmer
Richard Keil Manager Samoa Nonu Upolu [email protected] Manager
Michael Von Reiche Solaua Farms Upolu [email protected] staff
Venissa Freesir Samoa Nonu Upolu [email protected] staff
Lasa Aiono Lulu o le aoa Farm Upolu [email protected] Manager
Taupau Lino self-employed Upolu
Nanai Tiavolo self-employed Upolu
Tolo Iosefa USP Upolu [email protected] staff
Sili Apelu Taofua Beach Resort Upolu [email protected] Owner
Vika Kailau USP Upolu [email protected] student
Luaiufi Aiono USP Upolu [email protected] student
Mani Mua USP Upolu [email protected] student
Nonumalo Akerei Salesa NUS lecturer Upolu lecturer
Enid Westerlund AA Researcher Upolu [email protected] researcher

72
Lanisi faimoa NUS Lecturer Upolu lecturer
Mulitalo Siafausa PSC Upolu Commissioner
Karin Mapusua WIBDI Upolu [email protected]
Roslyn Peters Ah Him MAF Upolu [email protected] ACEO-CSD
Tafilipepe Too Tanielu Farmer Upolu
Aleni Te'o Self employed Upolu Farmer
Fiapa'ipa'I Too Vaimauga College Upolu [email protected] Teacher
Rev Mafutaga Tamatoa farmers Assoc Upolu Pastor
Agnes Ripley farmers Assoc Upolu Farmer
Maalaula Vailele Upolu
Ulutautogia Faatoafe Mosooi Asosi Upolu Farmer
Feiloaiga Malaga MOH Upolu Staff
Leicester Dean Bee Keepers Assoc Upolu Farmer
Mara Hunter Leala I Moana Hotel Upolu [email protected] Hotel Owner
Christine Qested MOH Upolu [email protected] Nutritionist
Moana Luamanuvae UNDP Upolu [email protected]
Nynette Sass SHA Upolu [email protected]
Sala Geogina Bonin UNDP Upolu [email protected]
Matatamalii Sonya
Hunter STA Upolu [email protected] CEO
Seumalo Afele Faulagi MAF Upolu [email protected] ACEO
Winnie Misa Walter farmers Assoc Upolu
Aukuso Samy Nansen farmers Assoc Upolu
Jeff Atoa farmers Assoc Upolu [email protected]
Leiataua Katifa Bryce
Faalapotopotoga Atinae
Komiti Tina Upolu [email protected]
David Hunter USP Upolu [email protected]
Reupena Leau SUNGO Upolu
Talei Fidow Moors MAF - Quarantine Upolu [email protected]
Seumanuula Moana SUNGO Upolu [email protected]

73
Clarke
Ricky Westerlund Farmer Upolu
Sonny Lameta USP Upolu
Jagdish Bhati USP Upolu [email protected]
Pueata Tanielu MAF Upolu [email protected]
Emele Ainuu MAF Upolu
Raymond Voigt Bee Keepers Assoc Upolu [email protected]
Sala Vaimili Aufaipopo Upolu
Faafetai Ah Kuoi farmers Assoc Upolu [email protected]
Fiona Lene MFAT Upolu [email protected]
Viliamu Galuvao Upolu [email protected]
Panoa Tavita Moala farm Supplies Upolu
Tuulima Laiti Farmer Upolu
Tanya Grey Aggie Greys hotel Upolu [email protected]
Evelyn Kwan Aggie Greys hotel Upolu [email protected]
Afiafi Siaosi Farmer - Salelavalu Savaii
Leua Lapa Savaii
Nise Lapa Farmer - Salelavalu Savaii
Lapa Fili Farmer - Salelavalu Savaii
Limatolu Valevale Farmer - Salelavalu Savaii
Vaelua Tui Leutu Savaii
Rapi Ioane Farmer - Salelavalu Savaii
Kalami Tupeni Farmer Savaii
Tuileutu A Voti Pulenuu - Faga Savaii
Su'a Afiafi Farmer - Salelavalu Savaii
Tevaga Tupuivao Avana
Poufa Farmer
Savaii
Nuu Tanesi Farmers Association Sale Savaii

74
Stakeholder list for Strategy Development Workshop 2 (February 2009)
NAME and Surname
Institution
TELEPHONE
Emele M. Ainuu
MAF
(685) 23416
Pueata Tanielu
MAF
(6850 23341
Sailo Pao
MAF
(685) 20605
Tommy Tuamalii
MAF
(685) 20605
Lasa Aiono
Samoa Farmers‟
Association
(685) 30112
Christine Quested
Ministry of Health
(685) 68137
T.F Wendt
Farmers‟ Association
(685) 22839
Reupena Le‟au
SUNGO
(685) 47457
Alatina Ioelu
SBEC
(685) 22770
Paul Christiansz
SBEC
(685) 22770
Tupai Kalani
Farmer
Afamasaga Dan Betham
Farmer
(685) 7770147
Parate Matalavea
MAF
(685) 23416
Orlando Huaman
FESI
(685) 7700481
NAME and Surname
Institution
TELEPHONE
Asuao K. Pouono
MAF
(685) 22561
MOF

75
Nick Roberts (Aid division) (685) 7205248 [email protected]
Richard Markham
ACIAR
Samalaulu Falevaai
MAF
(685) 7737463
Paul Tomane
FAO
(685) 22127
Tuulima Laiti
Farmer
(685) 7785303
Manasa Katonivuwikai
SPC
Pauli Tuia
SPC
Brian Kaio
MFAT
(685) 21171
Gaufa Salesa Fetu
SROS
(685) 20664
Luaiufi Aiono
MAF
(685) 7715826
Agnes Ripley
Vailima
(685) 24943
Unasa Iulia Petelo
MCIL
(685) 20441
Aiolupotea Jeff Atoa
Farmer
(685) 28808
Kuini Levy
Famer
(685) 7507012
Amiaifolau Afamasaga
STA
(685) 7790230
Nuuausala Siaosi
(685) 7507514
Sonja Hunter
STA
(685) 7776000
Sonny Lameta
USP
Naheed Haque
UN/UNDP
Resident
(685) 20609
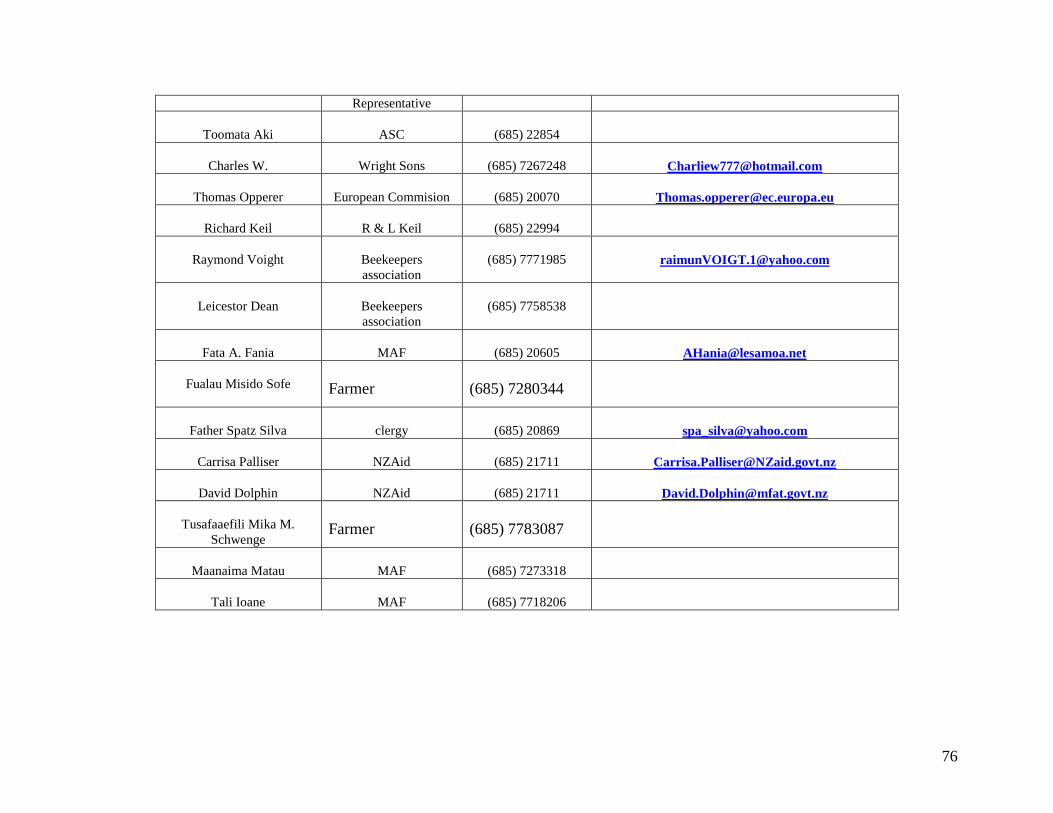
76
Representative
Toomata Aki
ASC
(685) 22854
Charles W.
Wright Sons
(685) 7267248
Thomas Opperer
European Commision
(685) 20070
Richard Keil
R & L Keil
(685) 22994
Raymond Voight
Beekeepers
association
(685) 7771985
Leicestor Dean
Beekeepers
association
(685) 7758538
Fata A. Fania
MAF
(685) 20605
Fualau Misido Sofe
Farmer
(685) 7280344
Father Spatz Silva
clergy
(685) 20869
Carrisa Palliser
NZAid
(685) 21711
David Dolphin
NZAid
(685) 21711
Tusafaaefili Mika M.
Schwenge
Farmer
(685) 7783087
Maanaima Matau
MAF
(685) 7273318
Tali Ioane
MAF
(685) 7718206

77
Appendix 3: Past and current development activities
Activity/modality Funding
Agency
Implementi
ng
Partner(s)
Purpose Timeline Budget USD
Integrated Pest Management
in Sustainable Production
System for Brassica Sub-
regional Project
Aus/ACIAR
MAF
SPC
Develop integrated pest
management package for
diamondback moth
2005- 2010 527,625
Demonstration Farm China MAF Establish demonstration and
training farm for vegetable
production/integrated livestock
and biogas
Pipeline 200,000
Regional Programme For
Food Security (RPFS)
FAO, Italy FAO,
National
Ministries
of
Agriculture
in 14 PICs
Enhancing production, income
generation and food security as
well as building capacity on trade
facilitation and agriculture policy
development
2004-2008 7,060,000
Formulation of the Food
Security and Sustainable
Livelihoods Programme in
the PICS
FAO FAO Assist countries in the preparation
for the expansion phase of the
Regional Programme for Food
Security
2007-2008 244,000
Initiative on Soaring Food
Prices
FAO To enhance food security and
nutritional status of small farmers
and vulnerable households through
the provision of seeds of improved
varieties and necessary agro-inputs
2008-2009 250,000
Horticultural Post-Harvest
Research
FAO RDIS To conduct post harvest research
on horticultural produce with the
aim to enhance the quality of fresh
produce along the food chain
2008 73,000
Organic Farming and
Processing
FAO WIBDI To build capacities to produce and
process organically certified and
fair trade labelled agricultural
produce for local and export niche
markets
2009-2010 230,000
Micro-projects EU MoF Support to community projects
including agriculture
1998-2009 13,860,000
Development of Sustainable
Agriculture in the Pacific
(DSAP) Project
EU SPC,
National
Ministries
of
Agriculture
in 16 PICs
To promote and implement
sustainable agriculture that will
improve food production thereby
enhancing food security and
income generation in the Pacific.
2003-2008 12,628,000
Organic Certification in the
Pacific Project
IFAD IFOAM/WI
BDI
Primarily aims to build the
capacity in certification of organic
agriculture.
2008 200,000
Organic Standards project IFAD SPC To help develop regional standards,
improve regional coordination and
develop a strategy for promotion of
organic agriculture
2007-2009 200,000

78
Activity/modality Funding
Agency
Implementi
ng
Partner(s)
Purpose Timeline Budget
PACER/Regional Trade
Facilitation Programme
(RTFP)
AusAID,
NZAID
PIFS, SPC,
Oceania
Customs
Organisatio
n (OCO)
To facilitate trade within the region
through improved and streamlined
processes in quarantine, customs
and standards and conformance
matters. It also includes capacity
building and support to reform
legislative and regulatory
frameworks.
2004-2009 Aus$
770,000
Pacific Regional Agricultural
Market Access (PRAMA)
AusAID
NZAID
SPC To enable PICs to better meet the
import quarantine requirements of
key trading partners, like Australia
and New Zealand.
Pipeline
Legislation review TA Commonwea
lth Sec.
MFAT/Atto
rney
General‟s
Office
Legislation drafting for
compatibility with WTO
National Export Strategy Commonwea
lth Sec.
MFAT To improve export performance
through enforcement of food safety
standards, development a Samoan
brand, organic certification, fair
trade products
2008-2012 80,000
Processing of Regional Trade
Statistics of Agricultural
Commodities
F AO SPC To assist the Secretariat of the
Pacific Community (SPC) in
obtaining relevant statistical
information from PICs in support of
informed agricultural policies
2006-2009 253,000
Pacific Regional Economic
Integration Programme
(PACREIP)
EU PIFS, SPC,
SPTO
To strengthen capacity to implement
PICTA, conduct EPA Negotiations
with EU, support participation in the
WTO, engage in regional economic
integration.
2004-2009 17,248,000
Diagnostic (DTIS)
Capacity building /
Window 1 TA
IFTF LDCs UNDP/MF
AT
To boost Samoa‟s trade capacity,
better react to market opportunities,
and work towards full integration
into the multilateral trading system.
2008-2009
285,714
38,000
Facilitating Agriculture
Commodity Trade (FACT)
Project
EU SPC To address existing bottlenecks in
the supply chain of representative
Pacific island commodities and
transform selected commercial
ventures into export oriented,
market-driven enterprises that
consistently supply overseas
markets with competitive products
2008-2013 6,160,000
Programme support to
WIBDI
Oxfam WIBDI To develop organic farming and fair
trade certification to niche value
products for export
Annual 167,000

79
Activity/modality Funding
Agency
Impleme
nting
Partner
Purpose Timeli
ne
Budget
Pacific Financial Technical
Advisory Centre (PFTAC)
Multi-
donor
To provide technical advice and capacity building to 15
Pacific Island countries in four key areas: tax and customs
policy; public financial management; financial sector
supervision and regulation; and economic and financial
statistics.
ongoin
g
Private Enterprise
Partnership for the Pacific
(PEP-Pacific)
IFC,
Australia,
Japan,
New
Zealand
IFC To reduce poverty through employment-generating
sustainable private sector development focusing on access
to finance, tourism and business climate development.
ongoin
g
Enterprise Challenge Fund
(ECF)
Australia Priv
ate
Sect
or
To encourage businesses to develop viable commercial
projects which result in increased incomes, improved
livelihoods and access to services for the local community
2007-
2013
94,000,0
00
Activity/modality Funding
Agency
Implemen
ting
Partner(s)
Purpose Timelin
e
Budget
USD
Improved Nutrition
Capacity Building
WHO WHO/Mo
H
Nutrition guidelines, poster printing, school canteen
audits, evidence-based interventions for anaemia
2008 20,000
TA (Health SWAp)
Pooled Funding
WB MoF,
MoH
Review Nutrition Policy 24,000
Water resources SWAp
(programme support)
EU MoF,
MoH,
MNRE,
SWA
Water sector support programme 2005-
2010
29,500,0
00
Water resources SWAp
(budget support)
EU MoF,
MoH,
MNRE,
SWA
Water sector support programme phase 2 Pipeline
2009-
2013
35,340,0
00
Integrated Water Resource
Management
EU Water
Facility
SOPAC To safeguard the sustainable access to water and
sanitation, and support countries to engage with
civil society, and jointly develop/implement water
strategies with attention to health, agriculture,
tourism, environment.
2008-
2011
4,312,00
0


81
Appendix 4: Progress toward the Millennium Development Goals and Targets
Millennium Development Goal (MDG) table classifying impact per activity
Strategy
objectives
Eradicate extreme poverty
and hunger
Promote gender equality
and empower women
Combat HIV/AIDS,
malaria and other diseases
Ensure environmental
sustainability
Global partnership for
Development
Objective 1 1.10 Align policy / regulations to
strengthen the implementation of
the fruit and vegetables sector
including promotion of healthy
eating and import substitution or
supply side capacity building.
Ensure sector priorities are
represented in the Improving
Policy Development and
Coordination Reform Program
(Ref: PO44
1.10Align F&V strategy with
the overall strategy for the
development of Samoa (SDS).
Ensure link between the Fruit &
Vegetable Sector Strategy with
the Agricultural development
plan, the National Export
Strategy and SROS Plan, Health
Sector Plan, MWCSD Sector
Plan, Water Sector Plan and
MNRE Cooperate Plan. Ensure
sector priorities are represented
in the Improving Policy
Development and Coordination
Reform Program (Ref: PO44)
1.11 Strengthen mechanisms for
dialogue with private sector and
other governments in the region
for integration into bilateral and
regional policy processes related
to fruit and vegetable sector
Objective 2 2.12 Develop promotional point
of sale materials to be displayed
in hotels, restaurants,
Supermarkets, F&V markets and
stalls to communicate
contribution of fruit and
vegetable sector to farmer
community livelihoods,
promotion of healthy eating and
import substitution
2.15Promote backyard
gardening for consumption of
fruits and vegetables
2.14Develop and conduct a
campaign to promote the
consumption of fruits and
vegetables as part of a healthy
diet:
TV health and cooking
programmes(including O le
Kuka Samoa and the Challenge)
School and work place canteen
and lunch program
Ministry of Health Exercise
programs

82

83
Strategy
objectives
Eradicate extreme poverty
and hunger
Promote gender equality
and empower women
Combat HIV/AIDS,
malaria and other diseases
Ensure environmental
sustainability
Global partnership for
Development
Objective 4 4.3 In cooperation with the
MOAF, villages, private sector
and potential buyers, develop or
improve approach towards a
more commercially driven
methodology for training
farmers
Objective 5 5.13 Conduct a study on the
feasibility of creating a multi-
sector disaster aid facility.
Evaluate the establishment of a
disaster risk management fund at
a regional level to provide local
and international insurance
companies an incentive to insure
the agricultural sector and to
provide clear definition of the
kind of risks that are being
covered
5.13 Conduct a study on the
feasibility of creating a multi-
sector disaster aid facility.
Evaluate the establishment of a
disaster risk management fund at
a regional level to provide local
and international insurance
companies an incentive to insure
the agricultural sector and to
provide clear definition of the
kind of risks that are being
covered
Objective 6 6.1 Develop an aggressive
promotional strategy that will
raise awareness on the lifestyle
benefits of engaging in
Agricultural activities
(e.g engaging key national
figures as spoke people for the
Fruit and Vegetable sector to
target changing mindsets,
current WIBDI ads on healthy
living, calendar of farmers)
6.1 Develop an aggressive
promotional strategy that will
raise awareness on the lifestyle
benefits of engaging in
Agricultural activities
(e.g engaging key national
figures as spoke people for the
Fruit and Vegetable sector to
target changing mindsets,
current WIBDI ads on healthy
living, calendar of farmers)

84
Appendix 5: Land tenure systems in Samoa
93.5%
0.4%
2.4%3.0%0.4%
0.3%
Percentage of Land Area by Land Tenure in Samoa
Customary Land
Leased Customary Land
Leased Government Land
Owned Freehold Land
Leased Freehold Land
Other Land Tenure

85
Appendix 6: F&V Value chain maps and issues

86
Market & Policy Analysis Trade Promotion 1AInternational
Buyers1B
REGIONAL
Inter-Island Buyers1C Domestic Buyers
Foreign Direct Investment
promotion
Market Intelligence
information centres
Quarantine services Foreign Customs 2A Import Agents 2BRegional
Wholesalers
Refrigerated transport
Freight Fowarder Local Customs 3A Export Delivery
Refrigerated transport Cold Storage Facilities
Refrigerated transport Business service providers 4 Distribution
Maintenance Packaging design 5 Packaging
Quality control & testing
laboratoriesFinance 6A Processing
Trade & Market InformationValue addition processing
services
Farm, Trade & Business Support Services Value Chain Stage
Post harvest facilities
Cold storage facilities 7ACooling & Washing
& GradingCool Storage 7B
Refrigerated transport Cold storage facilities 8Collection
Middle Man
Price and seasonality / harvest
time informationMicro-Meso Finance
Farmer extension services Pest & Disease control unit Commercial
Farmers
9A
Subsistence
Farmers9B
Market, demand & Price
information
Cooperative association
training
Maintenance & Spare parts NGO services
10aImported
Fertilizers10b Water 10c Labour
Imported
MachineryWeather
Local seeds /
Plants
Imported Seeds LandLocal Tools &
Machinery
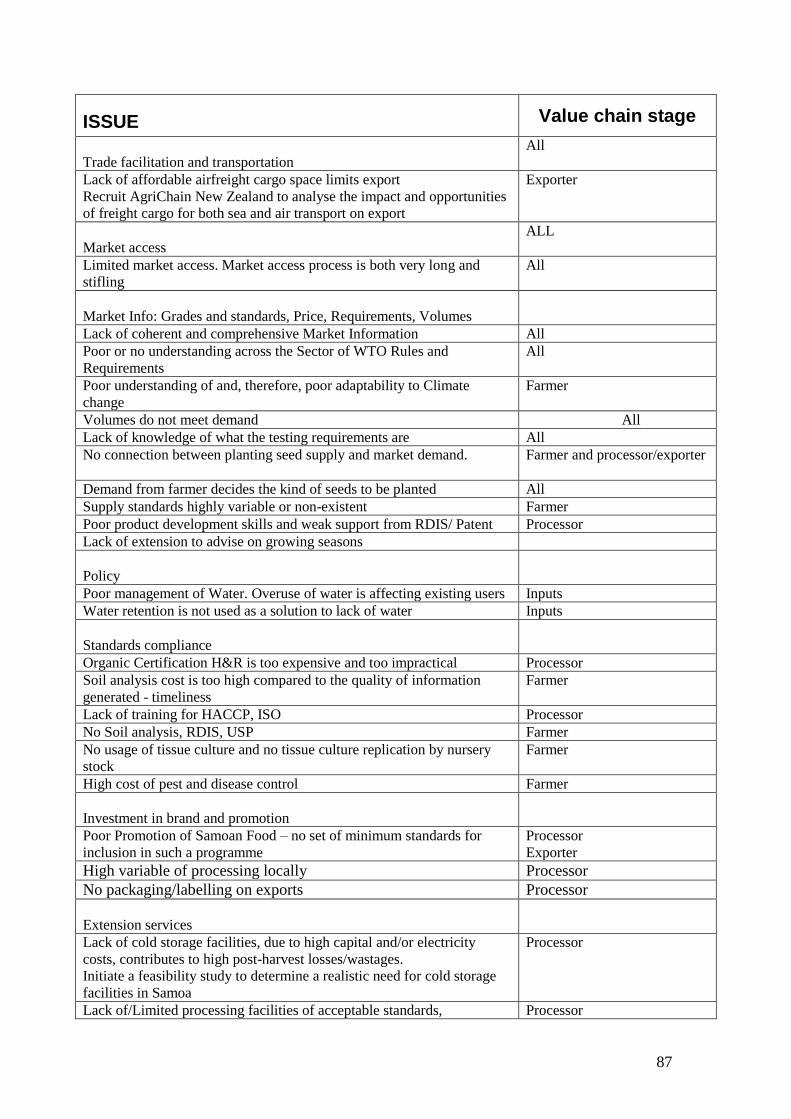
87
ISSUE Value chain stage
Trade facilitation and transportation
All
Lack of affordable airfreight cargo space limits export
Recruit AgriChain New Zealand to analyse the impact and opportunities
of freight cargo for both sea and air transport on export
Exporter
Market access
ALL
Limited market access. Market access process is both very long and
stifling
All
Market Info: Grades and standards, Price, Requirements, Volumes
Lack of coherent and comprehensive Market Information All
Poor or no understanding across the Sector of WTO Rules and
Requirements
All
Poor understanding of and, therefore, poor adaptability to Climate
change
Farmer
Volumes do not meet demand All
Lack of knowledge of what the testing requirements are All
No connection between planting seed supply and market demand. Farmer and processor/exporter
Demand from farmer decides the kind of seeds to be planted All
Supply standards highly variable or non-existent Farmer
Poor product development skills and weak support from RDIS/ Patent Processor
Lack of extension to advise on growing seasons
Policy
Poor management of Water. Overuse of water is affecting existing users Inputs
Water retention is not used as a solution to lack of water Inputs
Standards compliance
Organic Certification H&R is too expensive and too impractical Processor
Soil analysis cost is too high compared to the quality of information
generated - timeliness
Farmer
Lack of training for HACCP, ISO Processor
No Soil analysis, RDIS, USP Farmer
No usage of tissue culture and no tissue culture replication by nursery
stock
Farmer
High cost of pest and disease control Farmer
Investment in brand and promotion
Poor Promotion of Samoan Food – no set of minimum standards for
inclusion in such a programme
Processor
Exporter
High variable of processing locally Processor
No packaging/labelling on exports Processor
Extension services
Lack of cold storage facilities, due to high capital and/or electricity
costs, contributes to high post-harvest losses/wastages.
Initiate a feasibility study to determine a realistic need for cold storage
facilities in Samoa
Processor
Lack of/Limited processing facilities of acceptable standards, Processor

88
particularly for small farmers and processors
Processing equipment cannot be afforded by most processors regardless
of the size of the operation
Processor
No Access to water for irrigation. Frequent flooding and droughts Farmer
Non-availability of machinery adapted to farmers‟ needs Farmer
Seeds, planting and linkage to market
Variety of seeds viability and absence of on farm advice relating to
choice of crop and its optimum development
Inputs
Seed quality and variety Inputs
Need for wider and appropriate availability of seed variety to strengthen
network between processors/ hotels / farmers
Low availability of seeds and lack of uniformity
See above but lack of traditional extension services
Inputs and Packaging
Unavailability of affordable packaging materials is a major constraint Processor
Need for collective procurement of raw material and packaging materials Processor
Rocking Terrain soils limit mechanisation Farmer
High cost of machinery to develop land and improve farming
methodology
Farmer
Inconsistent supply of raw materials impairs the ability for processors to
produce consistently.
Initiate a pilot study between a selected number of suppliers (e.g. for talo
palagi) and a processor (National Foods) over time to provide concrete
positive indication/benefits of consistent supplies
Processor
Organisation, training and common drive
Lack of a firm decision/practices among farmers to overcome
inconsistency in supply
Farmer
Lack of entrepreneurship All
Unavailability of continuous training awareness Farmer
Very poor cooperation between farmers Farmer
Larceny Farmer
High pre-harvest losses due to pigs (free range) Farmer
Lack of resources and materials for fencing Farmer
Trust & Relationship not recognised as key to the success of operation All
Need for closer collaboration between farmers, suppliers & processors All
No organization collection hubbing Farmer
Poor ability of farmer to adapt Farmer
Lack of commercial drive and commercial training in the basics of
business
Farmer/ Processor
Processor sector does not pay enough attention to import substitution
opportunities
Select one key processed product with high import substitution potential
and initiate an experiment with existing infrastructure (e.g. nonu
producers) to gauge feasibility of such an enterprise
Processor
Little training on the field to farmers Farmer
Average farmers‟ age over 30. Need to change traditional mindset to a
more commercially driven one. Lack of status in farming
Farmer
Not enough farmers committed to farming. (Young people)
Lack of Farmer and Working capital Finance

89
Access to credit too hard and/or cumbersome Farmer
Lending rates too high Farmer
Fund availability and communication access a major constraint Farmers /Processor
Power cuts /water cuts/portables affect shelf life of machinery and
processing activities
Processor
Unavailability of loans for corporate farming Farmer
Funding for fencing hard to access and, often, not a priority Farmer
Consignment stock affects cash flow All
Enforcement of credit being repaid based on trust
Lack of credit records leads to constraints in third party investment and
activities/production
Risk of chasing farmer for payment too high for banks
High cost of credit schemes & finance
Price setting at spot on day of sale, lack of contract
No contracts between banks and farmers
No collateral for customary land
Lack of mechanisation & finance to buy land
Spread of Risk too high or does not even exist
No access to risk
Lack of shared capital and investment risk
Pest and disease control cost
No record keeping by small holders and commercial farmers Farmer
Health
Not enough awareness or programs strongly linking F&V production
and supplies to Health dietary
All

90
Appendix 7: Average annual quantity and CIF value of vegetable imports (Jan 2002 – Jun 2008)
Product (tariff definition) Quantity
(kg)
CIF value
(S$)
Onions and shallots, fresh or chilled 534561.6 1004140
Potatoes, frozen 131972.4 514877.1
Cabbage lettuce,(head lettuce) fresh or chilled 93128.01 382836.6
Carrots and turnips, fresh or chilled 102327.2 287143.4
Garlic, fresh or chilled 158918 224320.6
Mixtures of vegetables, frozen 77715.08 215887.5
Tomatoes, fresh or chilled 27037.6 100410.2
Cauliflowers and headed broccoli, fresh or chilled 35422.3 73441.23
Celery other than celeriac,fresh or chilled 37505.42 65408.92
Fruits of genus capiscum or pimenta, fresh or chilled 19080.96 62553.69
Lettuce, fresh or chilled, (excl. cabbage lettuce) 7592.58 43715.54
Mushrooms, fresh or chilled 13676.02 41049.23
Sweet corn, frozen 8423.966 17722
Other vegetables, fresh or chilled,not elsewhere specified. 4154.683 12430.15
Vegetables, frozen, other 4726.726 12372
Beetroot...radishes and other similar edible roots, fresh or chilled 5632.277 12197.23
White,red,Savoy, Chinese cabbages, collards,kohlrabi, kale...etc, fresh or chilled 2940.778 12169.85
Brussels sprouts, fresh or chilled 3743.697 7917.846
Beans, fresh or chilled 3266.358 7105.846
Other vegetables;mixtures of vegetables,whole,cut,sliced..but not further prepared 2121.758 7082.462
Other vegetables;mixture of vegetables provisionally preserved,unsuitable for
immediate
2335.809 6398.308
Onions provisionally preserved, unsuitable in that state for immediate consumption 3163.206 6104.462
Shelled or unshelled peas, frozen 4923.812 5443.231
Peas, fresh or chilled 1690.217 5337.846
Shelled or unshelled beans, frozen 4260.283 3751.385
Chicory, fresh or chilled, (excl. witloof) 1913.603 3460.923
Asparagus, fresh or chilled 626.1785 3006.615
Spinach,New Zealand spinach and orache spinach, frozen 707.1385 2391.077
Dried mushrooms and truffles,whole,cut,sliced,broken or in powder,not further
prepared
1596.197 2388.154
Cucumbers and gherkins, fresh or chilled 813.6062 2355.846
Leeks and other alliaceous vegetables,fresh or chilled 664.2631 2182.615
Olives provisionally preserved, unsuitable in that state for immediate consumptionle 732.7031 1612
Spinach, NZ spinach and orache spinach,fresh or chilled 503.7446 969.0769
Leguminous vegetables, fresh or chilled,other 77.48308 602.6154
Dried onions,whole,cut,sliced,broken or in powder,but not further prepared 194.1169 502.6154
Truffles, fresh or chilled 36.07692 417.5385
Cucumbers and gherkins provisionally preserved, unsuitable for immediate
consumption
91.54308 409.8462

91
Appendix 8: Average annual quantity and CIF value (Jan 2002 – Jun 2008) of fruit imports
Product (tariff definition) Quantity
(kg)
CIF
Value
(S$)
Apples, fresh 124660.3 513005.7
Oranges,fresh 85537.82 399238.9
Coconuts,not fresh,not desiccated 96579.42 203099.1
Dried prunes 26468.01 114582.6
Other nuts, fresh or dried, nes 9968.914 83679.23
Pears and quinces, fresh 33705.31 83577.85
Other dried fruit, nes 10291.7 60132
Fresh grapes 29000.01 59443.54
Mixtures of nuts or dried fruits,not containing added salt 4788.214 43276.77
Mixtures of nuts or dried fruits,containing added salt 3806.146 23526.62
Kiwifruit, fresh 12203.52 17561.38
Mandarins, clementines, wilkings...etc, fresh or dried 4831.586 17525.23
Peaches, including nectarines, fresh 4620.551 10343.54
Dried grapes 7946.094 9157.846
Strawberries, fresh 1551.758 8619.538
Melons, fresh, (excl.watermelons) 11640.41 8521.538
Plums and sloes, fresh 2038.495 8311.538
Watermelons, fresh 2309.154 6084.308
Coconuts, desiccated 6094.657 5734
Peel of citrus fruit or melons, fresh,frozen, dried...etc. 2206.343 4054.308
Other fruit, fresh, nes 815.3938 3812
Guavas, mangoes and mangosteens, fresh or dried 1181.323 2922.308
Walnuts without shells, fresh or dried 637.6277 2377.538
Lemons and limes, fresh or dried 451.2215 2148.154
Other fruits and nuts,frozen,containing added sugar and other sweetening matter 375.2308 1881.692
Cherries, provisionally preserved, not for immediate consumption 185.2308 1860.308
Cashew nuts, without shell, fresh or dried 263.7323 1755.385
Grapefruit, fresh or dried 680.0569 1734.462
Black, white or red currants and gooseberries, fresh 305.9585 1689.692
Fruit and nuts, provisionally preserved, not for immediate consumption 1630.978 1664.462
Raspberries, blackberries, mulberries and loganberries, fresh 255.1154 1645.077
Apricots, fresh 301.7031 1572.769
Oranges,dried 1197.329 1408.615
Cherries, fresh 247.2262 1192.923
Other fruits and nuts,frozen,not containing added sugar or other sweetening matter 27.29231 1161.385
Strawberries,frozen,not containing added sugar or other sweetening matter 95.73077 984.6154
Dates, fresh or dried 272.1923 861.2308
Almonds without shells, fresh or dried 933.9246 799.5385
Strawberries, provisionally preserved, not for immediate consumption 62.76923 789.3846
Avocados, fresh or dried 132.9985 786.6154
Cashew nuts, in shell,fresh or dried 171.0277 719.6923
Walnuts in shell, fresh or dried 312.1354 701.3846
Dried apricots 203.2185 507.6923
Almonds in shell, fresh or dried 104.7969 468.4615
Pineapples, fresh or dried 139.0492 406
Raspberries,blackberries,etc,containing added sugar or other sweetening matter 62 250

92
Appendix 9: Glossary
TERM DESCRIPTION
EC European Commission
EU European Union
ITC International Trade Centre
MAF Ministry of Agriculture and Fisheries
MoF Ministry of Finance
NGO Non Governmental Organisation
SCCA Samoa Crops Cooperative Association
SFA Samoa Farmer Association
UNCTAD United Nations Conference on Trade and Development
UNDP United Nations Development Programme
USAID Unites States Agency for International Development
USD United States Dollar
USP University of the South Pacific
![Fruit, flowers and vegetables - Fresh · Fruit, flowers and vegetables. ... Fruit - fresh Vegetables - fresh Flowers, ... • Fruit juices $7m South Africa $7m [$1m]](https://img.dokumen.tips/doc/110x75/5b8990697f8b9a655f8c756f/fruit-flowers-and-vegetables-fruit-flowers-and-vegetables-fruit-fresh.jpg)