Embed Size (px)
Citation preview

From Single Species to the Community Level:
Exploring Under‐Researched Avenues in
Protist Ecology and Protist‐Prokaryote
Interactions
Dissertation
zur
Erlangung des akademischen Grades
doctor rerum naturalium (Dr. rer. nat.)
der Mathematisch‐Naturwissenschaftlichen Fakultät
der Universität Rostock
vorgelegt von
Ruth Anderson, geb. am 20.08.1984 in Newcastle upon Tyne
(Großbritannien)
aus Rostock
Rostock, 30.03.2012

Gutachter
Prof. Dr. Klaus Jürgens
Sektion Biologische Meereskunde
Leibniz‐Institut für Ostseeforschung, Warnemünde
PD Dr. Rhena Schumann
MNF/Institut für Biowissenschaften (IfBI)
Universität Rostock
Datum der Einreichung: 30.03.2012
Datum der öffentlichen Verteidigung: 06.07.2012

...by the help of Microscopes, there is nothing so small, as to escape our inquiry; hence there is a new visable World discovered to the understanding
Robert Hooke (Micrographia, 1665)
Ciliate from the oxic / anoxic interface of the Baltic Sea. Scale‐bar: 20μm

Table of contents I
Table of contents
Abstract / Kurzfassung
Introduction
Taxonomically, what are protists?
Ecological role of protists
Significance of protist grazing in aquatic microbial food webs
Protist grazing vs. viral lysis
Interactions between protists grazers and their prokaryotic prey
Implications of grazer selectivity at a community level
Open questions in protist ecology
The starvation‐survival state in bacteria
Suboxic to anoxic water masses
Life in suboxic to anoxic water masses
Redoxcline prokaryotic communities and biogeochemical cycling
Eukaryotic organisms in redoxcline systems
Redoxcline food webs
The Baltic Sea as a model redoxcline system
Thesis outline
Chapter 1. Species‐specific patterns in the vulnerability of
carbon‐starved bacteria to protist grazing
Abstract
1.1. Introduction
1.2. Materials and methods
Bacterial strains and pre‐cultures
C. roenbergensis pre‐cultures
Growth experiments
V
1
1
2
3
5
6
9
10
11
12
13
15
18
20
23
25
27
27
30
31
31

II Table of contents
Enumeration of organisms and biovolume measurements
Data analysis and statistics
1.3. Results
Bacterial population characteristics
Flagellate growth on starved and non‐starved bacteria
1.4. Discussion
Methodological aspects
Protist growth on starved vs. non‐starved bacteria
1.5. Conclusions
Chapter 2. Protist abundance, diversity and importance as
predators in hypoxic waters of the central Baltic Sea
Abstract
2.1. Introduction
2.2. Materials and methods
Study sites, sampling and measurement of chemical parameters
Determination of prokaryotic and virus abundance
Determination of protist abundance and biomass
Protist taxonomic identification
Determination of protistan grazing on prokaryotes
Examination of food vacuole content
Estimation of the frequency of virally infected prokaryotic cells
2.3. Results
Physico‐chemical characteristics and prokaryote abundance
Protist abundance and community composition
Protist taxonomic identification
Impact of protist grazing on redoxcline prokaryotic communities
Viral abundance and impact on the prokaryotic communities
2.4. Discussion
Protist community composition analysis: methods
Protist community composition: diversity and distribution
Role of protists and viruses in Baltic Sea redoxcline food webs
2.5. Conclusions
32
33
34
35
41
42
43
45
47
47
50
51
51
52
53
55
55
56
57
63
65
67
69
70
71
74

Table of contents III
Chapter 3. Protist grazing on a chemoautotrophic bacterial
key‐player
Abstract
3.1. Introduction
3.2. Materials and methods
Study sites, sampling and measurement of chemical parameters
Predator‐exclusion assays
Predator exclusion assays with bacterial addition
Prokaryote and protist quantification
Estimation of Sulfurimonas subgroup GD17 growth and losses
Incubations for RNA stable isotope probing
Nucleic acid extraction, centrifugation and 18S rRNA quantification
16S and 18S rRNA fingerprinting analysis
Sequence analysis
Phylogenetic analysis
Statistical analysis
3.3. Results
Grazing impact on Sulfurimonas subgroup GD17
Identification of "Sulfurimonas gotlandica" strain GD1 grazers
3.4. Discussion
Protist grazing impact on the Sulfurimonas subgroup GD17
RNA‐Stable isotope probing: methodological considerations
Identification of “Sulfurimonas gotlandica" strain GD1 grazers
3.5. Conclusions
Conclusions and outlook
Bibliography
List of figures
List of tables
List of abbreviations
Supplementary material
Publications and conferences
Acknowledgments
Declaration of authorship / Selbständigkeitserklärung
75
77
77
80
81
82
82
83
83
84
85
85
86
86
86
90
94
96
97
98
99
107
140
142
143
145
148
151
153
Abstract / Kurzfassung V
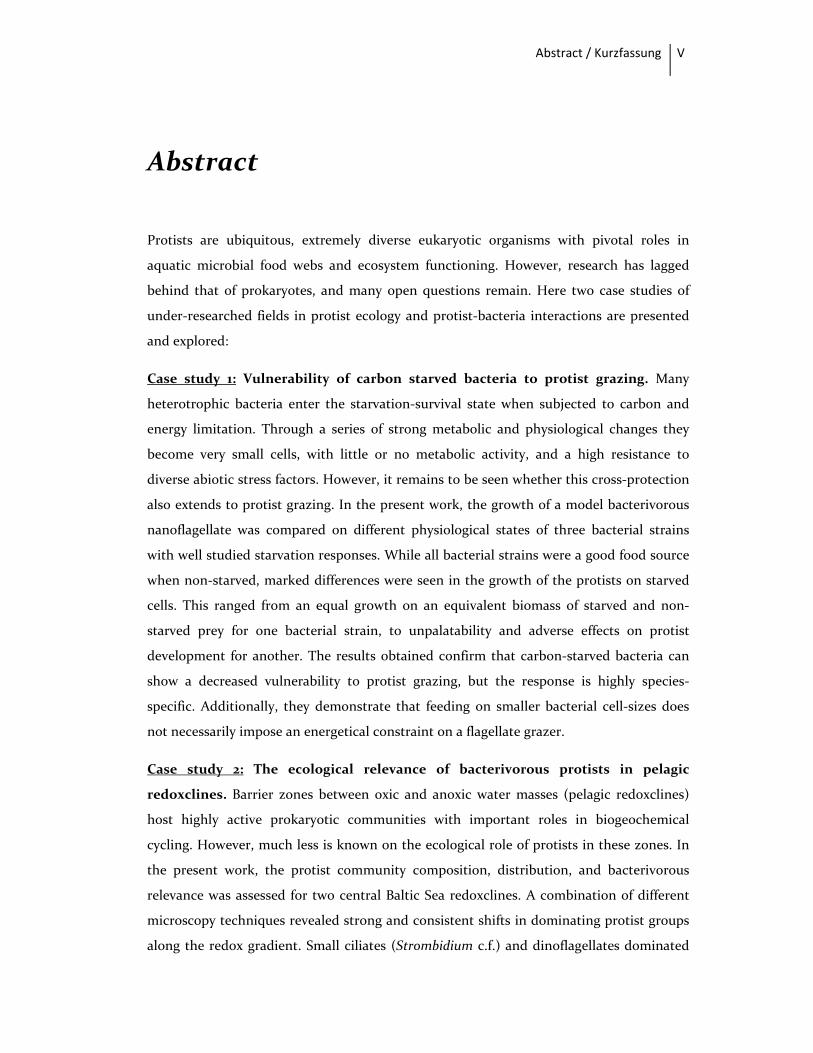
Abstract Protists are ubiquitous, extremely diverse eukaryotic organisms with pivotal roles in
aquatic microbial food webs and ecosystem functioning. However, research has lagged
behind that of prokaryotes, and many open questions remain. Here two case studies of
under‐researched fields in protist ecology and protist‐bacteria interactions are presented
and explored:
Case study 1: Vulnerability of carbon starved bacteria to protist grazing. Many
heterotrophic bacteria enter the starvation‐survival state when subjected to carbon and
energy limitation. Through a series of strong metabolic and physiological changes they
become very small cells, with little or no metabolic activity, and a high resistance to
diverse abiotic stress factors. However, it remains to be seen whether this cross‐protection
also extends to protist grazing. In the present work, the growth of a model bacterivorous
nanoflagellate was compared on different physiological states of three bacterial strains
with well studied starvation responses. While all bacterial strains were a good food source
when non‐starved, marked differences were seen in the growth of the protists on starved
cells. This ranged from an equal growth on an equivalent biomass of starved and non‐
starved prey for one bacterial strain, to unpalatability and adverse effects on protist
development for another. The results obtained confirm that carbon‐starved bacteria can
show a decreased vulnerability to protist grazing, but the response is highly species‐
specific. Additionally, they demonstrate that feeding on smaller bacterial cell‐sizes does
not necessarily impose an energetical constraint on a flagellate grazer.
Case study 2: The ecological relevance of bacterivorous protists in pelagic
redoxclines. Barrier zones between oxic and anoxic water masses (pelagic redoxclines)
host highly active prokaryotic communities with important roles in biogeochemical
cycling. However, much less is known on the ecological role of protists in these zones. In
the present work, the protist community composition, distribution, and bacterivorous
relevance was assessed for two central Baltic Sea redoxclines. A combination of different
microscopy techniques revealed strong and consistent shifts in dominating protist groups
along the redox gradient. Small ciliates (Strombidium c.f.) and dinoflagellates dominated

VI Abstract / Kurzfassung
the protist community at suboxic depths (≤30 μM O2), while larger ciliates (Mesodinium
spp., Metacystis spp., Coleps c.f. and unidentified morphotypes) formed a peak in
abundance at the oxic‐anoxic interface. In sulphidic waters, protist abundance was very
low, represented by only few morphotypes (e.g. Metacystis spp.). Grazing rates on
prokaryotes were estimated (long‐term incubations with fluorescently labelled bacteria
(FLB)), and compared to the frequency of virally infected cells (dilution approach).
Prokaryotic mortality was dominated by protist grazing in suboxic and oxygen / hydrogen
sulphide interface depths (50 – 80 % of prokaryotic standing stock per day). Ciliates and
occasionally dinoflagellates, but not heterotrophic nanoflagellates (HNF), were the major
bacterivores. In upper sulphidic depths, grazing was below the detection limit and the
frequency of virally infected cells was below 5 %, leaving the major prokaryotic mortality
factor an open question. Predator exclusion experiments were used to study specific
grazing on a chemolithoautotrophic bacterial key‐player of Baltic Sea pelagic redoxclines,
the Sulfurimonas subgroup GD17 (Epsilonproteobacteria). Protist grazing on this bacterial
group was very high (>100 % of new cell production d‐1), thus being able to control its
growth and potentially its vertical distribution along the water column. Finally, the
principal protist grazers on the Sulfurimonas subgroup GD17 were identified by RNA stable
isotope probing, employing as prey a 13C‐labelled cultured representative ("Sulfurimonas
gotlandica" strain GD1). This analysis identified 3 flagellate and 2 ciliate taxa as grazers,
thus demonstrating that HNF could still play an important role as selective grazers on
highly active and biogeochemically significant prokaryotic groups.

Abstract / Kurzfassung VII
Kurzfassung
Protisten sind ubiquitär verbreitete, extrem diverse eukaroytische Organismen, die
in aquatischen mikrobiellen Nahrungsnetzen grundlegende Funktionen übernehmen. Im
Gegensatz zu den Prokaryoten ist diese Gruppe noch viel weniger erforscht. In dieser
Arbeit werden zwei verschiedene Fallstudien im Bereich der Protistenökologie sowie der
Protisten‐Bakterien‐Interaktionen vorgestellt:
Fallstudie 1: Anfälligkeit von hungeradaptierten Bakterien gegenüber
Protistenfraß. Viele heterotrophe Bakterien können als Reaktion auf Kohlenstoff‐ und
Energielimitierung in ein Stadium der Dormanz übergehen. Durch Änderungen des
Metabolismus und der Physiologie kommt es zu einer starken Größenreduktion der
Zellen, sie weisen wenig‐ bis gar keine Stoffwechselaktivität mehr auf und werden
zunehmend resistent gegenüber abiotischen Stressfaktoren. Bisher ist nicht bekannt, ob
sich diese Schutzmechanismen auch auf die Anfälligkeit gegenüber Fraß durch Protisten
auswirken. In der vorliegenden Arbeit wurden einem bakterivoren Nanoflagellat in
Fraßexperimenten drei verschiedene Bakterienstämme, aus wachsenden oder
hungeradaptierten Kulturen vorgesetzt. Während alle Bakterienstämme im wachsenden
Zustand eine gute Nahrungsquelle darstellten, zeigten sich deutliche Unterschiede im
Protistenwachstum auf hungeradaptierten Bakterien. Die Beobachtungen reichten von
gleichem Protistenwachstum unabhängig von dem physiologischen Zustand der Bakterien
bis hin zu Fraßresistenz hungeradaptierter Bakterien mit negativen Effekten auf die
Protistenentwicklung. Diese Ergebnisse zeigen, dass hungeradaptierte Bakterien eine
geringere Anfälligkeit gegenüber Protistenfraß aufweisen können, jedoch gibt es deutliche
Unterschiede zwischen verschiedenen Arten. Zusätzlich wurde gezeigt, dass der Fraß
kleinerer Zellen nicht notwendigerweise eine energetische Einschränkung für bakterivore
Flagellaten bedeutet.
Fallstudie 2 Die ökologische Bedeutung bakterivorer Protisten in pelagischen
Redoxklinen. Die Übergangszonen zwischen oxischen und anoxischen Wassermassen
(pelagische Redoxklinen) beherbergen hochaktive prokaryotische Gemeinschaften, die
wichtige Funktionen in biogeochemischen Stoffkreisläufen erfüllen. Über die ökologische
VIII Abstract / Kurzfassung
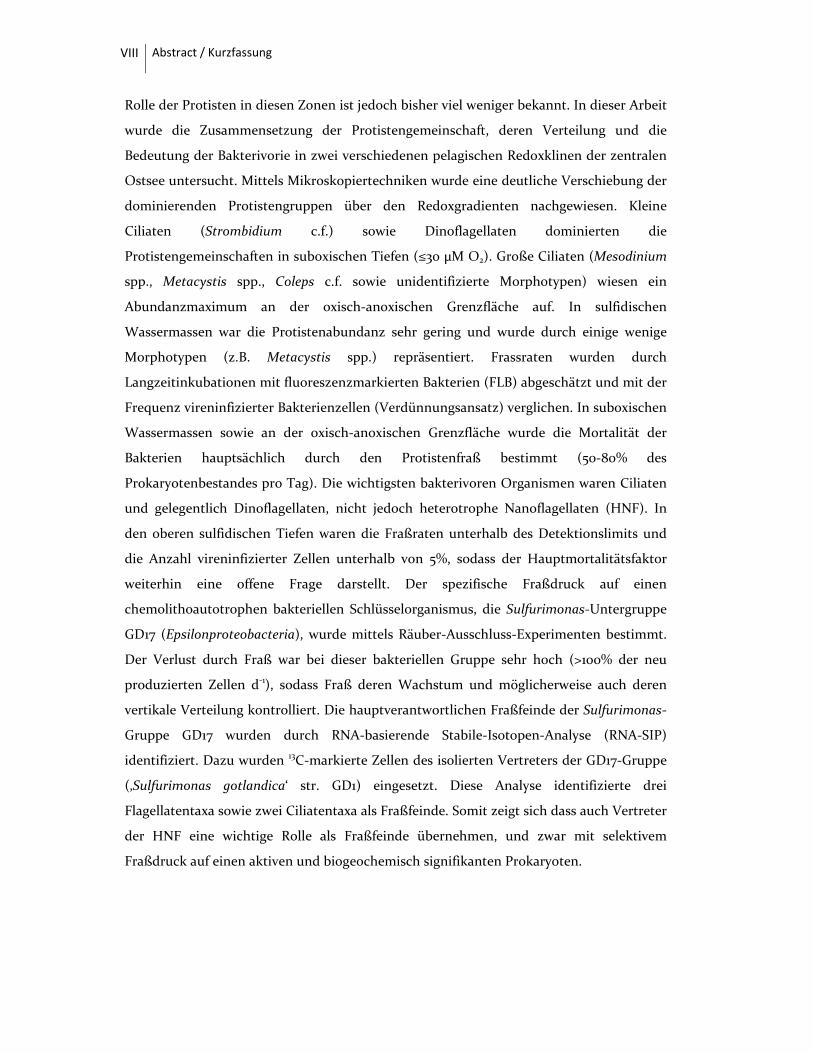
Rolle der Protisten in diesen Zonen ist jedoch bisher viel weniger bekannt. In dieser Arbeit
wurde die Zusammensetzung der Protistengemeinschaft, deren Verteilung und die
Bedeutung der Bakterivorie in zwei verschiedenen pelagischen Redoxklinen der zentralen
Ostsee untersucht. Mittels Mikroskopiertechniken wurde eine deutliche Verschiebung der
dominierenden Protistengruppen über den Redoxgradienten nachgewiesen. Kleine
Ciliaten (Strombidium c.f.) sowie Dinoflagellaten dominierten die
Protistengemeinschaften in suboxischen Tiefen (≤30 μM O2). Große Ciliaten (Mesodinium
spp., Metacystis spp., Coleps c.f. sowie unidentifizierte Morphotypen) wiesen ein
Abundanzmaximum an der oxisch‐anoxischen Grenzfläche auf. In sulfidischen
Wassermassen war die Protistenabundanz sehr gering und wurde durch einige wenige
Morphotypen (z.B. Metacystis spp.) repräsentiert. Frassraten wurden durch
Langzeitinkubationen mit fluoreszenzmarkierten Bakterien (FLB) abgeschätzt und mit der
Frequenz vireninfizierter Bakterienzellen (Verdünnungsansatz) verglichen. In suboxischen
Wassermassen sowie an der oxisch‐anoxischen Grenzfläche wurde die Mortalität der
Bakterien hauptsächlich durch den Protistenfraß bestimmt (50‐80% des
Prokaryotenbestandes pro Tag). Die wichtigsten bakterivoren Organismen waren Ciliaten
und gelegentlich Dinoflagellaten, nicht jedoch heterotrophe Nanoflagellaten (HNF). In
den oberen sulfidischen Tiefen waren die Fraßraten unterhalb des Detektionslimits und
die Anzahl vireninfizierter Zellen unterhalb von 5%, sodass der Hauptmortalitätsfaktor
weiterhin eine offene Frage darstellt. Der spezifische Fraßdruck auf einen
chemolithoautotrophen bakteriellen Schlüsselorganismus, die Sulfurimonas‐Untergruppe
GD17 (Epsilonproteobacteria), wurde mittels Räuber‐Ausschluss‐Experimenten bestimmt.
Der Verlust durch Fraß war bei dieser bakteriellen Gruppe sehr hoch (>100% der neu
produzierten Zellen d‐1), sodass Fraß deren Wachstum und möglicherweise auch deren
vertikale Verteilung kontrolliert. Die hauptverantwortlichen Fraßfeinde der Sulfurimonas‐
Gruppe GD17 wurden durch RNA‐basierende Stabile‐Isotopen‐Analyse (RNA‐SIP)
identifiziert. Dazu wurden 13C‐markierte Zellen des isolierten Vertreters der GD17‐Gruppe
(‚Sulfurimonas gotlandica‘ str. GD1) eingesetzt. Diese Analyse identifizierte drei
Flagellatentaxa sowie zwei Ciliatentaxa als Fraßfeinde. Somit zeigt sich dass auch Vertreter
der HNF eine wichtige Rolle als Fraßfeinde übernehmen, und zwar mit selektivem
Fraßdruck auf einen aktiven und biogeochemisch signifikanten Prokaryoten.
Introduction 1
Introduction
Taxonomically, what are protists?
The term protist refers to eukaryotic organisms, defined by the presence of membrane
bound nucleus and vesicles, capable of existence as single cells (Caron et al. 2012). This
rather simple definition encompasses 1.5 to 2 billion years of evolution (Knoll et al. 2006;
Roger & Hug 2006; Javaux 2007) and thousands of different organisms with widely
diverging habitats and lifestyles, ranging from 1µm unicellular algae (picoflagellates) in
ocean surface waters (Courties et al. 1994) to 40mm testate amoeba living on the abyssal
plain (Gooday et al. 2000). This enormous diversity has fascinated scientists since protists
were first discovered in the 17th century, but has not been conductive to an easy
systematics. Original classification systems separated heterotrophic animal‐like protists
(protozoa) from plant‐like photosynthetic protists (microscopic algae), following the
traditional two‐kingdom system of Linnaeus 1766. This was maintained until the gradual
recognition, starting in the late 19th century (Haeckel 1894), of the basal position held by
protists at the origin of eukaryotic multicellularity (reviewed in Taylor 2003).
Subsequently, numerous classification systems were developed, based both on
morphological, and more recently, small subunit ribosomal DNA (18S rDNA) information
(e.g., see reviews by Cavalier‐Smith 2002; Corliss 2002), which included several attempts to
unify all protists in one kingdom (e.g., kingdom Protista (Whittaker 1969)). However, to
date, no absolute consensus has been reached, with even such basic questions as what
defines a protist species still under discussion (Caron et al. 2009). At present, protistan
taxa are mingled with multicellular forms within 6 supergroups in the domain Eukarya
(Adl et al. 2005; Baldauf 2008; Caron et al. 2012). This recognises two fundamental facts: a)
that the old kingdoms of animals, plants and fungi (Whittaker 1969) are minor branches
among the eukaryotes, with close affiliations to unicellular forms; and b) that protists
constitute the bulk of eukaryotic diversity (Caron et al. 2012).

2 Introduction
Ecological role of protists
Protists require water for motility, feeding and growth, being therefore strictly aquatic
organisms. However, they are not restricted to `traditional´ aquatic systems, such as lakes
or oceans, but can also be found at much smaller‐scale environments, including the water
collected in the pores of soils and certain plant structures (e.g., in tank bromeliads
(Foissner & Wolf 2009)), forming thin layers on the surfaces of plants and litter; or in the
tissues of `higher´ organisms (Fenchel 1987). These widely differing environments have
lead to a variety of different lifestyles and morphological adaptations. Extreme examples
are some obligate parasitic protists, like the fungi‐related microsporidia, which have
strongly reduced their genomes and metabolism as an adaptation to life in their host
(Keeling & Fast 2002). In the following text, I will centre on protists inhabiting large‐scale
water masses (i.e., lakes and oceans), and to a smaller extent, the underlying sediments,
due to their larger global relevance in energy and matter cycling.
Protists can be phototrophic or heterotrophic, with both life‐forms co‐occurring in
most major lineages of unicellular eukaryotes (Sherr & Sherr 2002; Jürgens & Massana
2008). The two nutritional modes are additionally not mutually exclusive, with many
protists permanently or temporarily employing both in a phenomenon known as
mixotrophy (Sanders 1991; Raven 1997; Esteban et al. 2010). Whether phototrophic,
heterotrophic or both, protists have been found to be key‐components of virtually all
aquatic systems studied to date. Photosynthetic protists are major contributors to the
standing stock of biomass and primary production in euphotic water masses (Corliss 2002;
Sherr et al. 2007; Caron et al. 2009). In marine and oceanic surface waters, where roughly
half of global primary production occurs (Field et al. 1998), sporadic blooms of
phytoplankton in micro‐ and nano size‐ranges (respectively, 20 to 200 µm and 2 to 20 µm
in size), formed i.e. by diatoms, dinoflagellates or coccolithophorids, can dominate
primary production and be seen from space (Sarthou et al. 2005; Sherr et al. 2007). Even in
non‐bloom conditions, picoeukaryotes (<2 µm) can constitute a significant fraction of total
oceanic phytoplankton biomass and primary production (Worden & Not 2008). As an
example, a study conducted at a coastal Pacific Ocean site showed that an assemblage of
picoeukaryotes, including the prasinophyte Ostreococcus, was responsible for on average
76 % of picophytoplanktonic primary production, exceeding the contribution of the
cyanobacteria Prochlorococcus and Synechococcus (Worden et al. 2004).
Introduction 3
Heterotrophic protists are equally important, acting as consumers of prokaryotic and
eukaryotic biomass. The general phenomenon of protist capture and consumption of prey
is referred to as protist grazing, and has traditionally been divided into grazing on non‐
phototrophic bacteria and archaea (bacterivory), on cyanobacteria and `unicellular´ algae
(hervibory), on smaller heterotrophic protists (often referred to as predation, though this
term is also used for general protist grazing), and on a range of different prey (omnivory).
Feeding on colloidal and viral particles has also been observed (González & Suttle 1993;
Bettarel et al. 2005), but present knowledge does not indicate that it constitutes a
significant carbon source for protists (Miki 2008). The combined effect of bacterivory and
hervibory is one of the most important regulating factors for the prokaryotic and
phytoplanktonic standing stocks in nearly all aquatic systems studied to date (Sherr &
Sherr 2002; Pernthaler 2005; Jürgens & Massana 2008). A 1 : 1 relationship between
bacterivory and prokaryotic productivity has been observed for many freshwater and
marine systems (Sanders et al. 1992); while hervibory can consume up to 100 % of primary
production (reviewed in Sherr & Sherr 2002). However, the importance of heterotrophic
protists does not lay solely in their function as a mortality factor, but in their key role as
members of complex food webs in aquatic systems.
Significance of protist grazing in aquatic microbial food webs
In 1974 Pomeroy wrote a seminal paper in which he hypothesised that the `classical´ food
web (algae – zooplankton – fish) might only account for a small fraction of energy and
matter flow in aquatic systems. Instead, heterotrophic bacteria and protists would be the
major consumers and account for a large fraction of respiration. This idea was later
formalized by Azam et al. 1983 in the `microbial loop´ concept. The premise was that
heterotrophic bacteria would primarily be grazed upon by heterotrophic nanoflagellates
(HNF), which in turn would be consumed by microzooplankton. As a side effect of protist
grazing dissolved organic carbon (DOM) and nutrients would be released, and this would
in turn fuel heterotrophic bacterial growth. The result would be a more or less closed
system which would be embedded in the `classical´ food web through mesozooplankton
grazing upon microzooplankton. The concept was later widened, under the term microbial
food web, to include microbial primary producers and herviborous protists (Sherr & Sherr
1994) (Fig. I).

4 Introduction
Figure I. Simplified version of the microbial food web showing the principal flows of carbon and
energy: protist mediated multi‐step microbial food web, `classical´ algae‐metazoa food web, and
viral shunt. Processes of uncertain ecological relevance, e.g., protist feeding on viruses, are not
included. Only the `bottom‐up´ flow of carbon and energy is shown, excluding arrows indicating
DOM and nutrient‐pool renewal. Phytoplankton take up dissolved inorganic nutrients from the
DOM and nutrient pool, while prokaryotes take up both. Nominal cell‐size scale bar indicates the
typical size‐range classification: pico‐ (<2 μm), nano‐ (2 ‐ 20 μm) and micro‐ (20 ‐ 200 μm). HNF:
heterotrophic nanoflagellates.
An experimental body of evidence, collected primarily during the 80s and 90s,
confirmed these hypotheses (see reviews in Sherr & Sherr 2002; Pernthaler 2005; Jürgens &
Massana 2008). HNF in the 2 – 5 μm size‐range were shown to be a primary mortality
factor for bacteria in marine and freshwater systems (Fenchel 1982b; Sanders et al. 1992;
Vaqué et al. 1994), and serve as food for larger protists (Solic & Krstulovic 1994; Jürgens et
al. 1996; Zöllner et al. 2009), which were in turn demonstrably predated on by metazoans
(Stoecker & Capuzzo 1990; Jeong 1999; Zöllner et al. 2009). However, numerous shortcuts
were also found. HNF were shown to be able to use the DOM pool directly (Sherr 1988;
Tranvik et al. 1993), thus by‐passing prokaryotes and phototrophic eukaryotes. Ciliates and
dinoflagellates were found to also occasionally be significant bacterivores (Sherr et al. 1987;

Introduction 5
Šimek et al. 2000; Seong et al. 2006; Karayanni et al. 2008). Finally, the classical `algae –
mesozooplankton´ food web still takes place (Carpenter et al. 2001; Stibor et al. 2004); and
metazoans were proven to sporadically become important bacterivores, e.g., Daphnia spp.
in freshwater systems (Jürgens et al. 1997; Callieri et al. 2006).
On the other hand, it was shown that grazers not only affect prokaryotic and
phytoplanktonic communities negatively, but can also stimulate their proliferation
through the release of nutrients (Goldman et al. 1985; Caron et al. 1990; Eccleston‐Parry &
Leadbeater 1995; Selph et al. 2003). The very graphically named `sloppy‐feeding process´,
by which metabolic waste products and undigested prey parts are released to the
environment (Lampert 1978), increases the pools of particulate and dissolved organic
matter (respectively POM and DOM) (Strom et al. 1997; Ferrier‐Pagès et al. 1998; Nagata
2000) and of dissolved inorganic nutrients (Dolan 1997). In the latter case, the production
of nitrogen and phosphorous could be particularly important, given that they are limiting
elements in many aquatic environments (Sterner 2008; Deutsch & Weber 2012).
Prokaryotes have a higher nitrogen and phosphorus concentration per unit of biomass
than eukaryotes, owing to the higher ratio of proteins and nucleic acids to total cell‐mass
(Simon & Azam 1989; Vadstein et al. 1993, 2003; Pernthaler 2005). Protist grazers release
these excess nutrients that are not required for growth, thus making them available again
for prokaryotic and phytoplanktonic growth.
Overall, protists are integral parts of the microbial community, fostering and
consuming prokaryotic and phytoplankton growth. However, they are not the only major
prokaryotic regulating factor, viruses can play an equally pivotal role (Wommack &
Colwell 2000; Suttle 2007; Breitbart 2012), as will be addressed in the following section
Protists grazing vs. viral lysis
Viruses are the most abundant biological entities in aquatic systems, can equal protists in
terms of biomass and are thought to be predominantly composed of bacteriophages
(Breitbart 2012). Their contribution to prokaryotic mortality has been studied for a wide
range of systems, though unfortunately rarely at the same time as protist grazing, making
direct comparisons difficult (Fuhrman & Noble 1995; Miki 2008; Breitbart 2012). It should
also be noted that quantifying viral lysis is harder than determining protist grazing rates.
However, it is clear that viral lysis can be as, or on occasions more important, than protist
grazing in controlling prokaryotic biomass (Fuhrman & Noble 1995; Wommack & Colwell
2000; Suttle 2007; Breitbart 2012), but their effect on the microbial food web is very

6 Introduction
different. Virally lysed prokaryotic biomass returns to the POM, DOM and nutrient pools,
without transfer of carbon and energy to higher levels in the food web, in the so‐called
viral‐shunt (Fig. I) (Fuhrman 1999; Suttle 2007). Thus, in systems where viral lysis
dominates, theoretical models predict that prokaryotic growth and respiration would be
enhanced at the expense of biomass at higher trophic levels (Breitbart et al. 2008). The
potential for viruses to enhance prokaryotic respiration has been shown experimentally
(Middelboe & Lyck 2002), and viral lysates are thought to provide from 4 to 95 % of
prokaryotic carbon demand in different aquatic environments (Breitbart et al. 2008).
However, the quantitative incorporation of this concept to microbial food web models is
difficult, since viral lysates also constitute a nutrient source for phytoplankton production,
part of which will be channelled back to higher trophic levels (Breitbart et al. 2008;
Breitbart 2012).
A second important aspect of viral lysis is the high host specificity thought to be
exhibited by most, though not all, viruses (Breitbart 2012). This lead to the development of
the `kill the winner´ theory (Thingstad & Lignell 1997; Thingstad 2000b), which postulated
that selective virally induced mortality would suppress numerically dominating
prokaryotic groups and allow less abundant bacteria to become dominant. Experimental
data supported this theory, albeit with highly variable results between locations and
experiments (reviewed in Breitbart et al. 2008), and led to the establishment of a second
theory. This proposed that protist grazing would generally control prokaryotic biomass
while viral lysis would primarily control prokaryotic diversity (Thingstad & Lignell 1997;
Thingstad 2000b). However, this second theory was based on a `black box´ approach to
protist grazing. The identity of both the protist grazers and the prokaryotic prey were
ignored, on the premise that a given protist grazer would handle all particles in an edible
size‐range equally. This is generally far from the case, with complex species‐specific
interactions taking place between bacterivores and prey, which can shape the structure of
the prokaryotic community (Hahn & Höfle 2001; Jürgens & Matz 2002; Sherr & Sherr 2002;
Pernthaler 2005; Jürgens & Massana 2008).
Interactions between protist grazers and their prokaryotic prey
When considering interactions between bacterivores and their prey, two important facts
should be taken into account: (1) It encompasses an enormous diversity of protist grazers
and prokaryotes, both of which will be found in different physiological states, from
actively growing to dormant. This additionally includes different feeding modes in

Introduction 7
protists, ranging from interception‐feeders, which handle each prey cell individually, to
filter‐feeders, which clear water of particles by means of mesh‐like structures (reviewed in
Boenigk & Arndt 2002; Fenchel 1987). (2) It is an immensely old process, likely constituting
one of the first interactions between eukaryotes and prokaryotes (Cavalier‐Smith 2002),
and therefore has been subject to millions of years of co‐evolution. Both facts lead to a
very complex array of interactions, which are only just beginning to be understood. A
series of studies conducted with laboratory cultures have allowed a first glimpse of this
complexity and uncovered some basic principles (Fig. II) (see reviews by Hahn & Höfle
2001; Jürgens & Matz 2002; Sherr & Sherr 2002; Matz & Kjelleberg 2005; Pernthaler 2005).
However, the lack of information for certain types of interactions, and the lack of cultures
for many relevant groups of bacterivorous protists and prokaryotes in marine and
freshwater systems, leaves many open questions in this field.
Interactions between bacterivores and prokaryotes can occur at different stages
during the feeding process, and can alter the probabilities of the predator encountering a
given prey, and the preys subsequent capture, ingestion and digestion (Jürgens & Matz
2002) (Fig. II). At each stage, different traits of the protist and prokaryote can lead to a
`selection´ by the protist. This can be an active selection, with the protist discriminating
between different prey (e.g. through the cell‐surface characteristics or `taste´ of the
prokaryotic prey (Hahn & Höfle 2001; Jürgens & Matz 2002)); or a passive or indirect
selection, where traits of a specific prokaryote alter the chances of it being found, captured
or consumed without active discrimination by the protists (e.g. resistance to digestion
(Boenigk et al. 2001)).
Prokaryotic size and morphology are two factors that have repeatedly and
convincingly been linked to changes in the chances of prey encounter, capture and
ingestion (Hahn & Höfle 2001; Jürgens & Matz 2002; Sherr & Sherr 2002; Matz & Kjelleberg
2005; Pernthaler 2005). At the encounter phase, simple geometrical models show that the
odds of a given protist encountering a prey increase with the size of the prey particle until
a certain limit (Fenchel 1982a). Thus, very small prokaryotes are less likely to be `found´
by grazers than larger ones. Upon encounter, small‐sized bacteria can avoid capture by
filter‐feeding protists by being too small to be retained in the filtration structures. Finally,
at the ingestion stage, prokaryotes can become too large or morphologically too
complicated to be engulfed by the protist food vacuole (e.g., filaments or spiral‐shaped
cells). Prokaryotic motility, frequently observed in free‐living prokaryotes of aquatic
systems (Fenchel 2001; Grossart et al. 2001; Herzog & Wirth 2012), is another such factor,

8 Introduction
but is considered a `two‐sided coin´ (Pernthaler 2005). Higher speeds increase encounter
rates with predators (González et al. 1993), but at the same time enable the possibility of
escape during capture and ingestion phases (Matz & Jürgens 2005) (Fig. II).
Figure II. Examples of prokaryotic traits that increase (+) or decrease (‐) the probability of a
prokaryote being found, captured and consumed by a protist predator. Adapted from Jürgens &
Matz 2002.
Given the large number of stages at which selection can act, it is very likely that all
bacterivorous protists will to a certain extent `select´ their prokaryotic prey, either
passively or actively. However, for some, especially interception feeding flagellates, it will
be a more intensive process than for others. Protist intra‐specific variability should also be
considered (Weisse 2002). Protists can present complicated life cycles, and will potentially
show varying selectivity at different stages. Additionally, experimental data strongly
suggests that feeding history can alter the level of selectivity, with protists in prey‐limited
conditions being considerably less `choosy´ than their well‐fed counterparts (Jürgens &
DeMott 1995; Boenigk et al. 2002).
In all, these complex patterns in inter‐specific and intra‐specific traits lead to `prey
selectivity´ by protists (here including both active and passive selection). On an individual
level, this means that a given protist grazer will not consume all prey equally, and that a
given prokaryotic prey will not be consumed equally by all grazers.

Introduction 9
Implications of grazer selectivity at a community level
Extrapolated to the community level, prey selectivity implies that protists not only
regulate the biomass of prokaryotic communities, but can also affect their phenotypic and
phylogenetic composition (Hahn & Höfle 2001; Jürgens & Matz 2002; Sherr & Sherr 2002;
Pernthaler 2005; Jürgens & Massana 2008). In freshwater systems, community
manipulation experiments convincingly linked high abundances of filamentous bacteria
and ultramicrobacteria to high grazing pressure (Šimek et al. 1997; Posch et al. 1999). This
development of grazing `resistant´ phylotypes was further proven in chemostat cultures
with mixed bacterial communities, were addition of bacterivores lead to a strong
bidirectional shift in the prokaryotic size‐distribution towards smaller cells and larger
filamentous forms or aggregates (Hahn & Höfle 1999; Corno 2008). In marine systems,
filamentous bacteria do not tend to occur, but small, often highly motile forms are
common (Matz & Jürgens 2003; Pernthaler 2005). Changes in phylogenetic community
composition under varying grazing pressure have also been experimentally proven, both
through community manipulation techniques (Jürgens et al. 1999; Langenheder & Jürgens
2001; Šimek et al. 2007; Corno 2008) and analysis of food‐vacuole content (Jezbera et al.
2005, 2006; Bautista‐Reyes & Macek 2012). Moreover, bacterivores leave a direct imprint on
the taxonomic composition of prokaryotic communities (Pernthaler 2005), which can be
seen e.g., by the numerical importance of putatively grazing resistant Gram‐positive
Actinobacteria in freshwater prokaryotic assemblages (Hahn et al. 2003; Tarao et al. 2009).
Grazing selectivity also has the potential to impact the activity and distribution of
given prokaryotic groups (Hahn & Höfle 2001; Jürgens & Matz 2002; Sherr & Sherr 2002;
Pernthaler 2005; Jürgens & Massana 2008). Actively growing prokaryotes tend to be larger
than non‐growing or dormant forms. Thus, in systems where prokaryotes tend towards
small cell‐sizes, prokaryotic grazing will primarily impact the actively growing portion of
the prokaryotic community. As a direct effect, some heavily grazed members of the
prokaryotic community are thought to shift away from their zones of growth optimum to
areas with reduced grazing pressure (Tittel et al. 2003).
The full in situ spectra and implications of selective protist grazing are to a large part
still unknown, partly due to the numerous restriction and biases imposed by the existing
methodologies to date (McManus & Fuhrman 1988; Vaqué et al. 1994; Dolan & McKeon
2005; Landry & Calbet 2005). However, it’s clear that protist grazing is a major regulating
factor for prokaryotic and phytoplanktonic communities in aquatic systems, not only
controlling biomass production, but also their composition, activity and distribution.

10 Introduction
Open questions in protist ecology
As seen above, a considerable body of work has been amassed over the last decades on the
ecological role of protists in aquatic environments. These studies have firmly established
protists as ubiquitous, extremely diverse eukaryotic organisms with pivotal roles in
microbial food webs and ecosystem functioning. However, research has lagged behind that
of prokaryotes (Caron et al. 2009), and many open questions remain, ranging from single‐
cell interactions to the community level (Montagnes et al. 2008). The recent application of
18S rRNA gene based techniques revealed a wealth of novel, environmentally relevant
protist groups, only distantly related to cultured representatives (López‐Garcia et al. 2001;
Moon‐van der Staay et al. 2001; Massana et al. 2004; Not et al. 2009). The range and depth
of their interactions with in situ prokaryotic communities, and how well the ecological
principles obtained through studies with well‐characterized laboratory protist strains can
be extrapolated to these novel protist groups, are relevant questions that remain to be
answered. Also important is to extend our knowledge away from oxygenated surface
waters, and include other environments, such as sediments, deep‐sea water masses and
anaerobic zones. These ecosystems differ strongly in their environmental parameters and
constraints, and remain tantalisingly under‐explored. It should additionally be noted, as
has been mentioned in the preceding text, that even for aerobic conditions and well‐
studied protist species, many relevant points remain unknown.
For the present thesis, two case studies of under‐researched fields in protist ecology
and protist‐bacteria interactions were selected based on their potential global relevance,
and will be expanded on in the following text:
1. A study focusing on interactions between single predator and prey species,
analysing the vulnerability of carbon‐starved bacteria to bacterivores with regard
to its implications for protist grazing in nutrient depleted environments.
2. An environmental study, focusing on grazer‐prey interactions at a community level
in a hitherto understudied aquatic environment, marine suboxic to anoxic water
columns.

Introduction 11
The starvation‐survival state in bacteria
The fact that all ecosystems are energy driven is a basic ecological principle. The amount
of energy entering a system, its quality and bioavailability, and its turnover rate, will
determine the biomass and productivity of the system (Kjelleberg 1993; Morita 1997).
However, with the recognition in the mid 20th century of the importance of heterotrophic
bacteria in aquatic systems (Pomeroy 1974; Azam et al. 1983), came the realization that
most of these systems are oligotrophic, and do not receive enough energy to support the
average 105 to 106 prokaryotes per ml‐1 found there. Thus, if all cells were alive and equally
active, they would be starved (reviewed in Kjelleberg 1993; Morita 1997; Giorgio & Gasol
2008). Subsequent research showed that bacterial populations could be divided into
actively growing cells, cells that appeared damaged or dead, and a large proportion of
apparently intact cells that showed little or no metabolic activity. These latter cells have
been referred to as dormant, latent, starved, quiescent or inactive (Giorgio & Gasol 2008).
One of the most obvious causes for latency is the carbon‐starvation or starvation‐
survival state (Giorgio & Gasol 2008). Studies with cultured heterotrophic bacteria have
revealed a fairly consistent response to severe carbon and energy limitation (Kjelleberg
1993; Morita 1997; Britos et al. 2011). In a first stage bacterial chemosensory and quorum
sensing mechanisms `alert´ the cell that conditions are turning unfavourable and activate
a regulatory cascade which starts the starvation‐survival response (McDougald et al. 2000,
2003; Brackman et al. 2009). This leads to an initial down‐regulation of metabolical
activity and an increase in protein degradation. If starvation persists, a series of
reorganization events occur, which include changes in membrane composition, reductive
division, development of chemotactic responses to diverse solutes, degradation of reserve
material, and the onset of development of resistance against a variety of stress factors
(Kjelleberg 1993). Finally, a gradual decline in metabolic activity occurs, leaving the cell in
a dormant or latent state. The end result is a bacterium with a severely reduced cell‐size
and metabolic activity, which is strongly resistant to abiotic stress factors and adapted to
quickly respond to renewed carbon availability. Oligotrophic ultramicrobacteria can also
develop a starvation‐survival response, but the changes are less drastic, since they are
already small cells (<0.1 μm3) with a tendency towards high resistance to abiotic stress
factors (Cavicchioli et al. 2003; Hahn et al. 2003; Lauro et al. 2009).
The characteristics of the carbon‐starvation response lead to it being considered a
long‐term survival strategy for heterotrophic bacteria (from months to years) (Kjelleberg

12 Introduction
1993). A test conducted with several marine isolates showed that cells remained intact and
could respond to new nutrient inputs after 8 months of starvation (Amy & Morita 1983).
This is partly due to a remarkable resistance to abiotic stress (Kjelleberg 1993). Studies
conducted with Photobacterium angustum showed that the percentage of surviving cells
after heat shock or UV exposure rose from practically 0 when non‐starved to almost 100 %
when carbon‐starved for respectively 10 and 40 h (Nyström et al. 1992). They are
additionally thought to be in a sense `immune´ to viral lysis due to the practical absence of
metabolic activity (Giorgio & Gasol 2008). However, to date it is not known whether this
extensive cross‐resistance also encompasses a reduced vulnerability to protist grazing.
The implications of such a resistance could be important for oligotrophic systems.
No adequate methodologies exist for quantifying the abundance and heterogeneity of
different metabolic and physiological states in situ (Giorgio & Gasol 2008). However, it is
thought that two principal strategies exist for surviving in energy limited environments:
high affinity continued nutrient uptake with slow growth; or fast growth when nutrients
are present followed by entry into the starvation‐survival state. Models comparing the two
strategies do not always show a benefit for the latter (reviewed in Giorgio & Gasol 2008).
Instead, they postulate that only when the periodicity of nutrient input is long compared
to the minimum doubling time of a bacterium, does the starvation‐survival state present
an advantage. However, these models were conducted from a bottom‐up nutrient control
perspective, and did not take into account potential differences in the magnitude of loss
processes for bacteria conducting the two strategies. This latter fact will also affect the
standing stocks of available prey for protists. Thus, the resistance or not of carbon‐starved
bacteria to protist grazing is an important point that should be considered.
Suboxic to anoxic water masses
Suboxic (defined here as <30 µM oxygen (O2)) and anoxic environments are found in a
variety of habitats, from sediments to the intestinal tracts of animals, and are primarily
caused by an O2 demand for organic matter decomposition which exceeds supply. As
anoxia develops, anaerobic microbial degradation takes over, and the metabolic end
products (e.g., hydrogen sulphide (H2S) or hydrogen (H2)) cause chemically reducing
conditions (Fenchel & Finlay 1995). An alternative, globally less relevant cause for
anaerobiosis is geothermal activity, which releases water rich in reducing solutes such as
H2S (e.g. hot springs and hydrothermal vents) (Fenchel & Finlay 1995). The resulting

Introduction 13
transition zones between oxidizing and reducing conditions are termed redoxclines, and in
systems where H2S is produced, the zone of its first appearance is called chemocline. In
open water masses, suboxic to anoxic conditions generally occur in highly productive areas
where stratification (i.e, due to temperature or salinity) or weak circulation, lead to a
limited replenishment of water depleted of O2 through organic matter decomposition.
These zones can be found worldwide in freshwater, brackish and marine systems. Deep,
aphotic, pelagic redoxclines are present in e.g., the Black Sea (Yakushev et al. 2008), the
Cariaco Basin off the coast of Venezuela (Taylor et al. 2006), and the Baltic Sea (described
in detail in later sections). Other systems have shallow euphotic redoxclines, like the
Framvaren and Mariager Fjords (Yao & Millero 1995; Zopfi et al. 2001) and certain lakes
(e.g. lake Cisó in Spain (Casamayor et al. 2008)). Finally, water masses with permanent or
temporary low O2 concentrations, which can become anoxic and sometimes sulphidic,
occur at mid‐water depths in coastal oceanic zones located near upwelling areas with high
productivity (Oxygen Minimum Zones (OMZ)) (Stramma et al. 2008; Lam & Kuypers 2011)
and in lakes (e.g., Mallin et al. 2006; Gobler 2008)).
Life in suboxic to anoxic water masses
Redoxcline prokaryotic communities and biogeochemical cycling
Redoxcline systems are closely interlinked to the highly stratified and active prokaryotic
communities they host. Diverse prokaryotic groups require the strong gradients in
electron donors and acceptors found there for metabolism and growth. At the same time,
by directly or indirectly mediating oxidation‐reduction processes, prokaryotes become a
major driving force behind element cycling (Pimenov & Neretin 2006), thus shaping the
redox gradient in combination with abiotic processes. The role prokaryotic communities
play in biogeochemical cycling has long been a focus of intensive studies, especially for
nitrogen, sulphur, and carbon cycles (Taylor et al. 2001; Sievert et al. 2007; Jost et al. 2008;
Lam & Kuypers 2011; Zehr & Kudela 2011) (Fig. III), revealing important roles in, for
example, nitrogen loss processes.
Nitrogen is a critical element for new biomass production in aquatic systems since it
is often in short supply relative to other nutrients (Zehr & Kudela 2011). Its availability
depends on the balance of input‐ and loss processes, with major sources being
atmospheric deposition, river runoff and nitrogen fixation; and important loss processes
occurring in suboxic to anoxic zones of the water column and the underlying sediments

14 Introduction
(Lam & Kuypers 2011; Zehr & Kudela 2011). As an example, it has been estimated that 30 –
50 % of the oceans nitrogen losses occur in OMZs (reviewed in (Lam & Kuypers 2011).
Studies conducted to date have lead to a relatively good general understanding of nitrogen
cycling in redoxcline systems (Fig. III). In suboxic zones, ammonia (NH4 +) from organic
matter remineralization is oxidized via nitrite (NO2 ‐) to nitrate (NO3
‐ ) (nitrification). This
processes is conducted by diverse prokaryotic assemblages, but the first step, from NH4 +
to NO2 ‐, is primarily conducted by Beta‐ and Gammaproteobacteria, and Thaumarchaeota
from the marine cluster I (McCaig et al. 1994; Francis et al. 2005; Christman et al. 2011). In
suboxic to anoxic zones, the produced NO3‐ is reduced to molecular nitrogen (N2) by
denitrifying bacteria (Zehr & Kudela 2011). Alternatively, in absence of H2S, N2 is produced
by bacteria belonging to the Planctomycetes through the combination NH4 + and NO2 ‐, in
a process called anaerobic ammonium oxidation (anammox) (Kuypers et al. 2003; Lam &
Kuypers 2011).
Figure III. Idealized representation of a marine pelagic redoxcline, showing major
biogeochemical processes involved in nitrogen‐, carbon‐ and sulphur cycling.
Sulphur compounds are the main energy link between aerobic and anaerobic
processes (Sievert et al. 2007). In anoxic zones, organic material sinking to the sediment
surface is degraded coupled to SO4 reduction to H2S (Fig. III). This process is conducted by

Introduction 15
an assemblage of prokaryotes, which tends to be dominated by Deltaproteobacteria in
mesophilic systems (Teske et al. 1996; Nedwell et al. 2004; Ince et al. 2006). H2S then
diffuses upwards and is reoxidized at the oxic / anoxic interface via biological pathways,
which can be phototrophic or non‐phototrophic, or through inorganic reactions (Sievert et
al. 2007). This reoxidation is often coupled to the reduction of other compounds, for
example NO3, linking the sulphur cycle to that of other inorganic elements.
Finally, chemoautotrophy is an important component of the carbon cycle in
redoxclines (Fig. III) (e.g., Taylor et al. 2001; Casamayor et al. 2008; Grote et al. 2008). This
process, also called `dark CO2 fixation´, refers to the fixation of CO2 using the energy from
favourable reactions between inorganic electron donors and acceptors instead of from
light (photoautotrophy). Chemolithoauthotrophic prokaryotic assemblages tend to be
dominated by Epsilonproteobacteria and Gammaproteobacteria (Glaubitz et al. 2009, 2010;
Lavik et al. 2009) though other groups are also involved, such as Thaumarchaeota in
suboxic zones (Varela et al. 2011; Yakimov et al. 2011), and sulphate reducing prokaryotes in
sediments (Neretin et al. 2007).
Overall, successive studies have revealed the importance of redoxcline prokaryotes
in biogeochemical cycling across different environments. However, substrate availability
and redox optima are not always sufficient to explain the distribution and activity of the
specific prokaryotic groups, and to date little attention has been given to other potential
regulating processes, such as bacterivorous pressure and viral lysis.
Eukaryotic organisms in redoxcline systems
Suboxic to anoxic conditions are not favourable for `higher´ eukaryotic organisms, which
tend to have low tolerance to O2 deficiency (Marcus 2001; Wu 2002) and an extremely low
tolerance to H2S (Vismann 1991). Thus, higher organisms living permanently in pelagic
redoxcline systems appear to be relatively rare, especially for sulphidic zones (Danovaro et
al. 2010). Temporary forays to these areas have been seen to occur, for example by the
amphipod Orchomene obtusus to feed (De Robertis et al. 2001), and could constitute an
important link between oxic and anoxic food webs. However, it is clear that protists are
the primary, and in some cases only permanent components of eukaryotic communities in
suboxic to anoxic aquatic systems.
To date, most studies conducted on protists in pelagic redoxclines have centred on
their abundance and diversity, analysed by both classical microscopy (e.g., Bark 1985;
Fenchel et al. 1990; Zubkov et al. 1992) and 18S rRNA gene based methods (e.g., Stoeck et

16 Introduction
al. 2003; Zuendorf et al. 2006; Orsi et al. 2011, 2012; Wylezich & Jürgens 2011). These studies,
carried out for freshwater, brackish and marine environments, demonstrated that
redoxcline protist communities can present high cell‐abundances at oxic / anoxic
interfaces, taxonomically differ from their counterparts in overlaying oxic water masses,
and show strong changes in composition along the redox gradient. Additionally, a high
proportion of `novel´ protist groups were found, only distantly related to the closest
cultured representatives. However, due to the scarcity of cultured free‐living redoxcline
species, and the methodological constraints of maintaining in situ physico‐chemical
conditions, relatively little is known about the autoecology of redoxcline protist species
and their ecological role.
From a physiological point of view, the metabolism of protists which do not use O2
as a terminal electron acceptor (anaerobes) is practically unknown for pelagic redoxclines
(Fenchel & Finlay 1991a, 1995; Ginger et al. 2010). The predominating theory is that free‐
living anaerobic protists will base their metabolism on fermentation and substrate level
phosphorylation (Fenchel & Finlay 1991a). Degenerate mitochondria, called
hydrogenosomes, which use the pyruvate:ferredoxin oxidoreductase to oxidize pyruvate to
acetate with production of H2, were discovered in the pathogen Trichomonas (Müller 1988;
Boxma et al. 2005); and later with a different catabolising enzyme, the pyruvate:formate
lyase, in anaerobic chytrids (Neocallimastix and Piromyces) (Akhmanova et al. 1998;
Hackstein et al. 2006). They have been additionally inferred for numerous free‐living
anaerobic ciliates through ultrastructure studies and / or the presence of methanogenic
endo‐symbionts, which employ the released H2 to reduce certain oxidated carbon
compounds to methane (CH4) (Fenchel & Finlay 1995; Hackstein et al. 2006). However,
anaerobic respiration is also possible. NO3 respiration has been found for diatoms,
foraminiferans, and the microaerophilic ciliate Loxodes (Finlay 1985; Risgaard‐Petersen et
al. 2006; Pina‐Ochoa et al. 2010); while homologues to the prokaryotic nitrite reductase
(nirK) have been detected for several groups of protists (reviewed in Ginger et al. 2010).
Additionally, SO4 reduction, though not seen yet in protists, has been found for the fungi
Fusarium oxysporum (Abe et al. 2007).
Another important factor for protists living in redoxcline systems is how they cope
with O2 and H2S toxicity. O2 toxicity arises from the production of O2 radicals in
conjunction with the absence or inadequacy of cellular detoxification mechanisms; and
from its ability to destroy or inactivate certain enzymes (Fenchel & Finlay 1991a, 2008).
Cultured anaerobic protists have been shown to respire O2, though the lack of

Introduction 17
cytochromes impedes its coupling to energy conservation. Instead, it is thought to act as a
detoxification method, maintaining anaerobiosis inside the cells at low O2 tensions (up to
4 – 5 µmol O2 l‐1) (Fenchel & Finlay 1995). H2S, on the other hand, acts as a respiratory
inhibitor to aerobic organisms, and can also inhibit anaerobic organisms at high
concentrations (Fenchel & Finlay 1995). Anaerobic protists studied to date tend to be quite
tolerant to H2S, showing 100 % viability up to 2 ‐ 30 mM, though the underlying
mechanisms behind this tolerance are poorly understood (Massana et al. 1994; Fenchel &
Finlay 1995; Atkins et al. 2002).
Figure IV. Epifluorescence microscopy photographs of ciliate cells containing putative
symbionts (marked by arrows) from Baltic Sea anaerobic zones. A and B: Fluorescence In Situ
Hybridization (FISH) with specific probes for Eubacteria; photograph B courtesy of F. Weber
(unpublished data). C: non‐specific DAPI staining. Scale‐bar represents 20 μm.
The wide‐spread occurrence of prokaryotic endo‐ and ectosymbionts in anaerobic
protists is probably closely linked to both metabolism, and O2 and H2S tolerance, and
requires further study (Fenchel & Finlay 1991a, 1995; Edgcomb et al. 2011c, 2011d) (Fig. IV).
The role of the majority of these symbionts is unknown, but they have been shown to have
a profound impact on their hosts. In the case of the methanogenic endosymbionts
mentioned above, experimental inactivation or elimination of the symbiont resulted in a
strongly reduced growth of anaerobic free‐living ciliate hosts (e.g., Plagiopyla frontata,
Metopus contortus and Trimyema compressum (Fenchel & Finlay 1991b; Shinzato et al.
2007)). Symbionts have also been shown to modify the behavior of their host, with an
intriguing example set by the symbiosis between Strombidium purpureum and purple
photosynthetic non‐sulphur bacteria. The prokaryotic symbiont switches from anoxygenic
photosynthesis in the light to oxidative phosphorylation in the dark, thus secondarily
transforming S. purpureum from an anaerobe in the light to an aerobe in the dark (Fenchel
& Bernard 1993). The `other side of the coin´ should be kept in mind too, with protist

18 Introduction
hosts constituting favourable microhabitats within the redoxcline, potentially allowing
processes to be carried out which would otherwise not be favoured at that depth.
From an environmental point of view, the points discussed above imply that protists
could impact biogeochemical cycling though anaerobic respiration and as hosts for
symbionts. However, their regulating influence as bacterivores should also not be
disregarded, and remains vitally under‐explored.
Redoxcline food webs
Redoxcline systems mark the transition from aerobic to anaerobic food webs, and either
present chemoautotrophs as sole `primary´ producers (in dark redoxclines), or in
combination with phototrophs (in euphotic redoxclines) (here, primary production is
shown in brackets since it can also be considered secondary production, using compounds
which proceed from organic mater decomposition, such as SO4). Anaerobic food webs
have in principle the same structure as their aerobic counterparts (Fig. I); but are
postulated to support at most two levels of consumers, due to lower growth efficiencies
(Fenchel & Finlay 1990). However, almost all knowledge of the carbon and energy flows
through suboxic to anoxic food webs are based on models using predator and prey
biomass and theoretical considerations (Fenchel & Finlay 1995). This is constrained by: (a)
the lack of information on predominant metabolic pathways for free‐living anaerobic
protists, which impacts their efficiency in transforming prey biomass into new protist
biomass, and thus the carbon and energy available for the next trophic level; (b) the
magnitude of carbon being transported into the protist mediated microbial food web vs.
the viral shunt; and (c) the magnitude of import / export processes between oxic, suboxic
and anoxic compartments. All of these points remain under‐researched to date, largely
due to methodological constraints.
Table I summarizes the principal studies conducted on protist grazing and viral lysis
for marine, brackish, and freshwater suboxic to anoxic zones. Clearly, no consensus exists
on the predominating mortality factor for prokaryotes, even when excluding shallow
redoxclines, where a seasonal influence can introduce variability. Weinbauer et al. showed
a shift in the predominating prokaryotic mortality factor from protist grazing in
oxygenated waters to viral lysis in anoxic / sulphidic zones (Weinbauer & Höfle 1998), but
this is not always supported by other studies (Table I). Thus, the relative role played by
protist grazers in regulating prokaryotic communities along redox gradients, and their

Introduction 19
potential impact on biogeochemical cycling, are important questions that remain to be
answered.
Table I. Review on existing literature on protist grazing impact and viral lysis in suboxic to
anoxic water masses; part I: Freshwater systems. HNF: heterotrophic nanoflagellates; PB:
prokaryotic biomass;. PM: prokaryotic mortality; PSS: Prokaryotic standing stocks; EM: electron
microscopy; PP: prokaryotic production.
Study site Target Method Zone Results Reference
Lake Cisó Spain
Plagiopyla sp. FLB ingestion Sulphidic ‐ <0.1 % PB d‐1 (Massana & Pedrós‐Alió 1994)
Lake Plußsee Germany
HNF and viruses
HNF: literature clearance rates Viral lysis: EM
Suboxic Anoxic (non‐sulphidic)
‐ Summed PM: 22‐ 57 %; 51‐ 91 % of PM caused by viruses ‐ Summed PM: 43‐ 103 %; 88‐94 % of PM caused by viruses
(Weinbauer & Höfle 1998)
Lake Eire U.S.A.
Protist community (pre‐filtered: 200 μm) and viruses
Grazing : Dilution Viral lysis: EM
Suboxic ‐ Protists: 71‐ 78 % PSS; Viruses: 5 – 12 % PSS
(Gobler 2008)
Lake Adyat France (Seasonal study)
Ciliates, HNF and viruses
Grazing: ingestion of fluorescent beads Viral lysis: EM
Suboxic Anoxic (non‐sulphidic)
‐ Summed mortality: 10 ‐ 100 % PP, shared by viruses and HNF ‐ 10 ‐ 50 % PP, dominated by viruses.
(Bettarel et al. 2004)
Lake Alchichica Mexico
Ciliates Analysis of food vacuole content
Anoxic ‐ Preference for: α‐, γ‐ and δ‐Proteobacteria and Planctomycetes
(Bautista‐Reyes & Macek 2012)
Lake Faro Italy
Whole protist community
FLB ingestion Sulphidic ‐ 36 – 72 % picoplankton production d‐1.
(Saccà et al. 2009)

20 Introduction
Table I (continued). Review on existing literature on protist grazing impact and viral lysis in
suboxic to anoxic water masses; part II: Marine and brackish systems. HNF: heterotrophic
nanoflagellates; PP: prokaryotic production; PM: prokaryotic mortality; CC: community
composition; interface: zone were both O2 and H2S range around the detection limit.
Site Target Method Zone Results Reference
Gotland Deep; Baltic Sea
Protist community (pre‐filtered: 100 μm)
Dilution (Note: water for dilution filtered under oxic conditions)
Sulphidic ‐ 48 % of gross PP cleared d‐1
(Detmer et al. 1993)
Gotland Deep; Baltic Sea
Ciliates Theoretical clearance rates
Suboxic to interface
‐ 2 ‐ 10 % of water volume cleared d‐1
(Setälä & Kivi 2003)
Gotland Deep; Baltic Sea
Viruses Mytomicin C and electron microscopy
Suboxic Sulphidic
‐ 11 ‐ 19 % virally mediated PM ‐ 27 ‐ 50 % virally mediated PM
(Weinbauer et al. 2003)
Cariaco Basin
Whole protist community
Predator exclusion (filtration through 1.6 μm)
Interface to sulphidic
‐ Changes in prokaryotic CC, but generally no strong changes in abundance
(Lin et al. 2007)
Hypoxic Masan Bay
HNF and viruses
Protist grazing: FLB ingestion Viral lysis: Microscopy
Suboxic ‐ HNF: 0 ‐ 100 % PP; viruses: 2 ‐ 34 % PP
(Park & Cho 2002) (Choi et al. 2003)
OMZ, Chile
HNF Selective inhibitors ; food vacuole analysis
Suboxic ‐ HNF: >100 % PP d‐1; 0 ‐ 30 % of cyanobacteria production d‐1
(Cuevas & Morales 2006)
The Baltic Sea as a model pelagic redoxcline system
The Baltic Sea (Fig. V) is relatively young in geological terms, with its origin dating to
about 1500 B.P. (Grasshoff 1975; HELCOM 1981). Today, it extends over 415.266 km2, and
constitutes a land‐locked or inland sea. It is not a single basin, but a labyrinth of smaller
and larger basins formed by the action of ice movement during and after the last glaciation
on different types of rock (Grasshoff 1975). The largest of these basins is Gotland Deep,
with 249 m, and the deepest is Landsort Deep, with 459 m. The Baltic Sea is connected to
the North Sea through a series of narrow channels called the Danish straits (Øresund,

Introduction 21
Great Belt and Little Belt) (Fig. V). Here, water entering or leaving the Baltic must pass
through the 7 m deep Drogden Sill or the 18 m Darss Sill, with the consequence that water
exchange with the North Sea is generally severely restricted. On the other hand,
freshwater input is very strong in the Baltic Sea, both through river run‐off and through
direct precipitation which is not quite balanced by evaporation, leading to a net outflow of
lower salinity water into the North Sea and further restricting the inflow of North Sea
water into the Baltic (Reißmann et al. 2009). The result is a horizontal salinity gradient
which oscillates between 25 ‰ in the south‐western Baltic and 2‐3 ‰ in the Gulf of
Bothnia, making the Baltic Sea one of the largest brackish water masses in the world. The
salinity gradient also extends to the vertical plane, with lower salinity water overlaying
denser higher salinity water. This has lead to the formation of a permanent halocline,
situated around 60 – 80 m in the central Baltic Sea basins, which restricts vertical mixing
between over‐ and under‐laying water masses (Grasshoff 1975).
Figure V. (A) Bathymetric map of the Baltic Sea (maximum depth shown ~600 m, already
belonging to the North Sea (NS)). (B) Horizontal profile of the Baltic Sea showing the vertical
salinity gradient. The contour plot includes the connection to the NS, the Great Belt from the
Danish straits (G), the eastern Baltic Sea proper (including Gotland Deep (GD)) and the
Bothnian Bay (BB) (the western Baltic Sea proper, including Landsort Deep (LD), is not shown).
The restricted vertical and horizontal exchange results in the stagnation of Baltic Sea
water masses. However, exceptional meteorological conditions can lead to higher inputs of
high salinity oxygenated North Sea water, and consequent renewal of Baltic Sea bottom
waters, in processes known as inflow events. These can occur after strong storm events,
which cause a sea‐level difference between basins located before and after the Danish
straits (barotropic inflows (Lass & Matthäus 1996; Reißmann et al. 2009)); or after

22 Introduction
prolonged periods of warm calm weather and stratification, caused by density differences
across the Great Belt (baroclinic inflows (Feistel et al. 2003; Reißmann et al. 2009)). These
sporadic inflows do not occur as single events, but are generally clustered in groups of 4‐7,
lasting up to 3 years (Matthäus & Franck 1992). Since 1983 there have been only two major
Baltic Sea inflow events, in 1993 and 2003, with 10 year stagnation periods in between
(Matthäus & Franck 1992). Prior to 1983 inflow events were more regular, but stagnation
periods still lasted several years (Matthäus et al. 2008).
The Baltic Sea, through its strong river mediated terrestrial‐input is a naturally
nutrient rich system. However, since the start of the 20th century anthropogenic impact
through industrialization, agriculture and farming have resulted in a strong eutrophication
(Zillén et al. 2008). Inputs of phosphorous and nitrogen are especially important since they
trigger phytoplankton growth and bloom formation. Photosynthetic primary production is
very high in central Baltic Sea surface waters (Schneider & Kuss 2004; Dahlgren et al.
2010), and is characterized by two bloom episodes, one in spring, dominated by diatoms
and dinoflagellates, and one in summer, dominated by cyanobacteria (Wasmund et al.
1998; Ploug 2008; Suikkanen et al. 2011). Most of the organic carbon produced is
remineralized by heterotrophic bacteria in the oxic zone (Gast & Gocke 1988; Rheinheimer
et al. 1989), but a significant fraction still sediments as POM to deeper water layers
(Schneider et al. 2002). Decomposition of this organic matter takes place during sinking
and at the sediment surface. Since the halocline impedes vertical mixing, O2 depleted
water does not get replaced, with the exception of during inflow events, and deep basins
become gradually anoxic. The organic matter degradation process is then taken over by
fermenting and SO4 reducing bacteria, with production of H2S, leading to sulphidic
bottom waters (Piker et al. 1998). The resulting transition zone between oxic and anoxic
water masses (i.e. the redoxcline), ranges over several meters, is situated in the aphotic
zone and is marked by strong chemical gradients (Fig. VI).
Baltic Sea redoxclines (Fig. VI) host highly active prokaryotic communities that have
been well characterized to date (Labrenz et al. 2005, 2007; Brettar et al. 2006; Jost et al.
2008). Successive studies have revealed the presence of key‐prokaryotic groups, which can
constitute a significant percentage of total cell abundance and are importantly involved in
specific biogeochemical processes. These include the nitrifying Thaumarchaeota
subcluster GD2 (Labrenz et al. 2010); and the Sulfurimonas subgroup GD17 (Grote et al.
2008, 2012; Grote 2009), involved in chemolithoautotrophy coupled to denitrification and
sulphide reduction. Gammaproteobacteria have also been identified as potentially
Introduction 23
important chemolithoautotrophs (Glaubitz et al. 2009), but their relevance in Baltic Sea
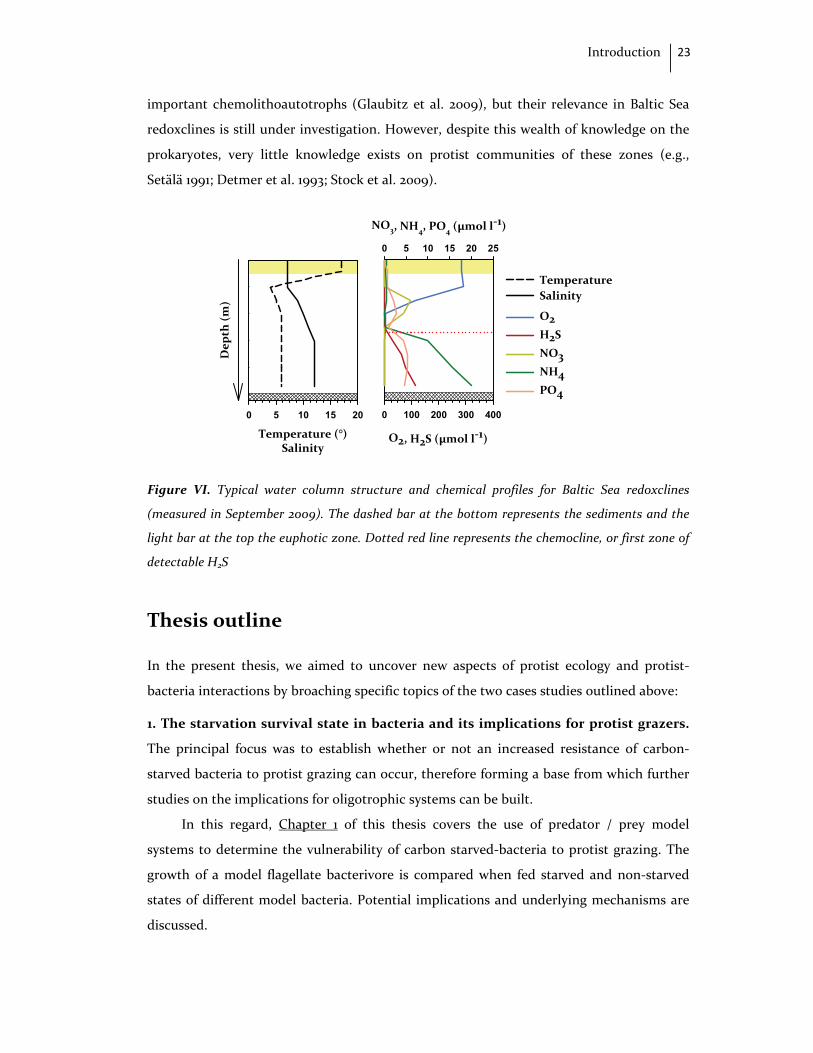
redoxclines is still under investigation. However, despite this wealth of knowledge on the
prokaryotes, very little knowledge exists on protist communities of these zones (e.g.,
Setälä 1991; Detmer et al. 1993; Stock et al. 2009).
O2, H2S (µmol l‐1)
0 100 200 300 400
NO3, NH4, PO4 (µmol l‐1)
0 5 10 15 20 25
O2 H2S NO3 NH4 PO4
Temperature (°)Salinity
0 5 10 15 20
Dep
th (m
)
TemperatureSalinity
Figure VI. Typical water column structure and chemical profiles for Baltic Sea redoxclines
(measured in September 2009). The dashed bar at the bottom represents the sediments and the
light bar at the top the euphotic zone. Dotted red line represents the chemocline, or first zone of
detectable H2S
Thesis outline
In the present thesis, we aimed to uncover new aspects of protist ecology and protist‐
bacteria interactions by broaching specific topics of the two cases studies outlined above:
1. The starvation survival state in bacteria and its implications for protist grazers.
The principal focus was to establish whether or not an increased resistance of carbon‐
starved bacteria to protist grazing can occur, therefore forming a base from which further
studies on the implications for oligotrophic systems can be built.
In this regard, Chapter 1 of this thesis covers the use of predator / prey model
systems to determine the vulnerability of carbon starved‐bacteria to protist grazing. The
growth of a model flagellate bacterivore is compared when fed starved and non‐starved
states of different model bacteria. Potential implications and underlying mechanisms are
discussed.
24 Introduction
2. Ecological role of bacterivorous protists in suboxic to anoxic water masses. The
principal aim was to establish the relevance of protist grazers as a mortality factor for
prokaryotic communities in pelagic redoxclines, using two deep Baltic Sea basins as model
systems. Due to the scarcity of information existing on Baltic Sea redoxcline protist
communities a multi‐stage approach was developed aimed at uncovering the following
points:
1. The diversity, abundance and distribution of the protist community
throughout the redoxcline.
2. The impact of bacterivory on the total prokaryotic community, and its relative
importance as a prokaryotic mortality factor compared to viral lysis.
3. The role played by bacterivores in regulating the growth and abundance of
key‐prokaryotic organisms involved in biogeochemical cycling.
In this regard, Chapter 2 of this thesis describes the use of different microscopy
techniques to identify and quantify the principal morphotypes found in Baltic Sea
redoxclines, and the analysis of the principal protist associations found along the O2
gradient. The bacterivorous impact of the protist community at depths of differing
physico‐chemical conditions are assessed by tracer techniques, and compared to the
impact of viral lysis, determined through the dilution approach. Finally, the relative role of
different protist functional groups is estimated (ciliates, dinoflagellates and HNF), based
on data proceeding from food‐vacuole analysis and theoretical considerations.
Chapter 3 of this thesis describes the use of predator‐exclusion experiments to
determine the grazing impact on a prokaryotic key‐player of Baltic Sea biogeochemical
cycling, the Sulfurimonas subgroup GD17 (Epsilonproteobacteria). Additionally, the
principal grazers on a cultured representative of this strain, "Sulfurimonas gotlandica"
strain GD1, are identified by means of RNA‐stable isotope probing.
Overall, this thesis provides one of the first assessments on the role the carbon‐
starvation response plays in the bacterial resistance to protist grazers; and it includes by
far the most detailed description of the structuring and relevance as bacterivores of Baltic
Sea pelagic redoxcline protist communities. It is additionally, the first study which
conclusively proves that protists can regulate the growth, and potentially the distribution,
of a key‐prokaryotic group for redoxcline biogeochemical cycling.

Chapter 1
Species‐specific patterns in the
vulnerability of carbon‐starved
bacteria to protist grazing


Grazing vulnerability of carbon starved bacteria 27
Abstract
Many heterotrophic bacteria possess adaptations for prolonged survival under carbon and
energy limitation, generally involving a reduction in cell size and an increased resistance
to environmental stress factors. In order to reveal whether carbon‐starved bacteria also
become less vulnerable to protist grazing, we compared the growth of a bacterivorous
nanoflagellate, Cafeteria roenbergensis, on different physiological states of 3 bacterial
strains with well‐studied starvation responses (Vibrio vulnificus, Photobacterium angustum
and Sphingopyxis alaskensis). Protists achieved high growth rates on all 3 bacterial strains
when they were provided in a non‐starved state. However, for carbon‐starved bacteria,
pronounced differences in the response of the flagellates were observed. P. angustum
provided similar protist growth for an equal biomass of non‐starved and starved cultures,
indicating no change in food quality or grazing resistance for carbon‐starved cells, despite
smaller cell size. In contrast, starved V. vulnificus did not support protist growth, even
resulting in a strong decrease in flagellate numbers at most concentrations tested; and
starved S. alaskensis provided only reduced growth rates. The results obtained
demonstrate that (1) feeding on bacteria of smaller cell size does not necessarily impose
energy constraints on a flagellate grazer, and (2) a pronounced species‐specific variability
exists in the susceptibility of carbon‐starved bacteria to protist grazing.
1.1. Introduction
Suspended bacteria in marine pelagic environments are strongly influenced by both top‐
down (predation) and bottom‐up (resources) controlling forces. Organic substrate and
inorganic nutrient concentrations are generally very low, requiring physiological
adaptations for efficient substrate uptake and utilization as well as for long‐term survival
under carbon and energy limitation. In addition, pelagic environments offer little refuge
against predation by bacterivorous protists, making necessary the development of
strategies to decrease their vulnerability. How bacterial communities cope with these two
selection forces has been the focus of numerous studies, revealing a wide range of

28 Chapter 1
resistance mechanisms to protist grazing (Hahn & Höfle 2001; Jürgens & Matz 2002;
Pernthaler 2005), and a well characterized carbon‐starvation response (Kjelleberg 1993;
Morita 1997). However, few studies have analyzed the response to the two forces jointly,
centring on the potential ideal for planktonic prokaryotes, an adaptive response able to
cope with both substrate limitation and grazing pressure simultaneously.
To date, the physiological and molecular mechanisms of the starvation response
have been studied in detail for a number of bacteria, such as Vibrio spp (Kjelleberg 1993;
McDougald et al. 2001, 2003), Enterobacteria (Jenkins et al. 1988; Galdiereo et al. 1994;
Brauer et al. 2006) and others (Wrangstadh et al. 1980; Redon et al. 2005; Johnson et al.
2006). For these model organisms the final outcome is so‐called non‐growing
“ultramicrobacteria” which are highly resistant against diverse stress factors (e.g., UV,
chemical oxidants and high temperatures), remain viable for extended periods (from
weeks to months or years) and can be recovered to normally growing cells by substrate
addition. Interestingly, one of these adaptations, namely miniaturization of the cells, is
known to be a major factor leading to a decreased vulnerability towards protist predation,
due to a lowered grazer feeding efficiency on smaller bacterial cells (González et al. 1990;
Šimek et al. 1994; Posch et al. 1999). This could therefore constitute a mechanism, directly
developed or as an indirect benefit of the starvation survival response, for carbon starved
bacteria to decrease their vulnerability towards grazers. Additionally, it becomes plausible
to consider that the dominance of small or ultramicrobacterial cells among planktonic
prokaryotic communities could partly be due to the combination of a high abundance of
cells in the starvation‐survival state and a preferential elimination of larger cell sizes by
predators, particularly bacterivorous protists.
However, despite the potential importance of small cell‐size, it alone may not be
sufficient for long‐term survival of starvation adapted, non‐growing cells, in the presence
of protist predators. For most interception‐feeding flagellates there is no physical
limitation for the uptake of small particles, being able to ingest even viruses (González &
Suttle 1993) and colloids (Sherr 1988; Tranvik et al. 1993), though not at the same rates as
larger particles. Geometric models predict that the clearance rate of interception feeders
decreases approximately with the square of the particle radius (Spielman 1977; Fenchel
1982a). This encounter‐based size‐selectivity has been confirmed in feeding studies with
fluorescent beads which revealed that particles of less than 0.5 µm are removed by typical
bacterivorous nanoflagellates with a 4‐6 times lower efficiency than 1 µm particles (Jürgens
& Matz 2002). Extrapolated to the natural environment this would imply that in situations
Grazing vulnerability of carbon starved bacteria 29
where protist grazing accounts for the removal of bacterial standing stocks within one or a
few days, small cell‐size would only prolong survival to 1 ‐ 2 weeks. These first‐order
estimates show that cell size miniaturization alone would not enable long‐term survival in
the presence of bacterial grazers.
These considerations, combined with the fact that the starvation‐survival
programme confers a high, long‐term, resistance to abiotic stress factors, raises the
question whether carbon‐starved cells are also capable of prolonged survival in presence of
protist grazers. It has been speculated that the starvation‐induced differentiation program
which results in cross‐protection against different stress factors might also involve an
increased protection against predators, for example by resisting the digestive enzymes
inside protist food vacuoles (Jürgens & Matz 2002). Similar effects have been observed for
bacteria with certain cell wall structures, such as gram‐positive bacteria (Iriberri et al.
1994; Tarao et al. 2009); certain pathogens inside protists and macrophages (e.g.
Legionella) (Barker & Brown 1994); and through the secretion of macromolecules and
proteins (Greub & Raoult 2004). Additionally, other resistance mechanisms could act at
different stages of the interaction between bacteria and protists (i.e. avoiding capture or
ingestion) (Matz et al. 2002; Montagnes et al. 2008).
In the present study we aimed to take the first step of assessing whether the
potential exists for carbon starved bacteria to become less vulnerable to protist grazing,
thus creating a basis for future studies on long‐term survival and potential resistance
mechanisms. To this aim we selected three model bacteria with a clearly characterized
carbon starvation response, but that differ in their lifestyle strategies. Vibrio vulnificus,
found mostly in coastal temperate waters, often associated with plankton, shellfish and
fish (Oliver 2006) and Photobacterium angustum, which was isolated from surface coastal
waters, are both copiotrophic organisms with relatively large and fast growing cells, which
quickly react to carbon limitation, forming the aforementioned starvation survival
ultramicrobacterial cells. Conversely, Sphingopyxis alaskensis is a model oligotroph that
grows with a constant maximum growth rate on low concentrations of substrates and
maintains a relatively small cell volume (Lauro et al. 2009). We used the simple but
effective approach of comparing protist growth rates on starved vs. non‐starved cells. This
provides an integrated measure of the grazers’ ability to capture, ingest and digest
bacterial prey and the subsequent efficiency in transforming it into protist biomass.
Therefore, this methodology, though not revealing specific processes, encompasses both
30 Chapter 1
the possible resistance mechanisms of these bacteria, and the potential differences in
nutritional value between starved and non‐starved cells.
1.2. Materials and methods
Bacterial strains and pre‐cultures
The three bacterial strains used in this study, their specific starvation responses, and their
subsequent increase in resistance to abiotic stress factors, have been described previously:
Sphingopyxis alaskensis RB2256 (Schut et al. 1993; Schut 1994; Cavicchioli et al. 2003);
Photobacterium angustum S14 (formerly Vibrio angustum) (Humphrey et al. 1983;
Albertson et al. 1990; Nyström et al. 1992) and Vibrio vulnificus M06‐24/O (Wright et al.
1990; Morton & Oliver 1994). All strains were obtained from the CMB (Centre for Marine
Bio‐Innovation, Universitiy of New South Wales, Sydney) and were maintained as glycerol
stocks at ‐80°C.
V. vulnificus and P. angustum were routinely grown from glycerol stocks on Luria
Broth agar with 2 % NaCl (LB20) and MMM2000 (Marine Minimal Medium (MMM) with 2
g l‐1 of glucose (Östling et al. 1991); for all solutions 50 ng l‐1 of Vitamin B12 were added after
autoclaving (Cavicchioli et al. 1999). S. alaskensis did not grow well on LB20 so VNSS agar
(Marden et al. 1985) was used instead. In all cases, incubation was at 30 °C, with orbital
shaking at 150 rpm for liquid cultures.
Starved bacterial cultures were obtained as previously described (Holmquist &
Kjelleberg 1993), with some modification. Bacteria were grown in MMM2000 until an
optical density corresponding to mid‐exponential phase was reached, namely OD610 = 0.2 –
0.3 for V. vulnificus and P. angustum, and OD433 = 0.3 for S. alaskensis (D. McDougald &. L.
Ting, pers. comm.). Cultures were then washed with MMM, resuspended in the same
media, and allowed to starve for 72 hours, to ensure that the cells were fully adapted to
long‐term starvation conditions (Kjelleberg 1993).
Non‐starved bacterial cultures were obtained from overnight cultures grown in
MMM2000, corresponding to mid‐ to late exponential growth phase. Starved and non‐
starved bacterial cultures to be used in a given experiment were inoculated from the same
plate. With S. alaskensis, additional cleaning steps with MMM proved to be necessary,
both for the non‐starved and starved cultures, since strong bacterial growth was observed
in the first grazing experiment with C. roenbergensis. This is likely due to the fact that this

Grazing vulnerability of carbon starved bacteria 31
bacterium has broad‐specificity, high‐affinity uptake systems, enabling efficient substrate
scavenging (Cavicchioli et al. 2003), and can grow on low nutrient levels (Williams et al.
2009) such as those present in the inoculum.
C. roenbergensis pre‐cultures
The widespread marine bicosoecid nanoflagellate C. roenbergensis (Fenchel & Patterson
1988) was selected as a model predator in tests prior to the experiments, due to its ability
to grow well on the selected prey and growth conditions (data not shown). Two different
stocks of C. roenbergensis were used. For the first experiment with P. angustum and the
experiment with V. vulnificus, an axenic C. roenbergensis culture from the CMB was
employed (described in (Matz et al. 2005)), while in all other experiments a culture from
the Leibniz Institute for Baltic Sea Research was used (reference IOW23). Both were
isolated from the Baltic Sea by A. P. Mylnikov. Cultures were routinely grown in MMM, at
room temperature (23 ‐ 25 °C) with moderate orbital shaking, using the bacterium to be
tested in the experiment as food source.
To eradicate indigenous bacteria in the IOW23 cultures and obtain a protist culture
with the desired bacteria as sole prey, serial dilutions in multiwell plates containing MMM
as media were performed. Protists were allowed to grow 1‐2 days at room temperature,
with light orbital shaking and the desired bacteria as added food source. New multiwell
plates were then inoculated from the highest dilutions that exhibited protist growth. This
process was repeated until only the desired bacterial strain was detected (inspected by
fluorescence microscopy and/or colony morphology on plates) and the final cultures were
then used to inoculate the protist pre‐cultures. The efficiency of the method was tested in
the second experiment with P. angustum with an immunofluorescence assay using
polyclonal antibodies against P. angustum, as previously described (Christoffersen et al.
1997).
Growth experiments
For each experiment, batch cultures were inoculated in tissue culture flasks (Sarstedt AG &
Co.) containing MMM as medium, using a standard protist concentration of 103 flagellates
ml‐1 (obtained from the same protist pre‐culture for both treatments), and six different
initial bacterial concentrations of starved or non‐starved cells, ranging from 106 to 108
bacteria ml‐1. As controls, treatments with an intermediate bacterial concentration of ~ 107

32 Chapter 1
cell ml‐1, and no protists were prepared. Flasks were incubated at room temperature (23 –
25 °C), with moderate orbital shaking, for 60 – 72 h. Samples were taken every 4 h during
the day and immediately fixed with 2 % formaldehyde.
In total, five experiments were carried out, two with P. angustum (the first of which
tested only growth on starved bacteria), one with V. vulnificus, and two with S. alaskensis.
They shall be referred to respectively as ExpP.a.1 and ExpP.a.2; ExpV.v.; and ExpS.a.1 and
ExpS.a.2; throughout this paper. For ExpS.a.1, due to the active bacterial growth during
incubation with flagellates, only data for the growth of the flagellate on the non‐starved
bacterial treatment is shown, and is referred to as flagellate growth on actively growing
bacteria. Data from the starved bacterial treatment was excluded from further analysis
since the fact that there was bacterial growth was an obvious indication that they were no
longer in the starvation‐survival state.
Enumeration of organisms and biovolume measurements
For bacterial enumeration, fixed subsamples were filtered onto black polycarbonate filters
(0.2 μm pore size; 25 mm diameter; Whatman GmbH) and stained with DAPI (0.01 mg ml‐
1). For protist enumeration, the same procedure was employed using 0.8 μm pore size
filters (Whatman GmbH). Samples were observed under a Zeiss Axioskop 2 mot plus
microscope (Carl Zeiss MicroImagimg GmbH) and a minimum of 200 bacterial cells (1000
X magnification) and 100 flagellate cells (630 X magnification) were counted per sample
using filter set 02 (Carl Zeiss MicroImagimg GmbH).
For bacterial cell size measurements, image acquisition and analysis was performed
using the CellP Image analysis software (Soft Imaging System GmbH) and an F‐View
camera (Soft imaging Systems GmbH). Images were processed as previously described
(Posch et al. 2009), with a modification of the morphological filters: Erosion,
Morphological Opening and Dilatation. A total of 200 – 250 cells were analyzed (Massana
et al. 1997), and cell volumes were calculated using the formula described by Bjørnsen
(1986). The accuracy of the method was tested by means of calibration with fluorescent
beads of known size.
Size distributions, based on cell volumes, were determined for each bacterial
population, and the average length to width ratio was calculated for larger size classes as
Ferret max/Ferret min (respectively, the maximum and minimum values between tangents
circulating at angle α 0, 10, 20… 180° around the particle). Size distributions were
determined for control treatments without flagellates at the start of the experiment and

Grazing vulnerability of carbon starved bacteria 33
for treatments with protists, at intermediate to high bacterial concentrations, for later
time points during the experiment. This should reveal possible changes in bacterial
morphology, e.g., due to nutrient regeneration by the grazers. The time points studied
were selected to cover the whole exponential phase of flagellate growth, in some cases
extending beyond this time period. Statistical comparison was done by means of
parametric tests when possible (t‐test or ANOVA, see Table 1.1), but in occasions the
distribution of bacterial cell‐sizes was not normal, requiring the use of non‐parametric
tests (U‐Mann Whitney).
Data analysis and statistics
For all experiments and treatments, flagellate and bacterial numbers were followed over
time at all bacterial concentrations. Analysis was conducted with data obtained from the
first 36 – 40 hours of the experiment, and initial bacterial numbers were determined from
samples taken immediately after inoculation of the experimental flasks, to avoid errors
arising from the carry over of the bacterium from the flagellate inoculum. Total initial
biovolumes inoculated in each experimental flask were determined by multiplying the
initial concentration by the mean cell‐biovolume calculated for the bacterium in the
corresponding physiological state.
Net flagellate growth rates were obtained by linear regression of the natural
logarithm of C. roenbergensis concentration against time for each inoculated
concentration of bacterial prey (starved and non‐starved) (Fenchel 1982b). Data for
flagellate growth rate and initial bacterial concentration or biovolume were fitted by
iteration to a hyperbolic function:
μ = x μmax / (Ks + x)
where μ: growth rate (d‐1); μmax: maximum growth rate (d‐1); x: prey concentration or
biovolume available; and Ks: half saturation constant for growth. Uncertainties in the
estimates of the regression coefficients are expressed by the corresponding 95 %
confidence intervals and asymptotic standard errors (see Table 1.2).
As an indication of the minimum number of bacteria needed for flagellate growth,
theoretical threshold bacterial concentrations were calculated as previously described
(Eccleston‐Parry & Leadbeater 1994).
Finally, as a measure of the decrease of bacterial populations in the experimental
flasks, bacterial loss rates were determined during the exponential phase of bacterial
34 Chapter 1
decrease (coinciding with the flagellate exponential growth pahse) for each treatment and
bacterial concentration as follows:
[(ln Nt ‐ ln N0) / (tt ‐ t0)] ‐ [(ln Ct ‐ ln C0) / (tt ‐ t0)]
where Nt and N0 are, respectively, the final and initial bacterial concentration in the test
flasks (with protists); Ct and C0 are, respectively, the final and initial bacterial
concentration in the control flasks (without protists); and tt and t0 are, respectively, the
final and initial time points.
Statistical analyses were performed with the SPSS 15.0 (SPSS GmbH) and
SigmaPlot10.0 (Systat Software GmbH) software packages.
1.3. Results
Bacterial population characteristics
P. angustum in its non‐starved state is a rod‐shaped bacterium (0.82 x 1.4 μm, median
width and length respectively) with a median volume of 0.46 μm³. Starved cells are
smaller, with a median volume of 0.18 μm³ and a more cocci‐like morphology (0.70 x 0.89
μm). Observing the populations as whole, non‐starved bacteria had a more heterogeneous
size distribution, covering a wide range of size classes, and possessing higher and more
variable length to width ratios (Supplementary Fig. S1.1 Fig. 1.1A, B; only data from ExpS.a.2
is shown for starved bacteria, since cell‐size distributions were very similar in both
experiments).
V. vulnificus is smaller in terms of volume, median 0.35 μm³, forming longer but
thinner rods than P. angustum (0.73 x 1.69 μm). As a result of starvation conditions it
forms shorter rods (0.66 x 1.19 µm), with a median volume of 0.23 μm³. The cell‐size
distributions of both populations tended towards a normal distribution with a maximum
in the median value (Fig. 1.1C, D; Fig. S1.1). Length to width ratios were higher for the non‐
starved bacterial population.
S. alaskensis is a rod‐shaped bacterium with decreasing sizes in its three
physiological states, passing from a median cell‐volume of 0.32 μm³ (0.65 x 1.70 μm) when
actively growing, to 0.23 μm³ (0.62 x 1.27 μm) when non‐starved (but not growing), and,
finally to 0.17 μm³ (0.58 x 1.02 μm) when starved (Fig. S1.1). The reduction in length
between the three physiological states was more marked than the reduction in width, as

Grazing vulnerability of carbon starved bacteria 35
shown by the decreasing length to width ratios (Fig. 1.1.E, F, G). The cell‐size distribution
of the populations showed a clearer dominance of certain size classes for non‐starved (Fig.
1.1.F) and starved bacteria (Fig. 1.1.G), while the actively growing population had a more
wide‐spread heterogeneous distribution (Fig. 1.1.E).
0.000.030.060.090.120.150.18
Relative freq
uency
A
0.2 0.4 0.6 0.80.000.030.060.090.120.150.18
B
C
0.2 0.4 0.6 0.8
D
0.000.030.060.090.120.150.18
Relative freq
uency
1.0
1.5
2.0
2.5
3.0
3.5E
1.0
1.5
2.0
2.5
3.0
3.5
Length/W
idth (‐,‐)
F
0.2 0.4 0.6 0.81.0
1.5
2.0
2.5
3.0
3.5G
Cell ‐ volume (µm3 cell‐1)
Figure.1.1. Size distribution of the bacterial prey populations at the start of the experiments. The
histograms show the relative frequencies of the different size‐classes for P. angustum S14
(ExpP.a.2), A: non‐starved (number of cells measured (n): 269) and B: starved (n: 288); V.
vulnificus M06‐24/O (ExpV.v) C: non‐starved (n: 250) and D: starved (n: 234); and S. alaskensis
RB2256 (ExpS.a.1 & 2) E: actively growing (n: 235); F: non‐starved (n: 211); and G: starved (n: 204).
The average length/width ratios for larger size classes (indicated by the dashed lines) are also
plotted
For all three bacterial strains an overlap was observed between the initial cell‐size
distributions of the different physiological states (Fig. 1.1). However, a significant
difference was always maintained between the two populations, starved and non‐starved,
both at the start of the experiment and at later time points (Table 1.1.; P < 0.05). As a

36 Chapter 1
whole, measured median cell‐volumes remained constant with time, though some small
shifts were observed, i.e. the tendency towards smaller cells in the starved V. vulnificus
treatment or the appearance of larger cells at the final time‐point for non‐starved V.
vulnificus (Table 1.1). Mean and median cell‐volumes were normally equal or very similar,
though in some cases, such as the final time point for the starved P. angustum treatment,
divergences between the two occurred due to the appearance of small subpopulations of
cells with larger or smaller cell volumes (observed in histograms; data not shown).
Table.1.1. Mean and median cell‐volumes, with the corresponding standard deviation (SD),
measured at different time‐points for each type of bacterium and physiological state (n: number
of measured cells). Data is shown for only one experiment with each type of bacterium, and in
each case it proceeds from one experimental flask per physiological state, inoculated with an
intermediate to high initial bacterial concentration.
Non‐starved Starved
Time Biovolume [μm³] Time Biovolume [μm³]
[h] n Median Mean SD [h] n Median Mean SD
P. angustum ExpP.a.2
0 a+ 269 0.46 0.47a 0.19 0 a+ 288 0.18 0.19a 0.08
19 185 0.46 0.49a 0.18 23 233 0.17 0.18a 0.07
36 a+ 178 0.46 0.48a 0.18 36 a+ 191 0.20 0.25a* 0.13
V. vulnificus ExpV.v.
0 + 250 0.35 0.36 0.09 0 + 234 0.23 0.23 0.06
27 a+ 240 0.36 0.39a 0.15 27 a+ 211 0.21 0.21a* 0.06
31 199 0.56 0.56* 0.22 56 196 0.18 0.19a* 0.07
S. alaskensis ExpS.a.2
0 + 211 0.23 0.25 0.06 0 + 204 0.17 0.18 0.05
20 185 0.23 0.25a 0.07 20 177 0.16 0.17 0.04
24 225 0.20 0.21* 0.06 36 a+ 169 0.15 0.16* 0.04
36 a+ 212 0.19 0.20a* 0.06 44 147 0.16 0.17 0.05
* Significant differences with 0h value (ANOVA or U‐Mann Whitney (a), p < 0.05) + time points at which cell‐volumes of starved and non‐starved bacterial cells were compared. In all cases significant differences were found (t‐test or U‐Mann Whitney (a), p < 0.05).

Grazing vulnerability of carbon starved bacteria 37
In ExpP.a.2, the percentage of total bacteria corresponding to P. angustum was
determined by immunofluorescence staining, allowing the quantification of potential
contaminant bacteria in the test treatments. These were detected, but accounted for only 2
% or less of the initial total bacterial numbers in most treatments, though slightly higher
in those inoculated with the lowest bacterial concentration (data not shown). No
contaminant bacteria were detected in control treatments confirming that they came from
the protist pre‐cultures. The relative proportion of these bacteria did increase as the
experiment proceeded and total bacteria numbers were reduced due to grazing, but only
constituted a high percentage towards the end of the experiment, when total bacterial
numbers were 10 % or less of the original values.
Flagellate growth on starved and non‐starved bacteria
C. roenbergensis grew on all offered concentrations of the three bacterial strains in their
non‐starved or actively growing states, achieving maximal growth rates in the range of 0.2
‐ 0.3 h‐1 (Table 1.2), which correspond to doubling times of approximately 2.5 ‐ 3.5 h. In
contrast, growth on carbon starved bacterial cultures varied with the different bacterial
strains (Fig. 1.2; Table 1.2). The exponential growth phase for the flagellates was observed
in most cases between 12 and 24 ‐ 36 h, with the exception of the treatments in ExpS.a.2
supplied with starved bacteria, where it was delayed until 20 h and then continued until 40
h (data not shown).
When fed with P. angustum, the increase in flagellate growth with bacterial
concentration and biovolume was the same for both experiments and treatments (Fig.
1.2A, B). The hyperbolic fits tended to fall together and the corresponding estimated
growth parameters, namely maximum growth rate and Ks values, were similar, presenting
in all cases overlapping standard errors and 95 % confidence intervals (Table 1.2). Only
theoretical threshold values differed, being higher for flagellates fed on non‐starved
bacteria (Table 1.2).
In the experiment with V. vulnificus as a food source, marked differences were
observed between the growth on starved and non‐starved bacteria (Fig. 1.2C, D; Table 1.2).
An increase in flagellate growth rates with increasing prey concentration and biovolume,
equal to that obtained for P. angustum, was observed when C. roenbergensis was supplied
with non‐starved cells. However, starved bacteria only supported flagellate growth at the
highest concentration, and a marked decrease in flagellate numbers was observed for
almost all other concentrations tested. From lowest to highest initial bacterial
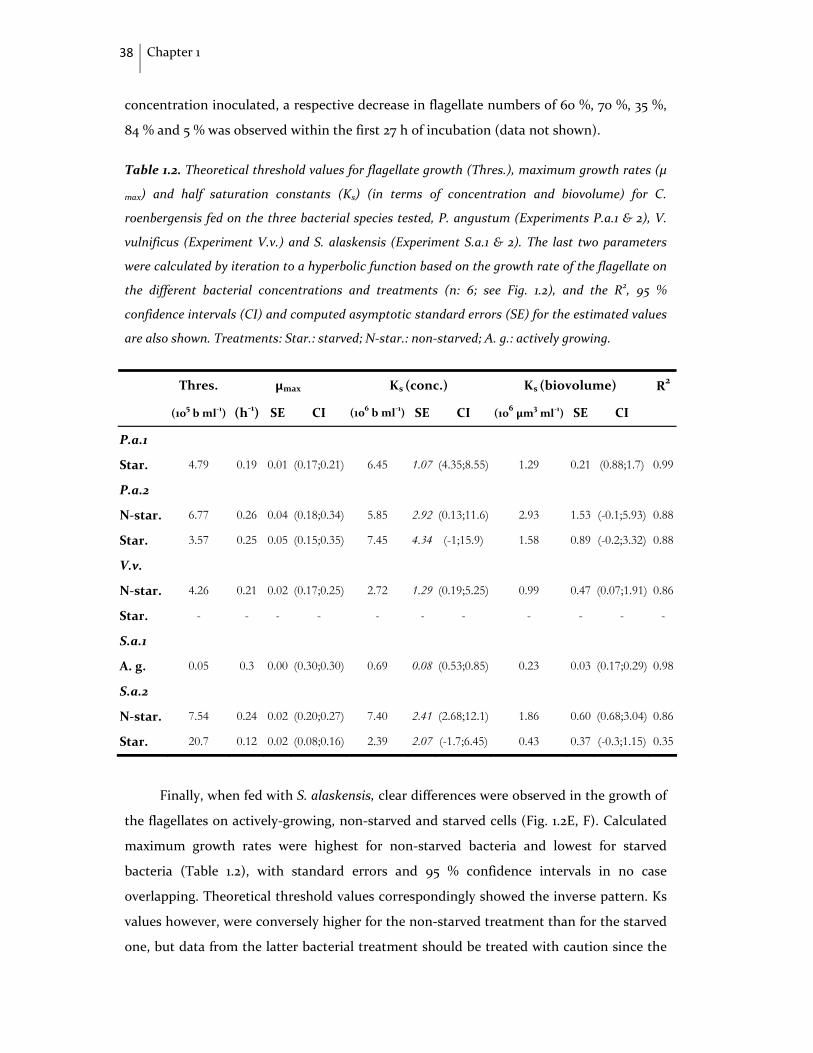
38 Chapter 1
concentration inoculated, a respective decrease in flagellate numbers of 60 %, 70 %, 35 %,
84 % and 5 % was observed within the first 27 h of incubation (data not shown).
Table 1.2. Theoretical threshold values for flagellate growth (Thres.), maximum growth rates (μ
max) and half saturation constants (Ks) (in terms of concentration and biovolume) for C.
roenbergensis fed on the three bacterial species tested, P. angustum (Experiments P.a.1 & 2), V.
vulnificus (Experiment V.v.) and S. alaskensis (Experiment S.a.1 & 2). The last two parameters
were calculated by iteration to a hyperbolic function based on the growth rate of the flagellate on
the different bacterial concentrations and treatments (n: 6; see Fig. 1.2), and the R2, 95 %
confidence intervals (CI) and computed asymptotic standard errors (SE) for the estimated values
are also shown. Treatments: Star.: starved; N‐star.: non‐starved; A. g.: actively growing.
Thres. μmax Ks (conc.) Ks (biovolume) R2
(105 b ml‐1) (h‐1) SE CI (106 b ml‐1) SE CI (106 μm3 ml‐1) SE CI
P.a.1 Star. 4.79 0.19 0.01 (0.17;0.21) 6.45 1.07 (4.35;8.55) 1.29 0.21 (0.88;1.7) 0.99
P.a.2
N‐star. 6.77 0.26 0.04 (0.18;0.34) 5.85 2.92 (0.13;11.6) 2.93 1.53 (-0.1;5.93) 0.88
Star. 3.57 0.25 0.05 (0.15;0.35) 7.45 4.34 (-1;15.9) 1.58 0.89 (-0.2;3.32) 0.88
V.v.
N‐star. 4.26 0.21 0.02 (0.17;0.25) 2.72 1.29 (0.19;5.25) 0.99 0.47 (0.07;1.91) 0.86
Star. - - - - - - - - - - -
S.a.1
A. g. 0.05 0.3 0.00 (0.30;0.30) 0.69 0.08 (0.53;0.85) 0.23 0.03 (0.17;0.29) 0.98
S.a.2
N‐star. 7.54 0.24 0.02 (0.20;0.27) 7.40 2.41 (2.68;12.1) 1.86 0.60 (0.68;3.04) 0.86
Star. 20.7 0.12 0.02 (0.08;0.16) 2.39 2.07 (-1.7;6.45) 0.43 0.37 (-0.3;1.15) 0.35
Finally, when fed with S. alaskensis, clear differences were observed in the growth of
the flagellates on actively‐growing, non‐starved and starved cells (Fig. 1.2E, F). Calculated
maximum growth rates were highest for non‐starved bacteria and lowest for starved
bacteria (Table 1.2), with standard errors and 95 % confidence intervals in no case
overlapping. Theoretical threshold values correspondingly showed the inverse pattern. Ks
values however, were conversely higher for the non‐starved treatment than for the starved
one, but data from the latter bacterial treatment should be treated with caution since the
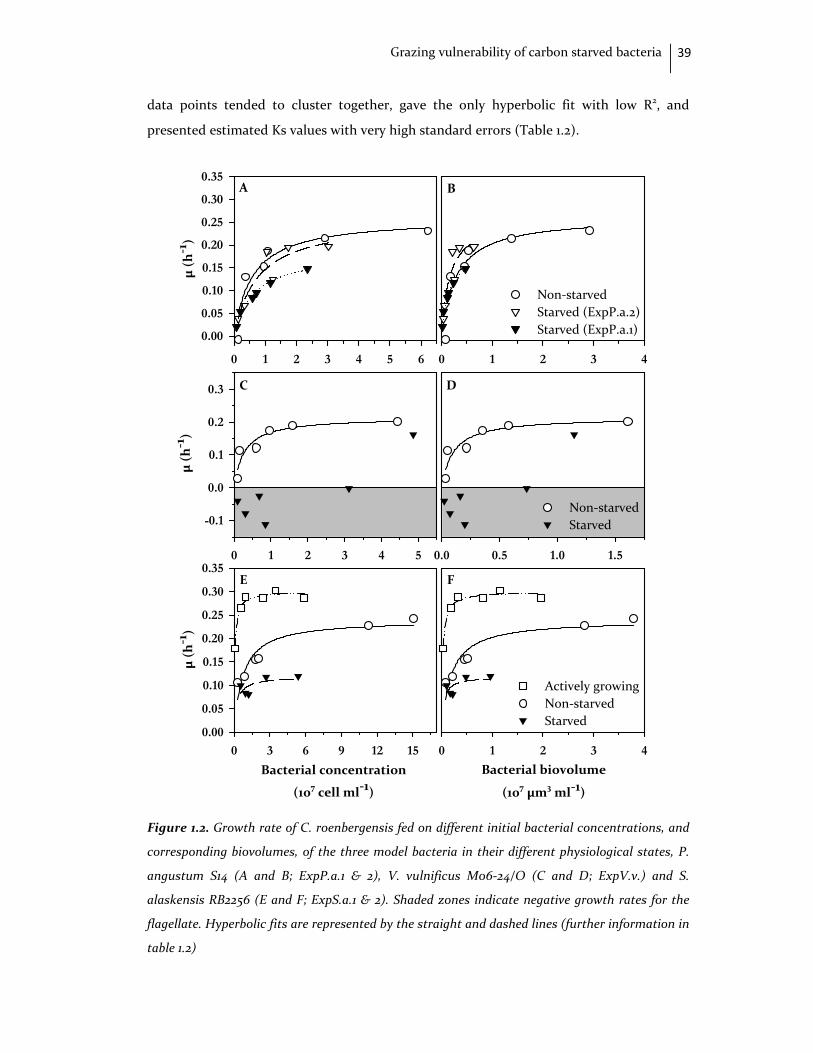
Grazing vulnerability of carbon starved bacteria 39
data points tended to cluster together, gave the only hyperbolic fit with low R2, and
presented estimated Ks values with very high standard errors (Table 1.2).
A
0 1 2 3 4 5 6
µ (h‐1)
0.00
0.05
0.10
0.15
0.20
0.25
0.30
0.35B
0 1 2 3 4
Non‐starvedStarved (ExpP.a.2)Starved (ExpP.a.1)
C
0 1 2 3 4 5
µ (h‐1)
-0.1
0.0
0.1
0.2
0.3
E
Bacterial concentration
(107 cell ml‐1)
0 3 6 9 12 15
µ (h‐1)
0.00
0.05
0.10
0.15
0.20
0.25
0.30
0.35F
Bacterial biovolume
(107 µm3 ml‐1)
0 1 2 3 4
Actively growingNon‐starvedStarved
D
0.0 0.5 1.0 1.5
Non‐starvedStarved
Figure 1.2. Growth rate of C. roenbergensis fed on different initial bacterial concentrations, and
corresponding biovolumes, of the three model bacteria in their different physiological states, P.
angustum S14 (A and B; ExpP.a.1 & 2), V. vulnificus M06‐24/O (C and D; ExpV.v.) and S.
alaskensis RB2256 (E and F; ExpS.a.1 & 2). Shaded zones indicate negative growth rates for the
flagellate. Hyperbolic fits are represented by the straight and dashed lines (further information in
table 1.2)

40 Chapter 1
A
0 2 4 6Bac
terial lo
ss rate (h‐1)
-0.12
-0.08
-0.04
0.00
0.04
0.08
0.12B
Bacterial concentration (107 cell ml‐1)
0 1 2 3 4 5
C
0 4 8 12 16
E
Protist growth rate (h‐1)
-0.1 0.0 0.1 0.2
D
0.0 0.1 0.2
-0.12
-0.08
-0.04
0.00
0.04
0.08
0.12F
0.0 0.1 0.2 0.3
Figure 1.3. Bacterial loss rates in relation to the initial bacterial concentration inoculated (A, B,
C; hyperbolic fits are also plotted (R2 > 0.81 in all cases)) and the protist growth rate (D, E, F), for
the experiments with P. angustum (A and D), V. vulnificus M06‐24/O (B and E) and S. alaskensis
RB2256 (C and F). Circles represent non‐starved bacteria (o), inverted triangles starved bacteria
(▼) and squares actively growing bacteria (□). For P. angustum, where two experiments with
starved bacteria were conducted, data from ExpP.a.1 are represented by black triangles and data
from ExpP.a.2 by white triangles. Dashed vertical and horizontal lines serve as reference to 0 h‐1
protist growth rates or bacterial loss rates.
Overall, protist growth resulted in a corresponding decline of bacterial numbers,
with bacterial loss rates increasing with protist growth rates (Fig. 1.3). As an exception, in
the treatment with actively growing S. alaskensis bacterial growth exceeded mortality,
though a tendency towards lower bacterial growth with increased protist growth was still
observed (Fig. 1.3C, F). In control treatments, with the exception of actively growing
bacteria, and test treatments where no protist growth was detected, bacterial loss rates

Grazing vulnerability of carbon starved bacteria 41
remained around 0 h‐1 (the average value for all control treatments was 0.0009 ± 0.005 h‐1,
and 0.004 ± 0.01 h‐1 for treatments were no protist growth was detected).
1.4. Discussion
Methodological aspects
In the present study, we compared the growth of a bacterivorous flagellate, C.
roenbergensis, on three model bacterial strains harvested in different physiological states,
carbon‐starved, non‐growing and exponentially growing. To ensure that bacteria had
remained in the desired physiological state throughout the duration of the experiment,
analysis was restricted to the first 36 – 40 h sampled and cell‐size was employed as an
indicator of change in the physiological state during the experiment. We recognize that by
employing this measure we potentially ignore certain effects that may occur prior to cell‐
size increase (i.e. changes in cell‐surface characteristics or excretion of certain substances).
However, the response of carbon starved bacteria to the appearance of a new carbon
source, for example by the regeneration of nutrients through protist feeding, is very fast
(Kjelleberg 1993; Morita 1997), and thus would soon be detected as shifts in the cell‐size
distribution of the population. This measure showed that the bacterial populations in
most cases retained a constant cell‐volume throughout the experiments and that a
significant difference was always maintained between the starved and non‐starved
treatments (Table 1.1).
At a bacterial strain level, mean cell‐volume values from the present experiments
were comparable to those reported previously, with the exception of S. alaskensis. This
strain was shown to have a constant small size of <0.1 µm3 in prior studies (Schut et al.
1993; Eguchi et al. 1996), whereas we observed a change from 0.16 µm3 in its carbon‐starved
state to 0.32 µm3 when growing. Nevertheless, the identity of the strain used was positively
confirmed by the 16S rRNA gene sequences (100% similarity) and similar increases in cell
size were also observed in other recent studies with this bacterium (L. Ting, pers. comm.),
indicating that there may be certain phenotypic changes in this strain compared to studies
performed in earlier years.
In the second experiment with P. angustum S14 as food source (ExpP.a.2) small
levels of contaminant bacteria were detected at the start of the experiments. However, this
contaminant remained after a final dilution of 1010 of the initial protist culture (after

42 Chapter 1
successive dilution steps) and the experimental results do not differ from those obtained
in ExpP.a.1, which employed an axenic culture. Therefore, we concluded that the
contaminant bacteria were likely not preferentially grazed upon by C. roenbergensis, and
appeared to have no effect on the experimental outcome.
Protist growth on starved vs. non‐starved bacteria
The results obtained in this study indicate species‐specific differences in the vulnerability
of carbon starved bacteria, even among the closely related strains P. angustum and V.
vulnificus (Ruimy et al. 1994). C. roenbergensis grew well on all three bacteria in their non‐
starved state, achieving maximal growth rates which were in the range of those previously
reported for this flagellate (González et al. 1993). In contrast, marked differences were
observed when comparing protist growth on starved vs. non‐starved cells of each bacterial
strain.
C. roenbergensis exhibited equal growth when offered a comparable amount of
starved and non‐starved cells of P. angustum (Fig. 1.2A, B), indicating that the bacterium
was an equally good food source for the flagellate in both physiological states, and that no
apparent resistance mechanisms existed. Higher threshold values for starved bacteria and
the tendency towards higher Ks values (Table 1.2) could even point towards a slightly
better nutritional quality in this physiological state. A higher growth efficiency of
flagellates when feeding on starved bacteria was also demonstrated in a previous study
(González et al. 1993). Furthermore, the results obtained with P. angustum are also
evidence that there is not necessarily an energetic constraint for flagellates feeding on
smaller prey particles. This is contrary to observations from an earlier study (Boenigk et al.
2006), which found lower flagellate growth rates on smaller sized bacteria. However, in
their study different bacterial strains were compared instead of different sized cells of the
same strain, which makes other effects possible, such as inter‐specific variations in food
quality and grazing resistance. Also, differences in the behaviour of the protist species
studied should be considered.
In contrast to P. angustum, starved V. vulnificus did not support flagellate growth
and protist numbers declined strongly in the first 27 h, except at the highest bacterial
concentration tested. This drastic negative response at low prey concentrations is too
strong to be due to a simple starvation response caused by a decrease in food quality
(Fenchel 1987) and suggests the presence of bacterial resistance or repellent mechanisms.
As we did not analyze the bacteria‐protist interactions in detail, e.g. by live video

Grazing vulnerability of carbon starved bacteria 43
microscopy (Boenigk & Arndt 2000), we do not know at which stage of the feeding process
V. vulnificus resisted grazing. Potentially, ingestion of bacteria could be avoided due to
receptor‐mediated repellent effects (Matz et al. 2002); there could be postingestional
mechanism involved, causing ingested bacteria to be egested after entering the food
vacuoles (Boenigk et al. 2001) or allowing them to undergo the vacuole passage without
being harmed by digestive enzymes (King & Shotts 1988; Barker & Brown 1994); or
antiprotozoal factors could be produced at different stages of the feeding process, as has
been seen for Vibrio cholerae during biofilm formation (Matz et al. 2005).
The observed exception to the overall pattern with V. vulnificus as prey, namely the
positive protist growth at the highest bacterial concentration, would need further
examination. The drastic negative response of the flagellates at lower bacterial
concentrations does not support the explanation of a compensation of low food quality by
a much higher food concentration. As a possible alternative, it remains to be examined
whether high concentrations of this bacterial strain trigger regulatory shifts, e.g., by
components involved in quorum sensing, known to affect both virulence and the
starvation survival response in Vibrio strains (McDougald et al. 2000, 2001, 2003; Brackman
et al. 2009). Nevertheless, this is, to my knowledge, the first documented case of a
bacterial strain which can change from a highly edible to an unpalatable food when
entering the starvation state.
Finally, C. roenbergensis also exhibited differences in growth when fed on different
concentrations and biovolumes of the three physiological states of S. alaskensis. However,
in contrast to the experiment with V. vulnificus, no deleterious effect on the protists was
observed. The observed reduction in growth likely points to a gradual decrease in food
quality from actively growing to carbon starved cells. It has been shown that both
ingestion (Shannon et al. 2007) and growth rates (Grover & Chrzanowski 2009) of
bacterivorous flagellates are affected by the nutritional quality of the bacterial prey,
although, in these studies, mainly a variable C:N:P stoichiometry of the offered bacterial
strains was taken into account.
1.5. Conclusions and outlook
In the present study, using predator‐prey model systems, we show 1) that miniaturization
of cell size alone is not sufficient to lower grazing vulnerability; and 2) some bacterial
strains could possess efficient, yet to be examined, defence mechanisms that accompany
44 Chapter 1
the starvation‐survival programme and result in drastic changes their edibility. As future
work, the following points remain to be elucidated to determine the relevance and
universality of the model systems used in this study:
o Further model systems should be tested, including different bacterial phylogenetic
groups and grazers, in order to discern general patterns in the effect of bacterial
carbon starvation on grazing vulnerability
o Comprehensive studies of the underlying mechanisms should be carried out in
cases where decreased vulnerability of carbon‐starved bacteria is observed, such as
in the present study with V. vulnificus as food source.
o Adequate methodologies should be developed to assess the prevalence of the
carbon starvation state in natural bacterial communities and its impact on grazer
vulnerability. Furthermore, the effect of a varied prey pool (different bacterial
strains in different physiological states) on prey vulnerability and prey selectivity
should be analyzed in detail to obtain an accurate vision of what occurs in natural
environments.

Chapter 2
Protist abundance, diversity and
bacterivorous role in suboxic
and anoxic waters of the central
Baltic Sea

Baltic Sea redoxcline protist communities 47
Abstract
Barrier zones between oxic and anoxic water masses (pelagic redoxclines) host highly
active prokaryotic communities that mediate important biochemical transformations.
However, much less is known on the composition and ecological role of protists in these
zones. In the present study we addressed this topic for two central Baltic Sea redoxclines,
sampled during cruises in 2005, 2008 and 2009. A combination of microscopy and
experimental community manipulation techniques were used to analyse the distribution
of different protist groups throughout the redoxcline, and assess the relative importance of
protist bacterivory and viral lysis as prokaryotic mortality factors. The results obtained
revealed strong and consistent shifts in dominating protist groups along the redox
gradient. Small ciliates (Strombidium c.f.) and dinoflagellates dominated the protist
community at suboxic depths (≤30 μM O2), while larger ciliates (Mesodinium spp.,
Metacystis spp., Coleps c.f. and unidentified morphotypes) formed a peak in abundance at
the oxic‐anoxic interface. In sulphidic waters, protist abundance was very low, represented
by only few morphotypes (e.g. Metacystis spp.). Prokaryotic mortality was dominated by
protist grazing in suboxic and oxygen / hydrogen sulphide interface depths (50 – 80 % of
prokaryotic standing stock per day, compared to 2 – 20 % of virally infected cells), with
ciliates and, occasionally, dinoflagellates, but not heterotrophic nanoflagellates, acting as
the major bacterivores. In upper sulphidic depths, however, grazing was below the
detection limit and the frequency of virally infected cells decreased, leaving the major
prokaryotic mortality factor an open question.
2.1. Introduction
Protists have long been recognized as fundamental components of microbial food‐webs in
oxygenated marine and freshwater environments (Sherr & Sherr 2002; Pernthaler 2005).
Phototrophic unicellular eukaryotes can contribute a significant fraction of primary
production (Worden & Not 2008), whereas phagotrophic protists, especially heterotrophic

48 Chapter 2
nanoflagellates (HNF), regulate the abundance, activity and composition of prokaryotic
communities (Jürgens & Matz 2002; Montagnes et al. 2008). Additionally, they act as
important agents in nutrient re‐mineralization (Sherr & Sherr 2002); and, as prey, serve as
a fundamental link to higher trophic levels (Zöllner et al. 2009). However, despite this
acknowledged importance, their abundance and ecological role in other environments,
such as sediments or suboxic (≤30 μM O2) and anoxic water masses, remains understudied.
One such environment of special interest is the barrier between oxic and anoxic
zones, also termed redoxcline. Here, steep geochemical changes are mirrored by different
modes of microbial physiology, with prokaryotes conducting important roles in
biogeochemical processes such as chemoautotrophic production (Taylor et al. 2001; Jost et
al. 2008), denitrification and ammonia oxidation (Hannig et al. 2007; Labrenz et al. 2010;
Lliros et al. 2010), and sulphur cycling (Jannasch et al. 1991; Jørgensen & Bak 1991).
Estimated growth rates for chemoautotrophic prokaryotes in these zones are substantial,
with doubling times in the range of 1 – 2 days, estimated for both the Cariaco Trench
(Taylor et al. 2006) and the Baltic Sea (Jost et al. 2008). However, prokaryotic abundance
tends to remain relatively constant, implying loss processes equivalent to new biomass
production (Taylor et al. 2006). For oxic water masses it’s known that sedimentation is
generally negligible (Güde 1986), but biological agents, such as protist grazing or viral
lysis, can be major loss factors for prokaryotic production (Suttle 1994; Fuhrman 1999;
Sherr & Sherr 2002). However, so far only few studies have been conducted assessing this
topic in oxygen‐deficient environments.
The existence of protist taxa occurring primarily or exclusively in suboxic or anoxic
environments has long been known (Lauterborn 1901; Fenchel et al. 1977). Classical
microscopical studies, conducted in marine and freshwater systems, revealed an increased
protist abundance in suboxic waters and oxygen / hydrogen sulphide interfaces (Fenchel
et al. 1990; Zubkov et al. 1992; Massana & Pedrós‐Alió 1994); and a shift in the community
towards anoxic / sulphidic waters, with the appearance of different taxonomic groups
compared to oxygenated upper layers (Zubkov et al. 1992; Fenchel et al. 1995). Deeper
anoxic waters were shown to possess very low protist abundances, with many taxa forming
symbiotic relationships with prokaryotes (Fenchel et al. 1977). The subsequent application
of 18S rRNA gene‐based techniques revealed an unexpected richness of anaerobic protistan
communities, and uncovered the existence of novel, uncultivated taxa (Stoeck & Epstein
2003; Behnke et al. 2006; Edgcomb et al. 2011b). However, the functional role and grazing
impact of these protists remains largely unknown. The constraints imposed by these

Baltic Sea redoxcline protist communities 49
environments on obtaining accurate grazing rates has led to a scarcity of studies, which
are additionally hard to compare due to the different methodologies employed and
environments analysed. Grazing estimates range from over 100 % of prokaryotic
production consumed per day (e.g., Cuevas & Morales 2006)) to below 5 % (e.g., Bettarel et
al. 2004)) (see Table I in the introduction) . Thus, no consistent picture appears on the
relevance of protist grazing as a loss factor for prokaryotic communities in suboxic and
anoxic water masses.
Viral lysis, the other major potential biological loss factor, is even more understudied
for oxygen‐deficient systems. Existing estimates on mortality due to viruses are scarce and
variable, ranging from <5 % to 50 % of prokaryotic production, sometimes even within the
same study (Bettarel et al. 2004). However, a tendency has been observed for an increased
importance of viral lysis in anoxic waters for certain systems (Weinbauer & Höfle 1998;
Weinbauer et al. 2003). This, in combination with studies in other environments (e.g.,
Breitbart et al. 2004), has led to the general hypothesis that in more extreme environments
(with regard to abiotic factors such as oxygen or salinity) there occurs a shift in the major
prokaryotic mortality factor from protist grazing to viral lysis (Pedrós‐Alió et al. 2000).
In the present study we focused on the redoxclines of the Baltic Sea, one of the
worlds´ largest brackish environments. A stable halocline, situated at 60 – 80 m depth,
limits vertical mixing and separates the water column into an upper oxygenated layer and
a bottom oxygen depleted layer which becomes anoxic and sulphidic in the deepest zones
(Reißmann et al. 2009). The euphotic zone of the Baltic Sea proper extends only to 10 – 30
m depth (Sandén & Håkansson 1996; Aarup 2002; Wasmund et al. 2005), with the deeper
oxic / anoxic transition zones of the central basins being therefore located at aphotic
depths. Occasional inflow events of high salinity water from the North Sea, the last of
which occurred in 2002 and 2003 (Feistel et al. 2004), cause oxygenation of the anoxic
deep basins. Stagnation periods between inflow events can last more than ten years, and
the magnitude varies, generally affecting only some basins (Matthäus 2006). The highly
active prokaryotic communities of Baltic Sea pelagic redoxclines have been well
characterized (Grote et al. 2007; Labrenz et al. 2007; Glaubitz et al. 2009). However, scarce
data exist on the composition of redoxcline protist communities and viral assemblages,
with most studies covering only 2 or 3 suboxic or anoxic depths (Mamaeva 1988; Setälä &
Kivi 2003; Weinbauer et al. 2003; Stock et al. 2009), and only two studies covering the
suboxic and anoxic zone of Gotland Deep in more detail (Setälä 1991; Detmer et al. 1993).

50 Chapter 2
Additionally, to my knowledge, no studies exist for Landsort Deep, the deepest and most
stably stratified basin in the Baltic Sea.
The aim of the present study was three‐fold. (1) Characterize, quantify and compare
the protist communities at the oxic / anoxic transition zone of two deep basins in the
central Baltic Sea, Gotland Deep (249 m depth) and Landsort Deep (459 m), during three
different sampling campaigns conducted in 2005, 2008 and 2009. (2) Estimate grazing
rates and assess the bacterivorous importance of different protist functional groups in
three different zones with differing physico‐chemical characteristics: suboxic (≤ 30 μM
O2), oxygen / hydrogen sulphide interface (oxygen and hydrogen sulphide coexist or are
both below detection), and upper anoxic / sulphidic waters (detectable sulphide and no
detectable oxygen). (3) Compare these rates to prokaryotic mortality due to viral lysis.
2.2. Materials and methods
Study sites, sampling and measurement of physico‐chemical parameters
Table 2.1. List of samples and experiments conducted during the three cruises in 2005, 2008 and
2009. W: whole water column, R: redoxcline in higher resolution, C: chemocline, S: sulphidic
zone, L: Landsort Deep, G: Gotland Deep (e.g. WRL: whole water column and redoxcline of
Landsort Deep)
Year 2005 2008 2009 Profiling Viruses ‐ ‐ WRL, WRG Prokaryotes RL, RG WRL, WRG WRL, WRG Protists <10 μm in length WL RL, RG RL, RG Protists >10 μm in length RG (x2) RL, RG RL, RG Taxonomic identification Flagellates WL, WG ‐ ‐ Ciliates CG, SL ‐ ‐ Determination of protist grazing ‐ ‐ RL, RG Determination of viral impact ‐ ‐ RL, RG
Sampling was conducted in the central Baltic Sea at Landsort Deep (station 284; 58°
35.0´ N; 18° 14.0´ E) and Gotland Deep (station 271; 57° 19.2´ N; 20° 03´ E) on board the R.V.
Alkor in May 2005, R.V. Poseidon in August 2008, and the R.V. Maria S. Merian in
September 2009. For an overview of the sampling and experiments conducted in each year

Baltic Sea redoxcline protist communities 51
and station see Table 2.1. Water was collected in 5 l or 10 l free‐flow bottles attached to a
conductivity, temperature and depth rosette (CTD) with a coupled oxygen sensor.
Inorganic nutrients, oxygen and hydrogen sulphide were measured immediately on board
according to standard methods (Grasshoff et al. 1983). Whole water column depth
profiling was conducted at 10 – 50 m depth intervals from the surface to just above the
sediments, and high resolution redoxcline depth profiles were conducted at 2 – 5 m
intervals around the chemocline. In cases were samples were not immediately fixed, only
the first 5 l of 10 l free‐flow bottles were employed, to avoid oxygen contamination during
emptying of the free‐flow bottles.
Determination of prokaryotic and virus abundance
For prokaryotic cell counts, 5ml samples were fixed immediately after retrieval with a
mixture of paraformaldehyde and glutaraldehyde (1 % and 0.05 % final concentration,
respectively), flash‐frozen in liquid nitrogen and stored at ‐80 °C until analysis. For viral
counts the same procedure was used, but employing glutaraldehyde (0.5% final
concentration; 2‐4 ml sample volume) as fixative. Subsequently, thawed samples were
stained with SYBR Green I (Invitrogen‐Molecular Probes) and abundance was determined
by flow‐cytometry. For prokaryotes, cell‐counts were determined on a FACScalibur
(Becton Dickinson) flow cytometer as previously described (Gasol et al. 2004) and data
analysis was conducted on Cell Quest Pro software (BD Biosciences). Virus abundance was
determined on a FACSAria II (Becton Dickinson) flow‐cytometer as previously described
(Brussaard 2004) and data analysis was performed using FACSDiva software (version 4.1;
Becton Dickinson). Prokaryotic abundance is the result of single measurements while viral
abundance is given as the average of duplicate measurements. Prokaryotic biomass was
estimated by applying the conversion factor of 20 fg C cell‐1 (Lee & Fuhrman 1987).
Determination of protist abundance and biomass estimations
For protists <10 µm in length (mainly heterotrophic nanoflagellates (HNF)), 100 ml
samples were fixed immediately after retrieval in brown glass bottles with a final
concentration of 1 % particle free formaldehyde (in 2008 and 2009) or 1.25 %
glutaraldehyde (in 2005) at 4 °C for 2‐24 h. Subsamples were then filtered onto black
polycarbonate filters (Nuclepore; 0.8 µm pore‐size; Whatman) and frozen until analysis.
Upon thawing, filters were stained with DAPI (0.01 mg ml‐1 final concentration) and
52 Chapter 2
observed under a Zeiss Axioskop 2 mot plus epifluorescence microscope (Carl Zeiss
MicroImagimg). A minimum of 100 cells per filter were counted at a magnification of 630
X using filter set 02 (Carl Zeiss MicroImagimg). Two major size‐classes were distinguished
during cell counts, consisting of HNF above and below 3 μm in diameter. Within the first
group, choanoflagellates were clearly distinguishable and, thus, were counted as a separate
group.
For protists >10 µm in length (mainly ciliates and dinoflagellates), 200 ml samples
were fixed immediately after retrieval with acid lugol (Willen 1962) (1 % final
concentration) and stored in brown glass bottles at room temperature, in the dark. Protists
were later concentrated by sedimentation of the lugol fixed samples in 100 ml
sedimentation chambers for a minimum of 24 h (Uttermöhl 1958) and counted at a
magnification of 200 X under an Axiovert S100 inverted microscope (Carl Zeiss
MicroImagimg). Between ten diagonal stripes and the whole counting chamber were
enumerated, depending on protist abundance. Major groups were distinguished during
counting, both for dinoflagellates and ciliates, based on morphological characteristics.
However, due to the difficulty of proper protist taxonomic identification in lugol‐fixed
samples, these represent morphotypes resembling known groups or taxa and, in the
following, will be abbreviated with c.f..
Protist biomass was estimated for each of the protist groups distinguished in the
cruises in 2008 and 2009. For this, size‐classes were established, and individual cells
volumes were determined through geometric models for representative cells of each
morphotype and size‐class. Volume to mass conversion factors were then applied of 220 fg
C / μm3 for HNF, 125 fg C / μm3 for dinoflagellates and 190 fg C μm3 for ciliates, as
previously described for fixed samples (Børsheim & Bratbak 1987; Putt & Stoecker 1989;
Pelegri et al. 1999). The total biomass for each group was obtained by multiplying the
individual cell mass by the respective cell count.
Protist taxonomic identification
In 2005, samples were taken for the taxonomic identification of flagellates and ciliates.
Flagellates were identified through a combination of live observation and electron
microscopy, with reference to previous literature (e.g., Bernard et al. 2000). Live samples
were collected by concentrating sea water through reverse filtration (0.2 µm membrane
filter; Millipore GmbH) in a hermetically‐sealed box with a nitrogen atmosphere at 4 °C.
Concentrated samples were then placed inside a 1 ml transparent glass chamber,

Baltic Sea redoxcline protist communities 53
hermetically sealed with a cover slip, and observed, directly on board, using phase contrast
and magnifications of 360X and 630X, under an Axiovert 40 CFL inverted microscope (Carl
Zeiss MicroImagimg). Additionally, individual flagellate cells were isolated by means of a
specially constructed micropipette (Zhukov & Balonov 1979), and cultured in 96‐well
plates or petri‐dishes, with sterile autoclaved Baltic Sea water as medium and
Pseudomonas putida MM‐1 as food source. Dried whole mount preparations of these
flagellates were later examined with a JEM‐1011 transmission electron microscope (JEOL
Ltd.; Tokyo, Japan) as previously described (Moestrup & Thomsen 1980).
For ciliate identification, 40 – 50 l of sea water were concentrated by filtration
through a 10 µm mesh size plankton net, avoiding contact with air, and stored at 4°C. The
concentrated material was then transported on ice back to the laboratory, where the
taxonomic composition of ciliates was determined. Although it’s likely that through this
approach only the more abundant and robust taxa remained, sufficient ciliate cells could
be retrieved to be studied microscopically by live observations and using silver
impregnation methods as previously described (Foissner 1991).
Determination of protistan grazing on prokaryotes
In 2009, protist bacterivory was estimated at different depths throughout the redoxcline at
Landsort and Gotland Deep using an approach based on the disappearance of
fluorescently labelled bacteria (FLB) during incubation (Marrasé et al. 1992). FLB were
prepared before the cruise from Brevundimonas diminuta cultures as previously described
(Vázquez‐Domínguez et al. 1999).
Sampling depths were first selected from oxygen and turbidity profiles recorded by a
CTD cast directly prior to that used to obtain water for the experiments. Selected depths
corresponded to suboxic, oxygen / hydrogen sulphide interface, and upper sulphidic
conditions. Immediately upon arrival of the water on deck, acid cleaned, 500 ml bottles
with narrow necks were filled directly from the free‐flow bottles, with at least half a
minute of overflow. FLB were immediately added to a concentration of 10 ‐ 20 % of in situ
prokaryotic abundance, and the bottles were quickly closed with glass stoppers, avoiding
any head space or air bubbles. Incubations were performed approximating in situ
conditions (4 °C and in the dark) for 24 hours. To avoid oxygen contamination during sub‐
sampling, separate sets of triplicate bottles were prepared for the two sampling points (0 h
and 24 h). Controls to test for stability of added FLB under the physico‐chemical
conditions present and in absence of grazers (removed by filtration through a 1 µm pore‐

54 Chapter 2
sized filter (Nuclepore, Whatman)), were carried out repeatedly at different depths in both
study sites in August 2008.
Fixation for protist and prokaryote samples, and protist quantification were carried
out as described above. Prokaryote and FLB enumeration was conducted by
epifluorescence microscopy. For this, subsamples were filtered onto black polycarbonate
filters (Whatman; pore width, 0.2 μm) and stained with DAPI. Samples were then
observed under a Zeiss Axioskop 2 mot plus microscope (Carl Zeiss MicroImagimg), and a
minimum of 200 cells per sample or 50 fields were counted at a magnification of 1000 X
using filter set 02 for total prokaryotes and 09 for FLB (Carl Zeiss MicroImagimg).
Protist grazing rates on the natural prokaryotic community were derived from the
data following the previously described exponential model (Salat & Marrasé 1994), with
slight modifications to account for the fact that initial and final replicates proceeded from
different incubation bottles. First, an average net prokaryotic growth for the three
replicates (a) was obtained at each depth as:
a = (1 / t) x ln (Nt / N0)
where t is the incubation time, and N0 and Nt are the average initial and final prokaryotic
abundance, respectively, for the three replicates at each depth.
Next, a specific grazing rate on FLB (g) was obtained for each replicate at each depth
as:
g = ‐ (1 / t) x ln (Ft / F0)
where t is the incubation time, F0 is the inoculated FLB abundance and Ft is the final FLB
abundance measured for each replicate. The inoculated FLB abundance was obtained as
the average FLB abundance for all initial replicates at all depths. This latter measure was
possible since all flasks were inoculated with the same volume from the same FLB stock,
resulting in the same average initial FLB abundance for all three depths (ANOVA; P >
0.05).
Since a ≠ 0 (see Salat & Marrasé 1994), the grazing rate on the natural prokaryotic
community (G) was obtained for each replicate at each depth as:
G = (1/t) x (g / a) x (Nt ‐ N0)
For each replicate, the corresponding g value and the a value for that depth was used. G
values were then transformed into prokaryotes consumed ml‐1 day‐1, and the percentage of

Baltic Sea redoxcline protist communities 55
the prokaryotic standing stock grazed per day was calculated for each replicate at each
depth.
Examination of protist food vacuole contents
The bacterivorous potential of different protist groups was qualitatively assessed through
the observation of presence / absence of FLB inside food vacuoles at the end of the grazing
experiments, and through Catalyzed Reporter Deposition ‐ Fluorescence In Situ
Hybridization (CARD‐FISH) targeting prokaryotes inside food vacuoles. FLB detection was
carried out using the microscopy samples employed for the quantification of heterotrophic
nanoflagellates (0.8 μm filters (described above); filter set 09 for detection). Samples for
CARD‐FISH (200 ml) were obtained from different depths throughout the redoxcline,
parallel to the microbial profile sampling, and fixed immediately after retrieval with the
alkaline lugol solution – formalin – thiosulphate method (Sherr & Sherr 1993a; Medina‐
Sánchez et al. 2005). The complete volume was then filtered onto polycarbonate filters
(Nuclepore; pore‐size, 2.0 µm; 47 mm diameter; Whatman) which were subsequently
frozen. CARD‐FISH was later carried out employing a modified version of an established
protocol (Medina‐Sánchez et al. 2005), which excluded the permeabilization step with
achromopeptidase since it severely damaged protist cell integrity. Eubacteria were
detected using probes EUB 338 I, II and III (1:1:1 mix) (Daims et al. 1999); and
Crenarchaeota with probe Cren537 (Teira et al. 2004). We targeted Crenarchaeota since
they are major constituents of the redoxcline prokaryotic communities in the central Baltic
Sea, constituting up to 25 % of total cell counts (Labrenz et al. 2010).
Estimation of the frequency of virally infected prokaryotic cells (FIC)
FIC was determined for different depths throughout the redoxcline using a virus‐dilution
approach (Wilhelm et al. 2002). Specifically, water samples (2 l) were filtered (Isopore;
pore‐size, 3 µm; diameter, 47 mm; Millipore) to remove larger planktonic organisms. The
prokaryotes contained in the filtrate were then concentrated (45 ‐ 60 ml final volume)
using a tangential‐flow filtration device with a pore‐size of 0.22 µm (Vivaflow 200,
polyethersulfone, Sartorius Stedim). The viruses contained in this second filtrate were
subsequently removed using a tangential‐flow filtration device with a molecular weight
cut‐off of 100 kDa (Vivaflow 200, polyethersulfone, Sartorius Stedim) yielding virus‐free
water. In order to estimate FIC due to lytic viruses, duplicate aliquots of the prokaryotic

56 Chapter 2
concentrate (10 – 15 ml) were dispensed into tightly sealable polypropylene tubes and
filled‐up to a total volume of 50 ml with virus‐free water from the same station and depth.
FIC due to lysogenic viruses was determined by inducing them in a second set of duplicate
experiments through the addition of Mitomycin C (1 µg ml‐1 final concentration; Sigma
Aldrich). Incubations were performed in the dark at 18°C for up to 30 hours and
subsamples to determine prokaryotic and viral abundance were taken every 4–5 hours.
Samples for virus abundance were fixed and enumerated as described above.
Samples for prokaryote abundance were fixed with glutaraldehyde (0.5 % final
concentration) and quantified on a FACSAria II (Becton Dickinson) flow cytometer as
previously described (Marie et al. 1999). FIC due to lytic viruses was calculated based on
the increase in viral abundance in the unamended incubations, assuming a burst size of 30
viruses per lysed prokaryotic cell for suboxic waters and 90 for oxygen / hydrogen sulphide
interface and anoxic waters (Weinbauer et al. 2003; Winter et al. 2004). FIC due to
lysogenic viruses was calculated as the difference between the results from Mitomycin C‐
amended and unamended incubations (Weinbauer et al. 2003). A significant detection of
FIC due to lysogeny was only considered when results for Mytomycin C treatments were
higher than results from unamended incubations (taking the variation of the duplicate
estimates into account).
2.3. Results
Physico‐chemical characteristics and prokaryote abundance
During all three cruises both study sites had clearly stratified water columns with anoxic
bottom waters (Fig. 2.1). The conditions in both basins in 2008 and 2009, and at Landsort
Deep in 2005 (Fig. 2.1; physico‐chemical data for Landsort Deep in 2005 are not shown)
resembled those generally observed in Baltic Sea redoxclines (e.g. Detmer et al. 1993; Jost
et al. 2008). However, Gotland Deep in 2005 was still under the influence of the 2003
inflow event (Feistel et al. 2004), and the chemocline, defined as the zone of first hydrogen
sulphide appearance, was located close to the sediment (Fig. 2.1). Conversely, in 2005 the
beginning of the suboxic zone (~30 μmol l‐1 oxygen) was located at similar depths as in the
other two years, leading to a much wider redoxcline. Prokaryote abundance, measured in
2008 and 2009 for the whole water column, was highest in surface waters at both study
sites, but a second smaller peak could often be observed at or just below the chemocline

Baltic Sea redoxcline protist communities 57
(Fig. 2.1, 2.2, 2.3). Typical prokaryotic abundances for the redoxcline ranged between 0.2 –
2 x 10⁶ cell ml‐1.
A
0 100 200 300 400
Dep
th (m
)
0
100
200
300
400
Prokaryotes
(105 cell ml‐1)
0 4 8 12 16
O2H2S Prokaryotes
B
O2, H2S (µmol l‐1)
0 100 200 300 400
0
50
100
150
200
250
Prokaryotes
(105 cell ml‐1)
0 10 20 30
C
0 150 300 450
0
50
100
150
200
250
O2, H2S (µmol l‐1)O2, H2S (µmol l‐1)
Figure 2.1. Examples of vertical profiles for oxygen, hydrogen sulphide and prokaryote
concentrations from the surface to just above the sediment (indicated by the shaded area), taken
at Landsort Deep in 2009 (A) and Gotland Deep in 2009 (B) and 2005 (C). The dashed line
represents the chemocline, defined as the zone of first hydrogen sulphide appearance.
Protist abundance and community composition throughout the redoxcline
In 2008 and 2009, ciliates and/or dinoflagellates dominated protist biomass at both study
sites (Fig. 2.2). Ciliates reached their maximum abundance around the chemocline, while
dinoflagellates peaked in the suboxic zone, and thereafter practically disappeared. In 2005,
detailed redoxcline profiles were conducted only at Gotland Deep, concentrating on
depths around the chemocline, thus, missing the upper part of the suboxic zone (Fig. 2.3).
Dinoflagellates were not observed and ciliate abundance was lower than in the other two
years (maximum abundance 103 cells l‐1, compared to 4 x 10³ cells l‐1 in 2008 and 1.4 x 10⁴
cells l‐1 in 2009).

58 Chapter 2
Dep
th (m
)
80
90
100
110
O2 H2S
O2, H2S
(µmol l‐1)
0 20 40
Dep
th (m
)
70
80
90
100
110
120
Biomass
(10‐2 µg C ml‐1)
0 3 6 9
O2, H2S
(µmol l‐1)
0 20 40
90
100
110
120
130
140
Biomass
(10‐2 µg C ml‐1)
0 3 30
Prokaryote biomass HNF biomass Dinoflagellate biomass Ciliate biomass
115
120
125
130
135
Dinoflagellates
(cell ml‐1)0 20 40 60
Ciliates (cell ml‐1)
0 2 4 6 8 10 12 14
HNF
(102 cell ml‐1)
0 3 6 9
Prokaryotes
(105 cell ml‐1)
0 4 8 12 16
Ciliates (cell ml‐1)
0 5 10 15
Dinoflagellates
(cell ml‐1)0 2 4 6 8 10
Prokaryote abundanceHNF abundance Dinoflagellate abundanceCiliate abundance
HNF
(102 cell ml‐1)
0 3 6 9
Prokaryotes
(105 cell ml‐1)
0 2 4 6 8 10 12
A
B D
C
Figure 2.2. High resolution redoxcline profiles taken at Landsort Deep in 2008 (A) and 2009 (B),
and at Gotland Deep in 2008 (C) and 2009 (D), showing oxygen and hydrogen sulphide
concentrations, and prokaryote and protist biomass (bars) and cell‐counts (line/scatter plots).
The horizontal dashed line represents the chemocline. Please note the break in the X axis of C
and D middle panels.
Ciliate and dinoflagellate morphotype composition showed clear changes
throughout the oxygen gradient in both study sites (Fig. 2.3 & 2.4; the relative abundance
of different morphotypes for 2008 and 2009 were very similar, so only data from 2009 is

Baltic Sea redoxcline protist communities 59
shown here). Dinoflagellates were mainly represented in the suboxic zone by rounded
morphotypes with a diameter of 10 ‐ 25 μm (major axis) (Fig. 2.4). However, Dinophysis
spp. (data not shown) and elongated morphotypes (10 ‐ 30 μm in length) could also
become important at certain suboxic depths, and larger morphotypes (> 30 μm in length)
sometimes appeared at the oxygen / hydrogen sulphide interface and deeper anoxic
waters. When observed with epifluorescence microscopy only Dinophysis spp. showed
autofluorescence, suggesting a heterotrophic lifestyle for the majority of dinoflagellates
observed.
O2, H2S
(µmol l‐1)
0 12 24
Prokaryotes
(105 cell ml‐1)0 10 20
B
Ciliates
(cell ml‐1)
0.0 0.3 0.6 0.9
Metacystis sp.Metopus sp.Mesodinium sp.Tintinnopsis sp.Spathidium sp.Uronema sp.Unclassified
O2, H2S
(µmol l‐1)
0 12 24
Dep
th (m
)
180
185
190
195
200
205
210
215
220
Prokaryotes
(105 cell ml‐1)0 10 20
O2 H2SProkaryotes
A
Ciliates
(cell ml‐1)
0.0 0.3 0.6 0.9
C D
Figure 2.3. High resolution redoxcline profile of ciliate morphotype composition at Gotland Deep
on the 4th (A, B) and the 6th (C, D) of May 2005. Changes with depth in oxygen, hydrogen
sulphide and prokaryote concentrations (A, C) and in ciliate cell‐counts (B, D) are shown. The
horizontal dashed line represents the chemocline.
Ciliate morphotype composition showed stronger changes within the redox gradient
(Fig. 2.3 & 2.4). Strombidium c.f. (20 – 30 μm length) dominated the suboxic zone down to
oxygen concentrations of 5 – 6 μmol l‐1 in 2008 and 2009, but was not observed in 2005. At
lower oxygen concentrations, and before hydrogen sulphide levels increased, the
composition became dominated by Metacystis spp. (present as several different
morphotypes, ranging from 20 to 150 μm in length), Mesodinium c.f., and either Coleps c.f.
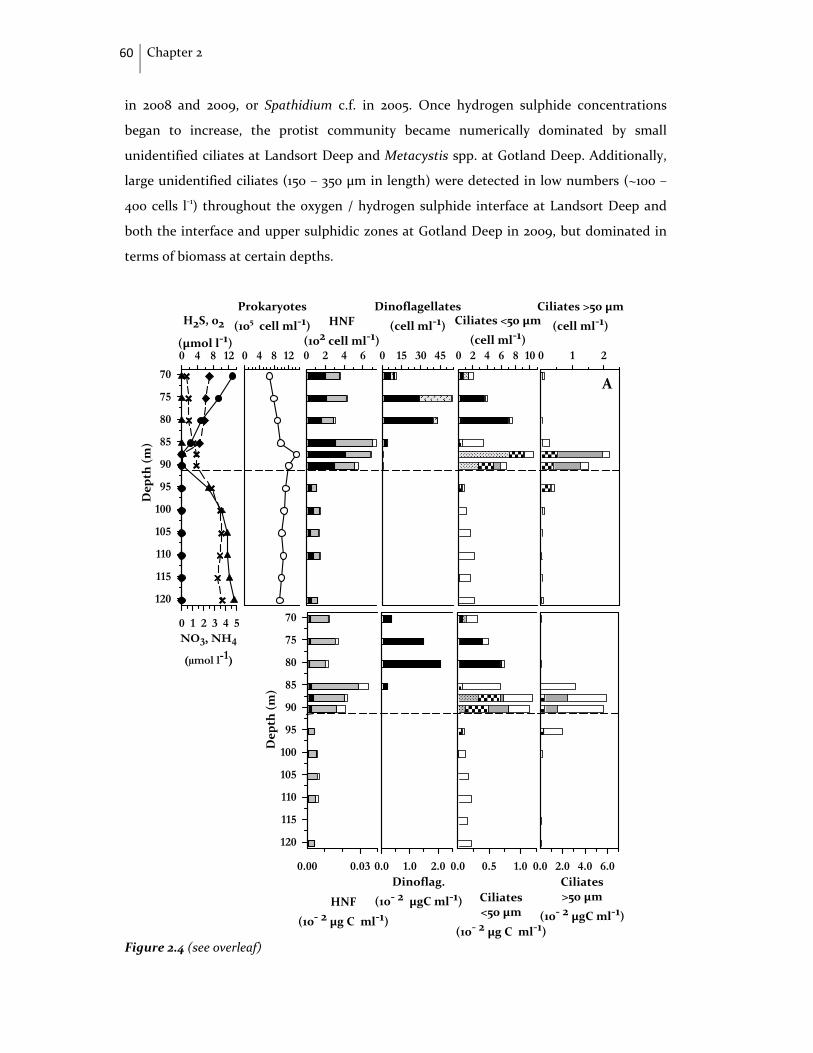
60 Chapter 2
in 2008 and 2009, or Spathidium c.f. in 2005. Once hydrogen sulphide concentrations
began to increase, the protist community became numerically dominated by small
unidentified ciliates at Landsort Deep and Metacystis spp. at Gotland Deep. Additionally,
large unidentified ciliates (150 – 350 μm in length) were detected in low numbers (~100 –
400 cells l‐1) throughout the oxygen / hydrogen sulphide interface at Landsort Deep and
both the interface and upper sulphidic zones at Gotland Deep in 2009, but dominated in
terms of biomass at certain depths.
Dinoflagellates
(cell ml‐1)
0 15 30 45
NO3, NH4
(µmol l-1)
0 1 2 3 4 5
Dep
th (m
)
70
75
80
85
90
95
100
105
110
115
120
H2S, 02
(µmol l‐1)0 4 8 12
Prokaryotes
(105 cell ml‐1)
0 4 8 12
Ciliates >50 µm
(cell ml‐1)
0 1 2
HNF
(102 cell ml‐1)0 2 4 6
Ciliates <50 µm
(cell ml‐1)0 2 4 6 8 10
A
Dinoflag.
(10‐ 2 µgC ml‐1)
0.0 1.0 2.0Ciliates>50 µm
(10‐ 2 µgC ml‐1)
0.0 2.0 4.0 6.0
HNF
(10‐ 2 µg C ml‐1)
0.00 0.03
Dep
th (m
)
70
75
80
85
90
95
100
105
110
115
120
Ciliates<50 µm
(10‐ 2 µg C ml‐1)
0.0 0.5 1.0
Figure 2.4 (see overleaf)

Baltic Sea redoxcline protist communities 61
Dinoflagellates
(cell ml‐1)
0 5 10
NO3 NH4
(µmol l‐1)
0 2 4 6
Dep
th (m
)90
95
100
105
110
115
120
125
130
135
140
02, H2S
(µmol l‐1)0 5 10 15
Prokaryotes
(105 cell ml‐1)
0 4 8 12
Ciliates >50 µm
(cell ml‐1)
0 1 2 3 4
HNF
(102 cell ml‐1)0 2 4 6
Ciliates <50 µm
(cell ml‐1)
0 2 4 6 8 10
B
Dinoflagellates
(10‐ 2 µg C ml‐1)
0.0 0.3 0.6
Ciliates>50 µm
(10‐ 2 µg C ml‐1)
0 6 12 20 40
HNF
(10‐ 2 µg C ml‐1)
0.00 0.03
Dep
th (
m)
90
95
100
105
110
115
120
125
130
135
140
Ciliates<50 µm
(10‐ 2 µg C ml‐1)
0.0 0.5 1.0
NO3 NH4O2 H2S
Prokaryotes Rounded 10‐25µmElongated 10‐30µmDinophysis sp.Uncl. >30µm
1.5‐3µm uncl. HNF3‐10µm uncl. HNFChoanoflagellates
Strombidium c.f.Mesodinium c.f.Metacystis spp.Coleps c.f.Unclassified
Figure 2.4. High resolution redoxcline profiles of protist morphotype composition at Landsort (A
(above)) and Gotland Deep (B (overleaf)), taken in September 2009. Changes with depth in
chemical parameters and in the cell‐counts (above) and biomass (below) of the different
microbial groups identified are shown. The horizontal dashed line represents the chemocline.
Protist sizes denote the cell length.

62 Chapter 2
H2S (µmol l‐1)0 10 20 30 40 50
Dep
th (m
)
0
100
200
300
400
O2 (µmol l‐1)0 200 400
H2SO2 trit.O2 sensorHNF
Dep
th (m
)
0
50
100
150
200
HNF (102 cell ml‐1)
0 5 10 15 20 25
Codo
siga sp
p.Sp
umella sp
.Pa
raph
ysom
onas sp
.
Bodo sa
ltans
Bodo curvifilus
Neobo
do designis
Rhyn
chom
onas nasuta
Helkesimastix fa
ecicola
Caecite
llus p
arvu
lus
Cilio
phyris in
fusion
um
Petalomon
as / Notosolen
us
Anc
yrom
onas sigm
oide
s
Hexam
ita sp
.Dep
ths s
ampled
A
B
Figure 2.5. Heterotrophic nanoflagellate abundance and observed taxa in May 2005 throughout
the whole water column at Landsort Deep (A) and Gotland Deep (B). The list of flagellate species
indentified is shown along with the depths at which they were detected (●), the total sampling
depths (gray romboids), and oxygen (measured by tritiation and by the oxygen sensor on the
CTD) and hydrogen sulphide concentrations (only available for Gotland Deep). With the
exception of HNF abundance, data were pooled for several different CTD casts. The dashed line
represents the chemocline.
HNF at the redoxcline peaked in abundance at the oxygen / hydrogen sulphide
interface in all years, but were insignificant in terms of biomass (Fig. 2.2, 2.4 & 2.5). The
community was represented equally, in terms of abundance, by larger (generally 3 – 6 μm
in diameter (major axis)) and smaller (1.5 – 3 μm) morphotypes, but the former dominated

Baltic Sea redoxcline protist communities 63
in terms of biomass (Fig. 2.4). Choanoflagellates were important components both
numerically and in terms of biomass at suboxic and oxygen / hydrogen sulphide interface
depths at Gotland Deep in 2008 and 2009, but represented only a small fraction of total
HNF at Landsort Deep.
Protist taxonomic identification
In 2005, a more precise taxonomic identification of ciliates and flagellates was carried out.
13 flagellate species were identified by means of light and electron microscopy (Fig. 2.5).
The examination of their presence / absence throughout different depths of both
redoxclines showed no strong differences between the two study sites. Most species had a
large vertical distribution, appearing from fully oxygenated waters to bottom anoxic
waters (e.g. Bodo curvifilus), and only a few appeared to be always restricted to anoxic
waters (e.g. Hexamita sp.).
Table 2.2. List of ciliate species identified in May 2005 through silver impregnation techniques,
and assessment of their presence (+) at different depths around the chemocline of Gotland Deep
and below the chemocline in Landsort Deep. For the genus Metacystis more than one
morphotype was identified, shown as Metacystis spp. 1‐5
Landsort D. Gotland D.
CTD‐cast 9th May 8th May 11th May 11th May
Depth (m) 253 404 200 202 200 203 201 204
Pleuronema sp. + + Holophyra sp. + + + + Metacystis spp. 1 + + + + + 2 + + + + + + 3 + + + + 4 + + + + + 5 + Cardiostomella sp. + + + + + + Mesodinium sp. + + Euplotes sp. + + Placus‐like n. gen. n. sp. + + Metopus sp. + Pelagiocama‐like n. gen. n. sp. +
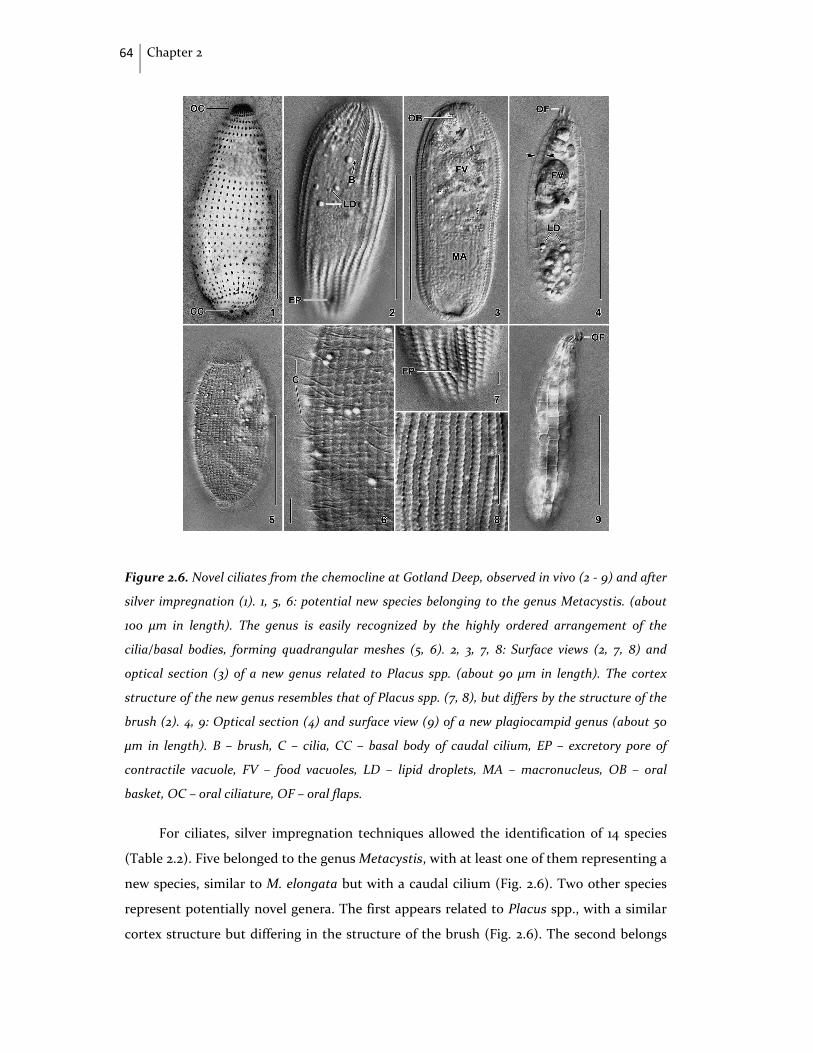
64 Chapter 2
Figure 2.6. Novel ciliates from the chemocline at Gotland Deep, observed in vivo (2 ‐ 9) and after
silver impregnation (1). 1, 5, 6: potential new species belonging to the genus Metacystis. (about
100 µm in length). The genus is easily recognized by the highly ordered arrangement of the
cilia/basal bodies, forming quadrangular meshes (5, 6). 2, 3, 7, 8: Surface views (2, 7, 8) and
optical section (3) of a new genus related to Placus spp. (about 90 µm in length). The cortex
structure of the new genus resembles that of Placus spp. (7, 8), but differs by the structure of the
brush (2). 4, 9: Optical section (4) and surface view (9) of a new plagiocampid genus (about 50
µm in length). B – brush, C – cilia, CC – basal body of caudal cilium, EP – excretory pore of
contractile vacuole, FV – food vacuoles, LD – lipid droplets, MA – macronucleus, OB – oral
basket, OC – oral ciliature, OF – oral flaps.
For ciliates, silver impregnation techniques allowed the identification of 14 species
(Table 2.2). Five belonged to the genus Metacystis, with at least one of them representing a
new species, similar to M. elongata but with a caudal cilium (Fig. 2.6). Two other species
represent potentially novel genera. The first appears related to Placus spp., with a similar
cortex structure but differing in the structure of the brush (Fig. 2.6). The second belongs

Baltic Sea redoxcline protist communities 65
to the family Plagiocampidae, as indicated by the characteristic positioning of finger‐like
oral flaps on the dorsal mouth margin, but differs from known genera of this family by the
unusual cortex consisting of large, quadrangular alveoli (Fig. 2.6).
Impact of protist grazing on redoxcline prokaryotic communities
Table 2.3. Data for the experiments to determine grazing and viral lysis. Prokaryotic and protist
abundance correspond to those from the start of the incubations, and are given as average values
with the standard deviation in parenthesis. Grazing rates are given as the average of triplicate
measurements with the standard deviation in parenthesis, while FIC (frequency of infected cells)
is the average of duplicate measurements, with the range in parenthesis. Zones: Sub: Suboxic; Int:
Interface; Sul: Sulphidic
Site Landsort Deep Gotland Deep
Depth (m) 65 70 80 110 125 130
Zone Sub. Int. Sul. Sub. Int. Sul.
Temperature (°C) 5.2 5.3 5.5 6.2 6.7 6.7
Salinity (‰) 9.6 9.7 10.1 9.3 9.3 9.3
O2 (μmol l‐1) 23.67 12.51 - 4.02 1 2.68 -
H2S (μmol l‐1) - 0.31 4.71 - 0.16 2.7
NO3 (μmol l‐1) 3.26 - - 1.23 1.51 -
NH4 (μmol l‐1) 0.43 0.23 3.31 0.67 0.35 1.58
Prokaryotes (105 cell ml‐1) 6.43 (1.28)
7.35 (0.35)
12.1 (0.47)
7.56 (0.49)
6.77 (0.47)
7.95 (1.29)
HNF (102 cell ml‐1) 3.32 (0.56)
4.56 (0.92)
2.61 (0.26)
5.24 (0.40)
1.51 (0.21)
0.95 (0.25)
Dinoflag. (103 cell l‐1) 3.56 (0.25)
6.05 (1.07)
0.47 (0.16)
0.59 (0.07)
1.89 (0.16)
0.26 (0.08)
Ciliates (103 cell l‐1) 4.03 (0.25)
3.71 (0.32)
2.67 (0.37)
2.17 (0.63)
3.42 (0.32)
3.45 (1.01)*
Net prok. growth (d‐1) - 0.23 - 0.18 0.14 0.01 - 0.19 0.31
Grazing rate (105 prok. ml‐1 d‐1)
5.19 (1.82)*
3.79 (0.80)*
4.58 (3.61)
1.92 (1.66)
3.32 (0.75) *
1.15 (1.45)
% prok. standing stocks d‐1
80.8 (28.3)
51.5 (10.9)
38.0 (22.0)
25.4 (22.0)
49.0 (11.1)
14.0 (18.2)
FIC (%) 19 (13–25)
3 (1.5–4)
2 (1.5–2.5)
6 (5–7)
2 (1.5-2.5)
3 (2.5-3.5)
1 Due to errors in the titration measurements, O2 values from the CTD sensor are shown instead; *Significant differences between initial and final cell‐counts (t‐test, P<0.05). In the case of the grazing rate, this refers to the initial and final abundance of FLB; (‐) Parameter was expected to be below detection limit and was not measured at this depth.

66 Chapter 2
FLB experiments were carried out at Landsort and Gotland Deep in 2009 in suboxic,
oxygen / hydrogen sulphide interface, and sulphidic waters (Table 2.3). The protist
communities observed resembled those seen in the profiles for zones of similar physico‐
chemical characteristics, with the exception of suboxic waters at Gotland Deep, where
Metacystis spp. was also detected (data not shown). No significant changes in protist
abundance occurred during the incubation, excepting at the sulphidic depth at Gotland
Deep (Table 2.3; t‐student, P<0.05), where a 50% reduction in protist numbers was
observed, mainly due to a decrease in Metacystis spp. abundance.
For FLB abundance, significant differences were detected between the initial and
final cell‐counts at the oxygen / hydrogen sulphide interface of both study sites and the
suboxic depth of Landsort Deep (Table 2.3; ANOVA, P<0.05). In all three cases calculated
grazing rates were high, resulting in the removal of 50 – 80% of the prokaryotic standing
stock per day. For the other three depths, the decrease in FLB abundance was not
significant due to small changes in cell‐counts (suboxic and sulphidic waters at Gotland
Deep) or a high variability between replicates at the final time point (sulphidic waters at
Landsort Deep). Control treatments showed no significant differences between initial and
final FLB abundance. Net growth of the natural prokaryotic community in presence of
grazers was only observed for sulphidic depths (Table 2.3). In suboxic and oxygen /
hydrogen sulphide interface waters rates were negative, indicating a decrease in
prokaryotic abundance over time, or were close to zero.
To assess potential bacterivory of the different protist functional groups, a
qualitative assessment of the presence / absence of FLB, Eubacteria, and Crenarchaeota
(the latter two detected by means of CARD‐FISH) was carried out in 2009 at both stations.
High percentages of HNF (22 – 63 %) contained FLB or Eubacteria and Crenarchaeota
throughout all depths of the redoxcline tested (Table 2.4). For ciliates and dinoflagellates,
not enough cells could be detected to obtain accurate percentages of cells containing FLB
or cells labelled through CARD‐FISH, but a qualitative assessment could be made. In this
sense, Strombidium c.f and large unidentified ciliates (150 – 350 μm long) detected at the
oxygen / hydrogen sulphide interface and sulphidic waters always contained large
numbers of FLB or Eubacteria and Crenarchaeota in their food‐vacuoles, dinoflagellates
generally contained Eubacteria and Crenarchaeota (FLB detection was not possible due to
fast fading of the fluorochrome signal and strong DAPI signal from the cells), Coleps c.f.
and Metacystis spp. contained less often FLB or Eubacteria and Crenarchaeota in their
food‐vacuoles, and none were ever detected inside Mesodinium sp.. However in this last

Baltic Sea redoxcline protist communities 67
case, cells always contained large quantities of autofluorescent pigments, which could
have masked the fluorescence of ingested, labelled cells. Additionally, large numbers of
potentially symbiotic Eubacteria and Crenarchaeota were detected in most ciliates on the
surface and / or in the cytoplasm at interface and sulphidic depths (data not shown).
Table 2.4. Percentage of HNF containing FLB or prokaryotes hybridized with Eubacteria‐ (EUB)
or Crenarcheota‐ (Cren) specific CARD‐FISH probes. The total number of HNF cells analyzed is
shown in parenthesis.
Landsort Deep Gotland Deep
Depth (m)
FLB EUB Cren Depth (m)
FLB EUB Cren
Profile 75 - 63.7 (80)
57.5 (80)
Profile 100 - 39.2 (79)
38.8 (80)
80 - 58.7 (80)
41.2 (80)
117.5 - 37.3 (75)
30.3 (67)
87.5 - 56.2 (80)
38.7 (80)
125 - 52.5 (80)
45.0 (80)
120 - 57.5 (40)
21.9 (41)
132.5 - 45.0 (60)
32.2 (62)
FLB Exp.
65 48.2 (83)
- - FLB Exp.
70 53.0 (83)
- -
70 46.2 (80)
- - 80 55.0 (80)
- -
80 22.9 (61)
- - 110 35.5 (76)
- -
Viral abundance and impact on the prokaryotic communities
Viral counts were highest in surface waters (Fig. 2.7), coinciding with the maxima in
prokaryotic abundance (Fig. 2.1) and then decreased and remained relatively constant
throughout the water column. However, no significant correlations were observed at
Gotland Deep between prokaryotic and viral abundance, and only a weak positive
correlation was observed at Landsort Deep (r: 0.410; Kendal‐Tau P<0.01). High‐resolution
profiles of the redoxcline showed no marked changes in total viral abundance (Fig. 2.7)
and again no significant correlations were observed with prokaryotic abundance. Virus to
prokaryote ratios ranged from 10 – 60 throughout the whole water column, with highest
values above the redoxcline. At the redoxcline itself, values remained relatively constant
(ratios 15 – 30).
The dilution experiments conducted in parallel to the grazing studies revealed
prokaryotic cells to be exclusively infected by lytic viruses. FIC was highest at suboxic
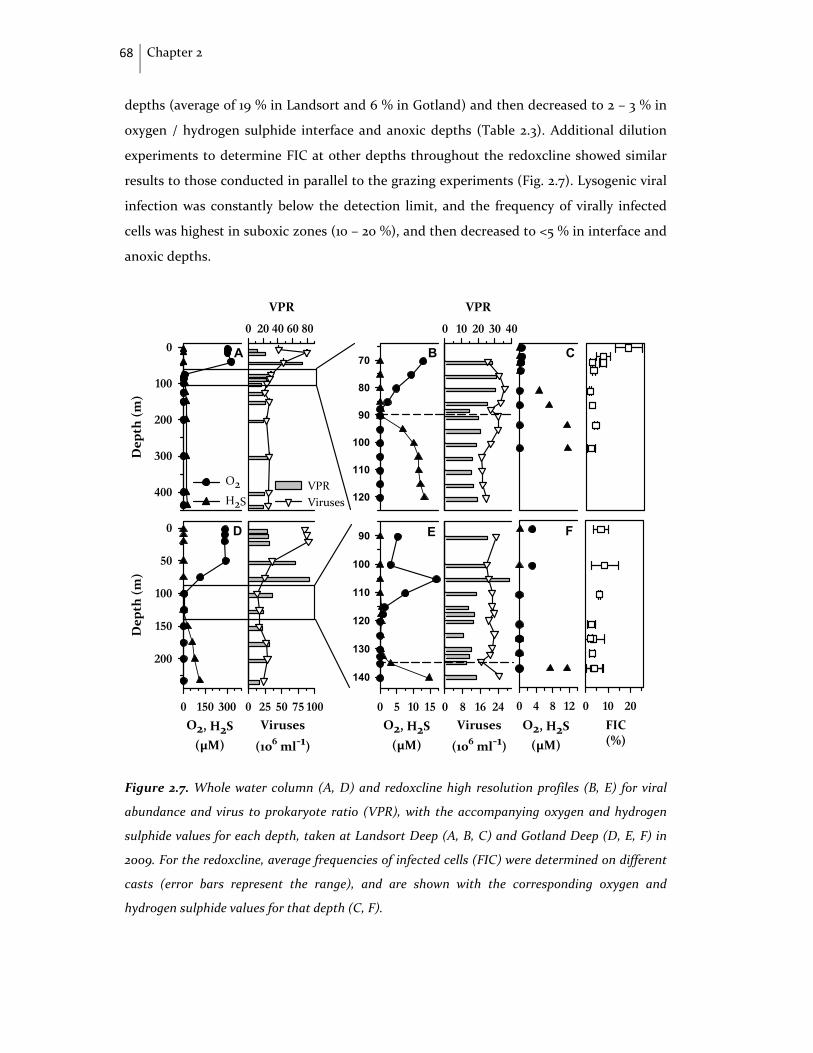
68 Chapter 2
depths (average of 19 % in Landsort and 6 % in Gotland) and then decreased to 2 – 3 % in
oxygen / hydrogen sulphide interface and anoxic depths (Table 2.3). Additional dilution
experiments to determine FIC at other depths throughout the redoxcline showed similar
results to those conducted in parallel to the grazing experiments (Fig. 2.7). Lysogenic viral
infection was constantly below the detection limit, and the frequency of virally infected
cells was highest in suboxic zones (10 – 20 %), and then decreased to <5 % in interface and
anoxic depths.
VPR
0 20 40 60 80
VPR Viruses
Viruses
(106 ml‐1)
0 25 50 75 100
O2, H2S(µM)
0 150 300
Dep
th (m
)
0
50
100
150
200
Dep
th (m
)
0
100
200
300
400O2H2S
70
80
90
100
110
120
VPR
0 10 20 30 40
O2, H2S(µM)
0 5 10 15
90
100
110
120
130
140
Viruses
(106 ml‐1)
0 8 16 24
A B C
O2, H2S(µM)
0 4 8 12
FIC(%)
0 10 20
D E F
Figure 2.7. Whole water column (A, D) and redoxcline high resolution profiles (B, E) for viral
abundance and virus to prokaryote ratio (VPR), with the accompanying oxygen and hydrogen
sulphide values for each depth, taken at Landsort Deep (A, B, C) and Gotland Deep (D, E, F) in
2009. For the redoxcline, average frequencies of infected cells (FIC) were determined on different
casts (error bars represent the range), and are shown with the corresponding oxygen and
hydrogen sulphide values for that depth (C, F).
Baltic Sea redoxcline protist communities 69
2.4. Discussion
Protist community composition analysis: methodological considerations
In the present study, we pooled results from three different sampling campaigns,
conducted in 2005, 2008 and 2009, to obtain a first view of the structuring and function of
Baltic Sea redoxcline protist communities. This was possible due to the overall stable
nature of deep pelagic redoxclines, with low influence of seasonality, allowing us to
compare results proceeding from different years and seasons. However, it should be taken
into account that in Baltic Sea redoxclines lateral intrusion of different water masses and
small‐scale mixing events occur (Lass et al. 2003), which can produce conditions not
normally found at the sampling depth tested (e.g. peak in oxygen at 105 m at Gotland Deep
in 2009 (Fig. 2.4)). Additionally, inflow events of North Sea water occur periodically,
oxygenating the anoxic basins and causing the redoxcline to retreat into the sediment
(Feistel et al. 2004). Both physical processes should be considered when comparing data
proceeding from different years, but, at least in the case of inflow events, constitute the
exception rather than the norm in these systems.
The analysis of the protist community composition was carried out using a
combination of microscopy techniques. Fixative solutions and quantification methods
were selected with regard to previous literature (reviewed in Sherr & Sherr 1993b), though
an optimal balance between protist preservation and quantification could not always be
maintained. In this sense, the lugol concentration employed in this study could have lead
to an underestimation of the abundance of certain ciliates (Stoecker et al. 1994). The
effectiveness of the selected methodologies in capturing protist diversity could be
compared in 2005 to the commonly used 18S rRNA gene techniques (e.g. Behnke et al.
2006; Stoeck et al. 2009; Edgcomb et al. 2011a; Orsi et al. 2012), since 18S rRNA gene clone
library results from the same sampling campaign have already been reported (Stock et al.
2009). Both methodological approaches showed clear changes in the protist community
throughout the physico‐chemical gradient and detected similar protist groups, but the
clone libraries captured, as expected, a larger fraction of the diversity. However,
Metacystis spp. and Mesodinium spp., dominant species detected via microscopy, were
absent from the clone libraries. These results reflect two of the major problems of applying
18S rRNA gene based approaches to suboxic and anoxic environments: the need for
universal primers that recover the complete diversity (Wintzingerode et al. 1997; Stoeck et
al. 2006; Edgcomb et al. 2011b) and the lack of sequenced representatives for many

70 Chapter 2
microaerophilic and anaerobic ciliates (i.e. Metacystis spp.). Thus, for the present study,
aimed at observing the major morphotypes and assessing their abundance and
distribution, the selected microscopy techniques proved more adequate, despite capturing
a lower fraction of the diversity.
Protist community composition: diversity and distribution
In the present study, we observed a clear dominance in terms of biomass of ciliates,
and, at certain depths, dinoflagellates, with a peak in total protist abundance at the oxygen
/ hydrogen sulphide interface, and strong shifts in major morphotypes throughout the
redoxcline. This allowed the distinction of three clear zones: 1) suboxic: dominated by
Strombidium c.f. and dinoflagellates; 2) oxygen / hydrogen sulphide interface: dominated
by Metacystis spp., Mesodinium c.f. and either Coleps c.f. (2008 and 2009) or Spathidium
sp. (2005); and 3) upper anoxic / sulphidic, dominated by Metacystis spp. and / or
unidentified ciliates. HNF were present in abundances an order of magnitude lower than
in Baltic Sea surface waters (Kuuppo‐Leinikki 1990; Weber 2008) and were always
negligible in terms of biomass (0.05 – 3 % of total protist biomass). These results were
similar for both study sites and the two sampling campaigns conducted under normal,
non‐inflow, conditions (2008 and 2009) and are consistent with previous observations
from Gotland Deep suboxic and anoxic waters (Mamaeva 1988; Setälä 1991; Setälä & Kivi
2003), thus potentially representing the characteristic protist community of Baltic Sea
redoxclines.
The shifts observed in the protist community composition along the redox gradient
are in accordance with observations from other suboxic and anoxic systems (e.g. Fenchel
et al. 1990; Zubkov et al. 1992; Orsi et al. 2011), and will depend on the autecology of the
individual species involved (e.g, hydrogen sulphide tolerance (Vismann 1991; Fenchel &
Finlay 1995) and prey availability. The strongest change in morphotype composition was
detected in the present study at ~ 4 – 5 μM oxygen, likely marking the shift from a mainly
aerobic to a mainly anaerobic metabolism. Physiological studies have demonstrate that
oxygen optimums for microaerophilic ciliates are generally higher than this range (Finlay
et al. 1986; Fenchel & Finlay 1989), while ~ 4 ‐ 5 μmol oxygen l‐1 has been shown to be the
upper limit where oxygen can be beneficially used by anaerobic ciliates as a sink for
reducing power (Fenchel & Finlay 1995).
The protist morphotypes found in the present study are also consistent with those
often detected in suboxic to anoxic systems (e.g. Fenchel et al. 1995). However, some

Baltic Sea redoxcline protist communities 71
differences in community composition do exist when comparing to similar redoxcline
systems, such as those from the Black Sea, likely reflecting differences in salinity and
hydrological regimes, among other factors. Notably, Metacystis spp., though found
previously in diverse suboxic and anoxic environments (e.g. Foissner 1984; Fenchel et al.
1995), is recorded here for the first time as a major constituent of deep pelagic redoxclines.
Additionally, the HNF community composition, as revealed by live microscopy in 2005,
showed no obvious shifts throughout the oxygen gradient, differing from results obtained
at Danish fjords (Fenchel et al. 1995). Flagellates with a wide distribution throughout
different oxygen conditions have also been detected in other suboxic and anoxic systems,
such as certain uncultured marine stramenopiles (MAST taxa) at the Cariaco Trench (Orsi
et al. 2011). However, it remains unclear whether the flagellates found in the present study
indeed constitute species with a wide physico‐chemical tolerance or encompass genetically
different strains with a highly similar morphology (Scheckenbach et al. 2005).
A broad comparison of the protist community during all three years studied showed
no strong influence either of seasonality, or of the 2003 North Sea water inflow event,
which affected Gotland Deep in 2005. However, in this latter year, as we did not analyse
the full suboxic water column, we cannot properly assess the effect of the inflow event on
the protist community in this zone. Some differences in community composition could be
observed at oxygen / hydrogen sulphide interface and sulphidic depths in 2005, but these
mainly related to ciliate morphotypes present in low numbers (< 200 cell / l) and the
absence of Coleps c.f. It remains to be investigated whether Baltic Sea pelagic anaerobic
ciliates are capable of living in the sediments during periods of water column oxygenation,
similar to those inhabiting lakes (Finlay 1981), or have developed resistance forms to
withstand it.
Role of protists and viruses in Baltic Sea redoxcline food webs
The FLB experiments conducted revealed significant and high grazing at the suboxic depth
of Landsort Deep and at the oxygen / hydrogen sulphide interface depths of both study
sites, accounting for 50 – 80 % of the prokaryotic standing stock per day. These bacterivory
rates are among the highest measured for suboxic and oxygen / hydrogen sulphide
interface systems (Park & Cho 2002; Bettarel et al. 2004; Saccà et al. 2009) and are
considerably higher than those estimated in a previous study for suboxic and anoxic
waters at Gotland Deep, through biovolume‐dependent theoretical clearance rates for
ciliates (Setälä & Kivi 2003). However it should be noted that in this last study, ciliate

72 Chapter 2
abundance was lower than in the present study (< 103 cell l‐1). The rough application of the
same theoretical clearance rates to the estimated ciliate biovolumes and abundances
found in the present study, combined with the use of literature clearance rates for
dinoflagellates and flagellates (Kuuppo‐Leinikki 1990; Neuer & Cowles 1995), resulted in
grazing estimates that fell within the range of experimentally measured rates
(Supplementary Table S2.1). Studies in oxygenated water masses demonstrate that protist
selection for or against FLB can lead to over‐ or underestimations of grazing rates (Landry
et al. 1991; Mischke 1994). This potential bias will in all likelihood also apply to suboxic and
anoxic water masses. However, the comparison of measured and estimated grazing rates
allows us to conclude that despite this potential selectivity, the use of FLB did not shift the
experimentally obtained grazing rates away from reasonable ranges for the protist
community present.
At the other 3 depths tested (suboxic zone of Gotland Deep and the two sulphidic
depths), no significant grazing was detected. The first of these depths, however, showed
anomalous water chemistry (nitrate values were lower than expected, and ammonia was
higher) and a mix of typically suboxic (Strombidium c.f. and dinoflagellates) and oxygen /
hydrogen sulphide interface / anoxic protists (Metacystis spp.), likely indicating the effect
of a small‐scale mixing event (e.g. due to lateral intrusions). Thus, the estimated grazing
rate would belong to a perturbed system, and not be a representative rate for this zone.
For the other two depths, the low protist abundance and the tendency of one of the
dominating protists, Metacystis spp., to decrease during the incubations, suggest that we
were at the detection limit of the methodology, leading to low and variable rates, with no
statistical significance. Overall, the very low protist abundance at sulphidic depths in this
and previous studies (Mamaeva 1988; Setälä 1991; Detmer et al. 1993) supports the view
that the bacterivorous impact on the prokaryotic community is low in this zone.
The analysis of food‐vacuole content revealed that nearly all protists observed had
the potential for bacterivory, though some of the larger ciliates (e.g. Coleps c.f.) contained
prokaryotes less often, potentially indicating a more predatorial role on smaller protists
(i.e., observed FLB could belong to the food vacuoles of protist prey). For HNF, the
consistency of the percentage of flagellates containing FLB or bacteria detected by EUB
probes, indicates that around 50 % of HNF were active grazers at most depths. However,
their low abundance excludes them from being major predators. Rough calculations, using
HNF abundances determined throughout the redoxclines of both study sites in all 3 years,
a clearance rate of 5 nl flagellate‐1 h‐1, determined for HNF in surface waters of the Baltic
Baltic Sea redoxcline protist communities 73
(Kuuppo‐Leinikki 1990), and assuming that 50 % of the HNF community is active, showed
that HNF grazing accounted in all cases for less than 8 % of the prokaryotic standing stock
day‐1, generally being below 5 %. Thus, as opposed to surface waters where grazing is
dominated by small bacterivorous flagellates (Sherr & Sherr 2002; Jürgens & Massana
2008), ciliates and, under suboxic conditions, dinoflagellates, would constitute the major
grazers of Baltic Sea oxic / anoxic transition zones.
The analysis of the frequency of virally infected prokaryotic cells showed that
lysogeny remained below detection throughout the redoxcline, while lytic infection was
highest in the suboxic zone (reaching occasionally up to 25 %), and decreased to <5 % at
the oxygen / hydrogen sulphide interface and in sulphidic zones. The rationale behind the
virus‐dilution approach (Wilhelm et al. 2002) is to dramatically reduce viruses and
therefore prevent new viral infections during the incubation. Thus, an increase in viruses
is only due to viral infections which had already occurred in the source water, prior to the
start of the incubation, and is not an artefact of the incubation itself. However, this
methodology requires the water to be filtered, and, for redoxcline samples, every filtration
alters the in situ physico‐chemical conditions (e.g., oxygen or sulphide concentrations).
Thus, FIC estimates may have suffered from this disturbance. However, prokaryotic
abundance in the incubations was stable over time, exhibiting no drastic decreases in
abundance such as would occur through a strong toxic effect of oxygen. Additionally, FIC
from suboxic and oxygen / hydrogen sulphide interfaces should be less impacted than for
sulphidic depths. A previous study conducted at Gotland Deep (Weinbauer et al. 2003)
detected similar or slightly higher FIC for suboxic zones, but also found increased FIC (up
to 25 %) in the anoxic zone. Weinbauer et al. (2003) did not reduce viral abundances
through dilution, which excludes the problem of oxygen contamination. However, new
viral infection during their particularly long incubation times of up to 3 days may have
increased their estimates in all zones. This is especially important in the Mitomycin C‐
induced treatments used to determine the impact of lysogenic viruses. Mitomycin C
causes DNA damage affecting DNA replication and cell division, resulting in greatly
elongated cells. Because viral contact rates increase with the size of host cells (Murray &
Jackson 1992), estimates of FIC due to lysogenic viruses by Weinbauer et al. (2003) may be
higher than in situ.
Overall, prokaryotic mortality decreased from suboxic to upper anoxic / sulphidic
depths, with the reduction in bacterivorous pressure not being accompanied in the depths
analysed by a corresponding increase in viral to prokaryote ratios or FIC. This could also
74 Chapter 2
be observed in the net prokaryotic growth rates, which were negative or close to zero in
suboxic and oxygen / hydrogen sulphide interface waters, but positive for upper sulphidic
zones (Table 2.3). Thus, for upper sulphidic layers, where a high chemoautotrophic
prokaryotic productivity is still maintained (Jost et al. 2010), neither protist grazing nor
viral lysis appear to be major mortality factors. A similar phenomenon has been observed
for some lakes (Bettarel et al. 2004), where summed mortality in the metalimnion and
seasonally in the hypolimnion, remained below 50 % of prokaryotic production. This
discrepancy between prokaryotic productivity and loss is a major open question requiring
further study. Potential biases in the measurement of productivity and mortality should be
determined, along with the assessment of other potential mortality factors (i.e, physical
(e.g., sedimentation) or biological (e.g., apoptosis) processes). A significantly higher
grazing impact than measured here is unlikely at these depths, due to the very low protist
abundance present, but viral lysis could have been underestimated (as discussed above). It
additionally should be considered that for some prokaryotic groups specific mortality by
selective protist grazing or viral infection (Jürgens & Matz 2002; Yoon et al. 2011) might
result in significantly higher losses than averaged for the total prokaryotic community.
2.5. Conclusions
In the present study, using a combination of microscopy techniques and incubation
experiments, we demonstrate the existence of a characteristic protist community structure
for pelagic redoxclines of the central Baltic Sea, which is remarkably stable over different
years, different study sites, and different water‐column conditions. Furthermore, we
showed the potential of said community to exert a strong grazing control on prokaryotic
communities at suboxic and oxygen / hydrogen sulphide interface depths, but not in
sulphidic zones. Viruses, on the other hand, did not appear to constitute a strong loss
factor for prokaryotic communities at the depths tested. Thus, there is a discrepancy
between the high prokaryotic productivity previously measured at upper sulphidic depths
and low mortality. Finally, we uncovered differences to surface water food‐web
structuring, with HNF playing only a marginal role, and ciliates and, at some depths,
dinoflagellates acting as the major bacterivores.

Chapter 3
Protist grazing impact on a
chemoautotrophic bacterial
key‐player of Baltic Sea
redoxclines


Specific grazing on a chemoautotrophic bacterial key‐player 77
Abstract
Barrier zones between oxic and anoxic water masses (pelagic redoxclines) host highly
active prokaryotic communities that mediate important biogeochemical transformations.
In central Baltic Sea pelagic redoxclines, Epsilonproteobacteria of the genus Sulfurimonas
(subgroup GD17) have been shown to dominate dark CO2 fixation and be responsible for
denitrification via sulphide oxidation. However, the loss processes balancing this
chemoautotrophic production are unknown. In the present study, the protist grazing
impact on the Sulfurimonas subgroup GD17 was determined using predator exclusion
assays and bacterial amendment with a cultured Epsilonproteobacteria from Baltic Sea
redoxclines ("Sulfurimonas gotlandica" strain GD1). Experiments were conducted for two
physico‐chemically differing depths of Baltic Sea pelagic redoxclines (suboxic and oxygen /
hydrogen sulphide interface). Additionally, the principal bacterivores involved were
identified by RNA‐Stable Isotope Probing (RNA‐SIP), employing labelled "S. gotlandica"
strain GD1 as substrate. The results obtained demonstrate a strong growth of the
Sulfurimonas subgroup GD17 at the oxygen / hydrogen sulphide interface (doubling time
of 1 – 3 days), which could be completely accounted for by protist grazing (>100 % of new
cell production d‐1). At suboxic depths, little or no growth of Sulfurimonas subgroup GD17
was observed, but grazing was still high, indicating that this was a suboptimal habitat for
this bacterial group. RNA‐SIP identified 5 active grazers on "S. gotlandica" strain GD1,
belonging to typical redoxcline ciliate groups (Prostomatea and Oligohymenophorea) and
wide‐spread marine flagellates (Chrysophyta, MAST‐4 and Cercozoa (novel clade VI)).
Overall we demonstrate, for the first time, that protist grazing can control the growth of a
chemolithoautotrophic key‐player of oxic / anoxic interfaces.
3.1. Introduction
Prokaryotic communities inhabiting barrier zones between oxic / anoxic water masses,
also termed redoxclines, play vital roles in biogeochemical cycling. Successive studies have
demonstrated their importance for i.e. chemoautotrophic production (Taylor et al. 2001;

78 Chapter 3
Jost et al. 2008), denitrification and ammonia oxidation (Hannig et al. 2007; Lam et al.
2007; Labrenz et al. 2010), and sulphur cycling (Jannasch et al. 1991; Jørgensen & Bak 1991).
Based on dark CO2 fixation measurements, it has been postulated that these prokaryotic
communities will be highly active and achieve relatively high growth rates, with doubling
times in the range of 1 – 2 days estimated for both the Cariaco Basin (Taylor et al. 2006)
and the Baltic Sea (Jost et al. 2008). However, little is known on the loss factors that
balance this productivity.
The potential for protist grazing to regulate the biomass, activity and composition of
prokaryotic communities is well known for oxygenated marine and freshwater systems
(Jürgens & Matz 2002; Sherr & Sherr 2002; Pernthaler 2005). The recent in situ application
of techniques that take into account grazer identity, such as RNA‐Stable Isotope Probing
(RNA‐SIP) (Lueders et al. 2006; Frias‐Lopez et al. 2009; Moreno et al. 2010) or Fluorescent
In Situ Hybridization (FISH) (Massana et al. 2009; Piwosz & Pernthaler 2009), has
additionally lead to an increased understanding of how preferential grazing by specific
protist groups can affect the distribution of their prokaryotic prey. As an example, in vitro
experiments (Christaki et al. 1999; Guillou et al. 2001) and in situ studies employing RNA‐
SIP (Frias‐Lopez et al. 2009) revealed differences in the protist assemblages that graze on
the highly abundant marine cyanobacteria Prochlorococcus and Synechococcus, which
could partly explain their different distribution throughout the water column. Thus,
protist bacterivory, and the abundance of specific protist grazers, can be as important as
abiotic environmental factors (i.e., nutrients or temperature) in explaining the distribution
and activity of a given prokaryotic group in the water column (Thingstad 2000a; Gasol et
al. 2002).
However, very few studies have addressed this topic for suboxic to anoxic water
masses, despite the fact that protists can be abundant and active bacterivores in these
zones (Chapter 2; Fenchel et al. 1995; Bettarel et al. 2004; Gobler 2008). Lin et al. (2007),
and Bautista‐Reyes & Macek (2012), both demonstrated preferential protist grazing on
certain broad phylogenetic prokaryotic groups in redoxcline systems, respectively Gamma‐
and Epsilonproteobacteria in the marine Cariaco Basin, and Alpha‐, Delta‐ and
Gammaproteobacteria in the hypoxic hypolimnion of a stratified lake. Glaubitz et al.
(2009) additionally demonstrated by means of RNA‐Stable Isotope Probing (RNA‐SIP),
that chemolithoautotrophically produced biomass could be assimilated by bacterivorous
ciliate of Baltic Sea anoxic water masses. However, studies quantifying the magnitude of

Specific grazing on a chemoautotrophic bacterial key‐player 79
protist grazing on specific key‐prokaryotic groups of suboxic to anoxic water masses are
lacking.
In the present study we focused on the pelagic redoxclines of the Baltic Sea, one of
the worlds´ largest brackish environments. A stable halocline, situated at 60 – 80 m depth,
limits vertical mixing and separates the water column into an upper oxygenated layer and
a bottom oxygen depleted layer which becomes anoxic and sulphidic in the deepest zones
(Grasshoff 1975). The prokaryotic communities inhabiting this pelagic redoxcline have
been studied in depth, uncovering several groups of special importance, among them the
Sulfurimonas subgroup GD17 (Grote et al. 2007, 2008, 2012). This phylogenetic cluster
represents almost the totality of Epsilonproteobacteria in the oxic / anoxic transition zone
of the Baltic Sea, and can constitute up to 25 % of total cell counts. It has been shown to
dominate chemoautotrophic production and is actively involved in hydrogen sulphide
oxidation coupled to denitrification, thus potentially constituting an important barrier for
the spreading of the sulphidic zone in Baltic Sea redoxclines (Grote et al. 2012). However,
information on regulating processes for the Sulfurimonas subgroup GD17 other than
substrate availability is lacking to date, and could be vital in understanding the in situ
activity, abundance and distribution of this prokaryotic group. Meanwhile, protist grazing
has been shown to be very high at the oxic / anoxic interface of Baltic Sea redoxclines, with
up to 100 % of bacterial standing stocks grazed per day (Chapter 2; Table 2.3). Thus, a
strong bacterivorous pressure could act as an important regulating factor for the growth of
the Sulfurimonas subgroup GD17 at the oxic / anoxic interface of Baltic Sea pelagic
redoxclines.
To determine the potential grazing impact on the Sulfurimonas subgroup GD17, we
applied a combination of predator exclusion and bacterial addition assays (employing a
cultured representative of this phylogenetic cluster, "Sulfurimonas gotlandica" strain GD1
(Grote et al. 2012)). Experiments were conducted at two physico‐chemically differing
depths: lower suboxic zone (low oxygen concentrations (3 ‐ 5 µM O2 in the present study)
and presence of nitrate); and oxygen / hydrogen sulphide interface (oxygen and hydrogen
sulphide around the detection limit, and trace levels of nitrate). Additionally, RNA‐SIP was
applied at the oxygen / hydrogen interface to identify grazers on this bacterial group,
employing [13C]‐labelled "S. gotlandica" strain GD1 as substrate.

80 Chapter 3
3.2. Materials and methods
Study sites, sampling and measurement of physico‐chemical parameters
Sampling for predator‐exclusion and bacterial addition assays were conducted in the
central Baltic Sea at Gotland Deep (station 271; 57° 19.2´ N; 20° 03´ E) on board the R.V.
Maria S. Merian in September 2009. Sampling for the identification of grazers was carried
out under similar physico‐chemical conditions (Table 3.1) in Landsort Deep (station 284;
58° 35.0´ N; 18° 14.0´ E) on board the R.V. Alkor in March 2011. Water was collected in free‐
flow bottles attached to a conductivity, temperature and depth rosette (CTD) with a
coupled oxygen sensor. Inorganic nutrients, oxygen and hydrogen sulphide were measured
immediately on board according to standard methods (Grasshoff et al. 1983).
Table 3.1. Physico‐chemical parameters measured for each of the depths analyzed in the different
experiments, and for the three depths used for comparison to the RNA‐SIP experiment (Depth 1, 2
and 3) (Pred. Exc.: predator exclusion without addition; Pred. Exc. Add.: predator exclusion with
addition of "Sulfurimonas gotlandica" strain GD1; RNA‐SIP: RNA Stable Isotope Probing; Study
sites, G: Gotland Deep, L: Landsort Deep; Zones, S: suboxic; I: oxygen / hydrogen sulphide
interface.
Experiment Study Site
Zone Depth (m)
O2 (μM)
H2S (μM)
NO3 (μM)
NH4 (μM)
Pred. Exc. G S 105 4.91 - 2.71 0.55
G I 135 0.44* 0.2* - 2.88
Pred. Exc. Add. G S 120 3.13 0 - 0.06
G I 135 - 0.25* - 2.64
RNA‐SIP L I 90 2.23* - 1.47 2.55
Depth 1 L I 85 3.71 - 3.38 1.09
Depth 2 L I 87 1.83* - 2.02 2.02
Depth 3 L I 89 1.12* - 2.76 1.59
‐ Parameter not measured at this depth.
* Value around the detection limit of the methodology (2 μM for O2 and 0.2 μM for H2S).

Specific grazing on a chemoautotrophic bacterial key‐player 81
Predator‐exclusion assays
Experiments were carried out with water from two depths selected to correspond to
suboxic and oxygen/hydrogen sulphide interface zones. For the preparation of treatments
with no predators, water from the free‐flow bottles was collected, avoiding air contact, in 4
l bags pre‐gassed with nitrogen (UD 3 TUR‐BAG, Sarstedt; modified to seal any non
required openings). Only the bottom 5 l of 10 l free‐flow bottles was used to avoid oxygen
contamination during emptying of the free‐flow bottles. Filled bags were taken to a 4 °C
climate chamber and placed inside a glove bag with a nitrogen atmosphere (AtmosBagTM;
Sigma‐Aldrich). Predator exclusion was achieved as shown in Fig. 3.1, by filtration through
1 µm pore‐size polycarbonate filters (Isopore; diameter, 47 mm; placed inside a Swin‐
LockTM filter holder; all Whatman), with the help of a peristaltic pump (Sci‐Q‐323; Watson
Marlow; 100 rpm). Gas tight tubing was employed to avoid oxygen contamination (Iso‐
Versinic, Saint‐Gobain Performance Plastics). Filtered water was transferred via needles
(Sterican; 0.8 mm x 120 mm; B. Braun) into acid‐cleaned glass bottles with septum lids,
which had been pre‐gassed with argon gas. Non‐fractioned control treatments (with
predators) were prepared by filling 1 l acid cleaned glass bottles directly from the free‐flow
bottles, with at least half a minute of overflow, and immediately closing them avoiding air
bubbles. Incubation was conducted approximating in situ conditions (4°C, in the dark).
Samples were collected at 0, 27 and 50 h, with separate sets of triplicate incubation bottles
prepared for each time point to avoid oxygen contamination during sampling.
Figure 3.1. Set‐up used to obtain filtered treatments in predator exclusion experiments. Dashed
arrow indicates direction of water‐flow.

82 Chapter 3
Predator exclusion with addition of "Sulfurimonas gotlandica" strain GD1
In a second set of experiments, the relative proportion of the Sulfurimonas subgroup GD17
population was increased by addition of "S. gotlandica" strain GD1, so that it constituted
the principal available prey (~ 50 % of total prokaryotic cell‐counts). To obtain cultures for
the amendment, "S. gotlandica" strain GD1 (Grote et al. 2012) was grown anaerobically for
around 15 days, at 15 °C and in the dark, using as media artificial brackish water medium
(ABW) (Bruns et al. 2002) modified as previously described (Grote 2009). Experiments
were carried out with water from two depths selected to correspond to suboxic and oxygen
/ hydrogen sulphide interface zones. Predator exclusion and control treatments were
prepared as described above (Fig. 3.1) with the incorporation of a bacterial addition step.
Immediately after filling, bottles were placed in an anaerobic chamber (Coy Laboratories)
with a forming gas atmosphere, and "S. gotlandica" strain GD1 was added to a final
concentration of ~ 5 x 10⁵ bacteria ml‐1. Incubation was conducted approximating in situ
conditions (4°C, in the dark). Samples were collected at 0, 27 and 50 h, with separate sets
of triplicate incubation bottles prepared for each time point to avoid oxygen
contamination during sampling.
Prokaryote and protist quantification
Total prokaryotic cell‐counts were obtained by flow‐cytometry as previously described
(Labrenz et al. 2007). Heterotrophic nanoflagellate (HNF), dinoflagellate and ciliate
abundance and morphotype composition were obtained by epifluoresence and light
microscopy following the protocols described in detail in Chapter 2.
Sulfurimonas subgroup GD17 abundance was obtained by Catalyzed Reporter
Deposition‐Fluorescence In Situ Hybridization (CARD‐FISH) employing probe SUL90 for
detection as previously described (Grote et al. 2007). A minimum of 200 hybridized cells
were counted at 1000 X using filter set 09 for detection under an Axioskop 2 mot plus
epifluorescence microscope (Carl Zeiss MicroImaging). In cases of uneven filter surface
distribution two or more filter sections from opposing sides of the filter were counted and
averaged, or, in severe cases, filters were discarded. The SUL90 probe can not distinguish
between the Sulfurimonas subgroup GD17 and its cultured representative, "S. gotlandica"
strain GD1 (Grote et al. 2007). Thus, all counts are referred to as Sulfurimonas subgroup
GD17 abundance.

Specific grazing on a chemoautotrophic bacterial key‐player 83
Estimation of Sulfurimonas subgroup GD17 growth and grazing losses
Growth and grazing rates were determined from the predator exclusion experiments as
follows. Exponential growth was assumed, and net growth rates of Sulfurimonas subgroup
GD17 were determined for each treatment as:
µ = (ln Nt – ln N0) / (tt – t0)
where N0 and Nt are respectively the cell abundance at the start of the experiment (t0) and
at the end of the time interval measured (tt). At t0, all cell‐counts for the same depth were
averaged, giving a pooled initial abundance for Sulfurimonas subgroup GD17 (N0). Net
growth rates were subsequently used to calculate doubling times for a given time interval
as:
ln (2) / µ
Finally, grazing rates were calculated for each time interval and depth as:
G = µ filtered treatment ‐ µ unfiltered treatment
Incubations for RNA‐stable isotope probing (RNA‐SIP)
"S. gotlandica" strain GD1 was grown prior to the cruise as described above, using [12C]‐
NaHCO3 (Merck) for `normal´ culture conditions (unlabelled, [12C]‐"S. gotlandica" strain
GD1) or as [13C]‐NaHCO3 (Cambridge Isotope Laboratories) to obtain [13C]‐labelled "S.
gotlandica" strain GD1.
Experiments were carried out with water from a depth selected to correspond to the
oxygen / hydrogen sulphide interface. 2 l acid‐cleaned narrow‐neck glass bottles were
filled from the free‐flow bottles, with at least half a minute of overflow, and immediately
closed with tightly fitting glass stoppers. The bottles were incubated without further
amendment in the dark at 4 °C for 5 days to achieve an enrichment in protists naturally
abundant in situ, following the principle of unamended sea‐water incubations (Massana et
al. 2006). Once in the laboratory, part of the bottles were left unamended (referred to as
N‐treatment), and part were inoculated in an anaerobic chamber (Coy Laboratories;
forming gas atmosphere) with either [13C]‐labelled "S. gotlandica" strain GD1 (referred to as
[13C]‐treatment) or unlabeled "S. gotlandica" strain GD1 (referred to as [12C]‐treatment).
Incubation was conducted at 10 °C in the dark. Samples were collected at 0 and 50 h, with
separate sets of triplicate incubation bottles prepared for each time point to avoid oxygen

84 Chapter 3
contamination during sampling. Samples were obtained for determining protist, total
prokaryote and Sulfurimonas subgroup GD17 abundance as described above. The
remaining volume (~ 1.4 l) was filtered onto membrane filters (Isopore; pore size, 0.2 µm;
diameter, 47 mm; Millipore), which were then shock‐frozen and stored at ‐80°C for the
subsequent analysis of 16S and 18S rRNA.
Nucleic acid extraction, isopycnic centrifugation, and 18S rRNA gene
quantification
DNA‐free total RNA was obtained following the protocol in Weinbauer et al. (2002),
modified according to Glaubitz et al. (2010). Gradient preparation, isopycnic
centrifugation, and gradient fractionation were performed as previously described
(Lueders et al. 2004b), with minor modifications as described in Glaubitz et al. (2009).
Each gradient consisted of 5.1 ml of CsTFA (~ 2 g ml‐1, GE Healthcare), 185 μl of formamide
and 1 ml of gradient buffer (100 mmol Tris‐HCl l‐1 (pH 8.0), 100 mmol KCl l‐1, 1 mmol EDTA
l‐1) including 500 ng of DNA‐free RNA. Prior to centrifugation, the average density of the
centrifugation medium was controlled refractometrically and adjusted to an average
density of 1.80 g cm‐3 if necessary. The samples were centrifuged in 5.1 ml Quickseal
polyallomer tubes in a VTi 65.2 vertical rotor using an Ultima L‐100 XP centrifuge (all
Beckman Coulter). Centrifugation was carried out at 20 °C for > 65 h at 35 000 rpm (105
000 g). Gradients were fractionated as previously described (Neufeld et al. 2007) and the
density of each collected fraction was measured by determining the refractory index.
Subsequently, the RNA contained in each fraction was precipitated using isopropanol; the
pellet was washed once with 70% ethanol, and was then dissolved in 25 μl of
diethylpyrocarbonate (DEPC) treated water (Calbiochem).
Quantitative reverse‐transcription‐PCR (RT‐qPCR) of density‐resolved RNA was
carried out following the protocol described in Glaubitz et al. (2009) employing a one‐step
RT‐PCR kit (Access Kit, Promega) and a quantitative PCR cycler (iCycler; Bio‐Rad).
Domain‐specific primer sets for eukaryotes Euk 350f (5´‐ TCC GGA GAG GGW GCC TGA
G – 3´) and E561‐R (5´ ‐ TTA CCG CGG STG CTG GCA CC – 3´) were used, obtained by
modifying the primers in Zhu et al. (2005) to afford a better coverage of cercozoa and
some ciliate groups (e.g., Mesodinium spp. or Cyclidium spp.). For absolute quantification
of rRNA molecules, in vitro RNA transcripts of cloned Tetrahymena pyriformis were used
in defined dilution steps from 108 to 102 copies per qPCR reaction. PCR was started with
reverse transcription (45 min at 48°C), followed by an initial denaturation step for 5 min.
Specific grazing on a chemoautotrophic bacterial key‐player 85
Amplification was performed with a 40‐cycle PCR (30 s 95 °C, 30 s 56 °C, 30 s 68 °C, 10 s 80
°C) followed by a terminal elongation step (5 min). After each run, a melting curve
between 50 °C and 89 °C was collected to differentiate between specific amplicons and
unspecific signals.
16S and 18S rRNA fingerprinting analysis
The microeukaryote community present in each of the density resolved fractions was
analyzed by denaturing gradient gel electrophoresis (DGGE). cDNA was synthesised using
the iScript Select Kit (Bio‐Rad) according to manufacturer’s instructions. 1µl of the cDNA
obtained served as template for a PCR using the eukaryotic primers EukA and Euk516r‐GC
(Díez et al. 2001) and 2U Taq DNA polymerase (5 PRIME). The PCR started with an initial
denaturation step at 94°C for 2 min followed by 30 cycles of denaturation at 94 °C for 30 s,
annealing at 56 °C for 45 s and elongation at 72 °C for 2 min. The terminal elongation step
was performed at 72 °C for 6 min. Samples were electrophoresed on 6% polyacrylamide gel
as described in Díez et al. (2001), with a linear denaturating gradient of 25 – 55 %, and
using the Ingeny PhorU system. Gels were run for 16 h at 100 V and 60 °C, with 0.5 X TAE
as electrophoresis buffer, and then stained for 60 min with 1X TAE buffer containing
SybrGold. The bands were visualized by UV radiation and excised under illumination with
blue light.
As a control for transfer of the [13C]‐signal within the prokaryotic community, the 16S
rRNA contained in the density resolved fractions was analysed by single stranded
conformation polymorphism (SSCP) as previously described (Glaubitz et al. 2009).
The DGGE and SSCP fingerprinting gels were digitalized and the resulting images
processed using GelCompar II (Applied Math). The relative contribution of each band to
the total band intensities of each lane was calculated based on densiometric curves after
normalization and background subtraction.
Sequence analysis
Sequencing efforts were centred on the gels proceeding from the [13C]‐treatment, though
representative bands were also analysed for control gels. Bands from SSCP gels were
excised and cleaned as previously described (Glaubitz et al. 2009). Bands from DGGE gels
were excised, eluted in nuclease‐free water, and reamplified, using the same primer set
and PCR conditions as described above. The purity and correct mobility of the reamplified

86 Chapter 3
product was tested in a second DGGE (denaturing gradient; 25 – 45 %). Bands excised
from the second DGGE were re‐amplified in a semi‐nested PCR with the primer sets
18SForN2 (5´ ‐ GAT CCT GCC AGT AGT CAT AYG C – 3´) (Wylezich et al., submitted) and
Euk516r (with no GC clamp; see Díez et al. 2001), and purified with the Nucleospin II kit
(Macherey and Nagel). Sequencing was performed by Qiagen (Hilden, Germany). All
sequences were quality checked using the programme BioEdit (Hall 1999) and preliminary
estimates of phylogenetic affiliations of the 16S and 18S rRNA sequences were obtained by
BLAST (Altschul et al. 1997).
Phylogenetic analysis
Sequences obtained were aligned with those retrieved from GenBank using the
CLUSTAL_X program (Thompson et al. 1997) and then edited manually. MrBayes
(Huelsenbeck et al. 2001) and PhyML 3.0 (Guindon & Gascuel 2003); http://www.atgc‐
montpellier.fr/ phyml/) were used for the phylogenetic analyses. This was carried out with
the GTR model of substitution (Lanave et al. 1984) and a gamma‐shaped distribution of
substitution rates among sites, with eight rate categories and a proportion of the invariable
sites. Bayesian analysis was performed for 1 000 000 generations and sampled every 100
generations for four simultaneous chains. For the likelihood analysis, all model parameters
were estimated from the dataset. To estimate branch support, 100 bootstrap replicates
were performed in maximum‐likelihood analyses.
Statistical analysis
Significant differences in protist and prokaryote abundances at different time‐points
during incubations were detected by means of ANOVA or t‐test, using the programme
SPSS 15.0 (SPSS).
3.3. Results
Grazing impact on Sulfurimonas subgroup GD17
Two experiments were conducted comparing the growth of Sulfurimonas subgroup GD17
in presence and absence of grazers, and under similar suboxic and oxygen / hydrogen
sulphide interface conditions (Fig. 3.2; Table 3.1). In the first, no further amendment was

Specific grazing on a chemoautotrophic bacterial key‐player 87
conducted (henceforth called non‐addition experiment) and, in the second, "S. gotlandica"
strain GD1 was added (henceforth addition experiment). In both experiments, only trace
abundances of the three functional protist groups could be found at the end of the
incubation in filtered treatments (<10 %, and generally <5 %; Fig. 3.3B, D; Fig. 3.4B, D),
indicating that predator exclusion was successful.
The initial abundance of the natural Sulfurimonas subgroup GD17 population was
similar for depths of comparable physico‐chemical conditions in the two experiments
(respectively for non‐addition and addition experiments, 2.54 ± 0.34 x 10⁴ cell ml‐1 and 2.24
x 104 cell ml‐1 at the suboxic zone, and 6.52 ± 0.86 x 10⁴ cell ml‐1 and 8.06 x 10⁴ at the oxygen
/ hydrogen sulphide interface). In the addition experiment, the inoculation of "S.
gotlandica" strain GD1 raised the proportion of the Sulfurimonas subgroup GD17 from 2 to
~ 65 % of the total prokaryotic community at the suboxic depth, and from 6 to ~ 45 % at
the interface.
S 0hS 27
hI 0
hI 2
7hS 0hS 50
h I 0
hI 5
0h
% of t
otal ciliate abu
ndan
ce
0
20
40
60
80
100
I 0h
I 50h
Depth
1
Depth
2
Depth
3
Strombidium c.f.Metacystis spp. Mesodinium c.f.Coleps c.f.Euplotes c.f.
pUnident. 1 (20 ‐ 30 µm; scuticociliate‐like)Unident. 2 (20 ‐ 30 µm)Unident. 3 (30 ‐ 70 µm; Prorodon‐like)Other
Figure 3.2. Relative abundance of the different ciliate morphotypes identified at the beginning
and end of the predator exclusion experiments, (A) without and (B) with addition of "S.
gotlandica" strain GD1; and (C) at the beginning and end of the 13C enrichment experiment
compared to in situ depths of similar physico‐chemical characteristics sampled during the same
cruise (Depth 1, 2 and 3). S: suboxic depth; I: oxygen / hydrogen sulphide interface depth. For the
RNA‐SIP experiments, three abundant morphotypes were distinguished through morphological
characteristics, but could not be classified (Unident. 1, 2 and 3).

88 Chapter 3
In both sets of experiments, Sulfurimonas subgroup GD17 showed different dynamics
over the incubation time at the two depths analysed (Fig. 3.3 and 3.4, Table 3.2). At suboxic
depths, the Sulfurimonas subgroup GD17 generally showed no growth in treatments with
no predators (Fig. 3.3 and 3.4, Table 3.2). The exception was the first 27 h of the non‐
addition experiments, where significant growth was observed (ANOVA P<0.05), followed
by a strong decrease to an abundance equal to that at the start of the experiment (ANOVA
27h vs 50h P<0.05, 0h vs. 50h P>0.05). In treatments with predators at the suboxic zone,
Sulfurimonas subgroup GD17 abundance did not vary over time in the non‐addition
experiment (t‐test; P>0.05), and decreased in the addition experiments (t‐test; P>0.05).
This resulted in grazing rates of 0.21 d‐1 for non‐addition experiments, and 0.38 d‐1 for
addition experiments, being in both cases higher than the growth rates (Table 3.2).
Total p
roka
ryot
es (1
05 cell m
l‐1 )
Sulfur
imon
as sub
grou
p GD17 (1
04 cell m
l‐1 )
0
1
2
3
4
5
6
7
0 27 50 0 27 50
HNF (10 2 cell m
l ‐1)
Ciliates and dinoflagellates (cell m
l ‐1)
0
1
2
3
4
5
6
0
5
10
15
20
25
Time (h)0 27 50 0 27 50
0.0
0.5
1.0
1.5
2.0
2.5
A B
DC
Figure 3.3. Changes during the predator exclusion experiments (with no bacterial addition) in
total prokaryote (white bars), Sulfurimonas subgroup GD17 (grey bars) and protist abundance
(line plots; ciliates (□), HNF (▼), and dinoflagellates (●)), under suboxic conditions in presence
(A) and absence (B) of grazers; and under oxygen / hydrogen sulphide interface conditions in
presence (C) and absence (D) of grazers. The corresponding standard deviations are shown.

Specific grazing on a chemoautotrophic bacterial key‐player 89
Total p
roka
ryot
es and
Sulfur
imon
as sub
grou
p GD17 (1
05 cell m
l‐1 )
0
2
4
6
8
10
12
0 27 0 27
HNF (10 2 cell m
l ‐1)
Ciliates and dinoflagellates (cell m
l ‐1)
0.0
0.5
1.0
1.5
2.0
2.5
0
5
10
15
20
Time (h)
0 27 0 27
0.0
0.5
1.0
1.5
2.0
2.5
A B
C D
Figure 3.4. Changes during the predator exclusion experiments with addition of "Sulfurimonas
gotlandica" strain GD1, in total prokaryote (white bars), Sulfurimonas subgroup GD17 (grey bars)
and protist abundance (line plots; ciliates (□), HNF (▼), and dinoflagellates (●)), under suboxic
conditions in presence (A) and absence (B) of grazers; and under oxygen / hydrogen sulphide
interface conditions in presence (C) and absence (D) of grazers. The corresponding standard
deviations are shown.
At oxygen / hydrogen sulphide interface depths, Sulfurimonas subgroup GD17
increased in abundance in treatments without predators (Fig. 3.3 and 3.4; t‐test; P<0.05),
resulting in growth rates of 0.56 d‐1 and 0.22 d‐1 for non‐addition and addition experiments
respectively (Table 3.2). For treatments with predators, a significant decrease in
abundance was observed for the addition experiment (t‐test; P<0.05). In non‐addition
experiments a initial increase was observed between 0 and 27 h (t‐test; P<0.05), coinciding
with the significant decrease in ciliate abundance (ANOVA; P<0.05), followed by a strong
decrease in Sulfurimonas subgroup GD17 abundance between 27 and 50 h, once protist
abundance stabilized (ANOVA; P>0.05). This resulted in grazing rates of 0.65 d‐1 for the
addition experiment, and of 0.94 d‐1 for the full 50 h incubation time of the non‐addition
experiment (Table 3.2), being again higher than the growth rates. Total prokaryotic
abundance did not significantly differ between treatments (presence or absence of grazers)

90 Chapter 3
for either depth or experiment for all time points analysed (Fig. 3.3 and 3.4; ANOVA;
P>0.05).
Table 3.2. Growth and grazing rates (standard deviation in parenthesis) on Sulfurimonas
subgroup GD17 measured for the full incubation time of predator‐exclusion experiments with and
without addition of "Sulfurimonas gotlandica" strain GD1.
No predators
Growth rate (d‐1)
doubling time (d)
Grazing rate (d‐1)
% cell production grazed d‐1
Suboxic
no addition 0.09 (0.04) 9.40 (5.42) 0.21 231.75
addition a a 0.38 b Interface
no addition 0.56 (0.06) 1.25 (0.20) 0.94 166.03
addition 0.22 (0.07) 3.42 (1.07) 0.65 296.02
a no growth detected b could not be determined since no cell‐production was measured
Identification of "Sulfurimonas gotlandica" strain GD1 grazers
For the [13C]‐incorporation assays water was collected at an oxygen / hydrogen sulphide
interface depth (Table 3.1), and incubated without further amendment for 5 days prior to
the start of the experiment. At the end of this incubation time, an approximately 10‐fold
increase in ciliate abundance was observed compared to in situ depths with similar
physico‐chemical conditions), while dinoflagellate abundance remained constant (HNF
were not quantified for the in situ depths). All ciliate morphotypes observed at the end of
the enrichment were also found in the in situ samples, though the proportions changed,
with small ciliates (25 – 40 µm in length) becoming more abundant than other larger
morphotypes (Fig. 3.2). At the start of the [13C]‐enrichment incubations, protist
abundances were: 621 ± 54 HNF ml‐1, 1.42 ± 0. 36 x 103 dinoflagellates l‐1 and 9.24 ± 0.75 x 10³
ciliates l‐1. These abundances did not vary significantly over the 50 h experimental
incubation (ANOVA P>0.05).
The natural Sulfurimonas subgroup GD17 population had an initial abundance of 7.17
x 104 cell ml‐1, constituting about 10 % of the total prokaryotic community. Through
addition of "S. gotlandica" strain GD1, this proportion was raised to 26 ± 3% of total
prokaryotes in both the [12C]‐ and [13C]‐treatments (data not shown). After 50 h
incubation, Sulfurimonas subgroup GD17 average cell‐counts had decreased by 25 – 30 %

Specific grazing on a chemoautotrophic bacterial key‐player 91
in [12C]‐ and [13C]‐treatments, and by 14 % in the N‐ control treatment without "S.
gotlandica" strain GD1 addition (data not shown). As a control for the transfer of the [13C]‐
signal to other members of the prokaryotic community, 16S rRNA SSCP fingerprinting was
conducted for the three density gradients. All bands with enhanced relative intensities in
heavier fractions of the [13C]‐gradient were identified as "Sulfurimonas gotlandica" strain
GD1 with 100% sequence identity (data not shown).
RT‐qPCR analysis of the density resolved RNA originating from the 50h samples,
with 18S rRNA specific primers, showed a slight but clear density shift towards heavier
rRNA in the [13C]‐treatment when compared to the two control treatments ([12C] and N)
(Fig. 3.5). The copy number maximum was found at a buoyant density of 1.787 g ml‐1 for all
three treatments. However, 46 % of total 18S rRNA copies were distributed at higher
densities in the [13C]‐treatment, compared to 33 and 28 % respectively for the [12C]‐ and N‐
control treatments, indicating an enrichment in the total rRNA pool. This was clearest at
densities between 1.798 g ml‐1 and 1.805 g ml‐1 which contained 30 % of 18S rRNA copies in
the [13C]‐treatment, but only 4 and 7 % in the [12C]‐ and N treatments controls,
respectively.
CsTFA buoyant density (g ml‐1)
1.75 1.77 1.79 1.81 1.83
Ratio of m
axim
um qua
ntities
0.0
0.2
0.4
0.6
0.8
1.0
1.212C13C N
Figure 3.5. Quantitative distribution of 18S rRNA in the CsTFA density gradients for the
treatments with addition of 13C‐labelled (13C) and non‐labelled (12C) "S. gotlandica" strain GD1,
and the treatment with no addition (N).
The 18S rRNA DGGE fingerprinting of the three density gradients and subsequent
comparison of relative band intensity, showed 5 clearly enriched bands (C, E, G, I and J),
and three potentially enriched bands (Q, L, and R) (Fig. 3.6; Supplementary Fig. S3.1).
These increased in band intensity towards heavier buoyant densities in the [13C]‐treatment,

92 Chapter 3
but not in either control (Fig. S3.1). Sequenced bands belonged mainly to the alveolates (12
OTUs (operational taxonomic unit; here defined as DGGE band position)), though
stramenopiles (3 OTUs), choanoflagellates (1 OTU) cercozoa (1 OTU) and euglenozoa (1
OTU) were also present (Fig. 3.7; the euglenozoa OTU (band R) is not included since it
was difficult to assign in BLAST databases). All groups, with the exception of the
choanoflagellates, contained enriched or potentially enriched OTUs. Clearly enriched
bands were identified as two ciliate OTUs, the first belonging to the Oligohymenophorea,
and closely related to Cardiostomatella vermiformis (98 % sequence identity) (Band I), and
the second belonging to the Prostomatea (Band C); two stramenopile OTUs, belonging to
the MAST‐4 group (Band E) and the chrysophytes (Band J); and the cercozoan OTU,
which belonged to the novel clade VI (Bass & Cavalier‐Smith 2004). Potentially enriched
bands included one additional ciliate OTU, belonging to the Armophorea and closely
related to Metopus contortus (98 % sequence identity) (Band L), a dinoflagellate OTU
(Band Q) and the euglenozoan OTU (Band R).
Figure 3.6. Fingerprints of density‐resolved eukaryotic SSU rRNA templates from the CsTFA
density gradient fractions obtained for the treatments with (a) no addition (N‐treatment control)
and (b) addition of [13C]‐labelled "S. gotlandica" strain GD1 ([13C]‐treatment). The lanes of each
gel represent, from left to right, fractions of increasing buoyant density. Relative band intensities
were evaluated for all fractions besides the lightest and the heaviest, which usually contain
erratic community patterns. Bands identified by sequencing are specified (A ‐ R), and bands
marked in red are those clearly enriched (based on relative band intensities). Reference lanes are
indicated with an asterisk.

Specific grazing on a chemoautotrophic bacterial key‐player 93
Figure 3.7. Phylogenetic tree showing the relationship of eukaryote 18S rRNA sequences retrieved
from DGGE bands as shown in Fig. 3.6. Clearly enriched bands are marked in red. Bar indicates
0.1 fixed point mutations per nucleotide. Numbers at nodes represent the posterior probabilities
of the Bayesian analysis.

94 Chapter 3
3.4. Discussion
Protist grazing impact on the Sulfurimonas subgroup GD17
In the present study we observed a high grazing impact on the Sulfurimonas subgroup
GD17 at suboxic and hydrogen sulphide interface depths of a Baltic Sea pelagic redoxcline
(Gotland Deep), capable of exceeding the growth of this prokaryotic group. The
Sulfurimonas subgroup GD17 grew strongly in absence of grazers at the oxygen / hydrogen
sulphide interface (Fig. 3.3 & 3.4; Table 3.2). Calculated doubling times (1 – 1.5 d) were
comparable to the maximal rates estimated for chemolithoautotrophic production in the
Baltic Sea (Jost et al. 2008) and the Cariaco Basin (Taylor et al. 2006)) based on 14C‐
bicarbonate incorporation. In suboxic zones however, Sulfurimonas subgroup GD17
growth was only detected in the first 27 h of the non‐addition experiment, indicating that
this zone was likely sub‐optimal for the growth of this bacterial group. This in accordance
with previous studies on the Sulfurimonas subgroup GD17 and its cultured representative
"S. gotlandica" strain GD1, which show that this group will primarily grow by coupling
denitrification to the oxidation of reduced sulphur compounds and dark CO2 fixation
(Labrenz et al. 2005; Grote et al. 2008, 2012). Thus, the oxygen / hydrogen sulphide
interface, with overlapping nitrate and hydrogen sulphide concentrations, constitutes the
optimal habitat for this bacterial group, while the suboxic zone, where nitrate is present
but hydrogen sulphide is absent, would not support significant growth.
The high grazing rates obtained, however, raise the question of how the relatively
high natural abundance of the Sulfurimonas subgroup GD17 population is maintained.
Potentially the experimental set‐up could lead to over‐ or underestimations of one or both
parameters, through, e.g., substrate exhaustion or confinement. However, both rates fit
well with previous estimates for high grazing (Chapter 2; Table 2.3) and chemoautotrophic
production (Jost et al. 2008; Grote et al. 2012) in this zone. It is additionally interesting to
note that maxima in Sulfurimonas subgroup GD17 abundances and dark CO2 fixation rates
are often found once hydrogen sulphide levels begin to increase (Grote et al. 2008, 2012;
Jost et al. 2010), below the theoretical `optimum growth zone´ for this bacterial group
(Bruckner et al. submitted). While several possible physiological explanations to this
phenomenon have been postulated (e.g., use of alternate electron donors (Jost et al. 2010)),
the ecological background remains unknown. It has been recently shown that protist
abundance and grazing rates on the total prokaryotic community strongly decrease once
hydrogen sulphide levels rise (Chapter 2; Fig. 2.2 & Table 2.3). Thus, protist grazing could

Specific grazing on a chemoautotrophic bacterial key‐player 95
potentially constitute a strong factor influencing the shift in the Sulfurimonas subgroup
GD17 population distribution away from its depths of growth optimum and towards a zone
which constitutes a refuge from protist predation.
As an additional point of interest, specific grazing on the Sulfurimonas subgroup
GD17 was always higher at the oxygen / hydrogen sulphide interface than at the suboxic
zone (Fig. 3.3 & 3.4; Table 3.2). This was especially evident in the addition experiment were
a comparable initial abundance of protists and prey were present (Fig. 3.4; Table 3.2). A
parallel study conducted on the same sampling cruise revealed that grazing on the total
prokaryotic community was conversely higher for the suboxic zone, and that the protist
communities in the two zones differed in composition (Chapter 2; Fig. 2.4 & Table 2.3).
Thus, it appears that at the oxygen / hydrogen sulphide interface zone, where the
Sulfurimonas subgroup GD17 is actively growing, the protist community present is better
adapted to consuming this bacterial group, than the protist association found in suboxic
zones
Finally, total prokaryotic abundance was not significantly influenced by presence or
absence of grazers (Fig. 3.3 & 3.4), contrary to observations for the Sulfurimonas subgroup
GD17. However, as we did not conduct any further analysis on the dynamics of other
prokaryotic groups, we cannot properly asses the changes induced by grazing on the
remaining prokaryotic community. A similar phenomenon was observed at the oxic /
anoxic interface of the Cariaco Basin, with changes in the relative abundance of different
prokaryotic groups in absence / presence of grazers not necessarily being accompanied by
changes in total prokaryotic abundance (Lin et al. 2007). Potentially, the interplay between
vulnerability to grazers and effectiveness in competing for substrates leads to a fast
turnover of different prokaryotic groups under changing grazing pressure (i.e., a high
grazing pressure on the Sulfurimonas subgroup GD17 could indirectly `free´ nutrient for
other less vulnerable prokaryotes that would otherwise have been outcompeted).
Overall, I demonstrate, to my knowledge for the first time, that protist grazing can
balance cell production of a chemolithoautotrophic bacterial key player of pelagic
redoxclines. An increased Epsilonproteobacteria growth in absence of grazers has also been
seen at the oxic / anoxic interface of the Cariaco Basin (Lin et al. 2007), indicating that
bacterivory could constitute an important regulating factor for this key prokaryotic group
of suboxic to anoxic systems (Taylor et al. 2001; Campbell et al. 2006; Lavik et al. 2009;
Glaubitz et al. 2010).

96 Chapter 3
RNA‐Stable Isotope Probing (RNA‐SIP): methodological considerations
In the present study we successfully applied a combination of RNA‐SIP (Manefield et al.
2002; Lueders et al. 2006) and unamended sea water incubations (Massana et al. 2006) to
enrich protists naturally present in situ in a Baltic Sea redoxcline (Landsort Deep) and
identify grazers on `S. gotlandica´ strain GD1, a cultured representative of the
Sulfurimonas subgroup GD17 (Grote et al. 2012). Ciliate morphotypes present at the end of
the enrichment period were consistent with those found at the in situ depths used for
comparison (Fig. 3.2), and existing data for Baltic Sea redoxclines (Chapter 2; Fig. 2.3 &
2.4). This, combined with the fact that the closest relative to most sequences recovered
proceeded from suboxic to anoxic water masses, indicates that the incubation conditions
favoured naturally abundant protists and did not result in a severe change in the
community composition.
The [13C]‐enrichment obtained in the present study was clear, but not strong (Fig.
3.5). Maximum copy numbers were found at the a buoyant density of 1.787 g ml‐1 for all
treatments, falling within normal ranges for [12C]‐rRNA (Lueders et al. 2004a). However, a
considerably higher proportion of rRNA copies was found at densities above the copy
maximum in the [13C]‐treatment than in the two controls (Fig. 3.5). One problem arising
from this `weaker´ enrichment, is that in cases where the DGGE bands already naturally
extended across the full gradient when unlabelled (e.g. Band A; Fig. 3.6), any enrichment
in the [13C]‐treatment is likely masked and hard to detect. Thus, under the current
protocol, it is not possible to determine for all protists whether they incorporated the
labelled substrate or not. The distribution of unlabeled RNA along the gradient to the
extent that it contaminates denser fractions has been observed and discussed previously,
and is the reason why careful comparison with control gradients is recommended
(Manefield et al. 2002; Lueders et al. 2004a; Singleton et al. 2005; Neufeld et al. 2007). An
increase in the amount of labelled prey or incubation time could potentially resolve this
problem, but this could lead to other experimental artefacts, i.e., an excess in the labelled
bacteria could alter the natural prey selection process of a given grazer. Thus, the
application of RNA‐SIP alone to the environment analysed in the present study may not be
able to fully resolve all specific grazers on a particular prokaryotic group.
16S rRNA analysis indicated that no significant transfer of the [13C]‐signal was
occurring to other members of the prokaryotic community, for example through use of
labelled by‐products of protist grazing. Additionally, alternative sources of enrichment for
the protist community other than bacterivory can be disregarded. The incubation times
Specific grazing on a chemoautotrophic bacterial key‐player 97
used should be too short for predators on smaller protists to assimilate enough labelled
prey biomass (considering that the protist prey itself needs enough time to become
significantly labelled through bacterivory), and an enrichment through osmotrophy with
[13C]‐bicarbonate proceeding from the "S. gotlandica" strain GD1 culture media would also
be observed in the prokaryotic community. Thus, we can conclude that all enrichment in
the protists community occurred exclusively through the ingestion and assimilation of "S.
gotlandica" strain GD1 biomass.
Identification of active grazers on "Sulfurimonas gotlandica" strain GD1
In the present study we identified 5 clearly and 3 potentially enriched protist taxa,
indicating that they were active grazers on "S. gotlandica" strain GD1. Clearly enriched taxa
belonged to typical ciliate groups for hypoxic water masses: Oligohymenophorea and
Prostomatea (Fenchel et al. 1990; Guhl et al. 1996; Stock et al. 2009; Stoeck et al. 2009),
and flagellate groups widely spread in marine systems, including hypoxic water masses
(e.g., Stoeck & Epstein 2003; Behnke et al. 2006; Orsi et al. 2011), which are increasingly
recognized as major bacterivores for surface waters: MAST‐4 (Massana et al. 2006, 2009),
Chrysophyta (Not et al. 2008) and Cercozoa (Bass & Cavalier‐Smith 2004; Piwosz &
Pernthaler 2009). Of the latter three, the cercozoan OTU clustered within the novel clade
VI (Bass & Cavalier‐Smith 2004; Bass et al. 2009), which to date is only known at a
sequence level, allowing us to assign an ecological role for the first time to a member of
this clade. Of the potentially enriched taxa, one belonged to the ciliate group Armophorea,
and the other two were only distantly related to cultured representatives, and grouped
within the euglenozoans and the dinoflagellates.
Other identified OTUs tended to group with sequences obtained from hypoxic
environments, such as the Framvaren and Mariager Fjords (Zuendorf et al. 2006; Behnke
et al. 2010) and the Black Sea (Coolen & Shtereva 2009; Wylezich & Jürgens 2011); and were
dominated by ciliates. One sequenced OTU (Band H) belonged to a recently discovered
choanoflagellate species of Baltic Sea pelagic redoxclines, Codosiga baltica n. sp. (Wylezich
et al., submitted). Among non‐enriched protists, the presence of a close relative of
Euplotes raiseta (97 % sequence identity) was surprising, since in a previous study
conducted using [13C]‐bicarbonate as substrate, the isotopic signal was transferred to a
close relative of this protist, indicative of grazing on chemoautotrophic prokaryotes
(Glaubitz et al. 2009). However, the latter study was conducted at a different study site,
under higher hydrogen sulphide concentrations, and with a wider prey pool (grazing on

98 Chapter 3
the whole assemblage of [13C]‐enriched prokaryotes). Therefore, habitat and prey
optimization could play an important role in the different results obtained.
Finally, the identification of flagellate taxa as active grazers on "Sulfurimonas
gotlandica" strain GD1 is an additional interesting point. A previous study determined that,
due to their very low abundance, heterotrophic nanoflagellates (HNF) could not be major
bacterivores on the prokaryotic community (Chapter 2). Here we show that flagellates
could still have a significant impact on pelagic redoxcline prokaryotic community through
selective feeding on highly active members.
3.6. Conclusions
The present study demonstrates, for the first time, that protist grazing can account for the
complete cell production of a chemolithoautotrophic key‐player of Baltic Sea pelagic
redoxclines, the Sulfurimonas subgroup GD17, thus constituting a major regulating factor
for the growth, and potentially the distribution, of this prokaryotic group. We additionally
show a higher grazing impact on this bacteria at depths where it is actively growing,
indicating an adaptation of the protist community in these zones to feeding on active
Sulfurimonas subgroup GD17. RNA stable isotope probing was successfully combined to
unamended sea water incubations to identify active grazers on the Sulfurimonas subgroup
GD17. Through this method, flagellates, which were previously identified as negligible
grazers on the total prokaryotic community, were shown to potentially still be having a
significant impact on the prokaryotic community through selective grazing on highly
active members.

Conclusions and outlook 99
Conclusions and outlook
In the present thesis, two case studies of under‐researched fields in protist‐bacteria
interactions were presented and further explored. The first addressed a species level
interaction, assessing how the starvation‐survival state alters the vulnerability of bacteria
to a given protist grazer. The second addressed an under‐explored environment, looking at
the ecological relevance of protist grazers in pelagic redoxclines, with two deep Baltic Sea
basins as model systems. The results obtained highlight the unexplored potential of `the
less travelled roads´ in protist ecology and protist‐bacteria interactions, and pin‐point
interesting new avenues for future research. In the following the principal results obtained
and remaining open questions are detailed:
The starvation survival state and its relation to grazing vulnerability
In chapter 1 of the present work I demonstrate through the use predator‐prey model
systems that the starvation‐survival state can confer a lower vulnerability to protist
grazing, but the response is highly species‐specific. These results cannot be directly
extrapolated to the environment, but show for the first time that resistance to protist
grazing is possible for carbon‐starved bacteria, and set an intriguing base for future
studies. Conceptually, the carbon‐starved fraction of prokaryotic communities could
present three different levels of vulnerability to protist grazers, with different implications
for ecosystem productivity (Fig. i):
(1) Most carbon‐starved bacteria are resistant to protist grazing (e.g., V. vulnificus),
implying little or no losses for these cells (Fig. iA). The prey base available to protists is
therefore reduced, leading to a lower new protist biomass production and a higher grazing
pressure on the edible fraction of the prokaryotic community.
(2) Carbon‐starved bacteria have a low vulnerability to protist grazers and
experience strongly reduced losses in comparison to the rest of the prokaryotic

100 Conclusions and outlook
community (Fig. iB). This could occur through a predominance of carbon‐starved bacteria
with lowered food quality, which could e.g., be selected against (e.g., S. alaskensis); or
through a mix of difference levels of food qualities and vulnerabilities, leading to only part
of these the cells being consumed. New protist biomass would be higher than in the
previous scenario, allowing a higher productivity.
(3) Resistance to protist grazing is rare, and most carbon‐starved bacteria have a
good food‐quality (e.g., P. angustum, or the mixed community tested in González et al.
1993) (Fig. iC). Grazing losses would be high, and would only be reduced in comparison to
other members of the prokaryotic community due to smaller cell‐size (i.e. lower encounter
rates with grazers). This scenario would lead to the highest new protist biomass
production and transfer of carbon and energy to higher levels in the food‐chain.
Figure i. Hypothetical scenarios of how altered vulnerabilities of carbon starved bacteria to
protist grazing could affect protist biomass production and energy transfer to higher trophic
levels. (A) resistance; (B) low vulnerability; and (C) high vulnerability. Orange boxes and arrows
indicate carbon starved bacteria; grey boxes and arrows indicate the remaining prokaryotic
community.
These conceptual models are highly simplified, since the outcome will also be
influenced by e.g., the edibility of the other members of the prokaryotic community and
other microbial food‐web interactions. However, they serve to highlight the potential
implications of the vulnerability of carbon‐starved bacteria to the productivity of
Conclusions and outlook 101
oligotrophic environments. A full study of interactions between different bacterivores and
model prey, and the potential underlying mechanisms to reduced vulnerability or
resistance to grazers (e.g., resistance to digestion (King & Shotts 1988; Barker & Brown
1994) or toxin production (Matz et al. 2004, 2005)), are important first steps to unveiling
the relevance of these phenomena in oligotrophic environments.
It should also be noted that differing patterns in the vulnerability of carbon‐starved
bacteria to protist grazers will affect the capacity of these cells to survive for long time
periods (from months to years) (Fig. i). From an anthropogenic point of view, this could be
especially important for diverse pathogenic bacteria which are known to enter the
starvation‐survival state (e.g., Vibrio cholerae and many virulent enteric bacteria
(Kjelleberg 1993; Spector & Kenyon 2012)). In the present study, Vibrio vulnificus, a
septicaemia causing human pathogen found in marine and brackish systems (Oliver 2006),
could completely resist protist grazing. Thus, a need exists for further studies on these
particular bacteria, with consideration to its implications for environmental standing
stocks of pathogens.
The ecological relevance of protist grazers in pelagic redoxclines
In the present work I successfully optimized existing techniques for the estimation of
protist bacterivory rates and the identification of grazers (FLB, predator‐exclusion and
RNA‐SIP) for the application to redoxcline environments. Combined with microscopy
analysis, this allowed a first detailed vision of the structuring and ecological relevance of
Baltic Sea redoxcline protist communities (chapters 2 and 3). The following principal
points were unveiled:
a) Baltic Sea redoxclines host characteristic and highly stratified protist
communities, with clear suboxic, O2 / H2S interface, and anoxic / sulphidic
protist associations.
b) Bacterivory is the major prokaryotic mortality factor at suboxic and O2 / H2S
interface zones, but decreases strongly in relevance at sulphidic depths.
c) Protist grazing is, for the first time, demonstrated to be capable of controlling the
growth of a redoxcline chemolithoautotrophic key‐player, indicating the
potential regulating role of grazing for biogeochemical cycling (in this case
denitrification and H2S oxidation).

102 Conclusions and outlook
Ciliate morphotypes detected in this work primarily fell within those `typical´ for
redoxcline systems (e.g., Fenchel et al. 1995), though the presence of Metacystis spp. as a
major component in terms of abundance could be characteristic for Baltic Sea redoxclines.
For dinoflagellates, the taxonomic resolution of the methods employed was very low. It
should be noted that, overall, knowledge on redoxcline dinoflagellate populations is
scarce. As seen in the present work, they tend to be abundant when O2 is still present, but
decrease strongly on from the O2 / H2S interface (Chapter 2, Fig. 2.2 & 2.4., and, e.g.,
Fenchel et al. 1990). However, they can still be detected in 18S rRNA based surveys of
protist diversity in anoxic systems, indicative of not only of presence but also of activity
(Stoeck et al. 2007; Alexander et al. 2009; Wylezich & Jürgens 2011). In the present work, a
protist affiliated to dinoflagellates was putatively seen to incorporate labelled Sulfurimonas
subgroup GD17 (Epsilonproteobacteria) biomass at the O2 / H2S interface (Chapter 3, Fig.
3.6 & 3.7 (band Q); Supplementary fig. S3.1B). This indicates that they could be active,
potentially relevant, bacterivores in this zone. Finally, for heterotrophic nanoflagellates
(HNF), most identified species showed a wide distribution throughout the O2 gradient
(Chapter 2, Fig. 2.5), though it remains to be revealed whether these are indeed species
with a wide physico‐chemical tolerance or are in fact genetically different strains with a
highly similar morphology. A recent study of two choanoflagellate strains, isolated
respectively from suboxic and sulphidic zones of Baltic Sea redoxclines and identified as
two novel Codosiga species, showed traits indicative of adaptation to their respective
environments, but also the capacity to grow under fully‐oxygenated conditions (Wylezich
et al., in preparation). Overall, it is likely that fluctuating redoxcline conditions, with
small‐scale mixing episodes and larger inflow events, favour protist species capable to
adapting and even exploiting transiently unfavourably conditions.
Protist grazing impact on the whole prokaryotic community
Protist grazing was revealed in the present work as the major prokaryotic mortality
factor for Baltic Sea redoxcline prokaryotic communities at suboxic and O2 / H2S interface
zones, accounting respectively for an average 80 and 50 % of standing stocks per day
(Chapter 2; Table 2.3). Food‐vacuole analysis and theoretical considerations showed that
ciliates and dinoflagellates will be the main bacterivores in these zones. In contrast to
grazing, frequencies of virally infected cells remained low, indicating a low viral impact
(Chapter 2; Fig. 2.7). Thus, food web structuring differs from that normally found in
oxygenated surface waters, with microzooplankton (ciliates and dinoflagellates) acting as
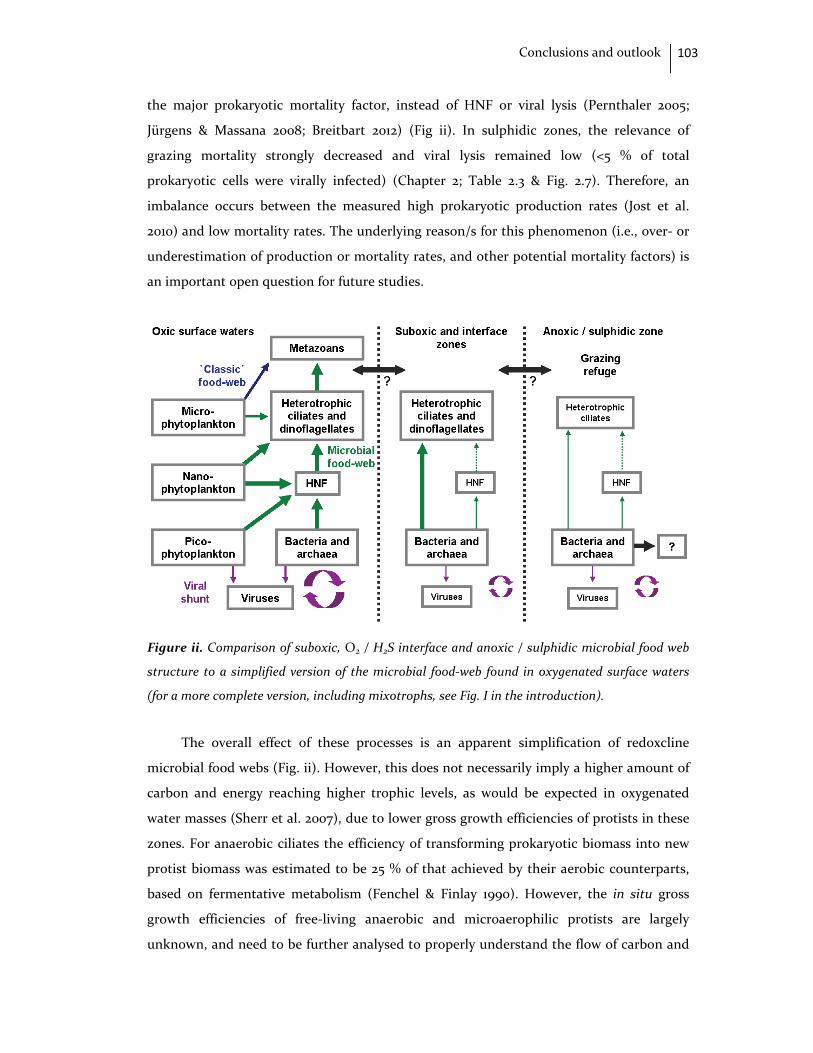
Conclusions and outlook 103
the major prokaryotic mortality factor, instead of HNF or viral lysis (Pernthaler 2005;
Jürgens & Massana 2008; Breitbart 2012) (Fig ii). In sulphidic zones, the relevance of
grazing mortality strongly decreased and viral lysis remained low (<5 % of total
prokaryotic cells were virally infected) (Chapter 2; Table 2.3 & Fig. 2.7). Therefore, an
imbalance occurs between the measured high prokaryotic production rates (Jost et al.
2010) and low mortality rates. The underlying reason/s for this phenomenon (i.e., over‐ or
underestimation of production or mortality rates, and other potential mortality factors) is
an important open question for future studies.
Figure ii. Comparison of suboxic, O2 / H2S interface and anoxic / sulphidic microbial food web
structure to a simplified version of the microbial food‐web found in oxygenated surface waters
(for a more complete version, including mixotrophs, see Fig. I in the introduction).
The overall effect of these processes is an apparent simplification of redoxcline
microbial food webs (Fig. ii). However, this does not necessarily imply a higher amount of
carbon and energy reaching higher trophic levels, as would be expected in oxygenated
water masses (Sherr et al. 2007), due to lower gross growth efficiencies of protists in these
zones. For anaerobic ciliates the efficiency of transforming prokaryotic biomass into new
protist biomass was estimated to be 25 % of that achieved by their aerobic counterparts,
based on fermentative metabolism (Fenchel & Finlay 1990). However, the in situ gross
growth efficiencies of free‐living anaerobic and microaerophilic protists are largely
unknown, and need to be further analysed to properly understand the flow of carbon and

104 Conclusions and outlook
energy in these zones. For this, culturing of environmentally relevant protist species and
autoecology studies are necessary. However, the application of culture independent –
omics techniques (transcriptomics, genomics and proteomics) could be an invaluable tool
for uncovering the bulk metabolic potential of protist in these zones, as has been done for
prokaryotes in different water masses (Vieites et al. 2009; Gilbert & Dupont 2011; Morales &
Holben 2011; Tomanek 2011; Zehr & Kudela 2011).
Another important point for future studies is the magnitude and relevance of carbon
and energy flows between oxic and suboxic to anoxic water masses. Higher organisms have
been shown to conduct feeding forays into hypoxic zones, thereafter returning to oxic
waters for digestion and growth (e.g., fish (Neuenfeldt et al. 2009), metazoans (De
Robertis et al. 2001) or jellyfish (Markulla et al., unpublished data)). They thus effectively
act as a shuttle of carbon and energy out of the system. A similar transport system, though
acting in both directions, could be protists that conduct long vertical migrations from
surface waters to nutrient rich redoxcline zones (Mamaeva 1988). The latter phenomenon
could explain the presence of pigment containing Dinophysis sp. and Mesodinium spp. at
respectively suboxic and O2 / H2S interface zones (the latter observed live under the
microscope), since both species have been previously postulated to conduct large vertical
migrations in search of nutrients (Villarino et al. 1995; Olli 1999; Gisselson et al. 2002).
Specific grazing on a prokaryotic key‐player for Baltic Sea biogeochemical cycling
In the present work, protist grazing was shown to effectively control the growth and
abundance of a chemolithoautotrophic key‐player of Baltic Sea redoxclines, the
Sulfurimonas subgroup GD17 (Epsilonproteobacteria), consuming above 100 % of the daily
cell production (Chapter 3, Table 3.2). The high growth exhibited by the Sulfurimonas
subgroup GD17 in absence of grazers at the O2 / H2S interface, confirm studies that
postulated this as an optimal growth zone for this bacterial group (Grote et al. 2012) (Fig.
iii). Further, the high grazing rates obtained serve as a potential explanation as to why the
maxima in Sulfurimonas subgroup GD17 abundance and chemoautotrophic production are
often found deeper in the water column than their theoretical optimal growth zone (Fig.
iii), with this bacterial group shifting its vertical distribution into zones where grazing is
greatly decreased (refuge zone) (Fig. iii).
The strong grazing impact on the Sulfurimonas subgroup GD17 could also have
important implications for how the prokaryotic community is structured. The high growth
rates exhibited by this bacterial group in absence of grazers at the O2 / H2S interface
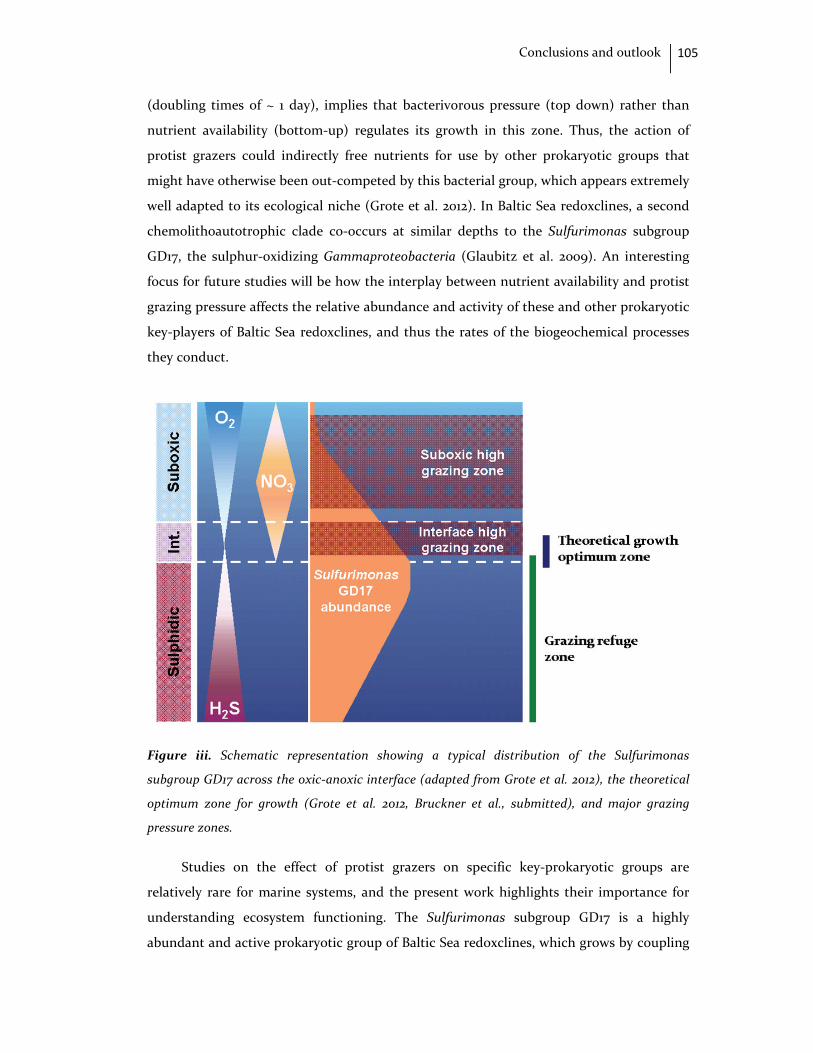
Conclusions and outlook 105
(doubling times of ~ 1 day), implies that bacterivorous pressure (top down) rather than
nutrient availability (bottom‐up) regulates its growth in this zone. Thus, the action of
protist grazers could indirectly free nutrients for use by other prokaryotic groups that
might have otherwise been out‐competed by this bacterial group, which appears extremely
well adapted to its ecological niche (Grote et al. 2012). In Baltic Sea redoxclines, a second
chemolithoautotrophic clade co‐occurs at similar depths to the Sulfurimonas subgroup
GD17, the sulphur‐oxidizing Gammaproteobacteria (Glaubitz et al. 2009). An interesting
focus for future studies will be how the interplay between nutrient availability and protist
grazing pressure affects the relative abundance and activity of these and other prokaryotic
key‐players of Baltic Sea redoxclines, and thus the rates of the biogeochemical processes
they conduct.
Figure iii. Schematic representation showing a typical distribution of the Sulfurimonas
subgroup GD17 across the oxic‐anoxic interface (adapted from Grote et al. 2012), the theoretical
optimum zone for growth (Grote et al. 2012, Bruckner et al., submitted), and major grazing
pressure zones.
Studies on the effect of protist grazers on specific key‐prokaryotic groups are
relatively rare for marine systems, and the present work highlights their importance for
understanding ecosystem functioning. The Sulfurimonas subgroup GD17 is a highly
abundant and active prokaryotic group of Baltic Sea redoxclines, which grows by coupling

106 Conclusions and outlook
dark CO2 fixation to H2S oxidation and NO3 reduction (Grote et al. 2007, 2008, 2012;
Glaubitz et al. 2009). As a denitrifier it contributes to Baltic Sea nitrogen losses, and as a
H2S reducer, it effectively acts as a detoxifier of sulphidic water masses (Grote et al. 2012).
Both processes could be highly important for the strongly eutrophic Baltic Sea. NO3 and
NO2 trigger microalgae bloom formation in surface waters, and the degradation of
resulting organic matter intensifies suboxic and anoxic conditions in bottom waters. The
resulting spread in hypoxic conditions can impact higher organisms and consequently
Baltic Sea fisheries. As an example, the cod‐fish requires higher salinity (~ 11 ‰)
oxygenated waters for successful egg fertilization and development, with spreading
hypoxic conditions thus seriously impacting spawning (Rheinheimer 1995; Limburg et al.
2011). H2S, on the other hand, is highly toxic for aerobic organisms, triggering mass
mortality events (Theede 1973; Vaquer‐Sunyer & Duarte 2008). Thus, the effect of protist
grazers on the abundance and, therefore, the population level activity of the Sulfurimonas
subgroup GD17 and, potentially, other highly active key‐prokaryotic groups involved in the
nitrogen and sulphur cycles, could impact the Baltic Sea ecosystem as a whole.
In the present work, a combination of `black‐box´ approaches to obtain bulk rates,
and techniques that identified prokaryotic prey (CARD‐FISH) (Jezbera et al. 2005; Lin et
al. 2007; Šimek et al. 2007; Bautista‐Reyes & Macek 2012) and protist grazers (RNA‐SIP)
(Lueders et al. 2006; Frias‐Lopez et al. 2009; Moreno et al. 2010) were applied. This allowed
not only the determination of the community level bacterivorous impact, but also a first
glimpse at possible underlying species‐specific interactions, such as selective HNF grazing
on the Sulfurimonas subgroup GD17. Future studies should continue in this direction,
analysing the implications of selective grazing, symbiotic and parasitic relationships and
host‐specific viral lysis on biogeochemical cycling in suboxic to anoxic water masses. As
an example, nano‐scale resolution secondary ion mass spectrometry (Nano‐SIMS) (Li et al.
2008; Foster et al. 2011; Ploug et al. 2011), and single‐cell genomics (Not et al. 2009;
Martínez‐Garcia et al. 2011; Yoon et al. 2011) could constitute optimal methodologies for
observing how protists, prokaryotes and viruses interact to shape the microbial food web.
Finally, its worth noting that in a recent study, Edgcom et al. (2011b) revealed that only
about 6 % of protists in deep sulphidic waters in the Cariaco Basin hybridized with a
universal 18S rRNA FISH probe (Edgcomb et al. 2011b). Thus, a wide range of protist
organisms, genetically highly divergent from those known to date, and with unknown
ecosystem functions, could still remain to be discovered.

Bibliography 107
Bibliography
Aarup T. (2002) Transparency of the North Sea and Baltic Sea ‐ a Secchi depth data mining
study. Oceanologia 44: 323‐337
Abe T., T. Hoshino, A. Nakamura and N. Takaya (2007) Anaerobic elemental sulfur reduction
by fungus Fusarium oxysporum. Bioscience Biotechnology and Biochemistry 71: 2402‐
2407
Adl S. M., A. G. B. Simpson, M. A. Farmer, R. A. Andersen, O. R. Anderson, J. R. Barta, S. S.
Bowser, G. Brugerolle, R. A. Fensome, S. Fredericq, T. Y. James, S. Karpov, P. Kugrens, J.
Krug, C. E. Lane, L. A. Lewis, J. Lodge, D. H. Lynn, D. G. Mann, R. M. McCourt, L.
Mendoza, Ø. Moestrup, S. E. Mozley‐Standridge, T. A. Nerad, C. A. Shearer, A. V.
Smirnov, F. W. Spiegel and M. F. J. R. Taylor (2005) The new higher level classification of
eukaryotes with emphasis on the taxonomy of protists. Journal of Eukaryotic
Microbiology 52: 399‐451
Akhmanova A., F. Voncken, A. van Alen, A. van Hoek, B. Boxma, G. Vogels, M. Veenhuis and J.
Hackstein (1998) A hydrogenosome with a genome. Nature 396: 527–528
Albertson N. H., T. Nyström and S. Kjelleberg (1990) Exoprotease activity of two marine
bacteria during starvation. Applied and Environmental Microbiology 56: 218‐223
Alexander E., S. Alexandra, H.‐W. Breiner, A. Behnke, J. Bunge, M. M. Yakimov, and T. Stoeck
(2009) Microbial eukaryotes in the hypersaline anoxic L’Atalante deep‐sea basin.
Environmental Microbiology 11: 360–381
Altschul S. F., T. L. Madden, A. A. Schaffer, J. Zhang, Z. Zhang, W. Miller and D. J. Lipman
(1997) Gapped BLAST and PSI‐BLAST: a new generation of protein database search
programs. Nucleic Acids Research 25 3389–3402
Amy P. S. and R. Y. Morita (1983) Starvation‐survival patterns of sixteen freshly isolated open‐
ocean bacteria. Applied and Environmental Microbiology 45: 1109‐1115

108 Bibliography
Atkins M. S., M. A. Hanna, E. A. Kupetsky, M. A. Saito, C. D. Taylor and C. O. Wirsen (2002)
Tolerance of flagellated protists to high sulfide and metal concentrations potentially
encountered at deep‐sea hydrothermal vents. Marine Ecology Progress Series 226: 63‐75
Azam F., T. Fenchel, J. G. Field, J. S. Gray, L. A. Meyer‐Reil and F. Thingstad (1983) The
ecological role of water‐column microbes in the sea. Marine Ecology Progress Series 10:
257‐263
Baldauf S. (2008) An overview of the phylogeny and diversity of eukaryotes. Journal of
Systematics and Evolution 46: 263‐273
Bark A. W. (1985) Studies on ciliated protozoa in eutrophic lakes: 1. Seasonal distribution in
relation to thermal stratification and hypolimnetic anoxia. Hydrobiologia 124: 167‐176
Barker J. and M. R. W. Brown (1994) Trojan horses of the microbial world: protozoa and the
survival of bacterial pathogens in the environment. Microbiology 140: 1253‐1259
Bass D. and T. Cavalier‐Smith (2004) Phylum‐specific environmental DNA analysis reveals
remarkably high global biodiversity of Cercozoa (Protozoa). International Journal of
Systematic and Evolutionary Microbiology 54: 2393–2404
Bass D., E. E.‐Y. Chao, S. Nikolaev, A. Yabuki, K.‐i. Ishida, C. Berney, U. Pakzad, C. Wylezich
and T. Cavalier‐Smith (2009) Phylogeny of novel naked filose and reticulose Cercozoa:
Granofilosea cl. n. and Proteomyxidea revised. Protist 160: 75‐109
Bautista‐Reyes F. and M. Macek (2012) Ciliate food vacuole content and bacterial community
composition in the warm‐monomictic crater Lake Alchichica, Mexico. FEMS
Microbiology Ecology 79: 85–97
Behnke A., J. Bunge, K. Barger, H. W. Breiner, V. Alla and T. Stoeck (2006) Microeukaryote
community patterns along an O2/H2S gradient in a supersulfidic anoxic Fjord
(Framvaren, Norway). Applied and Environmental Microbiology 72: 3626 ‐ 3636
Behnke A., K. J. Barger, J. Bunge and T. Stoeck (2010) Spatio‐temporal variations in protistan
communities along an O2/H2S gradient in the anoxic Framvaren Fjord (Norway). FEMS
Microbiology Ecology 72: 89‐102
Bernard C., A. G. B. Simpson and D. J. Patterson (2000) Some free‐living flagellates from anoxic
habitats. Ophelia 52: 113‐142
Bettarel Y., T. Sime‐Ngando, C. Amblard and J. Dolan (2004) Viral activity in two contrasting
lake ecosystems. Applied and Environmental Microbiology 70: 2941‐2951

Bibliography 109
Bettarel Y., T. Sime‐Ngando, M. Bouvy, R. Arfi and C. Amblard (2005) Low consumption of
virus‐sized particles by heterotrophic nanoflagellates in two lakes of the French Massif
Central. Aquatic Microbial Ecology 39: 205‐209
Bjørnsen P. K. (1986) Automatic determination of bacterioplankton biomass by image analysis.
Applied and Environmental Microbiology 51: 1199‐1204
Boenigk J. and H. Arndt (2000) Particle handling during interception feeding by four species of
heterotrophic nanoflagellates. Journal of Eukaryotic Microbiology 47: 350‐358
Boenigk J. and H. Arndt (2002) Bacterivory by heterotrophic flagellates: community structure
and feeding strategies. Antonie van Leeuwenhoek 81: 465‐480
Boenigk J., C. Matz, K. Jürgens and H. Arndt (2001) Confusing selective feeding with
differential digestion in bacterivorous nanoflagellates. Journal of Eukaryotic Microbiology
48: 425‐432
Boenigk J., C. Matz, K. Jürgens and H. Arndt (2002) Food concentration‐dependent regulation
of food selectivity of interception‐feeding bacterivorous nanoflagellates. Aquatic
Microbial Ecology 27: 195‐202
Boenigk J., K. Pfandl and P. J. Hansen (2006) Exploring strategies for nanoflagellates living in a
‘wet desert’. Aquatic Microbial Ecology 44: 71‐83
Børsheim K. Y. and G. Bratbak (1987) Cell‐volume to cell carbon conversion factors for a
bacterivorous Monas sp. enriched from seawater. Marine Ecology Progress Series 36: 171‐
175
Boxma B., R. M. de Graaf, G. W. M. van der Staay, T. A. van Alen, G. Ricard, T. Gabaldon, A. H.
A. M. van Hoek, S. Y. Moon‐van der Staay, W. J. H. Koopman, J. J. van Hellemond, A. G.
M. Tielens, T. Friedrich, M. Veenhuis, M. A. Huynen and J. H. P. Hackstein (2005) An
anaerobic mitochondrion that produces hydrogen. Nature 434: 74‐79
Brackman G., S. Celen, K. Baruah, P. Bossier, S. Van Calenbergh, H. J. Nelis and T. Coenye
(2009) AI‐2 quorum‐sensing inhibitors affect the starvation response and reduce
virulence in several Vibrio species, most likely by interfering with LuxPQ. Microbiology
155: 4114‐4122
Brauer M. J., J. Yuan, B. D. Bennett, W. Lu, E. Kimball, D. Botstein and J. D. Rabinowitz (2006)
Conservation of the metabolomic response to starvation across two divergent microbes.
Proceedings of the National Academy of Sciences of the United States of America 103:
19302‐19307

110 Bibliography
Breitbart M. (2012) Marine viruses: truth or dare. Annual Review of Marine Science 4: 425‐448
Breitbart M., L. Wegley, S. Leeds, T. Schoenfeld and F. Rowher (2004) Phage community
dynamics in hot springs. Applied and Environmental Microbiology 70: 1633‐1640
Breitbart M., M. Middelboe and F. Rohwer (2008) Marine viruses: community dynamics,
diversity and impact on microbial processes. In: Microbial ecology of the oceans, edited
by D. L. Kirchman. John Wiley & Sons, Hoboken, New Jersey. pp. 443‐468
Brettar I., M. Labrenz, S. Flavier, J. Botel, H. Kuosa, R. Christen and M. G. Höfle (2006)
Identification of a Thiomicrospira denitrificans‐like epsilonproteobacterium as a catalyst
for autotrophic denitrification in the central Baltic Sea. Applied and Environmental
Microbiology 72: 1364‐1372
Britos L., E. Abeliuk, T. Taverner, M. Lipton, H. McAdams and L. Shapiro (2011) Regulatory
response to carbon starvation in Caulobacter crescentus. PLoS ONE 6: e18179
Bruns A., H. Cypionka and J. Overmann (2002) Cyclic AMP and acyl homoserine lactones
increase the cultivation efficiency of heterotrophic bacteria from the Central Baltic Sea.
Applied and Environmental Microbiology 68: 3978‐3987
Brussaard C. P. D. (2004) Optimization of procedures for counting viruses by flow cytometry.
Applied and Environmental Microbiology 70: 1506‐1513
Callieri C., G. Corno and R. Bertoni (2006) Bacterial grazing by mixotrophic flagellates and
Daphnia longispina: a comparison in a fishless alpine lake. Aquatic Microbial Ecology 42:
127‐137
Campbell B. J., A. S. Engel, M. L. Porter and K. Takai (2006) The versatile ε‐proteobacteria: key
players in sulphidic habitats. Nature Reviews Microbiology 4: 458‐468
Caron D. A., K. G. Porter and R. W. Sanders (1990) Carbon nitrogen and phosphorus budgets
for the mixotrophic phytoflagellate Poteriochromonas malhamensis chrysophyceae
during bacterial ingestion. Limnology and Oceanography 35: 433‐443
Caron D. A., A. Z. Worden, P. D. Countway, E. Demir and K. A. Heidelberg (2009) Protists are
microbes too: a perspective. The ISME journal 3: 4‐12
Caron D. A., P. D. Countway, A. C. Jones, D. Y. Kim and A. Schnetzer (2012) Marine protistan
diversity. Annual Review of Marine Science 4: 467‐493
Carpenter S. R., J. J. Cole, J. R. Hodgson, J. F. Kitchell, M. L. Pace, D. Bade, K. L. Cottingham, T.
E. Essington, J. N. Houser and D. E. Schindler (2001) Trophic cascades, nutrients, and
lake productivity: whole‐lake experiments. Ecological Monographs 71: 163‐186
Bibliography 111
Casamayor E. O., J. García‐Cantizano and C. Pedrós‐Alió (2008) Carbon dioxide fixation in the
dark by photosynthetic bacteria in sulfide‐rich stratified lakes with oxic‐anoxic
interfaces. Limnology and Oceanography 53: 1193‐1203
Cavalier‐Smith T. (2002) The phagotrophic origin of eukaryotes and phylogenetic classification
of Protozoa. International Journal of Systematic and Evolutionary Microbiology 52: 297‐
354
Cavicchioli R., F. Fegatella, M. Ostrowski, M. Eguchi and J. Gottschal (1999) Sphingomonads
from marine environments. Journal of Industrial Microbiology and Biotechnology 23:
268‐272
Cavicchioli R., M. Ostrowski, F. Fegatella, A. Goodchild and N. Guixa‐Boixereu (2003) Life
under nutrient limitation in oligotrophic marine environments: An eco/physiological
perspective of Sphingopyxis alaskensis (formerly Sphingomonas alaskensis). Microbial
Ecology 45: 203‐217
Choi D. H., C. Y. Hwang and C. C. Byung (2003) Comparison of virus‐ and bacterivory‐induced
mortality in the eutrophic Masan Bay, Korea. Aquatic Microbial Ecology 30: 117‐125
Christaki U., S. Jacquet, J. R. Dolan, D. Vaulot and F. Rassoulzadegan (1999) Growth and
grazing on Prochlorococcus and Synechococcus by two marine ciliates. Limnology and
Oceanography 44: 52‐61
Christman G. D., M. T. Cottrell, B. N. Popp, E. Gier and D. L. Kirchman (2011) Abundance,
diversity, and activity of ammonia‐oxidizing prokaryotes in the coastal Arctic Ocean in
summer and winter. Applied and Environmental Microbiology 77: 2026‐2034
Christoffersen K., O. Nybroe, K. Jürgens and M. Hansen (1997) Measurement of bacterivory by
heterotrophic nanoflagellates using immunofluorescence labelling of ingested cells.
Aquatic Microbial Ecology 13: 127‐134
Coolen M. J. and G. Shtereva (2009) Vertical distribution of metabolically active eukaryotes in
the water column and sediments of the Black Sea. FEMS Microbiology Ecology 70: 525‐
539
Corliss J. O. (2002) Biodiversity and biocomplexity of the protists and an overview of their
significant roles in maintenance of our biosphere. Acta Protozoologica 41: 199‐219
Corno J. (2008) Structural and functional patterns of bacterial communities in response to
protist predation along an experimental productivity gradient. Environmental
Microbiology 10 2857–2871

112 Bibliography
Courties C., A. Vaquer, M. Troussellier, J. Lautier, M. J. Chretiennot‐Dinet, J. Neveux, C.
Machado and H. Claustre (1994) Smallest eukaryotic organism. Nature 370: 255
Cuevas L. A. and C. E. Morales (2006) Nanoheterotroph grazing on bacteria and cyanobacteria
in oxic and suboxic waters in coastal upwelling areas off northern Chile. Journal of
Plankton Research 28: 385‐397
Dahlgren K., A. Andersson, U. Larsson and U. Båmstedt (2010) Planktonic production and
carbon transfer efficiency along a north‐south gradient in the Baltic Sea. Marine Ecology
Progress Series 409: 77‐94
Daims H., A. Bruhl, R. Amann, K. H. Schleifer and M. Wagner (1999) The domain‐specific
probe EUB338 is insufficient for the detection of all Bacteria: development and
evaluation of a more comprehensive probe set. Systematic and Applied Microbiology 22:
434‐444
Danovaro R., A. Dell´Anno, A. Pusceddu, C. Gambi, I. Heiner and R. M. Kristensen (2010) The
first metazoa in permanently anoxic conditions. BMC Biology 8: 30
De Robertis A., K. Eiane and G. H. Rau (2001) Eat and run: anoxic feeding and subsequent
aerobic recovery by Orchomene obtusus in Saanich Inlet, British Columbia, Canada.
Marine Ecology Progress Series 219: 221–227
Detmer A. E., H. C. Giesenhagen, V. M. Trenkel, H. Auf dem Venne and F. J. Jochem (1993)
Phototrophic and heterotrophic pico‐ and nanoplankton in anoxic depths of the central
Baltic Sea. Marine Ecology Progress Series 99: 197‐203
Deutsch C. and T. Weber (2012) Nutrient ratios as a tracer and driver of ocean
biogeochemistry. Annual Review of Marine Science 4: 113‐141
Díez B., C. Pedrós‐Alió, T. L. Marsh and R. Massana (2001) Application of denaturing gradient
gel electrophoresis (DGGE) to study the diversity of marine picoeukaryotic assemblages
and comparison of DGGE with other molecular techniques. Applied and Environmental
Microbiology 67: 2942‐2951
Dolan J. R. (1997) Phosphorus and ammonia excretion by planktonic protists. Marine Geology
139: 109‐122
Dolan J. R. and K. McKeon (2005) The reliability of grazing rate estimates from dilution
experiments: Have we over‐estimated rates of organic carbon consumption by
microzooplankton? Ocean Science 1: 1‐7

Bibliography 113
Eccleston‐Parry J. D. and B. S. C. Leadbeater (1994) A comparison of the growth kinetics of six
marine heterotrophic nanoflagellates fed with one bacterial species. Marine Ecology
Progress Series 105: 167‐177
Eccleston‐Parry J. D. and B. S. C. Leadbeater (1995) Regeneration of phosphorus and nitrogen
by four species of heterotrophic nanoflagellates feeding on three nutritional states of a
single bacterial strain. Applied and Environmental Microbiology 61: 1033‐1038
Edgcomb V., W. Orsi, J. Bunge, S. Jeon, R. Christen, C. Leslin, M. Holder, G. T. Taylor, P.
Suarez, R. Varela and S. Epstein (2011a) Protistan microbial observatory in the Cariaco
Basin, Caribbean. I. Pyrosequencing vs Sanger insights into species richness. The ISME
journal 5: 1344‐1356
Edgcomb V., W. Orsi, G. T. Taylor, P. Vdacny, C. Taylor, P. Suarez and S. Epstein (2011b)
Assesing marine protists from the anoxic Cariaco Basin. The ISME journal 5: 1237‐1241
Edgcomb V. P., S. A. Breglia, N. Yubuki, D. Beaudoin, D. J. Patterson, B. S. Leander and J. M.
Bernhard (2011c) Identity of epibiotic bacteria on symbiontid euglenozoans in O2‐
depleted marine sediments: evidence for symbiont and host co‐evolution. The ISME
Journal 5: 231‐243
Edgcomb V. P., E. R. Leadbetter , W. Bourland, D. Beaudoin and J. M. Bernhard (2011d)
Structured multiple endosymbiosis of bacteria and archaea in a ciliate from marine
sulfidic sediments: a survival mechanism in low oxygen, sulfidic sediments? Frontiers in
Microbiology 2: 1‐16
Eguchi M., T. Nishikawa, K. MacDonald, R. Cavicchioli, J. C. Gottschal and S. Kjelleberg (1996)
Responses to stress and nutrient availability by the marine ultramicrobacterium
Sphingomonas sp. strain RB2256. Applied and Environmental Microbiology 62: 1287‐1294
Esteban G. F., T. Fenchel and B. J. Finlay (2010) Mixotrophy in ciliates. Protist 161: 621‐641
Feistel R., C. Nausch, T. Heene, J. Piechura and E. Hagen (2004) Evidence for a warm water
inflow into the Baltic Proper in summer 2003. Oceanologia 46: 581‐598
Feistel R., G. Nausch, V. Mohrholz, E. Lysiak‐Pastuszak, T. Seifert, W. Matthäus, S. Krüger and
I. S. Hansen (2003) Warm waters of summer 2002 in the deep Baltic Proper. Oceanologia
45: 571‐592
Fenchel T. (1982a) Ecology of heterotrophic flagellates. I. Some important forms and their
functional morphology. Marine Ecology Progress Series 8: 211‐223

114 Bibliography
Fenchel T. (1982b) Ecology of heterotrophic microflagellates. II. Bioenergetics and growth.
Marine Ecology Progress Series 8: 225‐231
Fenchel T. (1987) Ecology of protozoa. The biology of free‐living phagotrophic protists. Edited by
T. D. Brock. Science Tech Inc., Madison, Wisconsin
Fenchel T. (2001) Eppur si muove: many water column bacteria are motile. Aquatic Microbial
Ecology 24: 197‐201
Fenchel T. and C. Bernard (1993) A purple protist. Nature 362: 300
Fenchel T. and B. J. Finlay (1989) Microaerophily in ciliates: responses of an Euplotes secies
(Hypotrichida) to oxygen tension. Archiv für Protistenkunde 137: 317‐330
Fenchel T. and B. J. Finlay (1990) Anaerobic free‐living protozoa: growth efficiencies and the
structure of anaerobic communities. FEMS Microbiology Ecology 74: 269‐276
Fenchel T. and B. J. Finlay (1991a) The biology of free‐living anaerobic ciliates. European
Journal of Protistology 26: 201‐215
Fenchel T. and B. J. Finlay (1991b) Endosymbiotic methanogenic bacteria in anaerobic ciliates:
significance for the growth efficiency of the host. Journal of Eurkaryotic Microbiology 38:
18‐22
Fenchel T. and B. J. Finlay (1995) Ecology and evolution in anoxic worlds.
Fenchel T. and B. J. Finlay (2008) Oxygen and the spatial structure of microbial communities.
Biological Review 83: 553‐569
Fenchel T. and D. J. Patterson (1988) Cafeteria roenbergensis nov. gen., nov. sp., a
heterotrophic microflagellate from marine plankton. Marine Microbial Food Webs 3: 9‐19
Fenchel T., T. Perry and A. Thane (1977) Anaerobiosis and symbiosis with bacteria in free‐living
ciliates. Journal of Protozoology 24: 154‐163
Fenchel T., L. D. Kristensen and L. Rasmussen (1990) Water column anoxia: vertical zonation
of planktonic protozoa. Marine Ecology Progress Series 62: 1‐10
Fenchel T., C. Bernard, G. Esteban, B. J. Finlay, P. J. Hansen and N. Iversen (1995) Microbial
diversity and activity in a danish fjord with anoxic deep water. Ophelia 43: 45‐100
Ferrier‐Pagès C., M. Karner and F. Rassoulzadegan (1998) Release of dissolved amino acids by
flagellates and ciliates grazing on bacteria. Oceanologica Acta 21: 485‐494
Field C. B., M. J. Behrenfeld, J. T. Randerson and P. Falkowski (1998) Primary production of the
biosphere: integrating terrestrial and oceanic components. Science 281: 237‐240

Bibliography 115
Finlay B. J. (1981) Oxygen availability and seasonal migrations of ciliated protozoa in a
freshwater lake. Journal of General Microbiology 123: 173‐178
Finlay B. J. (1985) Nitrate respiration by protozoa (Loxodes spp.) in the hypolimnetic nitrite
maximum of a productive freshwater pond. Freshwater Biology 15: 333‐346
Finlay B. J., T. Fenchel and S. Gardener (1986) Oxygen perception and O2 toxicity in the
freshwater ciliated protozoan Loxodes. Journal of Eurkaryotic Microbiology 33: 157‐165
Foissner W. (1984) Infraciliatur, Silberliniensystem und Biometrie einiger neuer und wenig
bekannter terrestrischer, limnischer und mariner Ciliaten (Protozoa: Ciliophora) aus den
Klassen Kinetofragminophora, Colpodea und Polyhymenophora. Stapfia (Linz) 12: 1–165
Foissner W. (1991) Basic light and scanning electron microscopic methods for taxonomic
studies of ciliated protozoa. European Journal of Protistology 27: 313–330
Foissner W. and K. W. Wolf (2009) Morphology and ontogenesis of Platyophrya bromelicola
nov. spec., a new macrostome‐forming colpodid (Protists, Ciliophora) from tank
bromeliads of Jamaica. European Journal of Protistology 45: 87‐97
Foster R. A., M. M. M. Kuypers, T. Vagner, R. W. Paerl, N. Musat and J. P. Zehr (2011) Nitrogen
fixation and transfer in open ocean diatom‐cyanobacterial symbioses. The ISME Journal
5: 1484‐1493
Francis C. A., K. J. Roberts, J. M. Beman, A. E. Santoro and B. B. Oakley (2005) Ubiquity and
diversity of ammonia‐oxidizing archaea in water columns and sediments of the ocean.
Proceedings of the National Academy of Sciences of the United States of America 102:
14683‐14688
Frias‐Lopez J., A. Thompson, J. Waldbauer and S. Chisholm (2009) Use of stable isotope‐
labelled cells to identify active grazers of picocyanobacteria in ocean surface waters.
Environmental Microbiology 11: 512‐525
Fuhrman J. A. (1999) Marine viruses and their biogeochemical and ecological effects. Nature
399: 541‐548
Fuhrman J. A. and R. T. Noble (1995) Viruses and protists cause similar bacterial mortality in
coastal seawater. Limnology and Oceanography 40: 1236‐1242
Galdiereo E., G. Donnarumma, L. de Martino, A. Marcatili and G. M. Cipollaro de l'Ero, A.
(1994) Effect of low‐nutrient seawater on morphology, chemical composition, and
virulence of Salmonella typhimurium. Archives of Microbiology 162: 41‐47

116 Bibliography
Gasol J. M., C. Pedrós‐Alió and D. Vaqué (2002) Regulation of bacterial assemblages in
oligotrophic plankton systems: results from experimental and empirical approaches.
Antonie van Leeuwenhoek 81: 435‐452
Gasol J. M., E. O. Casamayor, I. Joint, K. Garde, K. Gustavson, S. Benlloch, B. Díez, M. Schauer,
R. Massana and C. Pedrós‐Alió (2004) Control of heterotrophic prokaryotic abundance
and growth rate in hypersaline planktonic environments. Aquatic Microbial Ecology 34:
193‐206
Gast V. and K. Gocke (1988) Vertical distribution of number, biomass and size‐class spectrum
of bacteria in relation to oxic/anoxic conditions in the Central Baltic Sea. Marine Ecology
Progress Series 45: 179‐186
Gilbert J. A. and C. L. Dupont (2011) Microbial metagenomics: beyond the genome. Annual
Review of Marine Science 3: 347‐371
Ginger M. L., L. K. Fritz‐Laylin, C. Fulton, W. Z. Cande and S. C. Dawson (2010) Intermediary
metabolism in protists: a sequence‐based view of facultative anaerobic metabolism in
evolutionarily diverse eukaryotes. Protist 161: 642‐671
Giorgio P. A. and J. M. Gasol (2008) Physiological structure and single‐cell activity in marine
bacterioplankton. In: Microbial ecology of the oceans, edited by D. L. Kirchman. John
Wiley & Sons, Hoboken, New Jersey. pp. 243‐285
Gisselson L.‐Å., P. Carlsson, E. Granéli and J. Pallon (2002) Dinophysis blooms in the deep
euphotic zone of the Baltic Sea: do they grow in the dark? Harmful Algae 1: 401‐418
Glaubitz S., T. Lueders, W.‐R. Abraham, G. Jost, K. Jürgens and M. Labrenz (2009) 13C‐isotope
analyses reveal that chemolithoautotrophic Gamma‐ and Epsilonproteobacteria feed a
microbial food web in a pelagic redoxcline of the central Baltic Sea. Environmental
Microbiology 11: 326–337
Glaubitz S., M. Labrenz, G. Jost and K. Jürgens (2010) Diversity of active chemolithoautotrophic
prokaryotes in the sulphidic zone of a Black Sea pelagic redoxcline as determined by
rRNA‐based stable isotope probing. FEMS Microbiology Ecology 74: 32‐41
Gobler D., Deonarine, Saxton, Lavrentyev, Jochem, Wilhelm (2008) Grazing and virus‐induced
mortality of microbial populations before and during the onset of annual hypoxia in Lake
Erie. Aquatic Microbial Ecology 51: 117‐128
Goldman J. C., D. A. Caron, O. K. Andersen and M. R. Dennett (1985) Nutrient cycling in a
microflagellate food chain: 1. Nitrogen dynamics. Marine Ecology Progress Series 24: 231‐
242

Bibliography 117
González J. M. and C. A. Suttle (1993) Grazing by marine nanoflagellates on viruses and virus‐
sized particles: ingestion and digestion. Marine Ecology Progress Series 94: 1‐10
González J. M., E. B. Sherr and B. F. Sherr (1990) Size‐selective grazing on bacteria by natural
assemblages of estuarine flagellates and ciliates. Applied and Environmental Microbiology
56: 583‐589
González J. M., E. B. Sherr and B. F. Sherr (1993) Differential feeding by marine flagellates on
growing versus starving, and on motile versus nonmotile, bacterial prey. Marine Ecology
Progress Series 102: 257‐267
Gooday A. J., S. S. Bowser, B. J. Bett and C. R. Smith (2000) A large testate protist, Gromia
sphaerica sp. nov. (Order Filosea), from the bathyal Arabian Sea. Deep Sea Research Part
II: Topical Studies in Oceanography 47: 55‐73
Grasshoff K. (1975) The hydrochemistry of landlocked basins and fjords. Edited by J. P. Riley and
G. Skirrow. Academic Press, London, UK
Grasshoff K., M. Erhardt and K. Kremling (1983) Methods of seawater analysis. Verlag Chemie,
Weinheim, Germany
Greub G. and D. Raoult (2004) Microorganisms resistant to free‐living amoebae. Clinical
Microbiology Reviews 17: 413‐433
Grossart H. P., L. Riemann and F. Azam (2001) Bacterial motility in the sea and its ecological
implications. Aquatic Microbial Ecology 25: 247‐258
Grote J. (2009) Physiology, ecology, and genomics of facultative chemoautotrophic
Epsilonproteobacteria in marine pelagic redoxclines. PhD thesis. University of Rostock,
Rostock, Germany
Grote J., M. Labrenz, B. Pfeiffer, G. Jost and K. Jürgens (2007) Quantitative distributions of
Epsilonproteobacteria and a Sulfurimonas subgroup in pelagic redoxclines of the Central
Baltic Sea. Applied and Environmental Microbiology 73: 7155‐7161
Grote J., G. Jost, M. Labrenz, G. J. Herndl and K. Jürgens (2008) Epsilonproteobacteria represent
the major portion of chemoautotrophic bacteria in sulfidic waters of pelagic redoxclines
of the Baltic and Black Seas. Applied and Environmental Microbiology 74: 7546‐7551
Grote J., T. Schott, C. G. Bruckner, F. O. Glöckner, G. Jost, H. Teeling, M. Labrenz and K.
Jürgens (2012) Genome and physiology of a model Epsilonproteobacterium responsible
for sulfide detoxification in marine oxygen depletion zones. Proceedings of the National
Academy of Sciences of the United States of America 109: 506‐510

118 Bibliography
Grover J. P. and T. H. Chrzanowski (2009) Dynamics and nutritional ecology of a
nanoflagellate preying upon bacteria. Environmental Microbiology 58: 231–243
Güde H. (1986) Loss processes influencing growth of planktonic bacterial populations in Lake
Constance. Journal of Plankton Research 8: 795‐810
Guhl B. E., B. J. Finlay and B. Schink (1996) Comparison of ciliate communities in the anoxic
hypolimnia of three lakes: general features and the influence of lake characteristics.
Journal of Plankton Research 18: 335‐353
Guillou L., S. Jacquet, M. J. Chrétiennot‐Dinet and D. Vaulot (2001) Grazing impact of two
small heterotrophic flagellates on Prochlorococcus and Synechococcus. Aquatic Microbial
Ecology 26: 201‐207
Guindon S. and O. Gascuel (2003) A simple, fast, and accurate algorithm to estimate large
phylogenies by maximum likelihood. Systematic Biology 52 696–704
Hackstein J. H. P., J. Tjaden and M. Huynen (2006) Mitochondria, hydrogenosomes and
mitosomes: products of evolutionary tinkering! Current Genetics 50: 225–245
Haeckel E. (1894) Systematische Phylogenie. I. Systematische Phylogenie der Protisten und
Pflanzen. Reimer, Berlin, Germany
Hahn M. W. and M. G. Höfle (1999) Flagellate predation on a bacterial model community:
interplay of size‐selective grazing, specific bacterial cell size, and bacterial community
composition. Applied and Environmental Microbiology 65: 4863‐4872
Hahn M. W. and M. G. Höfle (2001) Grazing of protozoa and its effect on populations of
aquatic bacteria. FEMS Microbiology Ecology 35: 113‐121
Hahn M. W., H. Lunsdorf, Q. Wu, M. Schauer, M. G. Höfle, J. Boenigk and P. Stadler (2003)
Isolation of novel ultramicrobacteria classified as Actinobacteria from five freshwater
habitats in Europe and Asia. Applied and Environmental Microbiology 69: 1442‐1451
Hall T. A. (1999) BioEdit: a user‐friendly biological sequence alignment editor and analysis
program for Windows 95/98/NT. Nucleic Acids Symposium Series 41: 95‐98
Hannig M., G. Lavik, M. M. M. Kuypers, D. Woebken, W. Martens‐Habbena and K. Jürgens
(2007) Shift from denitrification to anammox after inflow events in the central Baltic Sea.
Limnology and Oceanography 52: 1336‐1345
HELCOM (1981) Assessment of the effects of pollution on the natural resources of the Baltic
Sea. Baltic Sea Environment Proceedings 5B:

Bibliography 119
Herzog B. and R. Wirth (2012) Swimming behavior of selected species of archaea. Applied and
Environmental Microbiology 78: 1670–1674
Holmquist L. and S. Kjelleberg (1993) Changes in viability, respiratory activity, and morphology
of the marine Vibrio‐sp strain S14 during starvation of individual nutrients and
subsequent recovery. FEMS Microbiology Ecology 12: 215‐223
Huelsenbeck J. P., F. Ronquist, R. Nielsen and J. P. Bollback (2001) Bayesian inference of
phylogeny and its impact on evolutionary biology. Science 294: 2310–2314
Humphrey B., S. Kjelleberg and K. C. Marshall (1983) Responses of marine bacteria under
starvation conditions at a solid‐water interface. Applied and Environmental Microbiology
45: 43‐47
Ince B., I. Usenti, A. Eyigor, N. Oz, M. Kolukirik and O. Ince (2006) Analysis of methanogenic
archaeal and sulphate reducing bacterial populations in deep sediments of the Black Sea.
Geomicrobiology Journal 23: 285‐292
Iriberri J., B. Ayo, I. Artolozaga, I. Barcina and L. Egea (1994) Grazing on allochthonous vs
autochthonous bacteria in river water. Letters in Applied Microbiology 18: 12‐14
Jannasch H. W., C. O. Wirsen and S. J. Molyneaux (1991) Chemoautotrophic sulfur‐oxidizing
bacteria from the Black‐Sea. Deep‐Sea Research 38: S1105‐S1120
Javaux E. (2007) The early eukaryotic fossil record. In: Eukaryotic membranes and cytoskeleton,
edited by G. Jékely. Springer, New York. pp. 1‐19
Jenkins D. E., J. E. Schultz and A. Matin (1988) Starvation‐induced cross protection against
heat or H2O2 challenge in Escherichia coli. Journal of Bacteriology 170: 3910‐3914
Jeong H. J. (1999) The ecological roles of heterotrophic dinoflagellates in marine planktonic
community. Journal of Eukaryotic Microbiology 46: 390‐396
Jezbera J., K. Hornak and K. Šimek (2005) Food selection by bacterivorous protists: insight
from the analysis of the food vacuole content by means of fluorescence in situ
hybridization. FEMS Microbiology Ecology 52: 351‐363
Jezbera J., K. Hornak and K. Šimek (2006) Prey selectivity of bacterivorous protists in different
size fractions of reservoir water amended with nutrients. Environmental Microbiology 8:
1330‐1339
Johnson D., J. Park, J. Kukor and L. Abriola (2006) Effect of carbon starvation on toluene
degradation activity by toluene monooxygenase‐expressing bacteria. Biodegradation 17:
437‐445

120 Bibliography
Jørgensen B. B. and F. Bak (1991) Pathways and microbiology of thiosulfate transformations and
sulfate reduction in a marine sediment (Kattegat, Denmark). Applied and Environmental
Microbiology 57: 847‐856
Jost G., M. V. Zubkov, E. Yakushev, M. Labrenz and K. Jürgens (2008) High abundance and
dark CO2 fixation of chemolithoautotrophic prokaryotes in anoxic waters of the Baltic
Sea. Limnology and Oceanography 53: 14‐22
Jost G., W. Martens‐Habbena, F. Pollehne, B. Schnetger and M. Labrenz (2010) Anaerobic
sulfur oxidation in the absence of nitrate dominates microbial chemoautotrophy beneath
the pelagic chemocline of the eastern Gotland Basin, Baltic Sea. FEMS Microbiology
Ecology 71: 226‐236
Jürgens K. and W. R. DeMott (1995) Behavioral flexibility in prey selection by bacterivorous
nanoflagellates. Limnology and Oceanography 40: 1503‐1507
Jürgens K. and C. Matz (2002) Predation as a shaping force for the phenotypic and genotypic
composition of planktonic bacteria. Antonie van Leeuwenhoek 81: 413‐434
Jürgens K. and R. Massana (2008) Protistan grazing on marine bacterioplankton. In: Microbial
ecology of the oceans, edited by D. L. Kirchman. John Wiley & Sons, Hoboken, New
Jersey. pp. 383‐424
Jürgens K., S. A. Wickham, K. O. Rothhaupt and B. Santer (1996) Feeding rates of macro‐ and
microzooplankton on heterotrophic nanoflagellates. Limnology and Oceanography 41:
1833‐1839
Jürgens K., H. Arndt and H. Zimmermann (1997) Impact of metazoan and protozoan grazers
on bacterial biomass distribution in microcosm experiments. Aquatic Microbial Ecology
12: 131‐138
Jürgens K., J. Pernthaler, S. Schalla and R. Amann (1999) Morphological and compositional
changes in a planktonic bacterial community in response to enhanced protozoan
grazing. Applied and Environmental Microbiology 65: 1241‐1250
Karayanni H., U. Christaki, F. Van Wambeke, T. Thyssen and M. Denis (2008) Heterotrophic
nanoflagellate and ciliate bacterivorous activity and growth in the northeast Atlantic
Ocean: a seasonal mesoscale study. Aquatic Microbial Ecology 51: 169‐181
Keeling P. J. and N. Fast (2002) Microsporidia: biology and evolution of highly reduced
intracellular parasites. Annual Review of Microbiology 56: 93–116

Bibliography 121
King C. and E. B. Shotts, Jr. (1988) Enhancement of Edwardsiella tarda and Aeromonas
salmonicida through ingestion by the ciliated protozoan Tetrahymena pyriformis. FEMS
Microbiology Letters 51: 95‐100
Kjelleberg S. (1993) Starvation in bacteria. Edited by S. Kjelleberg. Plenum Press, New York
Knoll A. H., E. J. Javaux, D. Hewitt and P. Cohen (2006) Eukaryotic organisms in Proterozoic
oceans. Philosophical Transactions of the Royal Society of London B Biological Sciences
361: 1023‐1038
Kuuppo‐Leinikki P. (1990) Protozoan grazing on planktonic bacteria and its impact on
bacterial population. Marine Ecology Progress Series 63: 227‐238
Kuypers M. M. M., A. O. Sliekers, G. Lavik, M. Schmid, B. B. Jørgensen, J. G. Kuenen, J. S.
Sinninghe Damsté, M. Strous and M. S. Jetten (2003) Anaerobic ammonium oxidation by
anammox bacteria in the Black Sea. Nature 422: 608‐611
Labrenz M., G. Jost, C. Pohl, S. Beckmann, W. Martens‐Habbena and K. Jürgens (2005) Impact
of different in vitro electron donor/acceptor conditions on potential
chemolithoautotrophic communities from marine pelagic redoxclines. Applied and
Environmental Microbiology 71: 6664‐6672
Labrenz M., G. Jost and K. Jürgens (2007) Distribution of abundant prokaryotic organisms in
the water column of the central Baltic Sea with an oxic‐anoxic interface. Aquatic
Microbial Ecology 46: 177‐190
Labrenz M., E. Sintes, F. Toetzke, A. Zumsteg, G. J. Herndl, M. Seidler and K. Jürgens (2010)
Relevance of a crenarchaeotal subcluster related to Candidatus Nitrosopumilus
maritimus to ammonia oxidation in the suboxic zone of the central Baltic Sea. The ISME
Journal 4: 1496‐1508
Lam P. and M. M. M. Kuypers (2011) Microbial nitrogen cycling processes in oxygen minimum
zones. Annual Review of Marine Science 3: 317‐345
Lam P., M. M. Jensen, G. Lavik, D. F. McGinnis, B. Muller, C. J. Schubert, R. Amann, B.
Thamdrup and M. M. M. Kuypers (2007) Linking crenarchaeal and bacterial nitrification
to anammox in the Black Sea. Proceedings of the National Academy of Sciences of the
United States of America 104: 7104‐7109
Lampert W. (1978) Release of dissolved organic carbon by zooplankton grazing. Limnology and
Oceanography 23: 831‐834

122 Bibliography
Lanave C., G. Preparata, C. Saccone and G. Serio (1984) A new method for calculating
evolutionary substitution rates. Journal of Molecular Evolution 20: 86–93
Landry M. R. and A. Calbet (2005) Reality checks on microbial food web interactions in
dilution experiments: responses to the comments of Dolan and McKeon. Ocean Science
1: 39‐44
Landry M. R., J. M. Lehner‐Fournier, J. A. Sundstrom, V. L. Fagerness and K. E. Selph (1991)
Discrimination between living and heat‐killed prey by a marine zooflagellate,
Paraphysomonas vestita (Stokes). Journal of Experimental Marine Biology and Ecology
146: 139‐151
Langenheder S. and K. Jürgens (2001) Regulation of bacterial biomass and community
structure by metazoan and protozoan predation. Limnology and Oceanography 46: 121‐
134
Lass H.‐U. and W. Matthäus (1996) On temporal wind variations forcing salt water inflows into
the Baltic Sea. Tellus A 48: 663‐671
Lass H.‐U., H. Prandke and B. Liljebladh (2003) Dissipation in the Baltic proper during winter
stratification. Journal of Geophysical Research 108: 3187
Lauro F. M., D. McDougald, T. Thomas, T. J. Williams, S. Eganb, S. A. Rice, M. D. DeMaere, L.
Ting, H. Ertan, J. Johnson, S. Ferriera, A. Lapidus, I. Anderson, N. Kyrpides, A. C. Munk,
C. Detterg, C. S. Hang, M. V. Brown, F. T. Robb, S. Kjelleberg and R. Cavicchioli (2009)
The genomic basis of trophic strategy in marine bacteria. Proceedings of the National
Academy of Sciences of the United States of America 106:
Lauterborn R. (1901) Die `sapropelische´ Lebewelt. Zoologischer Anzeiger 24: 50‐55
Lavik G., T. Stuhrmann, V. Bruchert, A. Van der Plas, V. Mohrholz, P. Lam, M. Muszmann, B.
M. Fuchs, R. Amann, U. Lass and M. M. M. Kuypers (2009) Detoxification of sulphidic
African shelf waters by blooming chemolithotrophs. Nature 457: 581‐584
Lee S. and J. A. Fuhrman (1987) Relationships between biovolume and biomass of naturally
derived marine bacterioplankton. Applied and Environmental Microbiology 53: 1298‐1303
Li T., T.‐D. Wu, L. Mazeas, L. Toffin, J.‐L. Guerquin‐Kern, G. Leblon and T. Bouchez (2008)
Simultaneous analysis of microbial identity and function using NanoSIMS.
Environmental Microbiology 10: 580‐588

Bibliography 123
Limburg K. E., C. Olson, Y. Walther, D. Dale, C. P. Slomp and H. Høie (2011) Tracking Baltic
hypoxia and cod migration over millennia with natural tags. Proceedings of the National
Academy of Sciences of the United States of America 108: E177‐E182
Lin X., M. I. Scranton, R. Varela, A. Chistoserdov and G. T. Taylor (2007) Compositional
responses of bacterial communities to redox gradients and grazing in the anoxic Cariaco
Basin. Aquatic Microbial Ecology 47: 57‐72
Linnaeus C. (1766) Systema Naturae: sive Regna Tria Naturae Systematice Proposita per Classes,
Ordines, Genera et Species 12th ed. Stockholm, Sweeden
Lliros M., F. Gich, A. Plaséncia, J.‐C. Auguet, F. Darchambeau, E. O. Casamayor, J.‐P. Descy and
C. Borrego (2010) Vertical distribution of ammonia‐oxidizing crenarchaeota and
methanogens in the epipelagic waters of Lake Kivu (Rwanda‐Democratic Republic of the
Congo). Applied and Environmental Microbiology 76: 6853‐6863
López‐Garcia P., F. Rodríguez‐Valera, C. Pedrós‐Alió and D. Moreira (2001) Unexpected
diversity of small eukaryotes in deep‐sea Antarctic plankton. Nature 409: 603‐607
Lueders T., M. Manefield and M. W. Friedrich (2004a) Enhanced sensitivity of DNA‐ and
rRNA‐based stable isotope probing by fractionation and quantitative analysis of
isopycnic centrifugation gradients. Environmental Microbiology 6: 73‐78
Lueders T., B. Wagner, P. Claus and M. W. Friedrich (2004b) Stable isotope probing of rRNA
and DNA reveals a dynamic methylotroph community and trophic interactions with
fungi and protozoa in oxic rice field soil. Environmental Microbiology 6: 60‐72
Lueders T., R. Kindler, A. Miltner, M. W. Friedrich and M. Kaestner (2006) Identification of
bacterial micropredators distinctively active in a soil microbial food web. Applied and
Environmental Microbiology 72: 5342‐5348
Mallin M. A., V. L. Johnson, S. H. Ensign and T. A. MacPherson (2006) Factors contributing to
hypoxia in rivers, lakes, and streams. Limnology and Oceanography 51: 690‐701
Mamaeva N. V. (1988) Ciliates as a component of planctonic communities in the open regions
of the Baltic Sea. The Soviet Journal of Marine Biology 14: 1‐6
Manefield M., A. S. Whiteley, R. I. Griffiths and M. J. Bailey (2002) RNA stable isotope probing,
a novel means of linking microbial community function to phylogeny. Applied and
Environmental Microbiology 68: 5367‐5373
124 Bibliography
Marcus N. H. (2001) Zooplankton: responses to and consequences of hypoxia. In: Coastal
hypoxia: consequences for living resources and ecosystems, edited by N. N. Rabalais and
R. E. Turner. American Geophysical Union, Washington DC. pp. 49‐61
Marden P., A. Tunlid, K. Malmcrona‐Friberg, G. Odham and S. Kjelleberg (1985) Physiological
and morphological changes during short term starvation of marine bacterial isolates.
Archives of Microbiology 142: 326‐ 332
Marie D., C. P. D. Brussaard, R. Thyrhaug, G. Bratbak and D. Vaulot (1999) Enumeration of
marine viruses in culture and natural samples by flow cytometry. Applied and
Environmental Microbiology 65: 45‐52
Marrasé C., E. L. Lim and D. A. Caron (1992) Seasonal and daily changes in bacterivory in a
coastal plankton community. Marine Ecology Progress Series 82: 281‐289
Martínez‐Garcia M., D. Brazel, N. J. Poulton, B. K. Swan, M. L. Gómez, D. Masland, M. E.
Sieracki and R. Stepanauskas (2011) Unveiling in situ interactions between marine
protists and bacteria through single cell sequencing. The ISME journal 6: 703‐707
Massana R. and C. Pedrós‐Alió (1994) Role of anaerobic ciliates in planktonic food webs:
abundance, feeding, and impact on bacteria in the field. Applied and Environmental
Microbiology 60: 1325‐1334
Massana R., C. K. Stumm and C. Pedrós‐Alió (1994) Effects of temperature, sulfide, and food
abundance on growth and feeding of anaerobic ciliates. Applied and Environmental
Microbiology 60: 1317‐1324
Massana R., J. M. Gasol, P. K. Bjørnsen, N. Blackburn, Å. Hagström, S. Hietanen, B. H. Hygum,
J. Kuparinen and C. Pedrós‐Alió (1997) Measurement of bacterial size via image analysis
of epifluorescence preparations: description of an inexpensive system and solutions to
some of the most common problems. Scientia Marina 61: 397‐407
Massana R., J. Castresana, V. Balague, L. Guillou, K. Romari, A. Groisillier, K. Valentin and C.
Pedrós‐Alió (2004) Phylogenetic and ecological analysis of novel marine stramenopiles.
Applied and Environmental Microbiology 70: 3528‐3534
Massana R., L. Guillou, R. Terrado, I. Forn and C. Pedrós‐Alió (2006) Growth of uncultured
heterotrophic flagellates in unamended seawater incubations. Aquatic Microbial Ecology
45: 171‐180
Massana R., F. Unrein, R. Rodríguez‐Martıínez, I. Forn, T. Lefort, J. Pinhassi and F. Not (2009)
Grazing rates and functional diversity of uncultured heterotrophic flagellates. The ISME
Journal 3: 588–596

Bibliography 125
Matthäus W. (2006) The history of investigation of salt water inflows into the Baltic Sea ‐ from
the early beginnings to recent results. Meereswissentschaftliche Berichte 65: 1‐73
Matthäus W. and H. Franck (1992) Characteristics of major Baltic inflows ‐ a statistical analysis.
Continental Shelf Research 12: 1375‐1400
Matthäus W., D. Nehring, R. Feistel, G. Nausch, V. Mohrholz and H.‐U. Lass (2008) The inflow
of highly saline water into the Baltic Sea. In: State and evolution of the Baltic Sea, 1952‐
2005, A detailed 50‐year survey of meteorology and climate, physics, chemistry, biology,
and marine environment edited by R. Feistel, G. Nausch and N. Wasmund. John Wiley &
Sons, Hoboken, New Jersey. pp. 265‐309
Matz C. and K. Jürgens (2003) Interaction of nutrient limitation and protozoan grazing
determines the phenotypic structure of a bacterial community. Microbial Ecology 45:
384‐398
Matz C. and K. Jürgens (2005) High motility reduces grazing mortality of planktonic bacteria.
Applied and Environmental Microbiology 71: 921‐929
Matz C. and S. Kjelleberg (2005) Off the hook ‐ how bacteria survive protozoan grazing. Trends
in Microbiology 13: 302‐307
Matz C., J. Boenigk, H. Arndt and K. Jürgens (2002) Role of bacterial phenotypic traits in
selective feeding of the heterotrophic nanoflagellate Spumella sp. Aquatic Microbial
Ecology 27: 137‐148
Matz C., P. Deines, J. Boenigk, H. Arndt, L. Eberl, S. Kjelleberg and K. Jürgens (2004) Impact of
violacein‐producing bacteria on survival and feeding of bacterivorous nanoflagellates.
Applied and Environmental Microbiology 70: 1593–1599
Matz C., D. McDougald, A. M. Moreno, P. Y. Yung, F. H. Yildiz and S. Kjelleberg (2005) Biofilm
formation and phenotypic variation enhance predation‐driven persistence of Vibrio
cholerae. Proceedings of the National Academy of Sciences of the United States of America
102: 16819‐16824
McCaig A. E., T. M. Embley and J. I. Prosser (1994) Molecular analysis of enrichment cultures
of marine ammonia oxidisers. FEMS Microbiology Letters 120: 363‐368
McDougald D., S. A. Rice and S. Kjelleberg (2000) The marine pathogen Vibrio vulnificus
encodes a putative homologue of the Vibrio harveyi regulatory gene, luxR: a genetic and
phylogenetic comparison. Gene 248: 213‐221
126 Bibliography
McDougald D., S. A. Rice and S. Kjelleberg (2001) SmcR‐dependent regulation of adaptive
phenotypes in Vibrio vulnificus. J. Bacteriol. 183: 758‐762
McDougald D., S. Srinivasan, S. A. Rice and S. Kjelleberg (2003) Signal‐mediated cross‐talk
regulates stress adaptation in Vibrio species. Microbiology 149: 1923‐1933
McManus G. B. and J. A. Fuhrman (1988) Control of marine bacterioplankton populations:
Measurement and significance of grazing. Hydrobiologia 159: 51‐62
Medina‐Sánchez J. M., M. Felip and E. O. Casamayor (2005) Catalyzed reported deposition‐
fluorescence in situ hybridization protocol to evaluate phagotrophy in mixotrophic
protists. Applied and Environmental Microbiology 71: 7321‐7326
Middelboe M. and P. G. Lyck (2002) Regeneration of dissolved organic matter by viral lysis in
marine microbial communities. Aquatic Microbial Ecology 27: 187‐194
Miki J. (2008) Complex interactions in the microbial world: underexplored key links between
viruses, bacteria and protozoan grazers in aquatic environments. Aquatic Microbial
Ecology 51: 195‐208
Mischke U. (1994) Influence of food quality and quantity on ingestion and growth rates of
three omnivorous heterotrophic flagellates. Marine Microbial Food Webs 8: 125‐143
Moestrup Ø. and H. A. Thomsen (1980) Preparation of shadow‐cast whole mounts. In:
Handbook of phycological methods, edited by E. Gantt. Cambridge University Press
Cambridge, UK. pp. 385–390
Montagnes D. J. S., A. B. Barbosa, J. Boenigk, K. Davidson, K. Jürgens, M. Macek, J. D. Parry, E.
C. Roberts and K. Šimek (2008) Selective feeding behaviour of key free‐living protists:
avenues for continued study. Aquatic Microbial Ecology 53 83–98
Moon‐van der Staay S. Y., R. De Wachter and D. Vaulot (2001) Oceanic 18S rDNA sequences
from picoplankton reveal unsuspected eukaryotic diversity. Nature 409: 607 ‐ 610
Morales S. E. and W. E. Holben (2011) Linking bacterial identities and ecosystem processes: can
‘omic’ analyses be more than the sum of their parts? FEMS Microbiology Ecology 75: 2‐16
Moreno A. M., C. Matz, S. Kjelleberg and M. Manefield (2010) Identification of ciliate grazers of
autotrophic bacteria in ammonia‐oxidizing activated sludge by RNA stable isotope
probing. Applied and Environmental Microbiology 76: 2203‐2211
Morita R. Y. (1997) Bacteria in oligotrophic environments. Starvation ‐ survival lifestyle. Edited
by C. A. Reddy, A. M. Chakrabarty, A. L. Demain and J. M. Tiedje. Chapman & Hall, New
York

Bibliography 127
Morton D. S. and J. D. Oliver (1994) Induction of carbon starvation‐induced proteins in Vibrio
vulnificus. Applied and Environmental Microbiology 60: 3653‐3659
Müller M. (1988) Energy metabolism of protozoa without mitochondria. Annual Review of
Microbiology 42: 465‐488
Murray A. G. and G. A. Jackson (1992) Viral dynamics: a model of the effects of size, shape,
motion and abundance of single‐celled planktonic organisms and other particles. Marine
Ecology Progress Series 89: 103‐116
Nagata T. (2000) Production mechanisms of dissolved organic carbon. In: Microbial ecology of
the oceans, edited by D. L. Kirchman. John Wiley & Sons, Hoboken, New Jersey. pp. 121‐
153
Nedwell D. B., T. M. Embley and K. J. Purdy (2004) Sulphate reduction, methanogenesis and
phylogenetics of the sulphate reducing bacterial communities along an estuarine
gradient. Aquatic Microbial Ecology 37: 209‐217
Neretin L. N., R. M. M. Abed, A. Schippers, C. J. Schubert, K. Kohls and M. M. M. Kuypers
(2007) Inorganic carbon fixation by sulfate‐reducing bacteria in the Black Sea water
column. Environmental Microbiology 9: 3019‐3024
Neuenfeldt S., K. H. Andersen and H.‐H. Hinrichsen (2009) Some Atlantic cod Gadus morhua
in the Baltic Sea visit hypoxic water briefly but often. Journal of Fish Biology 75: 290–294
Neuer S. and T. J. Cowles (1995) Comparative size‐specific grazing rates in field populations of
ciliates and dinoflagellates. Marine Ecology Progress Series 125: 259‐267
Neufeld J., M. Dumont, J. Vohra and J. Murrell (2007) Methodological considerations for the
use of stable isotope probing in microbial ecology. Microbial Ecology 53: 435‐442
Not F., M. Latasa, R. Scharek, M. Viprey, P. Karleskind, V. Balagué, I. Ontoria‐Oviedo, A.
Cumino, E. Goetze, D. Vaulot and R. Massana (2008) Protistan assemblages across the
Indian Ocean, with a specific emphasis on the picoeukaryotes. Deep‐Sea Research I 55:
1456‐1473
Not F., J. del Campo, V. Balagué, C. de Vargas and R. Massana (2009) New insights into the
diversity of marine picoeukaryotes. PLoS ONE 4: e7143
Nyström T., R. M. Olsson and S. Kjelleberg (1992) Survival, stress resistance, and alterations in
protein expression in the marine Vibrio sp. strain S14 during starvation for different
individual nutrients. Applied and Environmental Microbiology 58: 55‐65

128 Bibliography
Oliver J. D. (2006) Vibrio vulnificus. In: The biology of Vibrios, edited by F. L. Thompson, B.
Austin and J. Swings. American Society for Microbiology, Washington D.C. pp. 349‐367
Olli K. (1999) Diel vertical migration of phytoplankton and heterotrophic flagellates in the Gulf
of Riga. Journal of Marine Systems 23: 145‐163
Orsi W., V. Edgcomb, S. Jeon, C. Leslin, J. Bunge, G. T. Taylor, R. Varela and S. Epstein (2011)
Protistan microbial observatory in the Cariaco Basin, Caribbean. II. Habitat
specialization. The ISME journal 5: 1357‐1373
Orsi W., Y. C. Song, S. Hallam and V. Edgcomb (2012) Effect of oxygen minimum zone
formation on communities of marine protists. The ISME journal (advanced online
publication) doi: 10.1038/ismej.2012.7
Östling J., A. Goodman and S. Kjelleberg (1991) Behaviour of IncP‐1 plasmids and a miniMu
transposon in a marine Vibrio sp.: isolation of a starvation inducible lac operon fusion.
FEMS Microbiology Ecology 86: 83‐94
Park J. S. and B. C. Cho (2002) Active heterotrophic nanoflagellates in the hypoxic water‐
column of the eutrophic Masan Bay, Korea. Marine Ecology Progress Series 230: 35‐45
Pedrós‐Alió C., J. I. Calderón‐Paz and J. M. Gasol (2000) Comparative analysis shows that
bacterivory, not viral lysis, controls the abundance of heterotrophic prokaryotic
plankton. FEMS Microbiology Ecology 32: 157‐165
Pelegri S. P., J. Dolan and F. Rassoulzadegan (1999) Use of high temperature catalytic oxidation
(HTCO) to measure carbon content of microorganisms. Aquatic Microbial Ecology 16:
273‐280
Pernthaler J. (2005) Predation on prokaryotes in the water column and its ecological
implications. Nature Reviews Microbiology 3: 537‐546
Piker L., R. Schmaljohann and J. Imhoff (1998) Dissimilatory sulfate reduction and methane
production in Gotland Deep sediments (Baltic Sea) during a transition period from oxic
to anoxic bottom water (1993‐1996). Aquatic Microbial Ecology 14: 183‐193
Pimenov N. V. and L. N. Neretin (2006) Composition and activities of microbial communities
involved in carbon, sulfur, nitrogen and manganese cycling in the oxic/anoxic interface
of the Black Sea. In: Past and present marine water column anoxia, edited by L. N.
Neretin. Springer, Dordrecht, The Netherlands. pp. 501‐521
Pina‐Ochoa E., S. Høgslund, E. Geslin, T. Cedhagen, N. P. Revsbech, L. P. Nielsen, M.
Schweizer, F. Jorissen, S. r. Rysgaard and N. Risgaard‐Petersen (2010) Widespread

Bibliography 129
occurrence of nitrate storage and denitrification among Foraminifera and Gromiida.
Proceedings of the National Academy of Sciences of the United States of America 107: 1148‐
1153
Piwosz K. and J. Pernthaler (2009) Seasonal population dynamics and trophic role of
planktonic nanoflagellates in coastal surface waters of the Southern Baltic Sea.
Environmental Microbiology 12: 364‐377
Ploug H. (2008) Cyanobacterial surface blooms formed by Aphanizomenon sp. and Nodularia
spumigena in the Baltic Sea: Small‐scale fluxes, pH, and oxygen microenvironments.
Limnology and Oceanography 53: 914‐921
Ploug H., B. Adam, N. Musat, T. Kalvelage, G. Lavik, D. Wolf‐Gladrow and M. M. M. Kuypers
(2011) Carbon, nitrogen and O2 fluxes associated with the cyanobacterium Nodularia
spumigena in the Baltic Sea. The ISME Journal 5: 1549‐1558
Pomeroy L. (1974) The ocean´s food web: a changing paradigm. Bioscience 24: 499‐504
Posch T., K. Šimek, J. Vrba, J. Pernthaler, J. Nedoma, B. Sattler, B. Sonntag and R. Psenner
(1999) Predator‐induced changes of bacterial size‐structure and productivity studied on
an experimental microbial community. Aquatic Microbial Ecology 18: 235‐246
Posch T., J. Franzoi, M. Prader and M. M. Salcher (2009) New image analysis tool to study
biomass and morphotypes of three major bacterioplankton groups in an alpine lake.
Aquatic Microbial Ecology 54: 113‐126
Putt M. and D. K. Stoecker (1989) An experimentally determined carbon: volume ratio for
marine "oligotrichous" ciliates from estuarine and coastal waters. Limnology and
Oceanography 34: 1097‐1103
Raven J. A. (1997) Phagotrophy in phototrophs. Limnology and Oceanography 42: 198‐205
Redon E., P. Loubiere and M. Cocaign‐Bousquet (2005) Transcriptome analysis of the
progressive adaptation of Lactococcus lactis to carbon starvation. Journal of Bacteriology
187: 3589‐3592
Reißmann J. H., H. Burchard, R. Feistel, E. Hagen, H.‐U. Lass, V. Mohrholz, G. Nausch, L.
Umlauf and G. Wieczorek (2009) Vertical mixing in the Baltic Sea and consequences for
eutrophication ‐ A review. Progress in Oceanography 82: 47‐80
Rheinheimer G. (1995) Meereskunde der Ostsee. Springer, Berlin, Germany

130 Bibliography
Rheinheimer G., K. Gocke and H.‐G. Hoppe (1989) Vertical distribution of microbiological and
hydrographic‐chemical parameters in different areas of the Baltic Sea. Marine Ecology
Progress Series 52: 55‐70
Risgaard‐Petersen N., A. M. Langezaal, S. Ingvardsen, M. C. Schmid, M. S. M. Jetten, H. J. M.
Op den Camp, J. W. M. Derksen, E. Pina‐Ochoa, S. P. Eriksson, L. Peter Nielsen, N. Peter
Revsbech, T. Cedhagen and G. J. van der Zwaan (2006) Evidence for complete
denitrification in a benthic foraminifer. Nature 443: 93‐96
Roger A. J. and L. A. Hug (2006) The origin and diversification of eukaryotes: problems with
molecular phylogenetics and molecular clock estimation. Philosophical Transactions of
the Royal Society of London B Biological Sciences 361: 1039‐1054
Ruimy R., V. Breittmayer, P. Elbaze, B. Lafay, O. Boussemart, M. Gauthiery and R. Christen
(1994) Phylogenetic analysis and assessment of the genera Vibrio, Photobacterium,
Aeromonas, and Plesiomonas deduced from small‐subunit rRNA sequences.
International Journal of Systematic Bacteriology
Saccà A., C. M. Borrego, R. Renda, X. Triadó‐Margarit, V. Bruni and L. Guglielmo (2009)
Predation impact of ciliated and flagellated protozoa during a summer bloom of brown
sulfur bacteria in a meromictic coastal lake. FEMS Microbiology Ecology 70: 42‐53
Salat J. and C. Marrasé (1994) Exponential and linear estimations of grazing on bacteria ‐
effects of changes in the proportion of marked cells. Marine Ecology Progress Series 104:
205‐209
Sandén P. and B. Håkansson (1996) Long‐term trends in Secchi depth in the Baltic Sea.
Limnology and Oceanography 41: 346‐351
Sanders R. W. (1991) Mixotrophic protists in marine and freshwater ecosystems. Journal of
Eukaryotic Microbiology 38: 76‐81
Sanders R. W., D. A. Caron and U. G. Berninger (1992) Relationships between bacteria and
heterotrophic nanoplankton in marine and fresh waters ‐ an inter‐ecosystem
comparison. Marine Ecology Progress Series 86: 1‐14
Sarthou G., K. R. Timmermans, S. Blain and P. Treguer (2005) Growth physiology and fate of
diatoms in the ocean: a review. Journal of Sea Research 53: 25‐42
Scheckenbach F., C. Wylezich, M. Weitere, K. Hausmann and H. Arndt (2005) Molecular
identity of strains of heterotrophic flagellates isolated from surface waters and deep‐sea
sediments of the South Atlantic based on SSU rDNA. Aquatic Microbial Ecology 38: 239‐
247

Bibliography 131
Schneider B. and J. Kuss (2004) Past and present productivity of the Baltic Sea as inferred from
pCO2 data. Continental Shelf Research 24: 1611‐1622
Schneider B., G. Nausch, H. Kubsch and I. Petersohn (2002) Accumulation of total CO2 during
stagnation in the Baltic Sea deep water and its relationship to nutrient and oxygen
concentrations. Marine Chemistry 77: 277‐291
Schut F. (1994) Ecophysiology of a marine ultramicrobacterium. PhD thesis. University of
Groningen, Groningen, The Netherlands
Schut F., E. J. de Vries, J. C. Gottschal, B. R. Robertson, W. Harder, R. A. Prins and D. K. Button
(1993) Isolation of typical marine bacteria by dilution culture: growth, maintenance, and
characteristics of isolates under laboratory conditions. Applied and Environmental
Microbiology 59: 2150‐2160
Selph K. E., M. R. Landry and E. A. Laws (2003) Heterotrophic nanoflagellate enhancement of
bacterial growth through nutrient remineralization in chemostat culture. Aquatic
Microbial Ecology 32: 23‐37
Seong K. A., H. J. Jeong, S. Kim, G. H. Kim and J. H. Kang (2006) Bacterivory by co‐occurring
red‐tide algae, heterotrophic nanoflagellates, and ciliates. Marine Ecology Progress Series
322: 85‐97
Setälä O. (1991) Ciliates in the anoxic deep water layer of the Baltic. Archives of Hydrobiology
122: 483‐492
Setälä O. and K. Kivi (2003) Planktonic ciliates in the Baltic Sea in summer: distribution,
species association and estimated grazing impact. Aquatic Microbial Ecology 32: 287‐297
Shannon S. P., T. H. Chrzanowski and J. P. Grover (2007) Prey food quality affects flagellate
ingestion rates. Microbial Ecology 53: 66‐73
Sherr B. F. and E. B. Sherr (1993a) Protistan grazing rates via uptake of fluorescently labeled
prey. In: Current methods in aquatic microbial ecology, edited by P. Kemp, B. F. Sherr, E.
B. Sherr and J. Cole. Lewis Publishers, New York. pp. 695‐702
Sherr B. F., E. B. Sherr and R. D. Fallon (1987) Use of monodispersed, fluorescently labeled
bacteria to estimate in situ protozoan bacterivory. Applied and Environmental
Microbiology 53: 958‐965
Sherr B. F., E. B. Sherr, D. A. Caron, D. Vaulot and A. Z. Worden (2007) Oceanic protists.
Oceanography 20: 130‐134

132 Bibliography
Sherr E. B. (1988) Direct use of high molecular‐weight polysaccharide by heterotrophic
flagellates. Nature 335: 348‐351
Sherr E. B. and B. F. Sherr (1993b) Preservation and storage of samples for enumeration of
heterotrophic protists. In: Current methods in aquatic microbial ecology, edited by P.
Kemp, B. F. Sherr and E. B. Sherr. Lewis, New York. pp. 207‐212
Sherr E. B. and B. F. Sherr (1994) Bacterivory and herbivory: key roles of phagotrophic protists
in pelagic food webs. Microbial Ecology 28: 223‐235
Sherr E. B. and B. F. Sherr (2002) Significance of predation by protists in aquatic microbial food
webs. Antonie van Leeuwenhoek 81: 293‐308
Shinzato N., I. Watanabe, X.‐Y. Meng, Y. Sekiguchi, H. Tamaki, T. Matsui and Y. Kamagata
(2007) Phylogenetic analysis and fluorescence in situ hybridization detection of archaeal
and bacterial endosymbionts in the anaerobic ciliate Trimyema compressum. Microbial
Ecology 54: 627‐636
Sievert S. M., R. P. Kiene and H. N. Schulz‐Vogt (2007) The sulfur cycle. Oceanography 20: 117‐
123
Šimek K., J. Vrba and P. Hartman (1994) Size‐selective feeding by Cyclidium sp. on
bacterioplankton and various sizes of cultured bacteria. FEMS Microbiology Ecology 14:
157‐167
Šimek K., J. Vrba, J. Pernthaler, T. Posch, P. Hartman, J. Nedoma and R. Psenner (1997)
Morphological and compositional shifts in an experimental bacterial community
influenced by protists with contrasting feeding modes. Applied and Environmental
Microbiology 63: 587‐595
Šimek K., K. Jürgens, J. Nedoma, M. Comerma and J. Armengol (2000) Ecological role and
bacterial grazing of Halteria spp.: small freshwater oligotrichs as dominant pelagic ciliate
bacterivores. Aquatic Microbial Ecology 22: 43‐56
Šimek K., M. G. Weinbauer, K. Hornák, J. Jezbera, J. Nedoma and J. R. Dolan (2007) Grazer and
virus‐induced mortality of bacterioplankton accelerates development of Flectobacillus
populations in a freshwater community. Environmental Microbiology 9: 789‐800
Simon M. and F. Azam (1989) Protein content and protein synthesis rates of planktonic marine
bacteria. Marine Ecology Progress Series 51: 201‐213
Singleton D. R., S. N. Powell, R. Sangaiah, A. Gold, L. M. Ball and M. D. Aitken (2005) Stable‐
isotope probing of bacteria capable of degrading salicylate, naphthalene, or

Bibliography 133
phenanthrene in a bioreactor treating contaminated soil. Applied and Environmental
Microbiology 71: 1202‐1209
Solic M. and N. Krstulovic (1994) Role of predation in controlling bacterial and heterotrophic
nanoflagellate standing stocks in the coastal Adriatic Sea: seasonal patterns. Marine
Ecology Progress Series 114: 219‐235
Spector M. P. and W. J. Kenyon (2012) Resistance and survival of Salmonella enterica to
environmental stresses. Food Research International 45: 455‐481
Spielman L. A. (1977) Particle capture from low‐speed laminar flows. Annual Review of Fluid
Mechanics 9: 297‐319
Sterner R. W. (2008) On the phosphorus limitation paradigm for lakes. International Review of
Hydrobiology 93: 433‐445
Stibor H., O. Vadstein, S. Diehl, A. Gelzleichter, T. Hansen, F. Hantzsche, A. Katechakis, B.
Lippert, K. Loseth, C. Peters, W. Roederer, M. Sandow, L. Sundt‐Hansen and Y. Olsen
(2004) Copepods act as a switch between alternative trophic cascades in marine pelagic
food webs. Ecology Letters 7: 321‐328
Stock A., K. Jürgens, J. Bunge and T. Stoeck (2009) Protistan diversity in suboxic and anoxic
waters of the Gotland Deep (Baltic Sea) as revealed by 18S rRNA clone libraries. Aquatic
Microbial Ecology 55: 267‐284
Stoeck T. and S. Epstein (2003) Novel eukaryotic lineages inferred from small‐subunit rRNA
analyses of oxygen‐depleted marine environments. Applied and Environmental
Microbiology 69: 2657‐2663
Stoeck T., G. T. Taylor and S. S. Epstein (2003) Novel eukaryotes from the permanently anoxic
Cariaco Basin (Caribbean Sea). Applied and Environmental Microbiology 69: 5656‐5663
Stoeck T., B. Hayward, G. T. Taylor, R. Varela and S. S. Epstein (2006) A multiple PCR‐primer
approach to access the microeukaryotic diversity in environmental samples. Protist 157:
31‐43
Stoeck T., A. Zuendorf, H.‐W. Breiner and A. Behnke (2007) A molecular approach to identify
active microbes in environmental eukaryote clone libraries. Microbial Ecology 53: 328‐
339
Stoeck T., A. Behnke, R. Christen, L. Amaral‐Zettler, M. Rodríguez‐Mora, A. Chistoserdov, W.
Orsi and V. Edgcomb (2009) Massively parallel tag sequencing reveals the complexity of
anaerobic marine protistan communities. BMC Biology 7: 72

134 Bibliography
Stoecker D. and J. M. Capuzzo (1990) Predation on Protozoa: its importance to zooplankton.
Journal of Plankton Research 12: 891‐908
Stoecker D. K., D. J. Gifford and M. Putt (1994) Preservation of marine planktonic ciliates:
losses and cell shrinkage during fixation. Marine Ecology Progress Series 110: 293‐299
Stramma L., G. C. Johnson, J. Sprintall and V. Mohrholz (2008) Expanding oxygen‐minimum
zones in the tropical oceans. Science 320: 655‐658
Strom S. L., R. Benner, S. Ziegler and M. J. Dagg (1997) Planktonic grazers are a potentially
important source of marine dissolved organic carbon. Limnology and Oceanography 42:
1364‐1374
Suikkanen S., P. Hakanen, K. Spilling and A. Kremp (2011) Allelopathic effects of Baltic Sea
spring bloom dinoflagellates on co‐occurring phytoplankton. Marine Ecology Progress
Series 439: 45‐55
Suttle C. A. (1994) The significance of viruses to mortality in aquatic microbial communities.
Microbial Ecology 28: 237‐243
Suttle C. A. (2007) Marine viruses‐major players in the global ecosystem. Nature Reviews
Microbiology 5: 801‐812
Tarao M., J. Jezbera and M. W. Hahn (2009) Involvement of cell surface structures in size‐
independent grazing resistance of freshwater Actinobacteria. Applied and Environmental
Microbiology 75: 4720‐4726
Taylor F. J. R. M. (2003) The collapse of the two‐kingdom system, the rise of protistology and
the founding of the International Society for Evolutionary Protistology (ISEP).
International Journal of Systematic and Evolutionary Microbiology 53: 1707‐1714
Taylor G. T., M. Iabichella‐Armas, T.‐Y. Ho, M. I. Scranton, R. C. Thunell, F. Müller‐Karger and
R. Varela (2001) Chemoautotrophy in the redox transition zone of the Cariaco Basin: a
significant midwater source of organic carbon production. Limnology and Oceanography
46: 148‐163
Taylor G. T., M. Iabichella‐Armas, R. Varela, F. Müller‐Karger, X. Lin and M. I. Scranton (2006)
Microbial ecology of the Cariaco Basin’s redoxcline: the U.S.‐Venezuela Cariaco times
series program. In: Past and present marine water column anoxia, edited by L. N. Neretin.
Springer, Dordrecht, The Netherlands. pp. 473‐499
Teira E., T. Reinthaler, A. Pernthaler, J. Pernthaler and G. J. Herndl (2004) Combining
catalyzed reporter deposition‐fluorescence in situ hybridization and

Bibliography 135
microautoradiography to detect substrate utilization by bacteria and archaea in the deep
ocean. Applied and Environmental Microbiology 70: 4411‐4414
Teske A., C. Wawer, G. Muyzer and N. B. Ramsing (1996) Distribution of sulfate‐reducing
bacteria in a stratified fjord (Mariager Fjord, Denmark) as evaluated by most‐probable‐
number counts and denaturing gradient gel electrophoresis of PCR‐amplified ribosomal
DNA fragments. Applied and Environmental Microbiology 62: 1405‐1415
Theede H. (1973) Comparative studies on the influence of oxygen deficiency and hydrogen
sulphide on marine bottom invertebrates. Netherlands Journal of Sea Research 7: 244‐252
Thingstad T. (2000a) Control of bacterial growth in idealized food webs. In: Microbial ecology
of the oceans, edited by D. L. Kirchman. John Wiley & Sons, Hoboken, New Jersey. pp.
229‐261
Thingstad T. F. (2000b) Elements of a theory for the mechanisms controlling abundance,
diversity, and biogeochemical role of lytic bacterial viruses in aquatic systems. Limnology
and Oceanography 45: 1320‐1328
Thingstad T. F. and R. Lignell (1997) Theoretical models for the control of bacterial growth
rate, abundance, diversity and carbon demand. Aquatic Microbial Ecology 13: 19‐27
Thompson J. D., T. J. Gibson, F. Plewniak, F. Jeanmougin and D. G. Higgins (1997) The ClustalX
windows interface: flexible strategies for multiple sequence alignment aided by quality
analysis tools. Nucleic Acids Research 24 4876–4882
Tittel J., V. Bissinger, B. Zippel, U. Gaedke, E. Bell, A. Lorke and N. Kamjunke (2003)
Mixotrophs combine resource use to outcompete specialists: implications for aquatic
food webs. Proceedings of the National Academy of Sciences of the United States of
America 100: 12776‐12781
Tomanek L. (2011) Environmental proteomics: changes in the proteome of marine organisms in
response to environmental stress, pollutants, infection, symbiosis, and development.
Annual Review of Marine Science 3: 373‐399
Tranvik L. J., E. B. Sherr and B. F. Sherr (1993) Uptake and utilization of colloidal DOM by
heterotrophic flagellates in seawater. Marine Ecology Progress Series 92: 301‐309
Uttermöhl H. (1958) Zur Vervollkommung der quantitativen Phytoplankton‐Methodik.
Mitteilung Internationale Vereinigung für Theoretische und Amgewandte Limnologie 9: 1‐
38

136 Bibliography
Vadstein O., Y. Olsen, H. Reinertsen and A. Jensen (1993) The role of planktonic bacteria in
phosphorus cycling in lakes ‐ Sink and link. Limnology and Oceanography 38: 1539‐1544
Vadstein O., L. M. Olsen, A. Busch, T. Andersen and H. R. Reinertsen (2003) Is phosphorus
limitation of planktonic heterotrophic bacteria and accumulation of degradable DOC a
normal phenomenon in phosphorus‐limited systems? A microcosm study. FEMS
Microbiology Ecology 46: 307‐316
Vaqué D., J. M. Gasol and C. Marrasé (1994) Grazing rates on bacteria: the significance of
methodology and ecological factors. Marine Ecology Progress Series 109: 263‐274
Vaquer‐Sunyer R. and C. M. Duarte (2008) Thresholds of hypoxia for marine biodiversity.
Proceedings of the National Academy of Sciences of the United States of America 105:
15452–15457
Varela M. M., H. M. van Aken, E. Sintes, T. Reinthaler and G. J. Herndl (2011) Contribution of
Crenarchaeota and Bacteria to autotrophy in the North Atlantic interior. Environmental
Microbiology 13: 1524‐1533
Vázquez‐Domínguez E., F. Peters, J. M. Gasol and D. Vaqué (1999) Measuring the grazing
losses of picoplankton: methodological improvements in the use of fluorescently labeled
tracers combined with flow cytometry. Aquatic Microbial Ecology 20: 119‐128
Vieites J. M., M.‐E. Guazzaroni, A. Beloqui, P. N. Golyshin and M. Ferrer (2009) Metagenomics
approaches in systems microbiology. FEMS Microbiology Reviews 33: 236‐255
Villarino M. L., F. G. Figueiras, K. J. Jones, X. A. Álvarez‐Salgado, J. Richard and A. Edwards
(1995) Evidence of in situ diel vertical migration of a red‐tide microplankton species in
Ría de Vigo (NW Spain). Marine Biology 123: 607‐617
Vismann B. (1991) Sulphide tolerance: physiological mechanisms and ecological implications.
Ophelia 34: 1‐27
Wasmund N., G. Nausch and W. Matthäus (1998) Phytoplankton spring blooms in the
southern Baltic Sea ‐ spatio‐temporal development and long‐term trends. Journal of
Plankton Research 20: 1099‐1117
Wasmund N., G. Nausch, B. Schneider, K. Nagel and M. Voss (2005) Comparison of nitrogen
fixation rates determined with different methods: a study in the Baltic Proper. Marine
Ecology Progress Series 297: 23‐31
Weber F. (2008) Verteilung und Diversität von Protisten in der Pelagischen Redoxcline der
zentralen Ostsee. Diploma thesis. University of Rostock, Rostock, Germany

Bibliography 137
Weinbauer M. G. and M. G. Höfle (1998) Significance of viral lysis and flagellate grazing as
factors controlling bacterioplankton production in a eutrophic lake. Applied and
Environmental Microbiology 64: 431‐438
Weinbauer M. G., I. Fritz, D. F. Wenderoth and M. G. Höfle (2002) Simultaneous extraction
from bacterioplankton of total RNA and DNA suitable for quantitative structure and
function analyses. Applied and Environmental Microbiology 68: 1082‐1087
Weinbauer M. G., I. Brettar and M. G. Höfle (2003) Lysogeny and virus‐induced mortality of
bacterio‐plankton in surface, deep, and anoxic marine waters. Limnology and
Oceanography 48: 1457‐1465
Weisse T. (2002) The significance of inter‐ and intraspecific variation in bacterivorous and
herbivorous protists. Antonie van Leeuwenhoek 81: 327‐341
Whittaker R. (1969) New concepts of kingdoms of organisms. Evolutionary relations are better
represented by new classification than by the traditional two kingdoms. Science 163: 150‐
160
Wilhelm S. W., S. M. Brigden and C. A. Suttle (2002) A dilution technique for the direct
measurement of viral production: A comparison in stratified and tidally mixed coastal
waters. Microbial Ecology 43: 168‐173
Willen T. (1962) Studies on the phytoplankton of some lakes connected with or recently
isolated from the Baltic. Oikos 13: 169‐199
Williams T. J., H. Ertan, L. Ting and R. Cavicchioli (2009) Carbon and nitrogen substrate
utilization in the marine bacterium Sphingopyxis alaskensis strain RB2256. The ISME
Journal 3: 1036‐1052
Winter C., G. J. Herndl and M. G. Weinbauer (2004) Diel cycles in viral infection of
bacterioplankton in the North Sea. Aquatic Microbial Ecology 35: 207‐216
Wintzingerode F., U. B. Goëbel and E. Stackebrandt (1997) Determination of microbial
diversity in environmental samples: pitfalls of PCR‐based rRNA analysis. FEMS
Microbiology Reviews 21: 213‐229
Wommack K. E. and R. R. Colwell (2000) Virioplankton: viruses in aquatic ecosystems.
Microbiology and Molecular Biology Reviews 64: 69‐114
Worden A. Z. and F. Not (2008) Ecology and diversity of picoeukaryotes. In: Microbial ecology
of the oceans, edited by D. L. Kirchman. John Wiley & Sons, Hoboken, New Jersey. pp.
159‐206

138 Bibliography
Worden A. Z., J. K. Nolan and B. Palenik (2004) Assessing the dynamics and ecology of marine
picophytoplankton: The importance of the eukaryotic component. Limnology and
Oceanography 49: 168‐179
Wrangstadh M., P. L. Conway and S. Kjelleberg (1980) The production and release of an
extracellular polysaccharide during starvation of a marine Pseudomonas sp. and the
effect thereof on adhesion. Archives of Microbiology 145: 220‐227
Wright A. C., L. M. Simpson, J. D. Oliver and J. G. Morris, Jr. (1990) Phenotypic evaluation of
acapsular transposon mutants of Vibrio vulnificus. Infection and Immunity 58: 1769‐1773
Wu R. S. S. (2002) Hypoxia: from molecular responses to ecosystem responses. Marine
Pollution Bulletin 45: 35‐45
Wylezich C. and K. Jürgens (2011) Protist diversity in suboxic and sulfidic waters of the Black
Sea. Environmental Microbiology 13 2939‐2956
Yakimov M. M., V. L. Cono, F. Smedile, T. H. DeLuca, S. Juarez, S. Ciordia, M. Fernandez, J. P.
Albar, M. Ferrer, P. N. Golyshin and L. Giuliano (2011) Contribution of crenarchaeal
autotrophic ammonia oxidizers to the dark primary production in Tyrrhenian deep
waters (Central Mediterranean Sea). The ISME Journal 5: 945‐961
Yakushev E., V. Chasovnikov, J. Murray, S. Pakhomova, O. Podymov and P. Stunzhas (2008)
Vertical hydrochemical structure of the Black Sea. In: The Black Sea Environment, edited
by A. G. Kostianoy and A. N. Kosanev. Springer, Berlin / Heidelberg, Germany. pp. 277‐
307
Yao W. and F. J. Millero (1995) The chemistry of the anoxic waters in the Framvaren Fjord,
Norway. Aquatic Geochemistry 1: 53‐88
Yoon H. S., D. C. Price, R. Stepanauskas, V. D. Rajah, M. E. Sieracki, W. H. Wilson, E. C. Yang,
S. Duffy and D. Bhattacharya (2011) Single‐cell genomics reveals organismal interactions
in uncultivated marine protists. Science 332: 714‐716
Zehr J. P. and R. M. Kudela (2011) Nitrogen cycle of the open ocean: from genes to ecosystems.
Annual Review of Marine Science 3: 197‐225
Zhu F., R. Massana, F. Not, D. Marie and D. Vaulot (2005) Mapping of picoeucaryotes in
marine ecosystems with quantitative PCR of the 18S rRNA gene. FEMS Microbiology
Ecology 52: 79‐92
Zhukov B. F. and I. M. Balonov (1979) The modernizated micropipette for isolation of
microorganisms. Biology of Inland Waters. Informational Bulletin. 42: 9‐11

Bibliography 139
Zillén L., D. J. Conley, T. Andrén, E. Andrén and S. Björck (2008) Past occurrences of hypoxia
in the Baltic Sea and the role of climate variability, environmental change and human
impact. Earth‐Science Reviews 91: 77‐92
Zöllner E., H. G. Hoppe, U. Sommer and K. Jürgens (2009) Effect of zooplankton‐mediated
trophic cascades on marine microbial food web components (bacteria, nanoflagellates,
ciliates). Limnology and Oceanography 54 262–275
Zopfi J., T. G. Ferdelman, B. B. Jørgensen, A. Teske and B. Thamdrup (2001) Influence of water
column dynamics on sulfide oxidation and other major biogeochemical processes in the
chemocline of Mariager Fjord (Denmark). Marine Chemistry 74: 29‐51
Zubkov M. V., A. F. Sazhin and M. V. Flint (1992) The microplankton organisms at the oxic‐
anoxic interface in the pelagial of the Black Sea. FEMS Microbiology Ecology 101: 245‐250
Zuendorf A., J. Bunge, A. Behnke, K. J. A. Barger and T. Stoeck (2006) Diversity estimates of
microeukaryotes below the chemocline of the anoxic Mariager Fjord, Denmark. FEMS
Microbiology Ecology 58: 476‐491

140 List of figures
List of figures
Introduction
Fig. I. Simplified version of the microbial food‐web (page 4).
Fig. II. Examples of prokaryotic traits that increase or decrease the probability of a prokaryote
being found, captured and consumed by a protist predator (page 8).
Fig. III. Idealized representation of a marine pelagic redoxcline, showing major biogeo‐
chemical processes in the nitrogen, carbon and sulphur cycles (page 14).
Fig. IV. Epifluorescence micrographs form Baltic Sea samples showing ciliate cells containing
putative symbionts (page 17).
Fig. V. Bathymetric map of the Baltic Sea; and horizontal profile showing the vertical salinity
gradient (page 21).
Fig. VI. Example of a typical chemical profile for the Baltic Sea water column (page 23).
Chapter 1
Fig. 1.1. Size distribution of the bacterial prey populations at the start of the experiments (page
35).
Fig. 1.2. Growth rate of C. roenbergensis fed on different initial bacterial concentrations, and
corresponding biovolumes, of the three bacterial prey in their different physiological states
(page 39).
Fig. 1.3. Bacterial loss rates in relation to the initial bacterial concentration and the protist
growth rate (page 40).
Chapter 2
Fig. 2.1. Examples of vertical profiles of the Baltic Sea water column, showing oxygen,
hydrogen sulphide and prokaryote concentrations from the surface to just above the sediment
(page 57).
Fig. 2.2. High resolution redoxcline profiles for 2008 and 2009 showing changes along the
physico‐chemical gradient in the abundance and biomass of prokaryotes, HNF, dinoflagellates
an ciliates (page 58).

List of figures 141
Fig. 2.3. High resolution redoxcline profile for 2005 showing changes along the physico‐
chemical gradient in ciliate abundance and morphotype composition (page 59).
Fig. 2.4. High resolution redoxcline profile for 2009 showing changes along the physico‐
chemical gradient in the abundance and biomass of identified protist morphotypes (page 60‐
61).
Fig. 2.5. Depth distribution of identified HNF taxa for 2005 (page 62).
Fig. 2.6. Novel ciliates from the chemocline at Gotland Deep (page 64).
Fig. 2.7. Changes along the physico‐chemical gradient in viral abundance, virus to prokaryote
ratios and FIC (page 68).
Chapter 3
Fig. 3.1. Predator exclusion experimental set‐up (page 81).
Fig. 3.2. Relative abundance of different ciliate morphotypes at the start of the experiments
(page 87).
Fig. 3.3. Changes during the predator exclusion experiments (with no bacterial addition) in
total prokaryote, Sulfurimonas subgroup GD17 and protist abundance (page 88).
Fig. 3.4. Changes during the predator exclusion experiments (with addition of "Sulfurimonas
gotlandica" strain GD1) in total prokaryote, Sulfurimonas subgroup GD17 and protist
abundance (page 89).
Fig. 3.5. Quantitative distribution of 18S rRNA in the CsTFA density gradients for the
treatments with addition of [13C]‐labelled and non‐labelled "S. gotlandica" strain GD1, and the
treatment with no addition (page 91).
Fig. 3.6. Fingerprints of density‐resolved eukaryotic SSU rRNA templates from the CsTFA
density gradient fractions obtained for the treatments with no addition and addition of [13C]‐
labelled "S. gotlandica" strain GD1 (page 92).
Fig. 3.7. Phylogenetic tree showing the relationship of eukaryote 18S rRNA sequences retrieved
from DGGE bands (page 93).
Conclusions
Fig. i. Conceptual models of the impact of different grazer vulnerabilities of carbon starved
fraction of the prokaryotic community on system productivity (page 100).
Fig. ii. Comparison of the structuring of Baltic Sea suboxic to sulphidic food‐webs, to that
typical structuring in oxygenated surface waters (page 103).
Fig. iii. Schema showing a typical distribution of Sulfurimonas subgroup GD17 abundance in
relation to high grazing pressure zones and the theoretical optimal zone for growth (page 105).

142 List of tables
List of tables
Introduction
Table I. Review on principal studies addressing the impact of protist grazing and viral lysis on
prokaryotic and phytoplanktonic communities of suboxic to anoxic water masses (Page 19‐20).
Chapter 1
Table 1.1. Mean and median cell‐volumes measured at different time‐points for each type of bacterium and physiological state (Page 36) . Table 1.2. Growth parameters (theoretical threshold, maximum growth rates and half saturation constants) for C. roenbergensis fed on the three bacterial species tested (Page 38).
Chapter 2
Table 2.1. List of samples and experiments conducted on the three cruises (Page 50).
Table 2.2. List of ciliate species identified in 2005 with the corresponding sample depths (Page
63).
Table 2.3. Data for the experiments conducted to determine protist grazing and viral lysis
impact on the prokaryotic community throughout the redox gradient (age 65).
Table 2.4. Percentage of HNF containing FLB or prokaryotes labeled with CARD‐FISH probes
specific for Eubacteria and Thaumarchaeota (Page 67).
Chapter 3
Table 3.1. Physico‐chemical parameters analyzed for each of the experiments (page 80).
Table 3.2. Growth and grazing rates measured for the Sulfurimonas subgroup GD17 at depths
of differing physico‐chemical conditions, and in absence and presence of grazers (page 90).

List of abbreviations 143
List of Abbreviations
A
BLAST
BD
bp
C
CARD
CI
CsTFA
CTD
DAPI
DGGE
DNA
cDNA
rDNA
dNTP
DOC
DOM
EUB
FIC
Fig.
FISH
FLB
G
H2
H2S
HNF
Ks
LB
MMM
Adenine
Basic Local Alignment Search Tool
Bouyant Density
Base pair
Cytosine
CAtalyzed Reporter Deposition
Confidence Interval
Cesium TriFluoroAcetate
Conductivity‐Temperature‐Depth
4',6‐Diamidino‐2‐Phenylindole
Denaturing Gradient Gel Electrophoresis
DeoxyriboNucleic Acid
Complementary DeoxyriboNucleic Acid
Ribosomal Deoxyribonucleic acid
DeoxyNucleoside TriPhosphate
Dissolved Organic Carbon
Dissolved Organic Matter
(Eu‐)Bacteria
Frequency of Infected Cells
Figure
Fluorescence In Situ Hybridization
Fluorescently Labeled Bacteria
Guanine
Hydrogen
Hydrogen sulphide
Heterotrophic Nano‐Flagellate
Half velocity coefficient
Luria Broth
Marine Minimum Medium
144 List of abbreviations
N2
NH4
NO2
NO3
O2
OD
OTU
PCR
qPCR
POC
POM
R2
RNA
rRNA
rpm
RT‐PCR
R.V.
SD
SE
SIP
SO4
SSCP
T
U
UV
VPR
Molecular nitrogen
Ammonium
Nitrite
Nitrate
Oxygen
Optical Density
Operational Taxonomic Unit
Polymerase Chain Reaction
Quantitative Polymerase Chain Reaction
Particulate Organic Carbon
Particulate Organic Matter
Level of significance
RiboNucleic Acid
Ribosomal RiboNucleic Acid
Revolutions Per Minute
Reverse Transcription Polymerase Chain Reaction
Research Vessel
Standard deviation
Standard Error
Stable Isotope Probing
Sulphate
Single Stranded Conformation Polymorphism
Thymine
Enzyme unit
Ultraviolet radiation
Virus to prokaryote ratio

Supplementary material 145
Supplementary material
Chapter 1
Figure S1.1. Epifluoresence micrographs at 1000 X magnification taken at the start of the
experiments with P. angustum S14 (A, B), V. vulnificus M06‐24/O (C, D) and S. alaskensis
RB2256 (E, F). In all cases, bacteria are shown in their non‐starved physiological state on
the left (A, C, E), and in their starved state on the right (B, D, F).

146 Supplementary material
Chapter 2
Table S2.1. Comparison of experimentally obtained average grazing rates (standard
deviation in parenthesis) with estimated grazing rates obtained through the application of
literature clearance rates to average protist biovolume and abundance data from the start
of the experiments.
% of bacterial standing stocks d‐1
Gotland Deep Landsort Deep Clearance
rate (nl cell‐1 h‐1)
Ref.
Sub. Int. Sul. Sub. Int. Sul.
Flagellates 5 (KuuppoLeinikki 1990)
6 2 1 4 5 3
Dinoflagellates
rounded 10‐25 μm in length
1500
(Neuer &
Cowles 1995)
2 6 1 5 10 1
elongated 10‐30 μm in length
1000
(Neuer &
Cowles 1995)
0.01 0.01 0.01 5 5 0.2
Ciliates
10‐20 μm ESD 2000
(Setälä & Kivi 2003)
7 3 0.2 20 14 3
20‐30 μm ESD 3000
(Setälä & Kivi 2003)
4 17 20 1 1 10
>30 μm ESD 5000
(Setälä & Kivi 2003)
3 4 3 15 10 7
Total estimated 22 32 25 50 45 24
Total measured 25.4
(22.0) 49.0
(11.1) 14.0
(18.2) 80.8 (28.3)
51.5 (10.9)
38.0 (22.0)

Supplementary material 147
Chapter 3
CsTFA Buoyant density (g ml‐1)
1.74 1.76 1.78 1.80 1.82 1.84
relative ban
d intens
ity (%
)
0
2
4
6
8
10
1.74 1.76 1.78 1.80 1.82 1.84
0
1
2
3
4
513C12C
A B
Figure S3.1. Examples of changes in relative band intensity along the density gradient for
the [13C]‐ and [12C]‐treatments: (A) clearly enriched band (e.g., band J), and (B) potentially
enriched band (e.g., band Q). Comparison of relative band intensity was carried out with
both controls, but only the [12C]‐treatment is shown here for clarity.

148 Publications and conferences
Publications and conferences
The contents of Chapter 1 have already been published, the contents of Chapter 2 have
been submitted to a peer‐reviewed journal, and the contents of Chapter 3 are ready for
submission. The author contributions are indicated in the following:
Publications in peer‐reviewed journals
• R. Anderson, S. Kjelleberg, D. McDougald and K. Jürgens (2011)
Species‐specific patterns in the vulnerability of carbon starved bacteria to protist
grazing. Aquatic Microbial Ecology 64: 105–116 (Feature Article).
Contributions by authors ‐ practical work: R.A.; first edition of the manuscript: R.A.;
revision of the manuscript: S.K., D.M. and K.J.
Manuscripts under review and in preparation
• R. Anderson, A. Mylnikov, C. Winter, W. Foissner and K. Jürgens. Protist abundance,
diversity and importance as predators in hypoxic waters of the central Baltic Sea.
(under review)
Contributions by authors ‐ practical work: R.A. (protist quantification and
morphotype identification, bacterivory measurements, food‐vacuole content
analysis), A.M. (protist quantification and flagellate identification), C.W. (virus
quantification and determination of FIC), W.F. (ciliate identification); first edition of
the manuscript: R.A.; revision of the manuscript: A.M., C.W., W.F. and K.J.
• R. Anderson, C. Wylezich, S. Glaubitz and K. Jürgens. Protist grazing impact on a
chemoautotrophic bacterial key‐player of Baltic Sea redoxclines, and identification of
the main grazers through RNA‐stable isotope probing. (ready for submission)
Contributions by authors ‐ practical work: R.A. (grazing experiments, RNA‐SIP), C.W.
(probe design), first edition of the manuscript: R.A.; revision of the manuscript: C.W.,
S.G. and K.J.

Publications and conferences 149
Oral presentations and posters at conferences
2011: Importance of protist grazing on a chemolitoautotrophic key player (´Sulfurimonas`
GD17) of Baltic Sea redoxclines.
R. Anderson, C. Winter, C. Wylezich and K. Jürgens. 12th Symposium on Aquatic
Microbial Ecology (SAME 12), Warnemünde, Germany. (Poster)
2011: Protist diversity, distribution and bacterivory in Baltic Sea pelagic redoxclines.
R. Anderson, F. Weber, C. Wylezich, W. Foissner, A. Mylnikov and K. Jürgens. 2011
Aquatic Sciences Meeting (ASLO), San Juan, Puerto Rico. (Oral presentation)
2010: Protist bacterivory in two Baltic Sea pelagic redoxclines: a first view of a complex system.
R. Anderson, F. Weber and K. Jürgens. 29th Annual Meeting of the German Society for
Protozoology (DGP), Düsseldorf, Germany. (Poster)
2009: Are carbon starved bacteria more resistant to protist predation?
R. Anderson, D. Mc Dougald, S. Kjelleberg and K. Jürgens. 11th Symposium on Aquatic
Microbial Ecology (SAME 11), 2009, Piran, Slovenia. (Oral presentation)
2009: Baltic Sea Redoxclines: a unique Model System for linking in situ and in vivo studies. C.
Bruckner, M. Labrenz, G. Jost, T. Schott, C. Wylezich, R. Anderson, J. Feike, S.
Glaubitz, J. Grote, F. Weber and K. Jürgens. Gordon Research Conference on Applied
and Environmental Microbiology. South Hadley, MA, USA. (Poster)
2009: Protists in Baltic Sea Pelagic Redoxclines.
F. Weber^, R. Anderson^, C. Wylezich and K. Jürgens. 28th Annual Meeting of the
German Society for Protozoology (DGP), Naumburg, Germany. (Poster)
^ both authors contributed equally to the present work
2008: Differential resistance to flagellate predation of two Vibrio species subjected to
carbon starvation.
R. Anderson, D. McDougald, S. Kjelleberg and K. Jürgens. 27th Annual Meeting of
the German Society for Protozoology (DGP), Warnemünde, Germany. (Poster)

150 Curriculum vitae

Acknowledgements 151
Acknowledgements
First of all I’d like to thank my supervisor, Klaus Jürgens for giving me the opportunity to
conduct my PhD at the Leibniz Institute for Baltic Sea Research. I’d also like to thank Klaus for
his guidance throughout these years, and for enabling my stay at the University of New South
Wales at the beginning of my thesis and my attendance to numerous conferences.
For excellent guidance and advice, I’m also very grateful to the members of my thesis
committee: Ramon Massana, Rhena Schumann, Matthias Labrenz, Günter Jost and Lars
Umlauf; and to Diane McDougald and Staffan Kjelleberg, during my stay in the University of
New South Wales.
I was funded for this work by the `Grant for the Formation of Investigative Personnel´ of
the Basque Government, Spain.
For technical assistance I’d like to thank Christian Meeske, Bärbel Buuk, Anette
Grütmüller, Katja Becker, Susanne Busch, Heike Brockmöller‐Benterbusch; Sven Trinkler and
Anna Haggenmeier. Also, the captains and crew of the R.V. Alkor, R.V. Poseidon and R.V.
Maria S. Merian for their excellent support at sea.
I’m very grateful to my whole working group, in its present and past configurations, for
fruitful discussions, assistance, advice, and many entertaining coffee breaks. Here, special
thanks go to Sabine Glaubitz, who instructed me in RNA‐stable isotope probing and translated
my abstract, and Claudia Wylezich who helped me with molecular work and did a lot of proof
reading on the final document.
Outside of the working group, I’m thankful to Christian Winter, for his work with
viruses; and Alexander P. Mylnikov and Wilhelm Foissner for, respectively, the taxonomic
identification of flagellates and ciliates.
Finally, a special thanks to all my friends and loved ones for all their support. I wouldn’t
have got to where I am today without my family, especially Carol, my mother. A special
mention also goes to the Rostock crew (Juliane, Eefke, Quique, Christian, Gisa, Markus, Lars,
Peter, Claudia, Christina, and many others) who welcomed me with open arms, helped me
whenever and with whatever I needed, patiently taught me german, and made my Rostock
time memorable. Last, and in no way least, Deniz, who among many, many things was an
untirable proof reader of my work,.

152 Conclusions and outlook

Statement of independence 153
Statement of Independence
Selbständigkeitserklärung
The opportunity for this doctoral project has not been conveyed to me commercially. In
particular, I did not engage an organization that, for a fee, seeks supervisors for the
preparation of dissertations. Nor did I engage an organization to, in whole or in part, take
care of incumbent obligations with regard to the examinations for me.
I hereby declare that I produced the present thesis independently and without external
help. I did not use any auxiliary materials or sources other than the ones indicated and
passages used literally or with regards to content have been declared as such.
Die Gelegenheit zum vorliegenden Promotionsvorhaben ist mir nicht kommerziell vermittelt
worden. Insbesondere habe ich keine Organisation eingeschaltet, die gegen Entgelt
Betreuerinnen/ Betreuer für die Anfertigung von Dissertationen sucht oder die mir
obliegenden Pichten hinsichtlich der Prüfungsleistungen für mich ganz oder teilweise
erledigt.
Ich versichere hiermit an Eides statt, dass ich die vorliegende Arbeit selbstständig angefertigt
und ohne fremde Hilfe verfasst habe. Dazu habe ich keine außer den von mir angegebenen
Hilfsmitteln und Quellen verwendet und die den benutzten Werken inhaltlich und wörtlich
entnommenen Stellen habe ich als solche kenntlich gemacht.
30.03.2012 Ruth Anderson
. . . . . . . . . . . . . . . . . . . . . . . . . . . . . . . . . . . . . . . . . . . . . . . . . . . . . . . . . . . . . . . . . . . . . . . . . . .
Date/Datum Signature/Unterschrift