Embed Size (px)
Citation preview
Department of Waste Management and Material Flow
Rostock University
ACTUAL SITUATION AND APPROACH FOR MUNICIPAL SOLID
WASTE TREATMENT IN THE ARAB REGION
DISSERTATION
Submitted in the fulfillment of the requirements of
The Academic Board of Rostock University
Faculty of Agriculture and Environmental Sciences
For the Degree of DOCTOR of Engineering (Dr. Eng.)
Ayman A. M. Elnaas
Born in Benghazi 1974, State of Libya
Rostock- Germany
2015

I
Reviewers:
1. Reviewer:
PD Dr. Abdallah Nassour
Universität Rostock, AUF, Abfall- und Stoffstromwirtschaft
2. Reviewer:
Dr.-Ing. Wolfgang Müller
Universität Innsbruck, Institut für Infrastruktur, Lehrstuhl für
Abfallbehandlung und Ressourcenmanagement
3. Reviewer:
Prof. PhD Bassim E. Abbassi
University of Guelph, School of Engineering.
Date of submission: 08.11.2015
Date of defence: 31.03.2016

I
SUMMARY
Recently, some Arab countries have introduced the ISWM concept. Collection and
sorting, composting, incineration of medical wastes and sanitary landfills are starting
to be implemented, while recycling, reuse and resource recovery are still at the initial
stages. In many countries up to 50% of the generated waste goes uncollected, and the
waste that is collected is mainly mixed with industrial and medical waste during
handling and disposal. The typical method of municipal waste disposal in most of the
Arab region is dumping, where it is poorly managed and lacks most of the basic
engineering and sanitary measures for the collection and treatment of gas and
leachate. The inability of the existing waste management systems to cope with the
growing waste generation rates has led to significant health and environmental
problems in most Arab countries
The purpose of this thesis is to examine the MSW treatment practices in the Arab
region in order to suggest possible treatment alternatives, which could be adopted and
implemented locally, for sustainable solid waste management in the future.
This PhD was conducted in two phases, the first phase was the evaluation of the
current situation of SWM practices in the Arab region and the assessment of the
compost produced from mixed MSW in the region; the second phase was the
examination of the feasibility of mechanical biological treatment (MBT) technology
as a solution for the conditions in the region to overcome some of its MSW
management problems. In this study, the characteristics of several samples of mixed
MSW composts were evaluated on the basis of chemical, physical and biological
aspects and compared with German standards (BioAbfV).
This thesis also focused on MBT technology in the form of biodrying processes that
produces refuse derived fuel (RDF) from mixed MSW. Laboratory analysis for RDF
samples was carried out, to evaluate the RDF quality and compared with criteria and
limits set by some European countries. The biological drying process of solid waste
by aerated windrow composting/stabilization was used as a method of pre-treatment
of mixed MSW prior to landfill, in order to produce high calorific material RDF and
recover valuable material from the waste stream. Furthermore the performance of the
biological drying process of solid waste by aerated windrow composting/stabilization
was investigated as part of a pilot scale experiment carried out in Tunisia.

II
In conclusion, the results showed that compost from some operating facilities was of a
poor quality and was not recommended to be used as soil fertilizers, due to the risk
from heavy metals and organic pollutants combined with the physical risks from
sharps and glass, and the aesthetic problem of plastic scraps that remain highly visible
even after composting. The absence of local standards, monitoring systems and the
legal barriers prevents the control of the selling and application of MSW compost to
agricultural/horticultural land.
Over all, the results conclude that an efficient waste treatment could be achieved with
a fairly basic and low-cost MBT concept. This is by utilizing the biological drying
process to produce a substitute fuel for industrial processes and reduce the landfill
areas required, as well as reducing the air emissions from the landfill, in particular
greenhouse gases. High capital investment is needed to set up an RDF plant.
However, return on investment is not guaranteed to treat the designated waste
quantity for all cases. Therefore, the success of SWM is based on the partnership and
cooperation between different involved parties (politicians, private sector, consultant
companies and public sector). The selection of the appropriate solution for MSW
must be based on many factors, such as the availability of land for disposal, the
market for recyclable material and the need for energy production, and taking into
account the economic and social aspects, with particular attention to environmental
issues.

I
TABLE OF CONTENTS
DECLARATION OF INDEPENDENCY ERROR! BOOKMARK NOT DEFINED.
SUMMARY I
TABLE OF CONTENTS I
LIST OF FIGURES VI
LIST OF FIGURES VI
LIST OF TABLES IX
LIST OF ABBREVIATIONS XI
ACKNOWLEDGEMENTS ERROR! BOOKMARK NOT DEFINED.
1. INTRODUCTION AND PROBLEM STATEMENT 1
2. TRENDS AND DEVELOPMENT OF SOLID WASTE MANAGEMENT 3
2.1 THE CONCEPT OF MUNICIPAL SOLID WASTE MANAGEMENT 3
2.2 INTEGRATED SOLID WASTE MANAGEMENT (ISWM) 4
2.3 TECHNOLOGICAL CONCEPTS OF MUNICIPAL SOLID WASTE
TREATMENT 6
2.4 WASTE-TO-ENERGY TECHNOLOGIES 6
2.4.1 THERMAL TREATMENT 7
2.4.2 MECHANICAL BIOLOGICAL TREATMENT 9
2.5 EU LANDFILL DIRECTIVE TO DIVERT WASTE FROM
LANDFILLS 11
2.6 DEVELOPMENT AND FURTHER TARGETS OF THE SOLID
WASTE MANAGEMENT IN GERMANY 12
2.7 THE RECYCLING OF MSW IN GERMANY 14
3. REVIEW OF MUNICIPAL SOLID WASTE MANAGEMENT IN ARAB
REGION 16

II
3.1 OVERVIEW OF THE ARAB REGION AND THE ENVIRONMENT
SECTOR 16
3.2 CURRENT SITUATION OF WASTE MANAGEMENT IN THE
ARAB REGION 17
3.3 LEGISLATION AND BASIC PRINCIPLES 18
3.4 FRAMEWORK AND RESPONSIBILITY 18
3.5 SOLID WASTE GENERATION 20
3.6 CHARACTERISTICS OF SOLID WASTE 22
3.7 MUNICIPAL SOLID WASTE MANAGEMENT AND TREATMENT 23
3.7.1 GENERAL MANAGEMENT ISSUES IN DEVELOPING
COUNTRIES 23
3.7.1.1 FINANCES AND INFRASTRUCTURE 24
3.7.1.2 COLLECTION AND TRANSPORTATION FACILITIES 24
3.7.1.3 WASTE DISPOSAL 24
3.7.2 WASTE MANAGEMENT IN THE ARAB REGION 25
3.7.2.1 STORAGE AND COLLECTION 25
3.7.2.2 RECYCLING AND RECOVERY 25
3.7.2.3 MSW DISPOSAL 26
4. ASSESSMENT OF MIXED MUNICIPAL SOLID WASTE
COMPOSTING PRODUCED IN THE ARAB REGION 28
4.1 QUALITY OF COMPOST PRODUCED FROM MSW 29
4.2 MIXED MSW MANAGEMENT 31
4.2.1 MIXED MSW DEFINITION 32
4.2.2 CHARACTERISTICS OF MIXED MSW 32
4.2.3 COLLECTION OF MIXED MSW 32
4.2.4 PROCESSING AND RECYCLING OF MIXED MSW 33

III
4.2.5 COMPOSTING OF MIXED MSW 34
4.3 STUDY MATERIALS 34
4.4 METHODS OF ANALYSIS 36
4.5 RESULTS AND DISCUSSION 36
4.5.1 MOISTURE CONTENT 38
4.5.2 ORGANIC MATTER 39
4.5.3 RESPIRATION ACTIVITIES 39
4.5.4 HEAVY METALS 40
5. BIODRYING FOR MBT OF MIXED MSW AND POTENTIAL FOR
RDF PRODUCTION 45
5.1 MECHANICAL BIOLOGICAL TREATMENT (MBT) 46
5.1.1 MECHANICAL SORTING COMPONENT 47
5.1.2 BIOLOGICAL PROCESSING COMPARTMENT 47
5.2 BIODRYING OF MIXED MSW- PILOT PROJECT IN BEJA CITY,
TUNISIA 49
5.2.1 SCOPE OF THE PROJECT 50
5.2.2 INSTALLATION OF THE DEMONSTRATION PLANT 51
5.2.3 BIODRYING CONCEPT 53
5.2.4 MATERIAL AND METHODS 54
5.2.4.1 INPUT MATERIAL (MSW) 54
5.2.4.2 CHARACTERISTICS OF THE MSW 55
5.2.5 SAMPLING AND ANALYTICAL METHODS FOR INPUT
MATERIAL 58
5.2.6 SAMPLING AND ANALYSIS FOR THE COARSE FRACTION
(>80 MM) 58
5.2.7 EXPERIMENTAL MONITORING 60

IV
5.2.8 RESULTS AND DISCUSSION 62
5.2.8.1 CHARACTERISTICS OF THE MSW 62
5.2.8.2 SIZE DISTRIBUTION OF FRESH WASTE 64
5.2.8.3 THE PHYSICAL AND CHEMICAL CHARACTERISTICS OF
MSW 65
5.2.8.4 SCREENING AT 80 MM AND MASS BALANCE 67
5.2.8.5 CHARACTERIZATION OF THE COARSE FRACTION 70
5.2.8.6 CHEMICAL PROPERTIES OF THE RDF 72
5.2.8.7 FINE FRACTION CHARACTERISTICS AFTER THE
BIODRYING PROCESS 79
5.2.8.8 STABILIZED MATERIAL PRODUCED/ COMPOST LIKE
OUTPUT (CLO) 80
6. POSSIBLE WASTE TREATMENT ALTERNATIVES DESIGN FOR
MIXED MSW AND ECONOMICAL FEASIBILITY IN THE ARAB
REGION 84
6.1 MECHANICAL BIOLOGICAL TREATMENT (MBT) 84
6.2 MECHANICAL BIOLOGICAL STABILIZATION (MBS) WITH
BIOLOGICAL DRYING, 84
6.2.1 MECHANICAL TREATMENT 85
6.2.2 BIOLOGICAL TREATMENT 85
6.3 PROPOSED STRATEGIES FOR MSW TREATMENT WITH MBT
FACILITIES 85
6.3.1 STRATEGY ONE: BIOLOGICAL DRYING OF MIXED MSW
WITH RDF PRODUCTION AND RECYCLABLES RECOVERY. 86
6.3.2 STRATEGY TWO: BIOLOGICAL DRYING OF MIXED MSW
WITH RDF AND METAL RECOVERY AND STABILIZATION OF
ORGANIC MATERIAL BEFORE LANDFILLING. 87
6.4 ECONOMIC FEASIBILITY ANALYSIS 89

V
6.4.1 COST ESTIMATION AND ECONOMICS 89
6.4.1.1 CAPITAL COST 90
6.4.1.2 OPERATION AND MAINTENANCE COSTS 90
6.4.1.3 GATE FEES AND RDF PRICE ERROR! BOOKMARK NOT DEFINED.
6.4.2 COST ANALYSIS WITH CAPITAL INVESTMENT COST 95
6.4.3 COST ANALYSIS WITHOUT CAPITAL INVESTMENT COST 98
6.5 FURTHER DEVELOPING FOR SUSTAINABLE SOLID
MANAGEMENT SYSTEM SWM SYSTEM 100
6.5.1 SEPARATE COLLECTION OF MSW 100
6.5.2 COOPERATION BETWEEN MUNICIPALITIES, PRIVATE
SECTOR AND INTERNATIONAL COMPANIES 101
6.5.3 WASTE TO WATER TECHNOLOGY (W2W) 102
7. CONCLUSIONS 104
8. RECOMMENDATION 108
REFERENCES XIII
THESIN XXIX
APPENDIXES XXXIII

VI
LIST OF FIGURES
Figure 2.1. A hierarchy of integrated solid waste management (UNEP, 2005). ............ 5
Figure 2.2. Municipal waste treatment in 2012 EU 28 (EUROSTAT, 2012) ................. 12
Figure 2.3. Development and further targets of the solid waste management in
Germany ....................................................................................................................... 13
Figure 2.4. Recycling of MSW in Germany (Eurostat, 2012) ........................................ 14
Figure 3.1. Location and countries of the Arab world (EIA, 2015) ............................... 16
Figure 3.2. The physical composition of municipal solid waste in some countries in the
Arab region (GCC, 2004; SWEEP-NET, 2010; Abou-Elseoud, 2008; Al-Yousfi, 2005; Al-
Humoud, 2005). ........................................................................................................... 23
Figure 4.1. MSW treatment facilities in the Arab region. ............................................ 35
Figure 4.2. The study area and sampling locations. .................................................... 36
Figure 4.3. The results of the organic matter content in the analyzed compost
samples. ....................................................................................................................... 39
Figure 4.4. The results of the AT4 test for all compost samples included in the study 40
Figure 4.5. Distribution of compost samples according to their rotting degree/class 40
Figure 4.6. The concentration of each heavy metal element in the analyzed compost
samples for this study. ................................................................................................. 42
Figure 4.7. Results of heavy metals concentrations in the compost samples compared
with the German standard (BioAbfV) .......................................................................... 43
Figure 5.1. The possibilities of the treatment and recovery of the individual fractions
of household waste and commercial waste in the Arab region. ................................. 47
Figure 5.2. The separation of different fractions of waste by the mechanical sorting
step. .............................................................................................................................. 47
Figure 5.3. A map showing the location of Beja city in Tunisia ( FIPA-TUNISIA, 2013).
...................................................................................................................................... 52
Figure 5.4. Compost plant for the demonstration trials .............................................. 52
Figure 5.5. The sampling procedure of input material for waste characterization (the
manual of the pilot project). ........................................................................................ 55

VII
Figure 5.6. Sampling and analytical methods for input material (the manual of the
pilot project). ................................................................................................................ 58
Figure 5.7. Sampling and analysis for the coarse fraction (>80 mm) .......................... 59
Figure 5.8. Ventilation system installed at the pilot site (unpublished interim report of
the project). .................................................................................................................. 60
Figure 5.9. Monitoring of temperature and water evaporation during the biodrying
process ......................................................................................................................... 61
Figure 5.10. Composition of household waste from Beja, average of each season’s
analysis ......................................................................................................................... 62
Figure 5.11. Composition of household waste from Beja, average of total analysis
during both seasons (summer and winter) .................................................................. 62
Figure 5.12. Size distribution and composition of fresh waste .................................... 64
Figure 5.13. Size distribution of each waste component of the received waste at the
site (Input). ................................................................................................................... 65
Figure 5.14. Dry matter results of the raw waste during the biodrying process before
screening ...................................................................................................................... 66
Figure 5.15. The percentage of output fractions after screening at 80 mm for the total
and each trial during the pilot project period .............................................................. 67
Figure 5.16. The mass balance after the biodrying process for the summer and winter
trials. ............................................................................................................................ 69
Figure 5.17. The average characteristics of coarse fraction for the summer and the
winter season during the pilot project ......................................................................... 71
Figure 5.18. Average total composition of coarse fraction characteristics. ................ 71
Figure 5.19. The average characteristics of fresh waste (input) and the coarse fraction
>80 mm after the end of the biodrying process (three weeks). ................................... 72
Figure 5.20. The dry matter of the input waste and the produced RDF after biodrying
in the pilot project. ....................................................................................................... 74
Figure 5.21. Low heating value (LHV) of the input material (raw waste) the RDF
produced for each trial. ................................................................................................ 74
Figure 5.22. Composition of the RDF produced in Beja compared with the composition
set by European countries ............................................................................................ 76

VIII
Figure 5.23. Heavy metals concentrations (Cd, Cr, Ni & Hg) of RDF produced in Beja
compared with criteria and values set by European countries .................................... 78
Figure 5.24. Heavy metals concentrations (Zn & As) of RDF produced in Beja
compared with criteria and values set by European countries .................................... 79
Figure 5.25. Heavy metals concentrations (Hg & Zn) of stabilized material produced in
Beja and in other composting facilities in the region compared with the German
standard ....................................................................................................................... 81
Figure 5.26. Heavy metals concentrations (Cd, Cr & Ni) of stabilized material
produced in Beja and in other composting facilities in the region compared with the
German standard ......................................................................................................... 82
Figure 6.1. Strategy one: biological drying, RDF production and recyclable material
recovery. ....................................................................................................................... 86
Figure 6.2. Mass balance of strategy one. ................................................................... 87
Figure 6.3. Strategy two: biological drying, RDF and stabilized material production
and recyclable material recovery. ................................................................................ 88
Figure 6.4. Mass balance of strategy three. ................................................................ 88
Figure 6.5. The effect of change in gate fees and RDF price upon investment return
for all suggested options .............................................................................................. 95
Figure 6.6. Revenue from the four suggested alternatives considering the capital cost
is covered by the private sector ................................................................................... 97
Figure 6.7. Revenue from the four suggested alternatives considering the capital cost
is covered by the public sector. .................................................................................... 99
Figure 6.8. Wet and dry separation program and flow of material(Nassour, 2011) . 101
Figure 6.9. Cooperation between municipalities, private sector and international
companies (Nassour, 2011)........................................................................................ 102
Figure 6.10. Principle of Waste-2-Water technology (BMUB, 2009). ........................ 103
IX
LIST OF TABLES
Table 2.1. Processes of municipal waste before landfilling (Bundesumweltamt, 2014)7
Table 2.2. Summary of the thermal treatment of waste (Bundesumweltamt, 2014) ... 8
Table 2.3. General overview of the mechanical-biological waste
treatment/stabilization (Umweltbundesamt, 2014) ................................................... 10
Table 3.1. MSW stakeholders and their role in MSWM in some Arab countries (Al-
Yousfi, 2005; Al-Humoud, 2005). ................................................................................. 19
Table 3.2. The estimated average rates and quantities of MSW generated in some
Arab countries (Nassour et al., 2011). ......................................................................... 21
Table 3-3. The situation of solid waste disposal in some Arab countries (Nassour et
al., 2011) ...................................................................................................................... 27
Table 4.1. Summary of several parameters of the compost samples analysis taken
during the study ........................................................................................................... 37
Table 4.2. Classification of the compost samples analyzed for AT4 test (Kehres, 1998)
...................................................................................................................................... 39
Table 4.3. Heavy metal concentrations of mixed MSW-derived compost compared
with German standards ............................................................................................... 41
Table 5.1.Comparison between the two methods of the aerobic biological process. . 48
Table 5.2. Comparison of the main aspects for both process, to produce
compost/stabilized material and RDF .......................................................................... 49
Table 5.3. The schedule of the summer and winter trials during the the pilot project
period. .......................................................................................................................... 55
Table 5.4. Sorting fractions of waste samples (the manual of the pilot project). ....... 57
Table 5.5.Overall results of the waste characterization and screening during the
project. ......................................................................................................................... 63
Table 5.6. Dry matter results of the raw waste during the biodrying process before
screening. ..................................................................................................................... 66
Table 5.7. Results of screening splits and the fresh and dry weight of each fraction
after screening of all trials during summer and winter season .................................. 68
Table 5.8. Mass balance after the biodrying process during the pilot test. ................ 69
X
Table 5.9. Characterization analysis of output material >80 mm (RDF) during the
period of the pilot project. ........................................................................................... 70
Table 5.10. The basic chemical features of RDF produced in the study area. ............. 73
Table 5.11. Typical composition for RDF according to MSW origin. ............................ 75
Table 5.12. Chemical properties of the produced RDF in Beja compared with quality
criteria set by European countries. .............................................................................. 76
Table 5.13. Heavy metals content of the produced RDF in Beja compared with quality
criteria set by European countries. .............................................................................. 77
Table 5.14. Characteristics of the fine fraction (<80 mm) after three weeks of the
biodrying process ......................................................................................................... 80
Table 6.1. Estimation of the capital investment for the proposed treatment options 90
Table 6.2. Estimated parameters for the calculation of the operation and
maintenance costs for the proposed options............................................................... 90
Table 6.3. Output of each proposed treatment option ................................................ 91
Table 6.4. Details of the operation and maintenance cost estimation ........................ 92
Table 6.5. Assumption of different parameters for revenue calculation ..................... 92
Table 6.6. Capital costs, operation and maintenance and the revenue for option 1 for
the different values of gate fees and RDF price ........................................................... 93
Table 6.7. Capital costs, operation and maintenance and the revenue for option 2 for
the different values of gate fees and RDF price ........................................................... 93
Table 6.8. Capital costs, operation and maintenance and the revenue for option 3 for
the different values of gate fees and RDF price ........................................................... 94
Table 6.9. Capital costs, operation and maintenance and the revenue for option 4 for
the different values of gate fees and RDF price ........................................................... 94
Table 6.10. Total capital investment, operation and maintenance cost and revenues
for the four suggested alternatives.............................................................................. 96
Table 6.11. Cost analysis summary for all options....................................................... 97
Table 6.12. Total capital investment, operation and maintenance cost and revenues
for the four suggested alternatives.............................................................................. 98

XI
LIST OF ABBREVIATIONS
AfDB: African Development Bank
AT4: Respiration activity test
Cd: Cadmium.
CLO: Compost Like Output.
Cr: Chrome.
Cu: Copper.
DM: Dry Matter.
EC: Electric Conductivity.
EU: European Union.
Hg: Mercury.
HHW: Household Hazardous Wastes
ISWM: Integrated Solid Waste Management.
MBT: Mechanical Biological Treatment
MRF: Materials Recovery Facilities.
MSW: Municipal Solid Waste.
MSWFF: Biodried MSW Fine Fraction.
Ni: Nickel.
Pb: Lead.
PET: Polyethylene terephthalate.
PMB: Pre Mechanical Biological
PP: Polypropylene
XII
RDF: Refuse Derived Fuel.
SRF: Solid Recovered Fuel
SWM: Solid Waste Management.
UAE: United Arab Emirates.
UNEP: United Nations Environment Program
USEPA: United States Environment Protection Agency
W/C: Water Content.
W2W: Waste to Water
WtE: Waste to Energy
Zn: Zinc.
Zn: Zinc.

1
1. INTRODUCTION AND PROBLEM STATEMENT
In the last two decades, municipal waste management (MWM) has become a major
concern and is presently one of the main subjects under discussion. This is probably
due to the considerable increase of municipal solid waste (MSW) production in both
total and per capita values. The amount of solid waste produced increases with
economic growth and it demands efficient management solutions (McCarthy, 1994).
Solid waste is an environmental problem in both developed and developing countries.
Solid waste management (SWM) systems in developing countries must deal with
many difficulties, including low technical experience and low financial resources,
which often cover only collection and transfer costs, leaving no resources for safe
final disposal (Collivignarelli et al., 2004). The provision of adequate SWM services
is critical because of the potential impact on public health and on the environment.
Population growth in urban centers, lack of planning, lack of proper disposal, limited
collection service, use of inappropriate technology and inadequate financing are
considered the main problems facing SWM (Diaz et al., 1999).
Composting is a means of biologically degrading organic materials while stabilizing a
residual organic fraction, which can be widely used in agriculture and horticulture
(Garcìa et al., 1995). It also decreases the volume and weight of the raw material
(Golueke, 1977; Schnitzer & Kahn, 1987). However, the quality of compost depends
on the presence or absence of inorganic and organic pollutants, which could enter the
food chain through plant uptake (Lazzari et al., 2000). MSW is the waste most
commonly used for composting. It is an extremely heterogeneous material in particle
size and chemical composition (Flyhammar, 1997). It may, moreover, contain high
concentrations of heavy metals such as lead (Pb), copper (Cu), cadmium (Cd), and
zinc (Zn) (Flyhammar, 1998).
The effective management system of solid waste involves the application of various
treatment methods, technologies and practices. All applied technologies and systems
must ensure the protection of the public health and the environment. There are a wide
variety of alternative waste management options and strategies available for dealing
with mixed MSW to limit the residual amount left for disposal in landfill sites. With

2
proper MSW management and the right control of its polluting effects on the
environment, MSW has the opportunity to become a precious resource and fuel for
future sustainable energy. Waste-to-Energy (WtE) technologies are able to convert the
energy content of different types of waste into various forms of valuable energy
(Rechberger, 2011; Rotter, 2011). Moreover, combustion and biological processes
that yield thermal power, refuse derived fuel, compost, and stabilized product of
MSW before landfill disposal have drawn increasing attention worldwide (Adani et
al., 2002).
The aim of this thesis was to examine the MSW treatment practices in the Arab region
in order to suggest possible treatment alternatives, which could be adopted and
implemented locally, for sustainable solid waste management in the future.
Within this context the objectives of this thesis were to:
Describe and review the current waste management and practices in the Arab
region and identify the factors that influence waste management in the region.
Assess the possible SWM systems and some of the technologies that could be
suitable for the local situation and conditions.
Examine a possible technology that can produce good quality RDF and be a
part of the region’s SWM solution.
Investigate the potential for RDF production and the quantity of RDF that
would be produced by using the biological drying/stabilization process.
Identify the possible RDF composition that would be produced from mixed
MSW in the Arab region.
Recommend practices that will improve and yield benefits in municipal SWM
process in the region.
3
2. TRENDS AND DEVELOPMENT OF SOLID WASTE MANAGEMENT
In the last two decades, MSW has become a major concern and it is presently one of the main
subjects under discussion. This is probably due to the considerable increase of MSW production
in both total and per capita values. The amount of solid waste produced increases with
economical growth and the demand for efficient management solution (McCarthy, 1994). Solid
waste is an environmental problem in both developed and developing countries. In recent years,
most developing countries have started to improve their municipal solid waste management
practices. The increasing amount of waste generated by rapid urbanization in these countries is
usually not properly managed. SWM systems in developing countries must deal with many
difficulties, including low technical experience and low financial resources, which often cover
only collection and transfer costs, leaving no resources for safe final disposal (Collivignarelli et
al., 2004).
2.1 THE CONCEPT OF MUNICIPAL SOLID WASTE MANAGEMENT
Solid waste consists of both solid and liquid waste but not wastewater. Solid waste is the term
usually used to describe non-liquid waste material arising from domestic, trade, commercial,
agricultural and industrial activities, and from public services (Sasikumar, 2009). United States
Environment Protection Agency (USEPA) defines it as ‘any useless, unwanted or discarded
material with insufficient liquid content to be free flowing’ (Brown, 1991).
Municipal solid waste (MSW) includes all solid wastes generated in the community and it is
broadly comprised of non-hazardous domestic, household hazardous wastes (for instance
insecticides, pesticides, batteries, left over paints etc.), and commercial and industrial refuse
including household organic waste, hospital and institutional garbage, street sweepings, yard
trimmings and construction wastes (Zerboc, 2003).
Article 2(b) of the European Union Landfill Directive (EU Landfill Directive, 1999) broadened
the definition further by defining MSW as waste arising from households as well as other wastes,
which because of their nature and composition are similar to waste from households (EEA,
2003). It should be recognized that MSW is a management concept; its organized handling is

4
usually a public issue, although many of the elements in the management system may be
privately owned and operated. Municipal waste is the waste that is generated by citizens and civil
work and similar waste from small businesses and industry (Christensen, 2011).
MSW management refers to the collection, transfer, treatment, recycling or resource recovery and
disposal of solid waste in urban areas (Sasikumar, 2009). Today, nearly half of the world’s
growing population lives in urban areas, placing large pressure on local environments. Inadequate
waste management is the cause of serious urban pollution and health hazards. Sustainable
management of waste, with the overall goal of minimizing its impact on the environment in an
economically and socially acceptable way, is a challenge for the coming decades (Ludwig et al.,
2003).
Waste management is about all the options that society has to manage the transition of the value
of goods and materials from positive value to negative value to be considered at the end as waste.
Ideally, waste management will ultimately turn waste into a zero-value good, i.e., appropriately
treated residue that can be left in a safe landfill or recycled by transforming it physically and/or
chemically so that it becomes valuable again as a raw material for new products (Ludwig et al.,
2003)
A simple definition of MSW management is the supervision of MSW from the source of
generation through collection, recovery and treatment to disposal (Sasikumar, 2009). According
to Uriarte (2008), MSW management should focus on all administrative, financial, legal,
planning, and processing of functions that lead to finding solutions to all problems of solid wastes
(Tchobanoglous et al., 1993).
2.2 INTEGRATED SOLID WASTE MANAGEMENT (ISWM)
ISWM can be defined as the selection and application of suitable techniques, technologies, and
management programs to achieve specific waste management objectives and goals in a way that
favors the best interests of public health and takes into considerations environmental concerns
(Tchobanoglous et al., 1993). The goal of ISWM is the recovery of more valuable products from
waste with the use of less energy and a more positive environmental impact (McDougall et al.,
2001). ISWM involves evaluating local needs and conditions and then selecting and combining

5
the most appropriate waste management activities for those conditions; it is also evolving in
response to the regulations developed to implement the various laws. The implementation of
ISWM for MSW typically involves the use of several technologies (McGraw Hill).
There is no universally applicable solid waste management system. Every community must plan
a system based on the quantity and character of its waste, its financial capability, its technical
expertise and manufacturing capability, and energy and wage costs (Uriarte, 2008).
ISWM lacks a clear and widely accepted definition. A hierarchy is sometimes used to define
ISWM (Figure 2.1). An integrated approach to waste management consists of a set of actions that
will result in minimum energy use, minimum environmental impact and minimum landfill space
at an affordable cost to the community. It will take into account community and region specific
issues and needs, and formulate an integrated and appropriate set of solutions (Bagchi, 2004;
Daskalopoulos et al., 1998, Medina, 2002, Zerboc, 2003).
Figure 2.1. A hierarchy of integrated solid waste management (UNEP, 2005).
6
Some waste management practices are more costly than others, and integrated approaches
facilitate the identification and selection of low-cost solutions. Some waste management
activities cannot bear any charges; some will always be net expenses, while others may produce
an income. An integrated system can result in a range of practices that complement each other in
this regard (UNEP, 2005). This means that the hierarchy cannot be followed strictly since, in
particular situations, the cost of a prescribed activity may exceed the benefits, when all financial,
social and environmental considerations are taken into account.
2.3 TECHNOLOGICAL CONCEPTS OF MUNICIPAL SOLID WASTE TREATMENT
Nowadays, one of the priorities for municipalities is the collecting, recycling, treating and
disposal of increasing quantities of MSW. The potential impacts caused by waste on the
environment, the use of valuable space by landfills and poor waste management that causes risks
to public health are significant obstacles to handling the problem. The effective management of
solid waste involves the application of various treatment methods, technologies and practices. All
applied technologies and systems must ensure the protection of the public health and the
environment. There are a wide variety of alternative waste management options and strategies
available for dealing with mixed MSW to limit the residual amount left for disposal to landfill.
With proper MSW management and the right control of its polluting effects on the environment
and climate change, MSW has the potential to become a precious resource and fuel for future
sustainable energy. Waste-to-Energy (WtE) technologies are able to convert the energy content of
different types of waste into various forms of valuable energy (Rechberger, 2011; Rotter, 2011).
2.4 WASTE-TO-ENERGY TECHNOLOGIES
Two basic techniques can be applied for the treatment of municipal waste. One is the mechanical
treatment of municipal waste, which is combined with biological and thermal processes; the other
is thermal treatment (the main concept of each method is described in Table 2.1).
The goals of these processes are:
• To break down the organic substances biologically or thermally to stabilize the waste
before landfilling
• To obtain recyclable material

7
• To minimize the mass sent to landfill
Table 2.1. Processes of municipal waste before landfilling (Bundesumweltamt, 2014)
Concept Preparation (MBT/MPS) Thermal treatment
Target Production of defined material flows for
recovery or an environmentally friendly
landfilling
Reduce of waste quantities for landfill, inert,
sanitation and utilization of the energy content
Process Mechanical aerobic biological treatment
Mechanical anaerobic-aerobic biological
treatment
Mechanical biological stabilization
(Drying)
Mechanical physical stabilization (Drying)
Incineration of municipal waste in incineration
plant
Pyrolysis in combination with the burning of
the pyrolysis products for power generation
Mono combustion for the use of alternative
fuels
Result Material flows for recycling (approx. 5-
10 % metal, plastic, etc.)
Alternative fuels (approx. 30-50 %,
depending on the treatment)
Material for disposal (approx. 20-30 %,
depending on the treatment)
Material flows for recycling (approx. 5 %
metal)
Power (electricity and heat)
Material for disposal (approx. 30, depending
on the composition of the waste)
2.4.1 THERMAL TREATMENT
Regarding the thermal treatment method, incineration is mainly used for the reduction of the
quantities of the disposal for the inert, the sanitation and the utilization of energy. The creation of
energy is not the main goal of the incineration. Nevertheless, it is a proven technology in
industrialized countries and it has been used in waste disposal for many years. Flue gas cleaning
is a very important process for the environment. The incineration could be applied to the
treatment of MSW. It is an effective MSW treatment option that contributes to waste stabilization
and maximum reduction of waste volume, as well as to sanitation and energy recovery (Liu,
2005). Waste combustion is an attractive treatment option that has some major drawbacks,
(Brinkmann, 1999), which are:

8
• Relatively high cost, higher than that of other technologies for the management of
municipal waste.
• High level of maintenance, higher than that of other technologies for the management of
municipal waste.
• Demand for high quantities of waste.
• Skilled labor required for operations.
Relevant information and data about thermal treatment are listed in Table 2.2.
Table 2.2. Summary of the thermal treatment of waste (Bundesumweltamt, 2014)
Generated material
flows and results
Slag, ash, flue gas, Metals depending on the pre-sorting (approx. 2-5%), electric power
(approx. 20%), thermal energy (about 60%), residues and impurities (about 30%), dust,
leachate and exhausted air.
Capacity Plant capacities approx. 100,000 to 500,000 t /a (Calorific value 6,000-10,000 KJ/kg)
Advantages
No preparation necessary.
Maximum volume reduction and reduction of pollutant and response potential.
Production of energy for electricity and thermal power.
Disadvantages
High investment and high knowledge in the operation.
High requirements on exhausted air treatment.
Location next to a heat consumption.
20-30% residual materials, depending on the technology and the composition of the waste to
disposal.
Investment cost
Approx. 350-600 €/t depending on the technology and plant size.
Approx. 30-40% boiler and steam generator.
Approx. 40-50% emissions treatment.
Additional costs are: development, bunker, construction, generator, planning, approvals and
financing etc.
Operating costs
Repair/maintenance (Construction app. 1%, machines and electrical engineering approx. 3-
4% of the investment costs/a).
Resources (fuel oil) and filter.
Personnel costs and disposal for residual materials.
Total costs 60-100 € / t depending on the energy sale prices and disposal costs of waste.
9
2.4.2 MECHANICAL BIOLOGICAL TREATMENT
MBT is an increasingly popular option in Europe, either as a pre-treatment before landfilling or
as a pre-treatment before combustion. Processes can be classified in two groups according to the
role of free oxygen, either as aerobic or anaerobic systems. The practical experience in Western
European countries has shown that the following groups of substances can be produced and
utilized by the mechanical-biological/physical treatment processes:
• Approximately 5-10% recyclable materials for marketing in local and international
markets.
• 40-60% alternative fuels for thermal utilization in the cement industry and power plants.
The price of the fuels is dependent on energy prices in the country.
• 20-30% inert/stable substances for landfill material, where less leachate and no landfill
gases are produced.
The primary function of the mechanical treatment is to break down the waste and to screen the
relevant material flow, taking into consideration the properties and further processing
(Beckmann, 2007; Bilitewski, 2000; Siefert, 2010).
Usually, this consists of different mechanical processes such as:
• Storage and loading facilities
• Removal of impurities and foreign matter
• Pre-shredding
• Several screening techniques for the separation of the organic fraction
• Metal separators for ferrous and non-ferrous metals
• Sorting technology "Near infrared technology" for PVC, polyethylene terephthalate (PET)
and Polypropylene. Grading technology for light and heavy fractions
• Secondary granulators
Relevant information and data for the mechanical biological treatment are listed in Table 2.3.

10
Table 2.3. General overview of the mechanical-biological waste treatment/stabilization
(Umweltbundesamt, 2014)
Application area Treatment capacity 20,000 to 300,000 t/a.
Advantages Reduction of reaction potential of the disposal waste and minimization of the mass
for landfill.
Minimization of the gas emissions leachate formation, pests and odor nuisances at
landfills.
Allows for energy recovery (biological processes).
Generation of RDF.
Simple and small capital intensive installations, depending on the treatment and its
target.
Disadvantages Only a preparation process to create specific material flows.
Inert substances (20-30 %) depending on the treatment have to be disposed.
Depending on the treatment, the RDF (30-50 %) is going to thermal utilization.
Energy demand Energy requirement (depending on the treatment and its target) approx. 20-60 kWh/t
(approx. 10-30 kWh/t only for the mechanical preparation).
Investment costs Capital costs are about 12 million EUR for 50,000 t/a and 40 million EUR 300,000
for t/a.
Operating costs Personnel and energy consumption (depending on local conditions).
Repair and maintenance (component: 1%, machinery and electronics; 3-6% and
mobile equipment; 8-15% of investment).
Total costs Approx. 20-50 € depending on the process, environmental laws of the country,
disposal costs of waste materials, sell price of alternative fuels, energy and
personnel costs.
With the support of the MBT, municipal solid waste can be safely disposed of because the
treatment permanently reduces the potential reactions and risks induced by the waste. The
mechanical biological treatment is very flexible and can adapt to the change of the composition
of the waste very easily, which makes it productive. The core of the mechanical biological waste
treatment is the treatment of the biodegradable fractions with the biological stage.

11
2.5 EU LANDFILL DIRECTIVE TO DIVERT WASTE FROM LANDFILLS
Waste management in modern societies is passing through several development stages. However,
the transition of waste management from pure disposal management over a more or less
controlled waste management, towards a resource efficient material flow management, offers
great challenges for all stakeholders involved in the process.
The European Union adopted the Landfill Directive aimed at preventing combustible waste from
being landfilled. Landfilling MSW was to be reduced to 75% of the value of year 1995 by 2006
and to 50% by 2009. The third phase to be implemented by 2016 sets out a reduction down to
35% (Ulrich, 2014).
The European Commission describes the aims of the Landfill Directive as follows: "The
objective of the Directive is to prevent or reduce as far as possible negative effects on the
environment from the landfilling of waste, by introducing strict technical requirements for waste
and landfills" (EC, 2014). European waste management builds on the principles of a waste
hierarchy: preventing waste by reusing products, recycling and recovering, including energy
through incineration, and finally disposal. Waste policy in the EU has evolved from dealing
mostly with specific streams of waste to a more integrated approach to waste management and to
resource management as a whole, with a focus on producer responsibility. The implementation of
the European requirements is challenging not only for the Accession Countries but also for
European Member States. Waste is therefore seen as a production resource and a source of
energy. However, depending on regional and local conditions, these different waste management
activities may have differing environmental impacts. Although the impacts of waste treatment on
the environment have been considerably reduced, there is still potential for further improvement,
first by full implementation of existing regulations, and then through the extension of existing
waste policies to encourage sustainable consumption and production practices including more
efficient resource use (EEA, 2010; Hansen et al., 2002).

12
Figure 2.2. Municipal waste treatment in 2012 EU 28 (EUROSTAT, 2012)
As Figure 2.2 shows, taking into account the fact that not all municipal waste is suitable for
recycling, waste that can be separated easily at source should be recycled. The remaining residual
waste should be transformed into energy in clean and save WtE plants, instead of being buried in
landfills. Countries that have most successfully reduced dependence on landfill (1% and below)
have the highest recycling rates in Europe, and have achieved this in combination with WtE,
proving that recycling and energy from waste, which cannot be recycled properly, go parallel in
order to divert waste from landfills (CEWEP, 2012).
2.6 DEVELOPMENT AND FURTHER TARGETS OF THE SOLID WASTE MANAGEMENT IN
GERMANY
Waste management in Germany has evolved substantially since the early 1970s. The first
independent Waste Disposal Act was adopted in Germany in 1972 and its primary aim was to
shut down uncontrolled refuse dumps and replace them with central, regulated and supervised
landfill sites, which fall under the responsibility of the regional and local governments (Schnurer,
2002). Instead of creating new landfill sites and incineration plants, the new Waste Avoidance
and Management Act of 1986 was introduced and, stipulated by the principle of avoidance, the
recycling of waste was given precedence over waste disposal (EEA, 2009; Fischer, 2013).

13
Figure 2.3. Development and further targets of the solid waste management in
Germany
As illustrated in Figure 2.3, Germany has had landfill restrictions for municipal waste since 1993,
for residual municipal wastes that cannot be recovered from both separately collected waste
materials and unsorted municipal waste, and the part of municipal wastes that can be recovered.
The restrictions are to ensure that the wastes being landfilled do not pose a danger to soil,
groundwater, air or the climate. Residual municipal wastes must be treated prior to landfill,
because of its significant biodegradable content, in order to comply with the landfill criteria. The
deadline for total compliance with the landfill ban was set for 2005, thus allowing for an overall
transition period of 12 years. Despite a slow start, the waste management industry began to invest
more actively in additional treatment facilities after 2001, when the landfill restrictions were
made legally binding; as a result of this, the proportion of municipal waste sent directly to landfill
without treatment went from 39% of total municipal waste in 1997 down to 1% in 2006 (BMU,
2006; EEA, 2009; Weissenbach, 2007).

14
2.7 THE RECYCLING OF MSW IN GERMANY
The development of recycling of MSW in Germany related to total recycling is shown in Figure
2.4. This is divided by recycling material, such as metal, glass, plastic, paper and cardboard and
organic recycling, such as compost and other biological treatment.
Figure 2.4. Recycling of MSW in Germany (Eurostat, 2012)
Germany had a high starting level of recycling of MSW in 2001, and the total recycling
continued to increase steadily over the period from 2001 to 2008 from 48% to 64%. Nevertheless,
the total and consistent increase of MSW recycling covers different trends for material recycling
and organic recycling. The amount of material recycling increased during the period from 34% in
2001 to 45% in 2010. In the period from 2001 to 2010, organic recycling increased very little,
from 15% to 17%. The increase has taken place during the last three years in particular (BMU,
2006; EEA, 2009; Fischer, 2013).
Germany aims to achieve almost complete high quality recovery of municipal waste by 2020.
This will eliminate the need for landfill, which has adverse effects on the climate. Resource and
climate protection will be incorporated into waste management to a greater extent at European
and international levels over the next few years, for example by minimizing methane and CO2
emissions or substituting fossil fuels. Options for reducing the organic content in waste are either
incineration or MBT. It has to be ensured that both treatment methods cause as little pressure to
the environment as possible. The use of MBT as an alternative to incineration has been strongly

15
encouraged and developed with different results. In order to reduce the waste quantities that
require pre-treatment before landfilling, separate collection systems and sufficient recovery
capacities for packaging paper and biowaste must be established (Weissenbach, 2007).

16
3. REVIEW OF MUNICIPAL SOLID WASTE MANAGEMENT IN ARAB REGION
SWM is one of the many issues facing developing countries. The provision of adequate waste
management services is critical because of the potential impact on public health and on the
environment. Population growth in urban centers, lack of planning, lack of proper disposal,
limited collection services, use of inappropriate technology and inadequate financing are
considered the main problems facing SWM (Diaz et al., 1999).
3.1 OVERVIEW OF THE ARAB REGION AND THE ENVIRONMENT SECTOR
The countries of the Arab region contain about 6% of the world’s population. The total
population of the region has increased from around 100 million in 1950 to around 380 million in
2000. During this period the population of the region increased 3.7 times, more than any other
major world region. The region spans an area of about 11.1 million Km2 (Figure 3.1 shows a map
of the region). Pollution-related health problems, particularly in urban and industrial areas,
represent a challenge. The causes include: open municipal waste dumps, the use of leaded
gasoline in an aging and poorly maintained vehicle fleet, the inefficient use of fossil fuels for
power generation, and particulate and sulfur oxide emissions from industry. Finally, weak
environmental institutions and legal frameworks prevent countries from adequately addressing
these environmental challenges (Hussein, 2008).
Figure 3.1. Location and countries of the Arab world (EIA, 2015)

17
With regards to industrial development, the current trends in the region fall within two categories:
that of oil-rich countries such as the Gulf Cooperation Council (GCC) countries, and that of the
less affluent Arab nations that rely heavily on the service and agricultural sectors as the backbone
of their economy (Asfari, 2002; Al-Yousfi, 2002).
The Arab region is highly dependent on its non-renewable resources. Generally, across the region
the waste resource sector is inadequately structured and regulated. Most Arab countries have not
yet established proper waste legislation and long term strategies. Waste management in the
region is also characterized by:
Centralization of authority at the national level
Absence of effective cost recovery mechanisms
Deficit in trained personnel
Service inequality between rural and urban areas
Lack of reliable databases
3.2 CURRENT SITUATION OF WASTE MANAGEMENT IN THE ARAB REGION
Currently SWM is one of the major challenges facing any developing nation globally. The
growing population, followed by rapid urbanization, produces a large amount of solid wastes;
while on the other hand, the infrastructure in these countries are not equipped to deal with the
problem. In the developed countries, municipal governments have generally assumed
responsibility for the collection, transfer and disposal of the waste and this constitutes a basic and
expected governmental function (Zerboc 2003). However, the municipal governments of
developing nations lack the ability to provide even this basic function (Medina 2002).
Recently, some Arab countries have introduced the ISWM concept. Collection and sorting,
composting, incineration of medical wastes and sanitary landfills are starting to be implemented,
while recycling, reuse and resource recovery are still at the initial stages (Nassour et al., 2011).
In many countries up to 50% of the generated waste goes uncollected, and the waste that is
collected is mainly mixed with industrial and medical waste during handling and disposal. The
typical method of municipal waste disposal in most of the Arab region is dumping, where it is

18
poorly managed and lacks most of the basic engineering and sanitary measures for the collection
and treatment of gas and leachate. The inability of the existing waste management systems to
cope with the growing waste generation rates has led to significant health and environmental
problems in most Arab countries (Abaza et al., 2011; Nassour et al., 2011).
3.3 LEGISLATION AND BASIC PRINCIPLES
With the rising environmental awareness in the Arab region, environmental protection and waste
management have been given high priority on the political agenda. Most Arab countries have
made efforts to organize SWM with the implementation of several laws and regulations. In some
cases, foreign rules and regulation were enacted without any customization to suit the
characteristics of the country. Some countries in the region have also agreed to and signed the
Basel convention but are struggling to fulfill their commitments under this agreement. A lack of
legislation and weak implementation are considered two of the main challenges facing waste
management in the region (Al-Humoud, 2005; Nassour et al., 2011).
The fees for managing waste are generally collected via trade taxes or as part of properties and
building taxes, but in some countries the relevant ministries and local authorities are responsible
for financing the industry. The fees collected are very low, covering no more than 30% of the
costs. Furthermore, in some cases the fees go to a central treasury and are distributed with unclear
criteria. The funding system for waste management is mainly characterized by the absence of
financial incentives and effective cost recovery mechanisms. There is an attempt toward
increasing charges for waste management services. In Jordan, as one of the developing countries,
a successful scheme has been introduced that is projected to recover 80% of the costs associated
with managing waste via electricity bills (Nassour et al., 2008).
3.4 FRAMEWORK AND RESPONSIBILITY
The concept of ISWM and utilizing waste as a resource has been spreading in the Arab region.
However, as Table 3.1 shows, the solid waste sector in many Arab countries can be characterized
as a disorganized sector with sporadic service coverage. Waste management in the region is one
of the major responsibilities of local government, with no significant participation by the private
19
sector. Subcontractors are commonly brought in to handle specific activities such as collection
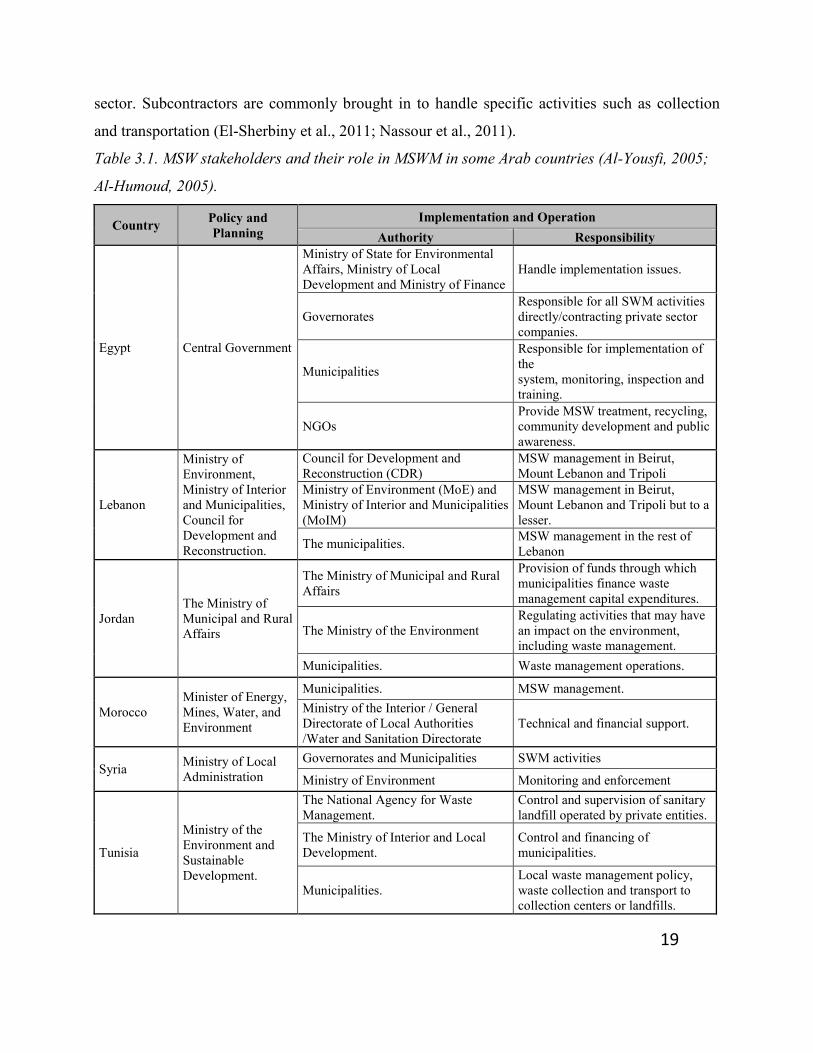
and transportation (El-Sherbiny et al., 2011; Nassour et al., 2011).
Table 3.1. MSW stakeholders and their role in MSWM in some Arab countries (Al-Yousfi, 2005;
Al-Humoud, 2005).
Country Policy and
Planning
Implementation and Operation
Authority Responsibility
Egypt Central Government
Ministry of State for Environmental
Affairs, Ministry of Local
Development and Ministry of Finance
Handle implementation issues.
Governorates
Responsible for all SWM activities
directly/contracting private sector
companies.
Municipalities
Responsible for implementation of
the
system, monitoring, inspection and
training.
NGOs
Provide MSW treatment, recycling,
community development and public
awareness.
Lebanon
Ministry of
Environment,
Ministry of Interior
and Municipalities,
Council for
Development and
Reconstruction.
Council for Development and
Reconstruction (CDR)
MSW management in Beirut,
Mount Lebanon and Tripoli
Ministry of Environment (MoE) and
Ministry of Interior and Municipalities
(MoIM)
MSW management in Beirut,
Mount Lebanon and Tripoli but to a
lesser.
The municipalities. MSW management in the rest of
Lebanon
Jordan
The Ministry of
Municipal and Rural
Affairs
The Ministry of Municipal and Rural
Affairs
Provision of funds through which
municipalities finance waste
management capital expenditures.
The Ministry of the Environment
Regulating activities that may have
an impact on the environment,
including waste management.
Municipalities. Waste management operations.
Morocco
Minister of Energy,
Mines, Water, and
Environment
Municipalities. MSW management.
Ministry of the Interior / General
Directorate of Local Authorities
/Water and Sanitation Directorate
Technical and financial support.
Syria Ministry of Local
Administration
Governorates and Municipalities SWM activities
Ministry of Environment Monitoring and enforcement
Tunisia
Ministry of the
Environment and
Sustainable
Development.
The National Agency for Waste
Management.
Control and supervision of sanitary
landfill operated by private entities.
The Ministry of Interior and Local
Development.
Control and financing of
municipalities.
Municipalities.
Local waste management policy,
waste collection and transport to
collection centers or landfills.

20
Country Policy and
Planning
Implementation and Operation
Authority Responsibility
Yemen Ministry of Local
Administration.
Local Authorities Providing SWM services and the
planning of local taxes and fees.
The City Cleaning and Improvement
Funds
Independent public sector entities,
headed by governors, and
responsible for financing SWM
services in their respective
communities.
Kuwait
Ministry of
Municipal Affairs
and Kuwait
Environment Public
Authority.
Kuwait Municipality. The collection process of waste, its
transport and disposal.
Bahrain
The Ministry of
Municipality Affairs
and Agriculture
Contracting private sector companies. SWM activities
In some countries, local private companies are involved in the collection and transport of solid
waste and some various recycling activities.
Some countries define organizational frameworks, but they are poorly implemented and disrupted
by the centralization of authorities at a national level. In addition, a lack of action by government
institutions, a lack of investment by the private sector and the absence of public participation in
decision making have all hampered the development of proper SWM practices in the region.
Many Arab countries lack a national strategy for SWM while regulations to govern the sector do
not exist. In Arab countries, the political commitment to waste management is limited (El-
Sherbiny et al., 2011; Nassour et al., 2011).
3.5 SOLID WASTE GENERATION
The growth in population causes tremendous increases in the concentration of population in the
urban centers due to migration and immigration of people from rural areas and near by countries
in search of a better livelihood (Zerboc, 2003). Recently, solid waste generation in Arab countries
has been growing due to population and economic growth, accelerated rates of urbanization,
rapid industrialization, rising standards of living, changing consumption patterns and the lack of
public awareness (El-Sherbiny et al., 2011).
21
The impact of a rapidly growing urban population is reflected in the growth in waste generation.
Several studies have shown that growing urban populations leads to huge increases in waste
generation (Medina, 2002; Schubeler, 1996; Zerboc, 2003; Zurbrugg, 2003). This is particularly
true of developing countries where the rate of waste generation far exceeds the infrastructural
provision. The pressure of the growing population on urban infrastructure in many cities
overburdens the provision of urban services. Urban municipal governments are under intense
pressure to meet the demand for basic services such as water, sanitation and SWM (Medina
2002). Globally, MSW generation has continued to increase in line with the growth of other
socio-economic parameters such as population, personal income and consumption patterns
(Achankeng, 2003; Sakurai, 1990).
In the last two decades, per capita waste generation in developed economies has increased nearly
threefold. According to African Development Bank (AfDB) waste generation in developing
nations is growing rapidly and may double in aggregate volume within this decade; this is driven
largely by growth in population and improvements in living standards. If current trends persist, a
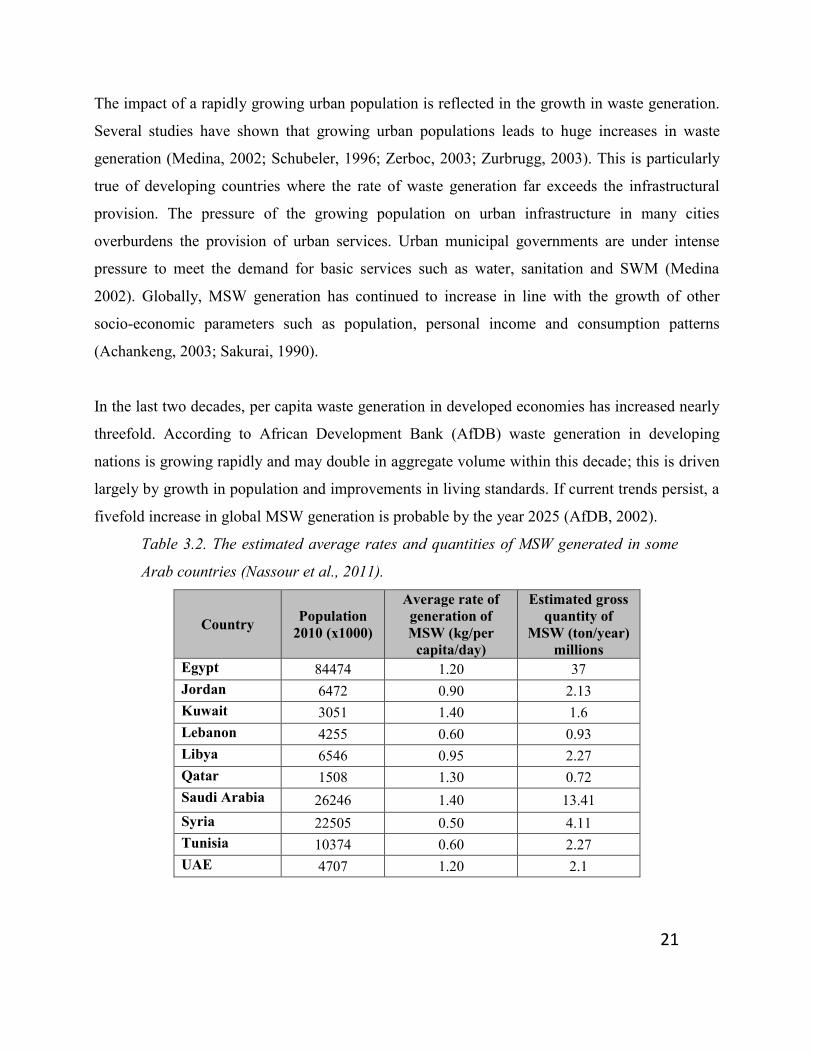
fivefold increase in global MSW generation is probable by the year 2025 (AfDB, 2002).
Table 3.2. The estimated average rates and quantities of MSW generated in some
Arab countries (Nassour et al., 2011).
Country Population
2010 (x1000)
Average rate of
generation of
MSW (kg/per
capita/day)
Estimated gross
quantity of
MSW (ton/year)
millions
Egypt 84474 1.20 37
Jordan 6472 0.90 2.13
Kuwait 3051 1.40 1.6
Lebanon 4255 0.60 0.93
Libya 6546 0.95 2.27
Qatar 1508 1.30 0.72
Saudi Arabia 26246 1.40 13.41
Syria 22505 0.50 4.11
Tunisia 10374 0.60 2.27
UAE 4707 1.20 2.1

22
As Table 3.2 shows, across the region the per capita waste generation ranges between 0.5 kg and
1.5 kg per day. Although the rate of waste generation is growing across the whole region, the rate
differs from country to country, due to factors such as social conditions and wealth (Abou-
Elseoud, 2008). It is predicted that the amount of MSW generated in Arab countries in 2020 will
exceed 200 million tons per year (LAS, 2009).
3.6 CHARACTERISTICS OF SOLID WASTE
One of the most significant differences between the waste generated in developed and developing
nations is in terms of its composition. The wastes generated in developed countries are mainly
inorganic in nature, whereas organic contents form a large portion of waste in developing
countries (Hoornweg, 1999; Medina, 2002; Zerboc, 2003; Zurbrugg 2003). In a developing
country the proportion of organic contents in waste is almost three times higher than that in
developed countries (Medina, 2002; Zerboc, 2003). Even though the volume of waste generated
in developing countries is much lower, as compared to that in developed countries, the nature of
waste is denser and has a very high humidity content (Hoornweg, 1999; Medina, 2002; Zerboc,
2003; Zurbrugg, 2003). The nature and composition of waste is highly dependent on the income
and lifestyle of the population. Being highly organic and humid in nature, SWM in developing
countries presents both opportunities and constraints that are entirely different than those faced
by developed countries (Hoornweg, 1999; Zurbrugg, 2003). Figure 3.2 shows the physical
composition of MSW in some countries in the Arab region.

23
Figure 3.2. The physical composition of municipal solid waste in some countries in
the Arab region (GCC, 2004; SWEEP-NET, 2010; Abou-Elseoud, 2008; Al-Yousfi,
2005; Al-Humoud, 2005).
Across the Arab region, recyclable materials such as plastic, glass, paper, metals and textiles are
not separately collected, and household waste is mixed with other types of waste when it is
collected, increasing the amount of municipal waste generated. The percentage of decomposable
material in MSW is very high and varies from 30 to 70%; it consists mainly of fruits, vegetables
and food scraps, while the proportion of wood is very low. Municipal waste also contains
hazardous substances such as drug residues, expired medicines, chemicals, paints, batteries and
other materials.
3.7 MUNICIPAL SOLID WASTE MANAGEMENT AND TREATMENT
3.7.1 GENERAL MANAGEMENT ISSUES IN DEVELOPING COUNTRIES
SWM is one of the many issues facing developing countries. The provision of adequate waste
management services is critical because of the potential impact on public health and on the
environment. Population growth in urban centers, lack of planning, lack of proper disposal,
limited collection service, use of inappropriate technology and inadequate financing are
considered the main obstacles facing municipal SWM in the Arab region (Diaz, 2003)
24
3.7.1.1 FINANCES AND INFRASTRUCTURE
In a developing country (Bartone, 2000; Schübeler 1996), the SWM service is only provided to
about 50% of the urban population; actual collection only accounts for around 60 to 70% of the
waste generated (Gerlagh et al., 1999). The insufficiency of services results in the deterioration of
the urban environment in the form of water, air and land pollution; which not only poses risks to
human health but to the environment as well (Medina, 2002). Another impact of the increasing
population is the creation of a vicious cycle of pollution. Rises in the population are not met by
equal increases in infrastructural facilities, which leads to increases of uncollected or poorly
managed waste (Zerboc, 2003).
3.7.1.2 COLLECTION AND TRANSPORTATION FACILITIES
Developing countries lack the facilities for proper handling, collection and transportation of the
generated wastes. Inadequate planning and layout, due to rapid urbanization, causes urban areas
in developing countries to be more congested and populated. Often the waste collection trucks
cannot reach every part of the town, compelling the residents to throw their waste in open
dumping spaces near human settlements. Congestion of traffic makes transportation of waste
more time consuming and, as a result, more expensive and less efficient (Zerboc, 2003). A lack
of proper transportation vehicles is also one of the problems facing SWM in developing
countries. Most of the vehicles used for transporting wastes are often outdated, improper and
non-functional (Zerboc, 2003).
3.7.1.3 WASTE DISPOSAL
The main disposal method for solid waste in most developing countries is that of open dumping,
often the dumping sites are very near to areas of human habitation (Medina, 2002). Little care is
given to the status of the water table, water pollution and emission of hazardous and toxic gases.
The disposal of hazardous, biomedical, or slaughterhouse wastes is rarely controlled. Illegal
disposal of wastes in water bodies is a common practice, which not only causes toxins to be
dispersed in the environment (Hoornweg et al., 1999; Zurbrugg, 2003) but also often ends up
coagulating the water bodies and destroying the whole ecosystem of the area.
25
3.7.2 WASTE MANAGEMENT IN THE ARAB REGION
Waste management in Arab countries is characterized by a high percentage of uncollected waste,
with most of the waste directed to open or controlled dumpsites. Sorting and composting facilities
are operated with limited capacity. Countries of the Gulf Cooperation Council (GCC) have higher
waste generation rates of 1.2-2.7 kg/capita/day; they are able to provide better waste management
services with coverage extending to remote or low-density population areas (AFED, 2008).
3.7.2.1 STORAGE AND COLLECTION
SWM practices in the Arab world include waste collection, transportation, transfer, sorting,
treatment, and final disposal. These practices vary widely from country to country, and even
within a country or region. However, different types of collection vehicles are used. Open bed,
covered, and compactor vehicles are generally used in urban areas. Transfer stations are not used
in many regions of the Arab world. Vehicle to vehicle transfer, open lot, and formal state-of-the
art transfer stations are also utilized in other regions (El-Sherbiny et al., 2011). Depending on the
finances available either plastic or steel 120 liter to 1100 liter bins are used, with a current trend
to supply plastic bins of between 240 liters and 1100 liters in collaboration with German and
other European countries. German companies have established some plastic bin production
facilities in the UAE. A number of separate collection pilot projects have been carried out in
Lebanon, Jordan and Saudi Arabia (Nassour et al., 2011).
3.7.2.2 RECYCLING AND RECOVERY
A recycling, reuse, and recovery industry does not exist in most of the Arab region, where they
are still at their initial stages, although they are gaining increased consideration. Waste sorting
and recycling are driven by an active informal sector. Such recycling activities are mostly manual
and labor intensive (El-Sherbiny et al., 2011). About 1-3% of the total generated waste is
recovered as recyclable materials, such as PET, other plastics, metals and paper. These materials
are sorted from the waste containers and disposal sites by scavengers, the sorted paper, metals
and some plastic materials are marketed and recovered in local recycling facilities, while the PET
are marketed internationally (Nassour et al., 2011).
26
Although waste recycling in the high-income Arab countries has increased, it remains limited.
The UAE has only 1.4% recycling rate, but it aims to reach 20%. The only comprehensive form
of recycling in the GCC countries has been in the case of paper, cardboards, metals and cans
(Indy ACT, 2010).
Food scraps and organic matter are separated by the informal sector to be recovered and reused as
animal feed, which may cause hygienic issues. Some countries have applied waste-to-energy
technologies using incineration and anaerobic digestion on a trial scale. However, such practices
have not yet been approved. Composting is also gaining increased interest due to the high organic
content of MSW. Composting has been increasingly adopted in some countries as a strategic
choice for processing the organic content of waste. Although the municipalities of the high-
income Arab countries have tried composting a fraction of organic waste, a large number of
plants were not operated successfully (Alhoumoud et al., 2004). The region has had poor
experience of sorting recyclable materials from municipal waste and processing the separated
organic matter.
The integration of the informal sector in recycling activities is considered necessary in the region,
due to social and organizational reasons and the significant economic and social benefits that will
be gained from it. The involvement of the informal sector in the separation and collection of the
recyclable materials from commercial centers and industrial facilities will have a positive effect
on the recycling management (Nassour et al., 2011).
3.7.2.3 MSW DISPOSAL
Still, recycling rates remain low with most waste ending up in dumpsites. Waste disposal along
curbsides and in uncontrolled dumps is still practiced in many parts of the Arab region. The most
commonly used method of disposal is in controlled dumpsites. Disposal in sanitary landfills is
increasingly being adopted, particularly where there is a strong sense of environmental
awareness. The situation of solid waste disposal in some Arab countries is shown in Table 3.3.
Nearly all of the high-income Arab countries dispose of their waste in landfills, which are more
like dumps than modern landfills (Alhoumoud et al., 2004).

27
Table 3-3. The situation of solid waste disposal in some Arab countries (Nassour et al., 2011)
Country Disposal situation
Egypt Landfills are located in large cities, while small dumps service small cities and
towns.
Jordan There are about 26 landfills around the country, with four of them considered to be
regional.
Tunisia Nine standard landfills and the necessary transfer stations have been built and are
operated by the government agency for waste.
The small landfills were not built with leachate treatment plants. Therefore, the
leachate is transported and treated in central treatment plants.
Kuwait There are 17 old landfills that the government and the environmental authority are
working on to find a long-term solution for the problem for landfill rehabilitation.
Lebanon There is not enough space for landfilling, or any solutions that require a large area.
Therefore the trend is towards incineration as an alternative treatment option.
The main problem in the country is dealing with old landfills and landfill
rehabilitation.
Libya
Main controlled dumpsites exist in the big cities; some of them are badly located
(near surface water and near the residential areas).
The small cities are dumping their waste in open area outside the cities
Dumpsites in the region generate high levels of methane gas due to the significant amount of
organic waste in the waste stream. Mixed waste contains hazardous materials such as batteries
and cathode ray tubes, which contaminate the groundwater with toxic heavy metals. Open
burning and outdated incinerators, even when fitted with pollution control devices, still release
greenhouse gases, heavy metals, particulates, cancer causing dioxins and hazardous ash.
İncineration of solid waste has been undertaken in some countries, but has been found to be
expensive and strongly opposed by the public (Andy ACT, 2010).

28
4. ASSESSMENT OF MIXED MUNICIPAL SOLID WASTE COMPOSTING PRODUCED
IN THE ARAB REGION
Composting is an ancient agricultural practice for the reuse of organic wastes and nutrients for
crop production. The production of compost from agricultural and industrial wastes, and
municipal by-products is an important means of recovering organic matter and an essential
method of disposal. It is applied to cropland to maintain and improve soil structure and plant
nutrition. In the course of ongoing urbanization and changing living conditions, organic waste
lost its link to the traditional reuse practices in rural agriculture. Instead, it became a health
hazard for cities and an environmental problem due to the lack of appropriate management
(Gigliotti et al., 1996).
Since the 1970s, composting has experienced increased attention in the field of solid waste
management. However, due to technological and managerial mistakes, composting gained a
questionable reputation. It was believed that large-scale, highly developed solid waste
composting plants could solve the waste problem in urban areas. Most of these composting plants
turned out to be failures with serious financial consequences (Dulac, 2001). Most of the plants
were abandoned for a number of reasons such as:
The technology applied was often too complicated and not adapted to local circumstances.
The over mechanization and choice of technologies without due analysis of waste
characteristics.
Financial and marketing aspects were usually ignored resulting in high operational costs.
Management and technical expertise was often not sufficiently available.
The absence of supportive institutional environments such as the legal and policy
framework or economic circumstances.
Poor quality of process outputs due to the use of mixed municipal waste with lot of inerts.
Low skill/managerial inputs reduced the operating efficiencies resulting in high cost of
production.
A poor quality of finished compost resulting in problems in marketability.

29
Composting is a means of biologically degrading organic materials while stabilizing a residual
organic fraction, which can be widely used in agriculture and horticulture (Garcìa et al., 1995). It
also decreases the volume and weight of the raw material (Golueke, 1977; Schnitzer & Kahn,
1987). Theoretically, all the organic matter could break down and escape as CO2 and water, in
which case finished compost would consist of nothing but the remaining ash. The fact that this
does not happen, and that the remaining stable organic fraction is useful to soils and plants, are
two of the reasons that composting has such value (Brinton, 1979; Rynck, 1992). This can help to
reduce the impact of several environmental problems (Chefetz et al., 1996).
However, the quality of compost depends on the presence or absence of inorganic and organic
pollutants, which could enter the food chain through plant uptake (Lazzari et al., 2000).
Previously MSW was the waste most commonly used in composting. It is an extremely
heterogeneous material in particle size and chemical composition (Flyhammar, 1997). It may,
moreover, contain high concentrations of Pb, Cu, Cd and Zn (Flyhammar, 1998). Consequently,
the subsequent application of MSW composts that are rich in heavy metals to agricultural soils
may cause accumulation of heavy metals to toxic levels (King et al., 1990; Veeken & Hamelers,
2002). The presence of heavy metals in composts is the main cause of adverse effects on animal
and human health, transmitted through the food chain from soil, groundwater and plants.
Consequently, analyzing the contents of heavy metals in composts is very important for the
routine monitoring and risk assessment and regulation of the environment (Senesi et al., 1999).
4.1 QUALITY OF COMPOST PRODUCED FROM MSW
Compost quality could be defined based on standard parameters aimed at assuring compost
suitability for agricultural exploitation. Obstacles due to the presence of contaminants can be
avoided by a right choice of the starting materials and composting processes. Due to the
qualitative and quantitative level of humification reached during the process, major difficulties
concern the compost maturity (Adani et al., 1997; Senesi & Brunetti, 1996).
Compost quality refers to the overall state of the compost with regard to physical, chemical and
biological characteristics, which indicate the ultimate impact of the compost on the environment.

30
It lies at the core of the issue of composting and biological treatment in general, as it defines the
marketing potential and the outlets of the product and in most cases, the feasibility of the
treatment plant, but also the long-term acceptability of biological treatment as a valuable option in
the waste hierarchy (Hogg et al., 2002; Lasaridi, 1998).
The criteria that are relevant to the evaluation of quality depend on what purpose the compost is
used for, the relevant environmental protection policies and the market requirements (Gillett,
1992; Kehres, 1992). For example, composts intended as growing media should meet more
stringent quality criteria compared to composts that will be used as landfill cover. The difference
in the MSW service level will affect the criteria that set the quality limits of the compost as
product. There is a wide variation among the limit values adopted by the member countries within
the EU with the north being usually more stringent than the south, due to the varying levels of
progress on source separation of the biodegradable fraction of MSW, but also the different needs
in soil organic matter (Deportes et al., 1995; Hogg et al., 2002).
A number of characteristics determine compost quality, such as moisture, organic matter and
carbon content, heavy metals, salinity, inert contaminants and state of maturity or stability
(Lasaridi, 1998). Similar values are set for foreign matter (glass, plastics and stones) in most
national specifications, usually defined as maximum allowed content on a dry weight basis and in
reference to their particle size (Hogg et al., 2002). The degree of compost stability and its
nitrogen content are particularly important for its agricultural use and are increasingly more often
defined in compost specifications. Compost stability is defined as microbial activity measured
through the respiration activity (AT4) or the self-heating potential (Hogg et al., 2002; Lasaridi &
Stentiford, 1998). In 1999, the European Union Landfill Directive (The Council of the European
Union, 1999) required member states to reduce the amount of biodegradable waste being dumped
(Anton et al., 2005), in order to minimize environmental impacts and the loss of organic
resources. This directive promoted the adoption of measures to increase and improve sorting at
the origin, and recovery and recycling, including composting of organic and green MSW. Organic
MSW is defined as household waste and other waste which, because of its nature or composition,
is similar to household waste, capable of undergoing anaerobic or aerobic decomposition,

31
excluding green MSW from gardens and parks, which includes tree cuttings, branches, grass and
wood. The composting of organic MSW, as well as reducing the total amount of landfill waste,
yields a product that can be used in agriculture and destroys many of the pathogens and odor
compounds (Jakobsen, 1995).
The aim of this thesis was to identify and analyze some compost produced from MSW in the
Arab region, in order to derive their quality profile and examine their compliance with the
international standards.
4.2 MIXED MSW MANAGEMENT
The typical problem in the MSW management of developing countries can be identified as:
inadequate service coverage and operational inefficiencies of services, limited utilization of
recycling activities, inadequate landfill capacity and inadequate management of hazardous and
healthcare waste (Visvanathan et al., 2004). Different countries have adopted different strategies
for reaching their goals, by applying advanced environmental technologies by extending
recycling and reuse. Sustainable waste management will have to consider all possible options for
the reduction of the negative impact of consumption (Ludwig et al., 2003).
Besides landfill and incineration, composting of MSW is considered as a waste management tool,
as composting can effectively reduce the waste volume and beneficial utilization of compost can
eventually turn waste material into a resource. Benefits of the soil application of compost have
been attributed to improvement of physical properties; that is, increased water infiltration, water-
holding capacity, aeration and permeability, reduction of disease incidence, weed control or
improvement of soil fertility (Barker, 1997; Gallardo-Lara & Nogales, 1987; Mkhabela &
Warman, 2005; Parr & Hornick, 1992; Rosen et al., 1993). The growth of MSW composting
facilities will depend on the development of good operating facilities and the economics of waste
management. Uniform standards are needed for compost products that will not hinder distribution
and marketing. The standards should be based on sound scientific basis and related to public
health and protection of the environment (Epstein, 1997).

32
4.2.1 MIXED MSW DEFINITION
Mixed MSW was defined in the 1991 Conn. Pub. Acts 293, §1 as consisting of “mixtures of solid
wastes which have not been separated at the source of generation or processed into discrete,
homogenous waste streams such as glass, paper, plastic, aluminum or tire waste streams” (DRS,
1992). It also refers to heterogeneous and commingled solid waste, which may include readily
biodegradable organic wastes, as well as other organic wastes that are not readily biodegradable
and may also contain inorganic and non-compostable wastes (DEM, 1997).
4.2.2 CHARACTERISTICS OF MIXED MSW
Mixed MSW is highly heterogeneous. It is characterized by mixed organic and inorganic waste,
mixed combustibles and inert mixed dry and wet wastes, organic fractions at different stages of
decomposition, and a high level of moisture as waste is mainly picked up from open community
storage containers. In the main, domestic waste can be found mixed with hospital and other
hazardous waste, construction and demolition debris, and drain silt. All of this leads to the
presence of sand, silt, glass and metal fines (Asit Nema, 2009). Batteries, consumer electronics,
ceramics, light bulbs, house dust and paint chips, lead foils, used motor oils, plastics, and some
glass and inks can all introduce metal contaminants into the solid waste stream (Richard, 1992).
4.2.3 COLLECTION OF MIXED MSW
The collection time and costs of mixed MSW per ton are often less than those for separated
material. Mixed MSW is deposited in large metal or plastic bins equipped with hinged lids. These
bins are designed for easy transport to the processing facilities (Goldstein et al., 1990; Hoornweg
et al., 1991). Mixed MSWis collected by vehicles and transported to a central processing facility,
which employs a high degree of mechanization, including separation equipment such as
shredders, trommels, magnets, and air classifiers, to recover the recyclables. Mixed waste
collection requires no extra effort by the generator and results in no incremental collection costs;
it is, however, accompanied by high processing and operating costs, and risks regarding
technology and market economics due to uncertain capital and operations costs and potentially
low recovery efficiency and material purity (Tchobanglous & Kreith, 2002).
Vehicles with enclosed trailers are used for collecting mixed MSW; these vehicles are equipped
33
with rotary drums or with a compactor. The use of these trucks will result in sufficient size
reduction of the waste, making it possible to increase the capacity of each container. The mixing
is desirable when the collection is followed by incineration. However, it is undesirable if the
recovery of recyclables is the next process step. For example, paper that is contaminated by food
waste, glass, sand and inert mater is unusable for recycling. Compaction can make separation
more difficult, however, and can greatly complicate the procedures and equipment that will be
used to compost. The primary disadvantage of mixed MSW collection is that the separation must
be performed as soon as possible once the material arrives at the facility (Bilitewski et al., 1994;
Goldstein et al., 1990; Hoornweg et al., 1991; Williams, 1998).
4.2.4 PROCESSING AND RECYCLING OF MIXED MSW
The theoretically recyclable components in MSW include paper and board, plastics, glass, metal
and putrescible materials. However, in some cases it is not possible to recycle some of the waste
due to contamination. Certainly, the materials are contaminated with non-compostable
contaminants, which includes visible materials such as plastic and glass, and chemical
contaminants, such as Household Hazardous Wastes (HHW). Both physical contaminants, such
as street sweepings that can contain a variety of contaminants such as motor oil and asbestos, and
chemical contaminants can have a negative impact on the marketability of the finished product,
and their removal forms a large part of the expense of modern MSW composting facilities
(Richard, 1992; Williams, 1998).
Mixed MSW would require the separation of the components of waste to remove the inert
material such as glass, ferrous and non-ferrous metals (Williams, 1998). One of the problems of
collecting all recyclable items and waste together is the contamination of paper from broken
glass. This type of contamination leads to a reduction in the value of the paper (Richard, 1992).
Having been mixed with waste in the container, or having been compacted and crushed in the
collection vehicle, lowers the quality of the sorted recyclables. Contamination by soiling or
wetting also limits the marketing of recyclables. It has been observed that the collection of
recyclables from mixed MSW results in only a partial recovery of waste paper, plastic and glass
(Bilitewski et al., 1994; Gallenkemper & Doedens, 1988).

34
4.2.5 COMPOSTING OF MIXED MSW
Mixed MSW is extremely heterogeneous in size, moisture and nutrient content. The organic
fraction can contain varying degrees of non-compostable and possibly hazardous waste. Both
physical and chemical materials found in the feedstock can have a negative impact on the
marketability of the finished product. The sorting of mixed MSW requires more labor and
machinery for manufacturing a marketable compost product from this material. Therefore, a
range of physical processing technologies, in addition to the biological process management
common to other types of composting, is needed (Richard, 1992). One important factor is the
market acceptance of the final MSW compost product. The use of this compost in horticultural
crops has some special concerns, which mainly relate to the presence of heavy metal compounds
and foreign and undegradable particles, such as glass and rubber, or chemical fibers and toxic
organic compounds (Rosen et al., 1993). The organic waste used for large scale composting
facilities can be variable, and may also contain contaminants due to incorrect sorting. Therefore,
end product quality may be difficult to guarantee for the end users (Williams, 1998). The
development of mixed MSW composting has not received much endorsement for the last decade
(Spencer & Goldstein, 2006).
4.3 STUDY MATERIALS
Solid waste treatment facilities with compost production, shown in Figure 4.1, do existed in the
Arab region, but many of them no longer operate and some even closed before they started to
operate. Their failure was due to their mismanagement because of the inappropriate technology
chosen for the local conditions (resulting in high operating costs and frequent mechanical
breakdowns through poor maintenance), a lack of understanding of the composting process and
training of personnel for the operational procedures.

35
Figure 4.1. MSW treatment facilities with compost production no longer operate in the Arab
region.
Samples of MSW composts were collected from some cities in different countries of the region.
Recyclable materials such as plastic, glass, paper, metal, textiles, etc. are not sorted from the
waste stream by separate collection, and the household waste in some cases is collected mixed
with other types of waste, which increases the amount of municipal waste generated. Municipal
waste also contains hazardous substances such as drug residues, expired medicines, chemicals,
paints, batteries and other materials.

36
Figure 4.2. The study area and sampling locations.
4.4 METHODS OF ANALYSIS
Samples were collected from different cities in different countries in the region (Egypt, Syria,
Iraq, Turkey and UAE) (see Figure 4.2). The main samples were MSW compost and the raw
material to produce the compost, which was mixed municipal solid waste. Sampling was
undertaken according to the same procedure from the composting plant, by the following steps:
Dig samples from several depths and from the sides and top.
Collect about 10–15 subsamples throughout the compost pile.
Mix the subsamples together thoroughly into one sample.
Coning and quartering to reach a final sample size of about 5 liters should reduce the
sample.
4.5 RESULTS AND DISCUSSION
Compost shall be well decomposed and stable with regard to oxygen consumption and carbon
dioxide generation. It shall be derived from agricultural, food and yard trimmings, source-
separated or mixed MSW. The product shall contain no substances toxic to plants, possess no
objectionable odors and shall not resemble the raw material it derived from. MSW is an

37
extremely heterogeneous material, of which up to 60% is biodegradable material. There are
however, major concerns about the quality of compost produced from MSW. However, it is not
only the physical contamination that poses a problem for potential users of MSW composts:
compost can also contain chemical and biological contaminants. The range and median values of
chemical properties of the MSW composts are presented in Table 4.1.
Table 4.1. Summary of several parameters of the compost samples analysis taken during
the study
Parameter Range Median German standard
(BioAbfV)
PH 7.12 – 8.12 7.68 -
EC ms/cm 6.47- 11.59 8.945 -
W/C % 7.4 – 33 18.5 55 %
Organic matter % 17.5 – 62.7 37.35 15-40 %
AT4 mgO2/g.dm 0.2 - 82.1 21.3 See Table 4.2
The pH is a measure of active acidity in the feedstock or compost and most finished composts
will have pH values in the range of 6 to 8: these ranges can be substantially different depending
on the kinds of feedstock used. A lower pH is preferred for certain plants, while a neutral pH is
suitable for most applications. The pH is not a measure of the total acidity or alkalinity and
cannot be used to predict the compost effect on soil pH. The values of the pH were in the range
from 7.12 to 8.12 with an overall median value of 7.68. The pH value of the compost is
important, since applying compost to the soil can alter the soil pH, which in turn can affect the
availability of nutrients to the plant (CIWMB, 2007; USCC, 2001).
Electric conductivity is a measure of the combined amount of salts in the compost: the greater the
electrical conductance, the greater the concentration of soluble salts in the compost. Generally,
compost soluble salt levels typically range from 1 to 10 ms/cm. Electric conductivity of the
compost samples varied from 6.47 to 11.59 dS/m with a median value of 8.94. Soluble salts can
be harmful to plants by reducing water absorption and producing conditions that are toxic to the
plants. Ideal soluble salt levels will depend on the end use of the compost. Therefore, some
compost uses can have higher soluble salts content, such as 12 ms/cm (Brinton, 2000). However,

38
greater management is required depending on the soil to which it is added, the amount and
frequency of adding the compost to the soil, the plant's tolerance to high salt concentrations, and
the amounts and frequency of irrigation water or rainfall.
4.5.1 MOISTURE CONTENT
The moisture content of compost affects its bulk density and, therefore, may affect transportation
cost. Moisture content can also affect product handling. The ideal moisture content for
composting will depend on the water holding capacity of the materials being composted. In
general, high organic matter materials have higher water holding capacity and a higher ideal
moisture content. Compost that is too dry can be dusty and irritating to work with while compost
that is excessively wet can be heavy and difficult to uniformly apply. According to the German
standards for compost (BioAbfV), the desirable moisture content of the finished compost is
around 50% or more.
Figure 4.4. Water content of compost samples analyzed
during the study.
As Figure 4.3 shows, the moisture content in the compost samples varied from 7.4 to 33%; such
composts with very low water content may not have been fully stabilized or may have been
stored for long periods leading to moisture loss. Since the water content of all samples was less
than 35%, they were considered as dry compost. The main disadvantage of dry compost is that it
produces significant amounts of dust.

39
4.5.2 ORGANIC MATTER
There is no ideal organic matter level for finished compost. Organic matter in the samples varied
from 17.5% to 62.7% and about 20% of the compost samples had organic matter content higher
than the value set by the German standard (BioAbfV), which should be between 15-45%. Dry
compost that is high in organic matter content is difficult to incorporate into the soil because it
tends to stay on the surface of the soil.
Figure 4.3. The results of the organic matter content in the analyzed compost samples.
4.5.3 RESPIRATION ACTIVITIES
This test contributes to understanding stability and maturity from a microbiological basis. Its
measurement is used to estimate biological activity in a sample; it refers to a specific stage of
organic matter decomposition during or after composting, which is related to the type of organic
compounds remaining and the resultant biological activity in the material.
Table 4.2. Classification of the compost samples analyzed for AT4 test (Kehres, 1998)
Rotting class AT4 (mg O2/g
DM)
Classification of
the samples tested
Product description
I >40 19% Compost raw materials
II 40-28 19% Fresh compost
III 28-16 6% Fresh compost
IV 16-6 44% Finished compost
V <6 12% Finished compost

40
Figure 4.4. The results of the AT4 test for all compost samples included in the study
The stability of any given compost is important in determining the potential impact of the
material on nitrogen availability in soil. Most uses of compost require a stable to very stable
product that will prevent nutrient tie up and maintain or enhance oxygen availability in soil. As
shown in Table 4.1, compost respiration in the samples varied from 0.2 mgO2/g.dm to 82.1
mgO2/g.dm. Accordingly, only 56% of the compost samples appeared to be stable and considered
as finished product of class IV and V (see Figure 4.6).
Figure 4.5. Distribution of compost samples according to their
rotting degree/class
4.5.4 HEAVY METALS
Heavy metals are trace elements whose concentrations are regulated due to the potential for
toxicity to humans, animals and plants. Many of these elements are actually needed by plants for

41
normal growth. There are many sources of heavy metals within household waste, many of which
can pass through mechanical screens designed to remove non-biodegradable matter such at
batteries (Richard, 1992). The potential for contamination of MSW is worsened by the absence of
recycling facilities for hazardous wastes (Slack et al., 2007). In addition, other materials such as
paints, electronics, ceramics, plastics and inks can all contribute to the heavy metal load of MSW
(Sharma et al., 1997). The results of the heavy metals concentration in the samples are shown in
Table 4.3.
Table 4.3. Heavy metal concentrations of mixed MSW-derived compost
compared with German standards
Parameter Range
German standard
(BioAbfV)
A B
Pb mg/kg 7.35 – 319 150 100
Cd mg/kg <0.1 – 1.66 1.5 1.0
Cr mg/kg 25.9 - 73 100 70
Cu mg/kg 30.4 – 182 100 70
Ni mg/kg 20.9 - 155 50 35
Hg mg/kg 0.04 – 0.8 1.0 0.7
Zn mg/kg 102 – 1550 400 300
High levels of heavy metals in compost represent an obvious concern when it is to be applied to
food crops (Bhattacharyya et al., 2001; Papadimitrou et al., 2008). Heavy metals do not degrade
during the composting process, and always become more concentrated due to the microbial
degradation. Figure 4.7 shows the concentration of each element of heavy metals in the compost
samples.

42
Figure 4.6. The concentration of each heavy metal element in the analyzed compost samples for
this study.

43
The levels at which heavy metals are found can vary from negligible background levels in ‘clean’
composts, such as source-separated food waste, to potentially toxic levels in some mixed waste
based composts (Richard, 1992).
High-quality compost should be low in trace elements and soluble salts, and should be free of
inert contaminants such as stones, plastic, glass and metal. The heavy metal concentration of the
compost sample analyzed for this study was compared with the German standards (BioAbfV).
Figure 4.8 shows the results that 56% of the samples had three or more elements of the heavy
metals higher than the proposed limit and that 12% had two elements more than the proposed
limit, while only 32% had one element more than the proposed limit. Only one of the 16 tested
samples fulfilled the BioAbfV requirements and was considered as stable compost of class (A),
due to concentrations of Ni higher than the limit set by BioAbfV.
Figure 4.7. Results of heavy metals concentrations in the compost
samples compared with the German standard (BioAbfV)
Generally, most compost samples tested in this study were of a poor quality and were not
recommended for use as soil fertilizers. This was due to the risk from heavy metals and organic
pollutants, alongside the physical risks from sharps, glass and the aesthetical problem of plastic

44
scraps that remain highly visible even after composting. It is clear that the production of compost
from mixed MSW is widely used in many countries in the Arab region and it needs sustainable
methods for its disposal. Almost all composts derived from MSW tested in this study remained
wastes rather than compost, even after successful processing to stabilize the organic matter. The
absence of local standards, monitoring systems and legal barriers prevents the control of the
application of MSW compost to agricultural/horticultural land. There is, however, a risk that the
application of MSW compost will increase the heavy metals content of agricultural soils.

45
5. BIODRYING FOR MBT OF MIXED MSW AND POTENTIAL FOR RDF
PRODUCTION
Considering the poor compost quality produced from mixed MSW, and the unfeasibility of a
segregated collection in most developing countries and the Arab Region, other practical
alternatives for the management of mixed MSW should be evaluated and considered for the
region. Moreover, combustion and biological processes yielding thermal power, refuse derived
fuel (RDF), compost, and stabilized product of MSW before landfill disposal have drawn
increasing attention worldwide (Adani et al., 2002).
A good alternative for the region is the waste to energy (WtE) concept where mixed MSW is
converted to RDF. This alternative mainly contributes to the reduction of the moisture content of
the waste, which increases the calorific value of the resulting product and decreases the
production of leachate of landfilled material if no further stabilization of organic material is
applied. It also includes the possibility of converting the waste into energy, recovery of
recyclable material and the reduction of pollutants emitted into the environment.
Due to a high proportion of food waste (>50%), MSW in many developing countries has a high
water content, which lowers the recovery of material and increases the operation cost of
combustion (Bezama et al., 2007; Hazra & Goel, 2009). Some processes could be applied to
mixed MSW to overcome these problems and to improve the material and energy recovery from
the waste stream. Composting and other bio-stabilization processes result in the degradation of
easily degradable organic matter; biodrying processes dry the waste while increasing its heating
value by reducing its water content (Bezama et al., 2007; Rada et al., 2007; Sugni et al., 2005;
Zhang et al., 2008).
This chapter aims to provide some possible options of technologies referred to as mechanical
biological treatment (MBT). The MBT technologies are pre-treatment technologies, which
contribute to the diversion of MSW from landfill when operated as part of a wider integrated
approach involving additional treatment stages.

46
5.1 MECHANICAL BIOLOGICAL TREATMENT (MBT)
An MBT system is a waste processing facility that combines a waste sorting facility with
biological treatment methods (anaerobic digestion and/or composting). MBT plants are designed
to process mixed household waste as well as commercial and industrial waste. Therefore, MBT is
neither a single technology nor a complete solution, since it combines a wide range of techniques
and processing operations (mechanical and biological) that are affected by the market needs of
the end products. Thus, MBT systems vary greatly in their complexity and functionality.
MBT is a generic term for the integration of a number of waste management processes such as
materials recovery facilities (MRF), RDF production, mechanical separation, sorting and
composting. MBT are used for treating waste with the aim of improving waste management
through the production of stabilized material for landfilling or, preferably, of added-value
products such as solid recovered fuel (SRF) or compost (Juniper, 2005). MBT includes the
separation of useful waste components for industrial reuse, such as metals and plastics, as well as
RDF.

47
Figure 5.1. The possibilities of the treatment and recovery of the individual
fractions of household waste and commercial waste in the Arab region.
Figure 5.1 illustrates the possibilities of the treatment and recovery of the individual fractions of
household waste and commercial waste in the Arab Region. The challenge for such a proposed
solution is to ensure the thermal utilization of the produced fuels. The ecological and economic
assessment represents the utilization of alternative fuels in the cement industry. In most countries
of the region there are already existing cement plants, which could use the RDF from municipal
waste.
5.1.1 MECHANICAL SORTING COMPONENT
Mixed MSW is separated into various fractions, each of which is treated and, if possible, recycled
in a way that is customized to its properties. Most MBT plants divide their input into a fine
fraction for biological treatment and a coarse high-calorific fraction that undergoes extended
mechanical or/and biological treatment, see Figure 5.2.
Figure 5.2. The separation of different fractions of waste by the mechanical
sorting step.
5.1.2 BIOLOGICAL PROCESSING COMPARTMENT

48
The biological process includes the biological treatment of the biodegradable organic materials
that has been sorted; it refers to the following methods:
Anaerobic digestion
Bio-stabilization/Aerobic treatment (composting)
Biodrying/Aerobic treatment
The aerobic option is the most commonly used as it is easier to manage. In the field of aerobic
processes, a distinction must be made between bio-stabilization and biodrying, see Table 5.1.
Both processes adopt aeration into the mass of waste, but with different targets.
Table 5.1.Comparison between the two methods of the aerobic biological process.
Method Bio-stabilization Biodrying
Processes Aeration Aeration
Time Long-time process Short-time process
Actions Highest conversion of
organic carbon
Evaporation of the highest part of the
humidity in the waste. Lowest
conversion of organic carbon
Product Stabilized solid end product
(compost) Produces a refuse-derived fuel.
Biodrying technology, aiming at removing water by microbial activities, is regarded as a good
solution to reduce the water content of wet organic wastes (Choi et al., 2001). Besides the high
water removal rate, it is expected to constrain organics degradation, preserving energy for
subsequent utilization (Adani et al., 2002).
The reduction of moisture reduces the weight of the material and facilitates the sorting of
different fractions from the waste stream for further recycling or/and recovery. Additional
benefits include the reduced potential for odors and leachate since the resulting material is well
aerated and partially stabilized.

49
Finally, the resulting material with its lower moisture content is more suitable for energy
production. A comparison of the main aspects for both processes, to produce compost/stabilized
material and RDF, is shown in Table 5.2. The biodrying process of MSW, which produces the
RDF, takes place before the stabilization process of the dried screened fine organic fraction.
Therefore, the time needed for the biodrying process is less than the time required for stabilized
organic fine material. The aim of the biodrying is to dry the waste using the heat produced by the
microbial activities where no water is added during the process. Therefore, the effect of the
weather conditions will be on the degree of drying, as the waste would be dried in both winter
and summer, with different percentages. Whereas, during the stabilization process, the weather
conditions would have a negative impact on the process and affect the optimum environment for
the bacterial activities
Table 5.2. Comparison of the main aspects for both process, to produce compost/stabilized
material and RDF
Aspects Stabilization RDF
Time needed 8-12 weeks 2-4 weeks
Output Low quality compost High energy content
Land needed Large area Less area
Selling of the output Needs marketing High potential
Weather conditions Negative impact Positive impact
RDF becomes one of the interesting alternatives to solving MSW problems. Its benefits are not
only to improve environmental quality, but also to reduce local economical loss. However, due to
the high moisture content, low calorific value and high ash content of raw MSW, it needs to
segregate the raw MSW and produce RDF. The advantage of RDF over raw MSW is that RDF
has a higher calorific value and more consistency in quality.
5.2 BIODRYING OF MIXED MSW- PILOT PROJECT IN BEJA CITY, TUNISIA
The biodrying process of MSW is a pre-treatment process before the biostabilization of the

50
screened fine fraction of the MSW. Within a pilot project supported with grant funds allocated by
the German Government/Federal Ministry for Economic Cooperation and Development (BMZ)
in the frame of the German Financial Cooperation via KfW Development Bank, the transfer of a
low cost mechanical biological pretreatment technique of MSW, particular to the conditions in
Tunisia, was to examined. Biodrying of mixed MSW took place during the processes of this pilot.
Based on the results obtained from this pilot project test, a review of the biodrying process is
presented below, as well as the potential of RDF production from mixed MSW in Tunisia.
5.2.1 SCOPE OF THE PROJECT
The project was planned to include trials during both the summer and the winter seasons to
determine the impact of both climates on the waste composition and the decomposing conditions.
The objectives of the pilot project were to prove that the Pre Mechanical Biological (PMB)
treatment is a feasible solution for the conditions in Tunisia.
The specific objectives of the biodrying treatment to be tested were to:
Minimize:
o The emissions of odors, landfill gas and leachate
o The remaining waste to be landfilled (quantity and emission)
o System costs
Optimize the biological decomposition
Determine the potential to produce secondary fuels (RDF)
Identification of the optimal method for mechanical and biological processing steps under
the conditions in Tunisia
Determine the need for adaptation of the system of MBT to Tunisian conditions
Rostock University has a part in this pilot project; a PhD student was required to be present at
Beja during both the winter and the summer trials, with experience in mechanical biological

51
treatment, and in particular the assessment of the composting process regarding optimum
conditions for efficient biodegradation.
Tasks included:
1. Preparation of the trial windrows.
2. Receiving of the waste.
3. Taking representative samples at waste characterization and from trial windrows.
4. Preparation of the samples (drying, sorting, shredding) and analysis, which are done in
Beja.
5. Transport samples to Rostock University in Germany for further analysis.
6. Process monitoring of the trial windrows.
7. The design of relevant MBT options for Tunisian waste: process flow diagram, plant
layout for different scale facilities.
5.2.2 INSTALLATION OF THE DEMONSTRATION PLANT
The demonstration plant was established at an existing small, windrow-composting facility in
Béja (see Figure 5.4), which is located in the northwestern part of Tunisia in the Medjerda
Valley. The plant is shown in Figure 5.3.

52
Figure 5.3. A map showing the location of Beja city in Tunisia ( FIPA-
TUNISIA, 2013).
The following equipment was provided and installed in the existing treatment facility:
An aeration system for two windrows (40 m length).
Semipermeable windrow cover sheets were used to protect the windrows from sun and
rain (in the winter) and to reduce the odor.
A windrow turner to enable mixing of the waste and turning of the composting windrows
on a weekly basis.
The existing machines in the site (shredder, screen, tractor) were tested and repaired
where needed.
Equipment for the lab to enable accurate monitoring of the trials.
Figure 5.4. Compost plant for the demonstration trials

53
Tasks of the process:
Waste delivery: it was planned that the facility should receive about 100t for each
trial/windrow.
Shredding of the total received waste with the existing compost-shredder at the site was
not possible. Therefore, the windrow turner was used to at least open the waste bags and
mix the waste.
Formation of windrows 5 m wide and 2 m high along the whole length of the aeration
pipes (about 40 m).
To maintain optimum composting/biodrying conditions the piles were turned and mixed
once a week using a composting turner. As the aim was to dry the waste, no water was
added at this stage of the process before screening the waste after three weeks.
After three weeks the process should be finished and the waste should be dried. The waste
was screened at 80 mm with the drum screen.
Determination of the split between > 80 and < 80 mm on the site using buckets.
Afterword the total RDF was weighed with the weighbridge in the close dumping site in
order to estimate and calculate the mass balance.
5.2.3 BIODRYING CONCEPT
In biodrying, the main drying mechanism is convective evaporation, which uses heat from the
aerobic biodegradation of waste components and is facilitated by the mechanically supplied
airflow. The moisture content of the waste is reduced through two main steps: water evaporates
from the surface of waste into the surrounding air and the evaporated water is then transported
through the waste by the airflow and removed with the exhaust gasses. A limited amount of free
water may leak through the waste and be collected at the bottom as leachate. The appropriate
control of aeration operational parameters (e.g., air-flow rate and direction) and temperatures can
achieve a high biodrying efficiency (66.7% of initial water eliminated) (Adani et al., 2002; Sugni

54
et al., 2005). However, the principle of aerobic biodrying is to drive evaporation with energy
from organic matter degradation, thus the capacity for water removal is limited by the amount of
biodegraded organics. The air supply is controlled automatically and the temperature probe
sensor manages the control mechanism.
Temperature is the key parameter for water evaporation and organics degradation during
biodrying. The aeration of waste is critical for biodrying; it provides a mass and energy flow
media, enabling water content removal, heat-transfer redistribution, removing excessive heat,
adjusting the windrow temperature and insure O2 delivery for aerobic decomposition. Air blowers
are set to maintain average compost temperatures of around 40 ˚C to 70 ˚C and waste is turned
weekly by the compost turning machine to avoid poor air distribution and uneven composting of
the waste in the windrow, and also to maintain a good structure in order to maintain porosity
throughout the entire composting period.
The resulting dry material is afterwards screened in order to separate the oversize fraction
characterized by high net heating value from the smaller fraction (“biodried MSW fine fraction”,
(MSWFF) that is characterized by low heating values (Tambone et al., 2011; Velis et al., 2010).
5.2.4 MATERIAL AND METHODS
5.2.4.1 INPUT MATERIAL (MSW)
The summer trials were spread over nearly four months and during this period three trials were
carried out. The winter trial was spread over three months with two trials. The schedule of the
summer and winter trials is listed in Table 5.3 below.
For each test, the waste was subjected to a biodrying phase (self-draining of waste) for a three
week period to enabled an effective screening of waste for separation of recyclable materials and
high calorific value components of fine organic fraction. The sampling was carried out during the
different steps of the process as follows:
Sampling for the characterization of received waste at the site
Sampling during screening (at 80 mm) the dried waste after 3 weeks (output)
Sampling during the weekly turning of waste for monitoring biological reactions

55
Table 5.3. The schedule of the summer and winter trials during the the pilot project period.
Trials Quantity of waste (t)
Number of
windrows Beginning of trial End of trial
1 110 2 25/06/2014 15/07/2014
2 96 1 04/08/2014 28/08/2014
3 98 1 03/09/2014 23/09/2014
4 145 2 27/10/2014 19/11/2014
5 60 1 02/12/2014 17/12/2014
5.2.4.2 CHARACTERISTICS OF THE MSW
After delivery of fresh waste, about 100 ton for each windrow, sub-samples were taken from
different waste trucks before the shredding and turning of waste to achieve a representative
samples for waste characterization. A drum screen with 40 mm screen was used to screen the
waste to small fraction < 40 mm and large fraction > 40 mm to record the size distribution of
waste fraction, see Figure 5.6.
Figure 5.5. The sampling procedure of input material for waste
characterization (the manual of the pilot project).

56
The characterization method followed that described in the manual of the pilot project. A drum
screen machine with a screen of 40 mm was used for the first screening. The entire waste sample
was screened. Waste bigger 40 mm was then placed on a table and sorted. The sorting team
consisted of five sorters with a team leader. Before the first screening step at 40 mm, plastic bags
were opened to make contents available for screening/sorting. In addition large particles (e.g.,
large cardboards, plastic film etc.), which may disturb the screening process and could reduce the
quality of the screening, should be separated by hand and specified according to the defined
sorting fractions. The sorting fractions were then weighed.
From the waste, which was fed to the first screening step of 40 mm, about 10% was separated for
taking a sample for lab analysis. The screen overflow > 40 mm was then sorted by hand in the
sorting fractions, defined in Table 5.5. The sorting fractions were then weighed.
The complete fine fraction <40 mm was weighed and then a proportionate quantity of at least 40 l
was taken for further investigation. The procedure to obtain this sample of 40 l was performed as
follows: the material <40 mm was piled on an even surface into a cone. This cone was once
turned into a new cone to further homogenize the material. The homogenized cone was flattened
to a uniform truncated cone and divided into four equal sections. Each of the diagonally opposite
portions was combined to a new subset. The entire process was repeated until the desired quantity
of about 40 l was obtained. Only this portion of fines <40 mm had to be screened by 10 mm and
the screening at 10 mm was done by a hand screen.
The particle size 10 - 40 mm was only sorted for the following sorting fractions:
Organics
Paper/cardboard
Plastics
Metals
Inert (incl. glass)
The fines < 10 mm were not sorted but just weighed and samples were taken for lab analysis.
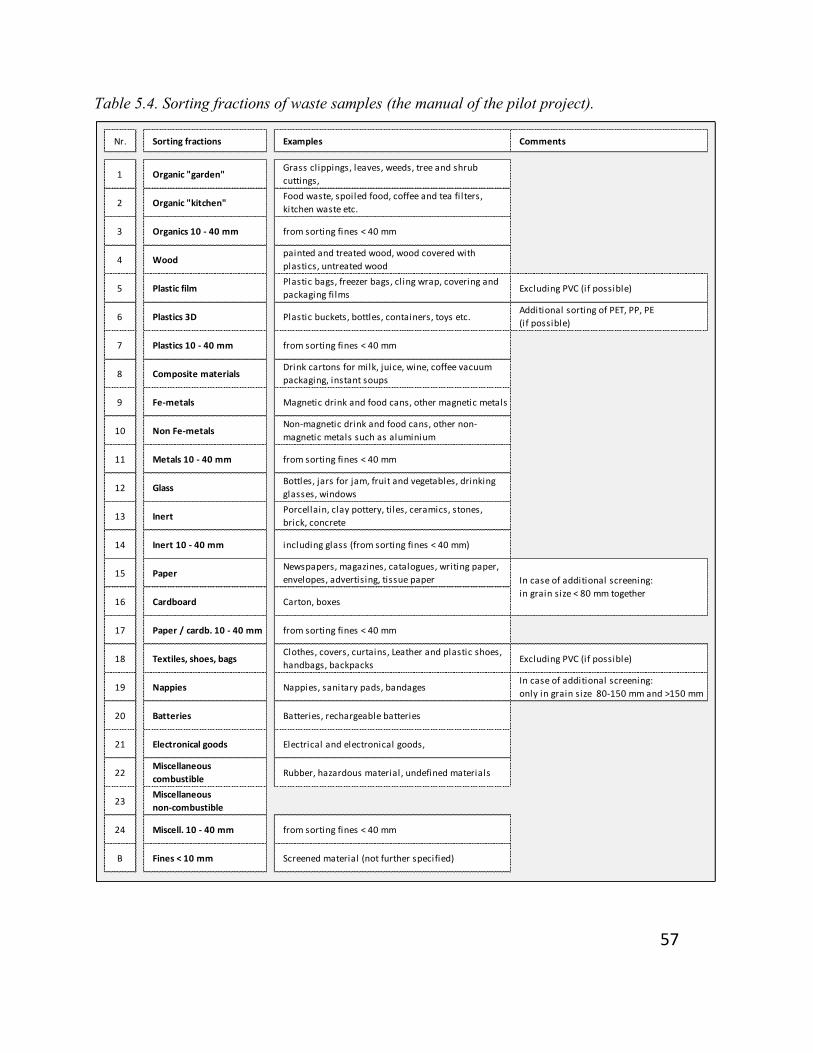
57
Table 5.4. Sorting fractions of waste samples (the manual of the pilot project).
Nr. Sorting fractions Examples Comments
1 Organic "garden"Grass clippings, leaves, weeds, tree and shrub
cuttings,
2 Organic "kitchen"Food waste, spoiled food, coffee and tea fi lters,
kitchen waste etc.
3 Organics 10 - 40 mm from sorting fines < 40 mm
4 Woodpainted and treated wood, wood covered with
plastics, untreated wood
5 Plastic filmPlastic bags, freezer bags, cling wrap, covering and
packaging fi lmsExcluding PVC (if possible)
6 Plastics 3D Plastic buckets, bottles, containers, toys etc.Additional sorting of PET, PP, PE
(if possible)
7 Plastics 10 - 40 mm from sorting fines < 40 mm
8 Composite materialsDrink cartons for milk, juice, wine, coffee vacuum
packaging, instant soups
9 Fe-metals Magnetic drink and food cans, other magnetic metals
10 Non Fe-metalsNon-magnetic drink and food cans, other non-
magnetic metals such as aluminium
11 Metals 10 - 40 mm from sorting fines < 40 mm
12 GlassBottles, jars for jam, fruit and vegetables, drinking
glasses, windows
13 InertPorcellain, clay pottery, ti les, ceramics, stones,
brick, concrete
14 Inert 10 - 40 mm including glass (from sorting fines < 40 mm)
15 PaperNewspapers, magazines, catalogues, writing paper,
envelopes, advertising, tissue paper
16 Cardboard Carton, boxes
17 Paper / cardb. 10 - 40 mm from sorting fines < 40 mm
18 Textiles, shoes, bagsClothes, covers, curtains, Leather and plastic shoes,
handbags, backpacksExcluding PVC (if possible)
19 Nappies Nappies, sanitary pads, bandagesIn case of additional screening:
only in grain size 80-150 mm and >150 mm
20 Batteries Batteries, rechargeable batteries
21 Electronical goods Electrical and electronical goods,
22Miscellaneous
combustibleRubber, hazardous material, undefined materials
23Miscellaneous
non-combustible
24 Miscell. 10 - 40 mm from sorting fines < 40 mm
B Fines < 10 mm Screened material (not further specified)
In case of additional screening:
in grain size < 80 mm together
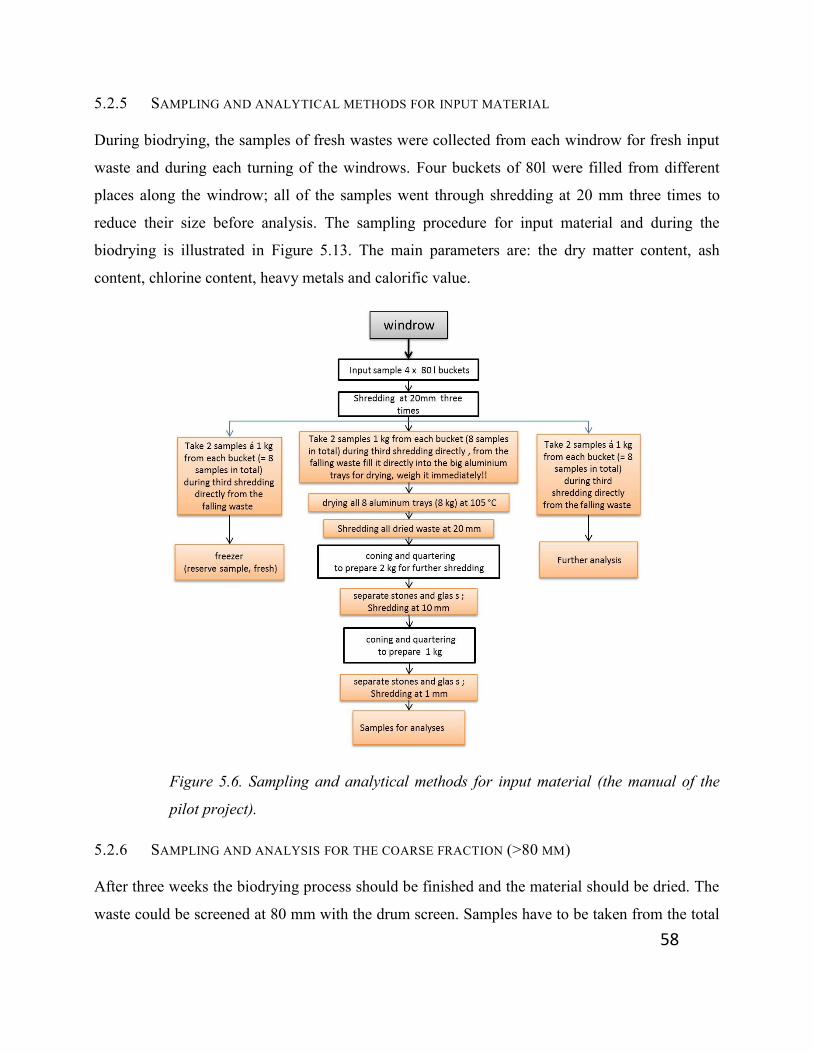
58
5.2.5 SAMPLING AND ANALYTICAL METHODS FOR INPUT MATERIAL
During biodrying, the samples of fresh wastes were collected from each windrow for fresh input
waste and during each turning of the windrows. Four buckets of 80l were filled from different
places along the windrow; all of the samples went through shredding at 20 mm three times to
reduce their size before analysis. The sampling procedure for input material and during the
biodrying is illustrated in Figure 5.13. The main parameters are: the dry matter content, ash
content, chlorine content, heavy metals and calorific value.
Figure 5.6. Sampling and analytical methods for input material (the manual of the
pilot project).
5.2.6 SAMPLING AND ANALYSIS FOR THE COARSE FRACTION (>80 MM)
After three weeks the biodrying process should be finished and the material should be dried. The
waste could be screened at 80 mm with the drum screen. Samples have to be taken from the total

59
waste, the coarse fraction >80 mm (RDF) and the fines fraction <80 mm. During the screening
and sampling processes the split between >80 and <80 mm was determined.
Figure 5.7. Sampling and analysis for the coarse fraction (>80 mm)
(the manual of the pilot project).
A total of five RDF samples were sorted manually, three samples during the summer trial (from
June 2014 to September 2014) and two samples during the winter trial (from September 2014 to
December 2014).
Sampling for coarse fraction characterization and analysis was done by collecting at least 15
buckets of 80l during screening parallel to the sampling of <80 mm for the determination of the
screening split. As shown in Figure 5.7, 11 buckets were used for the waste characterization by
hand sorting, the various components of the RDF were weighed and the results are presented as
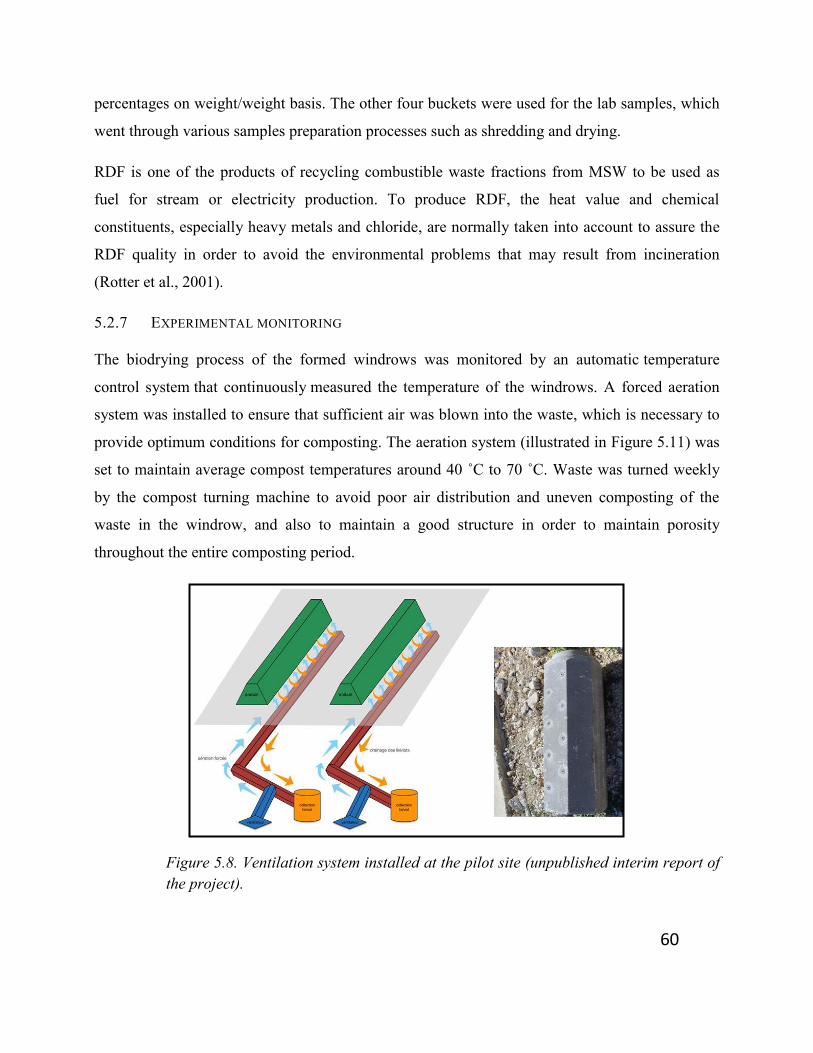
60
percentages on weight/weight basis. The other four buckets were used for the lab samples, which
went through various samples preparation processes such as shredding and drying.
RDF is one of the products of recycling combustible waste fractions from MSW to be used as
fuel for stream or electricity production. To produce RDF, the heat value and chemical
constituents, especially heavy metals and chloride, are normally taken into account to assure the
RDF quality in order to avoid the environmental problems that may result from incineration
(Rotter et al., 2001).
5.2.7 EXPERIMENTAL MONITORING
The biodrying process of the formed windrows was monitored by an automatic temperature
control system that continuously measured the temperature of the windrows. A forced aeration
system was installed to ensure that sufficient air was blown into the waste, which is necessary to
provide optimum conditions for composting. The aeration system (illustrated in Figure 5.11) was
set to maintain average compost temperatures around 40 ˚C to 70 ˚C. Waste was turned weekly
by the compost turning machine to avoid poor air distribution and uneven composting of the
waste in the windrow, and also to maintain a good structure in order to maintain porosity
throughout the entire composting period.
Figure 5.8. Ventilation system installed at the pilot site (unpublished interim report of
the project).

61
In addition to the evaporation of water, the forced aerations helped to establish optimum
composting conditions and to reduce the production of odorous substances. To further reduce the
emission of odors into the environment, the windrows were covered with a membrane. The other
purpose of the membrane was to protect the composting windrows against sun and rain.
Figure 5.9. Monitoring of temperature and water evaporation during
the biodrying process
As shown in Figure 5.12, the temperature of the windrows during the biodrying process was
maintained at 40-70 ˚C for most of the duration of the biodrying process. After three weeks of
composting, the waste was fairly dry with a moisture content of between 20 and 45%; the dry
matter of the final product increased from the initial 44-53% to 53-72%.

62
5.2.8 RESULTS AND DISCUSSION
5.2.8.1 CHARACTERISTICS OF THE MSW
The results for each sample and the overall results of the waste characterization and screening
during the project are described in Table 5.5.
The waste of the studied area had the typical waste characteristics of most developing countries,
such as high moisture contents and large organic fractions both of which contribute to the
production of leachat and landfill gasses with the presence of the odor problem.
Figure 5.10. Composition of household waste from Beja, average of each
season’s analysis
Figure 5.11. Composition of household waste from Beja, average of total
analysis during both seasons (summer and winter)

63
Table 5.5.Overall results of the waste characterization and screening during the project.
All these materials have a high calorific value and can be utilized to produce RDF, which can, for
example, be used in cement factories. There were little metals (1.4%) and glass in the waste. The
average results of the waste characterization of each and both seasons are summarized in Figures
5.7 and 5.8.
Sample area
Date of collection
Particle size kg % kg % kg % kg % kg % kg %
> 80 mm 82.3 51.2% 168.1 58.5% 227.5 56.0% 43.6 74.4% 77.4 82.9% 598.8 86.7%
10 - 80 mm 24.8 15.4% 23.7 8.2% 23.7 5.8% 15.0 25.6% 16.0 17.1% 103.2 18.4%
< 10 mm 53.8 33.4% 95.6 33.3% 154.7 38.1% 0.0 0.0% 0.0 0.0% 304.2 34.9%
Total sample weight 160.9 100.0% 287.4 100.0% 405.9 100.0% 58.6 100.0% 93.4 100.0% 1,006.2 140.0%
Sorting fractions kg % kg % kg % kg % kg % kg %
Organic "garden" 3.0 2.5% 5.6 1.9% 34.3 8.5% 0.8 1.4% 2.1 2.2% 45.7 4.6%
Organic "kitchen" 7.6 6.4% 22.5 7.8% 5.3 1.3% 3.5 5.9% 11.4 12.2% 50.2 6.4%
Organics 10 - 80 mm 17.2 14.6% 16.6 5.8% 1.5 0.4% 8.0 13.6% 9.1 9.7% 52.3 9.6%
Wood 1.4 1.2% 0.5 0.2% 2.5 0.6% 0.6 0.9% 0.4 0.4% 5.4 0.9%
Plastic film 7.6 6.5% 45.4 15.8% 43.2 10.6% 7.6 12.9% 19.1 20.4% 122.8 13.5%
Plastics 3D 2.3 2.0% 12.0 4.2% 5.3 1.3% 2.8 4.8% 2.6 2.7% 24.9 3.4%
Plastics 10 - 80 mm 1.7 1.5% 5.8 2.0% 4.6 1.1% 0.7 1.2% 1.8 1.9% 14.6 1.8%
Composite materials 3.4 2.9% 5.9 2.1% 14.5 3.6% 2.5 4.2% 3.2 3.4% 29.4 3.7%
Fe-metals 7.3 6.2% 4.7 1.6% 19.4 4.8% 2.2 3.7% 2.6 2.7% 36.0 4.9%
Non Fe-metals 0.0 0.0% 0.0 0.0% 0.0 0.0% 0.0 0.0% 0.0 0.0% 0.0 0.0%
Metals 10 - 80 mm 0.0 0.0% 0.0 0.0% 0.0 0.0% 0.2 0.3% 0.8 0.8% 1.0 0.1%
Glass 0.2 0.2% 0.6 0.2% 1.1 0.3% 0.1 0.2% 0.4 0.4% 2.5 0.3%
Inert 3.0 2.5% 2.7 0.9% 2.7 0.7% 0.6 1.0% 0.5 0.6% 9.6 1.6%
Inert 10 - 80 mm 0.0 0.0% 0.0 0.0% 17.5 4.3% 3.6 6.2% 2.3 2.5% 23.5 2.7%
Paper 4.1 3.5% 8.5 2.9% 10.9 2.7% 5.0 8.5% 7.3 7.8% 35.7 4.7%
Cardboard 6.7 5.6% 6.0 2.1% 18.5 4.5% 0.0 0.0% 9.5 10.1% 40.6 4.1%
Paper / cardb. 10 - 80 mm 0.0 0.0% 0.0 0.0% 0.0 0.0% 2.5 4.3% 2.1 2.2% 4.6 0.9%
Textiles, shoes, bags 23.2 19.7% 32.3 11.2% 43.5 10.7% 11.9 20.3% 10.1 10.8% 120.9 17.9%
Nappies 9.2 7.8% 17.8 6.2% 17.2 4.2% 5.2 8.8% 8.2 8.7% 57.4 7.8%
Batteries 0.0 0.0% 0.0 0.0% 0.0 0.0% 0.0 0.0% 0.0 0.0% 0.0 0.0%
Soft PVC 0.0 0.0% 0.0 0.0% 0.0 0.0% 0.0 0.0% 0.0 0.0% 0.0 0.0%
Electronical goods 0.0 0.0% 0.2 0.1% 0.3 0.1% 0.0 0.0% 0.2 0.2% 0.7 0.1%
Miscell. comb. 3.2 2.7% 3.1 1.1% 7.3 1.8% 0.7 1.2% 0.1 0.1% 14.4 2.1%
Miscell. non-comb. 0.3 0.3% 0.5 0.2% 1.7 0.4% 0.3 0.5% 0.0 0.0% 2.9 0.4%
Miscell. 10 - 80 mm 5.9 5.0% 1.3 0.4% 0.0 0.0% 0.0 0.0% 0.0 0.0% 7.2 1.8%
< 10 mm 10.6 9.0% 95.6 33.3% 154.7 38.1% 0.0 0.0% 0.0 0.0% 260.9 26.8%
Control 117.7 100.0% 287.4 100.0% 405.9 100.0% 58.6 100.0% 93.4 100.0% 962.9 120.0%
Total result
Sample 1 Sample 2
17/07/2014 28/05/2014
Sample 3
24/09/2014
Sample 4
19/11/2014
Area under
investigationSample 5
16/12/2014

64
5.2.8.2 SIZE DISTRIBUTION OF FRESH WASTE
The screening of the received waste at the site showed that most of waste fraction was of size >40
mm. According to the size distribution of solid waste, as shown in Figure 5.9, approximately
63.3% of the total solid waste screened could be recovered as the large fraction, whereas 28.2%
and 8.5% had sizes of 10-40 mm and 40 mm respectively.
Figure 5.12. Size distribution and composition of fresh waste
From the sorting analysis it was assumed that about 80% of the fine fraction <10 mm was
organic material. The additional classification of waste composition found that about 52% of
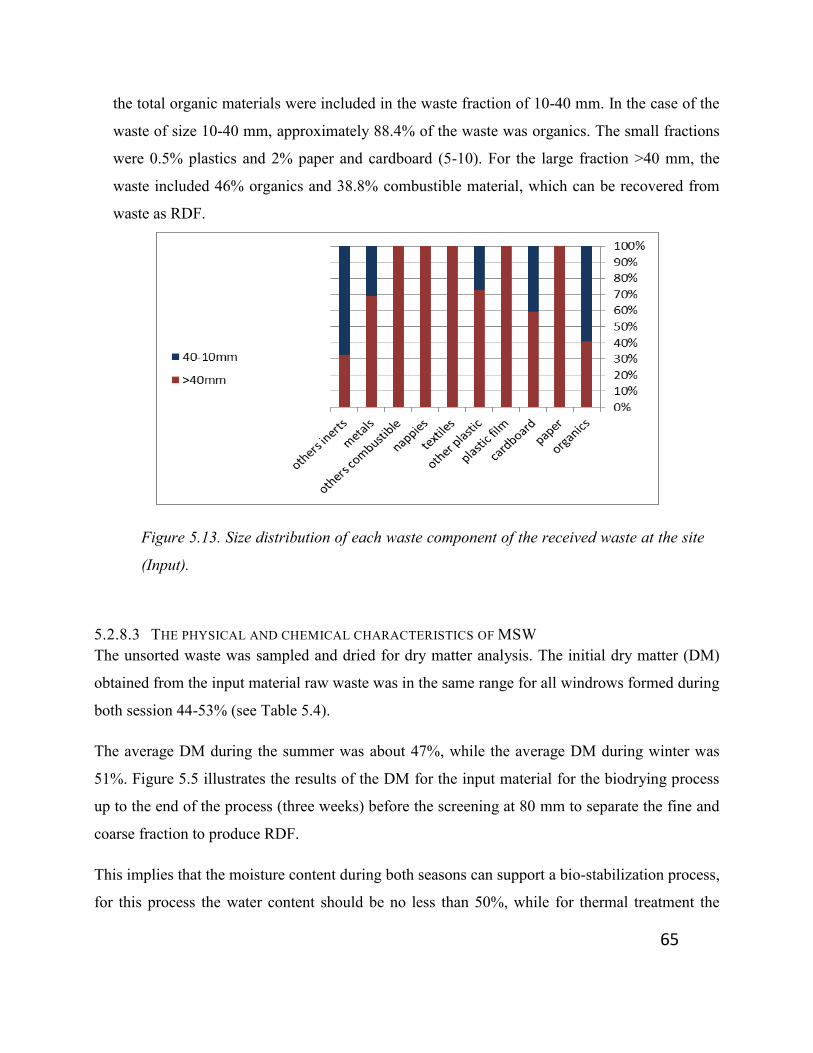
65
the total organic materials were included in the waste fraction of 10-40 mm. In the case of the
waste of size 10-40 mm, approximately 88.4% of the waste was organics. The small fractions
were 0.5% plastics and 2% paper and cardboard (5-10). For the large fraction >40 mm, the
waste included 46% organics and 38.8% combustible material, which can be recovered from
waste as RDF.
Figure 5.13. Size distribution of each waste component of the received waste at the site
(Input).
5.2.8.3 THE PHYSICAL AND CHEMICAL CHARACTERISTICS OF MSW
The unsorted waste was sampled and dried for dry matter analysis. The initial dry matter (DM)
obtained from the input material raw waste was in the same range for all windrows formed during
both session 44-53% (see Table 5.4).
The average DM during the summer was about 47%, while the average DM during winter was
51%. Figure 5.5 illustrates the results of the DM for the input material for the biodrying process
up to the end of the process (three weeks) before the screening at 80 mm to separate the fine and
coarse fraction to produce RDF.
This implies that the moisture content during both seasons can support a bio-stabilization process,
for this process the water content should be no less than 50%, while for thermal treatment the

66
moisture content of the waste should be less than 45% (Shuka et al., 2000). This means that the
high moisture content of the waste generated in the study area would reduce the efficiency of its
energy recovery, as well as the feasibility of the mechanical separation of different fractions for
beneficial utilization.
Table 5.6. Dry matter results of the raw waste during the biodrying
process before screening.
Trial
Dry matter (%)
Input Week 1 Week 2 Week 3
Summer trial
Trial 1 47% 65% 64% 63%
Trial 2 44% 53% 51% 58%
Trial 3 51% 62% 56% 53%
Winter trial
Trial 4.1 53% 61% 63% 72%
Trial 4.2 47% 60% 56% 66%
Trial 5 53% 52% N.A. N.A.
Figure 5.14. Dry matter results of the raw waste during the biodrying process
before screening

67
5.2.8.4 SCREENING AT 80 MM AND MASS BALANCE
After three weeks of composting and drying, the waste can be screened efficiently into a coarse
fraction with high calorific values, which can be used as a basis for the production of substitute
fuel, e.g., in cement kilns or combustion facilities. The results of screening splits and mass
balance of all trials during summer and winter seasons are illustrated in Table 5.6 and Figure
5.15.
Figure 5.15. The percentage of output fractions after screening at 80 mm for the total
and each trial during the pilot project period
As shown in Table 5.4, the initial dry matter content for the waste of trial three was (51%) higher
than the DM percentage of the previous two trials, but then the results of the screening splits and
the DM content during the drying process showed that the values of trial three differed from the
values of the others trials and was not in the same range. As shown in Table 5.4, the DM content
increased after the first week to reach 61% but it decreased for the rest of the biodrying process,
reaching 56% after two weeks and 53% at the end of the process after three weeks of biodrying,
with an overall increase of 2% in the DM. It was also observed during the site work that the
waste of trial three was considerably wet after the end of the biodrying process, which will have
affected the quality of the separated RDF, whereby more fine material will be separated with the
coarse fraction and less fine fraction will be obtained after screening the temperature probe
reading of trial three (shown in Figure 5.12). A different curve shape is observed from the other
trial due to a breakdown in the system where no data were recorded for almost a week (from

68
10/09/15 till 17/09/15), seven days after the beginning of the drying process (03/09/15). All of the
above indicated that there was something unusual with the drying process of trial three; therefore,
the values of trial three were excluded from the calculations of the mass balance.
Table 5.7. Results of screening splits and the fresh and dry weight of each fraction after
screening of all trials during summer and winter season
Trial
The split
of
fractions
(%)
Fresh material
Dry matter
content (%)
Dry material
Mass (t) % of total
mass Mass (t)
% of
total
mass
Summer trial
Trial 1
Input N.A. 110 100% 47% 52.2 47%
>80 mm (RDF) 37% 25.6 23% 75% 19.2 17%
< 80 mm at screening 63% 43.6 40% 70% 30.5 28%
Mass loss during 3 weeks drying N.A. 40.8 37% N.A. 2.5 2%
Trial 2
Input N.A. 96.0 100% 44% 42.0 44%
>80 mm (RDF) 30% 20.0 21% /69% 13.7 14%
< 80 mm at screening 70% 46.7 49% 60% 27.9 29%
Mass loss during 3 weeks drying N.A. 29.3 31% N.A. 0.3 0.3%
Trial 3
Input 98.0 100% 51% 50.0 51%
>80 mm (RDF) 40% 33.0 34% 50% 16.5 17%
< 80 mm at screening 60% 49.5 51% 60% 29.7 30%
Mass loss during 3 weeks drying N.A. 15.5 16% N.A. 3.8 4%
Winter trial
Trial 4
Input N.A. 145.0 100% 50% 72.5 50%
>80 mm (RDF) 36% 36.1 25% 69% 17.3 12%
< 80 mm at screening 64% 64.0 44% 72% 1.7 22%
Mass loss during 3 weeks drying N.A. 44.9 31% N.A. 13.9 10%
Trial 5
Input 60.0 100% 53% 31.8 53%
>80 mm (RDF) 46% 15.9 27% 58% 9.2 15%
< 80 mm at screening 54% 18.7 31% 62% 11.6 19%
Mass loss during 3 weeks drying N.A. 25.4 42% N.A. 11.0 18%

69
On average, for trials one, two, four and five, biodrying removed 27% of water, and 8% of solid
waste mass was lost from the input material weight. In total, the weight of MSW decreased by
33% during the summer and 37% during the winter; the RDF utilization was still not considered
in these figures of mass reduction.
Table 5.8. Mass balance after the biodrying process during the pilot test.
Trial
Input material
%
Output of biodrying 3 weeks
%
Mass loss
%
Dry
matter
Water
content
RDF <80 mm Wate
r
Dry
matter Water
Fresh Dry Fresh Dry
Summer 46 54 22 16 45 29 22 1 32
Winter 51 49 26 14 37 21 28 16 21
Average 49 52 24 15 41 25 25 8 27
At the end of the biodrying process, the mass of waste was reduced on average by approx. 35%
when the dried waste was directed to landfill without the recovery of material. In the case of RDF
utilization from the dried waste, the mass of waste to be landfilled was reduced by approx. 59%.
Furthermore, by dumping the dried waste in the landfill, leachate would not be produced if the
landfill was carefully covered and protected from rainfall.
Figure 5.16. The mass balance after the biodrying process for the summer and
winter trials.

70
5.2.8.5 CHARACTERIZATION OF THE COARSE FRACTION
An 80 mm drum screen was used to separate the coarse fraction > 80 mm from the fines fraction
< 80 mm: approx. 24% of the waste input material was found to be >80 mm. Material samples
were taken from this both for lab analysis and waste characterization (by means of hand sorting).
Sorting analysis of coarse fraction, after the end of the biodrying process, was conducted for each
trial during both seasons. The results of RDF percentage composition of each trial are presented
in Table 5.8.
Table 5.9. Characterization analysis of output material >80 mm (RDF) during the period of the
pilot project.
The average characteristics of coarse fraction for the summer and winter seasons are illustrated in
Figure 5.17. On average for both seasons (see Figure 5.18) the major components of RDF were
textiles (21.2%), plastics films (19.7%), nappies (10.5%) and cardboard (6.4%) Other
Sample area
Date of collection Total result
Particle size
Sorting fractions kg % kg % kg % kg % kg % kg %
Organic "garden" 3.0 3.6% 5.6 3.3% 34.3 15.1% 0.8 1.8% 2.1 2.6% 43.7 5.3%
Organic "kitchen" 7.6 9.2% 22.5 13.4% 5.3 2.3% 3.5 7.9% 11.4 14.7% 38.8 9.5%
Wood 1.4 1.7% 0.5 0.3% 2.5 1.1% 0.6 1.3% 0.4 0.5% 5.0 1.0%
Plastic film 7.6 9.2% 45.4 27.0% 43.2 19.0% 7.6 17.3% 19.1 24.6% 103.8 19.4%
Plastics 3D 2.3 2.8% 12.0 7.1% 5.3 2.3% 2.8 6.4% 2.6 3.3% 22.3 4.4%
Composite materials 3.4 4.1% 5.9 3.5% 14.5 6.4% 2.5 5.6% 3.2 4.1% 26.2 4.7%
Fe-metals 7.3 8.8% 4.7 2.8% 19.4 8.5% 2.2 5.0% 2.6 3.3% 33.5 5.7%
Non Fe-metals 0.0 0.0% 0.0 0.0% 0.0 0.0% 0.0 0.0% 0.0 0.0% 0.0 0.0%
Glass 0.2 0.3% 0.6 0.4% 1.1 0.5% 0.1 0.3% 0.4 0.5% 2.0 0.4%
Inert 3.0 3.6% 2.7 1.6% 2.7 1.2% 0.6 1.4% 0.5 0.7% 9.0 1.7%
Paper 4.1 5.0% 8.5 5.0% 10.9 4.8% 5.0 11.5% 7.3 9.4% 28.4 7.1%
Cardboard 6.7 8.1% 6.0 3.6% 18.5 8.1% 0.0 0.0% 9.5 12.2% 31.1 6.4%
Textiles, shoes, bags 23.2 28.1% 32.3 19.2% 43.5 19.1% 11.9 27.3% 10.1 13.0% 110.8 21.3%
Nappies 9.2 11.1% 17.8 10.6% 17.2 7.6% 5.2 11.8% 8.2 10.5% 49.3 10.3%
Batteries 0.0 0.0% 0.0 0.0% 0.0 0.0% 0.0 0.0% 0.0 0.0% 0.0 0.0%
Soft PVC 0.0 0.0% 0.0 0.0% 0.0 0.0% 0.0 0.0% 0.0 0.0% 0.0 0.0%
Electronical goods 0.0 0.1% 0.2 0.1% 0.3 0.1% 0.0 0.0% 0.2 0.2% 0.5 0.1%
Miscell. comb. 3.2 3.9% 3.1 1.8% 7.3 3.2% 0.7 1.6% 0.1 0.2% 14.3 2.1%
Miscell. non-comb. 0.3 0.4% 0.5 0.3% 1.7 0.8% 0.3 0.7% 0.0 0.0% 2.9 0.4%
Area under
investigationtrail 1 trail 2 trail 3 trail 4 trail 5
> 80 mm > 80 mm > 80 mm > 80 mm > 80 mm> 80 mm
17/07/2014 28/05/2014 24/09/2014 19/11/2014 16/12/2014

71
combustible materials present included paper (15.4%), other plastics (4.5%) and organics
(14.5%).
Figure 5.17. The average characteristics of coarse fraction for the
summer and the winter season during the pilot project
Figure 5.18. Average total composition of coarse fraction characteristics.
The proportion of plastics, textiles, nappies and paper/cardboard were increased compared to the
fresh waste composition, as shown in Figure 5.19. There was still some organics in the coarse
fraction, but this could be further reduced by optimization measures. Impurities in the RDF

72
comprised of non-combustible materials, namely metals (5.5%) and glass and inert materials
(2%).
Figure 5.19. The average characteristics of fresh waste (input) and the coarse
fraction >80 mm after the end of the biodrying process (three weeks).
RDF presents several advantages as a fuel over raw MSW. The main advantages are higher
calorific values, which also remain fairly constant, more uniformity of physical and chemical
composition, ease of storage, handling and transportation, lower pollutant emissions and
reduction of excess air requirement during combustion (Caputo & Pelagagge, 2002).
5.2.8.6 CHEMICAL PROPERTIES OF THE RDF
Table 5.9 presents the results of the basic chemical features of RDF. In addition to the heating
value, other important fuel properties, such as the moisture content/dry matter, the chlorine
content and the ash content were measured. DM showed great variability ranging from 50% to
75%: Figure 5.20 presents the DM of the RDF produced in each trial compared with the DM of
the input material for each trial. The climatic conditions were one of the main factors that may
have influenced the moisture content of the incoming MSW, and therefore of the RDF produced.
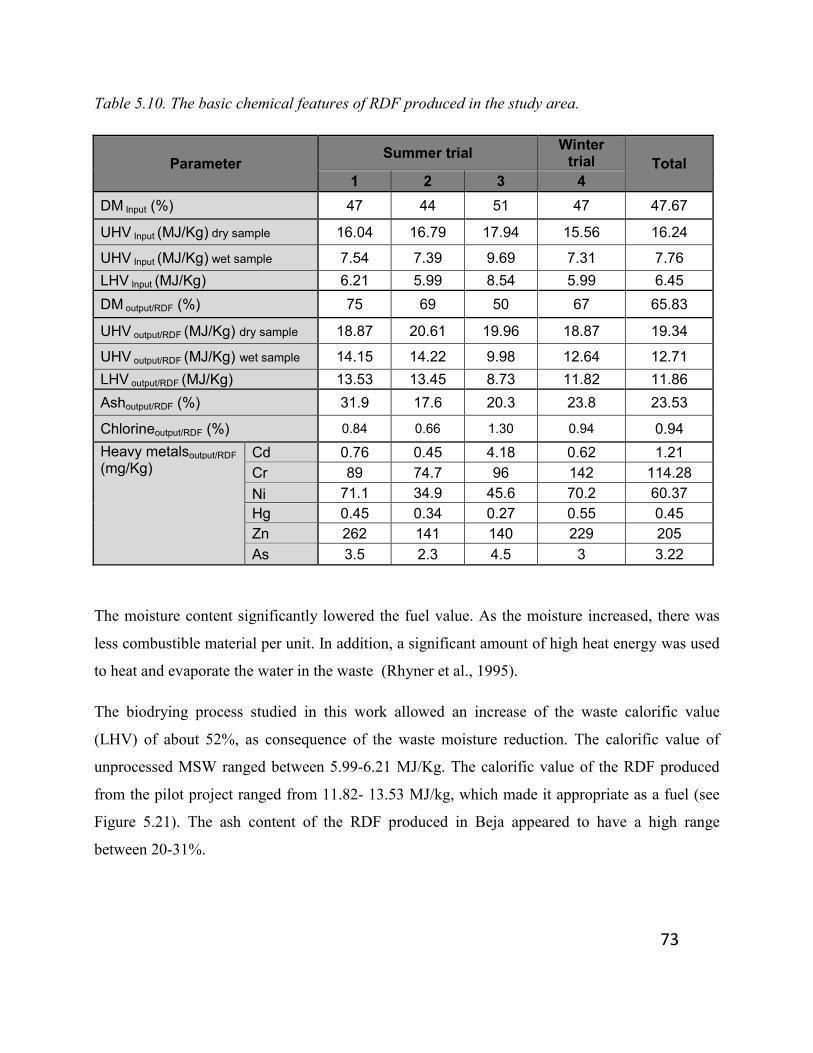
73
Table 5.10. The basic chemical features of RDF produced in the study area.
Parameter Summer trial
Winter trial Total
1 2 3 4
DM Input (%) 47 44 51 47 47.67
UHV Input (MJ/Kg) dry sample 16.04 16.79 17.94 15.56 16.24
UHV Input (MJ/Kg) wet sample 7.54 7.39 9.69 7.31 7.76
LHV Input (MJ/Kg) 6.21 5.99 8.54 5.99 6.45
DM output/RDF (%) 75 69 50 67 65.83
UHV output/RDF (MJ/Kg) dry sample 18.87 20.61 19.96 18.87 19.34
UHV output/RDF (MJ/Kg) wet sample 14.15 14.22 9.98 12.64 12.71
LHV output/RDF (MJ/Kg) 13.53 13.45 8.73 11.82 11.86
Ashoutput/RDF (%) 31.9 17.6 20.3 23.8 23.53
Chlorineoutput/RDF (%) 0.84 0.66 1.30 0.94 0.94
Heavy metalsoutput/RDF (mg/Kg)
Cd 0.76 0.45 4.18 0.62 1.21
Cr 89 74.7 96 142 114.28
Ni 71.1 34.9 45.6 70.2 60.37
Hg 0.45 0.34 0.27 0.55 0.45
Zn 262 141 140 229 205
As 3.5 2.3 4.5 3 3.22
The moisture content significantly lowered the fuel value. As the moisture increased, there was
less combustible material per unit. In addition, a significant amount of high heat energy was used
to heat and evaporate the water in the waste (Rhyner et al., 1995).
The biodrying process studied in this work allowed an increase of the waste calorific value
(LHV) of about 52%, as consequence of the waste moisture reduction. The calorific value of
unprocessed MSW ranged between 5.99-6.21 MJ/Kg. The calorific value of the RDF produced
from the pilot project ranged from 11.82- 13.53 MJ/kg, which made it appropriate as a fuel (see
Figure 5.21). The ash content of the RDF produced in Beja appeared to have a high range
between 20-31%.
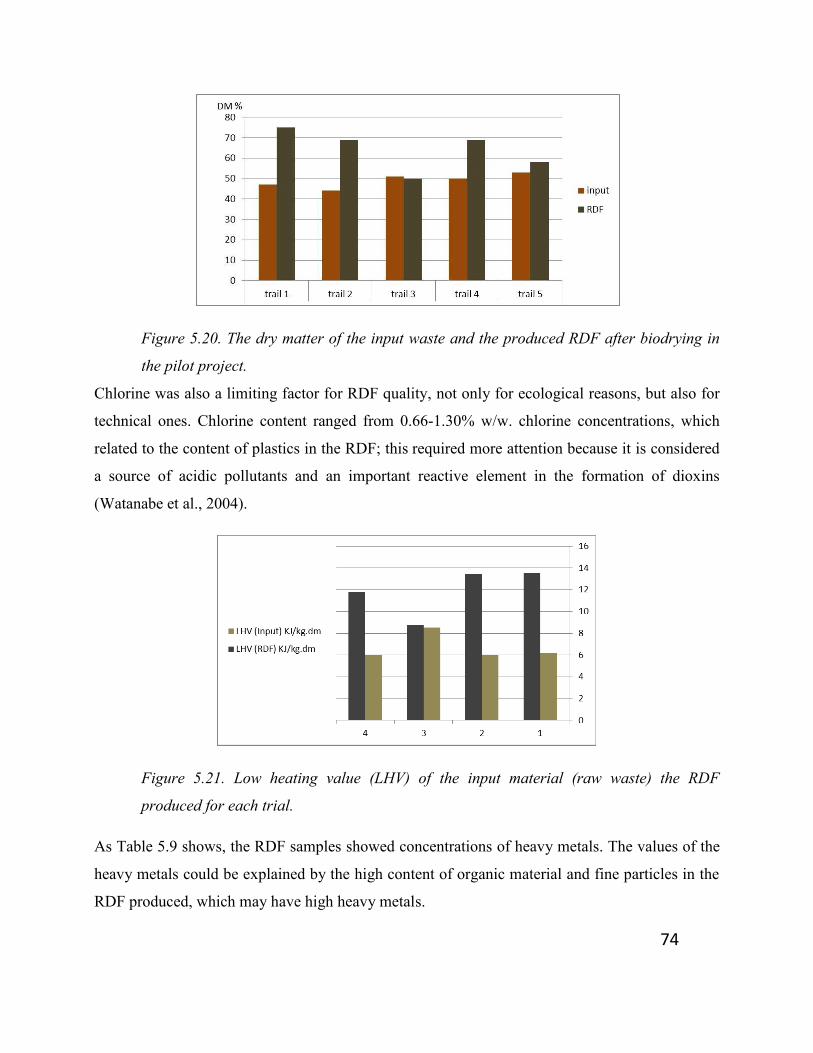
74
Figure 5.20. The dry matter of the input waste and the produced RDF after biodrying in
the pilot project.
Chlorine was also a limiting factor for RDF quality, not only for ecological reasons, but also for
technical ones. Chlorine content ranged from 0.66-1.30% w/w. chlorine concentrations, which
related to the content of plastics in the RDF; this required more attention because it is considered
a source of acidic pollutants and an important reactive element in the formation of dioxins
(Watanabe et al., 2004).
Figure 5.21. Low heating value (LHV) of the input material (raw waste) the RDF
produced for each trial.
As Table 5.9 shows, the RDF samples showed concentrations of heavy metals. The values of the
heavy metals could be explained by the high content of organic material and fine particles in the
RDF produced, which may have high heavy metals.

75
The advantage of RDF over raw MSW is that RDF can be considered as homogeneous material,
with little pollutant content and with a good calorific value, which can be used for energy
production in different plants or for replacing conventional fuels. However, due to the high
moisture content, low calorific value and high ash content of raw MSW, it is needed to segregate
the raw MSW and produce RDF.
The important characteristics for RDF as a fuel are the calorific value, water content, ash content
and chlorine content. The values of these parameters will vary according to raw waste
characteristics and the processes applied to produce the RDF. The composition of the RDF
produced in Beja is compared with the typical composition for RDF from MSW originating in
different places (see Table 5.10 and Figure 5.22). The characteristics and results of the produced
RDF in Beja were obtained from unprocessed RDF, which means that samples were taken from
the screened material at 80 mm, just after the end of the biodrying process.
Table 5.11. Typical composition for RDF according to MSW origin.
Waste fraction Flemish
region Italy UK Beja
(a)
Plastic (%) 9 23 11 24.2
Paper/cardboard (%) 64 44 84 14.1
Wood (%)
25
4.5
5
Textile (%) 12 21.2
Others (%) 14 32.5 (b)
Undesirable material (%) (glass, stone,
metal) 2 2.5 8
(c)
Source: Gendebien et al., 2003, PAGE)
(a) Unprocessed RDF, screened material at 80 mm without further shredding or screening
(b) Includes organic degradable waste
(c) Nappies includes others noncombustible material
A better quality RDF will be obtained after further shredding and screening/sorting. Despite this,
the quality of the RDF produced did not differ from the RDF quality set by some European
countries.

76
Figure 5.22. Composition of the RDF produced in Beja compared with the
composition set by European countries
The quality of RDF required that it should have a high calorific value and have low concentration
of toxic chemicals, especially for heavy metals and chlorine. Due to the different point of view of
RDF producers, potential RDF customers and the respective authorities, suggested RDF quality
varies from one group to another (Rotter et al., 2004).
Table 5.12. Chemical properties of the produced RDF in Beja compared with quality criteria set
by European countries.
Parameter Finland Italy UK Beja
Calorific value (MJ/Kg) 13-16 15 18.7 12.87-20.61
Moisture content % 25-35 25 max 7 to 28 25-34
Ash content % 5 to 10 20 12 17.6-31.9
Chlorine % <1.5* 0.9 0.3-1.2 0.66-1.3
Source : Gendebien et al, 2003)
*standard class III RDF
Although many European countries and organizations have already set specifications and quality
criteria for the chemical characteristics of RDF, limited work exists on actual measurements of
chemical parameters on RDF samples. This is particularly true for data on heavy metal

77
concentrations, which refer mostly to the specific components of MSW (Scoullos et al., 2009). In
Tables 5.11 and 5.12, the results of the RDF produced in Beja are compared with the available
data on the chemical characteristics of RDF reported from European countries.
Table 5.13. Heavy metals content of the produced RDF in Beja compared with quality
criteria set by European countries.
It becomes clear from the results that the RDF produced in Beja was of high calorific value, low
moisture and acceptable chlorine content compared to the RDFs produced in other countries.
Concerning heavy metal content, it is interesting to note that, although the Beja RDF showed
different ranges of heavy metal concentrations in the samples, as shown in Figures 5.23 and 5.24,
in most cases they were lower than the reported ranges from the other countries.
Parameter EURITSa Italy Finland Beja
Cd (mg/kg) N/A 10 5 0.44-0.76
Cr (mg/kg) 200 100 N/A 74-142
Ni (mg/kg) 200 40 N/A 34-71
Hg (mg/kg) 2 N/A 0.5 0.27-0.55
Zn (mg/kg) 500 500 N/A 140-262
As (mg/kg) 10 9 N/A 2.3-4.5
Source: Gendebien et al., 2003)
a: European Association of Waste Thermal Treatment Companies for specialized waste

78
Figure 5.23. Heavy metals concentrations (Cd, Cr, Ni & Hg) of RDF produced in Beja
compared with criteria and values set by European countries

79
Figure 5.24. Heavy metals concentrations (Zn & As) of RDF produced in Beja compared
with criteria and values set by European countries
5.2.8.7 FINE FRACTION CHARACTERISTICS AFTER THE BIODRYING PROCESS
After the end of the biological drying process the screened fine fraction (<80 mm) was further
composted. Some parameters of the fine fraction are presented in Table 5.13.
Based on the results of stabilization, there was a reduction in the respiration activities compared
with the input material. Comparing the results obtained with the classification of the rotting
degree of compost (Table 4.2), the produced fine fraction after three weeks of biodrying is
considered as fresh compost of class III.

80
Table 5.14. Characteristics of the fine fraction (<80 mm) after three weeks of the biodrying
process
Parameter
Samples of fine fraction <80 mm after the biodrying process
Summer trial Winter trial
1.1 1.2 2 3 4 5
Dry matter % 70 61 60 58 76 62
AT4 (mg O2/g DM) 19.43 19.43 20.41 24 24.05 22.85
In addition to which, as a result of the mass reduction during the biodrying process, the waste was
partially stabilized and had low moisture content, consequently this would reduce the formation
of greenhouse gases. Furthermore, in order to reduce leachate production when dumping this
fraction in a landfill, protection measures must be considered to prevent any water getting
through to the dumped waste. The more stabilized the waste the less landfill gas and leachate will
be produced in the landfill. The stabilization can be measured with the biological test parameter
‘respiration activity’ AT4. One of the objectives of the pilot project, which was not discussed in
this thesis, was to examine the possibility of producing stabilized fine fraction (<80 mm).
Therefore, the fine fraction <80 mm went through further stabilization/composting processes. To
establish effective stabilization of the material and further mass reduction, optimum moisture
content of 40 – 50% in the composting pile has to be maintained. As the material had lower
moisture content of 30 - 40% after the screening, water had to be added. After adding water the
material was mixed again and further composted. During this process water is also lost and has to
be added if needed.
5.2.8.8 STABILIZED MATERIAL PRODUCED/ COMPOST LIKE OUTPUT (CLO)
After further composting of the fines fraction, approx. 15% of mass reduction was achieved. The
material after composting mainly consisted of stabilized organic material similar to the organic
material of compost, but it was mixed with impurities such as plastics and glass particles.

81
Samples of the produced compost in Beja were collected and examined for the heavy metals
concentrations and compared with the results obtained earlier in Chapter 4 for compost samples
collected from different facilities operating in the region. The results are shown in Table 5.15.
The compost produced in Beja was in the same range of the compost produced in other operating
facilities in the region with the exception of Cr and Hg: the concentration of these two elements
were higher than the range of the compost produced in the region. Furthermore, of the three
compost samples collected from Beja, one of them did not fulfill the limits set by the German
standards due to the high value of the Hg (see Figures 5.25 and 5.26), while the other two could
be considered with the same quality of other compost produced in the region regarding heavy
metals.
Figure 5.25. Heavy metals concentrations (Hg & Zn) of stabilized material produced in Beja
and in other composting facilities in the region compared with the German standard
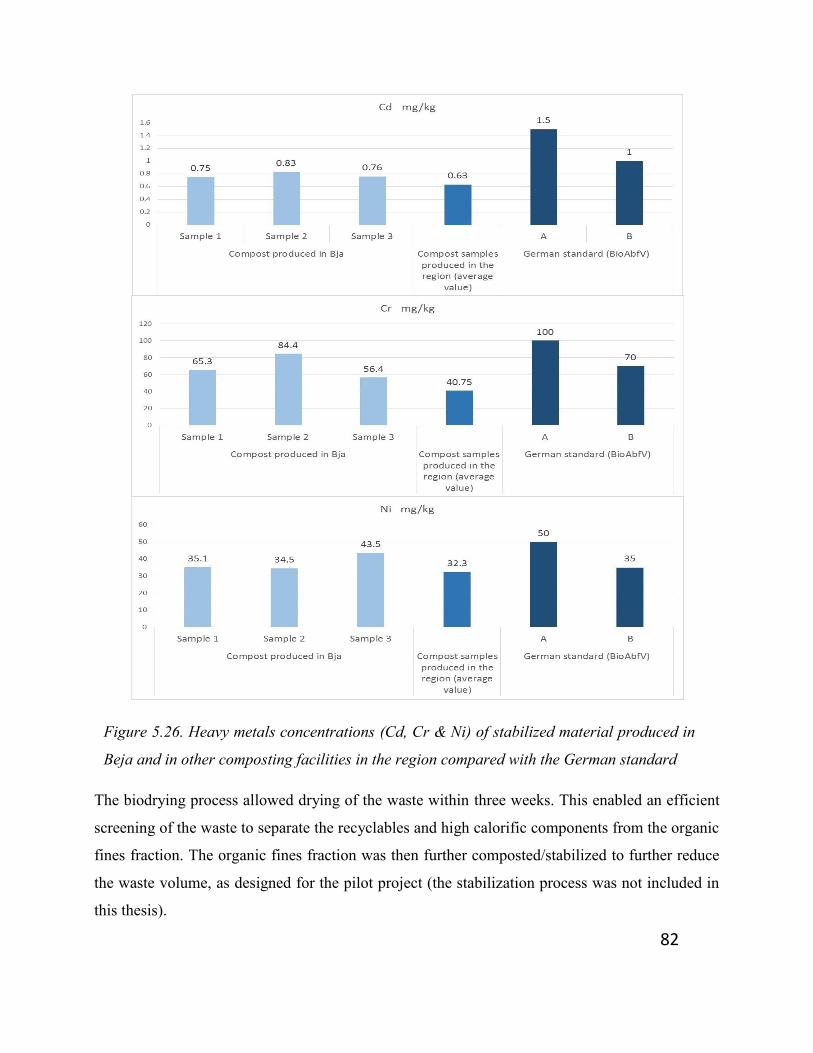
82
Figure 5.26. Heavy metals concentrations (Cd, Cr & Ni) of stabilized material produced in
Beja and in other composting facilities in the region compared with the German standard
The biodrying process allowed drying of the waste within three weeks. This enabled an efficient
screening of the waste to separate the recyclables and high calorific components from the organic
fines fraction. The organic fines fraction was then further composted/stabilized to further reduce
the waste volume, as designed for the pilot project (the stabilization process was not included in
this thesis).

83
The results showed that an efficient waste treatment can be achieved with a fairly basic and low-
cost MBT concept utilizing the biological drying process to produce a substitute fuel for
industrial processes and reduce the landfill volume required and air emissions from the landfill, in
particular greenhouse gases.

84
6. POSSIBLE WASTE TREATMENT ALTERNATIVES DESIGN FOR MIXED MSW AND
ECONOMICAL FEASIBILITY IN THE ARAB REGION
Solid waste treatment alternatives should be examined so that waste is put to the use that is most
beneficial in resource and environmental terms, rather than accepting a simple hierarchy, thus
pursuing integrative strategies. MBT for waste drying and sorting, and Mechanical Biological
Stabilization (MBS), are designed for a short and hot biological treatment to dry the waste for
later incineration and for sorting and sieving out usable fractions (minerals, metals). These plants
produce only a small amount of material, which might be landfilled. Most components are
comparable to MBTs prior to landfilling. The main product is refuse derived fuel (RDF).
6.1 MECHANICAL BIOLOGICAL TREATMENT (MBT)
MBT can be classified in four process concepts: material stream separation, mechanical
biological stabilization (with a biological drying process), mechanical-physical stabilization (with
a thermal drying process) and mechanical/biological pre-treatment prior to incineration.
In MBT based on the concept of material stream separation, the mixed waste is separated by
mechanical processing into different fractions: a concentrated high-calorific fraction for use as
RDF, value materials (such as metals) for material recycling, and a fraction with a low calorific
value that is biologically treated and then landfilled. Originally the development of MBT in the
last twenty years took place in Germany and Austria but the technology is spread over the world.
In each case, the MBT process is designed to suit the local conditions, the characteristics of the
treated waste and required output. The main advantage of the MBT technology is its fundamental
flexibility. The construction and layout can be adapted to the legal and technical circumstances
on site (Muller et al., 2011).
6.2 MECHANICAL BIOLOGICAL STABILIZATION (MBS) WITH BIOLOGICAL DRYING,
The aim of Mechanical Biological Stabilization (MBS) is to stabilize the carbon as the main
source of energy contained in the biologically degradable components contained in waste by
biological drying and to transform it, as far as possible, into the high calorific fraction for use as
RDF. The drying stage is an important precondition for the efficiency of the subsequent

85
separation of the remaining waste into combustible, and other value and inert materials (Thiel &
Hoffmann, 2008; Thiel et al., 2011). There are different variants of treatment processes existing
in an MBT facility, which are divided into mechanical and biological steps.
6.2.1 MECHANICAL TREATMENT
The mechanical processes are usually the first step of an MBT facility, of which different
fractions would be separated out of mixed MSW. It has the following functions:
Separation of bulky waste, to protect the machines, and homogenization of the waste for
the biological treatment (e.g., shredding).
Separation of high calorific fractions for use as RDF by sieving (150-200 mm) and
sometimes air separation; if the waste gets a second mechanical treatment after the
biological treatment it is usually a sieving at 60 mm or smaller.
Separation of waste components, which can be recycled (e.g., metals), by magnetic
separator.
6.2.2 BIOLOGICAL TREATMENT
The biological treatment (aerobic treatment) is achieved by aerated windrows operated under a
roof or directly in the open air, which are turned from time to time. The windrows should be
covered to protect the waste from getting wet and to prevent odor and insect problems. Process
control (e.g., moisture management) is difficult, or at least not very accurate, but it is possible to
achieve a huge improvement of the landfilled waste at low investment costs. Experienced
personnel are needed to run the windrows properly.
6.3 PROPOSED STRATEGIES FOR MSW TREATMENT WITH MBT FACILITIES
Two strategies have been considered for RDF production facility.
The first is based on the recovery of RDF and recyclables after the biodrying of raw waste, while
in the second strategy the raw waste is processed into RDF, recyclable material are recovered and
the fine fraction is further stabilized before landfilling.

86
The assumptions made for the following strategies are based on the available results obtained
during the summer trial from the pilot project in Beja. The main objectives of the chosen options
are:
Recovering recyclable material
Diverting material from landfill
Relevant factors include recovery efficiency, costs and time needed for treatment.
6.3.1 STRATEGY ONE: BIOLOGICAL DRYING OF MIXED MSW WITH RDF PRODUCTION AND
RECYCLABLES RECOVERY.
The concept of this strategy is proposed for facilities with a capacity of Option 1., 50000 Mg/a
and Option 2., 100,000 Mg/a. The waste will be subjected to composting (biodrying) without
adding any water for 2-4 weeks. At completion of the drying process, the waste would be
screened efficiently into a coarse fraction with high calorific value, which can be used as a basis
for the production of substitute fuel (RDF)(see Figure 6.2).
Figure 6.1. Strategy one: biological drying, RDF production and
recyclable material recovery.

87
Based on the results obtained for the pilot project in Beja, the mass of input waste will be reduced
by approx. 60%. This means that only 40% of the input material will be sent to the landfill and
60% will be diverted from landfill. The mass balance is illustrated in Figure 6-3.
Figure 6.2. Mass balance of strategy one.
6.3.2 STRATEGY TWO: BIOLOGICAL DRYING OF MIXED MSW WITH RDF AND METAL
RECOVERY AND STABILIZATION OF ORGANIC MATERIAL BEFORE LANDFILLING.
The concept of this strategy is the same as the concept of the previous strategy, except that at the
end of the drying process the fines fraction, after screening, would go through further
composting/stabilization for further mass reduction. The composting period is about 6-8 weeks
(see Figure 6.4). Two options will be studied for this strategy:
Option 3. Biodrying with RDF, recyclables recovery and stabilized material for landfilling.
Option 4. Biodrying with RDF, recyclables recovery, compost-like output (CLO) and inert
material for landfilling.
Based on the stabilization results obtained from the pilot project in Beja, the mass of the
stabilized portion will be reduced by approx. 87%. This means that only 13% of the waste input
will be sent to the landfill, while the rest is recovered as RDF fuel, recyclable material (metals)
and compost like product with moisture content loss as a result of the biodrying and stabilization
process. The mass balance is illustrated in Figure 6.5.

88
Figure 6.3. Strategy two: biological drying, RDF and stabilized material
production and recyclable material recovery.
Figure 6.4. Mass balance of strategy three.
The coarse fraction produced in strategies two and three may have to be further mechanically
processed (e.g., air separation, shredding, etc.) to produce better quality RDF, which would be
more suitable for the utilization process. MBT systems are linked to the markets and outlets for
89
recycled materials, RDF and soil conditioners that are produced by different processes. It is likely
that many of the material outputs from MBT will have a negative value. Collaborations between
MBT operators and potential users of outputs should be established and care should be taken to
ensure that plants could deliver materials of sufficient quality for the required market outlet.
6.4 ECONOMIC FEASIBILITY ANALYSIS
The financial sustainability of solid waste management systems is one of the greatest challenges
in low- and middle-income countries. Fees to cover solid waste management costs do not always
exist and, where they do, the authorities in charge often cannot raise them effectively; this means
that total SWM costs (capital as well as operating costs) are rarely covered. Fees can be used not
only to cover costs, but also to create incentives for waste reduction, recycling or particular
treatment and disposal options.
In a sustainable SWM system, not only technical factors but also economic aspects need to be
considered. For each planning scenario of SWM, the calculation of costs and benefits must be
taken into account. The key issue for any type of SWM is to ensure whether the charge system is
affordable, viable or sustainable for the community receiving the services. Cost and benefit of the
SWM system should be balanced to ensure proper operation of the facilities (Chang & Pires,
2015). Based on the availability of the RDF and its composition, it is useful to estimate the costs
related to its production and management.
6.4.1 COST ESTIMATION AND ECONOMICS
The cost of each plant includes two main components: total capital investment and operation and
maintenance costs. Total capital investment includes the costs of the main machineries and
equipment, their installation, engineering, construction and supervision, and the cost of capital or
interest payment. Meanwhile, operation and maintenance costs are generally divided into
maintenance, operating labor, supervision, plant overheads, laboratory expenses, raw
materials/consumables, utilities and transportation. Revenue is generated, mainly from the sale of
the produced RDF, recycled materials, as well as from MSW gate fee.

90
6.4.1.1 CAPITAL COST
An estimation of the capital cost (shown in Table 6,1) was made from the calculation prepared
for the four treatment options, shown in annex (1).
Table 6.1. Estimation of the capital investment for the proposed treatment options
Option Capacity Quantity
(Mg/a )
Capital
investment
(Million Euro)
1 RDF production and recyclables recovery. 50000 8
2 RDF production and recyclables recovery. 100000 12
3 RDF, recyclables recovery and stabilized
material for landfilling. 100000 14
4
RDF, recyclables recovery, compost-like
output (CLO) and inert material for
landfilling.
100000 14
Investment cost and operational and maintenance costs are required to be calculated for
sustainable operation and maintenance of the proposed waste management system and also to
meet expected service standards and the full technical lifetimes of the investment under the
existing conditions.
6.4.1.2 OPERATION AND MAINTENANCE COSTS
In order to calculate these costs, assumption were made according to the situation in the region; it
was assumed that the plant will work for 4000 hours per year to treat the required quantity of
waste, which means that the plant will operate two, eight hour shifts per day. The other estimated
parameters for the calculation of the operation and maintenance costs for the proposed options
are given in Table 6.2.
Table 6.2. Estimated parameters for the calculation of the operation and
maintenance costs for the proposed options
Annual cost
Net equity percentage 30 %
Useful economic life 15 years
Interest (inflation adjusted) 5 %p.a.
Insurance, Revisions 2 %p.a.

91
Expenses
Removal costs for residues and transportation 10 EUR / Mg
Maintenance costs 10 % of capital cost
Electricity costs* 110 EUR / MWh
Electricity consumption** 0.032 MWh/t
Personnel costs (1 man) 6880 €/a
*(STEG, 2015)
**(Karagiannidis, 2012)
To calculate the cost and revenue for each option, the mass balance must be known for each of
them. The output from each option is summarized in Table 6.3. The detailed mass balance during
the processes of the proposed options can be found in annex 2.
Table 6.3. Output of each proposed treatment option
Option 1 2 3 4
Input
Quantity of waste
50,000 100,000 100,000 100,000 Mg/a
Water content 50 %
Output
Metal 731 1,463 1,463 1,463 Mg/a
Recyclables 2,000 4,000 4,000 4,000 Mg/a
RDF 10,350 20,700 20,700 20,700 Mg/a
Compost 0 0 0 21,212 Mg/a
Material for landfill
Dried material Stabilized material
Inert material Mg/a
19,794 39,588 34,240 3,938
Variations in operating costs are less dependent on the technical solutions applied than the capital
costs, but may be strongly influenced by the local conditions (Vaitkus & Stankiewicz, 2013). For
rough evaluation purposes, the assumed operating and maintenance costs for the proposed
treatment option are listed in Table 6.4.

92
Table 6.4. Details of the operation and maintenance cost estimation
Option 1 2 3 4
Waste quantity 50 100 100 100 Mg/a
Operation and Maintenance Costs:
Net debt service 859,517 1,289,275 1,504,154 1,504,154 EUR/a
Maintenance 800,000 1,200,000 1,400,000 1,400,000 EUR/a
Removal of residues 197,938 395,875 342,400 39,375 EUR/Mg
Electricity consumption 174,400 348,800 348,800 348,800 EUR/a
Number of necessary persons 30 40 50 50 person
Effective personnel costs 206,400 275,200 344,000 344,000 EUR/a
Total O&M cost 2,238,255 3,509,150 3,939,354 3,636,329 EUR/a
6.4.1.3 GATE FEES AND RDF PRICE
Gate fees are the fee charged at a solid waste facility and it is generally used to recover the costs
of operating the facility. High gate fees can result in the diversion of waste to informal dumpsites.
Therefore, the gate fees should be set as reasonable amount, which can be affordable and provide
subsidies to sustainable plant operation (Chang & Pires, 2015). There are no available data on the
amount of gate fees and RDF price for the region. Thus, the gate fees and RDF selling price have
been studied in the analysis of the proposed options to investigate the effect of change in these
parameters upon investment return and to estimate the best reasonable price suitable for the
region. The annual cost, expenses and the price of recovered material and gate fees are estimated
and listed in Table 6.5.
Table 6.5. Assumption of different parameters for revenue calculation
Revenue
Gate fee 10,20,30,40 € / Mg
Sale of RDF 15,20,25,30 € / Mg
Sale of recyclables 50 € / Mg
Sale of compost like output 10 € / Mg
Considering the mass balance of each option, the capital costs and the operation and maintenance
the revenue (pre-tax profit) for each case was calculated for the different values of gate fees and
RDF price as shown in Tables 6.6, 6.7, 6.8 and 6.9.

93
Table 6.6. Capital costs, operation and maintenance and the revenue for option 1 for the different values of gate fees and RDF price
Table 6.7. Capital costs, operation and maintenance and the revenue for option 2 for the different values of gate fees and RDF price
Gate fees
RDF price 15 20 25 30 15 20 25 30 15 20 25 30 15 20 25 30
Net debt service 859,517 859,517 859,517 859,517 859,517 859,517 859,517 859,517 859,517 859,517 859,517 859,517 859,517 859,517 859,517 859,517 EUR / a
Personnel costs 206,400 206,400 206,400 206,400 206,400 206,400 206,400 206,400 206,400 206,400 206,400 206,400 206,400 206,400 206,400 206,400 EUR / a
Maintenance costs (abs) 800,000 800,000 800,000 800,000 800,000 800,000 800,000 800,000 800,000 800,000 800,000 800,000 800,000 800,000 800,000 800,000 EUR / a
Electricity consumption costs 174,400 174,400 174,400 174,400 174,400 174,400 174,400 174,400 174,400 174,400 174,400 174,400 174,400 174,400 174,400 174,400 EUR / a
Removal of residues 197,938 197,938 197,938 197,938 197,938 197,938 197,938 197,938 197,938 197,938 197,938 197,938 197,938 197,938 197,938 197,938 EUR / a
Sum costs 2,238,254 2,238,254 2,238,254 2,238,254 2,238,254 2,238,254 2,238,254 2,238,254 2,238,254 2,238,254 2,238,254 2,238,254 2,238,254 2,238,254 2,238,254 2,238,254 EUR / a
Waste acception 500,000 500,000 500,000 500,000 1,000,000 1,000,000 1,000,000 1,000,000 1,500,000 1,500,000 1,500,000 1,500,000 2,000,000 2,000,000 2,000,000 2,000,000 EUR / a
Sale of recyclable material 136,563 136,563 136,563 136,563 136,563 136,563 136,563 136,563 136,563 136,563 136,563 136,563 136,563 136,563 136,563 136,563 EUR / a
Sale of RDF 155,250 207,000 258,750 310,500 155,250 207,000 258,750 310,500 155,250 207,000 258,750 310,500 155,250 207,000 258,750 310,500 EUR / a
Sale of compost like product 0 0 0 0 0 0 0 0 0 0 0 0 0 0 0 0 EUR / a
Sum earnings 791,813 843,563 895,313 947,063 1,291,813 1,343,563 1,395,313 1,447,063 1,791,813 1,843,563 1,895,313 1,947,063 2,291,813 2,343,563 2,395,313 2,447,063 EUR / a
Pre-tax profit -1,446 -1,395 -1,343 -1,291 -946 -895 -843 -791 -446 -395 -343 -291 54 105 157 209 EUR / a
Unit
Annual costs:
Revenues:
10 20 30 40
Gate fees
RDF price 15 20 25 30 15 20 25 30 15 20 25 30 15 20 25 30
Net debt service 1,289,275 1,289,275 1,289,275 1,289,275 1,289,275 1,289,275 1,289,275 1,289,275 1,289,275 1,289,275 1,289,275 1,289,275 1,289,275 1,289,275 1,289,275 1,289,275 EUR / a
Personnel costs 275,200 275,200 275,200 275,200 275,200 275,200 275,200 275,200 275,200 275,200 275,200 275,200 275,200 275,200 275,200 275,200 EUR / a
Maintenance costs (abs) 1,200,000 1,200,000 1,200,000 1,200,000 1,200,000 1,200,000 1,200,000 1,200,000 1,200,000 1,200,000 1,200,000 1,200,000 1,200,000 1,200,000 1,200,000 1,200,000 EUR / a
Electricity consumption costs 348,800 348,800 348,800 348,800 348,800 348,800 348,800 348,800 348,800 348,800 348,800 348,800 348,800 348,800 348,800 348,800 EUR / a
Removal of residues 395,875 395,875 395,875 395,875 395,875 395,875 395,875 395,875 395,875 395,875 395,875 395,875 395,875 395,875 395,875 395,875 EUR / a
Sum costs 3,509,150 3,509,150 3,509,150 3,509,150 3,509,150 3,509,150 3,509,150 3,509,150 3,509,150 3,509,150 3,509,150 3,509,150 3,509,150 3,509,150 3,509,150 3,509,150 EUR / a
Waste acception 1,000,000 1,000,000 1,000,000 1,000,000 2,000,000 2,000,000 2,000,000 2,000,000 3,000,000 3,000,000 3,000,000 3,000,000 4,000,000 4,000,000 4,000,000 4,000,000 EUR / a
Sale of recyclable material 273,125 273,125 273,125 273,125 273,125 273,125 273,125 273,125 273,125 273,125 273,125 273,125 273,125 273,125 273,125 273,125 EUR / a
Sale of RDF 310,500 414,000 517,500 621,000 310,500 414,000 517,500 621,000 310,500 414,000 517,500 621,000 310,500 414,000 517,500 621,000 EUR / a
Sale of compost like product 0 0 0 0 0 0 0 0 0 0 0 0 0 0 0 0 EUR / a
Sum earnings 1,583,625 1,687,125 1,790,625 1,894,125 2,583,625 2,687,125 2,790,625 2,894,125 3,583,625 3,687,125 3,790,625 3,894,125 4,583,625 4,687,125 4,790,625 4,894,125 EUR / a
Pre-tax profit -1,926 -1,822 -1,719 -1,615 -926 -822 -719 -615 74 178 281 385 1,074 1,178 1,281 1,385 EUR / a
Unit
Revenues
Annual costs
10 20 30 40

94
Table 6.8. Capital costs, operation and maintenance and the revenue for option 3 for the different values of gate fees and RDF price
Table 6.9. Capital costs, operation and maintenance and the revenue for option 4 for the different values of gate fees and RDF price
Gate fees
RDF price 15 20 25 30 15 20 25 30 15 20 25 30 15 20 25 30
Net debt service 1,504,154 1,504,154 1,504,154 1,504,154 1,504,154 1,504,154 1,504,154 1,504,154 1,504,154 1,504,154 1,504,154 1,504,154 1,504,154 1,504,154 1,504,154 1,504,154 EUR / a
Personnel costs 344,000 344,000 344,000 344,000 344,000 344,000 344,000 344,000 344,000 344,000 344,000 344,000 344,000 344,000 344,000 344,000 EUR / a
Maintenance costs (abs) 1,400,000 1,400,000 1,400,000 1,400,000 1,400,000 1,400,000 1,400,000 1,400,000 1,400,000 1,400,000 1,400,000 1,400,000 1,400,000 1,400,000 1,400,000 1,400,000 EUR / a
Electricity consumption costs 348,800 348,800 348,800 348,800 348,800 348,800 348,800 348,800 348,800 348,800 348,800 348,800 348,800 348,800 348,800 348,800 EUR / a
Removal of residues 342,400 342,400 342,400 342,400 342,400 342,400 342,400 342,400 342,400 342,400 342,400 342,400 342,400 342,400 342,400 342,400 EUR / a
Sum costs 3,939,354 3,939,354 3,939,354 3,939,354 3,939,354 3,939,354 3,939,354 3,939,354 3,939,354 3,939,354 3,939,354 3,939,354 3,939,354 3,939,354 3,939,354 3,939,354 EUR / a
Waste acception 1,000,000 1,000,000 1,000,000 1,000,000 2,000,000 2,000,000 2,000,000 2,000,000 3,000,000 3,000,000 3,000,000 3,000,000 4,000,000 4,000,000 4,000,000 4,000,000 EUR / a
Sale of recyclable material 273,125 273,125 273,125 273,125 273,125 273,125 273,125 273,125 273,125 273,125 273,125 273,125 273,125 273,125 273,125 273,125 EUR / a
Sale of RDF 310,500 414,000 517,500 621,000 310,500 414,000 517,500 621,000 310,500 414,000 517,500 621,000 310,500 414,000 517,500 621,000 EUR / a
Sale of compost like product 0 0 0 0 0 0 0 0 0 0 0 0 0 0 0 0 EUR / a
Sum earnings 1,583,625 1,687,125 1,790,625 1,894,125 2,583,625 2,687,125 2,790,625 2,894,125 3,583,625 3,687,125 3,790,625 3,894,125 4,583,625 4,687,125 4,790,625 4,894,125 EUR / a
Pre-tax profit -2,356 -2,252 -2,149 -2,045 -1,356 -1,252 -1,149 -1,045 -356 -252 -149 -45 644 748 851 955 EUR / a
Annual costs
Revenues
10 20 30 40Unit
Gate fees
RDF price 15 20 25 30 15 20 25 30 15 20 25 30 15 20 25 30
Net debt service 1,504,154 1,504,154 1,504,154 1,504,154 1,504,154 1,504,154 1,504,154 1,504,154 1,504,154 1,504,154 1,504,154 1,504,154 1,504,154 1,504,154 1,504,154 1,504,154 EUR / a
Personnel costs 344,000 344,000 344,000 344,000 344,000 344,000 344,000 344,000 344,000 344,000 344,000 344,000 344,000 344,000 344,000 344,000 EUR / a
Maintenance costs (abs) 1,400,000 1,400,000 1,400,000 1,400,000 1,400,000 1,400,000 1,400,000 1,400,000 1,400,000 1,400,000 1,400,000 1,400,000 1,400,000 1,400,000 1,400,000 1,400,000 EUR / a
Electricity consumption costs 348,800 348,800 348,800 348,800 348,800 348,800 348,800 348,800 348,800 348,800 348,800 348,800 348,800 348,800 348,800 348,800 EUR / a
Removal of residues 39,375 39,375 39,375 39,375 39,375 39,375 39,375 39,375 39,375 39,375 39,375 39,375 39,375 39,375 39,375 39,375 EUR / a
Sum costs 3,636,329 3,636,329 3,636,329 3,636,329 3,636,329 3,636,329 3,636,329 3,636,329 3,636,329 3,636,329 3,636,329 3,636,329 3,636,329 3,636,329 3,636,329 3,636,329 EUR / a
Waste acception 1,000,000 1,000,000 1,000,000 1,000,000 2,000,000 2,000,000 2,000,000 2,000,000 3,000,000 3,000,000 3,000,000 3,000,000 4,000,000 4,000,000 4,000,000 4,000,000 EUR / a
Sale of recyclable material 273,125 273,125 273,125 273,125 273,125 273,125 273,125 273,125 273,125 273,125 273,125 273,125 273,125 273,125 273,125 273,125 EUR / a
Sale of RDF 310,500 414,000 517,500 621,000 310,500 414,000 517,500 621,000 310,500 414,000 517,500 621,000 310,500 414,000 517,500 621,000 EUR / a
Sale of compost like product 212,118 212,118 212,118 212,118 212,118 212,118 212,118 212,118 212,118 212,118 212,118 212,118 212,118 212,118 212,118 212,118 EUR / a
Sum earnings 1,795,743 1,899,243 2,002,743 2,106,243 2,795,743 2,899,243 3,002,743 3,106,243 3,795,743 3,899,243 4,002,743 4,106,243 4,795,743 4,899,243 5,002,743 5,106,243 EUR / a
Pre-tax profit -1,841 -1,737 -1,634 -1,530 -841 -737 -634 -530 159 263 366 470 1,159 1,263 1,366 1,470 EUR / a
Revenues
10 20 30 40Unit
Annual costs
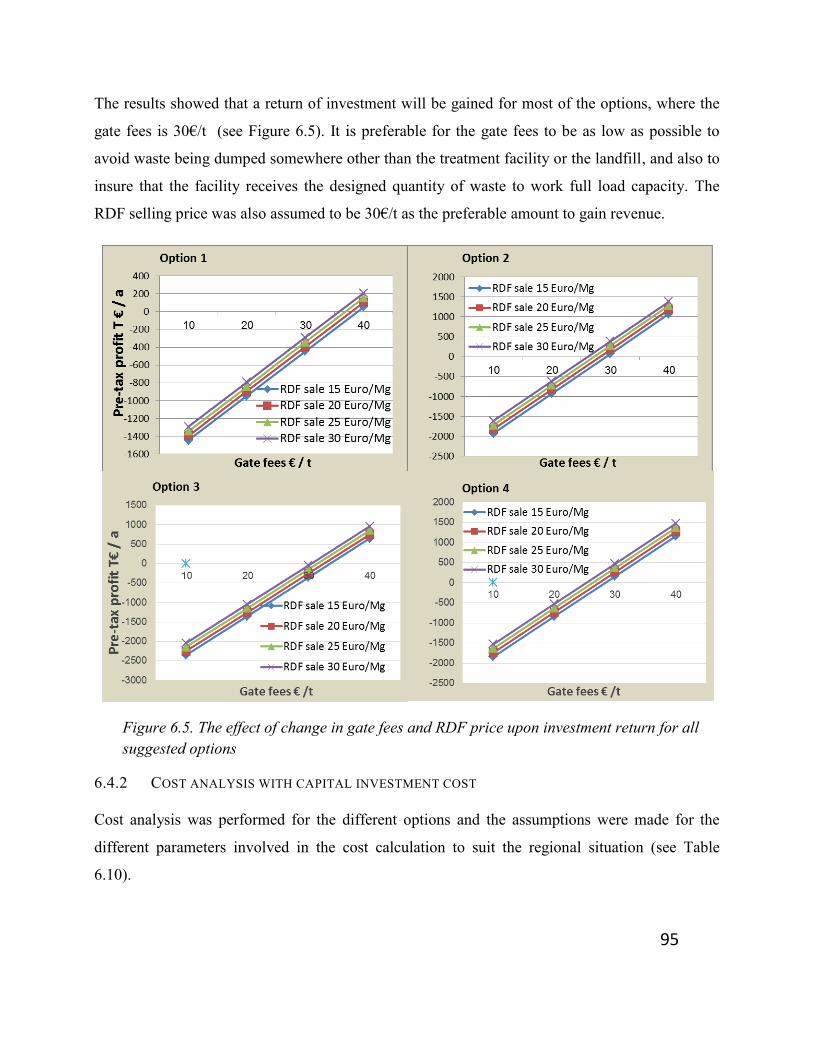
95
The results showed that a return of investment will be gained for most of the options, where the
gate fees is 30€/t (see Figure 6.5). It is preferable for the gate fees to be as low as possible to
avoid waste being dumped somewhere other than the treatment facility or the landfill, and also to
insure that the facility receives the designed quantity of waste to work full load capacity. The
RDF selling price was also assumed to be 30€/t as the preferable amount to gain revenue.
Figure 6.5. The effect of change in gate fees and RDF price upon investment return for all
suggested options
6.4.2 COST ANALYSIS WITH CAPITAL INVESTMENT COST
Cost analysis was performed for the different options and the assumptions were made for the
different parameters involved in the cost calculation to suit the regional situation (see Table
6.10).

96
Table 6.10. Total capital investment, operation and maintenance cost and revenues for the four
suggested alternatives
Option 1 2 3 4
Parameter:
Capital investment 8 12 14 14 MioEUR
Net equity 30 30 30 30 %
Useful economic life 15 15 15 15 years
Interest (inflation adjusted) 5 5 5 5 % p.a.
Costs:
Capital investment 859,517 1,289,275 1,504,154 1,504,154 EUR/a
Effective personnel costs 206,400 275,200 344,000 344,000 EUR/a
Maintenance 800,000 1,200,000 1,400,000 1,400,000 EUR/a
Removal of residues 197,938 395,875 342,400 39,375 EUR/a
Electricity consumption 174,400 348,800 348,800 348,800 EUR/a
Earnings:
Gate fees 30 EUR/Mg
RDF sale 30 EUR/Mg
Sale of recyclables 50 EUR/Mg
Sale of compost like output 10 EUR/Mg
Moreover, capital investment cost price (net debt service) and quantity of waste treated were
studied in the analysis of the proposed options as a case study. Figure 6.6 shows the effect of
change on these parameters upon investment return. From the cost analysis, it was clear that
larger sized plant and machinery are required. Therefore, high capital investment is needed to set
up an RDF plant.

97
Figure 6.6. Revenue from the four suggested alternatives considering the capital cost is covered
by the private sector
As shown in Table 6.11, the high figure of the investment costs makes it hard to gain enough
revenue through the sale of RDF and recycling material produced. For treatment costs of more
than 36€/t per ton there was no profit. Therefore, the cost of treatment per ton should be equal or
less than 36 €/t.
By far the largest cost item in the operation of such plants is the repayment of the capital
investment, which results in capital charges of 13-17 € per ton of MSW processed.
Table 6.11. Cost analysis summary for all options
Treatment option 1 2 3 4
Operation cost of total cost (%) 62% 63% 62% 59%
Investment cost of total cost (%) 38% 37% 38% 41%
Operation cost per ton (€/t) 28 22 24 21
Investment cost per ton (€/t) 17 13 15 15
Total cost (€/t) 45 35 39 36
37,500 50,000 62,500 75,000 100,000 125,000 150,000 t
Option 1. 50000 t/a (drying and RDF production) -685 -291 102 496 T€/a
Option 2. 100000 t/a (drying and RDF production) -402 385 1,172 1,960 T€/a
Option 3. 100000 t/a (stabilized material to landfill) -846 -45 756 1,556 T€/a
Option 4. 100000 t/a (sell of compost like output) -460 470 1,399 2,329 T€/a
Pre
-tax
pro
fit
T€/a
waste quantity
-1,500
-1,000
-500
0
500
1,000
1,500
2,000
2,500
Option 1.
Option 2.
Option 3.
Option 4.
Pre
-tax
pro
fit
T€/a
waste quantity (t)

98
The operating costs including the capital investment cost for such facilities for treating mixed
MSW and RDF production vary in the range of 35-45 €/t. The biggest share of operational costs
is attributed to maintenance of the process equipment. The second biggest operational costs
category is salaries, followed by the residual removal costs. However, return on investment is not
guaranteed to treat the designated waste quantity for all cases
6.4.3 COST ANALYSIS WITHOUT CAPITAL INVESTMENT COST
It is clear from the section above that the most challenging parameter appears to be the capital
costs, which can reach up to 40% of the total costs; to overcome this obstacle, the involvement of
the local municipalities and governments is recommended so they can take responsibility for
providing the initial capital costs, where the public sector has better opportunities to gain grants
and loans for such projects, see Table 6.12. Therefore, as a result, the rate of return will increase
and better economic performance can be achieved and sustained for all alternatives, which will
cover the operational and maintenance costs to ensure sustained operation of the facilities, as
shown in Figure 6.7.
Table 6.12. Total capital investment, operation and maintenance cost and revenues for the four
suggested alternatives
Option 1 2 3 4
Parameter :
Capital investment - - - - MioEUR
Net equity - - - - %
Useful economic life - - - - years
Interest (inflation adjusted) - - - - % p.a.
Costs:
Effective personnel costs 206,400 275,200 344,000 344,000 EUR/a
Maintenance 800,000 1,200,000 1,400,000 1,400,000 EUR/a
Removal of residues 10 10 10 10 EUR/Mg
Electricity consumption 174,400 348,800 348,800 348,800 EUR/a
Earnings:
Waste acceptance fee 20 EUR/Mg
RDF sale 25 EUR/Mg
Sale of recyclables 50 EUR/Mg
Sale of compost like output 10 EUR/Mg
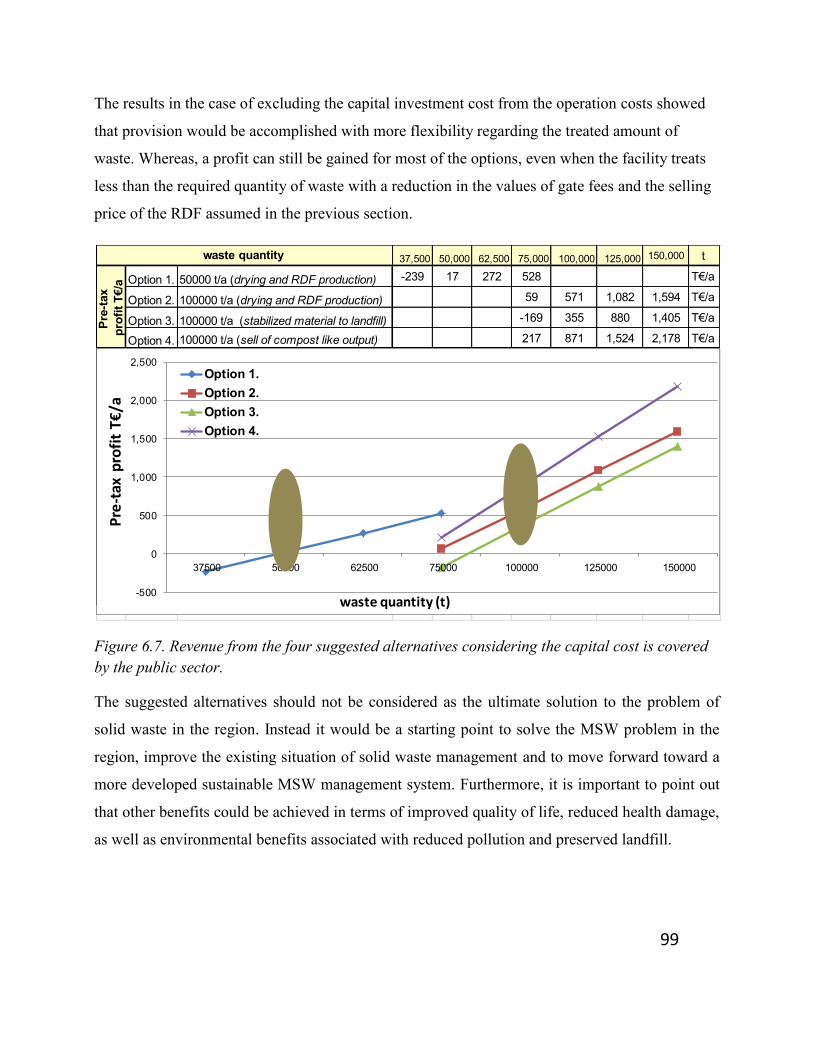
99
The results in the case of excluding the capital investment cost from the operation costs showed
that provision would be accomplished with more flexibility regarding the treated amount of
waste. Whereas, a profit can still be gained for most of the options, even when the facility treats
less than the required quantity of waste with a reduction in the values of gate fees and the selling
price of the RDF assumed in the previous section.
Figure 6.7. Revenue from the four suggested alternatives considering the capital cost is covered
by the public sector.
The suggested alternatives should not be considered as the ultimate solution to the problem of
solid waste in the region. Instead it would be a starting point to solve the MSW problem in the
region, improve the existing situation of solid waste management and to move forward toward a
more developed sustainable MSW management system. Furthermore, it is important to point out
that other benefits could be achieved in terms of improved quality of life, reduced health damage,
as well as environmental benefits associated with reduced pollution and preserved landfill.
37,500 50,000 62,500 75,000 100,000 125,000 150,000 t
Option 1. 50000 t/a (drying and RDF production) -239 17 272 528 T€/a
Option 2. 100000 t/a (drying and RDF production) 59 571 1,082 1,594 T€/a
Option 3. 100000 t/a (stabilized material to landfill) -169 355 880 1,405 T€/a
Option 4. 100000 t/a (sell of compost like output) 217 871 1,524 2,178 T€/a
Pre
-tax
pro
fit
T€/a
waste quantity
-500
0
500
1,000
1,500
2,000
2,500
Option 1.
Option 2.
Option 3.
Option 4.
Pre
-tax
pro
fit
T€/a
waste quantity (t)

100
6.5 FURTHER DEVELOPING FOR SUSTAINABLE SOLID MANAGEMENT SYSTEM SWM SYSTEM
The aim of these strategies, discussed previously, is to reduce the damage to the environment and
recover material from the waste stream.
MSW management represents one of the ongoing problems of modern society. National, regional
and municipal governments must face this problem. Furthermore, all of the previously adopted
technologies for MSW treatment and the low cost disposal practices are no longer acceptable
from different aspects.
With the implementing of alternatives suitable for the region, other steps should be taken to
improve the technologies chosen, to improve the quality of the output from the waste after
treatment and establish a sustainable market for the output material.
6.5.1 SEPARATE COLLECTION OF MSW
There are other alternative solutions that could be established, such as introducing separate
collection of organic wastes and recyclable material to divert them from landfills and to
accomplish maximum by-products utilization. Activities for the introducing and encouraging of
separate collection systems may require some time, about 5-10 years, to be accepted and
implemented, but it is a step that must be taken. Separate collection is considered fundamental for
resources oriented waste management.
A wet/dry separation program (see Figure 6.8) could be implemented as a first step to introducing
the separation of different fractions of waste at the source. Where the waste is separated into two
fractions, dry waste can be of value on the recycling market, such as plastic, cans, glass, paper,
cardboard; wet waste is all food and gardening waste such as fruit and vegetable peels, meat,
paper towels and personal sanitary products. Such a program, would improve the quality of the
products of the treatment facilities and reduce the investment and running costs of the facilities,
where some items and steps of the treatment process will not be needed afterwards.

101
Figure 6.8. Wet and dry separation program and flow of material(Nassour, 2011)
6.5.2 COOPERATION BETWEEN MUNICIPALITIES, PRIVATE SECTOR AND INTERNATIONAL
COMPANIES
The success of SWM is based on the organization between different involved parties (politics,
private sector, consultant companies and public sector) (See Figure 6.9), cooperation between
municipalities and the recycling market and cement industry should be arranged; in addition to
collaboration with developed countries for technology transfer.

102
Figure 6.9. Cooperation between municipalities, private sector and international
companies (Nassour, 2011)
Overall, every possible solution will still need a landfill for inert or stabilized material. The
selection of the appropriate solution for MSW must be based on many factors, such as the
availability of land for disposal, markets for recyclable material and the need for energy
production, taking into account economic and social aspects, with particular attention to
environmental issues.
6.5.3 WASTE TO WATER TECHNOLOGY (W2W)
The W2W technologies can be implemented to solve the problems of waste disposal and water
shortage by desalinating sea and brackish waters. Some arid regions of the world, especially in
the Arab region, have a lack of drinking water and a high accumulation of waste, where the cost
of energy source to operate the desalination plant is considerably high.
The W2W is an advanced technology: its fundamental principle technology is simple and
straightforward, as illustrated in Figure 6.10. The waste is used to produce an alternative energy,
which can be fed directly into desalination plants to generate valuable drinking and service water
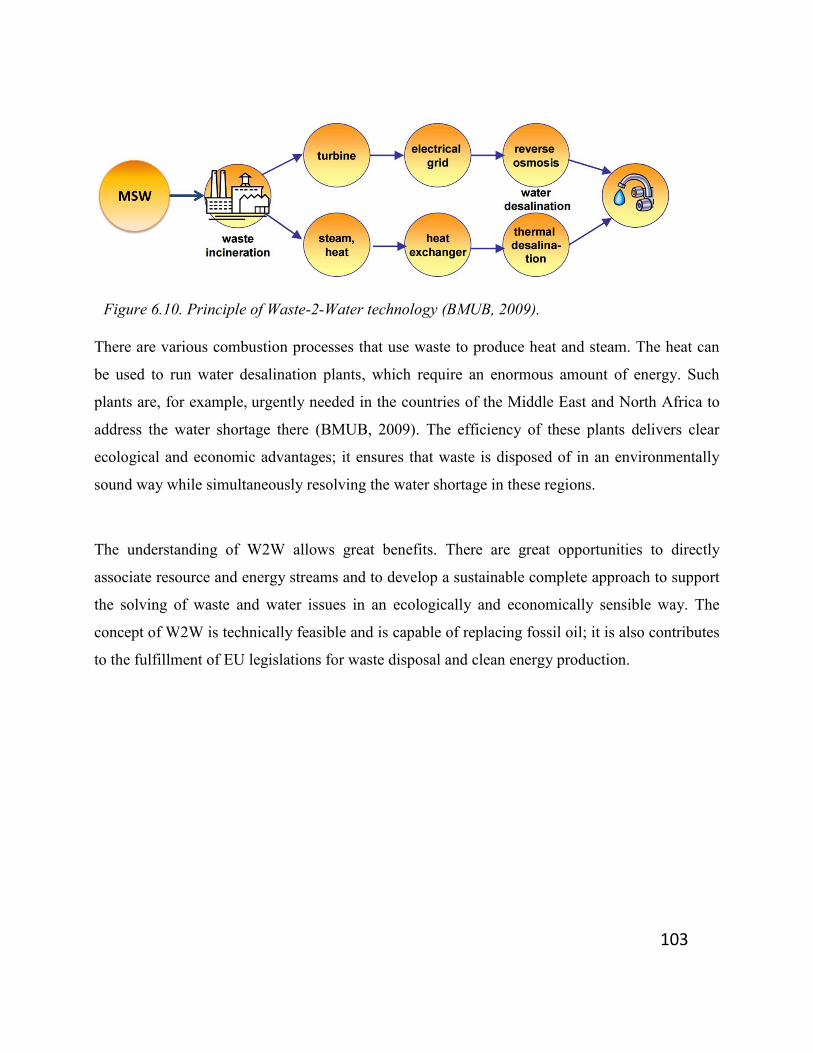
103
Figure 6.10. Principle of Waste-2-Water technology (BMUB, 2009).
There are various combustion processes that use waste to produce heat and steam. The heat can
be used to run water desalination plants, which require an enormous amount of energy. Such
plants are, for example, urgently needed in the countries of the Middle East and North Africa to
address the water shortage there (BMUB, 2009). The efficiency of these plants delivers clear
ecological and economic advantages; it ensures that waste is disposed of in an environmentally
sound way while simultaneously resolving the water shortage in these regions.
The understanding of W2W allows great benefits. There are great opportunities to directly
associate resource and energy streams and to develop a sustainable complete approach to support
the solving of waste and water issues in an ecologically and economically sensible way. The
concept of W2W is technically feasible and is capable of replacing fossil oil; it is also contributes
to the fulfillment of EU legislations for waste disposal and clean energy production.
104
7. CONCLUSIONS
In recent years some Arab countries have introduced the integrated solid waste management
concept. Collection and sorting, composting, incineration of medical wastes and sanitary landfills
are starting to be implemented, while recycling, reuse and resource recovery are still at the initial
stages. Recyclable materials, such as plastic, glass, paper, metals and textiles, are not separately
collected, and household waste is mixed with other types of waste when it is collected. About 2-
5% of materials are recovered as recyclable materials: these materials are sorted by the informal
sector.
Landfill and open dumps are still the common disposal method in the region; about 95% of
generated MSW is directed to landfill for disposal without any treatment. However, landfilling of
waste without treatment is considered a bad choice for many countries in the region, due to the
lack of space available and the nature of the waste to be disposed. Moreover, the high organic
material in MSW 50% to 70%, high water content of about 60%, and the technical problems and
poor operation of the disposal sites will lead to environmental and acceptance problems such as
leachate and landfill gas production and odor problems in the surrounding area. Waste
management in Arab countries is characterized by a high percentage of uncollected waste, with
most of the waste directed to open or controlled dumpsites. Sorting and composting facilities are
being operated with limited capacity. Most of them are not operating anymore and some of them
even closed before they started to operate. Their failure was due to their mismanagement because
of the inappropriate technology chosen for the local conditions, resulting in high operating costs
and frequent mechanical breakdowns through poor maintenance, lack of understanding of the
composting process and training of personnel for the operational procedures.
Compost from some operating facilities was of a poor quality and was not recommended to be
used as soil fertilizers, due to the risk from heavy metals and organic pollutants combined with
the physical risks from sharps and glass, and the aesthetic problem of plastic scraps that remain
highly visible even after composting. The absence of local standards, monitoring systems and the
legal barriers prevents the control of the selling and application of MSW compost to
agricultural/horticultural land.

105
A test project conducted in Beja proved that an efficient waste treatment can be achieved with a
fairly basic and low-cost MBT concept utilization, using the biological drying process to produce
a substitute fuel for industrial processes, reduce the landfill volume required and air emissions
from the landfill, in particular greenhouse gases.
The biodrying process allowed drying of the waste within three weeks. This enabled an efficient
screening of the waste to separate the recyclables and high calorific components from the organic
fines fraction. The RDF produced in Beja is of high calorific value, low moisture and acceptable
chlorine content compared to the RDFs produced in other countries. Concerning heavy metals
content, it is interesting to note that although the Beja RDF shows a different range of heavy
metals, in most cases they are lower than the reported ranges from European countries. In
addition to the mass reduction during the biodrying process, the waste was partially stabilized and
had low moisture content, consequently this would reduce the formation of greenhouse. The more
stabilized the waste, the less landfill gas and leachate would be produced in the landfill. The
compost produced in Beja was in the same range of the compost produced in other operating
facilities in the region with the exception of two elements, which were higher than the range of
the compost produced in the region.
The common issues for practicing waste management are choosing the suitable treatment method
of waste and the optimization of disposal logistics (e.g., introduction of separate waste collection,
cost reduction). Two strategies were considered: Strategy one is based on the recovery of RDF
and metal after the biodrying of raw waste, while in strategy two, the raw waste is processed into
RDF, metal is recovered and the fine fraction is further stabilized before landfilling.
The main objectives of the chosen alternatives are:
Recover recycling material
Minimum material for landfill
Relevant factors: recovery efficiency, costs, time needed for treatment.
The cost of each plant was included into two main components: total capital investment and
operation and maintenance cost. Revenues come mainly from the sale of produced RDF and

106
recycled materials, as well as from MSW gate fees. Cost analysis has been performed for
different facilities and the assumptions were made for the different parameters involved in the
cost calculation to suit the region situation. The high percentage of the investment cost makes it
hard to gain enough revenue from the sale of RDF and recycling material produced. From the
cost analysis, it was clear that larger sized plant and machinery are required. Therefore, high
capital investment is needed to set up an RDF plant. However, return on investment is not
guaranteed to treat the designed waste quantity for all cases. The most influential parameter
appeared to be the capital cost: to overcome this obstacle, the involvement of the local
municipalities and governments is recommended to take responsibility for providing the initial
capital cost.
The suggested options should not be considered as the ultimate solution to the problem of solid
waste in the region. With the implementing of alternatives suitable for the region, other steps
should be taken to improve the technologies chosen, improve the quality of the output from the
waste after treatment and establish a sustainable market for the output material.
Overall, a good alternative for the region is the WtE concept, where mixed MSW is converted to
RDF. This alternative mainly contributes into the reduction of the moisture content of the waste
leading to an increase in the calorific value of the resulting product and a decrease in the
production of leachate from landfilled material, if no further stabilization of organic material is
applied. RDF is becoming one of the interesting alternatives to solving both global warming and
MSWM problems. However, due to the high moisture content, low calorific value and high ash
content of raw MSW, it is needed to segregate the raw MSW and produce RDF. The advantage of
RDF over raw MSW is that RDF can be considered a homogeneous material, with little pollutant
content and with a good calorific value, which can be used for energy production in different
plants or for replacing conventional fuels. A good quality RDF is that which has high calorific
value and low concentrations of toxic chemicals, especially for heavy metals and chlorine. The
results showed that an efficient waste treatment could be achieved with a fairly basic and low-
cost MBT concept. This is by utilizing the biological drying process to produce a substitute fuel
for industrial processes and reduce the landfill areas required, as well as reducing the air
emissions from the landfill, in particular greenhouse gases. High capital investment is needed to

107
set up an RDF plant. However, return on investment is not guaranteed to treat the designated
waste quantity for all cases. Therefore, the success of SWM is based on the partnership and
cooperation between different involved parties (politicians, private sector, consultant companies
and public sector). The selection of the appropriate solution for MSW must be based on many
factors, such as the availability of land for disposal, the market for recyclable material and the
need for energy production, and taking into account the economic and social aspects, with
particular attention to environmental issues.

108
8. RECOMMENDATION
An ISWM approach should be adopted in solving the waste management problem. It is important
that resources for running the waste management program are properly employed. Financial
resources, the legal institutional framework and human resources are the fundamental
components on which the waste management can be run.
The current centralized approach to waste management planning needs to be reviewed. The
institutional and organizational aspects of the planning process should appoint responsibilities to
prepare and implement the plan. The following aspects should be taken into consideration to
improve the SWM system:
Set service standards
Enabling of laws and regulations
Monitoring and evaluation of the running services
Encourage private sector investment by ensuring fair competition between private
sector service providers and between the public and private sectors.
To overcome the problem of lack of professional know-how, appropriate training courses could
be arranged at local and international levels, by training arrangements through exchange
programs with other international institutions.
Public education is also recommended to ensure the acceptance and understanding of the SWM
system, by educating people on the socio-economic and environmental impacts of improper
waste handling and informing them on the values of the waste, if properly handled.
Introducing separate collection programs in the region to improve the waste treatment aspect and
provide more possibilities for other treatment options to be considered for the region.

109
In the meantime, producing compost for agricultural uses should be disregarded for the region at
present and reconsidered as an option in the future, after improving the collection services by
implementing the separate collection where the organic waste would be collected separately.
Governments have to promote the ISWM hierarchy and set up national policy regarding the
minimization of waste to landfill. Local standards must be set for compost, RDF and landfill
material in order to carry a quality control program.
Cooperation between private and public sectors involved in the solid waste management system
is required in order to guarantee the technical, financial and social sustainability of the
implemented solid waste management system.

XIII
REFERENCES
1. Abaza, H., saab, N., Zeitoon, B., 2011. Arab environment.4 green economy; sustainable
transition in a changing Arab World. Report of the Arab Forum for Environment and
Development (AFED). Lebanon.
2. Abou-Elseoud, N., 2008. Arab Environment: Future Challenges in Tolba, M., Saab, N.,
eds, Waste Management, The Arab Forum for Environment and Development, 111-126.
3. Achankeng, E., 2003. Globalization, urbanization and municipal solid waste management
in Africa. In African Studies Association of Australasia and the Pacific (2003) 26th
Annual Conference Proceedings: Africa on a global stage, University of Adelaide,
Australia [online]. Available: http://afsaap.org.au/assets/Achankeng.pdf <accessed 14
August 2013>.
4. Adani, F., Genevini, P.L., Gasperi, F. & Zorzi, G. (1997) Organic matter evo- lution index
(OMEI) as a measure of composting efficiency. Compost Sci. & Utilisation 5(2), pp. 53–
62.
5. AfDB, 2002. Study on solid waste management options for Africa. African Development
Bank AfDB Sustainable Development and Poverty Reduction Unit, Abidjan, Cote
d'Ivoire.
6. Alhoumoud J., Al-Ghusain L., and Al-Hasawi H. Management of Recycling in the Gulf
Co-operation Council States. Waste. Management 24, 2004 pp: 551–562
7. Al-Humoud, J. M., 2005. Municipal Solid Waste recycling in the Gulf Co-operation
Council state. Civil Engineering Department, Kuwait University, Kuwait.
8. Al-Yousfi, A., 2002. Regional perspectives of hazardous waste management in
developing countries, proceedings of Oman international conference on waste
management, united nation environment programme (UNEP), Regional office for west
Asia (ROWA).
XIV
9. Al-Yousfi, B., 2005. Sound Environmental Management of Solid Waste- the Landfill
Bioreactor. UNEP, Office of West Asia.
10. AndyACT, 2010. From waste management to material management: zero waste in the
Arab world. The league of independent activities. [online]. Available:
http://zerowastelebanon.org/userfiles/file/npsEDAD.pdf <accessed 29 August 2013>.
11. Anton, M. A., Munoz, P., Castells, F., Montero, J. I. and Soliva, M., 2005. Improving
waste management in protected horticulture. Agronomy for Sustainable Development, 25
4: 447-453.
12. Asfari, A., 2002. Municipal solid waste management in the Arab world with particular
reference to GCC countries, proceedings of Oman international conference on waste
management.
13. Bagchi, A. (2004). Design of landfills and integrated solid waste management. 3rd ed.
John wiley & sons. USA.
14. Barker, A.V. (1997) Composition : and uses of compost. Pp. 140-162 : In: Rechcigl, J.E.
and H. C. ; MacKinnon (Eds.) Agricultural i. Uses of By-Products and Wastes. I
American Chemical Society, :.. Washington, DC.
15. Bartone, C. 2000. Strategies for Improving Municipal Solid Waste Management: Lessons
from World Bank Lending and CWG Activities. Workshop on Planning for Sustainable
and Integrated Solid Waste Management, Manila, 18-22 September 2000. Washington,
DC: Urban Management Division, World Bank.
16. Beckmann, M, Ncube, S., 2007. Charakterisierung von Ersatzbrennstoffen hinsichtlich
brennstofftechnischer Eigenschaften. In: Wiemer, Klaus; Kern, Michael (Hrsg.): Bio- und
Sekundärrohstoffverwertung II. 1. Auflage, Witzenhausen: Witzenhausen-Institut für
Abfall, Umwelt und Energie GmbH.

XV
17. Bezama A, Aguayo P, Konrad O, Navia R, Lorber K E, 2007. Investigations on
mechanical biological treatment of waste in South America: Towards more sustainable
MSW management strategies. Waste Management, 27: 228–237.
18. Bhattacharyya, P., Chakrabarti, K., Chakraborty, A., Bhattacharya, B., 2001.
Characterization of municipal solid waste compost in relation to maturity, stability and
heavy metals content and pathogens. Indian J. Agri. Sci. 71, 791– 793.
19. Bilitewski, B., Hardtle, G., Marek, K., Weissbach, A. and Boeddicker, H., 1994. Waste
Management. Springer-Verlag Berlin.
20. Bilitewski, Bernd; 2000. Abfallwirtschaft: Handbuch für Praxis und Lehre, Springer;
Auflage: 3., neu bearb. Aufl.
21. BMU, 2006. Waste management in Gemany: A force for jobs and innovation, Federal
Ministry for the Environment, Nature Conservation and Nuclear Safety (BMU), Germany
22. BMUB, 2009. Feasibility Study Waste to Water, Federal Ministry for the Environment,
Nature Conservation, Building and Nuclear Safety.
http://www.bmub.bund.de/fileadmin/bmu-
import/files/english/pdf/application/pdf/trinkwasser_abfall_en_bf.pdf
23. Brinkman, J., 1999. Anaerobic digestion of mixed waste slurries from kitchens,
slaughterhouses and meat processing industries. In: Mata-Alvarez, J., Tilche, A., Cecchi,
F. (Eds.), Proceedings of the Second International Symposium on Anaerobic Digestion of
Solid Wastes, Barcelona, vol. 1, pp. 190- 195.
24. Brinton W. F., 2000. Compost quality standards & guidlines, final report. Woods end
research laboratory , Inc.
25. Brinton, W. (1979) Effects of Different Compost Amendments on Soil Humus Quality.
Compost Science/Land Application. Emmaus PA Fall issue.

XVI
26. Brown, T. E. (1991). Waste Management System: An Overview. Long tem waste
planning and management, T. E. Whitehead. Newcastle, University of Newcastle, Board
of Environmental Science, 17. 17: 27-62.
27. BundesamtUmwelt (2014). Abfallentsorgung – Fachserie 19 Reihe 1 2012. Wiesbaden.
Statistisches BundesamtUmwelt, Online available :
https://www.destatis.de/DE/ZahlenFakten/GesamtwirtschaftUmwelt/Umwelt/Umweltstati
stischeErhebungen/Abfallwirtschaft/Tabellen/Tabellen.html. Accessed on 10 Jan. 2015
28. C.A. Velis, P.J. Longhurst, G.H. Drew, R. Smith, S.J.T. Pollard, (2010), Biodrying for
mechanical-biological treatment of wastes: a review of process science and engineering,
Bioresour. Technol., 100 (11), pp. 2747–2761
29. C.A. Velis, P.J. Longhurst, G.H. Drew, R. Smith, S.J.T. Pollard, (2010). Production and
quality assurance of solid recovered fuels using mechanical-biological treatment (MBT)
of waste: a comprehensive assessment, Crit. Rev. Environ. Sci. Technol., 40 (12), pp.
979–1105
30. Caputo, A. C. & Pelagagge, P. M. (2002). RDF production plants: I Design and costs.
Applied Thermal Engineering, 22, 423-437.
31. CEWEP, 2012. Recycling and Waste-to-Energy in combination for sustainable waste
management, Confederation of European Waste-to-Energy Plants, Brussels
32. Chang, N. and Pires, A. 2015. Sustainable Solid Waste Management: A Systems
Engineering Approach, Wiley-IEEE Press, ISBN: 978-1-118-45691-0
33. Charles R. Rhyner, Leander J. Schwartz, Robert B. Wenger, Mary G. Kohrell, 1995.
Waste management and resource recovery, Lewis Publishers. USA
34. Chefetz, B., Hatcher, P.G., Hadar, Y. and Chen, Y. (1996) Chemical and biological
characterization of organic matter during composting of municipal solid waste. J.
Environ. Qual. 25, 776-785.
35. Christensen, T., (2011), Solid Waste Technology and Management, Wiley Ltd., UK.

XVII
36. CIWMB, 2007. Compost use for landscape and environmental enhancement, California
Environmental Protection Agency, the California Integrated Waste Management Board,
USA.
37. Collivignarelli C, Sorlini S, Vaccari M. Solid wastes management in developing
countries. Rome, Italy: CD-ROM of ISWAWorld Congress; 2004 October.
38. DEM, 1997. Rules and Regulations for Composting Facilities and Solid waste
Management Facilities, Regulation #DEM OWM-SW04-01. State of Rhode Island and
Providence Plantations, Department of Environmental Management.
39. Deportes, I., Benoid-Guyod, J., Zmirou, D., 1995. Hazards to man and environment posed
by the use of urban waste compost: a review. The Science of the Total Environment 172,
197–222.
40. Diaz, L.F., Savage, G.M. and Eggerth, L.L., 1999. Overview of Solid Waste Management
in Economically Developing Countries. In: Proceedings of Organic Recovery and
Biological Treatment, ORBIT 99, Part 3, Rhombos, Berlin, pp. 759–765.
41. DRS. 1992. Mixed Municipal Solid Waste Landfill/Resources Recovery Facility
Assessment. State of Connecticut. Department of revenue services. SN 92(10)
42. Dulac, N., 2001. The organic waste flow in integrated sustainable waste management, in:
Scheinberg, A. (Ed.), Integrated Sustainable Waste Management, A Set of Five Tools for
Decision-makers, Experiences from the Urban Waste Expertise Programme (1995– 2001).
WASTE, Advisers on Urban Environment and Development, Gouda.
43. E C. (2014). Waste -Environment - European Commission. Retrieved from
http://ec.europa.eu/environment/waste/landfill_index.htm. Accessed on 16 Feb 2015
44. EEA (2003), Europe’s environment: the third assessment. Environmental Assessment
Rept No. 10 Assessment of Information related to waste and material flows, European
Environment Agency (EEA), Copeenhagen, Ch 7, 151-164 (European Environment
Agency, EEA (2003)

XVIII
45. EEA, 2009. Diverting waste from landfill Effectiveness of waste-management policies in
the European Union, European Environment Agency, Copenhagen
46. EEA, 2010. The European Environment State and Ooulook 2010: synthesis. European
Environment Agency, Copenhagen.
47. EIA, 2015. Countries profile, Middle east and north Africa. U.S. Energy Information
Administration, Washington
48. Eleanor, L., Jackson, A. and Jackson, J. (1998). Dictionary of Environmental Science.
Edinburgh Gate, Harlow, Essex, Longman Ltd.
49. El-Sherbiny, R., Gaber, A., Riad, M., 2011. Waste management. In: Abaza, H., saab, N.,
Zeitoon, B., 2011. Arab environment.4 green economy; sustainable transition in a
changing Arab World. Report of the Arab Forum for Environment and Development
(AFED). Lebanon. pp 205-234, ISBN 978-9953-437-36-1
50. Epstein E. 1997. The science of composting. Technomic Publishing, Inc., Lancaster,
Pennsylvania, p. 83.
51. Eurostat (Statistical Office of the European Communites). (2014). Retrieved from
Environmental Data Centre on
waste:http://epp.eurostat.ec.europa.eu/portal/page/portal/waste/introduction
52. Eurostat, 2012. ‘Waste Statistics- Municipal Waste-Explanatory texts’
http://epp.eurostat.ec.europa.eu/cache/ITY_SDDS/Annexes/env_wasmun_esms_an1.pdf
Accessed on 25 Jan. 2014.
53. F. Adani, D. Baido, E. Calcaterra, P.L. Genevini, (2002). The influence of biomass
temperature on biostabilization-biodrying of municipal solid waste, Bioresour. Technol.,
83, pp. 173–179
54. F. Tambone, B. Scaglia, S. Scotti, F. Adani, (2011). Effect of biodrying process on
municipal solid waste properties, Waste Manage., 102, pp. 7443–7450

XIX
55. Fischer, C.,2013. Municipal waste management in Germany, European Environment
Agency (EEA), Copenhagen
56. Flyhammar, P. (1997) Estimation of heavy metal transforma- tions in municipal solid
waste. Sci. Total Environ. 198, 123- 133.
57. Flyhammar, P. (1998) Use of sequential extraction on an- aerobically degraded municipal
solid waste. Sci. Total Envi- ron. 212, 203-215.
58. Gallardo-Lara, F. and R. Nogales. (1987) Effect of the application of town refuse compost
on the soilplant system: A review. Biol. Wastes 10:35-62.
59. Garcìa, C., Moreno, J.L., Hernandez, T. and Costa, F. (1995) Effect of composting on
sewage sludge contaminated with heavy metals. Bioresource Technol. 53, 13-19.
60. GCC, (2004). GCC countries and their Role in the Protection of Environment and
Preservation of its Natural Resources. GCC General Secretariat.
61. Gendebien, A., Leavens, A., Blackmore, K., Godley, A., Lewin, K., Whiting, K. J., et al.
(2003). Refuse Derived Fuel, Current Practice and Perspectives Final Report. European
Commission.
62. Gerlagh, R., Pieter, B., Madhu, V., Yadar, P. and Pandey, P., 1999. Integrated modelling
of Solid Waste in India, CREED working paper series No. 26. International Institute for
environment and development. London.
63. Gigliotti G, Businelli D, Giusquiani PL. Trace metals uptake and distribution in corn
plants grown on a 6-year urban waste compost amended soil. Agric Ecosyst Environ
1996;58:199–206.
64. Gillett, J.W., 1992. Issues in risk assessment of compost from municipal solid waste:
occupational health and safety, public health, and environmental concerns. Biomass and
Bioenergy 3 (3–4), 145–162
XX
65. Goldstein, N., and Spencer, B., 1990. Solid waste composting facilities. BioCycle. Jan.
31(1):36-39.
66. Golueke, C. G. (1977), Biological Reclamation of Solid Wastes, Rodale Press, Emmaus,
PA
67. H.L. Choi, T.L. Richard, H.K. Ahn, (2001). Composting high moisture materials:
biodrying poultry manure in a sequentially fed reactor, Compost Sci. Util., 9, pp. 303–311
68. Hansen, W., Christopher, M., Verbuecheln, M., 2002. EU Waste Policy and Challenges
for Regional and Local Authorities (Background Paper for the Seminar on Household
Waste Management “Capacity Building on European Community’s Environmental
Policy”), Ecologic, Institute for International and European Environmental Policy, Berlin.
69. Hazra T, Goel S. 2009. Solid waste management in Kolkata, India: Practices and
challenges. Waste Management 29(1), 470-478.
70. Hogg, D., Favoino, E., Centemero, M., Caimi, V., Amlinger, F., Devliegher, W., Brinton,
W., Antler, S., 2002. Comparison of compost standards within the EU, North America
and Australia, The Waste and Resources Action Programme (WRAP), Oxon. ISBN 1-
84405-003-3.
71. Hoornweg, D., 1999. What a waste: solid waste management in Asia. Report of Urban
Development Sector Unit, East Asia and Pacific Region, World Bank, Washington, D.C.
72. Hoornweg, D., Otten, L., and Wong, W., 1991. Wet and dry household waste collection.
BioCycle. June, 32(6):52-54.
73. Hussein, M., 2008. Costs of environmental degradation; An analysis in the Middle East
and North Africa region. Management of Environmental Quality: An International
Journal. vol. 19, No. 3, 2008, pp. 305-317, Emerald Group Publishing Limited.
74. Jakobsen, S.T. (1995) Aerobic decomposition of organic wastes 2. Value of compost as
fertilizer. Resour Conserv Recycl 13, 57–71.

XXI
75. Juniper, 2005). Mechanical–Biological Treatment: A Guide for Decision Makers,
Processes, Policies and Markets – Annexe A, Process Fundamentals, Juniper Consultancy
Services Ltd., Sheppards Mill, UK
76. Karagiannidis, A., 2012. Waste to Energy Opportunities and Challenges for Developing
and Transition Economies, Green Energy and Technology, Springer-Verlag London
77. Kehres, B., 1992. New standards and compost quality in the federal republic of Germany:
the standards, the organisation for control, acceptance in practice. In: Jackson, D.V.,
Merillot, J.M., L’ Hermite, P. (Eds.), Composting and Compost Quality Assurance
Criteria. Commission of the European Communities, Luxembourg, pp. 184–187.
78. Kehres, B., 1998. Methodenbuch zur Analyse von Kompost, Bundesgütegemeinschaft
Kompost e.V. Red. 4., erg. und überarb. Aufl. Stuttgart : Verl. Abfall Now.
79. King, L.D., Burns, J.C. and Westerman, P.W. (1990) Long- term swine lagoon effluent
applications on ‘Coastal’ bermu- dagrass: I. Effect on nutrient accumulation in soil. J.
Environ. Qual. 19, 756-760.
80. LAS, 2009. Arab Regional Strategy for Sustainable Consumption and Production. Final
draft. League of Arab States (LAS), Cairo.
81. Lasaridi, K.E., Stentiford, E.I., 1998. A simple respirometric technique for assessing
compost stability. Water Research 32, 3717–3723.
82. Lasaridi, K.E., Stentiford, E.I., 1998. A simple respirometric technique for assessing
compost stability. Water Research 32, 3717–3723.
83. Lazzari, L., Sperni, L., Bertin, P. and Pavoni, B. (2000) Cor- relation between inorganic
(heavy metals) and organic (PCBs and PAHs) micropollutant concentrations during
sewage sludge composting processes. Chemospere 41, 27-435.

XXII
84. Liu, Y., Liu, Y., 2005. Novel incineration technology integrated with drying, pyrolysis,
gasification, and combustion of MSW and ashes vitrification. Environ. Sci. Technol. 39,
3855–3863.
85. Ludwig, C., Hellweg, S. and Stucki. S., (2003), Municipal Solid Waste Management:
Strategies and Technologies for Sustainable Solutions, Springer, Berlin.
86. M. Scoullos, P. Siskos, C. Zeri, A. Skordilis, Ch. Ziogas, A. Sakellari, K. Giannopoulou,
P. Tsiolis, S. Mavroudeas, I. Argyropoulos, Th. Roumeliotis, O. Skiadi, Composition and
chemical properties of RDF product at a MSW mechanical separation plant in Greece.
Conference on thermal processing of MSW, National Technical Univesity of Athens
2009.
87. M. Sugni, E. Calcaterra, F. Adani, (2005). Biostabilization-biodrying of municipal solid
waste by inverting air-flow, Bioresour. Technol., 96 (2005), pp. 1331–1337
88. McCarthy, J. E. (1994). The municipal solid waste problem in the main industrialized
countries.
89. McDougall F., White P., Franke M. & Hindle P. (2001) Integrated Solid Waste
Management: A Life-Cycle Inventory, Blackwell Science, 2nd Edition.
90. Medina, M. (2002). Globalisation, development and municipal solid waste management
in Third World Cities. Tijuana, Mexico: El Colegio de la Frontera Norte
91. Medina, M., 2002. Globalization, Development and Municipal Solid Waste Management
in Third World Cities. Institute of Advance Studies, Mexico. pp 1-23.
92. Mkhabela, M. and Warman, PR., (2005). The influence of muni- cipal solid waste
compost on yield, soil phosphorus avai- lability and uptake by two vegetable crops, grown
in a P- awash sandy loam soil in Nova Scotia. J. Agric. Ecosyst. Environ. 106,57-67.
93. N. Watanabe, O. Yamamoto, M. Sakai, J. Fukuyama, (2004). Combustible and
incombustible speciation of Cl and S in various components of municipal solid waste,
Waste Management, 24, pp. 623–632

XXIII
94. Nassour, A., Al-Ahmad, M., Elnaas, A. and Nelles, M., 2011. Practice of waste
management in the Arab region. Contribution in: kule-weidemeier, M.:(Editor), water-to-
resources 2011-4. International conference MBT and sorting systems, conference
proceedings, 24-26 May 2011, pp. 81-91, ISBN 978-3-86955-747-2 (05/2011).
95. Nassour, A.; Majanny, A.; Nelles, M. (2008): Waste Management: Current Developments
in the Arabic Countries, Tagungsband anlässlich der Asian-European Environmental
Technology and Knowledge Transfer Conference vom 5.-6. Juni 2008 in Hefei, China, S.
14-23, ISBN 978-3-00-024606-7.
96. Nema, A., 2009. Report: Risk factors associated with treatment of mixed municipal solid
waste in the Indian context. (ISWA) International Solid Waste Association. ISSN 0734–
242X, Waste Management & Research, 2009: 00: 1–6
97. Papadimitrou, E.K., Barton, J.R., Stentiford, E.I., 2008. Sources and levels of potentially
toxic elements in the biodegradable fraction of autoclaved nonsegregated household waste
and its compost/digestate. Waste Manage. Res. 26, 419–430.
98. Parr, J. F. and Hornick, S. B. 1992. Utilization of municipal wastes. In: Metting, F. B.
(ed.) Soil Microbial Ecology: Applications in Agricultural and Environmental
Management. Marcel Dekker Inc., New York. pp. 545-559.
99. Rada E C, Istrate I A, Ragazzi M, 2009. Trends in the management of Residual Municipal
Solid Waste. Environmental Technology, 30(7): 651--661.
100. Rechberger H. (2011). “Incineration: Co-combustion” in Solid waste technology
& management Rives, J. Rieradevall, J., & Gabarell, X. (2010) LCA comparison of
container systems in municipal solid waste management. Waste Management, 30, 949-
957.
101. Richard, T.L. 1992. Municipal solid waste composting: physical and biological
processing. Biomass and Bioenergy 3(3-4):163-180.

XXIV
102. Richard, T.L., 1992. Municipal solid waste composting: physical and biological
processing. Biomass Bioenerg. 3, 163–180
103. Rosen, C.J., Halbach, T.R., Swanson, B.T., 1993. Horticultural uses of municipal
solid waste components. Hortic. Technol. 3, 167–173.
104. Rotter S. (2011). “Incineration: RDF and SRF - Solid waste from fuels” in Solid
waste technology & management Tchobanoglous, George and Kreith, Frank, 2002.
Handbook of Solid Waste Management, 2nd Edition, McGraw-Hill.
105. Rotter, V.S., Kost, T., Winkler, J. & Bilitewski, B. (2004). Material flow analysis
of RDF-production process. Waste Management, 24, pp. 1005-1021.
106. Rynk, R., ed.(1992), On-Farm Composting Handbook, Northeast Regional
Agricultural Engineering Service, Cooperative Extension, Ithaca, NY.
107. Sakurai, K., 1990. Improvement of solid waste management in developing
countries. Institute for International Cooperation Japan, JICA Technical Handbook Series-
Vol.1.
108. Sasikumar, K., and Krishna, S., (2009), Solid Waste Management, PHI Learning
Private Ltd, New Delhi.
109. Schnitzer, M & M. Kahn (1987) Humic Substances in the Environment. Marcel-
Dekker Publ. NY
110. Schnurer, H., 2002. German Waste Legislation and Sustainable Development:
Development of Waste Legislation in Germany towards a sustainable closed Substance
Cycle. Work shop organized by the Alexander von Humboldt Foundational, the
International Institute for Advance Studies (IIAS), in Kyoto, Japan
111. Schubeler, P., 1996. Conceptual framework for municipal solid waste
management in low-income countries. United Nations Development Program, UMP
Working Paper Series no. 9. St. Gallen, Switzerland: SKAT.

XXV
112. Senesi, G.S., Baldassarre, G., Senesi, N., Radina, B., 1999. Trace element inputs
into soils by anthropogenic activities and implications for human health. Chemosphere 39,
343–377.
113. Senesi, N. & Brunetti, G. (1996) Chemical and physical parameters for qual- ity
evaluation of humic substances produced during composting. In: de Bertoldi, M., Sequi,
P., Lemmes, B. & Papi, T. (eds) The Science of Composting. Backie Academic &
Professional, Glasgow. pp. 175–184.
114. Sharma, V.K., Canditelli, M., Fortuna, F., Cornacchia, G., 1997. Processing of
urban and agro-industrial residues by aerobic composting: review. Energy Convers.
Manage. 38, 453–478.
115. Shukla, S. R.et al, (2000), Manual on “Municipal Solid Waste Management”,
Ministry of Urban Development Government of India, New Delhi.
116. Siefert, Helmut2010. Thermische Verfahren. In: Kranert, Martin; Cord-Landwehe,
Klaus (Hrsg.): Einführung in die Abfallwirtschaft. 4. Vollständig aktualisierte und
erweiterte Auflage, Wiesbaden: Vieweg & Teubner Verlag,
117. Slack, R.J., Bonin, M., Gronow, J.R., Van Santen, A., Voulvoulis, N., 2007.
Household hazardous waste data for the UK by direct sampling. Environ. Sci. Technol.
41, 2566–2571.
118. Spencer, R. and N. Goldstein. 2006. Mixed MSW composting is “steady as she
goes.” BioCycle 49(11):18-22.
119. STEG, 2015. The Tunisian Company of Electricity and Gas (STEG).
https://www.steg.com.tn/fr/clients_res/tarif_electricite.html
120. Sugni M, Calcaterra E, Adani F, 2005. Biostabilization-biodrying of municipal
solid waste by inverting air-flow. Bioresource Technology, 96(12): 1331--1337.
121. SWEEP-NET, (2010). Reports on the solid Waste Management in Mashreq and
Maghreb Countries, SWEEP.

XXVI
122. Tchobanglous, G. & Kreith, F. 2002. Handbooh of Solid Waste Management. 2nd
ed. McGraw-Hill. USA.
123. Tchobanoglous, G., Theisen, H. & Vigil, S. (1993) Integrated Solid Waste
Management: Engineering Principles and Management Issues. New York: McGraw-Hills
Inc.
124. The Management of Municipal Solid Waste in Europe: economic, technological
and environmental perspectives. A. Q. Curzio, L. Prosperetti and R. Zoboli. Amsterdam,
Elsevier Science B.V. 5: 248.
125. Thiel, S.; Hoffmann, B. (2008). State-of-the-Art and Assessment of Technogies
for Mechanical-Biological Waste Treatment. In: Aufbereitungs Technik AT 49, Nr. 6, S.
22-33.
126. Thiel, Stephanie, and Thomé-Kozmiensky, Karl Joachim, 2011: ‘Mechanical-
Biological PreTreatment of Waste – Hope and Reality’
http://www.iswa.org/uploads/tx_iswaknowledgebase/Thiel.pdf
127. UNEP (2005). Solid waste management, United nation environmental
program…….
128. United Nations, Economic and Social Commission for Asia and the Pacific, Asia
Development Bank, State of the Environment in Asia and the Pacific. New York, 1995.
129. Uriarte, F. A. (2008), Solid waste management: principles and practices,
University of the Philippines Press.
130. USCC, 2001. Field guide to compost use, the US composting council, E&A
Environmental Consultants, Inc., USA
131. Vaitkus, Z. and Stankiewicz, E., 2013. Papers Key Considerations in Planning
Waste–to–Energy Facilities, JASPERS Knowledge Economy and Energy Division Staff
Working
XXVII
132. Veeken, A. and Hamelers, B. (2002) Sources of Cd, Cu, Pb and Zn in biowaste.
Sci. Total Environ. 30, 87-98.
133. Velis C A, Longhurst P J, Drew G H, Smith R, Pollard S J T, 2010. Production
and quality assurance of solid recovered fuels using mechanical-biological treatment
(MBT) of waste: a comprehensive assessment. Critical Reviews in Environmental Science
and Technology, 40(12): 979--1105.
134. Vesilind, P. A., Worrell, W., and Reinhart, D., 2002. Solid waste engineering.
Brooks/Cole, Pacific Grove, California, USA.
135. Visvanathan, C., Trankler, J., Joseph, K., Chiemchaisri, C., Basnayake, B. F. A.,
& Gongming, Z. (2004). Municipal solid waste management in Asia. Asian Regional
Research Program on Environmental Technology (ARRPET). Asian Institute of
Technology publications. ISBN: 974-417-258-1.
136. Weissenbach, T., 2007. Evaluation of waste policies related to the Landfill
Directive "Germany"- Draft paper, European Topic Centre on Resource and Waste
Management (ETC/RWM), Copenhagen.
137. Williams, P. 1998. Waste Treatment and Disposal. John Wiley & sons. UK.
138. Zerbock Olar (2003) ‘Urban solid waste management: waste reduction in
developing nations’ school of forest resources and environment science, masters
international program, Michigan Technological University, Working paper 2003.
139. Zerbock, O., 2003. Urban solid waste management: waste reduction in developing
nations’ school of forest resources and environment science, Michigan Technological
University, Working paper 2003.
140. Zhang D Q, He P J, Shao L M, Jin T F, Han J Y, 2008. Biodrying of municipal
solid waste with high water content by combined hydrolytic-aerobic technology. Journal
of Environmental Sciences, 20(12): 1534--1540.
XXVIII
141. Zurbrugg, C., 2003, Markets for Compost; a key factor for success of urban
composting schemes in developing countries. City Matters Magazine, online Journal of
Urbanicity.

XXIX
THESIN
1. The solid waste sector in many Arab countries can be characterized as a disorganized
sector with sporadic service coverage. Waste management in the region is one of the
major responsibilities of local government, with no significant participation by the private
sector. Subcontractors are commonly brought in to handle specific activities such as
collection and transportation. Most Arab countries have made efforts to organize SWM
with the implementation of several laws and regulations. In some cases, foreign rules and
regulation were enacted without any customization to suit the characteristics of the
country.
2. Some countries define organizational frameworks, but they are poorly implemented and
disrupted by the centralization of authorities at a national level. In addition, a lack of
action by government institutions, a lack of investment by the private sector and the
absence of public participation in decision making have all hampered the development of
proper SWM practices in the region.
3. Waste sorting and recycling are driven by an active informal sector. About 1-3% of the
total generated waste is recovered as recyclable materials, such as PET, other plastics,
metals and paper. These materials are sorted from the waste containers and disposal sites
by scavengers, the sorted paper, metals and some plastic materials are marketed and
recovered in local recycling facilities, while the PET are marketed internationally.
4. Composting is also gaining increased interest due to the high organic content of MSW. it
has been increasingly adopted in some countries as a strategic choice for processing the
organic content of waste. Although the municipalities of the high-income Arab countries
have tried composting a fraction of organic waste, a large number of plants were not
operated successfully. The region has had poor experience of sorting recyclable materials
from municipal waste and processing the separated organic matter.
5. Waste disposal along in uncontrolled dumps is still practiced in many parts of the Arab
region. The most commonly used method of disposal is in controlled dumpsites. Disposal

XXX
in sanitary landfills is increasingly being adopted, particularly where there is a strong
sense of environmental awareness.
6. The Arab region needs a sustainable, flexible and resource oriented waste treatment
system. Mechanical biological/physical treatment is considered the most suitable solution.
Incineration is unpayable for the most cities in the region. The Gulf region has the
possibility for finance options. Further problems are the lower calorific value
<7000KJ/Kg, use of waste heat and the needed know-how for the operation.
7. Solid waste treatment facilities with compost production do existed in the region, but
many of them no longer operate and some even closed before they started to operate.
Their failure was due to their mismanagement because of the inappropriate technology
chosen for the local conditions (resulting in high operating costs and frequent mechanical
breakdowns through poor maintenance), a lack of understanding of the composting
process and training of personnel for the operational procedures.
8. Samples of MSW composts were collected from some cities in different countries of the
region. Generally, most compost samples tested in this study were of a poor quality and
were not recommended for use as soil fertilizers. This was due to the risk from heavy
metals and organic pollutants, alongside the physical risks from sharps, glass and the
aesthetical problem of plastic scraps that remain highly visible even after composting.
Therefore, compost of MSW cannot be considered as appropriate solution for big cities in
the region. The production RDF to be used in cement industry and power stations could
be practical and feasible solution for the local conditions of the region.
9. From several factors, high content of organic matter, the needed investment and operation
cost, easily adapted know-how..etc. Biodrying is the more suitable technology for
production of RDF from mixed collected MSW in the region.
10. Temperature of the windrows during the biodrying was maintained at 40-70 ˚C for most
of the duration of the process. After three weeks the waste was fairly dry with a moisture
content of between 20 and 45%.
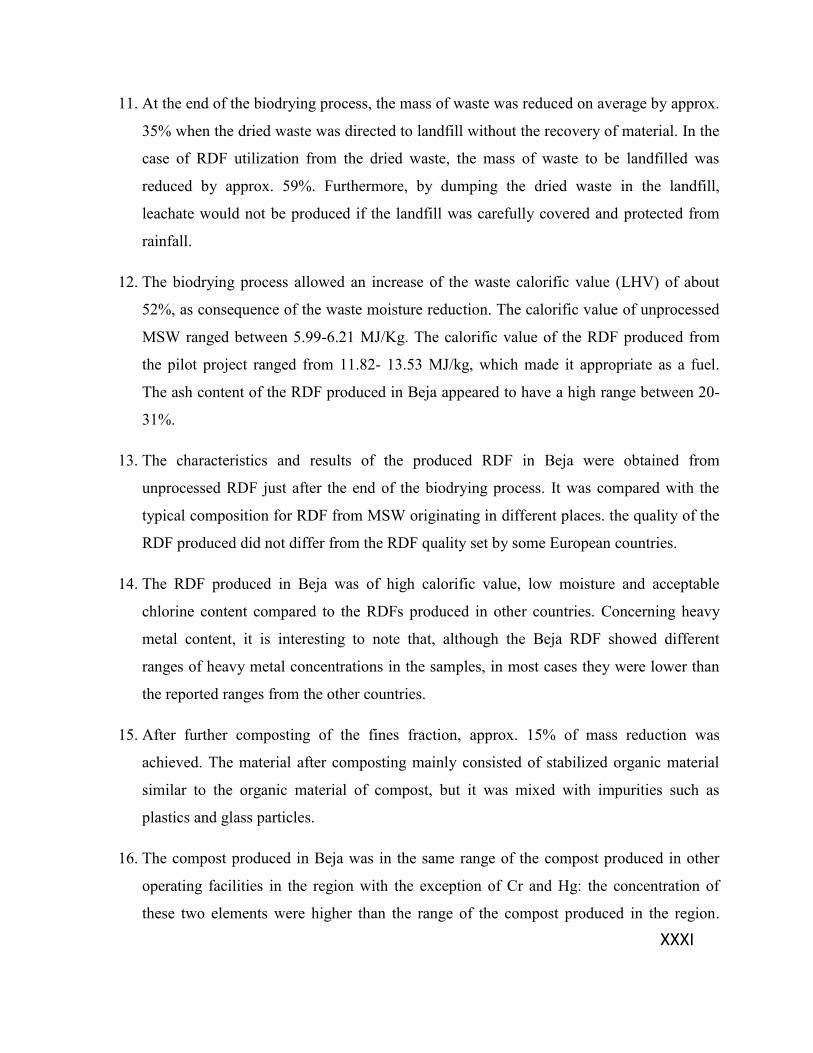
XXXI
11. At the end of the biodrying process, the mass of waste was reduced on average by approx.
35% when the dried waste was directed to landfill without the recovery of material. In the
case of RDF utilization from the dried waste, the mass of waste to be landfilled was
reduced by approx. 59%. Furthermore, by dumping the dried waste in the landfill,
leachate would not be produced if the landfill was carefully covered and protected from
rainfall.
12. The biodrying process allowed an increase of the waste calorific value (LHV) of about
52%, as consequence of the waste moisture reduction. The calorific value of unprocessed
MSW ranged between 5.99-6.21 MJ/Kg. The calorific value of the RDF produced from
the pilot project ranged from 11.82- 13.53 MJ/kg, which made it appropriate as a fuel.
The ash content of the RDF produced in Beja appeared to have a high range between 20-
31%.
13. The characteristics and results of the produced RDF in Beja were obtained from
unprocessed RDF just after the end of the biodrying process. It was compared with the
typical composition for RDF from MSW originating in different places. the quality of the
RDF produced did not differ from the RDF quality set by some European countries.
14. The RDF produced in Beja was of high calorific value, low moisture and acceptable
chlorine content compared to the RDFs produced in other countries. Concerning heavy
metal content, it is interesting to note that, although the Beja RDF showed different
ranges of heavy metal concentrations in the samples, in most cases they were lower than
the reported ranges from the other countries.
15. After further composting of the fines fraction, approx. 15% of mass reduction was
achieved. The material after composting mainly consisted of stabilized organic material
similar to the organic material of compost, but it was mixed with impurities such as
plastics and glass particles.
16. The compost produced in Beja was in the same range of the compost produced in other
operating facilities in the region with the exception of Cr and Hg: the concentration of
these two elements were higher than the range of the compost produced in the region.
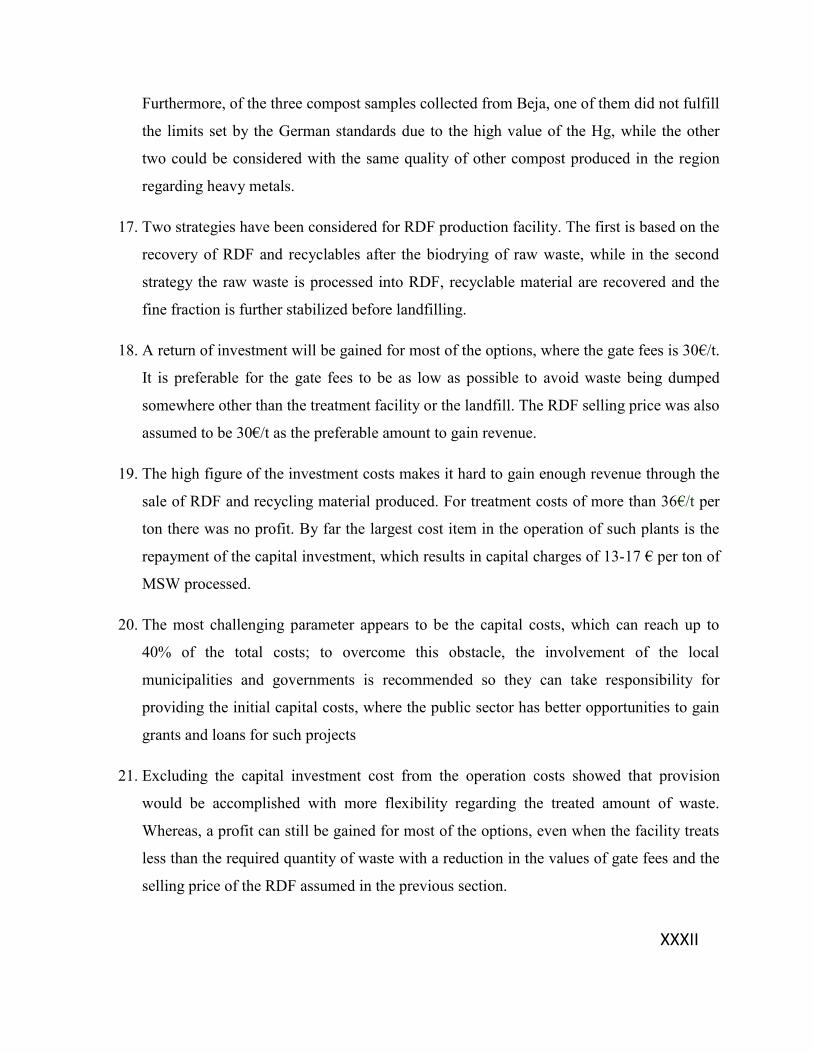
XXXII
Furthermore, of the three compost samples collected from Beja, one of them did not fulfill
the limits set by the German standards due to the high value of the Hg, while the other
two could be considered with the same quality of other compost produced in the region
regarding heavy metals.
17. Two strategies have been considered for RDF production facility. The first is based on the
recovery of RDF and recyclables after the biodrying of raw waste, while in the second
strategy the raw waste is processed into RDF, recyclable material are recovered and the
fine fraction is further stabilized before landfilling.
18. A return of investment will be gained for most of the options, where the gate fees is 30€/t.
It is preferable for the gate fees to be as low as possible to avoid waste being dumped
somewhere other than the treatment facility or the landfill. The RDF selling price was also
assumed to be 30€/t as the preferable amount to gain revenue.
19. The high figure of the investment costs makes it hard to gain enough revenue through the
sale of RDF and recycling material produced. For treatment costs of more than 36€/t per
ton there was no profit. By far the largest cost item in the operation of such plants is the
repayment of the capital investment, which results in capital charges of 13-17 € per ton of
MSW processed.
20. The most challenging parameter appears to be the capital costs, which can reach up to
40% of the total costs; to overcome this obstacle, the involvement of the local
municipalities and governments is recommended so they can take responsibility for
providing the initial capital costs, where the public sector has better opportunities to gain
grants and loans for such projects
21. Excluding the capital investment cost from the operation costs showed that provision
would be accomplished with more flexibility regarding the treated amount of waste.
Whereas, a profit can still be gained for most of the options, even when the facility treats
less than the required quantity of waste with a reduction in the values of gate fees and the
selling price of the RDF assumed in the previous section.
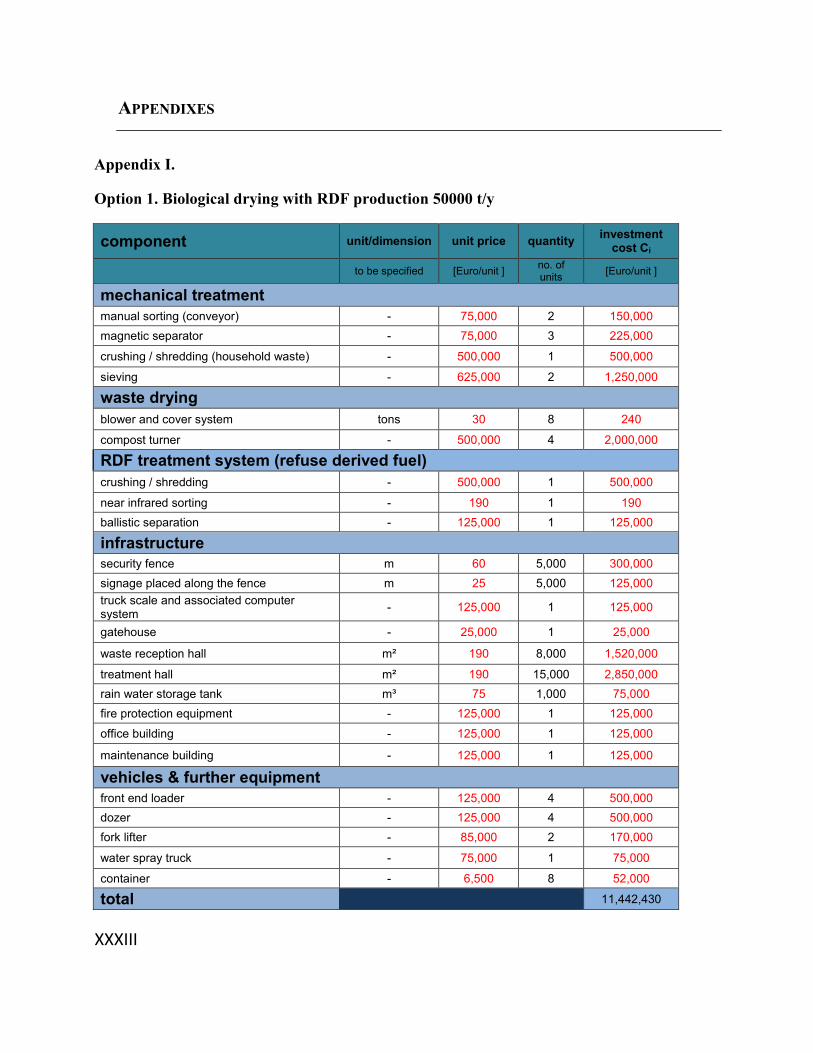
XXXIII
APPENDIXES
Appendix I.
Option 1. Biological drying with RDF production 50000 t/y
component unit/dimension unit price quantity investment
cost Ci
to be specified [Euro/unit ] no. of units
[Euro/unit ]
mechanical treatment
manual sorting (conveyor) - 75,000 2 150,000
magnetic separator - 75,000 3 225,000
crushing / shredding (household waste) - 500,000 1 500,000
sieving - 625,000 2 1,250,000
waste drying
blower and cover system tons 30 8 240
compost turner - 500,000 4 2,000,000
RDF treatment system (refuse derived fuel)
crushing / shredding - 500,000 1 500,000
near infrared sorting - 190 1 190
ballistic separation - 125,000 1 125,000
infrastructure
security fence m 60 5,000 300,000
signage placed along the fence m 25 5,000 125,000
truck scale and associated computer system
- 125,000 1 125,000
gatehouse - 25,000 1 25,000
waste reception hall m² 190 8,000 1,520,000
treatment hall m² 190 15,000 2,850,000
rain water storage tank m³ 75 1,000 75,000
fire protection equipment - 125,000 1 125,000
office building - 125,000 1 125,000
maintenance building - 125,000 1 125,000
vehicles & further equipment
front end loader - 125,000 4 500,000
dozer - 125,000 4 500,000
fork lifter - 85,000 2 170,000
water spray truck - 75,000 1 75,000
container - 6,500 8 52,000
total 11,442,430

XXXIV
Option 2. Biological drying with RDF production 100000 t/y
component unit/dimen
sion unit price
quantity
investment cost Ci
Euro/unit no. of units
[Euro/unit ]
mechanical treatment
manual sorting (conveyor) - 75,000 2 150,000
magnetic separator - 75,000 3 225,000
crushing / shredding (household waste) - 500,000 1 500,000
sieving - 625,000 2 1,250,000
waste drying
blower and cover system tons 30 6 180
compost turner - 500,000 2 1,000,000
RDF treatment system (refuse derived fuel)
crushing / shredding - 500,000 1 500,000
near infrared sorting - 190 1 190
ballistic separation - 125,000 1 125,000
infrastructure
security fence m 60 3,000 180,000
signage placed along the fence m 25 3,000 75,000
truck scale and associated computer system
- 125,000 1 125,000
gatehouse - 25,000 1 25,000
waste reception hall m² 190 5,000 950,000
treatment hall m² 190 10,000 1,900,000
rain water storage tank m³ 75 1,000 75,000
fire protection equipment - 125,000 1 125,000
office building - 125,000 1 125,000
maintenance building - 125,000 1 125,000
vehicles & further equipment
front end loader - 125,000 2 250,000
dozer - 125,000 2 250,000
fork lifter - 85,000 2 170,000
water spray truck - 75,000 1 75,000
container - 6,500 6 39,000
total 8,239,370

XXXV
Options 3and 4. Biological drying with RDF and stabilized material production
component unit/dimensio
n unit price quantity investment cost Ci
to be specified [Euro/unit ] no. of units
[Euro/unit ]
mechanical treatment
manual sorting (conveyor) - 75,000 2 150,000
magnetic separator - 75,000 4 300,000
air separator - 115,000 1 115,000
crushing / shredding (household waste) - 500,000 2 1,000,000
sieving - 625,000 3 1,875,000
waste drying
blower and cover system tons 30 6 180
compost turner - 500,000 4 2,000,000
biological treatment
rotting system (container, box, tunnel, etc.) m³ 125 6 750
blower tons 1,900 4 7,600
RDF treatment system (refuse derived fuel)
crushing / shredding - 500,000 1 500,000
near infrared sorting - 190 1 190
ballistic separation - 125,000 1 125,000
infrastructure
security fence m 60 5,000 300,000
signage placed along the fence m 25 5,000 125,000
truck scale and associated computer system - 125,000 1 125,000
gatehouse - 25,000 1 25,000
waste reception hall m² 190 8,000 1,520,000
treatment hall m² 190 15,000 2,850,000
rain water storage tank m³ 75 1,000 75,000
fire protection equipment - 125,000 1 125,000
office building - 125,000 1 125,000
maintenance building - 125,000 1 125,000
vehicles & further equipment
front end loader - 125,000 6 750,000
dozer - 125,000 4 500,000
fork lifter - 85,000 2 170,000
water spray truck - 75,000 2 150,000
container - 6,500 10 65,000
total 13,103,720
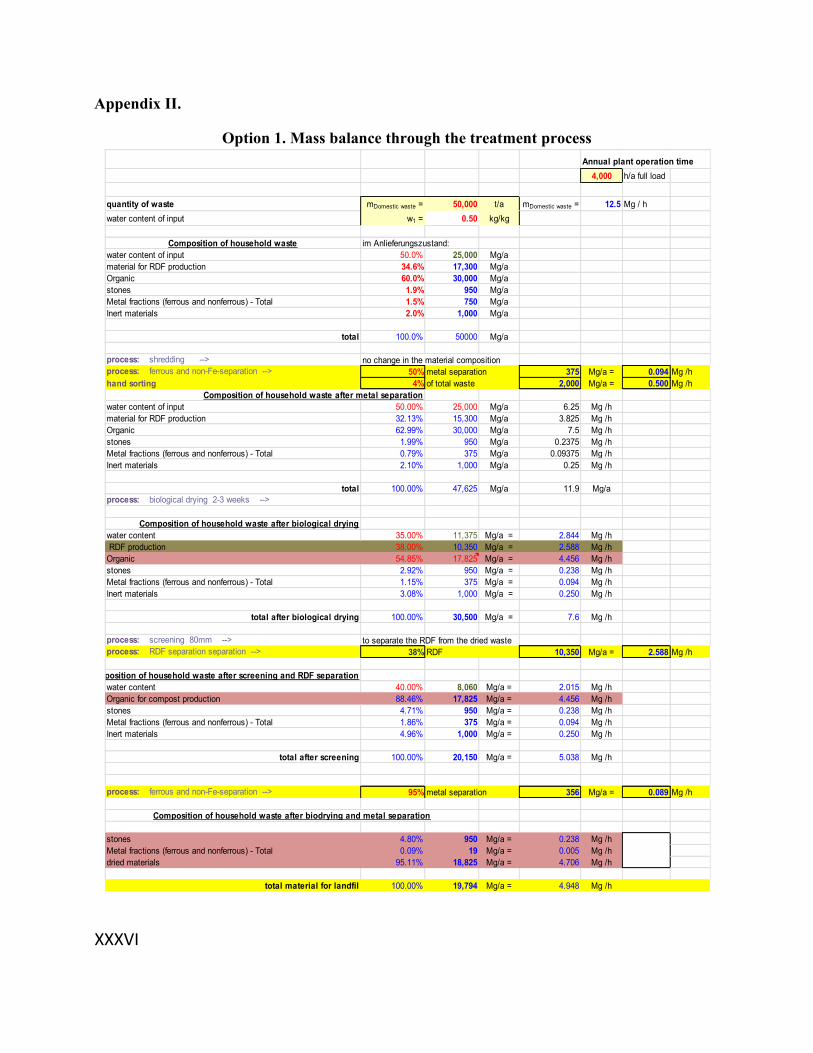
XXXVI
Appendix II.
Option 1. Mass balance through the treatment process
Annual plant operation time
4,000 h/a full load
quantity of waste mDomestic waste = 50,000 t/a mDomestic waste = 12.5 Mg / h
water content of input w1 = 0.50 kg/kg
Composition of household waste im Anlieferungszustand:
water content of input 50.0% 25,000 Mg/a
material for RDF production 34.6% 17,300 Mg/a
Organic 60.0% 30,000 Mg/a
stones 1.9% 950 Mg/a
Metal fractions (ferrous and nonferrous) - Total 1.5% 750 Mg/a
Inert materials 2.0% 1,000 Mg/a
total 100.0% 50000 Mg/a
process: shredding --> no change in the material composition
process: ferrous and non-Fe-separation --> 50% metal separation 375 Mg/a = 0.094 Mg /h
hand sorting 4% of total waste 2,000 Mg/a = 0.500 Mg /h
Composition of household waste after metal separation
water content of input 50.00% 25,000 Mg/a 6.25 Mg /h
material for RDF production 32.13% 15,300 Mg/a 3.825 Mg /h
Organic 62.99% 30,000 Mg/a 7.5 Mg /h
stones 1.99% 950 Mg/a 0.2375 Mg /h
Metal fractions (ferrous and nonferrous) - Total 0.79% 375 Mg/a 0.09375 Mg /h
Inert materials 2.10% 1,000 Mg/a 0.25 Mg /h
total 100.00% 47,625 Mg/a 11.9 Mg/a
process: biological drying 2-3 weeks -->
Composition of household waste after biological drying
water content 35.00% 11,375 Mg/a = 2.844 Mg /h
RDF production 38.00% 10,350 Mg/a = 2.588 Mg /h
Organic 54.85% 17,825 Mg/a = 4.456 Mg /h
stones 2.92% 950 Mg/a = 0.238 Mg /h
Metal fractions (ferrous and nonferrous) - Total 1.15% 375 Mg/a = 0.094 Mg /h
Inert materials 3.08% 1,000 Mg/a = 0.250 Mg /h
total after biological drying 100.00% 30,500 Mg/a = 7.6 Mg /h
process: screening 80mm --> to separate the RDF from the dried waste
process: RDF separation separation --> 38% RDF 10,350 Mg/a = 2.588 Mg /h
Composition of household waste after screening and RDF separation
water content 40.00% 8,060 Mg/a = 2.015 Mg /h
Organic for compost production 88.46% 17,825 Mg/a = 4.456 Mg /h
stones 4.71% 950 Mg/a = 0.238 Mg /h
Metal fractions (ferrous and nonferrous) - Total 1.86% 375 Mg/a = 0.094 Mg /h
Inert materials 4.96% 1,000 Mg/a = 0.250 Mg /h
total after screening 100.00% 20,150 Mg/a = 5.038 Mg /h
process: ferrous and non-Fe-separation --> 95% metal separation 356 Mg/a = 0.089 Mg /h
stones 4.80% 950 Mg/a = 0.238 Mg /h
Metal fractions (ferrous and nonferrous) - Total 0.09% 19 Mg/a = 0.005 Mg /h
dried materials 95.11% 18,825 Mg/a = 4.706 Mg /h
total material for landfil 100.00% 19,794 Mg/a = 4.948 Mg /h
Composition of household waste after biodrying and metal separation

XXXVII
Option 2. Mass balance through the treatment process
Annual plant operation time
4,000 h/a full load
quantity of waste mDomestic waste = 100,000 t/a mDomestic waste = 25 Mg / h
water content of input w1 = 0.50 kg/kg
Composition of household waste im Anlieferungszustand:
water content of input 50.0% 50,000 Mg/a
material for RDF production 34.6% 34,600 Mg/a
Organic 60.0% 60,000 Mg/a
stones 1.9% 1,900 Mg/a
Metal fractions (ferrous and nonferrous) - Total 1.5% 1,500 Mg/a
Inert materials 2.0% 2,000 Mg/a
total 100.0% 100000 Mg/a
process: shredding --> no change in the material composition
process: ferrous and non-Fe-separation --> 50% metal separation 750 Mg/a = 0.188 Mg /h
hand sorting 4% of total waste 4,000 Mg/a = 1.000 Mg /h
Composition of household waste after metal separation
water content of input 50.00% 50,000 Mg/a 12.5 Mg /h
material for RDF production 32.13% 30,600 Mg/a 7.65 Mg /h
Organic 62.99% 60,000 Mg/a 15 Mg /h
stones 1.99% 1,900 Mg/a 0.475 Mg /h
Metal fractions (ferrous and nonferrous) - Total 0.79% 750 Mg/a 0.1875 Mg /h
Inert materials 2.10% 2,000 Mg/a 0.5 Mg /h
total 100.00% 95,250 Mg/a 23.8 Mg/a
process: biological drying 2-3 weeks -->
Composition of household waste after biological drying
water content 35.00% 22,750 Mg/a = 5.688 Mg /h
RDF production 38.00% 20,700 Mg/a = 5.175 Mg /h
Organic 54.85% 35,650 Mg/a = 8.913 Mg /h
stones 2.92% 1,900 Mg/a = 0.475 Mg /h
Metal fractions (ferrous and nonferrous) - Total 1.15% 750 Mg/a = 0.188 Mg /h
Inert materials 3.08% 2,000 Mg/a = 0.500 Mg /h
total after biological drying 100.00% 61,000 Mg/a = 15.3 Mg /h
process: screening 80mm --> to separate the RDF from the dried waste
process: RDF separation separation --> 38% RDF 20,700 Mg/a = 5.175 Mg /h
Composition of household waste after screening and RDF separation
water content 40.00% 16,120 Mg/a = 4.030 Mg /h
Organic for compost production 88.46% 35,650 Mg/a = 8.913 Mg /h
stones 4.71% 1,900 Mg/a = 0.475 Mg /h
Metal fractions (ferrous and nonferrous) - Total 1.86% 750 Mg/a = 0.188 Mg /h
Inert materials 4.96% 2,000 Mg/a = 0.500 Mg /h
total after screening 100.00% 40,300 Mg/a = 10.075 Mg /h
process: ferrous and non-Fe-separation --> 95% metal separation 713 Mg/a = 0.178 Mg /h
stones 4.80% 1,900 Mg/a = 0.475 Mg /h
Metal fractions (ferrous and nonferrous) - Total 0.09% 38 Mg/a = 0.009 Mg /h
dried materials 95.11% 37,650 Mg/a = 9.413 Mg /h
total material for landfil 100.00% 39,588 Mg/a = 9.897 Mg /h
Composition of household waste after biodrying and metal separation

XXXVIII
Option 3. Mass balance through the treatment process
Annual plant operation time
4,000 h/a full load
quantity of waste mDomestic waste = 100,000 t/a mDomestic waste = 25 Mg / h
water content of input w1 = 0.50 kg/kg
Composition of household waste im Anlieferungszustand:
water content of input 50.0% 50,000 Mg/a
material for RDF production 34.6% 34,600 Mg/a
Organic 60.0% 60,000 Mg/a
stones 1.9% 1,900 Mg/a
Metal fractions (ferrous and nonferrous) - Total 1.5% 1,500 Mg/a
Inert materials 2.0% 2,000 Mg/a
total 100.0% 100000 Mg/a
process: shredding --> no change in the material composition
process: ferrous and non-Fe-separation --> 50% metal separation 750 Mg/a = 0.188 Mg /h
hand sorting 4% of total waste 4,000 Mg/a = 1.000 Mg /h
Composition of household waste after metal separation
water content of input 50.00% 50,000 Mg/a 12.5 Mg /h
material for RDF production 32.13% 30,600 Mg/a 7.65 Mg /h
Organic 62.99% 60,000 Mg/a 15 Mg /h
stones 1.99% 1,900 Mg/a 0.475 Mg /h
Metal fractions (ferrous and nonferrous) - Total 0.79% 750 Mg/a 0.1875 Mg /h
Inert materials 2.10% 2,000 Mg/a 0.5 Mg /h
total 100.00% 95,250 Mg/a 23.8 Mg/a
process: biological drying 2-3 weeks -->
Composition of household waste after biological drying
water content 35.00% 22,750 Mg/a = 5.688 Mg /h
RDF production 38.00% 20,700 Mg/a = 5.175 Mg /h
Organic 54.85% 35,650 Mg/a = 8.913 Mg /h
stones 2.92% 1,900 Mg/a = 0.475 Mg /h
Metal fractions (ferrous and nonferrous) - Total 1.15% 750 Mg/a = 0.188 Mg /h
Inert materials 3.08% 2,000 Mg/a = 0.500 Mg /h
total after biological drying 100.00% 61,000 Mg/a = 15.3 Mg /h
process: screening 80mm --> to separate the RDF from the dried waste
process: RDF separation separation --> 38% RDF 20,700 Mg/a = 5.175 Mg /h
Composition of household waste after screening and RDF separation
water content 40.00% 16,120 Mg/a = 4.030 Mg /h
Organic for compost production 88.46% 35,650 Mg/a = 8.913 Mg /h
stones 4.71% 1,900 Mg/a = 0.475 Mg /h
Metal fractions (ferrous and nonferrous) - Total 1.86% 750 Mg/a = 0.188 Mg /h
Inert materials 4.96% 2,000 Mg/a = 0.500 Mg /h
total after screening 100.00% 40,300 Mg/a = 10.075 Mg /h
process: composting 6-8 weeks -->
Composition of household waste after composting
water content 40.00% 16,120 Mg/a = 4.030 Mg /h
Organic for compost production 86.70% 30,303 Mg/a = 7.576 Mg /h
stones 5.44% 1,900 Mg/a = 0.475 Mg /h
Metal fractions (ferrous and nonferrous) - Total 2.15% 750 Mg/a = 0.188 Mg /h
Inert materials 5.72% 2,000 Mg/a = 0.500 Mg /h
total after composting 100.00% 34,953 Mg/a = 8.738 Mg /h
process: ferrous and non-Fe-separation --> 95% metal separation 713 Mg/a = 0.178 Mg /h
stones 5.55% 1,900 Mg/a = 0.475 Mg /h
Metal fractions (ferrous and nonferrous) - Total 0.11% 38 Mg/a = 0.009 Mg /h
Inert materials 94.34% 32,303 Mg/a = 8.076 Mg /h
total material for landfil 100.00% 34,240 Mg/a = 8.560 Mg /h
Composition of household waste afterstabilization and metal separation

XXXIX
Option 2. Mass balance through the treatment process
Annual plant operation time
4,000 h/a full load
quantity of waste mDomestic waste = 100,000 t/a mDomestic waste = 25 Mg / h
water content of input w1 = 0.50 kg/kg
Composition of household waste im Anlieferungszustand:
water content of input 50.0% 50,000 Mg/a
material for RDF production 34.6% 34,600 Mg/a
Organic 60.0% 60,000 Mg/a
stones 1.9% 1,900 Mg/a
Metal fractions (ferrous and nonferrous) - Total 1.5% 1,500 Mg/a
Inert materials 2.0% 2,000 Mg/a
total 100.0% 100000 Mg/a
process: shredding --> no change in the material composition
process: ferrous and non-Fe-separation --> 50% metal separation 750 Mg/a = 0.188 Mg /h
hand sorting 4% of total waste 4,000 Mg/a = 1.000 Mg /h
Composition of household waste after metal separation
water content of input 50.00% 50,000 Mg/a 12.5 Mg /h
material for RDF production 32.13% 30,600 Mg/a 7.65 Mg /h
Organic 62.99% 60,000 Mg/a 15 Mg /h
stones 1.99% 1,900 Mg/a 0.475 Mg /h
Metal fractions (ferrous and nonferrous) - Total 0.79% 750 Mg/a 0.1875 Mg /h
Inert materials 2.10% 2,000 Mg/a 0.5 Mg /h
total 100.00% 95,250 Mg/a 23.8 Mg/a
process: biological drying 2-3 weeks -->
Composition of household waste after biological drying
water content 35.00% 22,750 Mg/a = 5.688 Mg /h
RDF production 38.00% 20,700 Mg/a = 5.175 Mg /h
Organic 54.85% 35,650 Mg/a = 8.913 Mg /h
stones 2.92% 1,900 Mg/a = 0.475 Mg /h
Metal fractions (ferrous and nonferrous) - Total 1.15% 750 Mg/a = 0.188 Mg /h
Inert materials 3.08% 2,000 Mg/a = 0.500 Mg /h
total after biological drying 100.00% 61,000 Mg/a = 15.3 Mg /h
process: screening 80mm --> to separate the RDF from the dried waste
process: RDF separation separation --> 38% RDF 20,700 Mg/a = 5.175 Mg /h
Composition of household waste after screening and RDF separation
water content 40.00% 16,120 Mg/a = 4.030 Mg /h
Organic for compost production 88.46% 35,650 Mg/a = 8.913 Mg /h
stones 4.71% 1,900 Mg/a = 0.475 Mg /h
Metal fractions (ferrous and nonferrous) - Total 1.86% 750 Mg/a = 0.188 Mg /h
Inert materials 4.96% 2,000 Mg/a = 0.500 Mg /h
total after screening 100.00% 40,300 Mg/a = 10.075 Mg /h
process: composting 6-8 weeks -->
Composition of household waste after composting
water content 40.00% 16,120 Mg/a = 4.030 Mg /h
Organic for compost production 86.70% 30,303 Mg/a = 7.576 Mg /h
stones 5.44% 1,900 Mg/a = 0.475 Mg /h
Metal fractions (ferrous and nonferrous) - Total 2.15% 750 Mg/a = 0.188 Mg /h
Inert materials 5.72% 2,000 Mg/a = 0.500 Mg /h
total after composting 100.00% 34,953 Mg/a = 8.738 Mg /h
process: screening 10mm --> compost <10mm 70% of organics 21,212 Mg/a = 5.303 Mg /h
process: ferrous and non-Fe-separation --> 95% metal separation 713 Mg/a = 0.178 Mg /h
stones 48.25% 1,900 Mg/a = 0.475 Mg /h
Metal fractions (ferrous and nonferrous) - Total 0.95% 38 Mg/a = 0.009 Mg /h
Inert materials 50.79% 2,000 Mg/a = 0.500 Mg /h
total material for landfil 100.00% 3,938 Mg/a = 0.984 Mg /h
Composition of household waste afterstabilization and metal separation