Embed Size (px)
Citation preview
lable at ScienceDirect
Acta Materialia 113 (2016) 311e319
Contents lists avai
Acta Materialia
journal homepage: www.elsevier .com/locate/actamat
Full length article
From electronic structure to phase diagrams: A bottom-up approachto understand the stability of titaniumetransition metal alloys
Liang-Feng Huang a, b, Blazej Grabowski a, *, Jian Zhang c, Min-Jie Lai a, C. Cem Tasan d,Stefanie Sandl€obes e, Dierk Raabe a, J€org Neugebauer a
a Max-Planck-Institut für Eisenforschung GmbH, 40237 Düsseldorf, Germanyb Department of Materials Science and Engineering, Northwestern University, Evanston, IL 60208, United Statesc State Key Laboratory for Mechanical Behavior of Materials, Xi’an Jiaotong University, Xi’an 710049, Chinad Department of Materials Science and Engineering, MIT, Cambridge, MA 02139, United Statese Institut für Metallkunde und Metallphysik, RWTH Aachen, Kopernikusstr. 14, 52074 Aachen, Germany
a r t i c l e i n f o
Article history:Received 1 April 2016Received in revised form26 April 2016Accepted 30 April 2016Available online 13 May 2016
Keywords:Titanium alloysTransition metalStabilityPhase diagramDensity functional theory
* Corresponding author.E-mail address: [email protected] (B. Grabows
http://dx.doi.org/10.1016/j.actamat.2016.04.0591359-6454/© 2016 Acta Materialia Inc. Published by End/4.0/).
a b s t r a c t
We have computed formation energies for all technologically relevant transition metal solutes in the a, b,and u phases of Ti, employing ab initio simulations. We analyze and explain their periodic-table trends,and from their differences we derive stabilization energies which provide direct insight into phasestabilization effects of the various solutes with respect to a, b, and u. This allows us to identify strong b
stabilizers in the middle of each electronic d shell in consistency with experimental knowledge. Based onan extension of the stabilization energies to free energies we derive a wide range of Ti-transition metalphase diagrams. A detailed comparison to available experimental martensitic transformation tempera-tures and to measurements performed in this study shows that, despite some quantitative discrepancies,the qualitative trends can be expected to be correct. An important feature that is displayed by a limitedrange of the computed phase diagrams is a triple point at which the three phases, a, b, and u, meet. Thisinsight provides a plausible explanation for the complexity observed in gum metals, a class of Ti alloyswith very special materials properties.© 2016 Acta Materialia Inc. Published by Elsevier Ltd. This is an open access article under the CC BY-NC-
ND license (http://creativecommons.org/licenses/by-nc-nd/4.0/).
1. Introduction
Titanium alloys are widely applied as structural materials inaerospace and biomedicine, due to their variable elastic modulus,excellent corrosion and wear resistance, light weight, goodductility, and high biocompatibility [1e6]. To satisfy the increasingtechnological and industrial requirements, the mechanical, ther-modynamic, and chemical properties of Ti alloys continue to beunder intensive experimental and theoretical investigation, withthe goal of achieving highly optimized material properties.
Transition metals (TMs) are among the most important alloyingelements in Ti alloys, because their s, p, and d electrons can haveprofound influence on various properties. For example, it is wellknown that the elastic modulus, plasticity, and shape memorybehavior can be effectively tuned by TM additions [1e4,7e15]. Acrucial ingredient enabling this versatile behavior are the three
ki).
lsevier Ltd. This is an open access
phases a, b, and u [16,17], the stabilities of which can be effectivelytuned by the TM solutes. The details of the phase stabilities and theresulting mechanical properties of the Ti alloys critically depend onthe atomic number of the added TM atoms [1,2,18e23]. This istypically explained using approximate empirical correlations withthe electron valence number [24e30]. However, these empiricalcorrelations can be invalid [20,31e35], and thus further explicitinvestigations are required to better understand the phase stabilitydependencies for complementing experimental data.
In this work, a bottom-up approach rooted in ab initio simula-tions is used to reveal the periodic-table trends in the stabilities ofthe a, b, and u phases in all technologically relevant TieTM alloys.We employ density functional theory to compute the formationand stabilization energies of all the TM solutes in the three Tiphases. Investigating the stabilization energies provides cleartrends as a function of the electron valence number that can beexplained in terms of a coordination-number argument inconjunction with a simple bonding model. Extending the stabili-zation energies to free energies enables us to compute awide range
article under the CC BY-NC-ND license (http://creativecommons.org/licenses/by-nc-
L.-F. Huang et al. / Acta Materialia 113 (2016) 311e319312
of TieTM phase diagrams that we carefully validate by comparingwith experimentally available martensitic transformation temper-atures from literature and as obtained in this study. Finally, weapply the computed phase diagrams to analyze the complexdeformation behavior in gummetals, a special class of Ti alloys withpromising properties.
2. Methodology
2.1. Computation of the TM solute formation energy
A central quantity determining phase stabilities in TieTM alloysis the formation energy, EaX , defined as
EaX ¼ EanTiþX � nEaTi � mX ; (1)
where a is an index running over the three phases a, b, and u, X isan index running over all TM solutes, EanTiþX is the total energy of asupercell in phase awith n Ti atoms andwith one substitutional TMatom, EaTi is the total energy per atom of a pure Ti supercell in phasea, and mX is the chemical potential of the TM solute. The formationenergy in Eq. (1) measures the energetic preference of a TM soluteto dissolve in one of the Ti phases a, b, or u with respect to thechemical potential mX. A negative formation energy indicates thatthe reaction is exothermic and thus that the incorporation of theTM solute will take place.
A typical choice to reference the chemical potential mX are thestable bulk phases of the alloyed elements (e.g., hcp for Zr, bcc forMo, or fcc for Ag). However, for the present purpose of revealingchemical trends of alloying to the Ti matrix, the stable bulk phasesare not a good reference because of the strongly varying inter-atomic bonding across the d series. A more suitable choice arethe energies of the isolated TM atoms (in particular after sub-tracting the contribution due to atomic magnetism, cf. Fig.1 below),revealing clear chemical dependencies and trends. It should benoted that for phase stabilities the choice of the chemical potentialis not critical as it cancels from the corresponding energydifferences.
For determining phase stabilities we consider in particularformation-energy differences according to
Ea�bX ¼
�EaX � EbX
���EaTi � EbTi
�; (2)
where a and b (with as b) are indices running over the phases a, b,and u. By subtracting the term ðEaTi � EbTiÞ in Eq. (2) we have
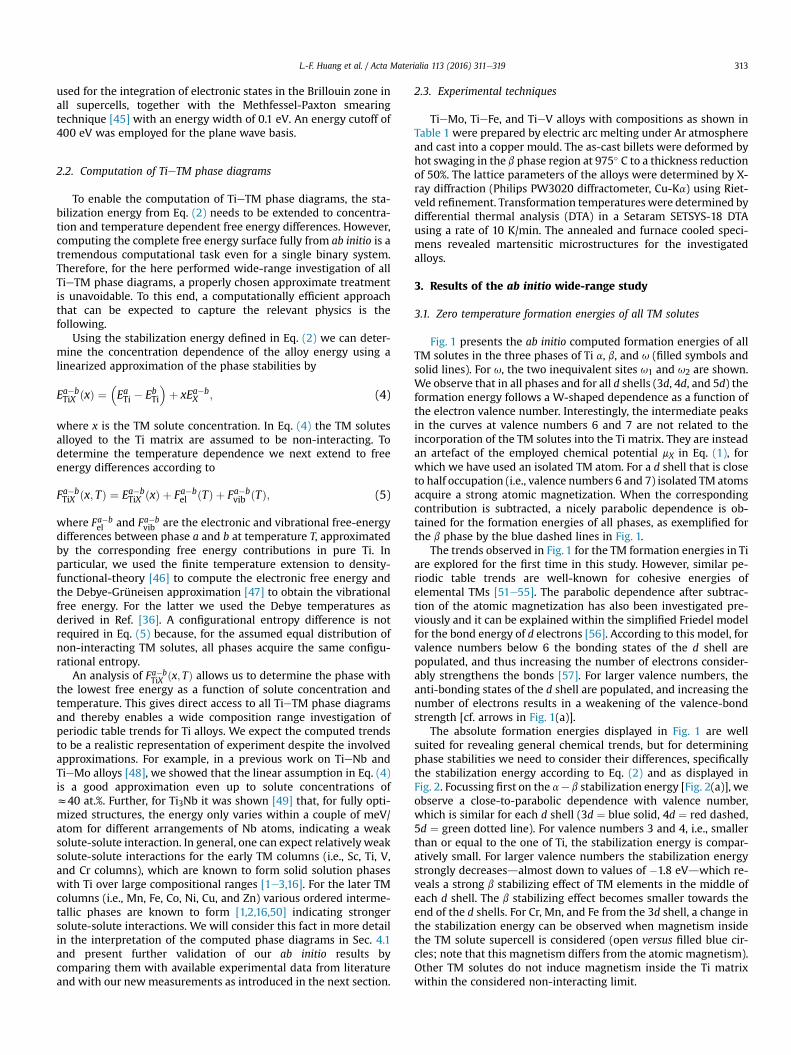
Fig. 1. Ab initio computed formation energies of all (a) 3d, (b) 4d, and (c) 5d TM solutes in a,inequivalent sites, u1 and u2, are shown. For b, an additional formation energy is shown (blum�x was used in Eq. (1) that excludes the effect of atomic magnetization (blue shaded area). (Fto the web version of this article.)
excluded the intrinsic energy difference between the a and bphases of pure Ti. Doing so, Ea�b
X , which we will call stabilizationenergy, becomes a useful descriptor having a one-to-one corre-spondence to the strength with which a TM solute stabilizes acertain phase (e.g., whether it is a b stabilizer).
The computation of the formation energy, EuX , for the u phase iscomplicated by the fact that this phase has two symmetricallyinequivalent sublattices. The corresponding sites are the trigonal,u1, and the honeycomb, u2, site corresponding to 1=3 and 2=3 of allu lattice sites, respectively. To take this properly into account, wehave computed the formation energies for both sites, Eu1
X and Eu2X ,
for all TM solutes from which we then determined
EuX ¼ 13Eu1X þ 2
3Eu2X ; (3)
corresponding to the averaged formation energy in u for fullyrandomly distributed TM solutes. Experimentally the average in Eq.(3) represents a rapid quenching from the high temperature b tothe low temperature u field, for which the TM solutes are kineti-cally hindered to redistribute to the more favorable sites and toform ordered intermetallic phases.
The computation of the formation energy, EbX , for the b phase iscomplicated by the fact that this phase is dynamically unstable inpure Ti at low temperatures [36e39]. As a consequence, intro-ducing a TM solute leads to local relaxations away from the bcclattice sites. In a real system, these local relaxations are removed atfinite temperatures where phonon-phonon interactions are able tostabilize the system on the bcc lattice positions. Since an explicittreatment of phonon-phonon interactions is computationally pro-hibitive for a wide composition range investigation, we haveemployed a computational trick as utilized previously in Ref. [40]:In the b phase only the coordination neighbors of the solute areallowed to relax (coordination-neighbor relaxation). Thiscoordination-neighbor relaxation ensures that all atoms remainclose to their bcc lattice positions, but it still provides enoughflexibility to release the main portion of the relaxation energy.
All formation energies EaX were calculated using density func-tional theory as implemented in the VASP code [41]. The projectoraugmented wave method [42,43] was used to describe the elec-tronic wavefunctions, and the PBE [44] functional for the electronicexchange and correlation. Spin polarization was included for themagnetic elements. Supercells of 5� 5� 3, 4� 4� 4, and 3� 3� 5times the conventional a, b, and u unit cells were employed for theTM solute supercell calculations. A k-point grid of 5 � 5 � 5 was
b, and u Ti according to Eq. (1). For u, formation energies for each of the symmetricallye open squares and dashed line) for which a modified, non-magnetic chemical potentialor interpretation of the references to colour in this figure legend, the reader is referred
L.-F. Huang et al. / Acta Materialia 113 (2016) 311e319 313
used for the integration of electronic states in the Brillouin zone inall supercells, together with the Methfessel-Paxton smearingtechnique [45] with an energy width of 0.1 eV. An energy cutoff of400 eV was employed for the plane wave basis.
2.2. Computation of TieTM phase diagrams
To enable the computation of TieTM phase diagrams, the sta-bilization energy from Eq. (2) needs to be extended to concentra-tion and temperature dependent free energy differences. However,computing the complete free energy surface fully from ab initio is atremendous computational task even for a single binary system.Therefore, for the here performed wide-range investigation of allTieTM phase diagrams, a properly chosen approximate treatmentis unavoidable. To this end, a computationally efficient approachthat can be expected to capture the relevant physics is thefollowing.
Using the stabilization energy defined in Eq. (2) we can deter-mine the concentration dependence of the alloy energy using alinearized approximation of the phase stabilities by
Ea�bTiX ðxÞ ¼
�EaTi � EbTi
�þ xEa�b
X ; (4)
where x is the TM solute concentration. In Eq. (4) the TM solutesalloyed to the Ti matrix are assumed to be non-interacting. Todetermine the temperature dependence we next extend to freeenergy differences according to
Fa�bTiX ðx; TÞ ¼ Ea�b
TiX ðxÞ þ Fa�bel ðTÞ þ Fa�b
vib ðTÞ; (5)
where Fa�bel and Fa�b
vib are the electronic and vibrational free-energydifferences between phase a and b at temperature T, approximatedby the corresponding free energy contributions in pure Ti. Inparticular, we used the finite temperature extension to density-functional-theory [46] to compute the electronic free energy andthe Debye-Grüneisen approximation [47] to obtain the vibrationalfree energy. For the latter we used the Debye temperatures asderived in Ref. [36]. A configurational entropy difference is notrequired in Eq. (5) because, for the assumed equal distribution ofnon-interacting TM solutes, all phases acquire the same configu-rational entropy.
An analysis of Fa�bTiX ðx; TÞ allows us to determine the phase with
the lowest free energy as a function of solute concentration andtemperature. This gives direct access to all TieTM phase diagramsand thereby enables a wide composition range investigation ofperiodic table trends for Ti alloys. We expect the computed trendsto be a realistic representation of experiment despite the involvedapproximations. For example, in a previous work on TieNb andTieMo alloys [48], we showed that the linear assumption in Eq. (4)is a good approximation even up to solute concentrations ofz40 at.%. Further, for Ti3Nb it was shown [49] that, for fully opti-mized structures, the energy only varies within a couple of meV/atom for different arrangements of Nb atoms, indicating a weaksolute-solute interaction. In general, one can expect relatively weaksolute-solute interactions for the early TM columns (i.e., Sc, Ti, V,and Cr columns), which are known to form solid solution phaseswith Ti over large compositional ranges [1e3,16]. For the later TMcolumns (i.e., Mn, Fe, Co, Ni, Cu, and Zn) various ordered interme-tallic phases are known to form [1,2,16,50] indicating strongersolute-solute interactions. We will consider this fact in more detailin the interpretation of the computed phase diagrams in Sec. 4.1and present further validation of our ab initio results bycomparing them with available experimental data from literatureand with our newmeasurements as introduced in the next section.
2.3. Experimental techniques
TieMo, TieFe, and TieV alloys with compositions as shown inTable 1 were prepared by electric arc melting under Ar atmosphereand cast into a copper mould. The as-cast billets were deformed byhot swaging in the b phase region at 975� C to a thickness reductionof 50%. The lattice parameters of the alloys were determined by X-ray diffraction (Philips PW3020 diffractometer, Cu-Ka) using Riet-veld refinement. Transformation temperatures were determined bydifferential thermal analysis (DTA) in a Setaram SETSYS-18 DTAusing a rate of 10 K/min. The annealed and furnace cooled speci-mens revealed martensitic microstructures for the investigatedalloys.
3. Results of the ab initio wide-range study
3.1. Zero temperature formation energies of all TM solutes
Fig. 1 presents the ab initio computed formation energies of allTM solutes in the three phases of Ti a, b, and u (filled symbols andsolid lines). For u, the two inequivalent sites u1 and u2 are shown.We observe that in all phases and for all d shells (3d, 4d, and 5d) theformation energy follows a W-shaped dependence as a function ofthe electron valence number. Interestingly, the intermediate peaksin the curves at valence numbers 6 and 7 are not related to theincorporation of the TM solutes into the Ti matrix. They are insteadan artefact of the employed chemical potential mX in Eq. (1), forwhich we have used an isolated TM atom. For a d shell that is closeto half occupation (i.e., valence numbers 6 and 7) isolated TM atomsacquire a strong atomic magnetization. When the correspondingcontribution is subtracted, a nicely parabolic dependence is ob-tained for the formation energies of all phases, as exemplified forthe b phase by the blue dashed lines in Fig. 1.
The trends observed in Fig. 1 for the TM formation energies in Tiare explored for the first time in this study. However, similar pe-riodic table trends are well-known for cohesive energies ofelemental TMs [51e55]. The parabolic dependence after subtrac-tion of the atomic magnetization has also been investigated pre-viously and it can be explained within the simplified Friedel modelfor the bond energy of d electrons [56]. According to this model, forvalence numbers below 6 the bonding states of the d shell arepopulated, and thus increasing the number of electrons consider-ably strengthens the bonds [57]. For larger valence numbers, theanti-bonding states of the d shell are populated, and increasing thenumber of electrons results in a weakening of the valence-bondstrength [cf. arrows in Fig. 1(a)].
The absolute formation energies displayed in Fig. 1 are wellsuited for revealing general chemical trends, but for determiningphase stabilities we need to consider their differences, specificallythe stabilization energy according to Eq. (2) and as displayed inFig. 2. Focussing first on the ae b stabilization energy [Fig. 2(a)], weobserve a close-to-parabolic dependence with valence number,which is similar for each d shell (3d ¼ blue solid, 4d ¼ red dashed,5d ¼ green dotted line). For valence numbers 3 and 4, i.e., smallerthan or equal to the one of Ti, the stabilization energy is compar-atively small. For larger valence numbers the stabilization energystrongly decreasesdalmost down to values of �1.8 eVdwhich re-veals a strong b stabilizing effect of TM elements in the middle ofeach d shell. The b stabilizing effect becomes smaller towards theend of the d shells. For Cr, Mn, and Fe from the 3d shell, a change inthe stabilization energy can be observed when magnetism insidethe TM solute supercell is considered (open versus filled blue cir-cles; note that this magnetism differs from the atomic magnetism).Other TM solutes do not induce magnetism inside the Ti matrixwithin the considered non-interacting limit.
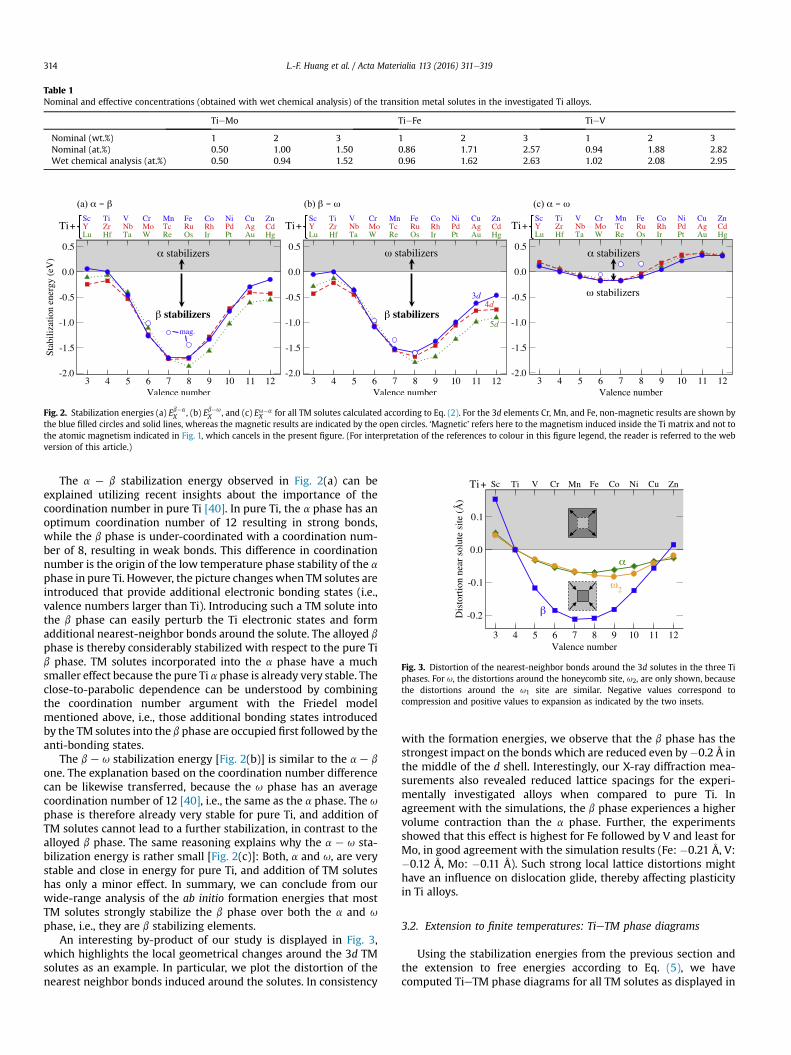
Table 1Nominal and effective concentrations (obtained with wet chemical analysis) of the transition metal solutes in the investigated Ti alloys.
TieMo TieFe TieV
Nominal (wt.%) 1 2 3 1 2 3 1 2 3Nominal (at.%) 0.50 1.00 1.50 0.86 1.71 2.57 0.94 1.88 2.82Wet chemical analysis (at.%) 0.50 0.94 1.52 0.96 1.62 2.63 1.02 2.08 2.95
Fig. 2. Stabilization energies (a) Eb�aX , (b) Eb�u
X , and (c) Eu�aX for all TM solutes calculated according to Eq. (2). For the 3d elements Cr, Mn, and Fe, non-magnetic results are shown by
the blue filled circles and solid lines, whereas the magnetic results are indicated by the open circles. ‘Magnetic’ refers here to the magnetism induced inside the Ti matrix and not tothe atomic magnetism indicated in Fig. 1, which cancels in the present figure. (For interpretation of the references to colour in this figure legend, the reader is referred to the webversion of this article.)
Fig. 3. Distortion of the nearest-neighbor bonds around the 3d solutes in the three Tiphases. For u, the distortions around the honeycomb site, u2, are only shown, becausethe distortions around the u1 site are similar. Negative values correspond tocompression and positive values to expansion as indicated by the two insets.
L.-F. Huang et al. / Acta Materialia 113 (2016) 311e319314
The a e b stabilization energy observed in Fig. 2(a) can beexplained utilizing recent insights about the importance of thecoordination number in pure Ti [40]. In pure Ti, the a phase has anoptimum coordination number of 12 resulting in strong bonds,while the b phase is under-coordinated with a coordination num-ber of 8, resulting in weak bonds. This difference in coordinationnumber is the origin of the low temperature phase stability of the aphase in pure Ti. However, the picture changes when TM solutes areintroduced that provide additional electronic bonding states (i.e.,valence numbers larger than Ti). Introducing such a TM solute intothe b phase can easily perturb the Ti electronic states and formadditional nearest-neighbor bonds around the solute. The alloyed b
phase is thereby considerably stabilized with respect to the pure Tib phase. TM solutes incorporated into the a phase have a muchsmaller effect because the pure Ti a phase is already very stable. Theclose-to-parabolic dependence can be understood by combiningthe coordination number argument with the Friedel modelmentioned above, i.e., those additional bonding states introducedby the TM solutes into the b phase are occupied first followed by theanti-bonding states.
The b e u stabilization energy [Fig. 2(b)] is similar to the a e b
one. The explanation based on the coordination number differencecan be likewise transferred, because the u phase has an averagecoordination number of 12 [40], i.e., the same as the a phase. The u
phase is therefore already very stable for pure Ti, and addition ofTM solutes cannot lead to a further stabilization, in contrast to thealloyed b phase. The same reasoning explains why the a e u sta-bilization energy is rather small [Fig. 2(c)]: Both, a and u, are verystable and close in energy for pure Ti, and addition of TM soluteshas only a minor effect. In summary, we can conclude from ourwide-range analysis of the ab initio formation energies that mostTM solutes strongly stabilize the b phase over both the a and u
phase, i.e., they are b stabilizing elements.An interesting by-product of our study is displayed in Fig. 3,
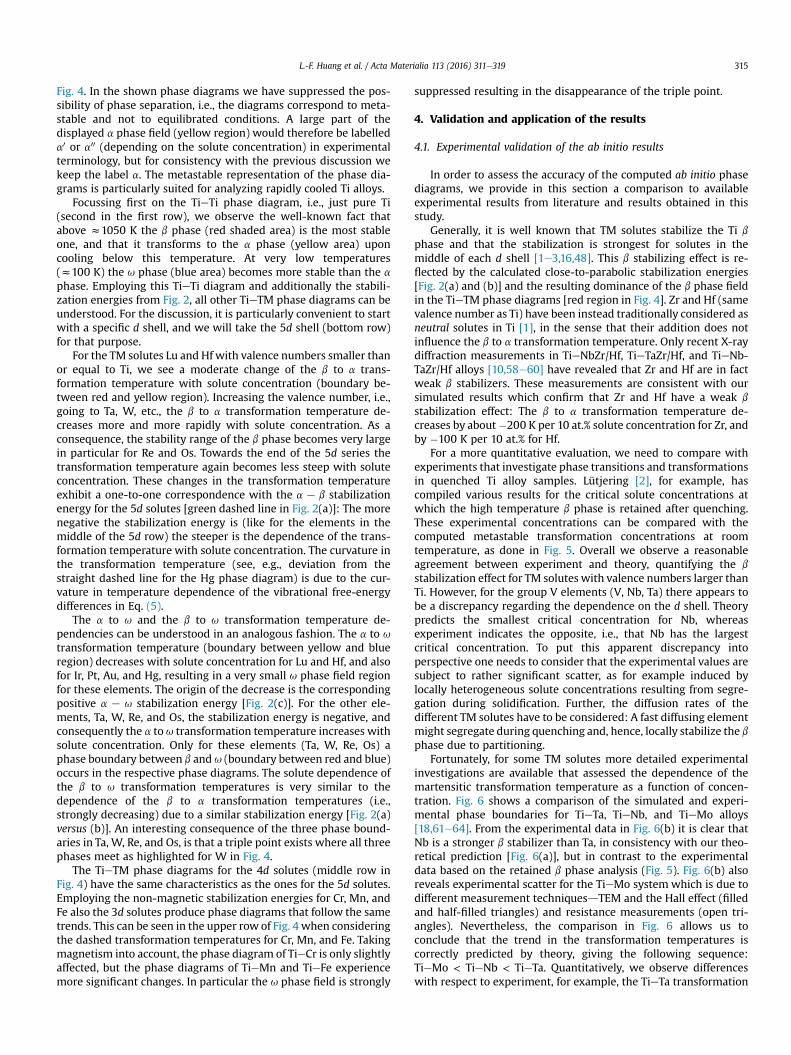
which highlights the local geometrical changes around the 3d TMsolutes as an example. In particular, we plot the distortion of thenearest neighbor bonds induced around the solutes. In consistency
with the formation energies, we observe that the b phase has thestrongest impact on the bonds which are reduced even by�0.2 Å inthe middle of the d shell. Interestingly, our X-ray diffraction mea-surements also revealed reduced lattice spacings for the experi-mentally investigated alloys when compared to pure Ti. Inagreement with the simulations, the b phase experiences a highervolume contraction than the a phase. Further, the experimentsshowed that this effect is highest for Fe followed by V and least forMo, in good agreement with the simulation results (Fe: �0.21 Å, V:�0.12 Å, Mo: �0.11 Å). Such strong local lattice distortions mighthave an influence on dislocation glide, thereby affecting plasticityin Ti alloys.
3.2. Extension to finite temperatures: TieTM phase diagrams
Using the stabilization energies from the previous section andthe extension to free energies according to Eq. (5), we havecomputed TieTM phase diagrams for all TM solutes as displayed in
L.-F. Huang et al. / Acta Materialia 113 (2016) 311e319 315
Fig. 4. In the shown phase diagrams we have suppressed the pos-sibility of phase separation, i.e., the diagrams correspond to meta-stable and not to equilibrated conditions. A large part of thedisplayed a phase field (yellow region) would therefore be labelleda0 or a00 (depending on the solute concentration) in experimentalterminology, but for consistency with the previous discussion wekeep the label a. The metastable representation of the phase dia-grams is particularly suited for analyzing rapidly cooled Ti alloys.
Focussing first on the TieTi phase diagram, i.e., just pure Ti(second in the first row), we observe the well-known fact thatabove z1050 K the b phase (red shaded area) is the most stableone, and that it transforms to the a phase (yellow area) uponcooling below this temperature. At very low temperatures(z100 K) the u phase (blue area) becomes more stable than the a
phase. Employing this TieTi diagram and additionally the stabili-zation energies from Fig. 2, all other TieTM phase diagrams can beunderstood. For the discussion, it is particularly convenient to startwith a specific d shell, and we will take the 5d shell (bottom row)for that purpose.
For the TM solutes Lu and Hf with valence numbers smaller thanor equal to Ti, we see a moderate change of the b to a trans-formation temperature with solute concentration (boundary be-tween red and yellow region). Increasing the valence number, i.e.,going to Ta, W, etc., the b to a transformation temperature de-creases more and more rapidly with solute concentration. As aconsequence, the stability range of the b phase becomes very largein particular for Re and Os. Towards the end of the 5d series thetransformation temperature again becomes less steep with soluteconcentration. These changes in the transformation temperatureexhibit a one-to-one correspondence with the a e b stabilizationenergy for the 5d solutes [green dashed line in Fig. 2(a)]: The morenegative the stabilization energy is (like for the elements in themiddle of the 5d row) the steeper is the dependence of the trans-formation temperature with solute concentration. The curvature inthe transformation temperature (see, e.g., deviation from thestraight dashed line for the Hg phase diagram) is due to the cur-vature in temperature dependence of the vibrational free-energydifferences in Eq. (5).
The a to u and the b to u transformation temperature de-pendencies can be understood in an analogous fashion. The a to u
transformation temperature (boundary between yellow and blueregion) decreases with solute concentration for Lu and Hf, and alsofor Ir, Pt, Au, and Hg, resulting in a very small u phase field regionfor these elements. The origin of the decrease is the correspondingpositive a e u stabilization energy [Fig. 2(c)]. For the other ele-ments, Ta, W, Re, and Os, the stabilization energy is negative, andconsequently the a to u transformation temperature increases withsolute concentration. Only for these elements (Ta, W, Re, Os) aphase boundary between b and u (boundary between red and blue)occurs in the respective phase diagrams. The solute dependence ofthe b to u transformation temperatures is very similar to thedependence of the b to a transformation temperatures (i.e.,strongly decreasing) due to a similar stabilization energy [Fig. 2(a)versus (b)]. An interesting consequence of the three phase bound-aries in Ta, W, Re, and Os, is that a triple point exists where all threephases meet as highlighted for W in Fig. 4.
The TieTM phase diagrams for the 4d solutes (middle row inFig. 4) have the same characteristics as the ones for the 5d solutes.Employing the non-magnetic stabilization energies for Cr, Mn, andFe also the 3d solutes produce phase diagrams that follow the sametrends. This can be seen in the upper row of Fig. 4 when consideringthe dashed transformation temperatures for Cr, Mn, and Fe. Takingmagnetism into account, the phase diagram of TieCr is only slightlyaffected, but the phase diagrams of TieMn and TieFe experiencemore significant changes. In particular the u phase field is strongly
suppressed resulting in the disappearance of the triple point.
4. Validation and application of the results
4.1. Experimental validation of the ab initio results
In order to assess the accuracy of the computed ab initio phasediagrams, we provide in this section a comparison to availableexperimental results from literature and results obtained in thisstudy.
Generally, it is well known that TM solutes stabilize the Ti bphase and that the stabilization is strongest for solutes in themiddle of each d shell [1e3,16,48]. This b stabilizing effect is re-flected by the calculated close-to-parabolic stabilization energies[Fig. 2(a) and (b)] and the resulting dominance of the b phase fieldin the TieTM phase diagrams [red region in Fig. 4]. Zr and Hf (samevalence number as Ti) have been instead traditionally considered asneutral solutes in Ti [1], in the sense that their addition does notinfluence the b to a transformation temperature. Only recent X-raydiffraction measurements in TieNbZr/Hf, TieTaZr/Hf, and TieNb-TaZr/Hf alloys [10,58e60] have revealed that Zr and Hf are in factweak b stabilizers. These measurements are consistent with oursimulated results which confirm that Zr and Hf have a weak b
stabilization effect: The b to a transformation temperature de-creases by about�200 K per 10 at.% solute concentration for Zr, andby �100 K per 10 at.% for Hf.
For a more quantitative evaluation, we need to compare withexperiments that investigate phase transitions and transformationsin quenched Ti alloy samples. Lütjering [2], for example, hascompiled various results for the critical solute concentrations atwhich the high temperature b phase is retained after quenching.These experimental concentrations can be compared with thecomputed metastable transformation concentrations at roomtemperature, as done in Fig. 5. Overall we observe a reasonableagreement between experiment and theory, quantifying the b
stabilization effect for TM solutes with valence numbers larger thanTi. However, for the group V elements (V, Nb, Ta) there appears tobe a discrepancy regarding the dependence on the d shell. Theorypredicts the smallest critical concentration for Nb, whereasexperiment indicates the opposite, i.e., that Nb has the largestcritical concentration. To put this apparent discrepancy intoperspective one needs to consider that the experimental values aresubject to rather significant scatter, as for example induced bylocally heterogeneous solute concentrations resulting from segre-gation during solidification. Further, the diffusion rates of thedifferent TM solutes have to be considered: A fast diffusing elementmight segregate during quenching and, hence, locally stabilize the bphase due to partitioning.
Fortunately, for some TM solutes more detailed experimentalinvestigations are available that assessed the dependence of themartensitic transformation temperature as a function of concen-tration. Fig. 6 shows a comparison of the simulated and experi-mental phase boundaries for TieTa, TieNb, and TieMo alloys[18,61e64]. From the experimental data in Fig. 6(b) it is clear thatNb is a stronger b stabilizer than Ta, in consistency with our theo-retical prediction [Fig. 6(a)], but in contrast to the experimentaldata based on the retained b phase analysis (Fig. 5). Fig. 6(b) alsoreveals experimental scatter for the TieMo system which is due todifferent measurement techniquesdTEM and the Hall effect (filledand half-filled triangles) and resistance measurements (open tri-angles). Nevertheless, the comparison in Fig. 6 allows us toconclude that the trend in the transformation temperatures iscorrectly predicted by theory, giving the following sequence:TieMo < TieNb < TieTa. Quantitatively, we observe differenceswith respect to experiment, for example, the TieTa transformation
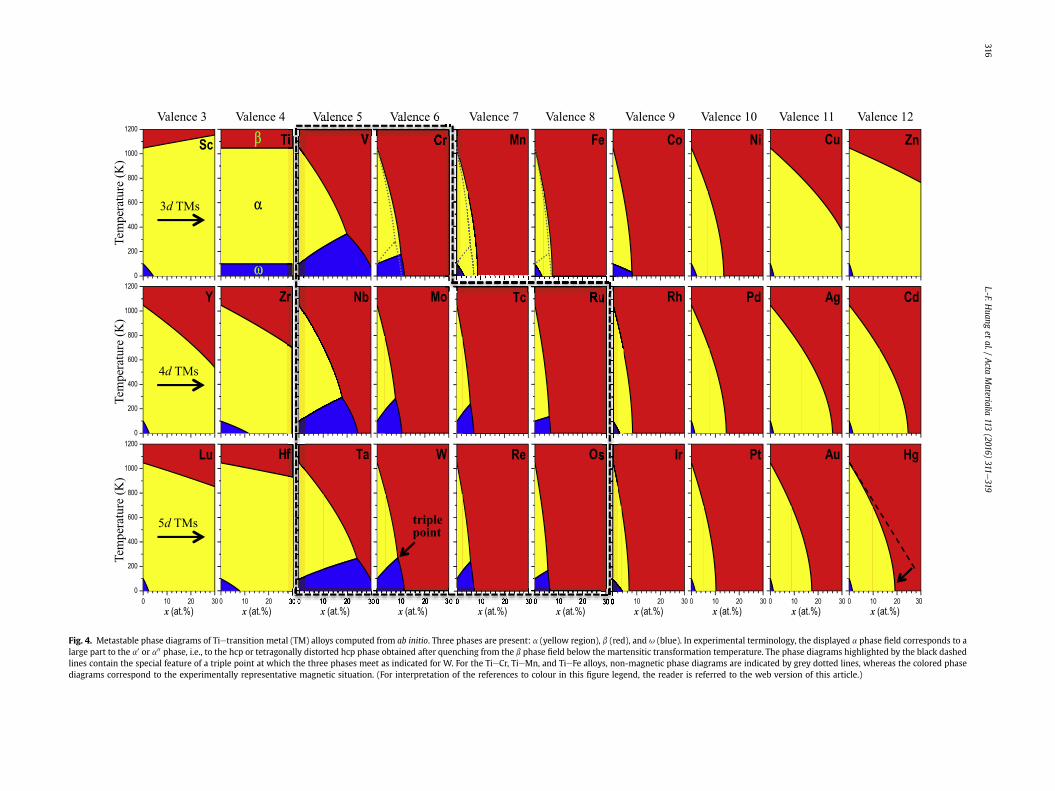
Fig. 4. Metastable phase diagrams of Tietransition metal (TM) alloys computed from ab initio. Three phases are present: a (yellow region), b (red), and u (blue). In experimental terminology, the displayed a phase field corresponds to alarge part to the a0 or a00 phase, i.e., to the hcp or tetragonally distorted hcp phase obtained after quenching from the b phase field below the martensitic transformation temperature. The phase diagrams highlighted by the black dashedlines contain the special feature of a triple point at which the three phases meet as indicated for W. For the TieCr, TieMn, and TieFe alloys, non-magnetic phase diagrams are indicated by grey dotted lines, whereas the colored phasediagrams correspond to the experimentally representative magnetic situation. (For interpretation of the references to colour in this figure legend, the reader is referred to the web version of this article.)
L.-F.Huang
etal./
Acta
Materialia
113(2016)
311e319
316
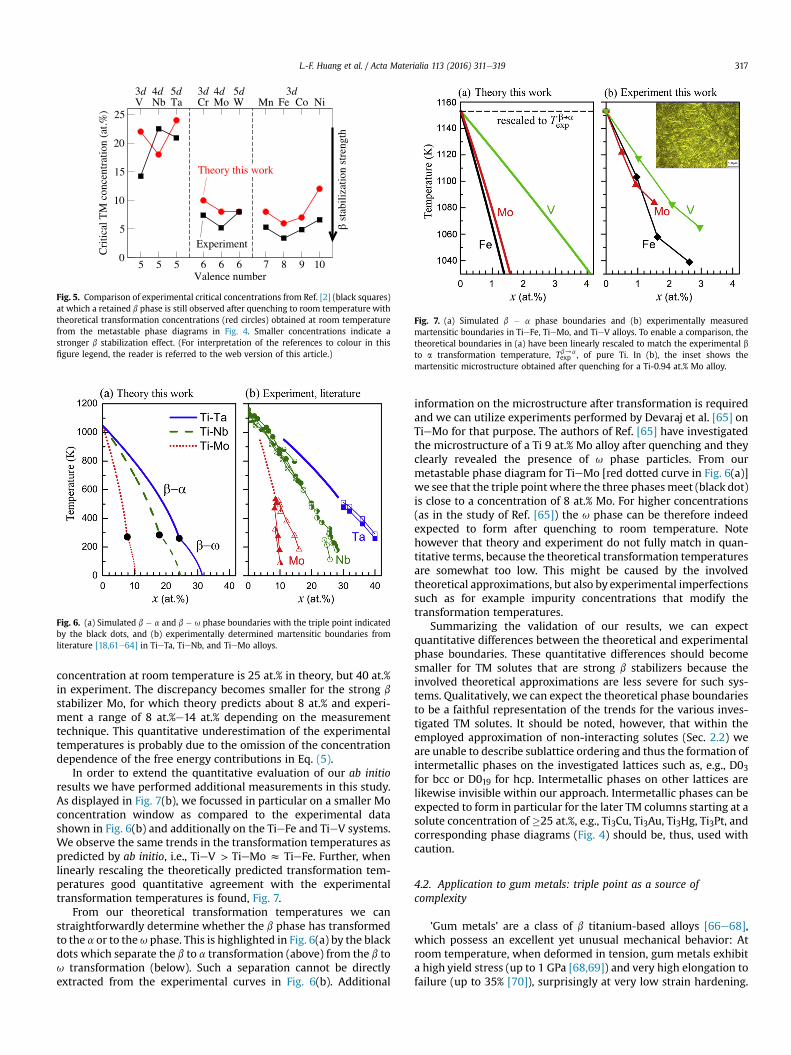
Fig. 5. Comparison of experimental critical concentrations from Ref. [2] (black squares)at which a retained b phase is still observed after quenching to room temperature withtheoretical transformation concentrations (red circles) obtained at room temperaturefrom the metastable phase diagrams in Fig. 4. Smaller concentrations indicate astronger b stabilization effect. (For interpretation of the references to colour in thisfigure legend, the reader is referred to the web version of this article.)
Fig. 6. (a) Simulated b � a and b � u phase boundaries with the triple point indicatedby the black dots, and (b) experimentally determined martensitic boundaries fromliterature [18,61e64] in TieTa, TieNb, and TieMo alloys.
Fig. 7. (a) Simulated b � a phase boundaries and (b) experimentally measuredmartensitic boundaries in TieFe, TieMo, and TieV alloys. To enable a comparison, thetheoretical boundaries in (a) have been linearly rescaled to match the experimental bto a transformation temperature, Tb/a
exp , of pure Ti. In (b), the inset shows themartensitic microstructure obtained after quenching for a Ti-0.94 at.% Mo alloy.
L.-F. Huang et al. / Acta Materialia 113 (2016) 311e319 317
concentration at room temperature is 25 at.% in theory, but 40 at.%in experiment. The discrepancy becomes smaller for the strong b
stabilizer Mo, for which theory predicts about 8 at.% and experi-ment a range of 8 at.%e14 at.% depending on the measurementtechnique. This quantitative underestimation of the experimentaltemperatures is probably due to the omission of the concentrationdependence of the free energy contributions in Eq. (5).
In order to extend the quantitative evaluation of our ab initioresults we have performed additional measurements in this study.As displayed in Fig. 7(b), we focussed in particular on a smaller Moconcentration window as compared to the experimental datashown in Fig. 6(b) and additionally on the TieFe and TieV systems.We observe the same trends in the transformation temperatures aspredicted by ab initio, i.e., TieV > TieMo z TieFe. Further, whenlinearly rescaling the theoretically predicted transformation tem-peratures good quantitative agreement with the experimentaltransformation temperatures is found, Fig. 7.
From our theoretical transformation temperatures we canstraightforwardly determine whether the b phase has transformedto the a or to theu phase. This is highlighted in Fig. 6(a) by the blackdots which separate the b to a transformation (above) from the b tou transformation (below). Such a separation cannot be directlyextracted from the experimental curves in Fig. 6(b). Additional
information on the microstructure after transformation is requiredand we can utilize experiments performed by Devaraj et al. [65] onTieMo for that purpose. The authors of Ref. [65] have investigatedthe microstructure of a Ti 9 at.% Mo alloy after quenching and theyclearly revealed the presence of u phase particles. From ourmetastable phase diagram for TieMo [red dotted curve in Fig. 6(a)]we see that the triple point where the three phasesmeet (black dot)is close to a concentration of 8 at.% Mo. For higher concentrations(as in the study of Ref. [65]) the u phase can be therefore indeedexpected to form after quenching to room temperature. Notehowever that theory and experiment do not fully match in quan-titative terms, because the theoretical transformation temperaturesare somewhat too low. This might be caused by the involvedtheoretical approximations, but also by experimental imperfectionssuch as for example impurity concentrations that modify thetransformation temperatures.
Summarizing the validation of our results, we can expectquantitative differences between the theoretical and experimentalphase boundaries. These quantitative differences should becomesmaller for TM solutes that are strong b stabilizers because theinvolved theoretical approximations are less severe for such sys-tems. Qualitatively, we can expect the theoretical phase boundariesto be a faithful representation of the trends for the various inves-tigated TM solutes. It should be noted, however, that within theemployed approximation of non-interacting solutes (Sec. 2.2) weare unable to describe sublattice ordering and thus the formation ofintermetallic phases on the investigated lattices such as, e.g., D03for bcc or D019 for hcp. Intermetallic phases on other lattices arelikewise invisible within our approach. Intermetallic phases can beexpected to form in particular for the later TM columns starting at asolute concentration of �25 at.%, e.g., Ti3Cu, Ti3Au, Ti3Hg, Ti3Pt, andcorresponding phase diagrams (Fig. 4) should be, thus, used withcaution.
4.2. Application to gum metals: triple point as a source ofcomplexity
’Gum metals’ are a class of b titanium-based alloys [66e68],which possess an excellent yet unusual mechanical behavior: Atroom temperature, when deformed in tension, gum metals exhibita high yield stress (up to 1 GPa [68,69]) and very high elongation tofailure (up to 35% [70]), surprisingly at very low strain hardening.
L.-F. Huang et al. / Acta Materialia 113 (2016) 311e319318
Despite the interest in this alloy class, the physical mechanismsgoverning the plastic behavior are still unclear. It appears howeverthat an important condition is a careful choice of the main alloyingelement and its specific concentration. Most prominent in thisrespect is the TieNb system with typical concentrations of 23 at.%Nb.
In early experimental studies on gummetals with a compositionof Ti-23Nb-0.7Ta2Zr-1.2O at.% [66,68], it was found that the gen-eration of the so-called giant faults determines plastic deformation,while phase transformations and dislocation slip have not beenobserved. In contrast, follow-up experimental studies identified avariety of plastic deformation modes in gum metals with similarchemical compositions: e.g., nanodisturbances [71], dislocations[31,70,72e75], twining, phase transformations (b to a and b to u)[28,69,76e79], and even the involvement of all these deformationmodes in one sample [80]. Which deformation mode (e.g., twin-ning, phase transformation, or dislocation slip) dominates theplastic deformation of a Ti gum metal very sensitively depends onthe phase composition and stability [8,81e84]. Close to themartensitic phase boundary, this dependence is most pronounced[8,81].
Utilizing our TieNbmetastable phase diagram, we can provide aplausible explanation for the origin of the complexity in gummetals. Referring to the simulated phase boundaries of TieNb inFig. 6(a) (green dashed line) we see that the triple point where a, b,and u meet (black dot) is close to room temperature and to aconcentration of 18 at.% Nb. Considering the above discussed factthat the theoretical TieNb phase boundaries underestimate theexperimental ones with respect to solute concentration [Fig. 6(b)],we can conclude that the triple point is very close to the typicalgum metal concentration of Ti-23 at.% Nb. This explains the varietyof deformation modes experimentally observed in TieNb gummetals, becauseddue to the vicinity of the gum-metal compositionto the triple pointdeven minute variations in solute concentration,interstitial distribution, or processing history of an alloy can havesignificant effects on phase composition and, thus, consequently onthe mechanical properties.
Based on this insight and with reference to the wide range ofmetastable phase diagrams displayed in Fig. 4, we can propose a setof candidate TM solute elements that have the potential to replaceNb as the basis alloying element in gum metals. The correspondingphase diagrams are required to exhibit a triple point between a, b,and u and this is only possible for elements that produce a specificcombination of stabilization energies as discussed in Sec. 3.2. Thiscondition is fulfilled for V and Cr from the 3d elements withMn andFe being ruled out due to magnetism; for Nb, Mo, Tc, and Ru fromthe 4d elements; and for Ta, W, Re, and Os from the 5d elements.The corresponding phase diagrams are highlighted in Fig. 4 by theblack dashed lines.
5. Conclusions
Employing a bottom-up approach based on ab initio calculationswe have computed and analyzed formation and stabilization en-ergies of transitionmetal solutes in the three relevant Ti phases a, b,and u. From the stabilization energies we have derived a widerange of metastable phase diagrams of Ti-transition metal alloys.Such metastable phase diagrams are well suited for analyzingrapidly quenched systems as often utilized in the design of Ti alloys.We have assessed the accuracy of the computed phase diagrams bycomparison to experimental martensitic transformation tempera-tures: The trends for the various transition metal solutes are wellreproduced and the elements in the middle of each d shell areclearly identified as strong b stabilizers. Differences with respect toexperiments must be expected in absolute values due to the
presently unavoidable approximations. For systems where experi-mental data are available we have quantified these differences(Fig. 6) and we found that the discrepancy becomes smaller forstrong b stabilizers. By performing additional measurements, wehave extended the quantitative comparison to small concentrationsfor TieMo, TieFe, and TieV, strengthening thereby the confidencein our ab initio results. Finally, we have applied the computed phasediagrams to an analysis of gum metals, and we propose that thecomplexity in the deformation behaviordwhich is responsible forthe outstanding materials properties of these alloysdis related tothe triple point at which the a, b, and u phase fields meet in thephase diagrams. Based on this insight wewere able to identify a setof potential gum metal systems: TieV, Cr, Nb, Mo, Tc, Ru, Ta, W, Re,Os.
Acknowledgement
The funding by the European Research Council (ERC) under theEU’s 7th Framework Programme (FP7/2007-2013)/ERC Grantagreement 290998 and by the ERC under the EU’s Horizon 2020Research and Innovation Programme (Grant No. 639211) is grate-fully acknowledged.
References
[1] C. Leyens, M. Peters, Titanium and Titanium Alloys. Fundamentals and Ap-plications, Wiley-VCH, Weinhein, 2003.
[2] G. Lütjering, J.C. Williams, Titanium, Springer, Berlin, 2007.[3] D. Banerjee, J.C. Williams, Perspective on titanium science and technology,
Acta Mater. 61 (2013) 844e879.[4] M. Geetha, A.K. Singh, R. Asokamani, A.K. Gogia, Ti based biomaterials, the
ultimate choice for orthopaedic implants - a review, Prog. Mater. Sci. 54(2009) 397e425.
[5] M. Niinomi, Recent metallic materials for biomedical applications, Metall.Mater. Trans. A 33A (2002) 477e486.
[6] H. Liu, M. Niinomi, M. Nakai, K. Cho, Athermal and deformation-induced u-phase transformations in biomedical beta-type alloy Ti-9Cr-0.2O, Acta Mater.106 (2016) 162.
[7] K. Otsuka, X. Ren, Physical metallurgy of Ti-Ni-based shape memory alloys,Prog. Mater. Sci. 50 (2005) 511e678.
[8] S. Hanada, M. Ozeki, O. Izumi, Deformation characteristics in b phase Ti-Nballoys, Metall. Trans. A 16A (1985) 789e795.
[9] D. Ping, Review on phase in body-centered cubic metals and alloys, ActaMetall. Sin. Engl. Lett. 27 (1) (2014) 1e11, http://dx.doi.org/10.1007/s40195-013-0014-2.
[10] P.J.S. Buenconsejo, H.Y. Kim, S. Miyazaki, Effect of ternary alloying elements onthe shape memory behavior of Ti-Ta alloys, Acta Mater. 57 (2009) 2509e2515.
[11] H.Y. Kim, S. Hashimoto, J.I. Kim, T. Inamura, H. Hosoda, S. Miyazaki, Effect of Taaddition on shape memory behavior of Ti-22Nb alloy, Mater. Sci. Eng. A 417(2006) 120e128.
[12] N.G. Jones, R.J. Dashwood, M. Jackson, D. Dye, b phase decomposition in Ti-5Al-5Mo-5V-3Cr, Acta Mater. 57 (2009) 3830.
[13] M.J. Lai, C.C. Tasan, J. Zhang, B. Grabowski, L.F. Huang, D. Raabe, Origin of shearinduced b to u transition in Ti-Nb-based alloys, Acta Mater. 92 (2015) 55.
[14] Z. Tarzimoghadam, S. Sandl€obes, K.G. Pradeep, D. Raabe, Microstructuredesign and mechanical properties in a near-a Ti-4Mo alloy, Acta Mater. 97(2015) 291.
[15] P. Kwasniak, M. Muzyk, H. Garbacz, K.J. Kurzydlowski, Clustering of O-X,X¼(Ag, Al, Ga, Sn, Sc, Zn, Zr) point defects in hexagonal Ti: formation mech-anism and ductility variations, Mater. Chem. Phys. 154 (2015) 137.
[16] S.K. Sikka, Y.K. Vohra, R. Chidambaram, Omega phase in materials, Prog.Mater. Sci. 27 (1982) 245e310.
[17] T. Li, D. Kent, G. Sha, L.T. Stephenson, A.V. Ceguerra, S.P. Ringer, M.S. Dargusch,J.M. Cairney, New insights into the phase transformations to isothermal u andu-assisted a in near b-Ti alloys, Acta Mater. 106 (2016) 353.
[18] S. Miyazaki, H.Y. Kim, J.S. Buenconsejo, Development of high temperature Ti-Ta shape memory alloys, ESOMAT 2009 (2009) 01003.
[19] J.H. Dai, X. Wu, Y. Song, R. Yang, Electronic structure mechanism ofmartensitic phase transformation in binary titanium alloys, J. Appl. Phys. 112(2012) 123718.
[20] B.E. Tegner, L. Zhu, G.J. Ackland, Relative strength of phase stabilizers in ti-tanium alloys, Phys. Rev. B 85 (2012) 214106.
[21] S. Nag, R. Banerjee, R. Srinivasan, J.Y. Hwang, M. Harper, H.L. Fraser, u-assistednucleation and growth of a precipitates in the Ti-5Al-5Mo-5V-3Cr-0.5Fe btitanium alloy, Acta Mater. 57 (2009) 2136.
[22] A. Devaraj, R.E.A. Williams, S. Nag, R. Srinivasan, H.L. Fraser, R. Banerjee, In-vestigations of omega precipitation in titanium molybdenum alloys by

L.-F. Huang et al. / Acta Materialia 113 (2016) 311e319 319
coupling 3d atom probe tomography and high resolution (S)TEM, Microsc.Microanal. 15 (2009) 268.
[23] D. Bhattacharyya, G.B. Viswanathan, R. Denkenberger, D. Furrer, H.L. Fraser,The role of crystallographic and geometrical relationships between a and bphases in an a/b titanium alloy,, Acta Mater. 51 (2003) 4679.
[24] H. Ikehata, N. Nagasako, T. Furuta, A. Fukumoto, K. Miwa, T. Saito, First-principles calculations for development of low elastic modulus Ti alloys, Phys.Rev. B 70 (2004) 174113.
[25] H. Ikehata, N. Nagasako, S. Kuramoto, T. Saito, Designing new structural ma-terials using density functional theory: the example of gum metal,, MRS Bull.31 (2006) 688e692.
[26] L. You, X. Song, First principles study of low young’s modulus Ti-Nb-Zr alloysystem, Mater. Lett. 80 (2012) 165e167.
[27] T. Li, J.W. Morris Jr., N. Nagasako, S. Kuramoto, D.C. Chrzan, Ideal engineeringalloys, Phys. Rev. Lett. 98 (2007) 105503.
[28] R.J. Talling, R.J. Dashwood, M. Jackson, S. Kuramoto, D. Dye, Determination of(c11�c12) in Ti-36Nb-2Ta-3Zr-0.3O (wt.%) (gum metal), Scr. Mater. 59 (2008)669e672.
[29] R.J. Talling, R.J. Dashwood, M. Jackson, D. Dye, Compositional variability ingum metal, Scr. Mater. 60 (2009) 1000e1003.
[30] J. Huang, H. Xing, J. Sun, Structural stability and generalized stacking faultenergies in b Ti-Nb alloys: relation to dislocation properties, Scr. Mater. 66(2012) 682e685.
[31] H. Xing, J. Sun, Q. Yao, W.Y. Guo, R. Chen, Origin of substantial plastic defor-mation in gum metals, Appl. Phys. Lett. 92 (2008) 151905.
[32] M. Tane, S. Akita, T. Nakano, K. Hagihara, Y. Umakoshi, M. Niinomi,H. Nakajima, Peculiar elastic behavior of Ti-Nb-Ta-Zr single crystals, ActaMater. 56 (2008) 2856e2863.
[33] M. Tane, S. Akita, T. Nakano, K. Hagihara, Y. Umakoshi, M. Niinomi, H. Mori,H. Nakajima, Low young’s modulus of Ti-Nb-Ta-Zr alloys caused by softeningin shear moduli c’ and c44 near lower limit of body-centered cubic phasestability, Acta Mater. 58 (2010) 6790e6798.
[34] M. Tane, T. Nakano, S. Kuramoto, M. Hara, M. Niinomi, N. Takesue, T. Yano,H. Nakajima, Low young’s modulus of Ti-Nb-Ta-Zr alloys: cold working andoxygen effects, Acta Mater. 59 (2011) 6975e6988.
[35] Y.W. Zhang, S.J. Li, E.G. Obbard, H. Wang, S.C. Wang, Y.L. Hao, R. Yang, Elasticproperties of Ti-24Nb-4Zr-8Sn single crystals with bcc crystal structure, ActaMater. 59 (2011) 3081e3090.
[36] Z.G. Mei, S.L. Shang, Y. Wang, Z.K. Liu, Density-functional study of the ther-modynamic properties and the pressure-temperature phase diagram of ti,Phys. Rev. B 80 (2009) 104116.
[37] C.-E. Hu, Z.-Y. Zeng, L. Zhang, X.-R. Chen, L.-C. Cai, D. Alf�e, Theoretical inves-tigation of the high pressure structure, lattice dynamics, phase transition, andthermal equation of state of titanium metal, J. Appl. Phys. 107 (9) (2010)093509.
[38] R.G. Hennig, D.R. Trinkle, J. Bouchet, S.G. Srinivasan, R.C. Albers, J.W. Wilkins,Impurities block the alpha to omega martensitic transformation in titanium,Nat. Mater. 4 (2005) 129e133.
[39] R.G. Hennig, T.J. Lenosky, D.R. Trinkle, S.P. Rudin, J.W. Wilkins, Classical po-tential describes martensitic phase transformations between the a, b, and utitanium phases, Phys. Rev. B 78 (2008) 054121.
[40] L.-F. Huang, B. Grabowski, E. McEniry, D.R. Trinkle, J. Neugebauer, Importanceof coordination number and bond length in titanium revealed by electronicstructure investigations, Phys. Status Solidi B 252 (2015) 1907.
[41] J. Hafner, Ab-initio simulations of materials using vasp: density-functionaltheory and beyond, J. Comput. Chem. 29 (2008) 2044e2078.
[42] P.E. Bl€ochl, Projector augmented-wave method, Phys. Rev. B 50 (1994)17953e17979, http://dx.doi.org/10.1103/PhysRevB.50.17953.
[43] G. Kresse, D. Joubert, From ultrasoft pseudopotentials to the projectoraugmented-wave method, Phys. Rev. B 59 (1999) 1758e1775, http://dx.doi.org/10.1103/PhysRevB.59.1758.
[44] J.P. Perdew, K. Burke, M. Ernzerhof, Generalized gradient approximation madesimple, Phys. Rev. Lett. 77 (1996) 3865e3868, http://dx.doi.org/10.1103/PhysRevLett.77.3865.
[45] M. Methfessel, A.T. Paxton, High-precision sampling for brillouin-zone inte-gration in metals, Phys. Rev. B 40 (1989) 3616e3621, http://dx.doi.org/10.1103/PhysRevB.40.3616.
[46] N.D. Mermin, Thermal properties of the inhomogeneous electron gas, Phys.Rev. 137 (1965) A1441.
[47] V.L. Moruzzi, J.F. Janak, K. Schwarz, Calculated thermal-properties of metals,Phys. Rev. B 37 (1988) 790e799.
[48] D. Raabe, B. Sander, M. Fri�ak, D. Ma, J. Neugebauer, Theory-guided bottom-updesign of b-titanium alloys as biomaterials based on first principles calcula-tions: theory and experiments, Acta Mater. 55 (2007) 4475e4487.
[49] P. Lazar, M. Jahn�atek, J. Hafner, N. Nagasako, R. Asahi, C. Blaas-Schenner,M. St€ohr, R. Podloucky, Temperature-induced martensitic phase transitions ingum-metal approximations: first-principles investigations for ti3 nb, Phys.Rev. B 84 (2011) 054202.
[50] F.R. de Boer, R. Boom, A.R. Miedema, Enthalpies of formation of liquid andsolid binary alloys based on 3d metals, Phys. BþC 101 (1980) 294.
[51] V.L. Moruzzi, A.R. Williams, J.F. Janak, Local density theory of metallic cohe-sion, Phys. Rev. B 15 (1977) 2854.
[52] M.S.S. Brooks, B. Johansson, Exchange integral matrices and cohesive energiesof transition metal atoms, J. Phys. F. Met. Phys. 13 (1983) L197eL202.
[53] J.H. Rose, H.B. Shore, Bonding energetics of metals: explanation of trends,Phys. Rev. B 43 (1991) 11605e11611.
[54] P.H.T. Philipsen, E.J. Baerends, Cohesive energy of 3d transition metals: den-sity functional theory atomic and bulk calculations, Phys. Rev. B 54 (1996)5326e5333.
[55] S.L. Shang, A. Saengdeejing, Z.G. Mei, D.E. Kim, H. Zhang, S. Ganeshan,Y. Wang, Z.K. Liu, First-principles calculations of pure elements: equations ofstate and elastic stiffness constants, Comput. Mater. Sci. 48 (2010) 813e826.
[56] A.P. Sutton, Electronic Structure of Materials, Oxford University Press, Oxford,1993.
[57] G.A. Landrum, R. Dronskowski, The orbital origins of magnetism: from atomsto molecules to ferromagnetic alloys, Angew. Chem. Int. Ed. 39 (2000)1560e1585.
[58] Y.L. Hao, S.J. Li, S.Y. Sun, R. Yang, Effect of Zr and Sn on young’s modulus andsuperelasticity of Ti-Nb-based alloys, Mater. Sci. Eng. A 441 (2006) 112e118.
[59] S. Miyazaki, H.Y. Kim, H. Hosoda, Development and characterization of Ni-freeTi-base shape memory and superelastic alloys, Mater. Sci. Eng. A 438 e 440(2006) 18e24.
[60] Y.L. Hao, S.J. Li, F. Prima, R. Yang, Controlling reversible martensitic trans-formation in titanium alloys with high strength and low elastic modulus, Scr.Mater. 67 (2012) 487e490.
[61] D. de Fontaine, Simple models for the omega phase transformation, Metall.Trans. A 19A (1988) 169e175.
[62] D.L. Moffat, D.C. Larbalestier, The competition between martensite and omegain quenched Ti-Nb alloys, Metall. Trans. A 19A (1988) 1677e1686.
[63] T. Ahmed, H.J. Rack, Martensitic transformations in Tie(16e26 at%) Nb alloys,J. Mater. Sci. 31 (1996) 4267e4276.
[64] H.Y. Kim, Y. Ikehara, J.I. Kim, H. Hosoda, S. Miyazaki, Martensitic trans-formation, shape memory effect and superelasticity of Ti-Nb binary alloys,Acta Mater. 54 (2006) 2419e2429.
[65] A. Devaraj, S. Nag, R. Srinivasan, R.E.A. Williams, S. Banerjee, R. Banerjee,H.L. Fraser, Experimental evidence of concurrent compositional and structuralinstability leading to u precipitation in titanium-molybdenum alloys, ActaMater. 60 (2011) 596e609.
[66] T. Saito, T. Furuta, J.H. Hwang, S. Kuramoto, K. Nishino, N. Suzuki, R. Chen,A. Yamada, K. Ito, Y. Seno, T. Nonaka, H. Ikehata, N. Nagasako, C. Iwamoto,Y. Ikuhara, T. Sakuma, Multifunctional alloys obtained via a dislocation-freeplastic deformation mechanism, Science 300 (2003) 464e467.
[67] S. Kuramoto, T. Furuta, J.H. Hwang, K. Nishino, T. Saito, Plastic deformation in amultifunctional Ti-Nb-Ta-Zr-O alloy, Metall. Trans. A 37A (2006) 657.
[68] T. Furuta, S. Kuramoto, J. Hwang, K. Nishino, T. Saito, Elastic deformationbehavior of multi-functional Ti-Nb-Ta-Zr-O alloys, Mater. Trans. 46 (2005)3001e3007.
[69] R.J. Talling, R.J. Dashwood, M. Jackson, D. Dye, On the mechanism of super-elasticity in gum metal, Acta Mater. 57 (2009) 1188e1198.
[70] E. Plancher, C.C. Tasan, S. S, D. Raabe, On dislocation involvement in Ti-Nbgum metal plasticity, Scr. Mater. 68 (2013) 805e808.
[71] M.Y. Gutkin, T. Ishizaki, S. Kuramoto, I.A. Ovidko, Nanodisturbances indeformed gum metal, Acta Mater. 54 (2006) 2489e2499.
[72] H. Xing, W.Y. Guo, J. Sun, Substructure of recovered Ti-23Nb-0.7Ta-2Zr-Oalloy, Trans. Nonferr. Met. Soc. China 17 (2007) 1456e1458.
[73] Y. Yang, S.Q. Wu, G.P. Li, Y.L. Li, Y.F. Lu, K. Yang, P. Ge, Evolution of deformationmechanisms of Ti-22.4Nb-0.73Ta-2Zr-1.34O alloy during straining, ActaMater. 58 (2010) 2778e2787.
[74] P. Castany, M. Besse, T. Gloriant, Dislocation mobility in gum metal b-titaniumalloy studied via in situ transmission electron microscopy, Phys. Rev. B 84(2011) 020201(R).
[75] M. Besse, P. Castany, T. Gloriant, Mechanisms of deformation in gum metalTNTZ-O and TNTZ titanium alloys: a comparative study on the oxygen influ-ence,, Acta Mater. 59 (2011) 5982e5988.
[76] H. Xing, J. Sun, Mechanical twinning and omega transition by <111>{ 112}shear in a metastable b titanium alloy, Appl. Phys. Lett. 93 (2008) 031908.
[77] Y. Yang, G.P. Li, G.M. Cheng, H. Wang, M. Zhang, F. Xu, K. Yang, Stress-intro-duced a00 martensite and twinning in a multifunctional titanium alloy, Scr.Mater. 58 (2008) 9e12.
[78] E. Withery, M. Jin, A. Minor, S. Kuramoto, D.C. Chrzan, J.W. Morris Jr., Thedeformation of gum metal in nanoindentation, Mater. Sci. Eng. A 493 (2008)26e32.
[79] E.A. Withery, A.M. Minor, D.C. Chrzan, J.W. Morris Jr., S. Kuramoto, Thedeformation of gum metal through in situ compression of nanopillars, ActaMater. 58 (2010) 2652e2665.
[80] Y. Yang, G.P. Li, G.M. Cheng, Y.L. Li, K. Yang, Multiple deformation mechanismsof Ti-22.4Nb-0.73Ta-2.0Zr-1.34O alloy, Appl. Phys. Lett. 94 (2009) 061901.
[81] S. Hanada, A. Takemura, O. Izumi, The mode of plastic deformation of b Ti-Valloys, Trans. Jpn. Inst. Metals 23 (1982) 507e517.
[82] S. Hanada, O. Izumi, Correlation of tensile properties, deformation modes, andphase stability in commercial b-phase titanium alloys, Metall. Trans. A 18A(1987) 265e271.
[83] D.C. Chrzan, M.P. Sherburne, Y. Hanlumyuang, T. Li, J.W. Morris Jr., Spreadingof dislocation cores in elastically anisotropic body-centered-cubic materials:the case of gum metal, Phys. Rev. B 82 (2010) 184202.
[84] S.V. Bobylev, T. . ishizaki, S. Kuramoto, I.A. Ovidko, Theory of the nonplanarsplitting of screw dislocations in gum metal, Phys. Rev. B 77 (2008) 094115.