Embed Size (px)
Citation preview

Friday, March 21
Chapter 12.5
Interpret Line Graphs

Interpret Line Graphs
Objective: To draw and interpret line graphs.

Interpret Line Graphs
At the end of this lesson you should be able to answer the following question.
How can you use lines graphs to predict data?
Interpret Line Graphs
A line graph is used to show how a set of data changes over a period of time.

Interpret Line Graphs
What does the graph tell you about the popularity of skateboarding?
Hint – is it decreasing, increasing or stayingthe same?

Interpret Line Graphs
What does the graph tell you about the popularity of skateboarding?
Sometimes we can predict trends by looking at a graph.

Interpret Line Graphs
What does the graph tell you about the popularity of skateboarding?
Can you predict how many skateboards willbe sold in ‘15?

Interpret Line Graphs
What does the graph tell you about the popularity of skateboarding?
Can you predict how many skateboards willbe sold in ‘15?

Interpret Line Graphs
What does the graph tell you about the popularity of skateboarding?
Can you predict how many skateboards willbe sold in ‘15?
Interpret Line Graphs
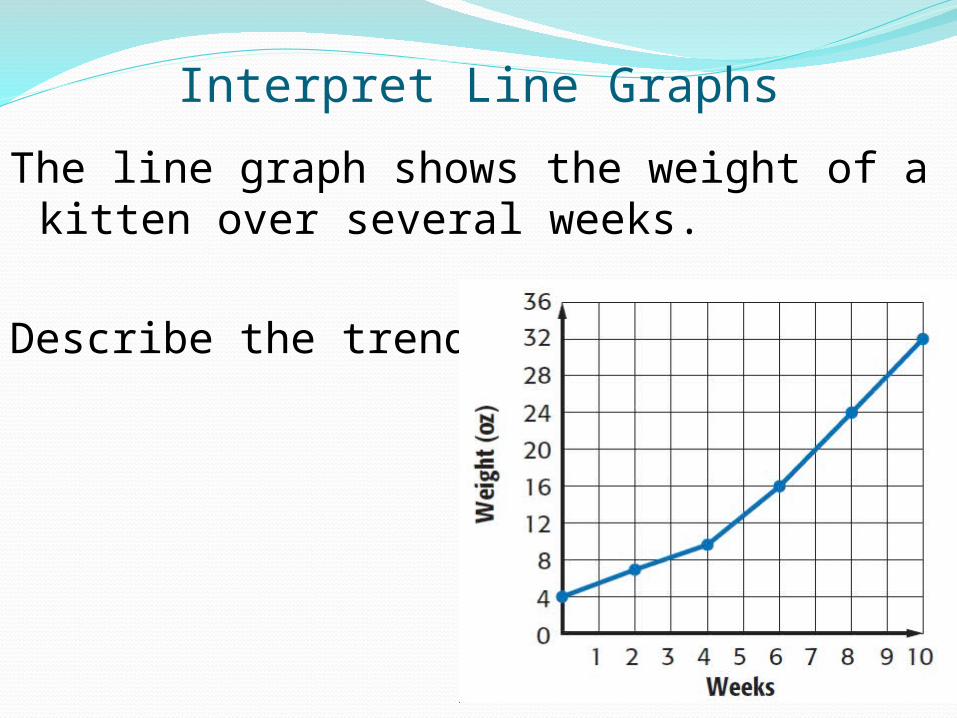
The line graph shows the weight of a kitten over several weeks.
Describe the trend.
Interpret Line Graphs
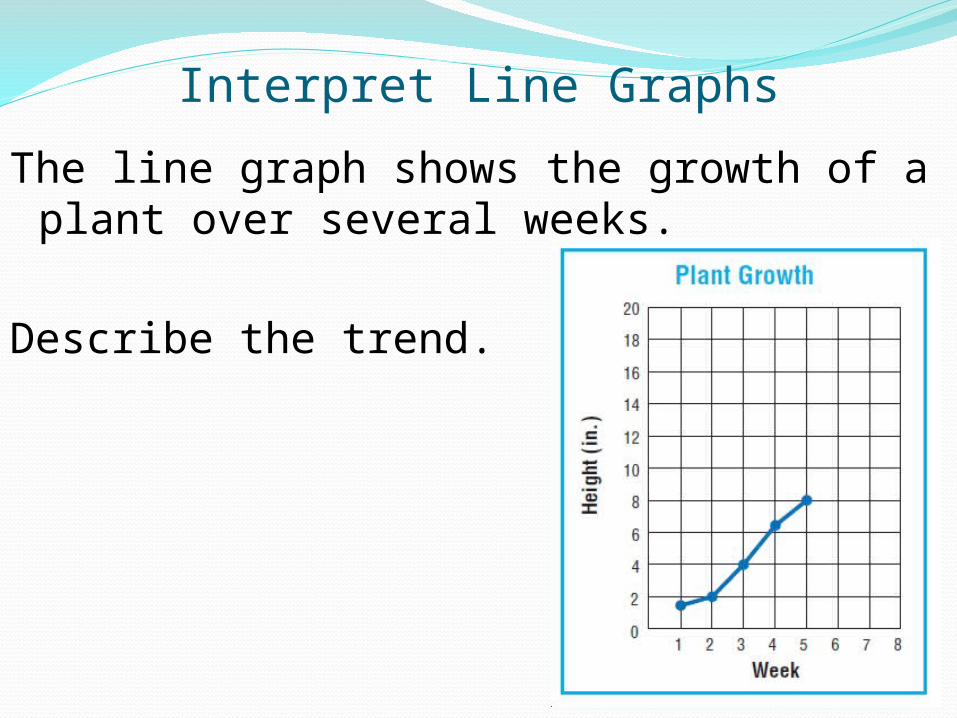
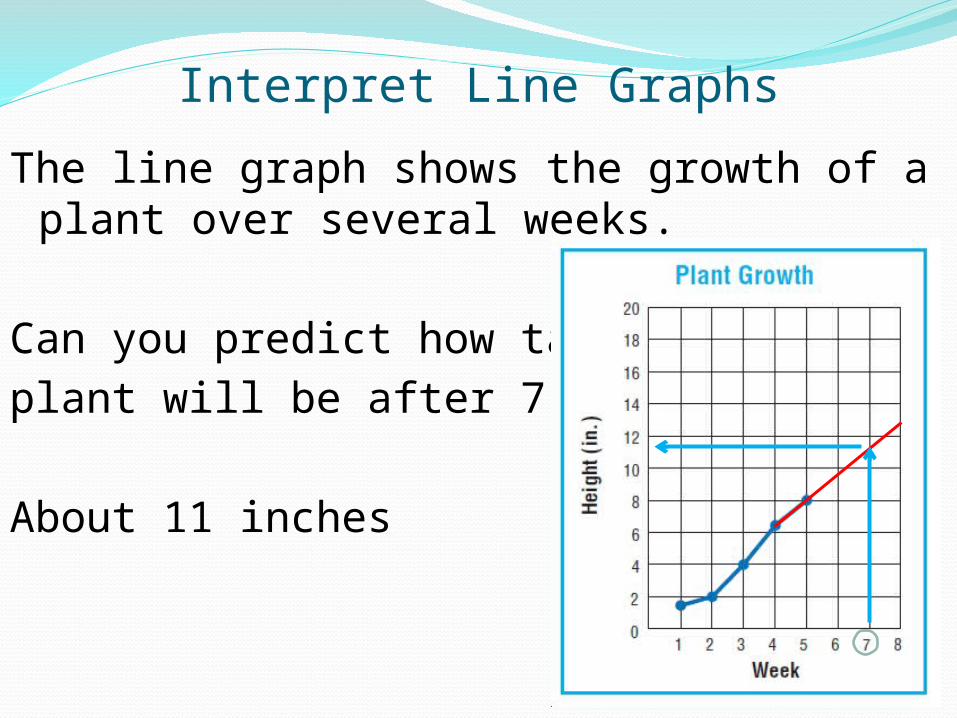
The line graph shows the growth of a plant over several weeks.
Describe the trend.
Interpret Line Graphs
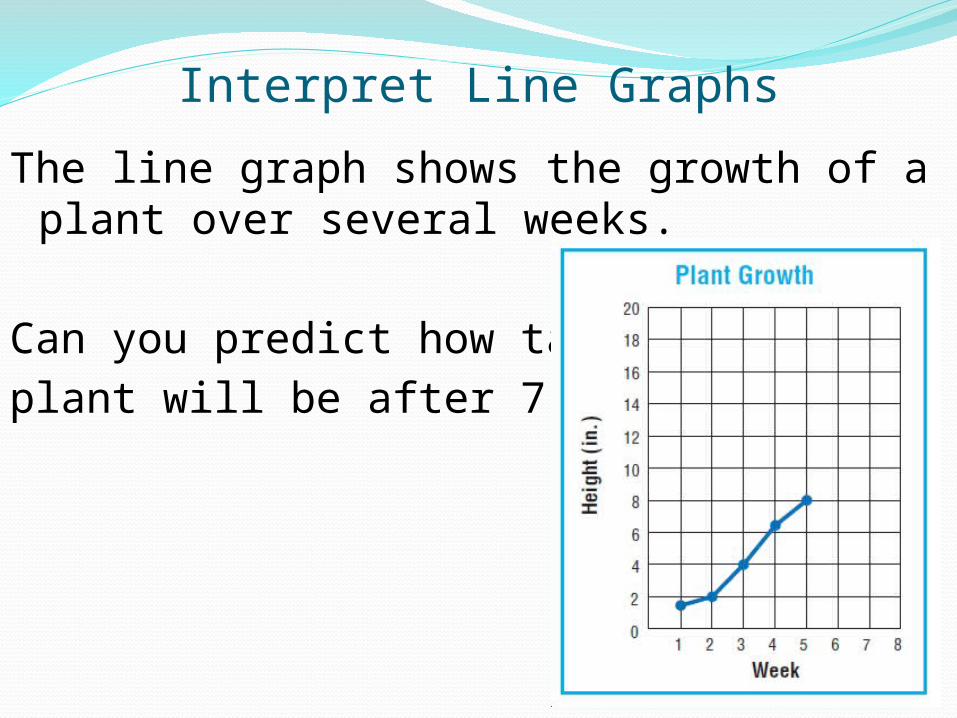
The line graph shows the growth of a plant over several weeks.
Can you predict how tall theplant will be after 7 weeks?
Interpret Line Graphs
The line graph shows the growth of a plant over several weeks.
Can you predict how tall theplant will be after 7 weeks?
About 11 inches
Interpret Line Graphs
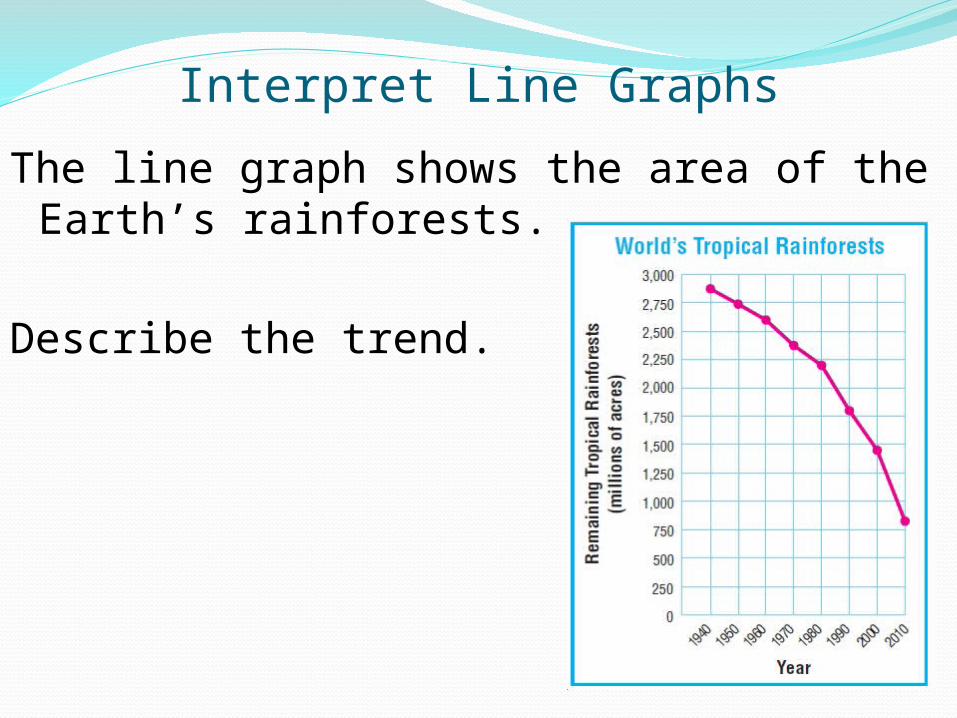
The line graph shows the area of the Earth’s rainforests.
Describe the trend.
Interpret Line Graphs
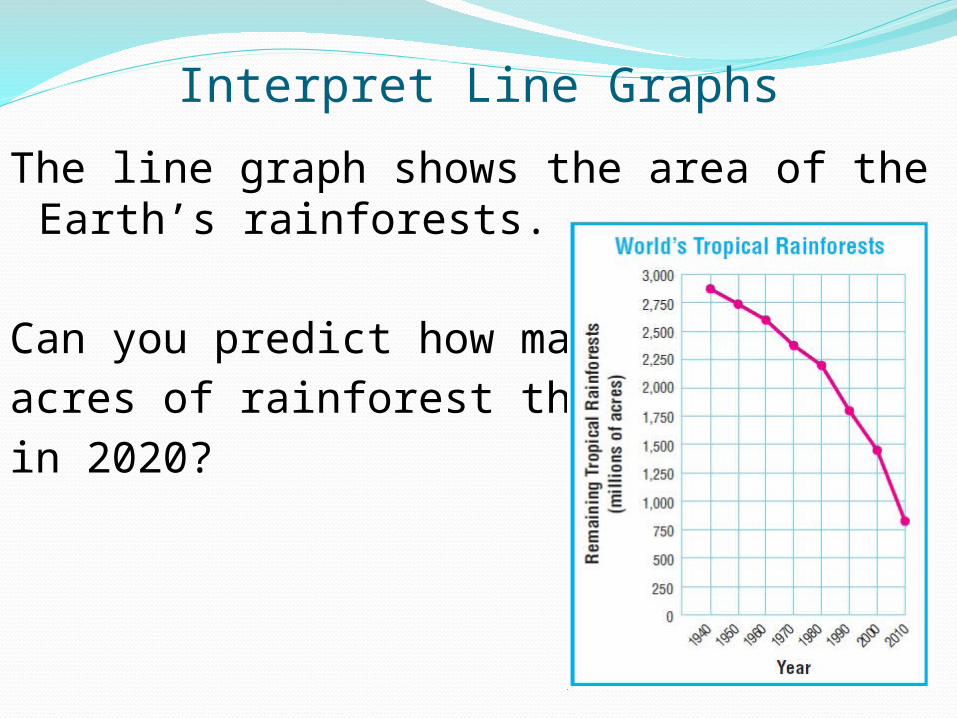
The line graph shows the area of the Earth’s rainforests.
Can you predict how many acres of rainforest there will bein 2020?
Interpret Line Graphs
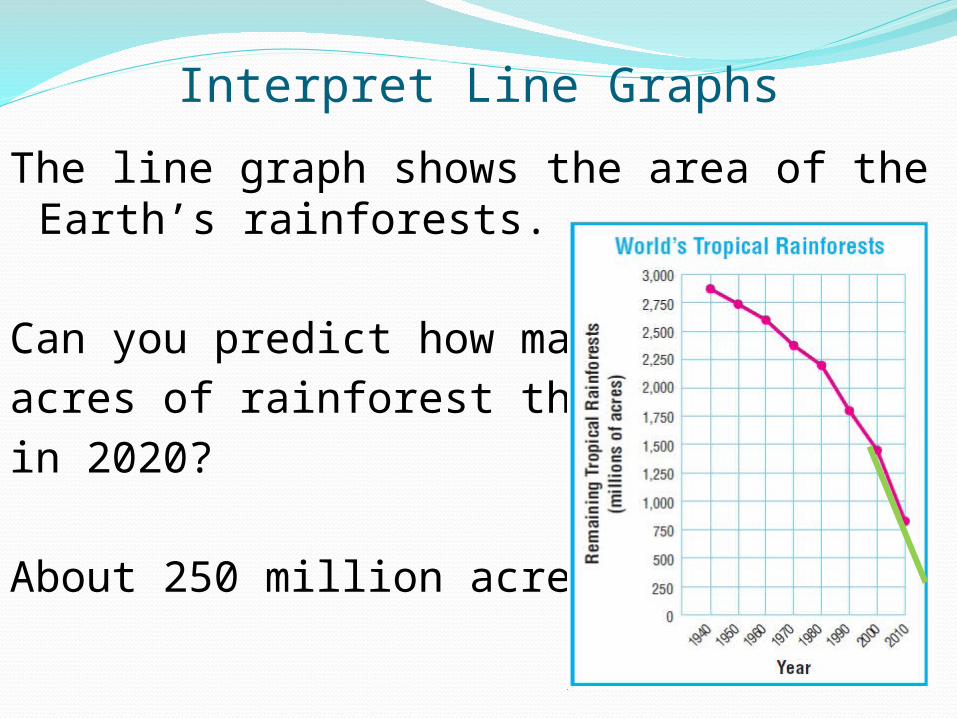
The line graph shows the area of the Earth’s rainforests.
Can you predict how many acres of rainforest there will bein 2020?
About 250 million acres.
Interpret Line Graphs
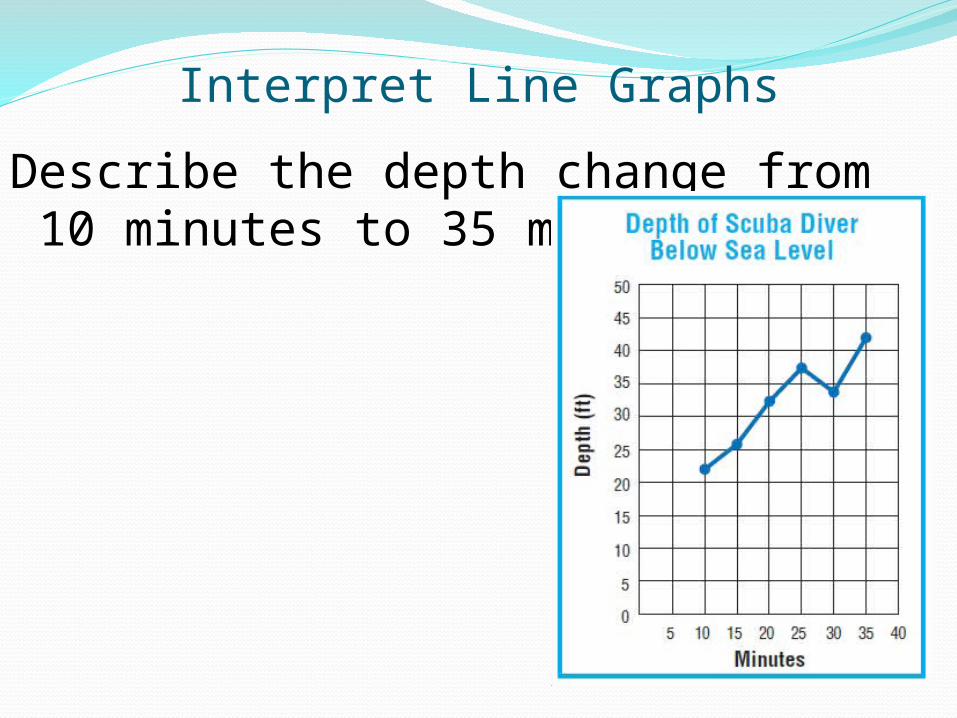
Describe the depth change from 10 minutes to 35 minutes.
Interpret Line Graphs
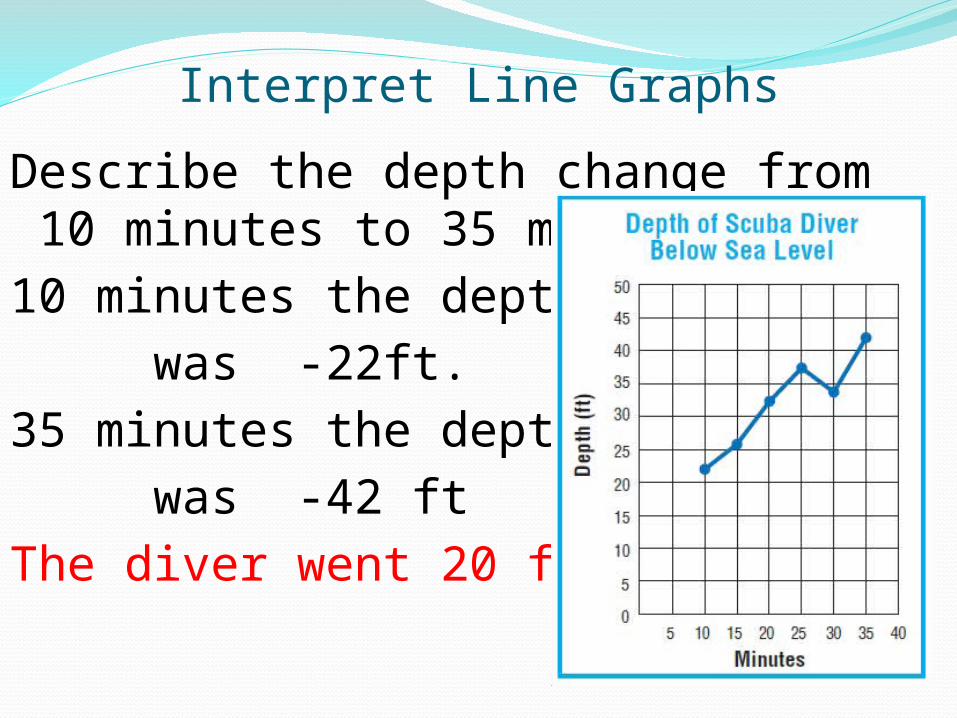
Describe the depth change from 10 minutes to 35 minutes.
10 minutes the depth was -22ft.35 minutes the depth was -42 ft
The diver went 20 ft lower
Interpret Line Graphs
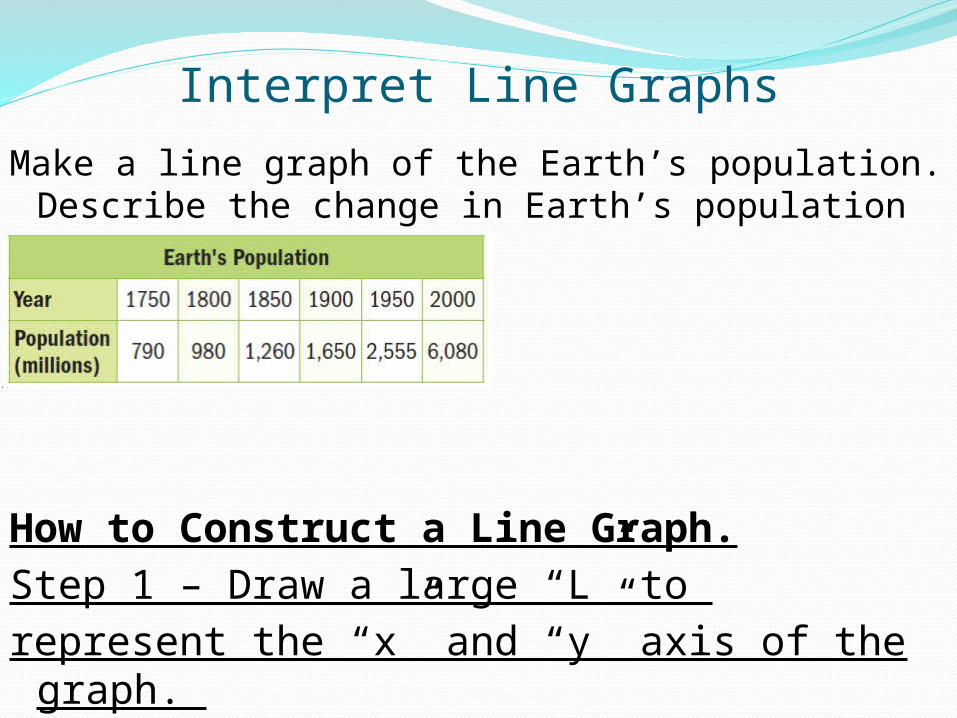
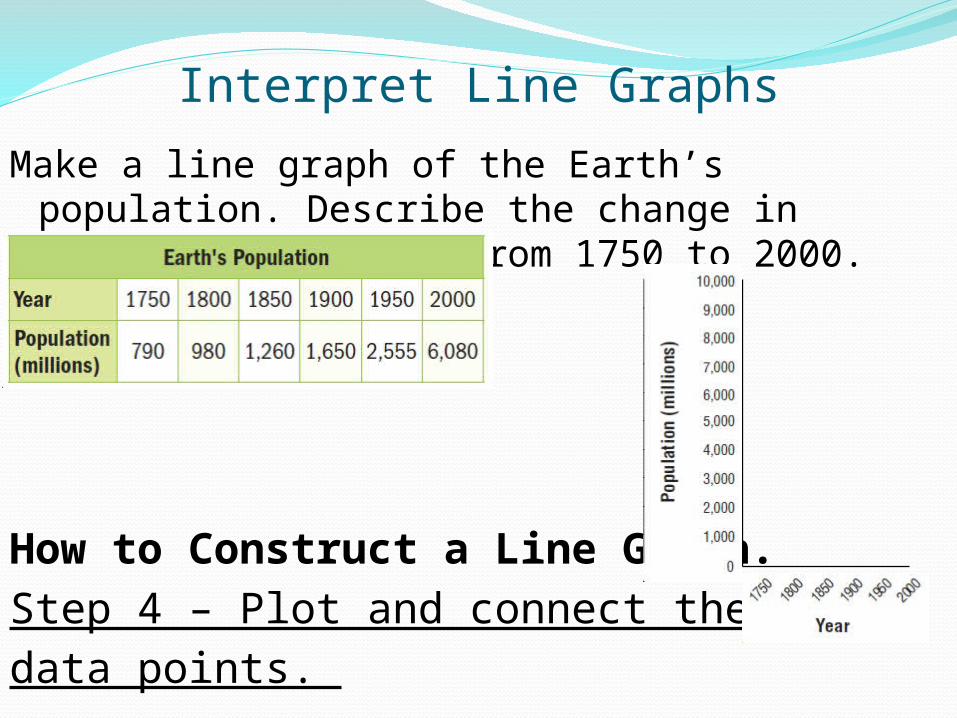
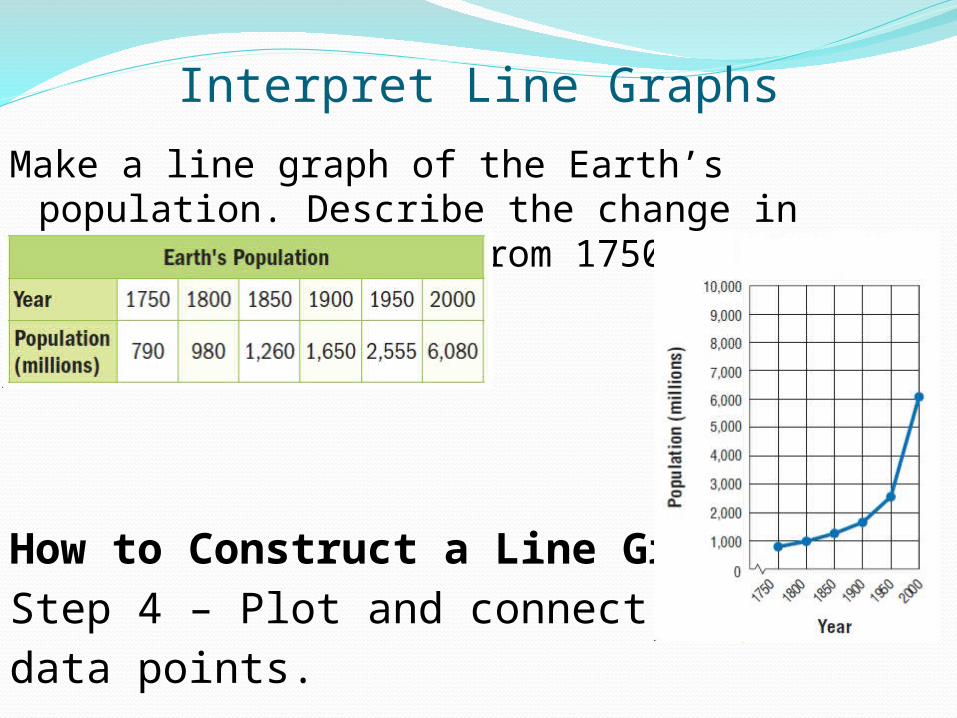
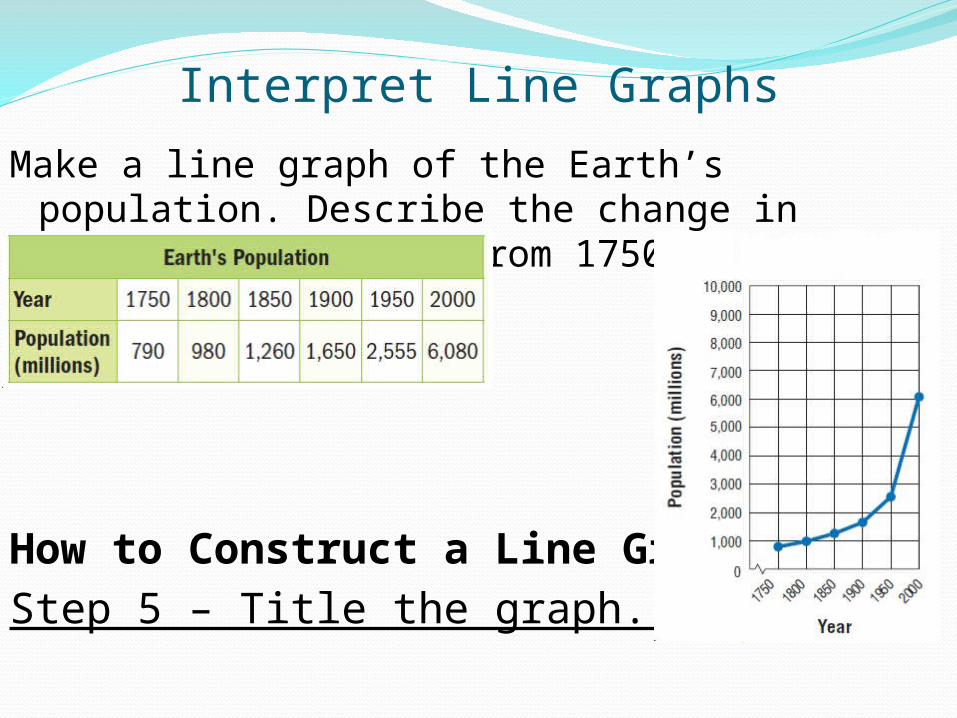
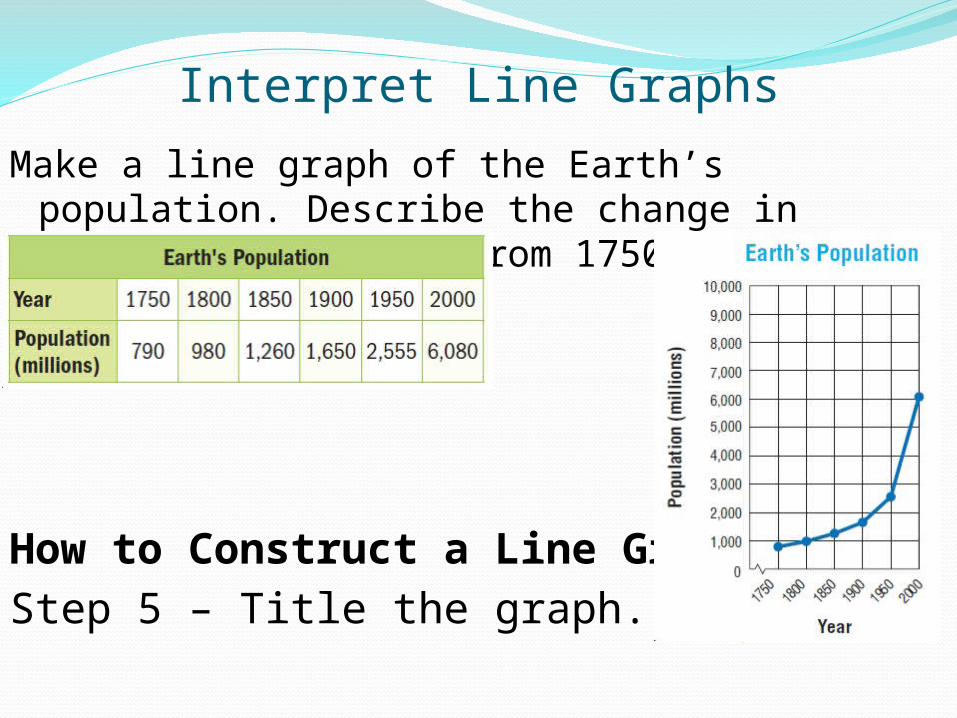
Make a line graph of the Earth’s population. Describe the change in Earth’s population from 1750 to 2000.
How to Construct a Line Graph.Step 1 – Draw a large “L” to represent the “x” and “y” axis of the graph.
Interpret Line Graphs
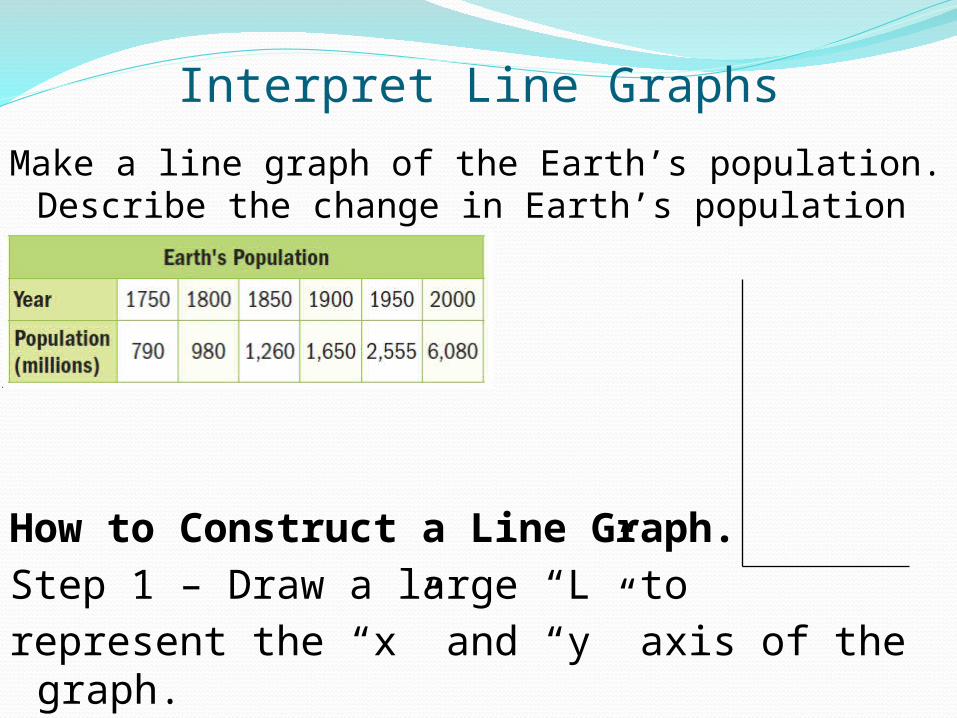
Make a line graph of the Earth’s population. Describe the change in Earth’s population from 1750 to 2000.
How to Construct a Line Graph.Step 1 – Draw a large “L” to represent the “x” and “y” axis of the graph.
Interpret Line Graphs
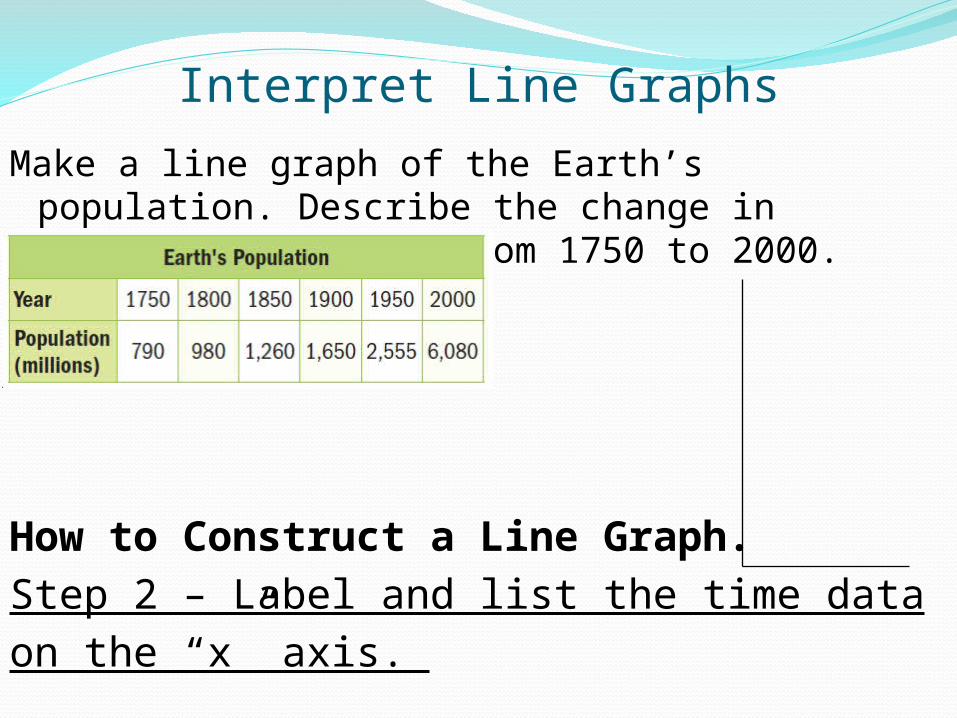
Make a line graph of the Earth’s population. Describe the change in Earth’s population from 1750 to 2000.
How to Construct a Line Graph.Step 2 – Label and list the time data on the “x” axis.
Interpret Line Graphs
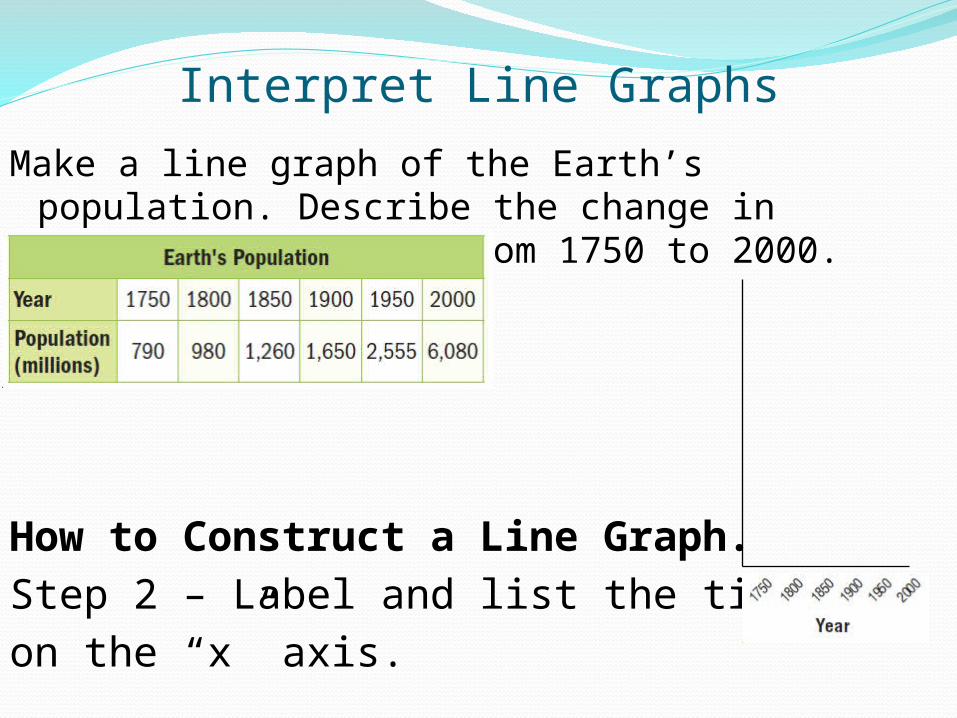
Make a line graph of the Earth’s population. Describe the change in Earth’s population from 1750 to 2000.
How to Construct a Line Graph.Step 2 – Label and list the time data on the “x” axis.
Interpret Line Graphs
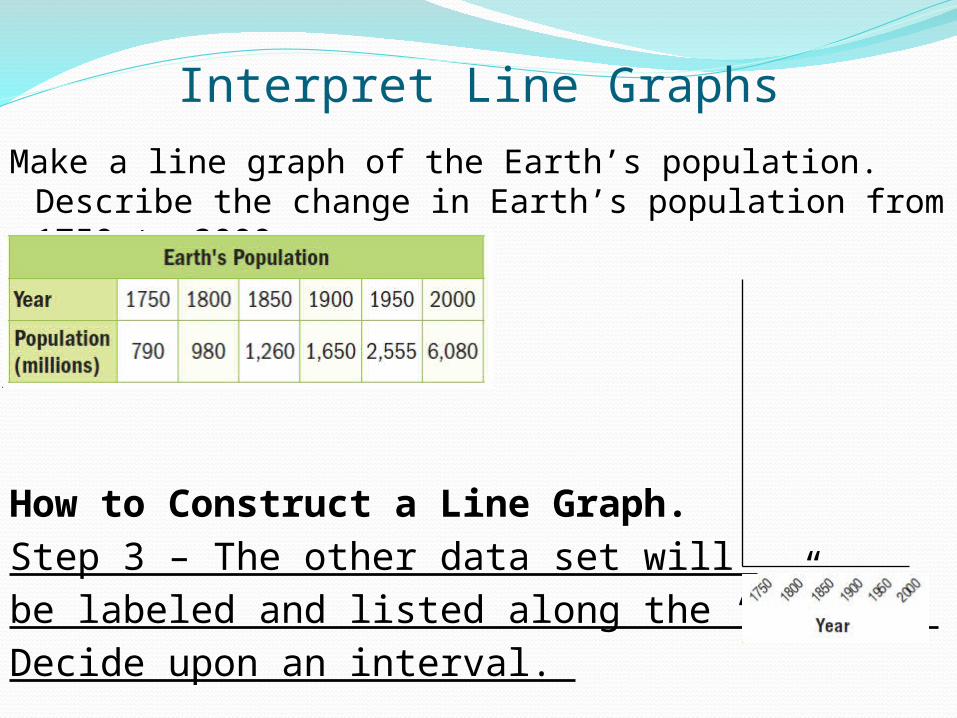
Make a line graph of the Earth’s population. Describe the change in Earth’s population from 1750 to 2000.
How to Construct a Line Graph.Step 3 – The other data set will be labeled and listed along the “y” axis.Decide upon an interval.
Interpret Line Graphs
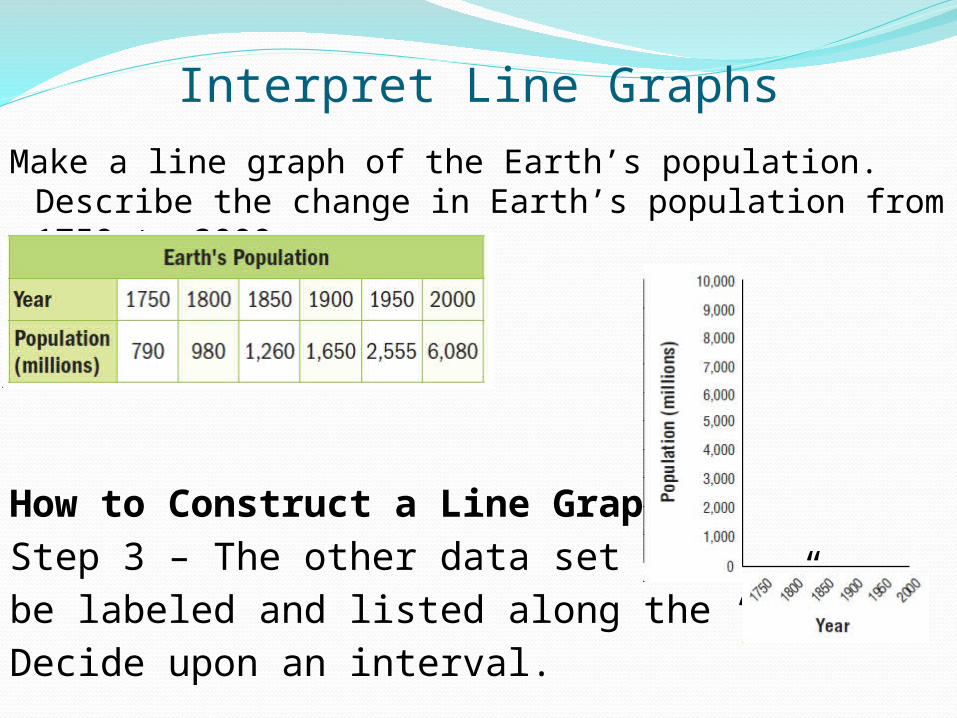
Make a line graph of the Earth’s population. Describe the change in Earth’s population from 1750 to 2000.
How to Construct a Line Graph.Step 3 – The other data set will be labeled and listed along the “y” axis.Decide upon an interval.
Interpret Line Graphs
Make a line graph of the Earth’s population. Describe the change in Earth’s population from 1750 to 2000.
How to Construct a Line Graph.Step 4 – Plot and connect the data points.
Interpret Line Graphs
Make a line graph of the Earth’s population. Describe the change in Earth’s population from 1750 to 2000.
How to Construct a Line Graph.Step 4 – Plot and connect the data points.
Interpret Line Graphs
Make a line graph of the Earth’s population. Describe the change in Earth’s population from 1750 to 2000.
How to Construct a Line Graph.Step 5 – Title the graph.
Interpret Line Graphs
Make a line graph of the Earth’s population. Describe the change in Earth’s population from 1750 to 2000.
How to Construct a Line Graph.Step 5 – Title the graph.

Interpret Line Graphs
How can you use lines graphs to predict data?

Interpret Line Graphs
Agenda Notes
Homework–
No Homework
Chapter 11/12 Test –Tuesday, March 25