Embed Size (px)
Citation preview
Bar Graphs with Intervals – Grade Three
1
Commentary: Students should have frequent experiences with collecting, representing and analyzing data. Students build on prior knowledge of bar graphs and learn that intervals are necessary to represent large sets of data. In order to determine intervals which are appropriate, students must have an informal sense of the range of data. Modeling and practicing the decision-making process to identify an interval is essential to building understanding.
Pre-Assessment: • Distribute a copy of Pre-Assessment, Attachment A, to each
student. • Have students complete the worksheet independently to
assess their competency of reading and interpreting a bar graph with intervals of one and their understanding of intervals. Circulate to observe and assist as needed.
• Ask questions to have students explain their understanding of bar graphs: 1. What does this bar graph show? (ways to go to school)
How did you know that? (title: “Ways We Come to School”)
2. What do the vertical numbers show? (number of students)
How did you know? (label by the numbers: “Number of Students”) 3. What do the words on the bottom show? (different
ways students go to school) How did you know? (label: “Types of Transportation”) 4. How can we tell how many students walk to school?
(Look at the “walk” column to see how far the bar goes and at what numbered line the bar stops.)
Ohio Standards Connection
Data Analysis and Probability Benchmark D Read, interpret and construct graphs in which icons represent more than a single unit or intervals greater than one; e.g., each � = 10 bicycles or the intervals on an axis are multiples of 10. Indicator 3 Read, interpret and construct bar graphs with intervals greater than one. Mathematical Processes Benchmarks I. Represent problem
situations in a variety of forms (physical model, diagram, in words or symbols), and recognize when some ways of representing a problem may be more helpful than others.
J. Read, interpret, discuss and write about mathematical ideas and concepts using both everyday and mathematical language.
Lesson Summary: Students explore a variety of bar graphs using familiar contexts. They read, interpret, and construct bar graphs with intervals of two, five and ten. Activities include diverse groupings of students, opportunities for oral and written communication and informal assessment. The concepts can be extended across the curriculum to teach or reinforce skills. Estimated Duration: Four hours
Bar Graphs with Intervals – Grade Three
2
5. How can we tell how many students ride the bus to school? (Look at the “bus” column to
see to what numbered line the bar extends.) 6. How can we tell how many students ride in a car to school? (Look at the “car” column to
see to what numbered line the bar extends.) 7. Why is a bar graph like this helpful to us? (It makes the information easier to distinguish
differences in the data) 8. How would changes in the weather possibly change the data on this graph? (If there was
a thunderstorm at the time the students left for school, there may be fewer walkers and more car riders). What other factors might change the data on the graph?
• Select students to read and answer questions on the completed Pre-Assessment, Attachment A worksheet. Allow students to correct errors during this discussion. Write answers on the overhead using a transparency of the worksheet. Have students explain their strategies for finding answers to each question. Encourage questions throughout the discussion and circulate to observe student work.
• Continue student reading, answering and grading for Part B of the pre-assessment. Have students explain how they decided the value of each point. Continue to encourage questions.
• Collect pre-assessment worksheets. Scoring Guidelines: Summarize progress in meeting the standard and readiness for further instruction using teacher observations, student responses during class discussion and student responses on the pre-assessment worksheet. Evaluate student progress in these areas:
Use, Points on a Number Line, Attachment E, as an intervention for identifying numbers represented by point values between intervals. Post-Assessment: Distribute Post-Assessment, Attachment B to each student. Students read and interpret data on bar graphs with intervals of two and ten, and use the information to solve problems. Students also construct a bar graph to display given information.
Ready for Instruction
Interprets information from a bar graph and responds to questions correctly. Identifies the correct numbers for points on the number lines.
Monitor During
Instruction
Interprets information from a bar graph and responds to questions with minor errors. Identifies numbers within a range of one for points on the number lines. For example: Identifies point A as 11, instead of 12.
Intervention
Required
Interprets information with more than two errors and needs assistance to respond to questions. Identifies numbers more than two away for points on the number line. For example: Identifies point T as 35, instead of 39.
Bar Graphs with Intervals – Grade Three
3
Scoring Guidelines: Assess progress for bar graphs with intervals greater than one. Expect students to accurately read bar graphs, interpret and compare information, and correctly assign a number value to each bar. Assess construction of a bar graph with intervals greater than one, including all necessary parts: organize information, choose appropriate intervals and shade bars to correspond to their values. Use Post-Assessment Scoring Rubric, Attachment D, to evaluate progress. Instructional Procedures: Part One 1. Distribute a copy of Bar Graph with Intervals of Two, Attachment F to each student. Have
students look at the graph to review the terms horizontal axis (the line going across the bottom of the graph) and vertical axis (the line going up and down on the left side of the graph).
2. Discuss all parts of the graph: title, types of weather, and intervals for the number of days. Ask questions that relate parts of the graph to the information each describes. • What is the title? What is this graph about? • What are the categories? How are they labeled? Which axis displays this information? • What intervals are used? How are the intervals labeled? Which axis displays this
information? • How are the intervals different than bar graphs you have studies in the past? • Why are intervals of two used? (Use intervals more than one for large sets of data or
larger numbers. Helps keep the graph small.) 3. Have students answer the questions on the worksheet, observe and assist as necessary. 4. When all students are finished, call on students to answer the questions. Class uses “thumbs
up” for agreement or “thumbs down” for disagreement. Allow students time to correct errors. 5. Ask questions that require students to analyze or apply the data, such as,
• Could a weather forecaster use this bar graph to make predictions about the weather? (Possibly, if he had several years of data to compare).
• Would the information be useful to students preparing for school? (Not really, as it does not give the dates that will be rainy).
6. Collect papers for use in Part Two. 7. Distribute a copy of Bar Graph with Intervals of Five, Attachment G, to each student.
Discuss all parts of the graph (title, categories, and intervals for the number of stickers). Refer to Part One, step 2 for specific questions.
8. Have students work with a partner to create three questions using the information on the graph. Encourage them to write their questions using terms: most, least, more than, less than, etc. Have partners write the same questions and include the answers. Circulate to observe and help students form questions as necessary.
9. Select one student to ask the class a question about the graph. Have the student call on another student to answer and tell if the response is correct. Then, the student who answered correctly, reads one of his/her group’s questions and calls on someone in a different group. Continue this student questioning and answering procedure until at least one student from each pair has had a turn.
10. Follow up with questions to extend students’ thinking. • How might the information on this graph change if?
Bar Graphs with Intervals – Grade Three
4
a. Julie used her allowance to but more stickers. b. Kelly left her stickers outside when it started to rain. c. Mandi received a pack of 50 stickers for her birthday.
11. Discuss the use of intervals greater than one. Have students summarize intervals in a journal. Ask questions such as: • What if 1,000 students were asked how they came to school? • What if the girls collected hundreds of stickers?
12. Collect papers for use in Part Two. Part Two 13. Distribute a copy of Bar Graph with Intervals of Ten, Attachment H, to each student. Use a
transparency of this worksheet to display answers on the overhead. Using class instruction, discuss all parts of the graph including title, categories, scale and intervals. Refer to Part One, step 2 for specific questions.
14. Continue having students read each question and their answer. Ask, • How did you know that? • How did you solve that problem? Discuss the range of possible answers on problems three through eight, allowing students to explain their reasoning in determining the value of the bar. Fill in the range of possible answers on the transparency, such as 46, 47 or 48 students.
15. Ask questions to analyze and apply the information, such as, • What kinds of food should restaurant owners make available as meals for kids? (The
graph shows that cheeseburgers and chicken nuggets are the most popular). 16. Collect papers for use in Part Four. 17. Distribute previously completed student copies of Bar Graph with Intervals of Two,
Attachment F, Bar Graph with Intervals of Five, Attachment G and Bar Graph with Intervals of Ten, Attachment H. Use these graphs to have students compare/contrast differences in recording information on bar graphs and discover what parts are necessary in all graphs.
18. Have students write in a mathematics journal or on paper, one component of a bar graph that may vary in any given graph (e.g.: the intervals will be different depending on the size of the numbers and the limits of the graph; the bars may be horizontal or vertical depending on where the categories are entered, etc). Have students share responses with their group to generate further discussion.
Part Three 19. Discuss and brainstorm favorite school lunches.
a. List the foods vertically on the board as students suggest them, For example: • pizza • macaroni and cheese • corn dogs • cheeseburger • chicken nuggets
b. After listing many favorite lunches, choose five or six of the most popular.
Bar Graphs with Intervals – Grade Three
5
c. Tell students to vote on these to determine the class favorites. Allow each student to vote
three times to generate sufficient data. Draw lines under each food to make the lunch list into a tally chart:
pizza macaroni and cheese corn dogs cheeseburgers chicken nuggets
d. Have students vote and tally the number of raised hands for each lunch.
20. Have the class make a bar graph of the information. a. Distribute a sheet of one-inch grid paper (or a copy of Blank Grid, Attachment J) to each
student. Use a transparency of the grid paper or Attachment J on the overhead to create a bar graph with the students.
b. Ask students questions about constructing the bar graph such as, • What information should be included on the graph? • What is a possible title for the graph? • Where are the types of lunches placed on the graph? • Where are the numbers placed? • What intervals could be used for our graph? Why? • How would we show the number of pizzas on the graph?
21. Summarize the information on the graph. Select students to tell something they know by looking at the graph or have them formulate a question to ask the class. Have students share these questions with the class, choose students to give answers and tell how they got their answers.
22. Ask questions to have students analyze or apply the data such as, • Would this information be useful to our cafeteria manager when planning student
lunches? • Would they need more information? (yes, surveys from other classes) • Would the sales of school lunches rise if our favorite food were served once a week?
23. To summarize construction of a bar graph, have students create a list of the components needed when constructing a bar graph. Circulate to assist. Have students share their ideas with the class by listing each component at the board or on chart paper. Students may make corrections and additions in their journal as the list is completed. (Use the bulleted checklist in step 19 to assure completeness of list.)
24. Have the class create a bar graph working with a partner. Display this information on the board, or the overhead: Jamal, Juan, Henry and Mario like to trade baseball cards. Jamal has 73 cards. Juan just started collecting, and he has 28 cards. Henry had the most baseball cards, but gave some to his sister. Now he has 66 cards. Mario had 52 and he bought a pack of 10 baseball cards at the store today. Now Mario has 62 cards. Make a bar graph to show this information.
Bar Graphs with Intervals – Grade Three
6
25. Pair the students. Distribute one-inch grid paper (or a copy of Blank Grid, Attachment J) to
each student. Students work together to read, discuss, brainstorm ideas and construct the graph (each student must make a graph). Write this list on the board or chart paper for
students to use as a checklist: • Title of graph • Label – horizontal axis (for the columns) • Category or Intervals – horizontal axis • Label – vertical axis (for the rows) • Category or Intervals – vertical axis • Bars shaded to show data
26. Circulate to observe, assist, and ask leading questions to guide the construction of the graph. Have students explain what they are drawing and why.
27. Have students visit other groups to see various ways of making a bar graph and to get ideas if they are not sure what to do. When all groups are finished, have each group display their graph telling how they constructed it.
Differentiated Instructional Support: Instruction is differentiated according to learner needs, to help all learners either meet the intent of the specified indicator(s) or, if the indicator is already met, to advance beyond the specified indicator(s). • Provide students with counters to represent the quantity at each interval. For example, the
graph shown uses an interval of three. Allow students to place three counters between each interval to represent concretely.
• Collect data from newspapers or magazines using numbers through 1,000 and have students create graphs and choose appropriate intervals.
Extensions: Opportunities for graphing occur each day in the classroom such as 1. Keep a graph of the weather and adding to it daily over the course of a month, season or year. 2. Create and display a birthday graph to show all students’ birthdays. 3. Have students conduct surveys of classmates, tally the information and create bar graphs
(e.g., favorite pizza toppings, favorite cartoon shows, favorite candy bars, eye color, favorite school subject, favorite pets, etc.)
4. Use data in other subject areas and (e.g. science experiments, population, land area) have students create bar graphs to compare/contrast the information.
Home Connections: • Collect data from home and create a bar graph such as: types of shoes, coins in a bank,
different clothing items (shirts, pants, shorts, etc.), types of books, etc. • Have students find displays (such as cereal boxes or from media) that show bar graphs with
intervals greater than one.
Bar Graphs with Intervals – Grade Three
7
Interdisciplinary Connections: Content Area: Science Standard: Scientific Inquiry Benchmark: B. Organize and evaluate observations, measurements and other data to formulate
inferences and conclusions. Indicators: 3. Read and interpret simple tables and graphs produced by self/others. 5. Record and organize observations (e.g., journals, charts and tables). Being able to graph and interpret data correctly is an important skill necessary for scientific inquiry. Materials and Resources: The inclusion of a specific resource in any lesson formulated by the Ohio Department of Education should not be interpreted as an endorsement of that particular resource, or any of its contents, by the Ohio Department of Education. The Ohio Department of Education does not endorse any particular resource. The Web addresses listed are for a given site’s main page, therefore, it may be necessary to search within that site to find the specific information required for a given lesson. Please note that information published on the Internet changes over time, therefore the links provided may no longer contain the specific information related to a given lesson. Teachers are advised to preview all sites before using them with students. For the teacher: chalkboard, chalk, overhead transparency of Attachments A, E, H, and J, overhead markers For the student: counters, crayons, grid paper, pencils Vocabulary: • axis • bar graph • horizontal • interval • vertical Technology Connections: Use computer encyclopedias or online sources to collect data about given topics. Students can then use available computer software to create bar graphs. Research Connections: Burns, Marilyn. About Teaching Mathematics: A K-8 Resource. Sausalito, Ca: Math Solutions Publications, 1992. Sousa, David A. How the Brain Learns: A Classroom Teacher’s Guide. Reston, VA.: NASSP, 1995.
Bar Graphs with Intervals – Grade Three
8
General Tips: Prior to class: • Reproduce a class set of:
1. Pre-Assessment, Attachment A 2. Post-Assessment, Attachment B 3. Number Lines, Attachment E 4. Bar Graph with Intervals of Two, Attachment F 5. Bar Graph with Intervals of Five, Attachment G 6. Bar Graph with Intervals of Ten, Attachment H 7. Blank Grid, Attachment J, if needed (one inch grid paper may be used)
• Make transparencies of: 1. Pre-Assessment, Attachment A 2. Number Lines, Attachment E 3. Bar Graph with Intervals of Ten, Attachment H 4. Blank Grid, Attachment J, or one-inch graph paper
Attachments: Attachment A, Pre-Assessment Attachment B, Post-Assessment Attachment C, Post-Assessment Part B Answer Key Attachment D, Post- Assessment Scoring Rubric Attachment E, Number Lines Attachment F, Bar Graph with Intervals of Two Attachment G, Bar Graph with Intervals of Five Attachment H, Bar Graph with Intervals of Ten Attachment I, Bar Graph with Intervals of Ten Answer Key Attachment J, Blank Grid
Bar Graphs with Intervals – Grade Three
9
Attachment A
Pre-Assessment
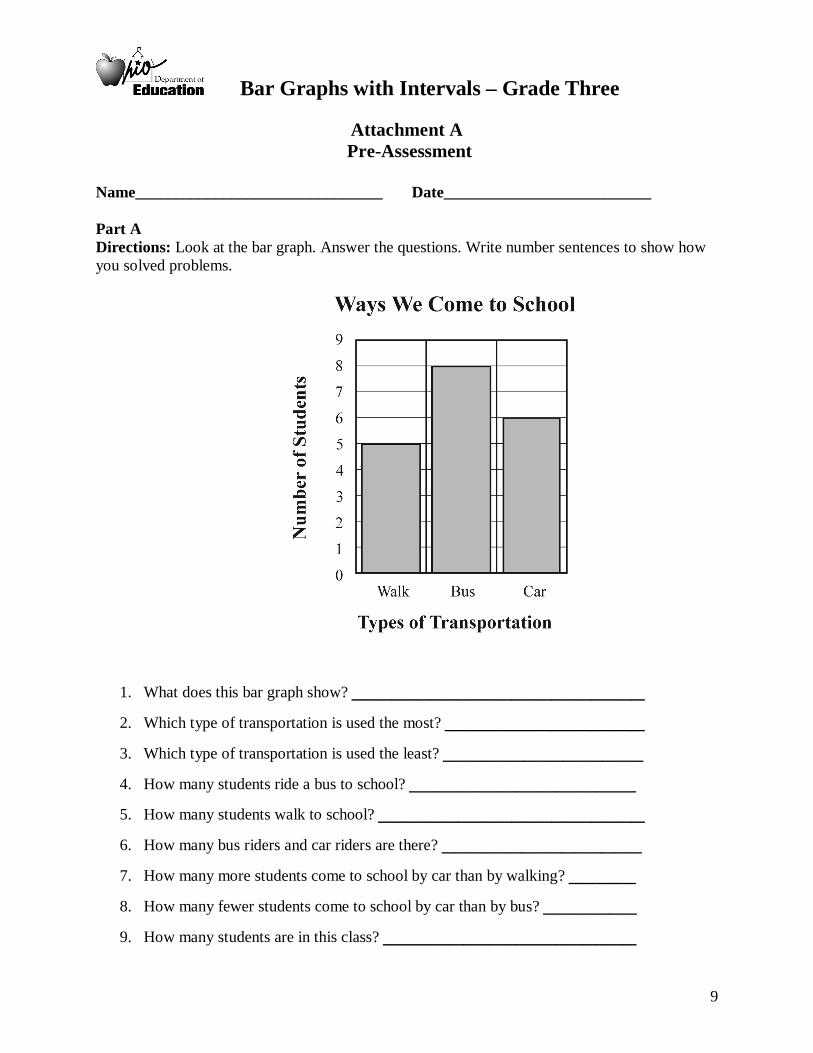
Name_______________________________ Date__________________________ Part A Directions: Look at the bar graph. Answer the questions. Write number sentences to show how you solved problems.
1. What does this bar graph show? ______________________
2. Which type of transportation is used the most? _______________
3. Which type of transportation is used the least? _______________
4. How many students ride a bus to school? _________________
5. How many students walk to school? ____________________
6. How many bus riders and car riders are there? _______________
7. How many more students come to school by car than by walking? _____
8. How many fewer students come to school by car than by bus? _______
9. How many students are in this class? ___________________
Bar Graphs with Intervals– Grade Three
10
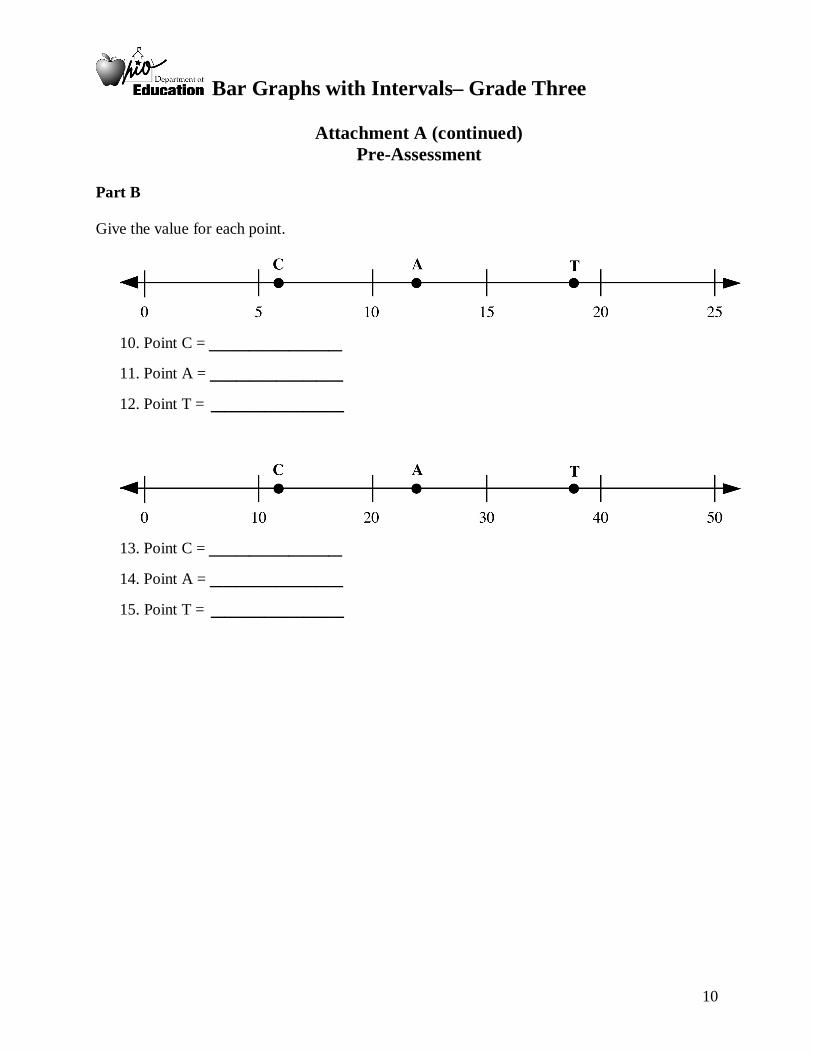
Attachment A (continued)
Pre-Assessment
Part B
Give the value for each point.
10. Point C = __________
11. Point A = __________
12. Point T = __________
13. Point C = __________
14. Point A = __________
15. Point T = __________
Bar Graphs with Intervals– Grade Three
11
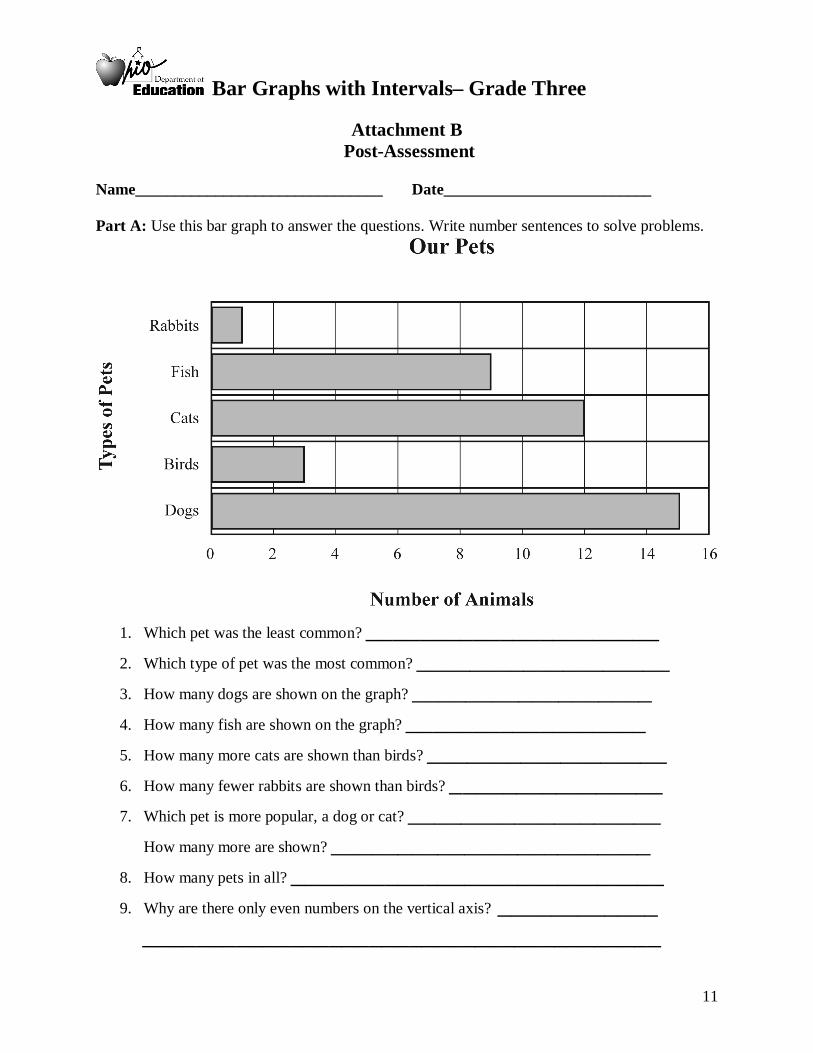
Attachment B
Post-Assessment
Name_______________________________ Date__________________________ Part A: Use this bar graph to answer the questions. Write number sentences to solve problems.
1. Which pet was the least common? ______________________
2. Which type of pet was the most common? ___________________
3. How many dogs are shown on the graph? __________________
4. How many fish are shown on the graph? __________________
5. How many more cats are shown than birds? __________________
6. How many fewer rabbits are shown than birds? ________________
7. Which pet is more popular, a dog or cat? ___________________
How many more are shown? ________________________
8. How many pets in all? ____________________________
9. Why are there only even numbers on the vertical axis? ____________
_______________________________________
Bar Graphs with Intervals– Grade Three
12
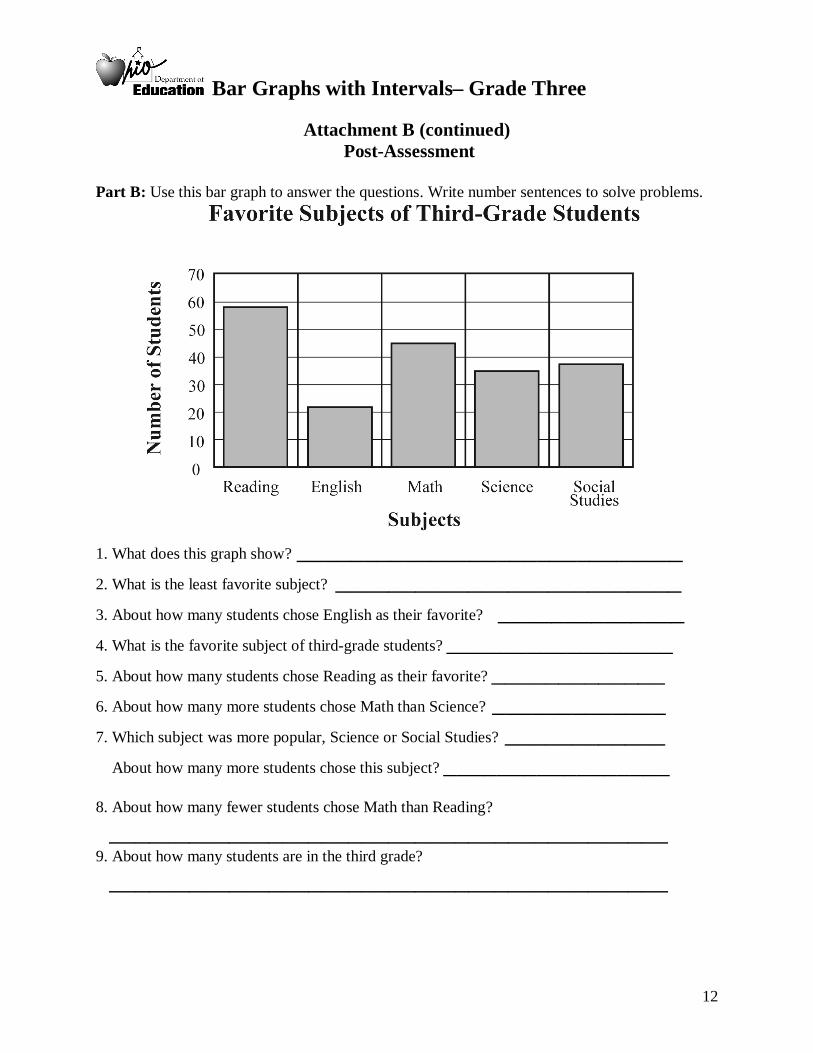
Attachment B (continued)
Post-Assessment
Part B: Use this bar graph to answer the questions. Write number sentences to solve problems.
1. What does this graph show? _____________________________ 2. What is the least favorite subject? __________________________ 3. About how many students chose English as their favorite? ______________
4. What is the favorite subject of third-grade students? _________________
5. About how many students chose Reading as their favorite? _____________
6. About how many more students chose Math than Science? _____________
7. Which subject was more popular, Science or Social Studies? ____________
About how many more students chose this subject? _________________ 8. About how many fewer students chose Math than Reading?
__________________________________________ 9. About how many students are in the third grade? __________________________________________
Bar Graphs with Intervals– Grade Three
13
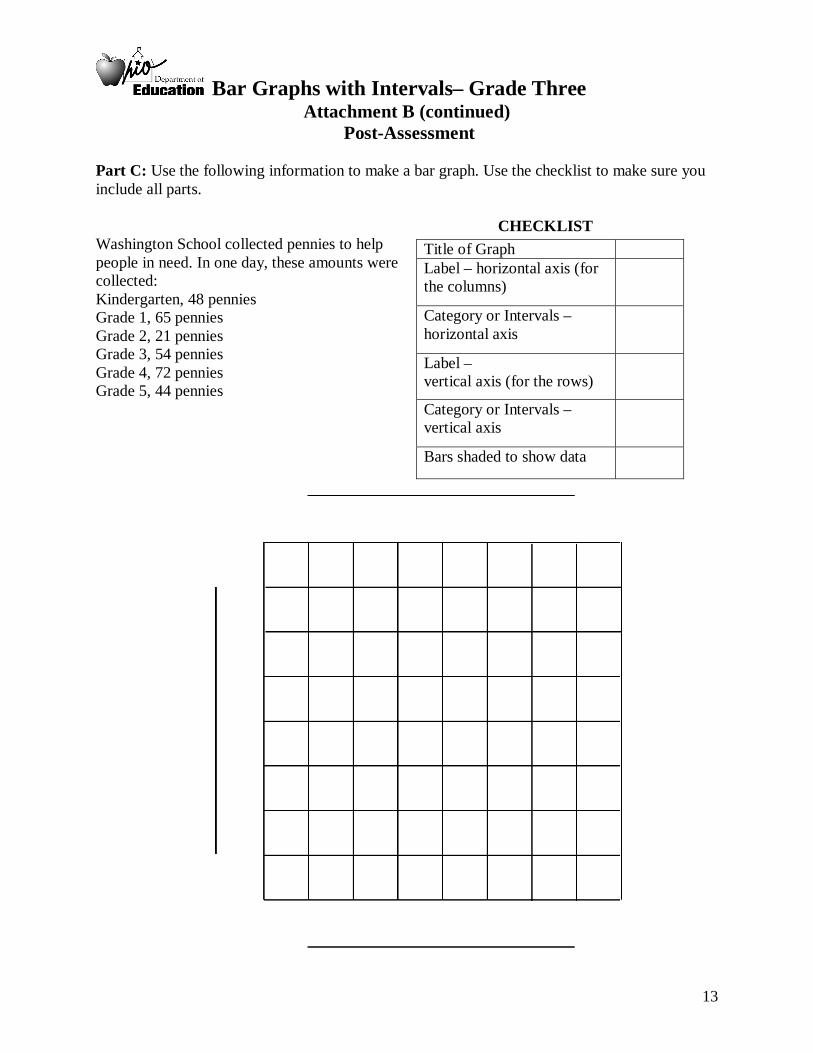
Attachment B (continued) Post-Assessment
Part C: Use the following information to make a bar graph. Use the checklist to make sure you include all parts. CHECKLIST Washington School collected pennies to help people in need. In one day, these amounts were collected: Kindergarten, 48 pennies Grade 1, 65 pennies Grade 2, 21 pennies Grade 3, 54 pennies Grade 4, 72 pennies Grade 5, 44 pennies
Title of Graph Label – horizontal axis (for the columns)
Category or Intervals – horizontal axis
Label – vertical axis (for the rows)
Category or Intervals – vertical axis
Bars shaded to show data
Bar Graphs with Intervals– Grade Three
14
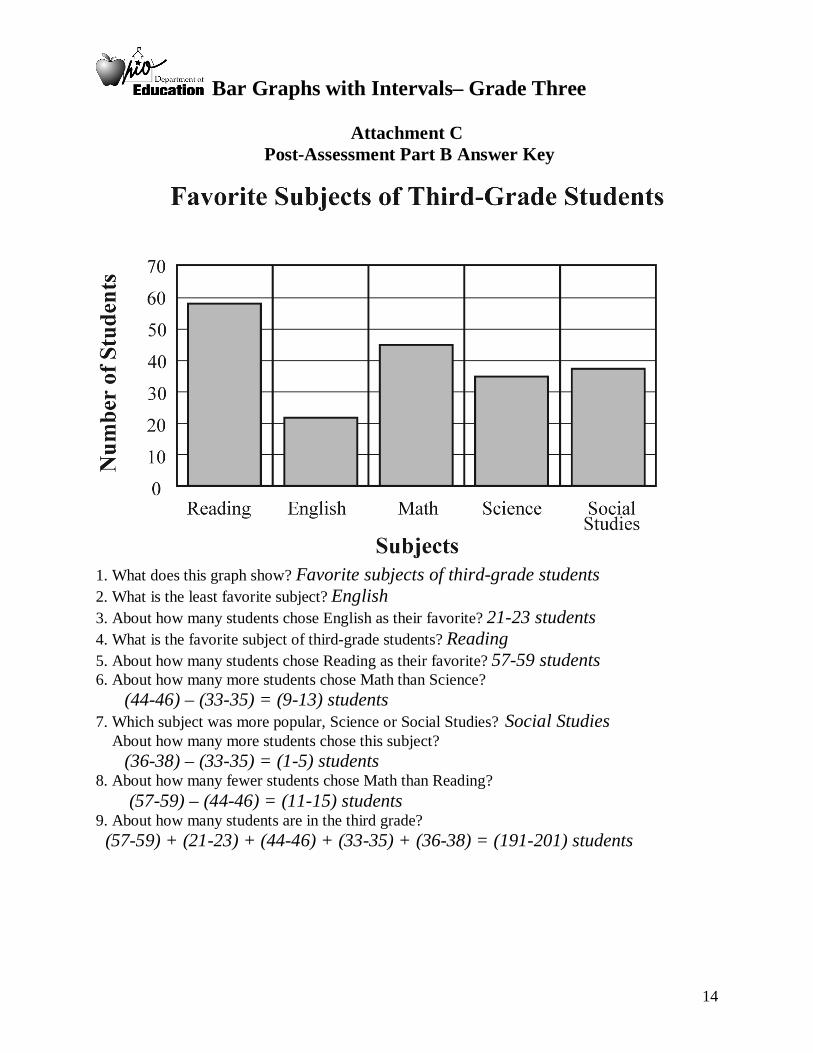
Attachment C
Post-Assessment Part B Answer Key
1. What does this graph show? Favorite subjects of third-grade students 2. What is the least favorite subject? English 3. About how many students chose English as their favorite? 21-23 students 4. What is the favorite subject of third-grade students? Reading 5. About how many students chose Reading as their favorite? 57-59 students 6. About how many more students chose Math than Science? (44-46) – (33-35) = (9-13) students 7. Which subject was more popular, Science or Social Studies? Social Studies About how many more students chose this subject? (36-38) – (33-35) = (1-5) students 8. About how many fewer students chose Math than Reading? (57-59) – (44-46) = (11-15) students 9. About how many students are in the third grade? (57-59) + (21-23) + (44-46) + (33-35) + (36-38) = (191-201) students
Bar Graphs with Intervals– Grade Three
15
Attachment D
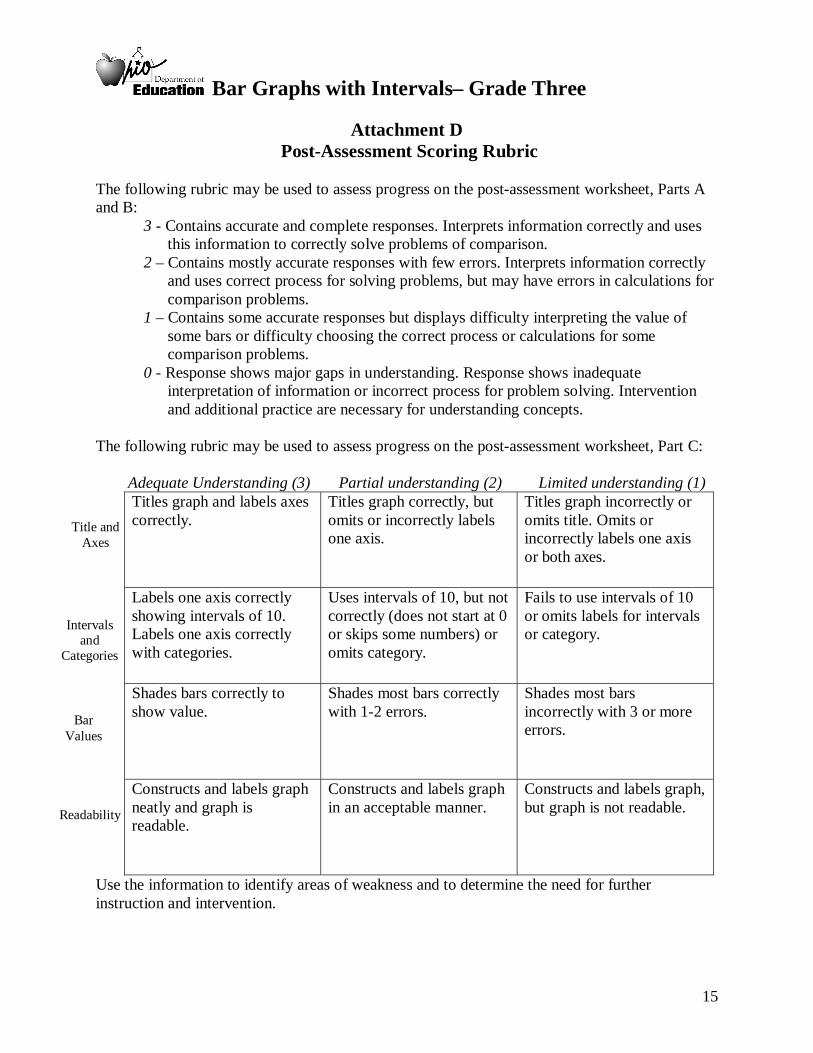
Post-Assessment Scoring Rubric The following rubric may be used to assess progress on the post-assessment worksheet, Parts A and B:
3 - Contains accurate and complete responses. Interprets information correctly and uses this information to correctly solve problems of comparison.
2 – Contains mostly accurate responses with few errors. Interprets information correctly and uses correct process for solving problems, but may have errors in calculations for comparison problems.
1 – Contains some accurate responses but displays difficulty interpreting the value of some bars or difficulty choosing the correct process or calculations for some comparison problems.
0 - Response shows major gaps in understanding. Response shows inadequate interpretation of information or incorrect process for problem solving. Intervention and additional practice are necessary for understanding concepts.
The following rubric may be used to assess progress on the post-assessment worksheet, Part C: Adequate Understanding (3) Partial understanding (2) Limited understanding (1)
Titles graph and labels axes correctly.
Titles graph correctly, but omits or incorrectly labels one axis.
Titles graph incorrectly or omits title. Omits or incorrectly labels one axis or both axes.
Labels one axis correctly showing intervals of 10. Labels one axis correctly with categories.
Uses intervals of 10, but not correctly (does not start at 0 or skips some numbers) or omits category.
Fails to use intervals of 10 or omits labels for intervals or category.
Shades bars correctly to show value.
Shades most bars correctly with 1-2 errors.
Shades most bars incorrectly with 3 or more errors.
Constructs and labels graph neatly and graph is readable.
Constructs and labels graph in an acceptable manner.
Constructs and labels graph, but graph is not readable.
Use the information to identify areas of weakness and to determine the need for further instruction and intervention.
Title and Axes
Intervals and
Categories
Bar Values
Readability
Bar Graphs with Intervals– Grade Three
16
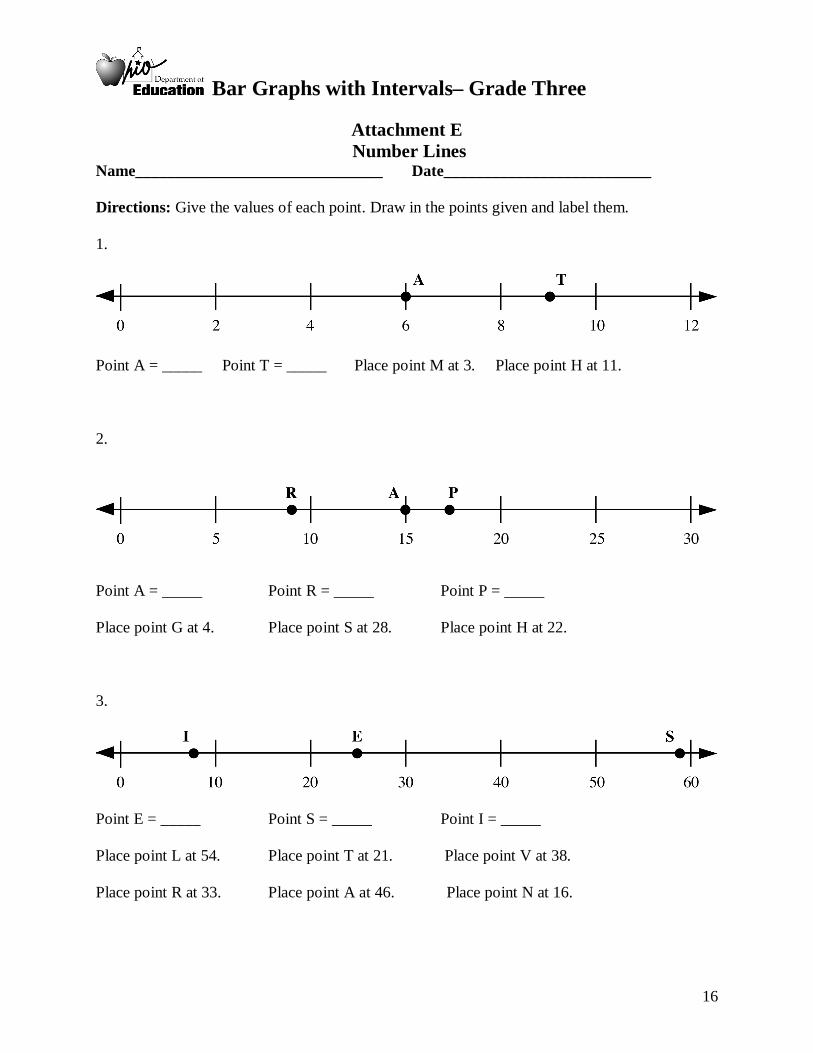
Attachment E Number Lines
Name_______________________________ Date__________________________ Directions: Give the values of each point. Draw in the points given and label them. 1.
Point A = _____ Point T = _____ Place point M at 3. Place point H at 11. 2.
Point A = _____ Point R = _____ Point P = _____ Place point G at 4. Place point S at 28. Place point H at 22. 3.
Point E = _____ Point S = _____ Point I = _____ Place point L at 54. Place point T at 21. Place point V at 38. Place point R at 33. Place point A at 46. Place point N at 16.
Bar Graphs with Intervals– Grade Three
17
Attachment E (continued)
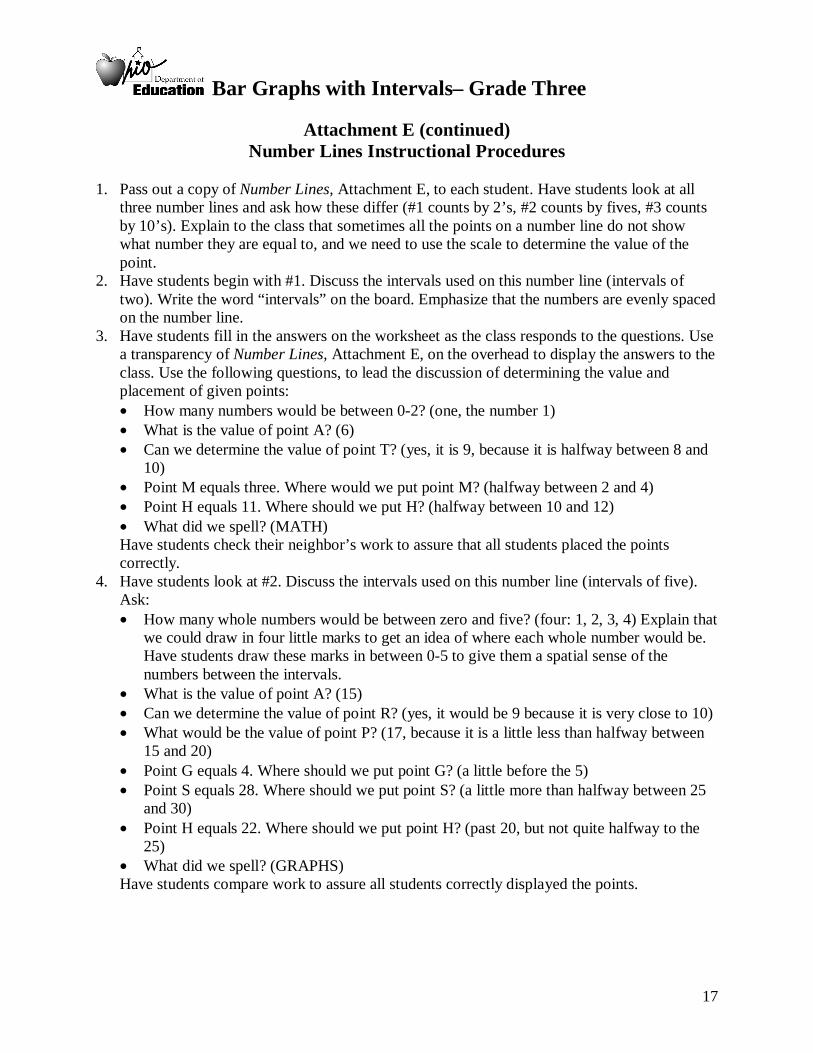
Number Lines Instructional Procedures 1. Pass out a copy of Number Lines, Attachment E, to each student. Have students look at all
three number lines and ask how these differ (#1 counts by 2’s, #2 counts by fives, #3 counts by 10’s). Explain to the class that sometimes all the points on a number line do not show what number they are equal to, and we need to use the scale to determine the value of the point.
2. Have students begin with #1. Discuss the intervals used on this number line (intervals of two). Write the word “intervals” on the board. Emphasize that the numbers are evenly spaced on the number line.
3. Have students fill in the answers on the worksheet as the class responds to the questions. Use a transparency of Number Lines, Attachment E, on the overhead to display the answers to the class. Use the following questions, to lead the discussion of determining the value and placement of given points: • How many numbers would be between 0-2? (one, the number 1) • What is the value of point A? (6) • Can we determine the value of point T? (yes, it is 9, because it is halfway between 8 and
10) • Point M equals three. Where would we put point M? (halfway between 2 and 4) • Point H equals 11. Where should we put H? (halfway between 10 and 12) • What did we spell? (MATH) Have students check their neighbor’s work to assure that all students placed the points correctly.
4. Have students look at #2. Discuss the intervals used on this number line (intervals of five). Ask: • How many whole numbers would be between zero and five? (four: 1, 2, 3, 4) Explain that
we could draw in four little marks to get an idea of where each whole number would be. Have students draw these marks in between 0-5 to give them a spatial sense of the numbers between the intervals.
• What is the value of point A? (15) • Can we determine the value of point R? (yes, it would be 9 because it is very close to 10) • What would be the value of point P? (17, because it is a little less than halfway between
15 and 20) • Point G equals 4. Where should we put point G? (a little before the 5) • Point S equals 28. Where should we put point S? (a little more than halfway between 25
and 30) • Point H equals 22. Where should we put point H? (past 20, but not quite halfway to the
25) • What did we spell? (GRAPHS) Have students compare work to assure all students correctly displayed the points.
Bar Graphs with Intervals– Grade Three
18
Attachment E (continued)
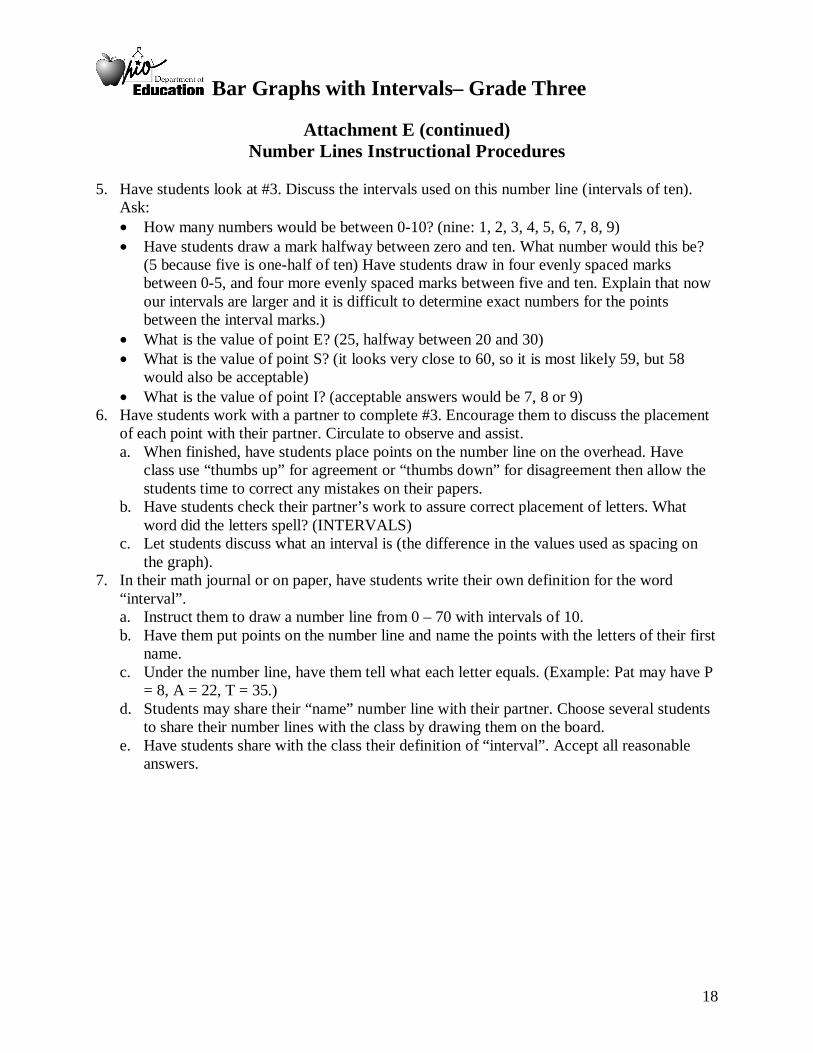
Number Lines Instructional Procedures 5. Have students look at #3. Discuss the intervals used on this number line (intervals of ten).
Ask: • How many numbers would be between 0-10? (nine: 1, 2, 3, 4, 5, 6, 7, 8, 9) • Have students draw a mark halfway between zero and ten. What number would this be?
(5 because five is one-half of ten) Have students draw in four evenly spaced marks between 0-5, and four more evenly spaced marks between five and ten. Explain that now our intervals are larger and it is difficult to determine exact numbers for the points between the interval marks.)
• What is the value of point E? (25, halfway between 20 and 30) • What is the value of point S? (it looks very close to 60, so it is most likely 59, but 58
would also be acceptable) • What is the value of point I? (acceptable answers would be 7, 8 or 9)
6. Have students work with a partner to complete #3. Encourage them to discuss the placement of each point with their partner. Circulate to observe and assist. a. When finished, have students place points on the number line on the overhead. Have
class use “thumbs up” for agreement or “thumbs down” for disagreement then allow the students time to correct any mistakes on their papers.
b. Have students check their partner’s work to assure correct placement of letters. What word did the letters spell? (INTERVALS)
c. Let students discuss what an interval is (the difference in the values used as spacing on the graph).
7. In their math journal or on paper, have students write their own definition for the word “interval”. a. Instruct them to draw a number line from 0 – 70 with intervals of 10. b. Have them put points on the number line and name the points with the letters of their first
name. c. Under the number line, have them tell what each letter equals. (Example: Pat may have P
= 8, A = 22, T = 35.) d. Students may share their “name” number line with their partner. Choose several students
to share their number lines with the class by drawing them on the board. e. Have students share with the class their definition of “interval”. Accept all reasonable
answers.
Bar Graphs with Intervals– Grade Three
19
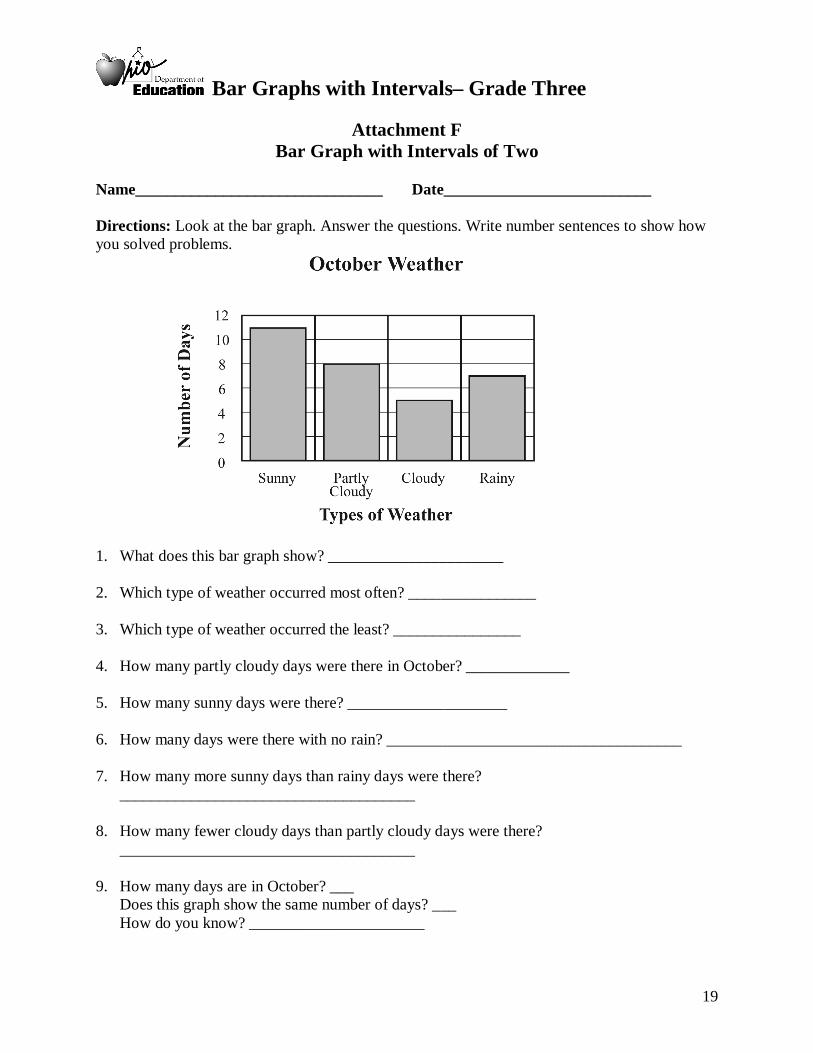
Attachment F
Bar Graph with Intervals of Two
Name_______________________________ Date__________________________ Directions: Look at the bar graph. Answer the questions. Write number sentences to show how you solved problems.
1. What does this bar graph show? ______________________ 2. Which type of weather occurred most often? ________________ 3. Which type of weather occurred the least? ________________ 4. How many partly cloudy days were there in October? _____________ 5. How many sunny days were there? ____________________ 6. How many days were there with no rain? _____________________________________ 7. How many more sunny days than rainy days were there?
_____________________________________ 8. How many fewer cloudy days than partly cloudy days were there?
_____________________________________ 9. How many days are in October? ___ Does this graph show the same number of days? ___ How do you know? ______________________
Bar Graphs with Intervals– Grade Three
20
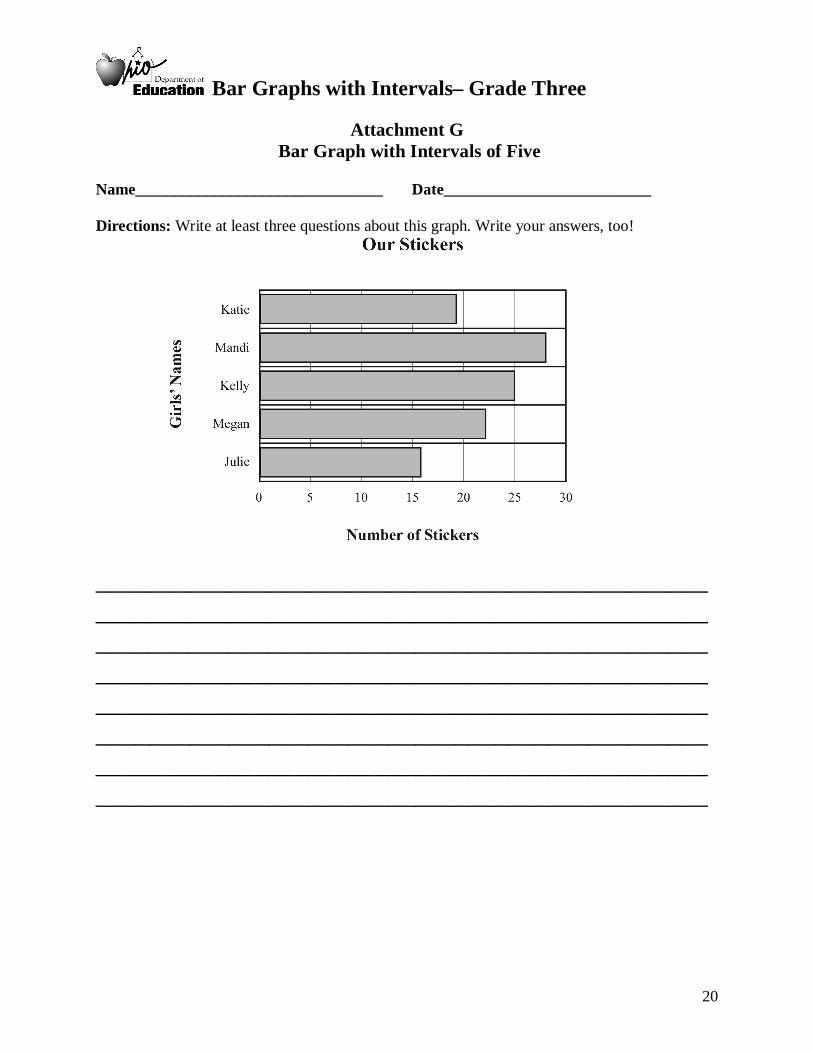
Attachment G
Bar Graph with Intervals of Five
Name_______________________________ Date__________________________ Directions: Write at least three questions about this graph. Write your answers, too!
______________________________________________________________________________________________________________________________________________________________________________________________________________________________________
______________________________________________
______________________________________________
______________________________________________
Bar Graphs with Intervals– Grade Three
21
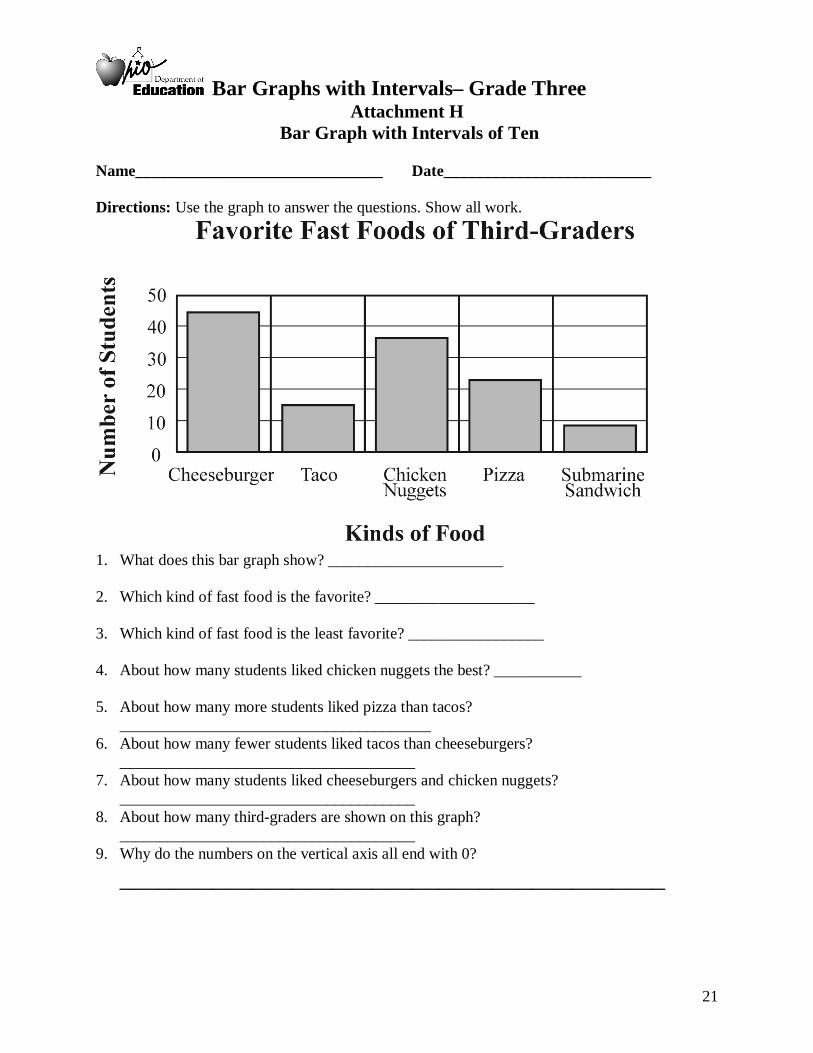
Attachment H Bar Graph with Intervals of Ten
Name_______________________________ Date__________________________ Directions: Use the graph to answer the questions. Show all work.
1. What does this bar graph show? ______________________ 2. Which kind of fast food is the favorite? ____________________ 3. Which kind of fast food is the least favorite? _________________ 4. About how many students liked chicken nuggets the best? ___________ 5. About how many more students liked pizza than tacos? _______________________________________ 6. About how many fewer students liked tacos than cheeseburgers?
_____________________________________ 7. About how many students liked cheeseburgers and chicken nuggets?
_____________________________________ 8. About how many third-graders are shown on this graph?
_____________________________________ 9. Why do the numbers on the vertical axis all end with 0?
_________________________________________
Bar Graphs with Intervals– Grade Three
22
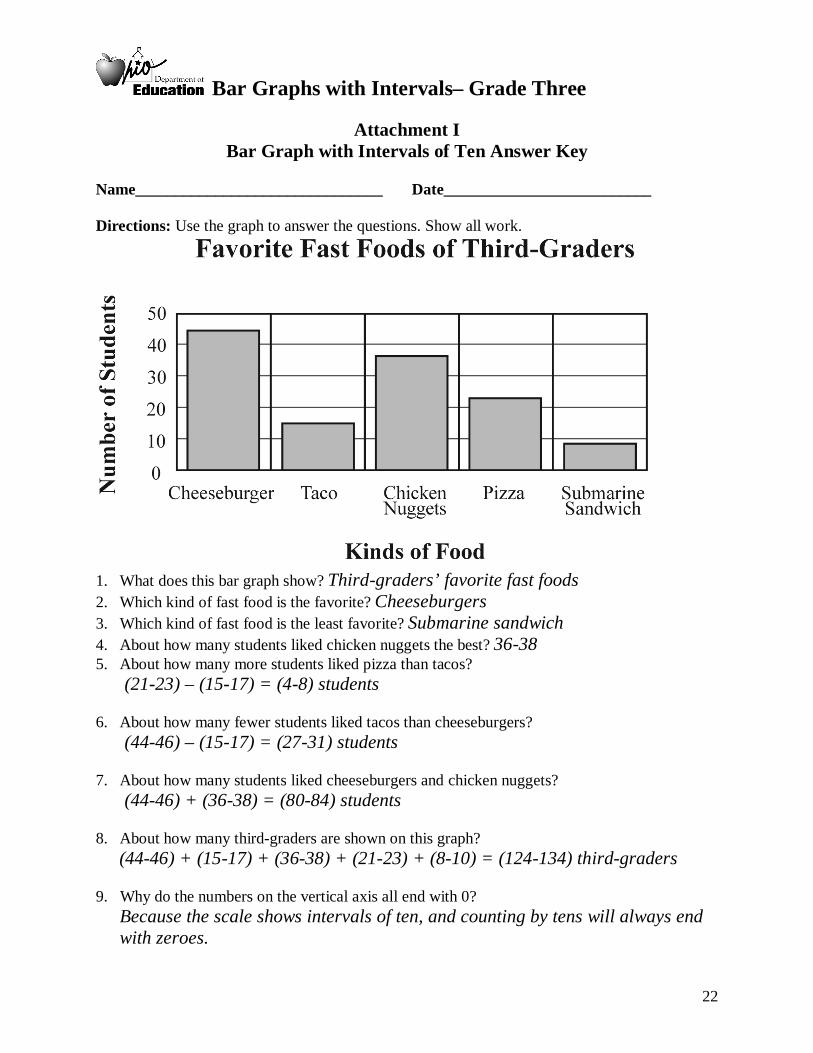
Attachment I
Bar Graph with Intervals of Ten Answer Key
Name_______________________________ Date__________________________ Directions: Use the graph to answer the questions. Show all work.
1. What does this bar graph show? Third-graders’ favorite fast foods 2. Which kind of fast food is the favorite? Cheeseburgers 3. Which kind of fast food is the least favorite? Submarine sandwich 4. About how many students liked chicken nuggets the best? 36-38 5. About how many more students liked pizza than tacos? (21-23) – (15-17) = (4-8) students 6. About how many fewer students liked tacos than cheeseburgers? (44-46) – (15-17) = (27-31) students 7. About how many students liked cheeseburgers and chicken nuggets? (44-46) + (36-38) = (80-84) students 8. About how many third-graders are shown on this graph? (44-46) + (15-17) + (36-38) + (21-23) + (8-10) = (124-134) third-graders 9. Why do the numbers on the vertical axis all end with 0? Because the scale shows intervals of ten, and counting by tens will always end
with zeroes.
Bar Graphs with Intervals– Grade Three
23
Attachment J Blank Grid
Name_______________________________ Date__________________________