Embed Size (px)
Citation preview

Fretting Wear Mechanisms in A216 Plain Carbon Steel
By
Alyssa Anne Maich
A dissertation submitted in partial satisfaction of the
requirements for the degree of
Doctor of Philosophy
in
Engineering – Materials Science and Engineering
in the
Graduate Division
of the
University of California, Berkeley
Committee in charge:
Professor Ronald Gronsky, Co-Chair
Professor Kyriakos Komvopoulos, Co-Chair
Professor Fiona Doyle
Professor Lisa Pruitt
Spring 2016

Fretting Wear Mechanisms in A216 Plain Carbon Steel
Copyright 2016
By
Alyssa Anne Maich
1
Abstract
Fretting Wear Mechanisms in A216 Plain Carbon Steel
by
Alyssa Anne Maich
Doctor of Philosophy
University of California, Berkeley
Professor Ronald Gronsky, Co-Chair
Professor Kyriakos Komvopoulos, Co-Chair
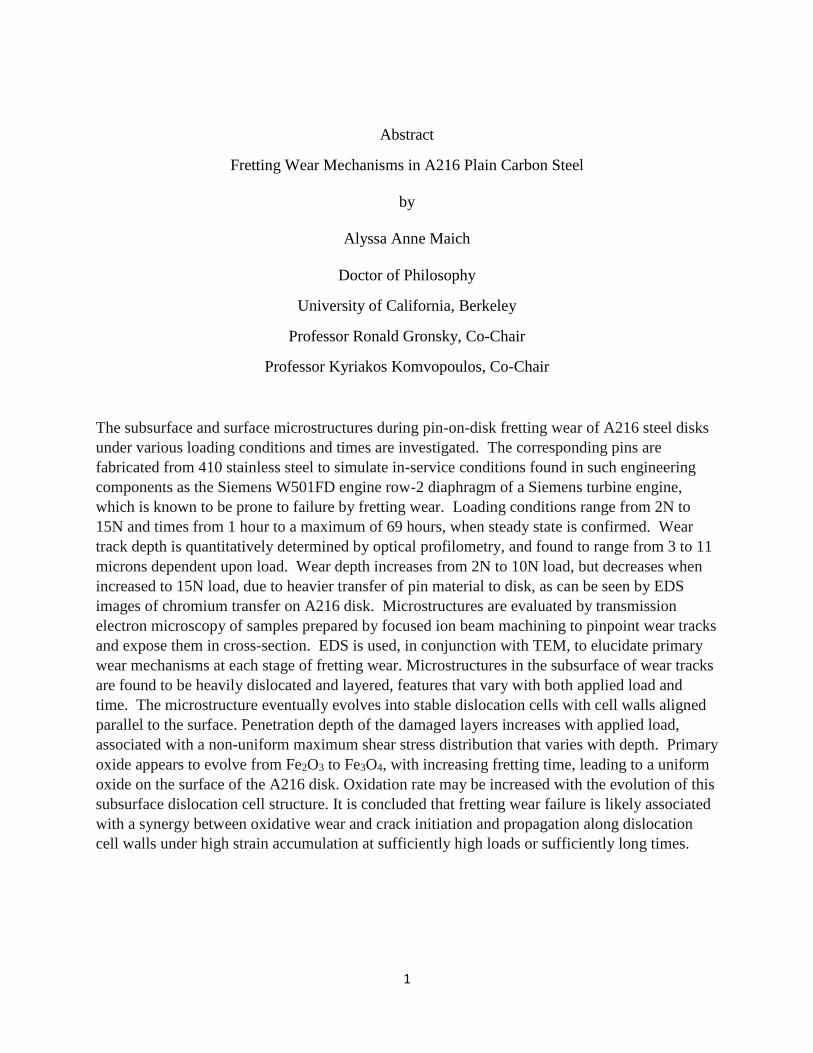
The subsurface and surface microstructures during pin-on-disk fretting wear of A216 steel disks
under various loading conditions and times are investigated. The corresponding pins are
fabricated from 410 stainless steel to simulate in-service conditions found in such engineering
components as the Siemens W501FD engine row-2 diaphragm of a Siemens turbine engine,
which is known to be prone to failure by fretting wear. Loading conditions range from 2N to
15N and times from 1 hour to a maximum of 69 hours, when steady state is confirmed. Wear
track depth is quantitatively determined by optical profilometry, and found to range from 3 to 11
microns dependent upon load. Wear depth increases from 2N to 10N load, but decreases when
increased to 15N load, due to heavier transfer of pin material to disk, as can be seen by EDS
images of chromium transfer on A216 disk. Microstructures are evaluated by transmission
electron microscopy of samples prepared by focused ion beam machining to pinpoint wear tracks
and expose them in cross-section. EDS is used, in conjunction with TEM, to elucidate primary
wear mechanisms at each stage of fretting wear. Microstructures in the subsurface of wear tracks
are found to be heavily dislocated and layered, features that vary with both applied load and
time. The microstructure eventually evolves into stable dislocation cells with cell walls aligned
parallel to the surface. Penetration depth of the damaged layers increases with applied load,
associated with a non-uniform maximum shear stress distribution that varies with depth. Primary
oxide appears to evolve from Fe2O3 to Fe3O4, with increasing fretting time, leading to a uniform
oxide on the surface of the A216 disk. Oxidation rate may be increased with the evolution of this
subsurface dislocation cell structure. It is concluded that fretting wear failure is likely associated
with a synergy between oxidative wear and crack initiation and propagation along dislocation
cell walls under high strain accumulation at sufficiently high loads or sufficiently long times.

i
For my son, Anthony Jase.

ii
Contents
Dedication ..................................................................................................................................................... i
Contents ....................................................................................................................................................... ii
List of Abbreviations and Symbols........................................................................................................... iii
Acknowledgements .................................................................................................................................... iv
Chapter 1 Background ............................................................................................................................... 1
1.1 Wear .................................................................................................................................................... 1
1.2 Wear Mechanisms ............................................................................................................................... 3
1.21 Adhesive Wear .............................................................................................................................. 5
1.22. Abrasive Wear ............................................................................................................................. 6
1.23 Fatigue Wear ................................................................................................................................. 8
1.24 Corrosive Wear ............................................................................................................................. 8
1.3 Fretting Wear .................................................................................................................................... 10
1.4 Properties of Steels ............................................................................................................................ 12
Chapter 2 Materials and Methods ........................................................................................................... 17
2.1 Specimens ......................................................................................................................................... 17
2.2 Fretting Wear Apparatus ................................................................................................................... 18
2.3 Profilometry ...................................................................................................................................... 19
2.4 Microanalysis Methods ..................................................................................................................... 19
2.4.1 Analysis of Worn Surfaces ........................................................................................................ 19
2.4.2 Analysis of Damaged Subsurface .............................................................................................. 20
i. Focused Ion Beam (FIB) ............................................................................................................. 20
ii. Transmission Electron Microscopy (TEM) ............................................................................... 21
Chapter 3 Results ...................................................................................................................................... 22
3.1 Surface Wear Features ...................................................................................................................... 22
3.1.1 Effect of Normal Load ............................................................................................................... 22
3.1.2 Effect of Sliding Time................................................................................................................ 22
3.2 Subsurface Wear Features ................................................................................................................. 30
3.2.1 Features of Cross-Sections Parallel VS. Perpendicular to Wear Direction ................................ 30
3.2.2 Features with Increasing Applied Load ..................................................................................... 31
3.2.3 Features with Increasing Time with 2N Load ............................................................................ 33
3.2.4 Subsurface Wear Features of Pin (Parallel to Wear Direction) ................................................. 34
3.3 Image Compilations Emphasizing Trends ........................................................................................ 35
Chapter 4 Discussion ................................................................................................................................ 37
4.1 Dislocation Cells/Persistent Slip Bands (PSBs) ................................................................................ 38
4.2 Microstructure Development ............................................................................................................ 44
4.3 Wear of Oxide Layer ......................................................................................................................... 44
4.4 Transfer of 410 Stainless Steel Pin to A216 Carbon Steel Disk ....................................................... 47
Chapter 5 Conclusions .............................................................................................................................. 48
Chapter 6 Recommendations for Further Work ................................................................................... 49
REFERENCES CITED ............................................................................................................................... 50

iii
List of Abbreviations and Symbols
Abbreviations
ASTM American Society for Testing of Materials
SEM Scanning Electron Microscope/Microscopy
BCC Body-Centered Cubic
FCC Face-Centered Cubic
BCT Body-Centered Tetragonal
HCP Hexagonal Close-Packed
CCT Continuous Cooling Transformation
EDS Energy Dispersive Spectrometry/ Spectroscopy
TEM Transmission Electron Microscope/Microscopy
SAD Selected Area Diffraction
FIB Focused Ion Beam
PSB Persistent Slip Band
Symbols
k Archard’s wear coefficient
V Wear volume
x Sliding distance
L Normal/Applied load
H Hardness
pm Yield stress
Z Holm’s wear coefficient
kab Abrasive wear coefficient
τR Resolved shear stress
γ Shear strain

iv
Acknowledgements
I would like to express my deepest gratitude to my PhD advisors, Professor Ronald Gronsky and
Professor Kyriakos Komvopoulos, for their unwavering support, collegiality, and mentorship
throughout this project. Our discussions, over the years, have been invaluable. You have both
become part of a second family to me and without your support and guidance I wouldn’t be
where I am today. I could not have imagined better advisors and mentors for my PhD study.
I would like to extend my thanks to those who have offered collegial guidance and support over
the years: Professor Fiona Doyle, Professor Oscar Dubon, Dr. Chris Kumai, Dr. Mehrzad Tartibi,
and Dr. Huaming Xu. Your support and guidance is appreciated more than you will ever know.
I would like to thank my family and friends for their unwavering support and votes of confidence
through the many ups and downs I have been through the past few years. Without such a strong
support group I wouldn’t have made it to the very end.
I would like to thank my son, Anthony Jase. You have given me an entirely new outlook on life
and love. I never believed I could love someone as much as I love you. You have given me the
drive to achieve the most I possibly can in life: to set a good example for you. I hope that you
will always follow your dreams and always strive to live life to the fullest.
Siemens, Grant # 94905-23845-44--EKKOM, supported this research

1
Chapter 1
Background
1.1 WEAR
Wear is formally defined by the American Society for Testing of Materials [ASTM G40-13] as
the alteration of a solid surface by progressive loss or progressive displacement of material due
to relative motion between that surface and another contacting surface. Therefore, wear most
often involves the removal of material from one or both contacting surfaces in relative motion.
Figure 1 depicts a generic wear system, which conventionally has three or four parts: (i) a wear
couple (body and counter-body), (ii) an interfacial medium (such as a lubricant), and (iii) a
surrounding medium (environment). Such a system can be analyzed in terms of operating
variables vs. wear characteristics. The operating variables include the applied load(s), time,
relative (sliding) velocity, and temperature. Previous work, conducted by Welsh et al. [1] on
plain-carbon steels, clearly shows that a small change in operating variables, such as an increase
in load from 100 to 200 g, can have a significant effect on wear rate (by two orders of
magnitude). Because these small changes can have such a significant effect on the wear rate, it is
important to study a material’s wear behavior under different operating conditions.
Figure 1.1 Representative tribological system [2]
Comparing wear states mandates careful analysis of appropriate data. In general, wear comprises
two stages: running-in and steady-state. The running-in stage is defined as the initial transient
sliding process occurring in newly established contacts, often accompanied by transients in
coefficient of friction, wear rate, or both, which may be uncharacteristic of the long-term
behavior of a given tribological system [ASTM G40−13]. The simultaneous occurrence of many
phenomena during the running-in stage, such as work hardening, surface chemistry changes,
plastic deformation of asperities, and stress/temperature-induced phase transformations, make it
especially difficult to comparatively examine the initial wear performance of a system. Steady-

2
state wear is associated with the long-term behavior of a tribological system. Because conditions
have stabilized in steady-state stage of wear, a comparative analysis can be performed. To
thoroughly understand the wear process, an in depth analysis of the wear mechanisms and
material properties during both running-in and steady-state stages is essential. In fretting wear,
the steady-state stage is identified as that at which the hysteresis of the friction force versus
relative displacement of the surfaces does not change with fretting cycles.
Previous investigators attempted to classify wear based on loading of the system in
question.[3,4,5,6] Loading of two mating surfaces can be very complex, since the two surfaces are
generally not in perfect contact due to time-dependent undulations (asperities) on the interacting
surfaces, resulting in a time-dependent pressure distribution at the surface. Consequently, rather
than analyzing wear characteristics with respect to pressure, it might be more illustrative to
analyze the slip regime induced by a particular load and sliding distance.
There are three different regimes in small-amplitude reciprocating sliding: no slip (stick), slip,
and mixed (stick-slip) regimes.[7] To reduce relative motion at the interface, the tangential
(friction) force must overcome the resisting force within the elasticity limits of the bulk
material.[6] The typical contact pressure distribution (for a ball, cylinder, or ellipsoid) has a peak
pressure at the center of the contact and decreases nonlinearly outward the contact edge. This
favors stiction at the center of the contact and slip within an annulus between the stick region and
the contact edge.[6] As the contact load increases, the slip annulus decreases until eventually the
stick regime fully occupies the contact region and relative motion between the two solid bodies
vanishes. It is therefore important to determine the dominant regime during fretting wear. This
can be accomplished by examining the characteristic wear features of each wear process.
Complete determination of the wear regime requires a comprehensive analysis of the friction
force vs. displacement hysteresis response of each experiment.
Among the various standardized wear testing methods used to quantify sliding wear of materials,
such as block-on-ring, crossed cylinder-on-cylinder, and pin-on-disk (POD),[8] the last of these is
often favored because of its simplicity; therefore, the POD test [ASTM G99] was chosen for this
investigation. The POD fretting machine used in this work uses as input the load, oscillation
frequency, reciprocating distance (time and velocity), and temperature, although temperature
changes were not considered in this study.
3
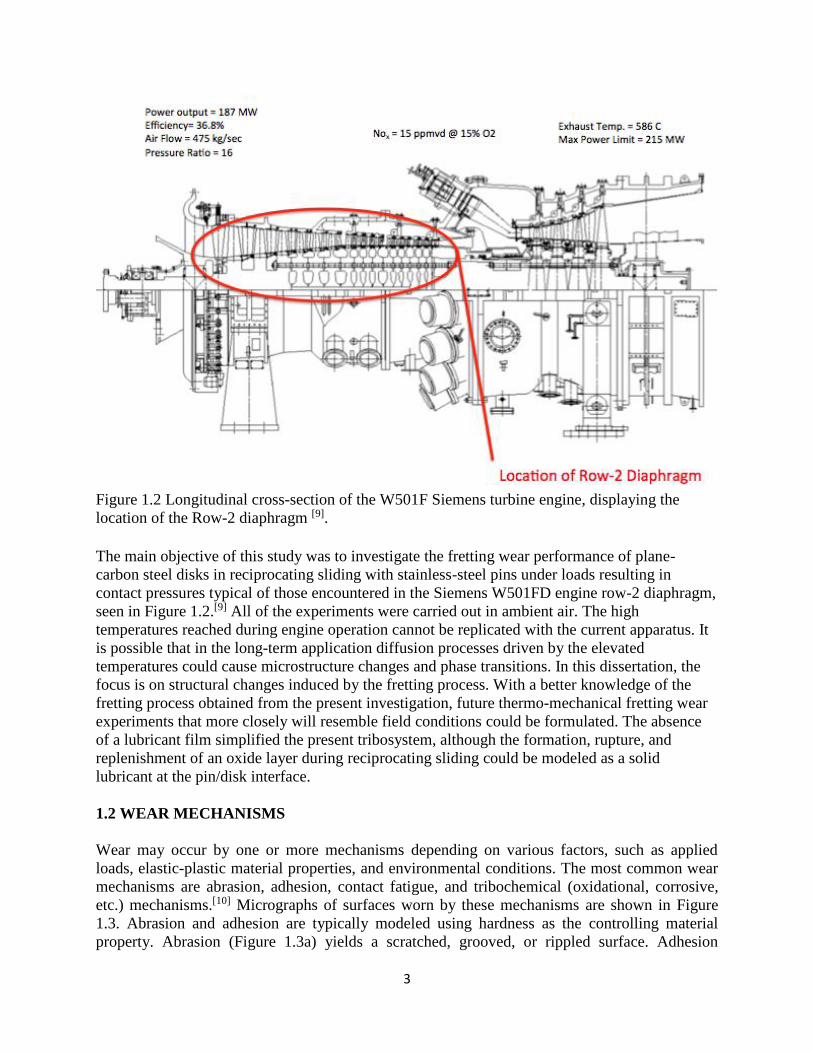
Figure 1.2 Longitudinal cross-section of the W501F Siemens turbine engine, displaying the
location of the Row-2 diaphragm [9].
The main objective of this study was to investigate the fretting wear performance of plane-
carbon steel disks in reciprocating sliding with stainless-steel pins under loads resulting in
contact pressures typical of those encountered in the Siemens W501FD engine row-2 diaphragm,
seen in Figure 1.2.[9] All of the experiments were carried out in ambient air. The high
temperatures reached during engine operation cannot be replicated with the current apparatus. It
is possible that in the long-term application diffusion processes driven by the elevated
temperatures could cause microstructure changes and phase transitions. In this dissertation, the
focus is on structural changes induced by the fretting process. With a better knowledge of the
fretting process obtained from the present investigation, future thermo-mechanical fretting wear
experiments that more closely will resemble field conditions could be formulated. The absence
of a lubricant film simplified the present tribosystem, although the formation, rupture, and
replenishment of an oxide layer during reciprocating sliding could be modeled as a solid
lubricant at the pin/disk interface.
1.2 WEAR MECHANISMS
Wear may occur by one or more mechanisms depending on various factors, such as applied
loads, elastic-plastic material properties, and environmental conditions. The most common wear
mechanisms are abrasion, adhesion, contact fatigue, and tribochemical (oxidational, corrosive,
etc.) mechanisms.[10] Micrographs of surfaces worn by these mechanisms are shown in Figure
1.3. Abrasion and adhesion are typically modeled using hardness as the controlling material
property. Abrasion (Figure 1.3a) yields a scratched, grooved, or rippled surface. Adhesion

4
(Figure 1.3b) causes back-forth transfer of material between contacting surfaces; this material is
then plastically deformed (smeared), appearing as a platelet type configuration. Severe adhesive
wear produces scuffing or galling in several surface areas (extensive extrusion of material),
material transfer, plastic shearing, and pinholes. Contact fatigue wear (Figure 1.3c) is mainly
characterized by the formation and growth of surface cracks, which may also coalesce to create a
(a) (b)
(c) (d)
Figure 1.3: SEM micrographs of surfaces worn by common wear
mechanisms: (a) abrasive wear of an aluminum,[11] (b) titanium layers
adhering onto a steel surface,[12] (c) cratering of a Resilab Master resin
caused by contact fatigue wear,[13] and (d) oxidative wear of a cobalt
alloy.[12]
pitting of material with a generally semi-smooth appearance. In tribochemical (e.g., corrosive)
wear (Figure 1.3d), the rubbing process is conducive to the removal (rupture) and replenishment
(by a thermally activated process) corrosive surface layer, which, under uncontrolled conditions,
can significantly increase the wear rate.
The aforementioned wear mechanisms (summarized in Table 1.1) have one thing in common –
the undesirable removal of material from both rubbing surfaces. Most wear processes usually
involve a combination of these wear mechanisms (with one, generally, dominating the steady-
state wear behavior). Therefore, identifying the dominant wear mechanism(s) is of critical
importance in any wear study.

5
Table 1.1 Wear phenomenon associated with various wear mechanisms
Wear Mechanism Wear Phenomenon
Adhesion Scuffing or galling areas, material transfer, plastic shearing,
holes,
Abrasion Scratches, grooves, ripples
Fatigue Cracks, pitting
Tribo-Chemical Reaction Reaction products (layers, particles)
Generally, scanning electron microscope (SEM) images are used to visually distinguish the
dominant wear mechanism(s) operating on a surface. The previously discussed wear
characteristics are summarized in the table above. Although this is an effective method for
identifying surface wear mechanisms, this method of analysis is not conducive to understanding
the developing microstructure below the sliding surface. The subsurface microstructure can
affect all of the previous wear mechanisms (Table 1.1). For example, microstructure changes
may significantly alter the strength (hardness) of the material. If adhesion or abrasion is the
prevailing wear mechanism, a change in hardness can greatly affect the wear rate.[14] In the case
of contact fatigue wear, a change in microstructure (including, but not limited to, rearrangement
and creation of dislocations) can have a huge effect on the formation of subsurface fatigue
cracks. For systems in which tribochemical reactions are prevalent, a change in microstructure
can have an impact on strain-dependent oxidative properties, and can create pathways for
oxidation to occur more aggressively.
1.2.1 Adhesive Wear
Adhesive wear is due to localized bonding between contacting solid surfaces leading to material
transfer between the two surfaces or loss from either surface [ASTM G40–13]. Adhesive wear is
the most fundamental of the wear mechanisms. Even in the absence of all other wear
mechanisms, adhesive wear can be present between two rubbing surfaces.[10]
ADHESIVE WEAR
Figure 1.4. Illustration of the adhesive wear process.

6
In adhesive wear, a bond is formed between asperities of the interacting surfaces. If the strength
of the adhesive bond is greater than the bond strength in the softer of the two materials, the softer
material eventually detaches and transfers to the harder material. The transferred material may
become dislodged at a later stage and form a loose wear particle. The initial material detachment
and transfer to the opposed surface process is illustrated in Figure 1.4. As rubbing of the two
surfaces progresses, the transferred material becomes compacted. An SEM image of this type of
wear can be seen in Figure 1.3b.
Archard[14] analyzed the mechanics of multiple asperity contacts with respect to their elastic and
plastic deformations and derived the following adhesive wear equation
𝑉 = 𝑘𝐿·𝑥
3𝐻 (1)
where V is the volume of worn off material, x is the total distance of sliding, 𝑘 is termed the
adhesive wear coefficient, representing the probability that an asperity junction would lead to
forma a wear particle, L is the applied normal load, and H is the hardness of the worn material.
The adhesive wear coefficient 𝑘 typically varies between 10–8 (atomic-scale wear) and 10–2
(severe adhesive wear, commonly known as scuffing), depending on the load, environmental
conditions (e.g., in vacuum, in air, contaminated/lubricated) and material properties.
Holm[15] introduced a similar wear equation of adhesive wear, i.e.,
𝑉 = 𝑍𝐿 · 𝑥
𝜎𝑌 (2)
where Z is the wear coefficient, termed as the probability of removing atomic-size particles or
layers becoming loose wear debris, and 𝜎𝑌 is the yield stress of the worn material. Considering
that the yield strength of a material is proportional to its hardness, it be inferred that Equations
(1) and (2) are nearly identical.
Significant effort has been devoted to obtaining a relation for the wear coefficient of adhesive
wear,[16,17,18,19] which depends on the similarity or affinity of the material surfaces to each other
(i.e., metallurgical solubility limit) and environmental conditions (i.e., vacuum, ambient air,
poor/good lubricant layer).[20] However, as seen from Equations (1) and (2), a change in hardness
may also lead to a significant change in wear rate. Variations in hardness may be associated with
changes in surface material properties, such as elastic modulus, yield strength, strain hardening,
and toughness. In particular, changes in dislocation density during the progression of adhesive
wear can have a significant effect on the hardness of the material being worn off and,
consequently, on its wear rate. Therefore, knowledge of the microstructure evolution during
surface rubbing is of critical importance.
1.2.2 Abrasive Wear
Abrasive wear is defined as the process in which hard particles trapped at the contact interface
and/or hard protuberances (asperities) of a hard surface plowing through the surface of a
relatively softer material [ASTM G40–13]. This form of wear is, perhaps, one of the most
understood forms of wear. Abrasive wear occurs in a situation where a solid is rubbing against
the surface of a countersurface material or trapped particles of equal or greater hardness.

7
Abrasion mainly involves microscale cutting and plowing processes. The way an asperity slides
over a surface determines the nature and intensity of abrasive wear.
(a)
(b)
Figure 1.5. Illustration of (a) two-body and (b) three-body
abrasive wear
There are two basic modes of abrasive wear: two-body and three-body abrasive wear, which are
illustrated in Figure 1.5. In two-body abrasive wear, the asperities of the harder surface remove
material from the softer surface by a process resembling microscopic cutting. In three-body
abrasive wear, small hard particles trapped between sliding surfaces temporarily indent and/or
interlock on one of the sliding surfaces and plow through the opposed surface.[10]
Although abrasion differs significantly from adhesion, it is reasonable to consider that the
volume of the worn groove is proportional to the contact area of the hard asperity on the soft
surface, as proposed by Rabinowicz.[21]
A simple evaluation of abrasive wear produced by a hard surface plowing a groove in a softer
surface (wearing away the softer surface), yields a variation of the adhesive wear equation,
derived by Archard and Holm, i.e.,
𝑉 = tan𝜃𝐿 · 𝑥
𝐻 (3)
where 𝑉 is the wear volume, 𝐿 is the applied load, 𝐻 is the hardness of the abraded material, and
tan𝜃 is the abrasive wear coefficient, where 𝜃 is the slope (sharpness) of the abrading

8
asperity/particle.[20] Equation (3) shows a significant effect of hardness on abrasive wear volume;
therefore, also indicating the importance of microstructure changes due to surface rubbing in
wear.
1.2.3 Fatigue Wear
Contact fatigue wear is defined as the wear of a solid caused by microcracking induced by cyclic
loading of the contacting surfaces [ASTM G40–13]. Alternating mechanical stresses lead to the
formation and propagation of fatigue surface and/or subsurface cracks when the material exceeds
its fatigue limit. The location of maximum shear stress (i.e., the region where crack initiation is
first encountered) depends on the type of contact between the two surfaces. As shown in Figure
1.6, for pure sliding the highest shear stress occurs at the surface, whereas for pure rolling the
maximum shear stress arises below the surface, as shown by Hertz theory.[10] These stress
distributions indicate that deformation can occur at different surface and subsurface locations,
depending on the type of sliding/rolling conditions at the contact interface.
Figure 1.6. Depth profile of maximum shear stress below the center of contact of a rigid solid
of revolution in rolling, sliding, and combined contact with an elastic half-space.[10]
Although contact fatigue wear resembles classical fatigue to some extent, there are a number of
differences between the two processes, such as the nonexistence of an endurance limit in contact
fatigue, representing infinite life.[20] Because fatigue failure results from crack formation under
cyclic loading, the formation of subsurface features that serve as stress concentrators, such as
new surfaces, persistent slip bands, and grain interfaces can increase the fatigue wear rate. It is
therefore imperative to understand the evolution of the subsurface microstructure due to the
accumulation of irreversible deformation due to alternating (cyclic) contact stresses.
1.2.4 Corrosive wear
Corrosive wear is defined as the wear process in which chemical or electrochemical reactions
between a surface and the environment weaken significantly the material surface, leading to the
removal of material upon surface rubbing [ASTM G40–13]. Oxidational wear is one of the most

9
common forms of corrosive wear, because an oxygen-rich environment is a typical environment
in which this wear process occurs. Figure 1.7 illustrates the oxidational wear process.
Friction-induced activation of the highly stressed material adjacent to the contact interface may
cause it to chemically react with elements in the fluid lubricant or gases from the ambient and
form easily shearable reaction products which are eventually removed by the surface rubbing
process. For oxidational wear to occur, surface chemical reactivity must be coupled with relative
motion of the contacting surfaces.[10] In many instances, oxidative wear is considered to be a
“mild-wear” process because the oxide film serves as a solid lubricant, protecting the subsurface
metal from a more severe wear mechanism, such as severe adhesive wear (scuffing).
OXIDATIONAL WEAR
Figure 1.7. Illustration of the oxidational wear process.
Oxidational wear may occur by several complex mechanisms. The wear rate of this mechanism
is governed by many factors, such as rate of surface oxidation, removal rate of the forming oxide
scale(s), normal and shear (friction) surface tractions, geometry of sliding surfaces, whether the
whole oxidative surface is removed at once or in part, etc.[20] The oxidation rate depends on
many properties, including microstructure. For instance, materials with excess grain boundaries
and slip bands enhance diffusion, increasing the oxidation rate of the material. The oxidation rate
depends on electronic differences, stress/strain in the material, and thickness of oxide scale.[22, 23,
24, 25, 26] The spallation of the oxide scale (film) may result from increase in strain at the metal-
oxide interface. Strain can vary with type of oxide formed (change in atomic misfit and thermal
expansion properties), changes in dislocation density in the metal (varying hardness and so
changing material compressibility), and thickness of oxide film, which may vary with oxidation
rate. A change in hardness of the oxide film oxide forming during surface rubbing and wear can
also change the removal rate of the oxide. Consequently, a thorough understanding of the
evolution of the subsurface microstructure is necessary to understand the progression of wear
with time of surface sliding.

10
1.3 FRETTING WEAR:
Fretting wear is defined as the wear process encountered in small amplitude (typically 20–200
m) oscillatory contact of two solid bodies [ASTM G40–13]. Although fretting wear and
reciprocal wear can be defined as the same for very short reciprocal distances, there are a few
notable distinctions between the two. In fretting wear, the volumetric wear rate increases with
increasing stroke amplitude (under constant loading conditions), whereas in reciprocating wear,
the volumetric wear rate remains constant, even if the oscillation amplitude is changed,[8] as
shown in Figure 1.8.
Fretting wear is sometimes referred to as fretting fatigue. This is mainly for oscillatory contacts
predominantly failing by contact fatigue cracking. In fretting fatigue cracks can grow from the
surface into the bulk of the material, or below the surface and parallel in the direction of
reciprocating sliding for significant time of the fatigue life, before they eventually shear off to
the surface and/or intersect with other cracks to cause material to be peeled off – a process
collectively known as delamination.[27]
Figure 1.8. Effect of oscillation amplitude (slip distance) on wear volume.[28] Fretting wear
occurs for slip amplitudes below 200–250 m, where the wear rate (slope) increases with slip
amplitude.
Compared to other wear mechanisms, fretting wear has been relatively less studied and not fully
understood, despite the fact that this type of wear has been found to be responsible for the
catastrophic failure in numerous applications, including industrial machinery, turbine engine
parts, MEMS devices, computer boards, microrelays, microswitches, and other other engineering
components where a source of vibration is present.[29, 30, 31, 32, 33] Fretting wear can increase the
clearance between adjacent components in applications where tight tolerances are critical to
effective operation (e.g., piston/cylinder interface) and also cause jamming when wear debris is
strongly held at the contact interface (e.g., journal bearings).[34]

11
Plastic strains induced during sliding contact produce subsurface damage near the surface, which
can be significantly different from the bulk. Fretting wear may also have an “environmental”
component, influenced by several factors, such as temperature, humidity, and others.[35, 36, 37, 38,
39] Despite of many fretting wear studies of various steels, the mechanisms controlling fretting
wear are still not well understood. In most investigations of fretting wear the focus has been on
the damaged surface; however, subsurface damage must be considered in conjunction with
surface damage to elucidate the mechanisms involved in this type of wear.
Standard material testing usually assesses elastic and plastic bulk properties of the contact pair.
However, subsurface imaging studies performed for this dissertation reveal changes in second
phase morphologies and severe plastic strain accumulation under the contact area. Very little is
known about the correlation of subsurface changes in microstructure to resulting fretting wear of
steels. Results from this study yield important insight into contact material degradation, and
guide understanding of local hardness changes and appropriate material damage models
associated with the contact area.
Microstructure changes can influence the response of a material to plastic deformation and,
hence, influence the oxidation rate. Changes in oxidation rate may, in turn, alter the wear
behavior. The role of oxidation during fretting wear and damage accumulation remains a
controversial topic.[40, 41, 42, 43, 44] Fretting wear has been thought to mainly be an oxidative
process; however, it has been observed that fretting wear occurs in materials that do not
oxidize.[45, 46, 47, 48, 49] The significant increase of the wear rate with slip amplitude observed in the
fretting wear regime (Figure 1.8) does not appear to coincide with an oxidative wear process,
which is typically seen as a mild wear process, because the oxide scale usually acts as a
lubricious (low adhesion) solid film,[50, 51, 52, 53, 54] slowing down the wear process. Eyre et al.[55]
found a change in oxide wear debris of 0.4% carbon steel for various sliding speeds. Quinn[56, 57]
proposed a parabolic theory of oxidational wear, where the oxide layer reached a critical
thickness (1–3 m) before rupturing to produce oxide wear debris. While many oxidational wear
models assume a parabolic law,[58] inconsistencies between parabolic oxidation theory and
experimental evidence led to the development of linear oxidational laws.[59, 60] Oxides have been
found to form at ambient temperatures much below than the temperatures expected from phase
diagrams. This may be explained by considering that the contact pressure developing over the
real area of contact (which is the sum of all asperity-asperity contact areas spontaneously
forming and breaking during sliding at the contact interface) can be several orders of magnitude
higher than that predicted based on the apparent area of contact.[50] Excessive frictional heating
at these asperity contacts (“hot spots”) is responsible for the observed oxide growth under
ambient temperatures. Large temperature variations at these hot spots are believed to be
responsible for the formation of different oxides,[61, 62, 63] although this is hard to prove due to the
difficulty to measure these short-lived temperature spikes. However, oxidational wear promoted
by mechanical stress/strain effects is much less understood than thermally-induced oxidational
wear. If the “hot spot” theory is not adequate, a mechanical deformation driven oxidation
mechanism could be the answer.
As discussed in previous sections, most wear models use the bulk material hardness as the
mechanical property governing the wear rate of the material.[64, 65, 66, 67] However, the bulk
hardness usually differs significantly than the surface hardness, because the surface undergoes

12
significantly more plastic deformation than the bulk during sliding and, even more, during
fretting wear. These may be a reason for the varying conclusions about the correlation of
hardness with wear rate.[68, 69, 70] A more promising approach may be to investigate the
correlation of material toughness with wear rate, or use the material toughness in certain fretting
regimes and the hardness in others.[16, 71] For example, if cracking is found to be more dominant
in the mixed fretting regime, an appropriate material property to examine wear in this regime
would be toughness, whereas in other regimes, the material hardness may be the more pertinent
material property affecting wear.[72]
The aforementioned wear mechanisms make up the major types of wear seen in most traditional
industrial applications. Erosive wear can be considered another form of wear, but will not be
discussed in this dissertation, as it is a special case where there is a need for a carrier medium to
carry hard particles imping onto a surface and causing loss of material by a one or several of the
previous wear processes combined together.
Understanding the dominant wear mechanism(s) involved in a tribosystem is an important step to
fully decipher the wear process. Fretting wear, similar to other forms of wear, combines one or
more of these wear mechanisms. Fretting wear is often observed to occur by a combination of
oxidational wear (a form of mild wear) and/or contact fatigue wear, although several other wear
mechanisms (i.e., adhesion and abrasion) may also be contributing to the overall wear rates, at
least during a portion of the wear life. I will discuss these studies in the following sections, with
specific attention to the alloy of interest in this dissertation.
1.4 PROPERTIES OF STEELS
In this study, A216 carbon steel [ASTM A216/A216M] and 410 stainless steel [ASTM A314-15]
were used as sliding countersurface materials. These steels are used in the W501FD engine row-
2 compressor diaphragm of the Siemens turbine engine,[73] where significant fretting wear
problems have been found to cause loosening of the diaphragm, impact with the stator and,
eventually, shut down of the engine for repair.[9] The mated materials, i.e., diaphragm and casing,
are made of these two different ferrous alloys. Since fretting wear failures are currently not well
understood, a thorough analysis of the materials leading to understanding of the failure
mechanisms was the objective of this dissertation.
The properties of steels are linked to their chemical composition, processing path, and
microstructure resulting from processing.[74] For a particular chemical composition, the
properties of iron/steel can be varied by changing the microstructure. These properties are called
“structure-sensitive” properties, and include properties such as yield strength and hardness.[74]
Materials engineering involves microstructural processing to achieve desired properties. Such
microstructural processing generally involves some form of mechanical deformation (such as hot
or cold rolling) and/or thermal treatment. However, there are many times when an unexpected
microstructure can develop, resulting in properties different than those originally sought. These
undesirable properties can lead to catastrophic and unexpected failures.
To understand the properties of a particular type of steel, it is instructive to consider the types of
microstructures that can form in steels and the driving force(s) responsible for their formation. It

13
is also necessary to know what properties are desired for a particular application. Often, the
desirable properties to be improved are inversely related to one another, thus making it difficult
to optimize all the properties desired. For example, when the material hardness increases, its
toughness generally decreases. Therefore, obtaining the optimal properties for a particular
application requires insight into the mechanisms influencing opposing trends in material
behavior. Moreover, it is often necessary to consider the desirable properties for manufacturing
the part, which can be quite different than the desired material properties in the actual
application. These and other issues must be addressed when seeking correlations between
microstructure and material properties.
The constituents of ferrous microstructures typically include ferrite, martensite, cementite,
austenite, pearlite, and bainite.
Ferrite is a solid solution of iron containing carbon and may contain one or more additional
alloying elements, such as silicon, chromium, manganese, and nickel,[75] with a body-centered
cubic (bcc) structure. Depending on whether the solid solution contains interstitial or
substitutional elements, the ferrite may have different characteristics. Interstitial elements and/or
an increase in grain boundaries can generally provide an increase in hardness,[76] whereas
substitutional elements may or may not have much of a solid-solution hardening effect.[77]
Because of the small size of interstitial atoms like carbon, diffusion is rapid. Larger substitutional
atoms cannot in general diffuse as quickly, and this influences the progress of heat treatments
applied to ferrous alloys. Control of grain size is generally carried out through thermomechanical
treatments, a combination of mechanical deformation and annealing, which can be affected by
alloying to pin grain boundaries during heat treatment.[74]
Cementite is an iron carbide with stoichiometry Fe3C and orthorhombic lattice.[78] It contains
6.67 wt.% carbon and 93.3 wt.% iron, with carbon in the largest interstices. Cementite is a hard
and brittle material that can form in all ferrous alloys and one of the two phases found in
microstructural constituents known as pearlite, bainite, and tempered martensite. Many material
properties associated with these microstructures are dependent on the quantity and morphology
of cementite particles.
Martensite is a supersaturated solid solution of carbon in iron formed by rapid quenching from
high temperatures. The amount of carbon in martensite far exceeds that found in ferrite, resulting
in a distorted body-centered tetragonal (bct) crystal structure, instead of the bcc structure of
ferrite. The continuous cooling–temperature (CCT) diagram shows that martensite only forms at
high cooling rates in plain carbon and low alloy steels (only some high alloyed steels can form
martensite by air cooling). Martensite tends to be very hard and brittle, and so tempering of
martensite is usually carried out to restore some ductility and increase toughness. During
tempering, the carbon that is in supersaturated solid solution precipitates onto preferred
crystallographic planes (typically {111}) of the martensite lattice. With sufficient alloying, the
martensite start temperature can be forced below room temperature, meaning incomplete
transformation and retained austenite present in the steel.[74] To some degree, the hardness of
martensite depends on the carbon content. Retained austenite is found when the carbon content
increases above 0.4 wt% and, because austenite is softer than martensite, the hardness decreases

14
at carbon concentrations above this level.[79] The yield strength also increases with carbon
content and changes with lath martensite packet size.
Like ferritic stainless steels, martensitic stainless steels (such as the 410 stainless steel, used in
this study) are high chromium alloys (12–18 wt% Cr), though both ferritic and martensitic
stainless steels have lower chromium content than austenitic stainless steels. Martensitic stainless
steels have carbon content in the 0.12–1.2 wt% range. With carbon and other alloy additions,
such as nickel, austenite can exist up to 25 wt% Cr in martensitic stainless steels. They become
martensitic on air cooling, even in thick sections,[74] making them ideal for creating large
engineering components, such as the casings in the Siemens turbine application. Martensitic
stainless steels are considered high-strength stainless steels because they can achieve yield
strengths between 550 and 1725 MPa. Ferritic stainless steels have microstructures consisting of
ferrite and carbides and are not considered high-strength steels, because their yield strength is
between 170 and 450 MPa.[74]
Austenite does not exist at room temperature in plain-carbon and low-alloy steels, other than as
small amounts of retained austenite that did not transform during rapid cooling. However, in
certain high-alloy steels, such as austenitic stainless steels, austenite is the predominant phase.
Manganese and nickel are alloying elements that stabilize austenite at room temperature.[80]
Austenite is a face-centered cubic (fcc) structure, which has certain desirable qualities compared
to the bcc structure of ferrite. fcc alloys may possess low temperature toughness, excellent
weldability, and are non-magnetic. Because of the high alloy content, austenitic steels are usually
corrosion resistant. However, these alloys could be quite expensive due to required high
concentrations of costly alloying elements, may exhibit susceptibility to stress corrosion cracking
(certain austenitic steels), have relatively low yield strength, and cannot be strengthened other
than by cold working, interstitial solid-solution strengthening, or precipitation hardening.[74] Cold
working can greatly increase yield strength and tensile strength at the expense of ductility.
Carbon is not effective in strengthening austenite because the interstitial site in austenite is a
regular octahedron and the corresponding strain field is similar to that of a substitutional
solute.[81]
Pearlite and bainite are combinations of ferrite and cementite in a parallel plate or lath
configuration, known as lamellae. The difference between these two types of microstructures is
in the fineness of the ferrite + cementite morphology. Pearlite has a coarse or fine morphology, at
high or low formation temperatures, respectively. Bainite has very fine and parallel needles of
ferrite separated by elongated particles of cementite. Bainite also has “upper” and “lower”
variants depending on the temperature at which they are formed.
In addition to grain size, the properties of fully pearlitic steels depend on the spacing between the
ferrite and cementite lamellae (interlamellar spacing λ) and colony size. The steel composition
does not have a major influence on the yield strength of fully pearlitic eutectoid steel though
there is some solid solution strengthening of the ferrite in the lamellae of the lamellar structure.
The thickness of the cementite lamellae also has an influence on the properties of pearlite. Fine
cementite lamellae can be deformed where thicker lamellae tend to crack during deformation.
The wear resistance of pearlite arises from the lamellar distribution of ferrite and cementite (a
hard constituent embedded in a soft and ductile constituent). The hard cementite plates do not

15
abrade away as easily as the equiaxed cementite particles found in other steel microstructures
(tempered martensite). In general, the wear resistance tends to increase as the interlamellar
spacing decreases, making the pearlitic interlamellar spacing one of the most important
microstructural parameters for controlling hardness and wear resistance.[74]
Most common steels, however, have a ferrite-pearlite microstructure. In these steels the carbon
content and the grain size determine the microstructure and resulting properties. The ultimate
tensile strength steadily increases with carbon content, due to the increasing fraction of pearlite
(much higher strength than ferrite). Yield strength, however, is relatively unaffected by carbon
content due to the fact that yielding is mainly controlled by the softer ferrite matrix. Strength and
toughness can be related to microstructural features. It has been found that finer ferrite grain size
improves strength and toughness, pearlite increases tensile strength, nitrogen increases yield
strength, but both pearlite and nitrogen reduce toughness.[74] Control of grain size is most
commonly used to engineer the material properties of ferrite-pearlite steels.
Similar with pearlite, bainite is a composite of ferrite and cementite, with the ferrite having an
acicular or feathery morphology and the carbides may be discrete particles. Because of these
morphological differences, bainite has much different properties than pearlite. In general, bainite
has higher strength. There are two forms of bainite, depending on temperature at which
austempering is conducted; upper bainite (400-550°C) and lower bainite (250-400°C).[82] Upper
bainite forms at lath boundaries and lower bainite forms on particular crystallographic habit
planes within the laths. These differences in morphology mean that they have different
mechanical properties; lower bainite, has a fine acicular structure and carbides within the laths
and higher toughness than upper bainite with its coarser structure.[82] There is a rapid increase in
tensile strength with the decrease of the transformation temperature increase amounts of lower
bainite formed). The main characteristic with bainitic steels is that an optimal strength/toughness
combination can be obtained without expensive heat treatments.[74]
Carbon steels, such as A216 steel, and low-alloy steels tend to be far less expensive and more
formable than stainless steels, such as 410 stainless steel, which tend to be far stronger and
corrosion resistant. Carbon steels can be made with increasing carbon content to increase
hardness and strength, and improve hardenability. However, the higher the carbon content the
more brittle the steel will be due to its tendency to form martensite. Alloying with other metals
can improve strength, toughness, and other properties. Carbon steels are divided into four groups
based on the carbon content: low, medium, high, and very high carbon content. Low-carbon steel
(often called “mild steel”) has less than 0.30% carbon and is the most commonly used grade of
steel. Low-carbon steels can be easily machined and welded and are more ductile than high-
carbon steels, therefore are easier to shape.
The iron-carbon phase diagram shown in Figure 1.9 indicaes that steels contain less than 2 wt%
carbon. A very important composition is ~0.8 wt.% carbon, known as the eutectoid composition.

16
Figure 1.9 Fe-Fe3C Phase Diagram showing temperature vs. weight percent
of carbon in iron [83]
A216 carbon steel has less than 0.3% carbon content, making it a low-carbon steel of hypo-
eutectoid composition. The only phases in equilibrium from room temperature to 723° (in this
composition range) are α-iron and cementite, most often found distributed as lamellae in pearlite.
Stainless steels generally contain a minimum of 10.5% chromium. They have high strength and
durability and also provide excellent corrosion resistance. Stainless steels are significantly
tougher than plain carbon steels at low temperatures. There are three types of stainless steels:
austenitic, ferritic, and martensitic. Ferritic stainless steels have between 12% and 27%
chromium with small amounts of austenite forming alloys. Austenitic stainless steels depend on
alloying elements to stabilize the austenite phase at low temperatures. Nickel is the most
important stabilizer, and others include carbon, manganese, and nitrogen. Martensitic stainless
steels have the least amount of chromium and offer high hardenability. The stainless steel
analyzed in this study (410 stainless steel) belongs in the martensitic stainless steel category.
Because the corrosion resistance of stainless steels is better than that of carbon steels, they can be
used in higher temperature applications, and they are often tougher than carbon steels. However,
they are more expensive (due to their alloying elements) and harder to shape than carbon steels.
The properties of iron and steels are linked to their chemical composition, processing path, and
resulting microstructures. The mechanical properties, such as yield strength and hardness, are
structure-sensitive properties and, as the name would suggest, depend on the microstructure.
Processing is a means to develop and control the microstructure of steels.[74] Mechanical
17
deformation (present, obviously, in wear situations) also affects the microstructure of all steels.
Most importantly, the existence of an unexpected microstructure can bring about unwanted
properties in engineering applications, such as the turbine components examined in this study,
and should always be considered when analyzing anticipated or observed behaviors in service.
The principal objective of this investigation was to determine the cause of excessive damage due
to fretting wear between A216 carbon steel and 410 stainless steel (the materials making up the
components in the W501FD engine row-2 diaphragm), with particular focus on A216 carbon
steel. The present study was initiated to examine the combination of surface and subsurface
properties, in an attempt to elucidate the underlying wear mechanisms involved in the fretting
wear process and to understand the pertinent material microstructure and material properties so
that to model the wear process in future. A more thorough understanding of the role of
microstructure combined with a thorough analysis of the wear surface will lead to a significantly
better understanding of the wear mechanisms that participate in the catastrophic failure of
materials during fretting wear. Understanding fretting wear mechanisms is essential to provide
industry with the knowledge necessary to prevent fretting damage.
Chapter 2
Material and Methods
2.1 SPECIMENS
Disks of 2 cm diameter consisting of A216 carbon steel and pins of ~1 cm diameter made of 410
stainless steel were used as specimens. Table 2.1 gives the composition of the pin and disk
specimens. While chromium is merely one of the trace elements in the A216 carbon steel disk,
but is 11.5–13.5% in the 410 stainless steel pin, it is ideal for analyzing transfer of pin material to
the disk by spatially-resolved energy dispersive spectrometry (EDS). These steels are currently
used as the diaphragm and casing materials, respectively, in the row 2 diaphragm of the
W501FD engines of Siemens, in which significant and catastrophic fretting wear damage has
been discovered. Polishing was performed with 240-1200 grit papers and then with diamond
pastes from 6μm to 1μm, on both the pin and disk specimens. Polishing showed no effect on the
wear behavior, and so various surface roughnesses were not analyzed in this dissertation.

18
1ASTM A216/A216M
2www.aksteel.com
2.2 FRETTING WEAR APPARATUS
Figure 2.1 shows the pin-on-disk testing apparatus (UMT3, CETR) used in the present study.
The normal load, frequency of oscillation, and stroke length are the input parameters, whereas
the friction force and lateral displacement are the measured parameters. Acoustic emission may
be a valuable addition to future studies.
Table 2.1. Composition of disk and pin specimens.
Element Composition (at%)
A216 carbon steel disk1 410 stainless steel pin2
Carbon 0.25–0.30 <0.15
Chromium 0.50 11.50–13.50
Manganese 0.7–1.2 <1.00
Phosphorous 0.035 <0.040
Sulfur 0.035 <0.030
Silicon 0.60 <1.00

19
Figure 2.1. Image of the CETR-UMT3 pin-on-disk testing apparatus.
Normal loads of 2, 10, and 15 N were applied at a frequency of 5 Hz and stroke length of 120
µm for 1, 2, 12, and 69 h (steady state). Previous testing for smaller amplitudes of fretting wear
revealed a linear variation in wear rate with amplitude. Fretting wear is typically encountered for
stroke lengths of less than 200-300 m; above this range the behavior changes from fretting to
reciprocating sliding. Thus, the stroke amplitude was set at 120 m to simulate fretting wear
conditions characterized by both stick and slip behaviors for the load range used in this study.
Because the force versus reciprocating distance hysteresis remained stable after testing for as
long as 69 h, it is referred to as steady-state, while the transient responses obtained for testing
times much less than 69 h are attributed to the so-called run-in stage of fretting wear. From the
analysis of the energy hysteresis curves, the responses for 2 and 10 N loads were found to be in
slip mode, whereas those for a load of 15 N were found to be in stick-slip mode.
2.3 PROFILOMETRY
The depth of each wear track was measured from two-dimensional surface profiles obtained with
a KLA – Tencor™ (P-10 model) stylus profiler. The stylus has a conical diamond tip with a
radius of 2μm. A low load (50μN) was applied to preserve surface integrity. The wear volume
was calculated from three-dimensional profiles obtained with this same profilometer.
2.4 MICROANALYSIS METHODS
2.4.1 Analysis of worn surfaces
Scanning electron microscopy (SEM) and energy dispersive spectrometry (EDS) were performed
with a Zeiss EVO-MA-10 scanning electron microscope with a tungsten filament operated at a
voltage of 20 kV. The SEM was used to characterize the dominant wear mechanisms on the wear
tracks. The x-ray analysis was conducted with an EDAX™ Genesis system having a silicon drift
detector. This method was used to study surface oxidation due to fretting and material transfer

20
from the pin to the disk specimen surface through mapping of chromium, which is much higher
in the pin material.
2.4.2 Analysis of damaged subsurface
i. Focused Ion Beam (FIB)
For subsurface damage analysis, cross-sectional samples were obtained with a focused ion beam
(FIB) and transmission electron microscope (TEM) FEI Quanta 3D SEM/FIB system using a gun
voltage of 30 kV. Cross-sectional samples were obtained parallel and perpendicular to the wear
track direction as schematically shown in Figure 2.2.
Figure 2.2. Sample configurations in relation to the direction of
wear marks (slip direction).
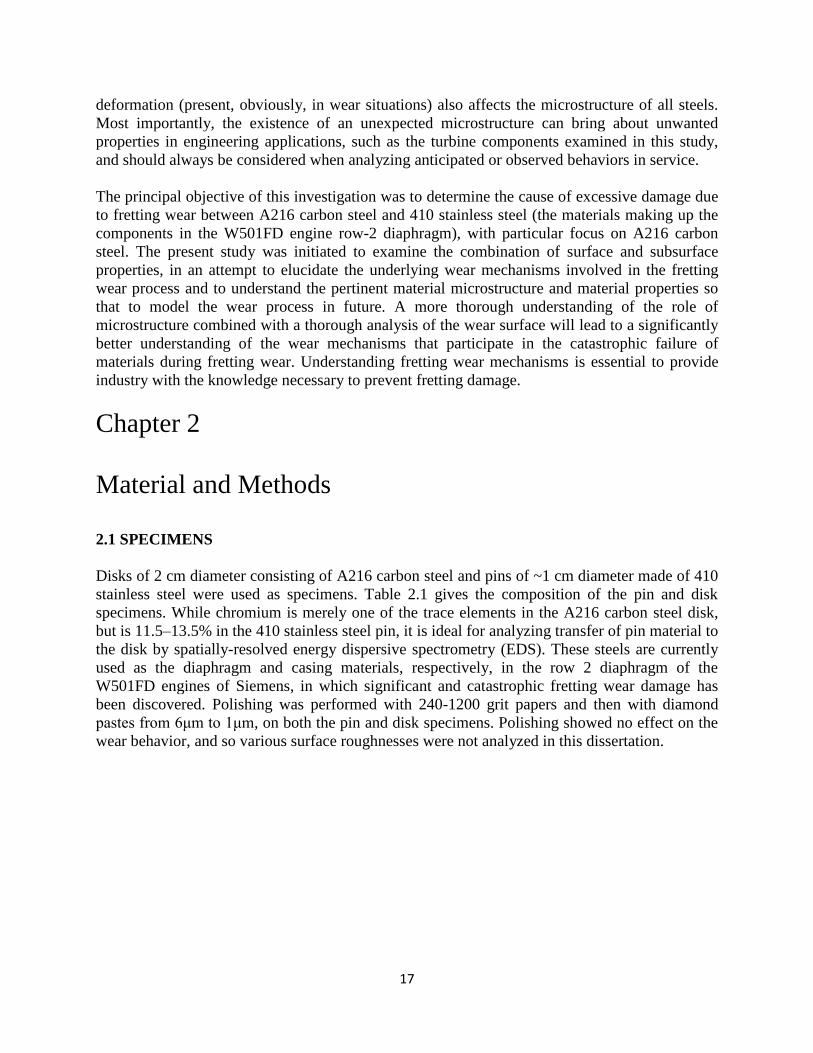
Figure 2.3 illustrates the FIB milling process used to create the TEM cross-sectional samples.
First, a protective platinum layer was deposited using Ga ion beam with a current density of 2pA
μm-2 onto the sample surface and a rough trench was milled, using a current of 30 nA (as seen in
Figure 2.3a). The current was gradually decreased to 0.5 nA as the beam distance from the
sample surface decreased to minimize damage of the sample before extraction. When the
thickness decreased to ~500 nm, the sample was removed and a u-trench was cut below the tilted
sample (Figure 2.3b). A micromanipulator was then welded to the platinum layer and the
remaining sample was milled free (Figure 2.3c). Subsequently, the sample was carefully
maneuvered out of the trench with the micromanipulator and welded, using a platinum layer, to a
copper TEM grid (Figure 2.3d). Finally, the micromanipulator was cut free from the sample (not
shown), leaving the sample free to be analyzed by the electron microscope.
21
a.) b.)
c.) d.)
Figure 2.3. Cross-sectioning process with a focused ion beam: (a) sample
milling to a thickness of <500 nm and length ~20 m, (b) cutting of a u-trench
below the tilted sample, (c) micromanipulator welding to the platinum layer
deposited onto the sample surface and milling of the remaining sample, and (d)
sample removal from the trench and welding to a copper TEM grid.
ii. Transmission electron microscopy (TEM)
Transmission electron microscopy (TEM) was used to examine the subsurface microstructure
and wear features. TEM imaging was performed with a JEOL 2011 LaB6 TEM operated at a
voltage of 200 kV. The TEM was also used to study the oxide scale thickness, amount of
subsurface porosity, damage depth, and dislocation substructure and distribution in the sample,
including pertinent crystallographic orientations of substructural constituents with respect to bulk
crystal structure using selected area diffraction (SAD).

22
Chapter 3
Results
Experimental results of this investigation are subdivided into two sections: (a) results from the
analysis of surface wear features, and (b) results from the analysis of subsurface wear features.
Since a typical analysis of wear surfaces requires a thorough surface analysis, this was conducted
first. Much less (if any) analysis is typically also conducted on subsurface wear features, even
though this should be an imperative aspect of wear analysis, in order to thoroughly understand
the progression of wear mechanisms. A key feature examined in this study is the microstructure
evolution in the course of reciprocating sliding.
3.1 SURFACE WEAR FEATURES
3.1.1 Effect of Normal Load
Figure 3.1 shows the dependence of the severity of fretting wear on normal load for a testing
duration of 12 h. The first row of Figure 3.1 shows SEM micrographs of the wear scar produced
due to sliding under a normal load of 2, 10, and 15 N, while the second, third, and fourth rows
show corresponding EDS maps of iron, oxygen, and chromium, respectively. The SEM images
and EDS maps indicate an enhancement of oxidation and material transfer from the pin specimen
(shown in the chromium maps) on the wear scar with increasing normal load. The oxygen maps
indicate that while oxidation of the sliding steel surface for a normal load equal to 2 and 10 N
(slip) appears to be similar, it is more pronounced for a normal load of 15 N (stick-slip),
suggesting that a transition from slip to stick-slip conditions due to the increase of the normal
load was conducive to oxidation of the material. Material transfer from the pin to the disk surface
(tracked by EDS) increased with normal load regardless of the occurrence of either pure slip (2
or 10 N load) or stick-slip (15 N load) contact conditions.
High-magnification SEM and EDS provided evidence of a change in dominant wear mechanisms
from adhesive and abrasive wear at relatively low (2 N) or intermediate (10N) normal loads to
abrasive wear and material transfer from pin specimen (due to adhesive wear of the pin) in the
slip region of the disk at a high normal load (15 N) after testing for 12 h (Figure 3.2). The
oxygen and chromium EDS maps confirm that the increase of the normal load promotes surface
oxidation and materials transfer, respectively.
3.1.2 Effect of Sliding Time
Figures 3.3 and 3.4 show the evolution of fretting wear and oxide formation for a 10 N normal
load (pure slip) and 1 or 2 h of testing, respectively. Material from the pin specimen (chromium
maps) initially transfers to the disk where it becomes oxidized along with iron. Sliding for 1 and
2 h corresponds to the run-in stage of fretting wear, involving a progressively increasing
conformability of the wearing surfaces and loaclaized high pressure spikes, as evidenced by the
wear fetaures on the sliding tracks.

23
Figures 3.5 and 3.6 show the progression of fretting wear and oxide formation for a 10 N load
(pure slip) after 12 and 69 h of testing, respectively. The longer duration of sliding has resulted
in more uniform oxidation with less significant chromium transfer from the pin to the disk.
However, after testing for 12 h, there are still some areas of heavier chromium transfer. After 69
h of testing (steady state), the surface has a much more uniform appearance in both oxidation and
chromium transfer (very little chromium transfer from the pin to the disk and an extremely even
layer of oxide on the surface).

24
2 N 10 N 15 N S
EM
Im
age
Iron
Oxygen
Chro
miu
m
Figure 3.1. SEM images (first row) and EDS elemental maps (second, third, and fourth rows)
of the entire wear scar produced on the surface of A216 steel disk for a normal of 2, 10, and
15 N, 120 µm stroke amplitude, 2 Hz oscillation frequency, and 12 h testing time.

25
2 N 10 N 15 N S
EM
Im
age
Iron
Oxygen
Chro
miu
m
Figure 3.2. High-magnification SEM images (first row) and corresponding EDS elemental maps
(second, third, and fourth rows) revealing characteristic wear features on the surface of A216
steel disk for a normal of 2, 10, and 15 N, 120 µm stroke amplitude, 2 Hz oscillation frequency,
and 12 h testing time.

26
1 HOUR
SE
M I
mag
e
Iron
Oxygen
Chro
miu
m
Figure 3.3. Low- and high-magnification SEM images (first row) and
corresponding EDS elemental maps (second, third, and fourth rows)
revealing characteristic wear features on the surface of A216 steel disk
for 10 N normal load, 120 µm stroke amplitude, 2 Hz oscillation
frequency, and 1 h testing time.

27
2 HOURS
SE
M I
mag
e
Iron
Oxygen
Chro
miu
m
Figure 3.4. Low- and high-magnification SEM images (first row) and
corresponding EDS elemental maps (second, third, and fourth rows)
revealing characteristic wear features on the surface of A216 steel
disk for 10 N normal load, 120 µm stroke amplitude, 2 Hz oscillation
frequency, and 2 h testing time.

28
12 HOURS
SE
M I
mag
e
Iron
Oxygen
Chro
miu
m
Figure 3.5. Low- and high-magnification SEM images (first row) and
corresponding EDS elemental maps (second, third, and fourth rows)
revealing characteristic wear features on the surface of A216 steel disk
for 10 N normal load, 120 µm stroke amplitude, 2 Hz oscillation
frequency, and 12 h testing time.

29
69 HOURS
SE
M I
mag
e
Iron
Oxygen
Ch
rom
ium
Figure 3.6. Low- and high-magnification SEM images (first row) and
corresponding EDS elemental maps (second, third, and fourth rows)
revealing characteristic wear features on the surface of A216 steel disk
for 10 N normal load, 120 µm stroke amplitude, 2 Hz oscillation
frequency, and 69 h testing time.

30
3.2 SUBSURFACE WEAR FEATURES
The microstructure of an unworn sample is shown in Figure 3.8 and is labeled “0N”. The initial
microstructure is that of pearlitic steel.
3.2.1 Features of Cross-Sections Parallel vs. Perpendicular to Wear Direction
As you can see, in Figure 3.7, we have a hypoeutectoid microstructure, containing proeutectoid
ferrite and pearlite, as we would expect in A216 steel, with bands of dislocations running
through the two phases.
OVERVIEW HIGHER MAGNIFICATION
Para
llel
to
Wea
r D
irect
ion
Per
pen
dic
ula
r t
o W
ear
Dir
ecti
on
Figure 3.7. Bright field TEM images of subsurface features with cross-sections parallel
and perpendicular to the wear direction with wear parameters of 15N, 12 Hr, 120 um,
and 2 Hz

31
We find that a dislocation band (cell wall) structure develops below the surface. The most
significant microstructural change appears to occur in a direction parallel to the wear direction, at
an angle of approximately 45 degrees from the surface, so the direction parallel to wear is
emphasized from this result forward. We also find that the oxide that has developed on the
surface provides an uneven surface coverage.
3.2.2 Features with Increasing Applied Load
Preparation of the background sample by FIB was difficult, as it milled much faster, at the same
current, than the deformed samples. Additional dislocations would increase the hardness of the
surface making it more difficult to mill and thus easier to control the milling process by
decreasing the milling rate. There was slight FIB damage at the surface of the background
sample that was seemingly unavoidable, but the microstructure was still viewable.
The background sample showed a shallow (1-1.5 um) dislocation cell wall structure at the
surface, probably due to the cutting of the disk at the Siemens factory, though any uneven
dislocation distribution may initiate dislocation wall formation in certain materials. The area
directly below this was unaffected.
In the 2N load, the dislocation cell walls become denser than the unworn sample with the angle
remaining at 45 degrees. The 15N load appears to increase the density of dislocations and also
remains at an angle of 45 degrees. The thickness of the wall isn’t of much use for comparison, as
the thickness depends on the cut of the subsurface.
The oxide scale appears to be quite porous and uneven in both the 2N and 15N samples. Shear
bands also develop directly below the oxide with both the 2N and 15N load, which could enable
an easier removal of oxide from the wear surface.
As you can see in Figure 3.8 the 15 N applied load appears to have denser dislocation cell walls
and fewer dislocations in the areas between the walls.

32
SURFACE IMAGES MIDSECTION IMAGES
0N
(Bac
kgro
und
(to
p s
ecti
on,
exte
nds
1.5
-3 m
icro
ns
in
dep
th))
2N
15N
Figure 3.8. Bright field TEM images of subsurface features parallel to the wear
direction, induced by deformation at 12 Hr, 120 um, 2 Hz at loads of 2, 10, and
15N.

33
3.2.3 Features with Increasing Time with 2N Load
SURFACE IMAGES MIDSECTION IMAGES
0 H
r
12 H
r
69 H
r
Figure 3.9. Bright field TEM images of subsurface features parallel to the
wear direction, induced by deformation at 0, 12, and 69 Hr, sliding distance of
120 um, frequency of 2 Hz, and a load of 2N.

34
Figure 3.9 shows dislocation cell configurations at 0, 12, and 69 hours fretting with an applied
load of 2N. At 12 hours, the dislocation walls become denser than the unworn sample with the
angle remaining at 45 degrees. At 69 hours the density of dislocations increases and the cell
walls become spaced closer together. The angle of the dislocation walls has now rotated to close
to parallel to the surface. There appears to be an even dislocation density between the walls as
well.
The oxide scale at 12 hours appears to be quite porous, and exhibits uneven surface coverage
while the oxide scale at 69 hours appears to be denser and evenly coats the surface, indicating
possible oxidational wear occurring in a controlled manner. Shear bands also develop directly
below the oxide, at 12 hours.
At 69 hours, there appears to be an area near the surface that has not developed dislocation cell
walls. This is, possibly, due to a grain orientation that is more resistant to deformation.
At 69 hours we notice that there is no apparent pearlite structure in the areas where dislocation
cell walls have formed.
3.2.4 Subsurface Wear Features of PIN (Parallel to Wear Direction)
The counterbody (the pin) shows no development of dislocation cell walls after 12 hours, at 2 N.
Overview Surface
Figure 3.10. Pin Overview and surface microstructures when worn with conditions of 2N, 12
Hrs, 120 um, 2 Hz - Parallel to wear direction

35
3.3 IMAGE COMPILATIONS EMPHASIZING TRENDS
As seen in Figure 3.11, a wall-like (“persistent slip band”) structure emerges with increasing
time.
a.) b.) c.)
Figure 3.11. Bright field TEM images of persistent slip bands formed with an applied load of
2N, frequency of 2 hz, and sliding distance of 140um at a.) 0 hrs, b.) 12 hrs, and c.) 69 hrs.
Dislocation cell walls appear to form at varying depths, depending on applied pressure, as you
can see in Figure 3.12.
a.) b.) c.)
Figure 3.12. Bright field TEM images showing an increasing depth of persistent slip band
formation formed at 2Hz, 120um, after 12 hours of fretting wear at pressures of a.) 0N, b.) 2N,
and c.) 15N
Figure 3.13 shows a rotation of dislocation cells with time. The oxide present on the surface
appears to be uneven at 12 hours and becomes uniform in thickness by 69 hours.

36
a.) b.)
Figure 3.13. Bright field TEM images showing a rotation of persistent slip bands at formed
at 2N, 120um, and 2Hz at a.) 12 hr and b.) 69 hr
As you can see in Figure 3.14, the oxide at 12 hours is unevenly distributed on the surface. By
69 hours (steady state) we have achieved uniformity, unseen during previous time frames.
a.) b.)
Figure 3.14. TEM cross-sections for 2N, 120um, 2 Hz conditions at a.) 12 hrs and b.) 69 hrs
37
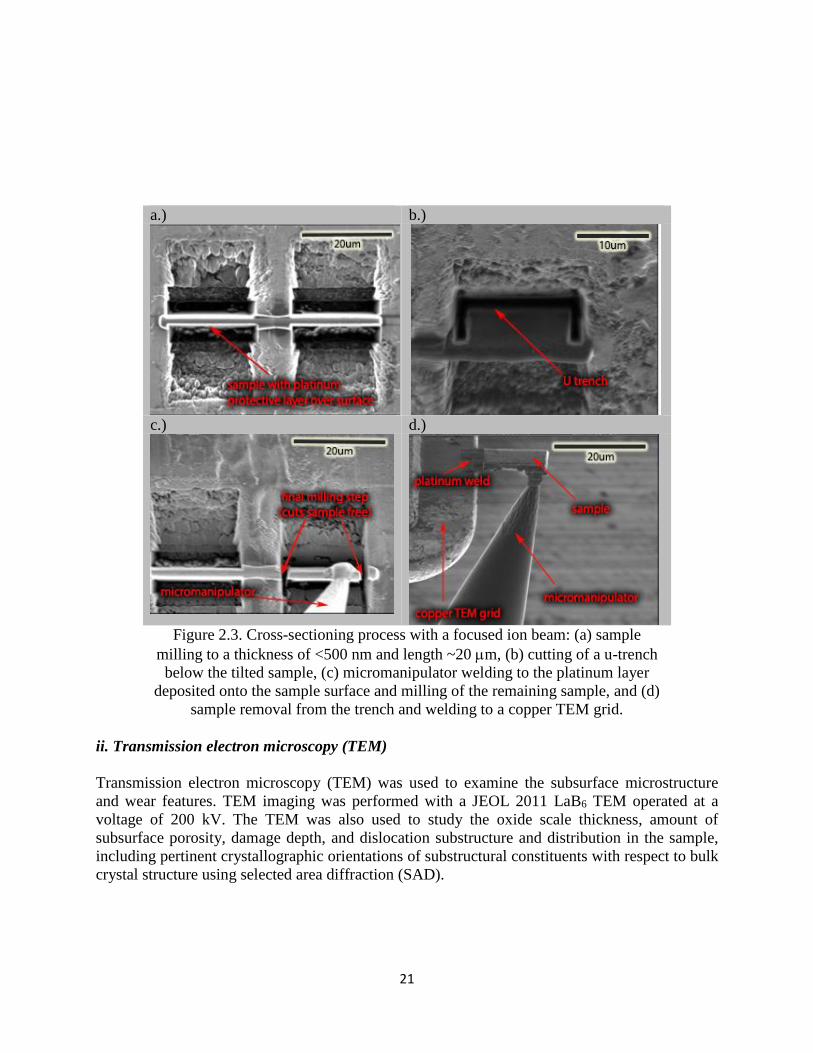
As we increased fretting time there was also a change in oxide color, from red to black, that
occurred over the surface of the wear scar.
As you can see from the oxide mappings in Figure 3.15, the oxide formation, with time,
increases in uniformity.
a.) b.)
c.) d.)
Figure 3.15. Overview of oxidation of wear scar surfaces (at 10N, 2Hz, and
120 µm sliding distance) at a.) 1 hr, b.) 2 hr, c.) 12 hr, and d.) 69 hrs.
CHAPTER 4
Discussion
Fretting wear is quite often described as being an “oxidational wear” process [84, 85, 86, 87, 88, 89]. In
fact, it was initially described as “fretting corrosion” [90]. Fretting wear exhibits an increase in
wear rate not seen in typical sliding wear processes that has, unfortunately, not been explained
comprehensively. Oxides generally act as solid lubricants; consequently oxidational wear is
considered a type of “mild wear,” which does not fit the conventional definition of fretting wear [91]. It is apparent that, in order to understand the fretting wear process, a thorough understanding

38
of the oxidation process and associated subsurface structural evolution is necessary. The
findings presented here appear to show a synergy between oxidational wear and fatigue wear, the
latter of which builds below the surface during the oxidational wear process. It is my theory that
in certain situations, oxidational wear is the dominant wear mechanism because insufficient
strain has been generated in the subsurface to promote massive failure. However, the subsurface
dislocation structure may also have an effect on the formation of surface oxides. It is my theory
that this dislocation structure generates different primary oxides with increasing time, and wear
of the oxide layer is predominant. Sakrani and Sullivan [92] show that Fe3O4 minimizes wear
and friction in dry wear of alloy steel. In other instances, the material may fail by separation of
subsurface material, due to accumulation of subsurface dislocation cells
4.1 DISLOCATION CELLS/PERSISTENT SLIP BANDS (PSBs)
There is substantial development of distinctive microstructure/subsurface features during the
fretting wear process observed in this study. As seen in Figure 3.11, a wall-like (“persistent slip
band”) structure emerges with increasing time. Such a structure results from a spatial variation
in dislocation density during subsurface deformation accompanying wear. A variation in
dislocation density can bring about the formation of a polyganized dislocation structure through
a process driven by reduction of total energy of the system [93]. These dislocation structures are
common to heavily deformed metallic alloys, and have been found to occur during reciprocal
sliding/rubbing of two surfaces in contact [94, 95]. When dislocations arrange themselves into a
crystallographic planar "wall" configuration, they are most often found to persist in this
morphology during subsequent plastic deformation. Dislocation walls of this type are therefore
also known as "persistent slip bands." Alternatively, dislocations may arrange themselves into
arrays that do not align so sharply, but form meandering interfaces known as dislocation cells or
"subgrain boundaries” [93]. The driving force for the formation of both persistent slip bands and
dislocation cells is the same, namely a reduction in total elastic energy of the system [93, 96].
It has been reported that a large proportion of the dislocation density is used to maintain
geometric compatibility at the subgrain boundaries. These dislocations are therefore unavailable
for hardening, explaining the observed decrease in strain hardening rate with increasing
polyganization [97]. The material inside the cell walls tends to soften as the dislocation walls
form, creating a strain at the dislocation wall/cell interface. This heterogeneous distribution of
dislocation density develops under conditions of multiple slip (or primary slip plus strong
secondary-slip activity) [98]. The cell walls are also sometimes referred to as subcell boundaries.
The depth at which these subcell boundaries form appears to increase with increasing load as
well, increasing the affected volume with increasing load. This type of distribution of
dislocations could cause many issues when parts are in service. If a high enough stress/strain is
reached, massive subsurface failure may occur at dislocation cell wall boundaries. The increased
temperatures seen in service could increase the dislocation mobility, creating dislocation cell
structures at an accelerated rate.
In order to understand dislocation cell formation we must understand the variables that affect cell
formation.
For cell formation, dislocations must have sufficient mobility out of their slip plane, meaning the
cell formation depends on several external and internal factors [99]. External factors include

39
stress and temperature. Internal factors include polycrystalline engineering elastic constants,
Young’s modulus, shear modulus, bulk modulus, Poisson’s ratio, single crystal elastic
coefficients, elastic stiffness, elastic compliances, stacking fault energy, and any other factors
that determine a dislocation’s mobility out of its slip plane by cross slip and/or climb [100]. Climb
is generally temperature assisted due to the fact that it is diffusion driven, but, similarly, could be
driven by strain gradients. At room temperature, cross-slip is possible in both FCC and BCC
metals. Cross-slip is also possible in HCP metals that have been alloyed or HCP metals have
been heated to elevated temperatures. In Al the initiation of multiple slip and cross slip is easy
and a 3-D cellular dislocation structure tends to form [100]. With BCC materials having up to 48
slip systems that are nearly close packed, there are a multitude of slip systems available for
cross-slip to occur, enabling the formation of dislocation cell walls (persistent slip bands), much
more readily than for FCC materials (which have 12 slip systems). Due to the multitude of
readily available slip systems in BCC materials, they have been found to more readily form
linear dislocation structures, where FCC materials (with fewer available slip systems) tend to
form cellular (3-D) dislocation structures.
The formation of persistent slip bands (PSB’s) as a bulk phenomenon appears to occur as a
general feature in many FCC metal single crystals, such as copper, nickel, and silver, as well as
some BCC materials, such as alpha-iron and niobium [101]. The formation of this matrix
structure, the nucleation of PSB’s, and the steady state deformation occurring in PSB’s are
largely due to cross-slip, and long-range internal stresses [101]. However, pure BCC metals do not
appear to show PSB formation, as a general feature. Under typical testing conditions, cyclic
deformation of BCC metals occurs by the low-temperature deformation mode, characterized by
low mobility of screw-dislocations and impeded dislocation multiplication [101]. However, a
deformation mode similar to that in FCC metals, accompanied in some cases by the formation of
PSB’s as a bulk feature, is found under special conditions: low strain-rate, elevated temperatures
(below the regime of self-diffusion), and the presence of interstitial impurity atoms, as is present
in A216 steel [101]. Kuhlmann-Wilsdorf [102] found a strain-rate dependence of persistent slip
bands in BCC materials. In fretting wear, strain-rate depends on applied load, sliding distance,
and frequency. Although slip bands may not be seen as a BULK feature in BCC materials,
surface features can and do vary significantly from the bulk during wearing conditions.
The most important question regarding these substructural features is “how could failure, due to
dislocation cell formation, occur?” To answer this question, we can decompose it into two parts:
1) How do these cells affect the oxidation of the material associated with failure at the surface;
and 2) how might these cells lead to subsurface failure?
Dislocation cells could increase oxidation rate due to a sort of “channel” formation. Forests of
dislocations are located in dislocation cell walls and dislocation cores allow for short circuit
diffusion. An increase in oxidation rate, due to “channel” formation, could increase the quantity
of certain oxides that form by oxygen limited migration. The oxide on the surface can either
grow thicker or replenish quickly as the oxide is being removed during the wear process. Oxide
growth is still limited by oxygen transport through the oxide layer when there is oxide coverage
on the substrate, however, a dislocated structure will make metal cation migration harder,
limiting metal ion diffusion and increasing short circuit oxygen diffusion at the dislocation cores

40
thus enhancing formation of the oxides formed by anion diffusion (Fe3O4) and reducing
formation of oxides formed by cation diffusion (Fe2O3).
The Pilling-Bedworth ratio (RPB) (Equation 4) is a ratio that describes the volume change due to
the formation of an oxide on the surface of a metal. It is often used to describe the stress
generation in an oxide layer.
𝑅𝑃𝐵 =𝑉𝑜𝑥𝑖𝑑𝑒
𝑉𝑚𝑒𝑡𝑎𝑙 𝐸𝑞𝑢𝑎𝑡𝑖𝑜𝑛 4
Where Voxide and Vmetal are the volumes of the oxide produced by oxidation for a given metal
volume [103].
The degree of protection offered by an oxide is better if a.) the Pilling-Bedworth ratio is close to
unity, b.) the thermal expansion mismatch between base metal and oxide is low, and c.) the
diffusion rates of oxygen and metal ions through the oxide is low. The oxidation rates can be
further retarded by adding alloying elements, which preferentially oxidize and form protective
films [104]. This means that oxidation may offer better protection in alloyed steel than plain
carbon steel, such as A216 steel. Takeda et al. [105] showed that the thermal expansion coefficient
is lower for Fe2O3 than Fe3O4, however, at low temperatures they are very close in value.
For ferrous alloys, an increase in formation of Fe3O4 generates a weaker oxide than Fe2O3, on the
surface, increasing the wear rate of the oxide layer. However, since the Pilling-Bedworth ratio is
lower for Fe3O4, than it is for Fe2O3, the delamination of oxide from the substrate may be less
than is seen in prior stages of fretting wear. Fe3O4 grows with the [110] direction of the oxide
parallel to the [100] direction of the metal surface [106] giving approximately 3% lattice misfit
while α-Fe2O3 also has approximately 3% misfit [107]. Thermal expansion coefficients increase
with increasing temperature, with magnitudes in the following ascending order: FeO, Fe3O4, and
Fe2O3 [105]. This also suggests that Fe2O3 will delaminate before Fe3O4 or FeO, at the same
temperature as the temperature is increased. Another possible theory is that as the microstructure
is changing from a pearlitic steel structure to the dislocation cell structure as time progresses
lowering the misfit strain between the oxide and substrate. A decrease in misfit strain in
congruence with Fe3O4 preferentially forming, through decreased mobility of the metal cations
and increasing the anion diffusion by short-circuit diffusion at the dislocation cores would
explain the change in adherence of the substrate as well as evolution of oxide from Fe2O3 to
Fe3O4 with time. As long as the rate of production of oxide is larger than the wear rate, wear in
the oxide tends to dominate the overall wear rate. There is also some possibility of forming
oxides preferentially, in the dislocation heavy areas of the dislocation cells, causing the material
to become brittle in these areas. Oxide precipitate at the cell walls may occur due to enhanced
diffusion down the dislocation cores, resulting in a supersaturation of oxygen.
Although polyganization reduces overall matrix strain, dislocation cells still suffer strain, which
is localized in the cell walls. These strained areas are most likely to nucleate cracks, generating
wear debris. A macroscopic strain field accompanies individual dislocations, and as they glide
towards the cell walls a pressure builds up across the wall. When the dislocation cell walls are
pinned, the walls act to generate non-uniform stress field [108], which determines where
nucleation of new dislocations might occur. There is a higher flow stress associated with

41
“pinned” cell wall. The strain is roughly the same as for the case with free dislocation walls, but
the flow stress required is considerably higher [108].
Essmann & Mughrabi [109] found that during tensile and cyclic deformation, annihilation of both
screw and edge dislocations occurred, which set natural limits to dislocation densities achieved
by plastic deformation. They found, however, that these low limits did not seem to apply in the
cases of persistent slip bands in cyclically deformed FCC single crystals, where a high
dislocation density (about 2 orders of magnitude higher) was predicted to form [109]. Dislocation
cells appear to create a uniform dislocation density distribution over time. This distribution
consists of highly dislocated walls enclosing areas that are relatively “dislocation free”. This
dislocation density may, eventually, saturate if failure in the subsurface does not occur before
saturation.
Figure 4.1 graphically shows the 3 stages of work hardening in a single crystal as a function of
resolved shear stress, τR, and shear strain, γ. In a single crystal, slip occurs in 3 stages: stage I
single slip; stage II work hardening; and stage III saturation. In stage I, slip occurs at low stress
on a single, primary slip system. In stage II, slip induced by higher stress occurs on multiple slip
systems that can interact in ways to inhibit further glide, resulting in hardening. In stage III, the
applied stress is high enough to overcome the obstacles to dislocation motion until the work
hardening saturates.
Figure 4.1 Stages of work hardening in a single crystal as a function of resolved
shear stress, τR, versus shear strain, γ [110].
In polycrystalline deformation the situation is more complex. Random crystallographic
orientations of grains disrupt the direction of slip from one grain to the next. Slip can only occur
across grain boundaries when properly oriented slip planes are contiguous. Stage I slip is
therefore not seen in polycrystalline materials. Furthermore, an additional stage (stage IV) must
be added to the plot in polycrystalline materials, to account for the observed, almost constant,
low work-hardening rate and the capacity to accommodate large strains observed in
polycrystalline materials [102]. Stages II, III, and IV vary in their work hardening rates; in stage II
the work hardening rate is constant but has a high value, in stage III the work hardening rate
decreases sharply with strain, and in stage IV large plastic strains occur at a very low, virtually

42
constant work hardening rate. Initial formation of dislocation cell walls can occur in stage II. At
low to medium strains (stage III work hardening) the cell walls are formed at approximately 45
degrees from the wear direction, aligning with the shear stress, confining softer dislocation free
regions between these walls. When analyzing persistent slip bands, Brown [111] reports that
cross-slip occurs at all stages in the stress–strain curve, but at the onset of stage III, every screw
dislocation cross-slips to annihilation, eliminating all screw dislocation dipoles. On this model,
the absence of screw dislocations in the microstructure signals the onset of stage III. Stage IV is
characterized by a nearly constant hardening rate, which depends only slightly on temperature
and strain rate, and the hardening rate scales with the “would-be” saturation shear stress and
ranges from 0.05-0.10 [112]. It would make sense that in stage IV, (high strain situations), the
dislocation cell walls rotate parallel to the rolling direction, due to the softer nature of the
“dislocation-free” cell interiors. As the cells are rotated, new slip systems would become
activated, enabling an even denser dislocation density to form. Estrin, Y., et al [112] found that a
plateau of the hardening rate versus stress diagram associated with stage IV is followed by a fall-
off, signifying yet another stage of hardening, referred to as stage V, which eventually leads to
stress saturation. They found, in their model, that the dislocation densities in the cell interiors
couldn’t be neglected with respect to the cell walls (the ratio of the two dislocation densities
increasing from 10 to 35 with increasing strain). They also found that in stage IV hardening the
cell interiors becomes more and more “dislocation free” (when compared to the walls) while
forcing the dislocations into a smaller and smaller volume of the walls [112].
Dislocation cell walls appear to form at varying depths, depending on applied pressure, as you
can see in Figure 3.12. With increasing pressure an increasing depth of dislocation cell walls are
formed, due to the depth at which dislocations can now be produced and moved. Depending on
the slip regime (and number of cycles reached), this may or may not cause catastrophic
subsurface failure in a larger volume of material. There doesn’t appear to be a difference in
angle of dislocation cell wall formation or a significant increase in dislocation density at
dislocation cell walls with increased pressure, although a denser packing of dislocations at cell
walls appears to be present.
Figure 3.13 shows a rotation of dislocation cells with time. Dislocation cells rotate with
time/continued wear. This rotation could affect wear in many ways, among them being: 1)
changes in oxidation rate, 2) changes in subsurface failure/crack propagation, and 3) activation
of additional slip systems.
Rotation of dislocation cells could affect the oxidation rate in several ways. If the dislocation
cell walls are in fact areas that promote an increased oxidation rate, a dislocation cell wall that is
perpendicular to the surface would cause a localized increase in oxidational rate at various points
in the oxide surface, causing some areas to oxidize faster than others. As these dislocation rich
walls are rotated parallel to the surface, paths for enhanced oxygen diffusion are no longer
oriented perpendicular to the surface, resulting in to a more uniform oxide thickness.
A crack propagates along the direction of travel of the asperity/contact above the crack. During
sliding, the area in front of the contact is subject to compressive stresses, pushing that portion of
the crack shut, while the area directly in back of the asperity/contact is subject to tensile stresses,
opening the crack farther. Crack propagation, theoretically, would be greatest at 45 degrees,

43
when the areas of high strain align with the direction of maximum shear stress. McClintock,
while investigating crack behavior in a rail under rolling conditions, has concluded that cracks in
compressive fields tend to grow in shear [113]. Forsyth found that initial cracks formed when the
slip planes of PSBs most closely aligned with the maximum shear stress direction [114].
However, as wear progresses, and dislocation cell walls increase in size and magnitude of
accumulated strain, a lower applied stress can initiate crack propagation along dislocation cell
wall interfaces. If the dislocation cell walls are rotated parallel to the wear surface, fatigue
cracks could still propagate. Experimental results of Jahanmir et al. [115] found that, in
delamination wear, cracks propagated parallel to the surface for considerable distances before
they became loose. Fatigue cracks could be affected by the rotation of the highly strained cell
boundaries parallel to the wear direction, especially if cracks are initiated in the shear direction
and then continue to propagate with the tensile forces seen by the crack at the trailing end of
sliding during fretting wear. Fatigue cracks could then propagate at a more rapid rate with
increased cycling.
Rotation of dislocation cells, in theory, will make activation of various slip systems easier
because, now, many more slip systems will align with the maximum shear stress as the cells are
being rotated.
Progression of wear with the growth of dislocation cells/persistent slip bands can lead to a
multitude of failures, depending on the growth characteristics of the cells and the stress
distribution/wear conditions.
A plausible theory follows. Many low amplitude movements can cause wear in the stick-slip
regime [116]. Much of fretting wear, where fatigue damage is present, appears to occur in the
stick-slip regime [117, 10, 118, 119, 120, 121]. As wear continues, and material loss becomes more
significant, we may see a shift in stress distribution and slip regime. If a change in the stress
distribution occurs due to change in material contact conditions, for example, the same type of
massive failures seen in the partial slip or mixed slip regimes could be seen, due to the fact that
the dislocation cell structures are still forming subsurface. A high stress could tear apart the,
already highly strained, subsurface structure. These increased wear rates won’t be as large of a
problem in reciprocating wear, a gross-slip regime with a subsurface stress distribution different
from that in the stick-slip or slip regime. In the case of carbon steel, under gross slip conditions,
little difference is observed in either wear rate or wear scar topography at both low and high
frequency [122]. In gross-slip the same stress distribution seen in partial-slip or stick regimes is
not seen and the same microstructural developments and/or failure modes may not occur. Further
work in this area of study is highly suggested.
If we are claiming that fretting wear is a balance between oxidational wear and subsurface
failure at dislocation cell walls then, theoretically, a massive failure could also occur if the
oxidational wear rate is slower than the rate of dislocation cell wall growth at which a maximum
density of dislocations is achieved. Since dislocations continue to be produced during plastic
deformation, the “dislocation free” areas may eventually be consumed by the dislocation dense
cell walls and there is possibility of massive subsurface failure.

44
Another possibility is that as long as the dislocation cell walls remain at an angle of 45 degrees,
crack propagation can dominate wear behavior. When the dislocation cell walls rotate to an
angle parallel to the surface, and oxidation rates increase as well as new forms of oxide
occurring, oxidational wear takes over. Subsurface failure (by crack propagation) can still occur
if the appropriate stresses are reached at the cell wall boundaries.
4.2 MICROSTRUCTURE DEVELOPMENT
Figures 3.9 and 3.11 show an intriguing microstructural development with increasing time. A216
steel is a hypoeutectoid steel, meaning it is comprised of proeutectoid ferrite and pearlite at
ambient temperatures under equilibrium conditions. The microstructures observed at times 1
hour -12 hours are consistent with this microstructure. As we reach steady state wear, at 69
hours, we can see a marked absence of the pearlite phase, with a uniform phase in the cell
interiors.
A possible theory for this transformation follows. Pearlite is a lath structure of eutectoid ferrite
and cementite. The pearlitic microstructure has many phase boundaries, and therefore many
dislocations may be associated with it. As the dislocation cell walls are formed, the dislocations
from the cell interiors, including those associated with the pearlite microstructure, are driven
towards the lower energy configuration of the cell wall, effectively dissolving the pearlite
structure. The carbon from the cementite structure would be either redistributed into the cell
interiors, supersaturating the ferrite with carbon, or follows the dislocations to the dislocation
cell walls.
Dissolution of the pearlite structure could have many implications. If it is redistributed into the
cell interiors the ferrite would show an increase in hardness. However, since ferrite has a low
carbon solubility limit it would be more energetically favorable for the carbon to migrate with
the dislocation cores to the dislocation cell walls, leaving behind a malleable ferrite cell interior.
Since finer ferrite grain sizes improve strength and toughness in ferrite-pearlite microstructures,
the dissolution of pearlite into the dislocation cell structure causes an effectively larger grain (the
cell interior) to form, so the strength and toughness of the A216 steel decreases. Ferrite is the
softest phase in steel, and so the cells could be easily distorted with further wear. This would
explain the fact that the dislocation cell walls appear to have rotated to a direction parallel to the
surface, with time.
Figure 3.10 shows the microstructure of the 410 stainless steel pin with 2N-applied load, after 12
hours of fretting. As you can see, the microstructure is only damaged in the top 500-700nm. No
dislocation structure is present, indicating that the alloying of steel may have a significant effect
on the fretting fatigue of the steel in question. Since alloying of steel creates a significant strain
field the dislocation motion is impeded and the dislocation structure is less favorable.
4.3 WEAR OF OXIDE LAYER
The formation of a stable oxide layer can create a solid lubricant, changing the adhesion
characteristics between contacting surfaces. A change in composition of the disk surface
(changing the solubility between pin and disk) would cause a decrease in adhesion of pin to disk,

45
so we would expect adhesive wear to decrease and another wear mechanism, such as oxidational
wear, abrasive wear, or fatigue wear, to dominate.
Figures 3.3-3.6 shows that at a 10N loading the wear mechanisms appear to vary from adhesive,
abrasive, and fatigue wear of the oxide and substrate, at 1-12 hours, to mainly abrasive wear of
the oxide layer and some transfer of pin material to disk (adhesive wear), at 69 hours. This
abrasive wear of the oxide layer may remain dominant if the oxidation rate remains faster than
the abrasive wear rate, and no other mechanisms develop with time.
Oxide formation is a complex process described by many theories: the early diffusion theories,
such as Tammann-Pilling-Bedworth Parabolic Law (growth by uncharged particles) and Wagner
Theory (diffusion of charged particles) [123], electronically driven theories, such as the theory of
Cabrera and Mott [123] and Schennach et al. [124] and stress/strain limited theories [125, 26, 126]. It is
generally accepted that iron and many of its alloys oxidize in a layered structure with varying
stoichiometries [127, 128, 105]. Closest to the iron substrate is wustite (FeO), followed by magnetite
(Fe3O4,), then farthest away, hematite (Fe2O3). The growth of FeO and Fe3O4 is controlled by
the outward diffusion of cations, whereas the growth of Fe2O3 at the Fe3O4/Fe2O3 interface is
dominated by the inward diffusion of anions [129, 130]. More recently, others have suggested that
Fe2O3 grows by outward cation migration [131, 132]. Wustite is only thermodynamically stable
above 570°C. At temperatures below this, wustite decomposes into magnetite and alpha-iron.
Cation and anion migration is accelerated at higher temperatures, however anything that can
improve the diffusion rates of these ions enhances oxide growth. There is much controversy as
to what temperatures are actually reached in the wear process. It is difficult to experimentally
determine exact temperatures during the wear process, though some have attempted to assess this
using infrared technology [133, 134, 135, 136]]. Many believe there are “hot spots” that form at the
surface, due to the asperities that exist on the virgin surface and those that are created during the
wear process. Others have shown that only modest temperatures are reached during the wear
process. Since wustite is not found in our system, through x-ray diffraction of the wear particles,
it is likely that temperatures of 570 degrees are not reached in any of our experiments.
During mechanical deformation in the plastic regime, dislocations are nucleated and propagated
to accommodate strain. Many believe that oxidation is a stress/strain-aided or hindered process [26, 125, 137, 126]. Stresses that build up in the oxide as it thickens can halt further oxidative growth [125, 26]. Dislocation density, oxide thickness, and lattice misfit between oxide and substrate affect
stress-driven oxidation. Grain boundaries/dislocation cell walls are areas where diffusion is
promoted and higher strain energy may be seen, increasing possible strain-driven diffusion
processes.
As you can see from the oxide mappings in Figure 3.15, the oxide formation, with time,
increases in uniformity. X-ray diffraction of the wear particles indicates a mix of Fe3O4 and
Fe2O3 particles, though a small percentage of FeO may have been undetectable by our
instrument. This change to a uniform oxidation may indicate some change in primary oxide
formed, changing the Pilling-Bedworth ratio and thermal coefficient of expansion which would
change the oxide-substrate adhesion, with increasing time, leading to a less stressed oxide-
substrate interface, and the ability to retain a cohesive oxide layer on the surface. Viewing the
sample cross-sectional orientations using transmission electron microscopy we can also see this

46
difference in oxide thickness. As you can see, in Figure 3.14, the oxide at 12 hours is unevenly
distributed on the surface. By 69 hours (steady state) we have achieved uniformity, unseen
during previous time frames. As the dislocation cell structure becomes more pronounced and the
dislocations pile up to form cell walls the dislocation cores can serve as pathways for oxygen
transport, into the substrate, promoting the formation of Fe3O4.
The oxide debris changed from a reddish color to a blackish color with increasing time. This
intimates a change in oxide formation at the surface as wear progresses. Hematite (Fe2O3) is a
reddish oxide and magnetite (Fe3O4) is a black oxide.
All features seem to indicate a change in oxide formation with increasing time. When we
analyze the oxide formation in terms of ion migration, we can come to a sufficient explanation as
to why this happens. Any form of disruption to the matrix in which these ions are traveling, such
as introduction of dislocations or formation of dislocation clusters, can change the rate of oxide
formation. Creation of dislocations, during the wear process, could trap iron cations, preventing
them from traveling outwards towards the surface, decreasing the volume fraction of FeO or
Fe3O4 forming at the surface. However, with the creation of channels, such as those made
available by dislocation cell walls, an increase in oxygen anion transport is possible, increasing
the amount of Fe3O4 formed at the surface of the iron sample. The rotation of these cell walls
with increasing time would have an influence on the diffusion of oxygen into the subsurface,
enabling an increased oxidation rate parallel to the oxide surface, versus perpendicular to it.
Thus, with increasing wear time and/or pressure we may see a shift in major oxide formed at the
surface of our wear specimen. A shift in major oxide formed at surface affects the wear
properties of that surface. In our fretting wear experiments we found that with time a much more
even surface coverage developed, that did not appear to be completely removed from the
subsurface at any point on the wear surface.
According to Schutze [138] the elastic moduli of Fe3O4 and Fe2O3 are similar (208 and 219 GPa,
respectively), but fracture toughness varies more significantly. The fracture toughness of Fe3O4
is 1.4 MPa and Fe2O3, 1.6 MPa. Chicot et al. [139] verified elastic constants by experiment and
molecular dynamic simulations, revealing a significant difference in elastic constants between
Fe3O4 and Fe2O3. Comparison of hardness values by Takeda et al [105] show that Fe3O4 and
Fe2O3 have significantly different values of hardness, whether formed on an iron substrate or
created by a sintering process, at all temperatures studied. Fe2O3 is a much harder species of iron
oxide than Fe3O4, which is therefore expected to result in much different wear properties.
Regardless of the formation temperature, and whether or not the oxide is formed by sintering or
standard oxide growth, the hardness of Fe3O4 is less than that of Fe2O3. Since the oxide appears
to vary from the hematite (Fe2O3) form to the magnetite (Fe3O4) form with time during fretting
wear, the corresponding decrease in hardness will have a significant effect on protection of the
wearing surface. Sakrani and Sullivan [140] based their study on the idea that mechanically stable
films of Fe3O4 formed by a balanced diffusion of both anions and cations into the film that make
the bulk of the oxide more stable, and the adhesion with the metal substrate strengthened. In
contrast, however, they found that the Fe2O3 films are less stable because the Pilling-Bedworth
ratio is high (~2.14) signifying that the large apparent internal stress, coupled with the expansion
of the lattice due to oxide growth by anion migration, leads to the loss of metal/oxide adhesion,

47
resulting in a thinner oxide overlayer [140]. This would explain why the oxide remains uniform
over the entire surface during the later stages of fretting wear, but is uneven and discontinuously
removed in the earlier stages of fretting wear. This uneven removal of oxide could also be
explained by an uneven pressure distribution at earlier stages of fretting wear, however the shift
in color of the wear debris with time seems to imply the former. A shift to a softer oxide could
also lead to a faster oxidational wear rate and lower spallation, due to the decrease in the Pilling-
Bedworth ratio. As long as the rate of oxide formation surpasses the rate of oxide removal, an
even oxide coating can be anticipated.
It is important to note, however, that while the wear mechanisms on the surface show various
wear mechanisms such as abrasive wear of the oxide layer as the dominant wear mechanism,
Figures 3.8 and 3.9 show that the subsurface has a possibly problematic structure developing
with both increasing time and increasing load. The dislocation cells forming subsurface may be
subject to a massive failure if the cell walls reach appropriate strain levels for crack formation.
This means that it is possible that fatigue of the subsurface could become the prominent failure
mechanism, under appropriate conditions, while it appears that abrasive wear of the oxide is the
dominant mechanism. Testing longer than 69 hours is necessary to test this hypothesis.
4.4 TRANSFER OF 410 STAINLESS STEEL PIN TO A216 CARBON STEEL DISK
The transfer of the 410 stainless steel disk to the A216 carbon steel disk can be seen in Figures
3.1- 3.6. Since 410 stainless steel has much higher chromium content than A216 carbon steel, the
chromium serves as an excellent marker to determine transfer of pin material to the disk, during
fretting wear. Note should be made that there is some chromium in the A216 steel, and so there
will be a background level of chromium seen outside the wear scar in all cases.
Figures 3.1 and 3.2 show the wear progress at 12 hours for loads of 2N and 10N, in the slip
regime, and 15N, in the stick-slip regime. We observe increasing transfer of chromium with
increasing load in the slip-regime; at 2N load there is little to no transfer of pin material to disk.
As we move from the slip-regime to the stick-slip regime we find an even heavier transfer of
chromium to the center of the wear scar. This follows from the fact that shear stress seen by the
pin is much higher in the stick-slip regime, thereby removing more of the pin material and
transferring to the disk
Figures 3.3-3.5 show the wear progress from 1-12 hours at 10N in the slip regime. We see a
heavy transfer but uneven distribution of chromium on the A216 carbon steel disk. Figure 3.6
shows the surface when steady state wear, at 69 hours, has been reached; we find that the
chromium is evenly distributed, but transference is lesser than in the wearing-in cases. This
follows from the fact that the pressure is unevenly distributed during the wearing in cases,
because the surfaces do not mate perfectly. Undulations present on the initial sample surface as
well as from uneven wear, due to adhesion/fatigue/abrasion, create areas of higher pressure, and
hence higher material transfer.

48
Chapter 5
Conclusions
The findings presented in this dissertation show that fretting wear is best understood as a synergy
between oxidational wear and fatigue wear, the latter accumulating in effect below the surface
during the oxidational wear process. In low load regimes, oxidational wear is the dominant wear
mechanism when there is not enough subsurface strain to cause massive failure. Nevertheless,
the dislocation structure forming in the subsurface has an effect on surface oxide formation. This
causes a change in oxide stoichiometry over time. In high load regimes, the material may fail by
delamination within the subsurface, due to accumulation and alignment of dislocation cell walls.
Though the exact pressure reached with applied load is hard to determine, we can characterize
our findings by behavioral regimes. The "slip" regime is associated with pressures in the 2N to
10N range, while the "stick-slip" regime is associated with pressures in the 15N range. The
depth of subcell boundaries increases with increasing load, indicating that in both the slip regime
and stick-slip regime, dislocation cells are generated. These dislocation cells consume a larger
portion of the subsurface as we transition from slip to stick-slip regimes. The depth of damaged
layers is dependent on the non-uniform shear stress distribution, which varies with depth into the
subsurface.
The dislocation cells also increase in depth over time within the slip regime. This indicates that
the wear rate is slower than the formation rate of dislocation cells, suggesting that in longer time
regimes, catastrophic failure could result from cell wall induced subsurface delamination.
With time, the dislocation cells rotate from alignment with the maximum shear stress to a
direction parallel to the surface. This rotation can effect crack formation/propagation as well as
oxide formation on the surface, with implications for service lifetimes in engineering
components subjected to fretting wear.
At 2N loading, in the slip regime, energy dispersive spectroscopy reveals that oxide formation
during fretting wear is non-uniform in the early stages and becomes uniform by the steady-state
wear phase, at 69 hours. The TEM cross-sectional images confirm this. It is concluded that the
primary oxide evolves from Fe2O3 to Fe3O4, with increasing fretting time, leading to a uniform
oxide on the surface of the A216 disk. This change in oxidation is believed to be associated with
the formation of dislocation cells in the subsurface. The dislocation-rich cell walls serve as
enhanced diffusion sites for transport of oxygen ions into the metal, increasing the percent of
Fe3O4 formed on the surface. Though the hardness of Fe3O4 is less than Fe2O3, the Pilling-
Bedworth ratio is smaller, thus leading to less stress generation in the oxide layer, and better
adhesion to the A216 steel substrate. As long as the rate of oxide formation surpasses the rate of
oxide removal, an even oxide coating can be anticipated.
Scanning electron microscopy combined with electron dispersive spectroscopy reveals that the
wear mechanisms at 2N loading appear to vary from adhesive, abrasive, and fatigue wear of the
oxide and substrate at 1-12 hours, to mainly abrasive wear of the oxide layer at 69 hours. While
49
the wear mechanisms on the surface confirm these forms of wear, the subsurface shows a
possible problematic structure developing. The dislocation cells forming subsurface may be
subject to a massive failure if the cell walls reach appropriate strain levels for crack formation.
This observation shows the importance of surface combined with subsurface analysis for future
endeavors to understand the wear process.
Chapter 6
Recommendations for Further Work
Our focus, in this dissertation, was on the short-term structural changes induced by the fretting
process. It did not simulate the exact environment in which the W501FD row-2 diaphragm
operates.
The research that has been undertaken for this dissertation has highlighted a number of topics on
which further research would be beneficial. These include whether or not the dislocation
structure becomes problematic at fretting times longer than 69 hours, at ambient temperature.
With increased wear, does the dislocation structure begin to fail at the dislocation cell walls or
through the cell interiors or does abrasive wear of the oxide remain the dominant wear
mechanism? Further study of the oxide development on the surface of the wear scars, at the
temperatures observed in service in the area of the row-2 diaphragm, would be beneficial. An
increase in temperature will not only increase oxidation rates, but also increase dislocation
mobility. Future studies might, for example, look for variation in dislocation cell structure with
increased temperature. Does this structure maintain the dislocation wall structure at higher
temperatures? If the dislocation wall structure forms at a faster rate during high temperature
fretting does the dislocation wall continue to increase in thickness or does the structure reach a
stage where the wall thickness becomes constant and continued wear causes failure at the
dislocation cell walls? Further investigation into the evolution of oxide formation on the wear
surface with an increase of temperature is recommended. An increase in temperature will
increase the oxidation rates of the various oxides formed. Does this increase in oxidation rate
create a protective layer faster than it is removed, at higher temperatures? As the dislocation
cells evolve does abrasive wear of the oxide remain the dominant wear mechanism? If the
temperature is increased, and FeO becomes an energetically stable form of oxide on the surface,
does the oxide adhere to the substrate better, or does thermal expansion aid in removal of the
oxide? Further fretting testing of the pin material (410 stainless steel) is recommended in order to
determine the effect of alloying on the dislocation structure formed, since the pin material does
not show any dislocation structure after 12 hours of fretting.

50
References Cited 1 Welsh, N.C., “The Dry Wear of Steels I. The General Pattern Behaviour” Phil. Trans. R. Soc.
London A, 257, (1964) 31-50 2 Roos, J.R., Cells, J.P., and De Bonte, M., “Materials Science and Technology”, (2006)
ISBN:3527313958 3 Misra, A. and Finnie, I., “An Experimental Study of Three-Body Abrasive Wear”, Wear, Vol.
85, Issue 1, (1983), pp 57-68 4 Zhou, Z.R. and Vincent, L., Effect of External Loading on Wear Maps of Aluminum, Wear,
Volumes 162-164, Part A, (1993), pp 619-623 5 Fouvry, S., Kapsa, Ph., and Vincent, L., “Analysis of Sliding Behaviour for Fretting Loadings:
Determination of Transition Criteria”, Wear, 185, (1995), pp 35-46 6 Hagar Jr., C.H., Sanders, J.H., Sharma, S., “Characterization of mixed and gross slip fretting
wear regimes in Ti6Al4V interfaces at room temperature”, Wear, Volume 257, Issues 1-2,
(2004), pp. 167-180 7 Vingsbo, O. and Soderberg, S., “On Fretting Maps”, Wear, Vol 126, Issue 2, (1988), pp. 131-
147 8 Ruff, A.W., “Comparison of Standard Test Methods For Non-Lubricated Sliding Wear”, Wear,
134 (1989) pp. 49-57 9 Xia, J., Kovac, J., McQuiggan, G., and Wolfe, B., “SGT6-5000F (W501F) Engine
Enhancements to Improve Operational Flexibility”, POWER-GEN International, (2005), Las
Vegas, NV 10 Burwell, J.T., Jr., Survey of Possible Wear Mechanisms, Wear, Vol 1, (1957/1958) pp 119-
141 11 Komvopoulos, K., Suh, N.P., and Saka, N., “Wear of Boundary-Lubricated Metal Surfaces”,
Wear, Vol 107 (1986) 107-132 12 Li, C.X., The University of Birmingham, UK 13 de Souza, J.A., Dolavale, L.C., de Souza Camargo, S.A., “Wear mechanisms of dental
composites restorative materials by two different in-vitro methods”, Materials Research, Vol. 16,
No. 2, 2012 14 Archard, J.F., “Contact and Rubbing of Flat Surfaces”, Journal of Applied Physics, Vol 24, No
8, (1953), pp 981-988 15 Holm, R., Electrical Contacts, Stockholm: H. Gerber Pub. (1946) 16 Hornbogen, E., The Roll of Fracture Toughness in the Wear of Metals, Wear, 33 (1975) 251-
259 17 Ramesh, C.S., Anwar Khan, A.R. Ravikumar, N., Savanprabhu, P., Prediction of Wear
Coefficient of Al6061-TiO2 Composites, Wear, Vol 259, Issues 1-6 (2005), pp 602-608 18 Wu, J.M., Lin, S.J., Yeh, J.W., Chen, S.K., Huang, Y.S., Chen, H.C., Adhesive Wear Behavior
of AlxCoCrCuFeNi High-Entropy Alloys as a Function of Aluminum Content, Wear, Vol 261,
Issues 5-6, (2006), pp 513-519 19 Viafara, C.C. and Sinatora, A., Unlubricated sliding friction and wear of steels: An evaluation
of the mechanism responsible for the T1 wear regime transition, Wear, Vol. 271, (2011), 1689-
1700 20 Rabinowicz, E., “Wear”, Materials Science and Engineering, 25 (1976) pp. 23-28 21 Rabinowicz, E, Friction and Wear of Materials, John Wiley and Sons, New York (1965) 22 Lawless, K.R., “The Oxidation of Metals”, Rep. Prog. Phys. Vol 37, (1974), pp 231-316

51
23 Bamford, C.H. and Compton, R.G., Chemical Kinetics, Volume 21: Reactions of Solids with
Gases, Elsevier, (1984) 24 Lazzeri, M. and Selloni, A., Stress-Driven Reconstruction of an Oxide Surface: The Anatase
TiO2(001) – (1x4) Surface, Phys. Rev. Lett. Vol. 87, No 26, (2001) 25 Cao, Z., Thin Film Growth: Physics, Materials Science and Applications, Woodhead
Publishing, (2011) 26 Evans, H.E., Stress Effects in High Temperature Oxidation of Metals, International Materials
Review, Vol. 40, No. 1, (1995), pp 1-40 27 Hills, D.A., “Mechanics of Fretting Fatigue”, Wear, 175 (1994) pp 107-113 28 Ohmae N. and Tsukizoe, T., “The Effect of Slip Amplitude on Fretting”, Wear, 27 (1974) 281-
294 29 Waterhouse, R.B., Fretting Corrosion, Pergamon, Oxford, 1972. 30 Waterhouse, R.B., Fretting Fatigue, Elsevier Applied Science, London, 1981. 31 Perier, V., et al., Fretting-Fatigue Behaviour of Bridge Engineering Cables in a Solution of
Sodium Chloride, Wear 267 (2009) 308-314 32 Chamont, C., et al., Wear Problems in Small Displacements Encountered in Titanium Alloy
Parts in Aircraft Turbomachines, Proc. Sixth World Conf. on Titanium, June 6-9, 1988, Cannes 33 Qian, L., et al., Nanofretting Behaviors of NiTi Shape Memory Alloys, Wear 263 (2007), 501-
507 34 Berthier, Y., et al., Fretting Fatigue and Fretting Wear, Tribology International, Vol. 22 (1989)
No. 4, 235-242 35 Hurricks, P.L., “The Fretting Wear of Mild Steel from Room Temperature to 200C”, Wear,
Vol 19, Issue 2, (1972), pp 207-229 36 Hurricks, P.L., “The Fretting Wear of Mild Steel from 200C to 500C”, Wear, Vol 30, Issue 2,
(1974), pp 189-212 37 Goto , H. and Buckley, D.H., “Effect of Humidity on Fretting Wear of Several Pure Metals,
NASA Technical Paper 2403, (1984), Lewis Research Center, Cleveland, Ohio 38 Basu, B., Vitchev, R.G., Vleugels, J., Celis, J.P., and Van Der Biest, O., “Influence of
Humidity on the Fretting Wear of Self-Mated Tetragonal Zirconia Ceramics”, Acta Materialia,
Vol 48, Issue 10, (2000), pp 2461-2471 39 Mary, C., Fouvry, S., Martin, J.M., and Bonnet, B., “Pressure and Temperature Effects on
Fretting Wear Damage of a Cu-Ni-In Plasma Coating Versus Ti17 Titanium Alloy Contact”,
Wear, Vol. 272, Issue 1, (2011), pp 18-37 40 Berthier, Y., Vincent, L., Godet, M., “Velocity Accomodation in Fretting”, Wear, Vol 125
(1988) pp 25-38 41 Iwabuchi, A., “The Role of Oxide Particles in the Fretting Wear of Mild Steel”, Wear, Vol
151, Issue 2, (1991), pp 301-311 42 Jiang, J., Stott, F.H., Stack, M.M., “The Role of Triboparticulates in Dry Sliding Wear”,
Tribology International, Vol 31, Issue 5, (1998), pp 245-256 43 Stott, F.H., “The Role of Oxidation in the Wear of Alloys”, Tribology International, Vol 31,
Issues 1-3, (1998), pp 61-71 44 Landolt, D., Mischler, S., Stemp, M., “Electrochemical Methods in Tribocorrosion: A Critical
Appraisal”, Electrochimica Acta, Vol 46, (2001), pp 3913-3929 45 Godfrey, D., “Investigation of Fretting Corrosion By Microscopic Observation”, N.A.C.A.
Report, No 1009, (1951)

52
46 Godfrey, D., and Bailey, J.M., “Early Stages of Fretting of Copper, Iron, and Steel”,
Lubrication Eng., 10 (1954) pp 155 47 Feng, I.M. and Rightmire, B.G., “An Experimental Study of Fretting”, Masters Thesis,
University of California, Berkeley (1955) 48 Hurricks, P.L., “The Mechanism of Fretting – A Review”, Wear, Vol 15, (1970) , pp 389-409 49 Forrest, P.G., “Fatigue of Metals”, Pergamon Press (1962), p. 236 50 Quinn, T.F.J., Role of Oxidation in the Mild Wear of Steel, British Journal of Applied Physics,
Vol. 13, (1962) pp. 33-37 51 Quinn, T.F.J., Rowson, D.M., and Sullivan, J.L., “Application of the Oxidational Theory of
Mild Wear to the Sliding Wear of Low Alloy Steel”, Wear, 65, (1980), pp 1-20 52 Komvopoulos, K., Saka, N., and Suh, N.P., “The Significance of Oxide Layers in Boundary
Lubrication”, Journal of Tribology, ASME Trans., Vol. 108, No. 4, 1986, pp. 502–513. 53 Lancaster, J.K., A Review of the Influence of Environmental Humidity and Water on Friction,
Lubrication, and Wear, Tribology International, Vol 23, No 6, (1990), 371-389 54 Venkatesan, S., and Rigney, D.A., “Sliding Friction and Wear of Plain Carbon Steels in Air
and Vacuum”, Wear, Vol. 153, Issue 1, (1992) pp 163-178 55 Eyre, T.S., et al., Surface Aspects of Unlubricated Metal-To-Metal Wear, Wear, 18 (1971)
301-310 56 Quinn, T.F.J., Oxidational Wear, Wear, 18 (1971), 413-419 57 Quinn, T.F.J., Review of Oxidational Wear. Part I: The Origins of Oxidational Wear, Tribol.
Int. 16 (1983), 257-271 58 Quinn, T.F.J., Physical Analysis for Tribology, Cambridge University Press, New York,
(1991) 59 Hong, H., A New Approach to the Oxidational Theory of Mild Wear, STLE Trans., 31 (1988)
71-75 60 Sullivan, J.L., et al., Developments in the Oxidational Theory of Mild Wear, Tribol. Int., 12
(1980) 153-158 61 Quinn, T.F.J., The Effect of “Hot-Spot” Temperatures on the Unlubricated Wear of Steel,
ASLE Transactions, 10 (1967) 158-168 62 Zagrodzki, P., and Truncone, S.A., Generation of Hot Spots in a Wet Multidisk Clutch During
Short-Term Engagement, Wear, 254 (2003) 474-491 63 Kalin, M., Influence of Flash Temperatures on the Tribological Behaviour in Low-Speed
Sliding: a Review, Materials Science and Engineering: A, 374 (2004) 390-397 64 Podra, P. and Andersson, S., “Simulating Sliding Wear with Finite Element Method”,
Tribology International, Vol. 32, Issue 2, (1999), pp 71-81 65 McColl, I.R., Ding, J., and Leen, S.B., “Finite Element Simulation and Experimental
Validation of Fretting Wear”, Wear, Vol 256, Issues 11-12, (2004), pp. 1114-1127 66 Madge, J.J., Leen, S.B., and Shipway, P.H., “The Critical Role of Fretting Wear in the
Analysis of Fretting Fatigue”, Wear, Vol. 263, Issue 1-6, (2007), pp. 542-551 67 Yin, X. and Komvopoulos, K., “A Discrete Dislocation Plasticity Analysis of Plane-Strain
Indentation of a Single-Crystal Half-Space by a Smooth and a Rough Rigid Asperity”, Proc.
STLE/ASME 2010 International Joint Tribology Conference, IJTC2010, October 17-20, (2010),
San Francisco, CA 68 Shipway, P.H., et al., The Hardness and Sliding Wear Behavior of a Bainitic Steel, Wear, 203-
204 (1997) 196-205

53
69 Kalousek et al., The Wear Resistance and Worn Metallography of Pearlite, Bainite, and
Tempered Martensite Rail Steel Microstructures of High Hardness, Wear, 105 (1985) 199-222 70 Moore, M.A., The Relationship Between the Abrasive Wear Resistance, Hardness, and
Microstructure of Ferritic Materials, Wear, 28 (1974) 59-68 71 Lee, G.Y., “Abrasive Wear of Advanced Structural Materials”, UC Berkeley PhD
dissertation, (2002) 72 Zhou, Z.R. and Vincent, L. Cracking Induced by Fretting of Aluminum Alloys, Journal of
Tribology, 119 (1997) 36- 42 73 http://www.ccj-online.com/2q-2008/501f/ 74 Bramfitt, B.L., Structure/Property Relationships in Irons and Steels, Metals Handbook Desk
Edition, Second Edition, J.R. Davis, Editor, (1998) pp. 153-173 75 Campbell, F.C., “Elements of Metallurgy and Engineering Alloys”, ASM International,
(2008), ISBN-13: 978-0-87170-867-0 76 Alavudeen, A., Venkateshwaran, N., and Jappes, J.T.W., “A Textbook of Engineering
Materials and Metallurgy”, Laxmi Publications (P) LTD., New Delhi, (2006) 77 Mouritz, A.P. “Introduction to Aerospace Materials”, Woodhead Publishing, (2012), ISBN:
978-1-85573-946-8 78 Lipson, H. & Petch, N.J. “The Crystal Structure of Cementite, Fe3C”, J. Iron Steel Inst.
(London), 142 (1940) pp. 95 79 Totten, G.E., “Steel Heat Treatment Handbook (Second Edition): Steel Heat Treatment:
Metallurgy and Technologies”, Taylor & Francis, Boca Raton, FL (2007), ISBN-13: 978-0-
8493-8455-4 80 Reddy, K., “Principles of Engineering Metallurgy”, New Age International (P) Limited
Publishers, New Delhi, (1996), ISBN: 81-224-0952-0 81 Bhadeshia, H. and Honeycombe, R., “Steels: Microstructure and Properties”, Third Edition,
Butterworth-Heinemann (2006), ISBN-13: 978-0-750-68084-4 82 Bhadeshia, H.K.D.H., “Bainite in Steels”, Second Edition, Institute of Materials, (2001) ISBN:
1-86125-112-2 83 Pollack, “Materials Science and Metallurgy”, 4th ed., Prentice-Hall, 1988 84 Halliday, J.S. and Hirst, W., The Fretting Corrosion of Mild Steel, Proc. Roy. Soc. (London),
Ser. A, 236 (1956) p. 411 85 Waterhouse, R.B., Fretting Wear, Wear, Vol. 100, (1984), pp. 107-118 86 Warburton, J., “The Fretting of Mild Steel in Air”, Wear, Vol. 131, (1989), pp. 365-386 87 Kawalec, J.S., Brown, S.A., Payer, J.H., Merritt, K., “Mixed-Metal Fretting Corrosion of
Ti6Al4V and Wrought Cobalt Alloy”, Journal of Biomedical Materials Research, Vol. 29,
(1995), pp. 867-873 88 Hallab, N.J., Messina, C., Skipor, A., Jacobs, J.J., Differences in the Fretting Corrosion of
Metal-Metal and Ceramic-Metal Modular Junctions of Total Hip Replacements”, Journal of
Orthopaedic Research, Vol 22, (2004), pp 250-259 89 Zhang, X.Y., Ren, P.D., Zhong, F.C., Zhu, M.H., Zhou, Z.R., Fretting Wear and Friction
Oxidation Behavior of 0Cr20Ni32AlTi Alloy at High Temperature, Trans. Nonferrous Met. Soc.
China, Vol 22, (2012), pp 825-830 90 Tomlinson, G.A., The Rusting of Steel Surfaces in Contact, Proc. Roy. Soc. (London), Ser. A,
115, (1927) p. 472 91 Phakatkar, H.G. and Ghorpade, R.R., Tribology, Second Edition, (2009) Nirali Prakashan,

54
92 Sakrani, S.B. and Sullivan, J.L., “Iron Oxide Films in Tribological Surfaces of Alloy Steel”,
Proc. Third International Converence on Thin Film Physics and Applications, 175 (February 20,
1998) 93 Amodeo, R.J. and Ghoniem, N.M., “Dislocation Dynamics. II. Applications to the Formation
of Persistent Slip Bands, Planar Arrays, and Dislocation Cells”, Physical Review B., Vol. 41,
(1990), pp. 6968-6976 94 Hansen, N., “Microstructure and Flow Stress of Cell Forming Metals”, Scripta Metallurgica et
Materialia, Vol. 27, (1992) pp. 947-950 95 Landolt, D. and Mischler, S., “Tribocorrosion of Passive Metals and Coatings”, Woodhead
Publishing, (2011) 96 Kuhlmann-Wilsdorf, D., “Q: Dislocation Structures – How Far From Equilibrium? A: Very
Close Indeed”, Materials Science and Engineering: A, Vol. 315, Issues 1-2, (2001), pp. 211-216 97 Chu, D. & Morris, Jr., J.W. “The Influence of Microstructure on Work Hardening in
Aluminum”, Acta Mater., Vol 44, No. 7, [1996] pp 2599-2610 98 Mughrabi, H. “Dislocation Wall and Cell Structures and Long-Range Internal Stresses in
Deformed Metal Crystals”, Acta Metall., Vol. 31, No. 9, (1983) pp 1367-1379 99 Holt, D.L. “Dislocation Cell Formation in Metals”, Journal of Applied Physics, Vol. 41, No. 8,
[1970] pp 3197-3201 100 Qian Yu, et al. “The Effect of Size on Dislocation Cell Formation and Strain Hardening in
Aluminum”, Philosophical Magazine, Vol. 94, Issue 18, [2014] pp 2062-2071 101 Mughrabi, H. et al.,“Persistent Slipbands in Fatigued Face-Centered & Body-Centered Cubic
Metals”, in Fatigue Mechanisms, ASTM STP 675 (edited by J.T. Fong), Am. Soc. For Testing of
Materials, Philadelphia, PA, (1979) p. 69 102 Kuhlmann-Wilsdorf, D. and Hansen, N., “Theory of Work-Hardening Applied to Stages III
and IV”, Metallurgical Transactions A, Vol 20A (1989) 2393-2397 103 Pilling, N.B. and Bedworth, R.E., “The Oxidation of Metals at High Temperatures”, J. Inst.
Met, Vol 29, (1923), pp 529-591 104 Murthy, V.S.R., “Structure and Properties of Engineering Materials”, Tata McGraw-Hill
Publishing Company Limited, New Dehli, (2005) 105 Takeda, M., et al., “Physical Properties of Iron-Oxide Scales on Si-Containing Steels at High
Temperature”, Materials Transactions, Vol. 50, No. 9 (2009) pp. 2242-2246 106 Phillippe Marcus, “Corrosion Mechanisms in Theory and Practice”, Third Edition, (2012)
CRC Press 107 Carter, R.E., Roth, W.L. and Julien, C.A., “Orientation Relation Between Hematite
Precipitate and its Ferrite Host”, Journal of the American Ceramic Society, Vol. 42, No. 11,
(1959), 533-536 108 Van der Giessen, E. and Needleman, A., “Discrete Dislocation Plasticity: A Simple Planar
Model”, Modelling Simul. Mater. Sci. Eng., 3 (1995) 689-735 109 Essmann, U. and Mughrabi, H., “Annihilation of Dislocations During Tensile and Cyclic
Deformation and Limits of Dislocation Densities”, Philosophical Magazine A, 1979, Vol 40, No
6, pp 731-756 110 http://www.doitpoms.ac.uk/tlplib/slip/slip_in_ccp.php 111 Brown, L.M. “Dislocation Plasticity in Persistent Slip Bands”, Materials Science and
Engineering, A285 (2000) 35-42

55
112 Estrin, Y., Toth, L.S., Molinari, A., and Brechet, Y., “A Dislocation-Based Model for all
Hardening Stages in Large Strain Deformation”, Acta Mater., Vol 46, No 15, (1998) pp 5509-
5522 113 McClintock, F. A., "Plastic Flow Around a Crack Under Friction and Combined Stress,"
Fracture 1977, Taplin, D. M. R., ed., Vol. 4, Pergamon, 1978, pp. 49-64. 114 Forsyth, P. J. E., "A Two Stage Process of Fatigue Crack Growth," Proceedings of Crack
Propagation Symposium, Vol. 1, 1961, pp. 76-94. 115 Jahanmir, S., Suh, N. P., and Abrahamson, E. P., "Microscopic Observations of the Wear
Sheet Formation by Delamination," Wear, Vol. 28, 1974, pp.235-249. 116 Bryggman, U. and Soderberg, S., Contact conditions in fretting, Wear, 110 (1986) 1 - 17. 117 Vingsbo, O.B., “Fretting and Contact Fatigue Studied With the Aid of Fretting Maps”,
Standardization of Fretting Fatigue Test Methods and Equipment, ASTM STP 1159 (1988) 118 Zhou, Z.R. and Vincent, L., “Mixed Fretting Regime”, Wear, 181-183 (1995), pp. 531-536 119 Matikas, T.E. and Nicolaou, P.D., “Development of a Model for the Prediction of the Fretting
Fatigue Regimes”, J. Mater. Res., Vol. 16, No. 9, (2001), pp. 2716 - 2723 120 Jeong, S.H. and Lee, Y.Z., “Determination of the Fretting Regimes Under Stick-Slip
Condition Using The Phase Difference Between Friction and Relative Displacement of Two
Fretting Surfaces”, Proceedings of IJTC2006 (2006), San Antonio, TX, USA 121 Jeong, S.H. and Yong, S.J., “Friction and Wear Characteristics Due to Stick-Slip Under
Fretting Conditions”, Tribology Transactions, 50, (2007), pp. 564-572 122 Soderberg, S., Bryggman, U., McCullough, T., Frequency Effects in Fretting Wear, Wear,
110 (1986) 19-34 123 Fromhold, A.T., “Theory of Metal Oxidation”, North Holland Publishing Company,
Amsterdam (1976). Signatur an der Bibliothek der Uni Graz: I 466591 124 Schennach, R., Promreuk, S., Naugle, D.G., Cocke, D.L., “Thermal Electrochemical, and
Plasma Oxidation of Ti-50Zr, Cu-50Zr, Cu-50Ti, and Cu-33Ti-33Zr Alloys”, Oxidation of
Metals, Vol. 55, No. 5/6, (2001) , pp. 523-541 125 Evans, A.G., Crumley, G.B., and Demaray, R.E., “On the Mechanical Behavior of Brittle
Coatings and Layers”, Oxidation of Metals, Vol. 20, Nos. 5/6, (1983), pp. 193-216 126 Pratt, A., Lari, L., Hovorka, O., Shah, A., Woffinden, C., Tear, S.P., Binns, C., and Kroger,
R., “Enhanced Oxidation of Nanoparticles Through Strain-Mediated Ionic Transport”, Nature
Materials, 13, 26-30, (2014), pp. 26-30 127 Petty, E.R., “Physical Metallurgy of Engineering Materials”, Allen and Unwin, (1970), ISBN:
0046710043, 9780046710040 128 Kutz, M., “Handbook of Environmental Degredation of Materials”, William Andrew
Publishing (2005), Norwich, New York, USA ISBN: 0-8155-1500-6 129 Kubaschewski, O. and Hopkins, B.E., “Oxidation of Metals and Alloys”, 2nd Edition, (1962),
Butterworths, London 130 Hauffe, K., “Oxidation of Metals”, (1965), Spain, ISBN 978-1-4684-8920-0 131 Birks, N. and Meier, G.H., “Introduction to High Temperature Oxidation of Metals”, Edward
Arnold, (1983), ISBN 13: 9780713134643 132 Bruckman, K. and Simkovich, G., “Concerning the Mechanism of Scale Growth Due to
Cation Diffusion in Fe2O3 and CuS”, Corrosion Science, Vol. 12, (1972), pp. 595-601

56
133 Quinn, T.F.J. and Winer, W.O., “An Experimental Study of the “Hot-Spots” Occuring During
the Oxidational Wear of Tool Steel on Sapphire”, Journal of Tribology, Volume 109, Issue 2,
(1987) 315-319 134 Hong, H. and Winer, W.O., “A Fundamental Tribological Study of Ti/Al2O3 Contact in
Sliding Wear”, Journal of Tribology, Volume 111, Issue 3, (1989), pp. 504-509 135 Bair, S., Green, I., Bhushan, B., “Measurements of Asperity Temperatures of a Read/Write
Head Slider Bearing in Hard Magnetic Recording Disks”, Journal of Tribology, Volume 113,
Issue 3, (1991), pp. 547-554
136 Bogdanovich, P.N., and Tkachuk, D.V., “Temperature Distribution Over Contact Area and
“Hot Spots” in Rubbing Solid Contact”, Tribology International, Vol. 39, Issue 11, (2006), pp.
1355-1360 137 Ciacchi, L.C., Cole, D.J., Payne, M.C., and Gumbsch, P., “Stress-Driven Oxidation
Chemistry of Wet Silicon Surfaces”, J. Phys. Chem. C., Vol. 112, No. 32, (2008), pp. 12077-
12080 138 Schutze, M., “Mechanical Properties of Oxide Scales”, Oxidation of Metals, Vol. 44, No. 1/2,
(1995) 139 Chicot, D., et al., “Mechanical Properties of Magnetite (Fe3O4), Hematite (α-Fe2O3) and
Goethite (α-FeO.OH) by Instrumented Indentation and Molecular Dynamics Analysis”,
Materials Chemistry and Physics, 129 (2011) pp. 862-870 140 Sakrani, S.B. and Sullivan, J.L., “Iron Oxide Films in Tribological Surfaces of Alloy Steel”,
Proc. SPIE 3175, Third International Conference on Thin Film Physics and Applications, 175
(1998)
![Development of a Modular Fretting Wear and Fretting ... · studied the wear behavior of thin steel wires with a fretting wear tribometer that was developed at BAM [4,15]. In both](https://img.dokumen.tips/doc/110x75/5e20245bd81e082c5a0f3176/development-of-a-modular-fretting-wear-and-fretting-studied-the-wear-behavior.jpg)


![JJC Jordan Journal of Chemistry Vol. 3 No.3, 2008, pp. 281 ......friction an wear [21]. Fretting Wear The fretting wear results of the 480-nm thick Ag 49 Ni 51 and the 510-nm thick](https://img.dokumen.tips/doc/110x75/60cd188c19d835726f16989c/jjc-jordan-journal-of-chemistry-vol-3-no3-2008-pp-281-friction-an-wear.jpg)