Embed Size (px)
Citation preview
Frequency Response Monitoring in Western Interconnection
Dmitry Kosterev, BPA, Chair of WECC JSIS Donald Davies, WECC Pavel Etingov, PNNL
Alison Silverstein, NASPI Joe Eto, LBNL, CERTS
CIGRE Grid of The Future Conference, October 2014, Houston, TX 1
Outline
• Frequency Response • Regulatory Landscape • WECC Frequency Response Performance • Frequency Response Analysis Tool • Conclusions and Future Work
2
Frequency Response
FERC defines in RM13-11: “Frequency response is a measure of an Interconnection’s ability to stabilize frequency immediately following the sudden loss of generation or load, and is a critical component of the reliable operation of the Bulk-Power System, particularly during disturbances and recoveries.”
3

Regulatory Landscape - West • WECC had several attempts to develop a regional
frequency-responsive reserve standard from 1999 to 2010, driven by – frequency response imbalances in the West (hydro-
based North vs. thermal-based South) – needing to determine reliability-justified frequency
responsive reserves following California energy crisis • WECC developed and approved White Paper on
Frequency Responsive Reserve Standard in 2004 • FRR criterion was voted down in 2009
4
Regulatory Landscape - National • FERC-commissioned report on Frequency
Response Metrics, 2010 • FERC held Technical Conferences, 2010 • NERC Frequency Response Initiative, 2011-2012 • NERC BAL-003-1 Frequency Response and
Frequency Response Bias Reliability Standards is approved in 2013 – Simplicity is the major advantage, as well as a major
limitation
5
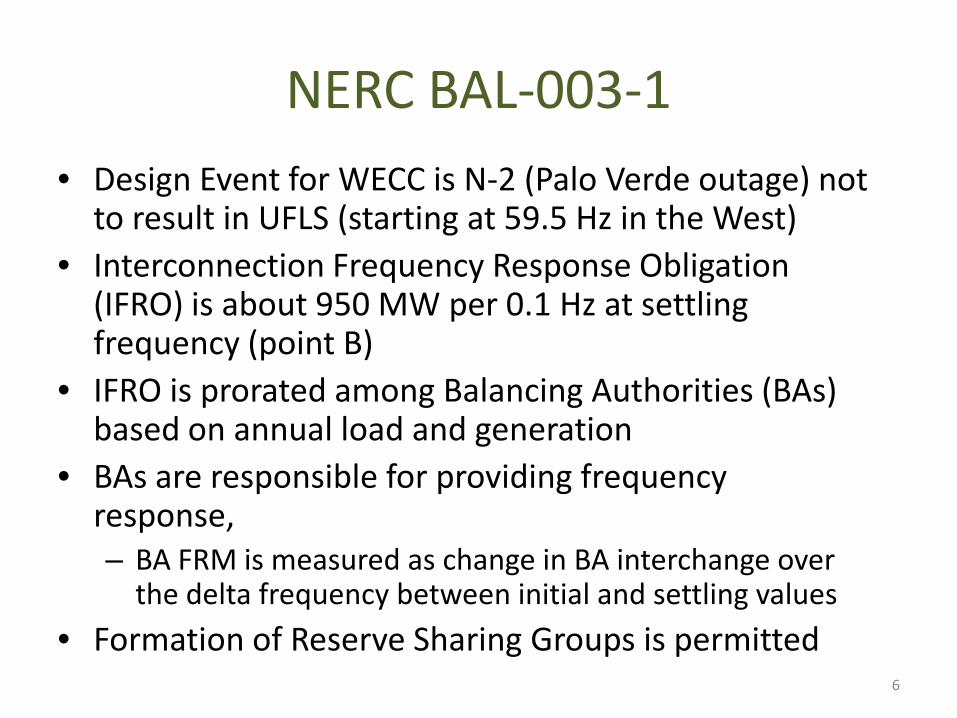
NERC BAL-003-1 • Design Event for WECC is N-2 (Palo Verde outage) not
to result in UFLS (starting at 59.5 Hz in the West) • Interconnection Frequency Response Obligation
(IFRO) is about 950 MW per 0.1 Hz at settling frequency (point B)
• IFRO is prorated among Balancing Authorities (BAs) based on annual load and generation
• BAs are responsible for providing frequency response, – BA FRM is measured as change in BA interchange over
the delta frequency between initial and settling values • Formation of Reserve Sharing Groups is permitted
6
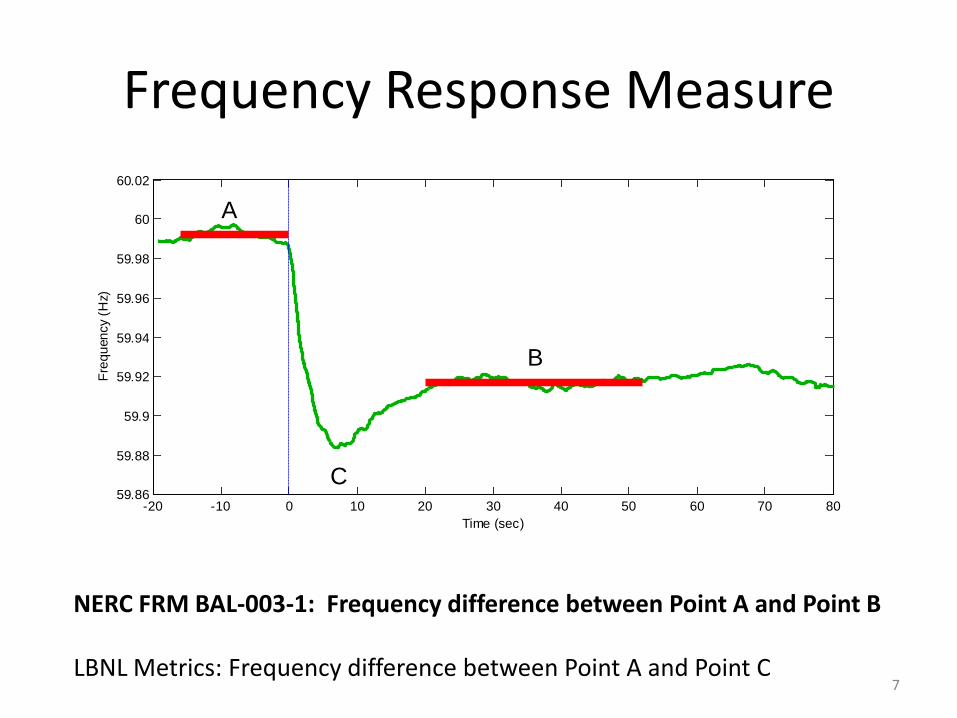
Frequency Response Measure
-20 -10 0 10 20 30 40 50 60 70 8059.86
59.88
59.9
59.92
59.94
59.96
59.98
60
60.02
A
B
C
Time (sec)
Freq
uenc
y (H
z)
NERC FRM BAL-003-1: Frequency difference between Point A and Point B LBNL Metrics: Frequency difference between Point A and Point C
7

Western Interconnection Performance
• Red dots – frequency response measured at point B (settling) using NERC FRM methodology
• Blue diamonds – frequency response is measured at point C (nadir)
2008 2009 2010 2011 2012 2013 2014 20150
200
400
600
800
1000
1200
1400
1600
1800
2000
Year
Freq
uenc
y R
espo
nse
(MW
per
0.1
Hz)
Frequency Response Measure for Western Interconnection
WECC IFRO ~950 MW per 01. Hz, WECC IFRM is trending ~ 1,400 to 1,600 MW per 0.1 Hz Response at nadir: required ~580 MW per 0.1 Hz, actual is about 800 MW per 0.1 Hz
8

Western Interconnection Performance
• Red dots – frequency response measured at point B (settling) using NERC FRM methodology
• Blue diamonds – frequency response is measured at point C (nadir)
500 1000 1500 2000 2500 30000
200
400
600
800
1000
1200
1400
1600
1800
2000
Event Size (MW)
Freq
uenc
y R
espo
nse
(MW
per
0.1
Hz)
Frequency Response Measure for Western Interconnection
Response versus size of event: Small events do not extrapolate well to large Nadir measurement is more consistent, as it is driven by system physics
9

BA Frequency Response Measure Calculation
BA FRM = (PINT_B – PINT_A + BA GEN LOSS) / ( FA – FB)
FA
FB
PINT_A PINT_B
FC
10
Frequency Response Analysis Tool
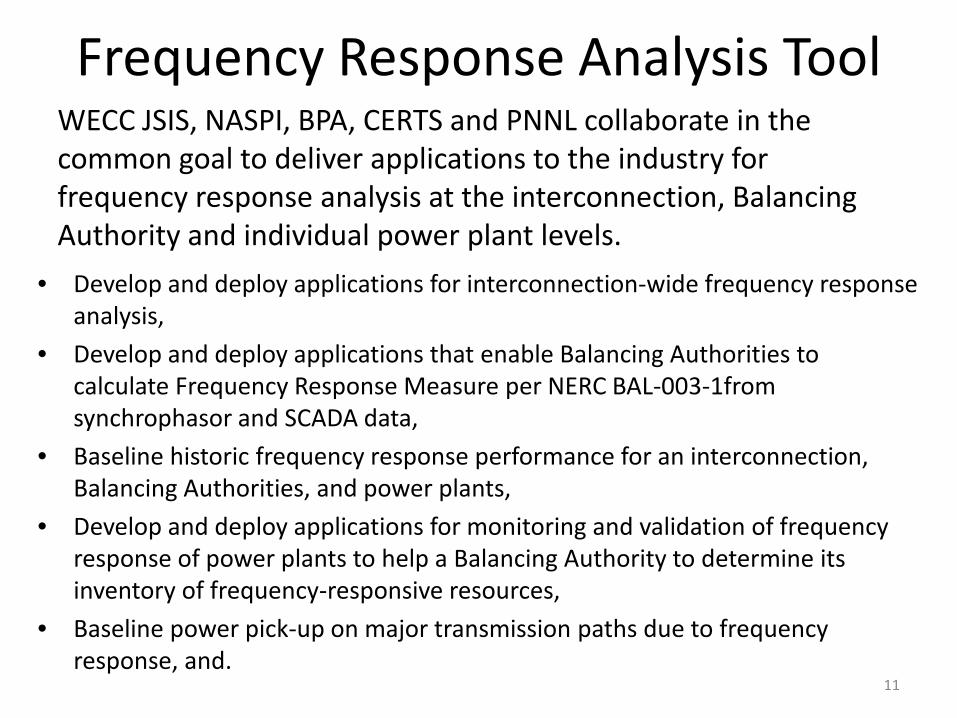
• Develop and deploy applications for interconnection-wide frequency response analysis,
• Develop and deploy applications that enable Balancing Authorities to calculate Frequency Response Measure per NERC BAL-003-1from synchrophasor and SCADA data,
• Baseline historic frequency response performance for an interconnection, Balancing Authorities, and power plants,
• Develop and deploy applications for monitoring and validation of frequency response of power plants to help a Balancing Authority to determine its inventory of frequency-responsive resources,
• Baseline power pick-up on major transmission paths due to frequency response, and.
11
WECC JSIS, NASPI, BPA, CERTS and PNNL collaborate in the common goal to deliver applications to the industry for frequency response analysis at the interconnection, Balancing Authority and individual power plant levels.
Frequency Response Analysis Tool
• Frequency response monitoring – Interconnection
• Balancing Authority –Power Plant
• Power pick-up on major transmission paths
12
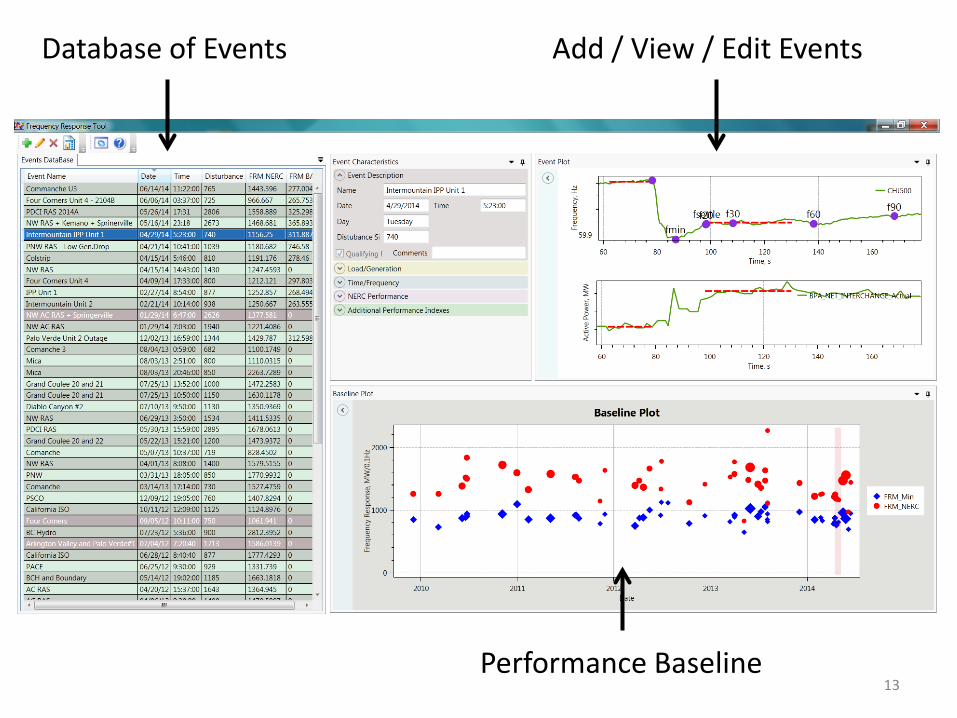
Database of Events Add / View / Edit Events
Performance Baseline 13

Western Interconnection Performance
14
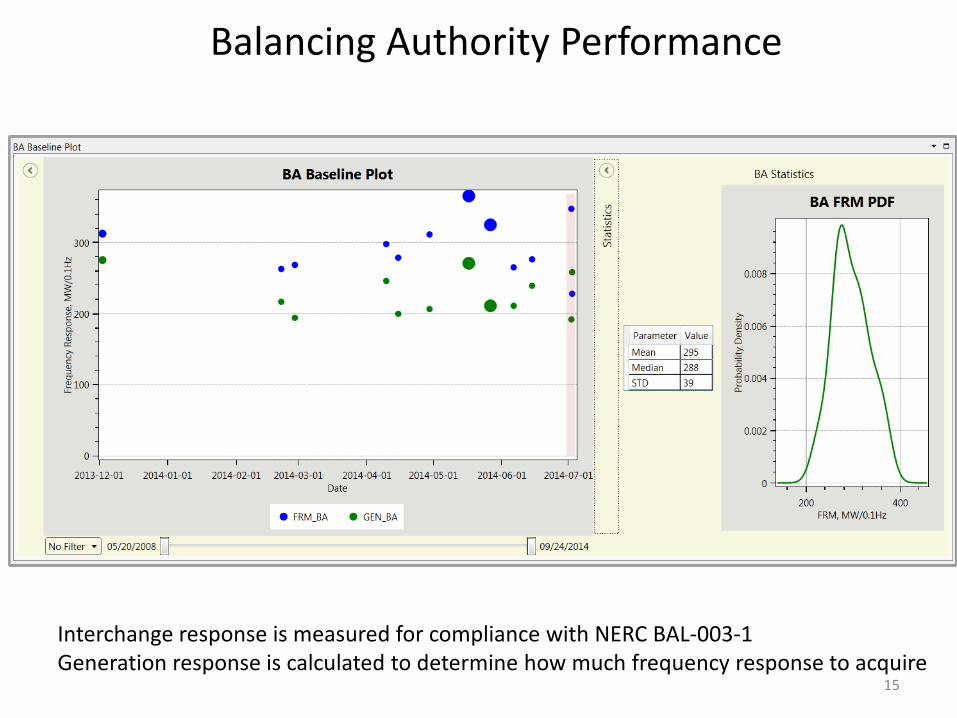
Balancing Authority Performance
Interchange response is measured for compliance with NERC BAL-003-1 Generation response is calculated to determine how much frequency response to acquire
15

Power Plant Performance
Coming Soon
16
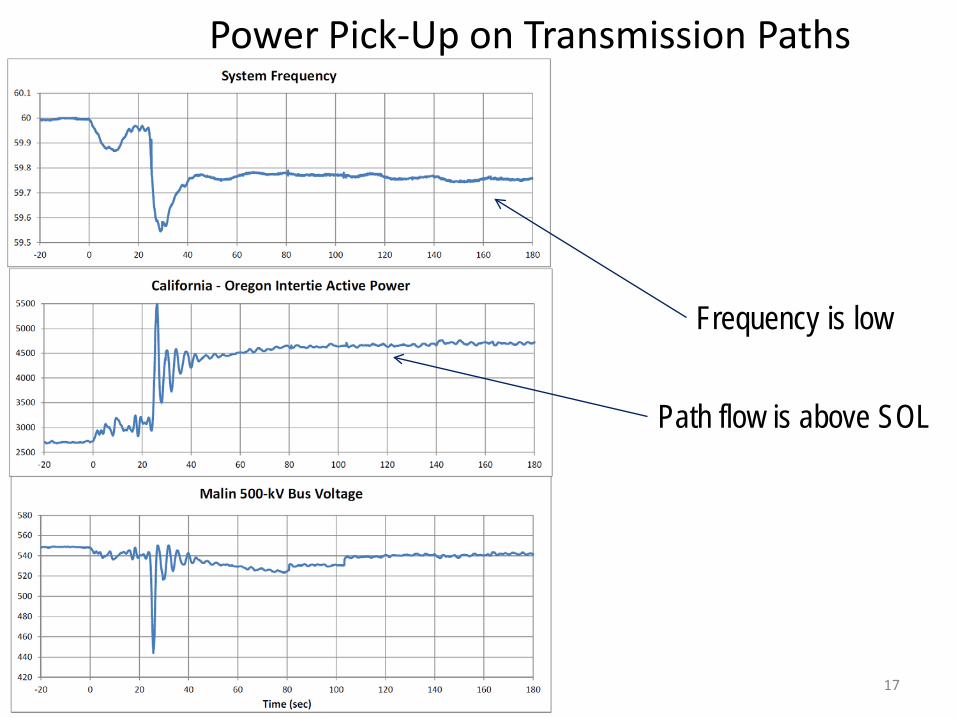
Frequency is low
Path flow is above SOL
Power Pick-Up on Transmission Paths
17
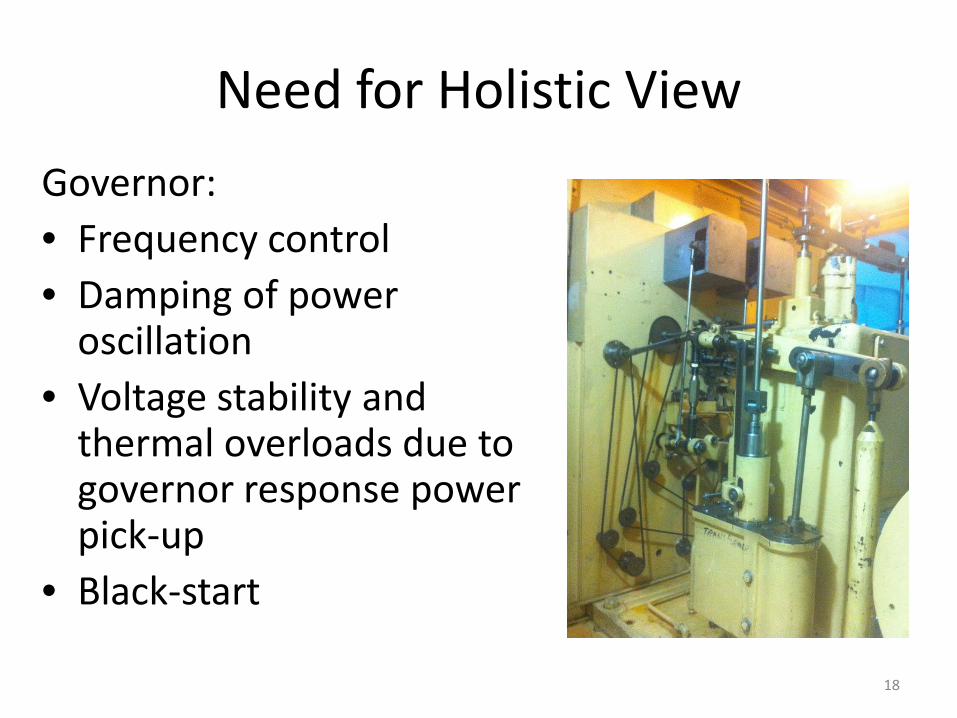
Need for Holistic View Governor: • Frequency control • Damping of power
oscillation • Voltage stability and
thermal overloads due to governor response power pick-up
• Black-start
18

Contact
October 23, 2014 19
– Tool web page: https://svn.pnl.gov/FRTool – [email protected] – [email protected]