Embed Size (px)
Citation preview

Franklin County Mobilizing for
Action through Planning and
Partnerships
(MAPP)
MAPP
Community Health Assessment
September 8, 2011

Franklin County Mobilizing for Action through Planning and Partnerships Page 2
Table of Contents
Franklin County MAPP Membership …………………………………...………………...……. Page 3
Strategic Plan for Community Health Improvement …………………………….…………...….Page 4
Vision and Values ………..……………...…………………………………………………...…..Page 5
Community Health Status Assessment ……..……… …………………………………..………Pages 5
Demographic Characteristics ……………………… ……………………...…….………Page 5
Socioeconomic Characteristics ………………. ………………………………...……….Page 5
Behavioral Risk Factors ………………………………………………………………….Page 6
Environmental Health Indicators ……...…………………………………………………Page 7
Health Resource Availability …………………………………………………………….Page 9
Communicable Disease …………………………………………………………………..Page 9
Social and Mental Health …. ………………………………………………………….…Page 10
Maternal and Child Health …………………………………………………………….…Page 11
Mortality ……………… ………………………………………………………….……...Page 12
Forces of Change Assessment ……………….. ………………………….……..……….……....Page 13
Community Themes and Strengths Assessment .……………….…………………………...…...Page 14
Local Public Health System Assessment …………………………………………………...……Page 15
References ……………………………………………………………………………..…………Page 16
Community Pictures ………………………………..…………………………………………….Page 19
Franklin County MAPP Contact Information ……………...…………………………………….Page 20

Franklin County MAPP Membership
Page 3 Health Improvement Plan
Access Soup Kitchen and Men’s Shelter
American Cancer Society
ASAP
Bluegrass Prevention
Canoe Kentucky
Chiro One Wellness Center
City of Frankfort Government
Coalition for a Smoke Free Frankfort/Franklin
County
Community Members
Community Trust Bank
Comp Care
Evelyn Clark Dentistry
Farmer’s Bank
Forever Communications
Frankfort Area Chamber of Commerce
Frankfort Emergency Management
Frankfort Fire and Emergency Medical
Services
Frankfort-Franklin County Ministerial
Association
Frankfort Independent Schools
Frankfort Parks, Recreation and Historic Sites
Frankfort Police Department
Frankfort Regional Medical Center
Frankfort Sewer
Frankfort YMCA
Franklin County Board of Health
Franklin County Council on Aging, Inc.
Franklin County Detention Center
Franklin County Diabetes Coalition, Inc.
Franklin County Drug Court
Franklin County Extension Office
Franklin County Fire Department
Franklin County Fiscal Court
Franklin County Government
Franklin County Health Department
Franklin County Home Health Agency
Franklin County Oral Health Coalition
Franklin County Public Schools
Franklin County Red Cross
Franklin County United Way
Franklin County Women’s Shelter
Golden Living Health
Greenheck
Health Works
Hospice of the Bluegrass
Internal Medicine Associates
Kentucky Cancer Program
Kentucky Department for Public Health
Kentucky State University
kidsGROWkentucky, Inc.
KY Fusion Center
Paul Sawyier Public Library
Representative Derrick Graham
Senator Julian Carroll
State Journal
Stewart Home School
The King’s Center
University of Kentucky College of Nursing
Walk/Bike Frankfort
All members participated in one or more Franklin
County MAPP assessments. Members are sin-
cerely thanked for their time, expertise, commit-
ment and dedication to the health of Franklin
County.
All public, private and voluntary organizations, agencies, groups and individuals that have inter-ests in population health improvement are invited to join Franklin County MAPP. Please contact
Judy Mattingly at [email protected] or
502-564-5559 for meeting information.

Franklin County Mobilizing for Action through Planning and Partnerships Page 4
Franklin County MAPP was formed in December 2008 and is supported by the Franklin County Health Department (FCHD). Coalition members followed a community health improvement planning model developed by the National Association of County and City Health Officials (2008) in cooperation with the Centers for Disease Control and Prevention , called Mobilizing for Action through Planning and Partnerships (MAPP). The coalition assessed Frankfort/Franklin County’s strengths and needs and for-
mulated a plan to address identified concerns. As shown in Figure 1 data collected during the four MAPP assessments, Community Themes & Strengths Assessment, Local Public Health System Assessment, Community Health Status Assessment and Forces of Change Assessment, informed the entire process. Franklin County MAPP is continu-ously organizing for success through partnership development and began by conducting several vision-ing sessions. Franklin County MAPP analyzed all assessment data, identified priority health issues and created a plan specifying program, policy, systems and environmental change strategies to improve the
health of Franklin County. This document presents the findings of the four MAPP assessments that were initially collected by four MAPP subcommittees between December 2008 and November 2009. Assessment data was updated between June and September 2011 for the revision of the Franklin County MAPP Community Health
Improvement work plan (2011).
Strategic Plan for Community Health Improvement
Figure 1. MAPP Community Strategic Planning Process

Page 5 Health Improvement Plan
Franklin County will be a community where all may thrive and enjoy wellness.
Values: healthy, safe, nurturing, respectful and welcoming.
Vision and Values
Community Health Status Assessment
Demographic Characteristics
The Franklin County commu-
nity covers 210.46 square miles
including Kentucky’s Capital in
the city of Frankfort. Franklin
County has a population of
49,285 that surges with a daily
influx of Commonwealth of
Kentucky employees. This
population represents a 3.4%
increase since 2000, which is
less than the state increase of
7.4% and the national increase
of 9.7%.
Franklin County is also home to
Kentucky State University
(KSU), a historically black col-
lege/university. The commu-
nity’s diversity (see Table 1)
includes African American,
American Indian and Alaska
Native, Asian and Hispanic or
Latino residents. Spanish is the
language spoken at home for
2.8% of the population, other
Indo-European languages are
spoken by 0.6%, Asian and Pa-
cific Islander languages are spo-
ken by 0.9% and other lan-
guages are spoken by 0.1%.
21.7% of residents are under the
age of 18 and 13.8% of resi-
dents are 65 years of age or
older (U.S. Census Bureau,
2010).
Demographics (2010) Franklin County Kentucky
Population 49,285 4,339,367
Persons under 18 years old (2009) 21.7% 23.5%
Persons 65 years and older (2009) 13.8% 13.2%
White persons 84.4% 87.8%
Black persons 10.4% 7.8%
American Indiana and Alaska Native persons 0.2% 0.2%
Persons reporting 2 or more races 2.2% 1.7%
Persons of Hispanic or Latino origin 2.8% 3.1%
Asian persons 1.4% 1.1%
Female (2009) 51.3% 50.9%
Male (2009) 48.7% 49.1%
Table 1 Franklin County Demographics
U.S. Census Bureau, 2010
Socioeconomic Characteristics
Although Franklin County’s
14% of residents living below
poverty is less than the state
percent of 18.4, it is barely be-
low the U.S. percent of 14.3.
More alarming is the 19.2% of
Franklin County youth and
23.6% of Kentucky youth living
below poverty compared to
18.6% in the U.S. The median
household income (2009)in
Franklin County is $45,619,
slightly higher than the state at
$40,061, but lower than the na-
tional median of $50,221. Also
linked to poverty, income and
health status are homeownership
rates (2009), which are only at
66.2% in Franklin County,
70.2% in Kentucky and 66.9%
in the nation (U.S. Census Bu-
reau, 2009).
Socioeconomic characteristics
have been shown to be impor-

Franklin County Mobilizing for Action through Planning and Partnerships Page 6
Community Health Status Assessment
for the U.S. (Kentucky Depart-
ment for Public Health [KDPH],
2008). 15.1% of Franklin
County residents have less than
a high school education com-
pared to 19.7% in Kentucky and
15.4% in the U.S. (U.S. Census
Bureau, 2009).
The County Health Rankings (2011) place Franklin County 13th in social and economic fac-tors out of Kentucky’s 120
counties.
tant indicators of health status.
According to the Institute of
Medicine “70% of health out-
comes are the result of living
and working conditions, eco-
nomic and social opportunities,
and the individual behaviors
that those structural factors en-
able” (Human Impact Partners,
2010).
Other social and economic fac-
tors affecting health status in-
clude, but are not limited to,
employment, insurance cover-
age and education. Unemploy-
ment rates have dramatically
increased in recent years. The
most current United States De-
partment of Labor (2011) data
show unemployment rates of
7.8% for Franklin County, 9.5%
for Kentucky and 9.1% for the
U.S. Additionally, the most re-
cent health insurance estimates
show an uninsured rate of
12.5% for Franklin County,
14.4% for Kentucky and 14.6%
Socioeconomic Characteristics
Behavioral Risk Factors
nation (CDC, 2009). County
level data is not reported (see
Table 3).
Linked to obesity is sedentary lifestyles. It was found that 29.6% of adults in the Bluegrass Area Develop District (includes Franklin County) did not par-ticipate in any physical activity in the past 30 days compared to 30.5% of Kentucky. Again these rates exceed the national
Table 2 shows Franklin
County adult behavioral
risk factor rates that sig-
nificantly impact health
outcomes. Closely related
to many of Franklin
County’s leading causes
of death is an adult obesity
rate of 29.5% compared to
a Kentucky rate of 30.3%
and a U.S. rate of 26.6%.
Obesity prevalence among Afri-
can Americans in Franklin
County is 44.5%, which is sig-
nificantly higher than the 29.4%
obesity rate among the white
population (KDPH, 2008).
Childhood Obesity Action Net-
work (2009) reported that in
2007 37.1% of Kentucky chil-
dren aged 10-17 were over-
weight or obese exceeding the
national rate of 31.6%. Locally
collected data (2008) from 416
4th and 5th grade Franklin
County students (includes
county, city and private schools)
revealed a rate of 41% (Franklin
County Health Department).
Youth Risk Behavior Surveil-
lance (YRBS) data was col-
lected for high school students
and showed that 33.2% were
overweight or obese in Ken-
tucky compared to 27.8% in the
BRFSS (Percentages) Bluegrass Area Development District
Kentucky U.S.
Obesity 29.5% 30.3% 26.6%
Sedentary 29.6% 30.5% 24.8%
Smoking 22.6% 25.2% 18.3%
Kentucky Department for Public Health (2008) Adult Behavioral Risk Factor Surveillance System
Table 2
Adult Behavioral Risk Factor Surveillance System (BRFSS) Indicators

Page 7 Health Improvement Plan
Community Health Status Assessment
Behavioral Risk Factors
Franklin County has received a ranking of 38 in health behav-iors. This category represents Franklin County’s lowest score on the 2011 County Health
Rankings.
rate of 24.8% (KDPH, 2008).
YRBS data indicate no physical activity for 17% of Kentucky and 23.1% of U.S. high school
students (CDC, 2009).
Another contributing factor to poor health is smoking and BRFSS data show a Bluegrass Area Development District rate of 22.6%, Kentucky rate of 25.2% and national adult smok-ing rate of 18.3%(KDPH, 2008). Although both the Kentucky and Franklin County rates are still higher than the national per-
centages, this data does reflect a decrease in recent years. Simi-larly, the Kentucky youth smok-ing rate is 26.1% and the U.S.
rate is 19.5% (YRBS, 2009).
Out of 120 Kentucky counties
BRFSS (Percentages) Kentucky U.S.
Obesity 33.2% 27.8%
Sedentary 17% 23.1%
Smoking 26.1% 19.5%
CDC (2009) Youth Risk Behavior Surveillance
Table 3
Youth Risk Behavior Surveillance (YRBS) Indicators
Environmental Health Indicators
Committee members conducted a windshield survey of the com-munity and held focus groups with members of Franklin County and Frankfort govern-ment from May to July 2011. The overall environmental score for nutrition was 63.49% and the environmental score for physical activity was 74.29%. The environmental factors con-sidered for nutrition included
The physical environment directly impacts health and quality of life. Clean air and water are examples of envi-ronmental factors that may influence health. However, access to healthy foods and recreational opportunities are also environmental fac-tors impacting health. For example, “physical activity levels are positively affected by structural environments, such as the availability of sidewalks, bike lanes, trails and parks (U.S. Department of Health and Hu-
man Services, 2011).
The County Health Rankings placed Franklin County 8 among Kentucky’s 120 counties in physical environment. This ranking included indicators for
clean air as well as access to healthy foods and access to rec-
reational facilities (see Table 4).
The Franklin County ACHIEVE committee utilized the CDC Community Health Assessment aNd Group Evaluation (CHANGE) tool to assess the environmental change strategies currently in place throughout the community (CDC, 2010).
BRFSS (Percentages) Franklin County
Kentucky National Benchmark
Air pollution– particulate matter days 1 2 0
Air pollution– ozone days 0 2 0
Access to recreational facilities 12 8 17
Access to healthy foods 100% 44% 92%
County Health Rankings (2011)
Table 4
Physical Environment

Franklin County Mobilizing for Action through Planning and Partnerships Page 8
Community Health Status Assessment
Environmental Health Indicators
healthy food and beverage op-tions and portion sizes at retail-ers, community gardens (see Figure 2), farmers markets (see Figure 3) and transportation to grocery stores. The environ-mental factors considered for physical activity included side-walks, land use plans, walking and biking infrastructure such as paths, trails (see Figure 4) and dedicated lanes (see Figure 5), parks and recreational facilities
(see Figure 6).
Figure 4. Kentucky River Trail at Riverview Park
Figure 2. Community Garden on Logan St. Figure 3. Farmers Market at Riverview Park
Figure 5. Bike Lane on Second St.
Figure 6. 2011 Longest Day of Play at Lakeview Park

Page 9 Health Improvement Plan
Community Health Status Assessment
Health Resource Availability
Medicare beneficiaries in Frank-lin County include 7,111 elderly and 2,412 disabled residents or 19.4% of the population. There are 6,750 Medicaid beneficiar-ies that total 13.8% of the Franklin County population (U.S. Department of Health and Human Services, 2009). This may account for the commu-nity’s feeling that they cannot find a medical providers that accept Medicare and/or Medi-caid (see Community Themes and Strengths Assessment). KDPH (2004) reported a Medi-caid eligible rate of 14.3% for Franklin County and 20.6% for
the state.
Access to health care, especially evidenced-based clinical and community preventive services reduces death, disability (National Prevention Council, 2011) and health inequities and improves quality of life (U.S. Department of Health and Hu-man Services, 2011), morbidity
and mortality (KDPH, 2005).
Frankfort Regional Medical Center (FRMC) is the only hos-pital in Franklin County. It is a 173 bed, acute care, public, for-profit, hospital. On a monthly basis FRMC reports 375 admis-sions, 2,835 emergency depart-ment visits, 715 surgeries and 4,085 outpatient visits (Franklin County ACHIEVE, 2011). There are also 8 home health agencies with a Certificate of
Need in Franklin County, 4 are private pay/privately owned agencies, and Hospice. The Community Health Status Indi-cators project (2009) report that Franklin County had a rate of 55.3 primary care physicians and a rate of 63.5 dentists per 100,000 population. It is also reported that Franklin County is not a health professional short-age area (U.S. Department of Health and Human Services,
2009).
The KDPH (2005) reported that the state has 326 licensed nurs-ing facilities with 26, 950 beds, 128 licensed home health agen-cies, 67 licensed adult day care facilities and 5,557 other li-censed residential care for
adults.
crude AIDS rate of 53.1 com-pared to Kentucky’s total of 2,669 living AIDS cases or a crude AIDS rate of 61.87 (KDPH, 2009). In addition, since this data was collected 8 new cases of HIV have been reported in Franklin County
(FCHD, 2010).
There is an inequitable burden of these diseases with 46% of gonorrhea, 38% of Chlamydia and 57% of syphilis in our Afri-
can American population.
Overwhelmingly the burden of STDs in Franklin County is also
As shown in Table 5 Franklin County far exceeds Kentucky’s rate of sexually transmitted dis-eases (STDs). The Kentucky rates for both gonorrhea and Chlamydia are also far from the goals set by Healthy People
2010.
Out of Kentucky’s 120 counties Franklin County has the second highest rate of STDs. The STD of highest prevalence is Chla-mydia; however the incidence rates of gonorrhea, syphilis and HIV are also alarmingly high compared to state rates. At the
end of fiscal year 2010 Franklin County’s crude rate (per 100,000 population) of Chlamy-dia was 722.92 compared to Kentucky’s state rate of 365.40. Similarly, Franklin County’s crude rate of gonorrhea was 161.33 compared to Kentucky’s state rate of 97.89. Franklin County’s incidence of syphilis was seven cases, making the calculation of a crude rate inac-curate; however Kentucky’s state incidence of syphilis was 281 cases. Also of great con-cern is Franklin County’s total of 26 living AIDS cases or a
Communicable Disease

Franklin County Mobilizing for Action through Planning and Partnerships Page 10
Community Health Status Assessment
(KDPH, 2008).
Franklin County was ranked 13 out of 120 Kentucky counties in health factors, which included health behaviors such as sexu-ally transmitted infections, clini-cal care, social and economic factors and physical environ-ment (County Health Rankings,
2011).
found in the 15-24 year old age range. With the exception of a slight de-crease in gonorrhea, the rate of STDs in 15-24 year olds has been rising over at least the last five years. The 15-24 year old population in Frank-lin County accounts for 70.4% of our Chlamydia cases with 26% found in 15-19 year olds and 44.4% in 20-24 year olds. Like-wise, 64.5% of Franklin County’s gonorrhea cases were also in the 15-24 year old popu-lation with 17.7% in 15-19 year olds and 46.8% in 20-24 year olds. For the first time in at least five years syphilis was also found in the 15-24 year old age range in Franklin County ac-counting for 42.9% of the cases,
the one case found in a 15-19 year old accounts for 14.3% while the two cases in 20-24 year olds accounts for 28.6%.
(KDPH, 2009).
Also of importance was 17cases of pertussis reported to FCHD in 2008. During this same year 183 cases were reported in Ken-tucky and rises were also seen in other states around the nation
Communicable Disease
Communicable Diseases (Crude Rate/100,000 Pop.; 2009-2010)
Franklin County
Kentucky Healthy KY 2010 Goal
Gonorrhea 161.33 97.89 55.0
Chlamydia 722.92 365.40 140.0
Syphilis 7 cases * 6.51 0.27
Tuberculosis (2008) 2.1 2.4 1.0
AIDS 1 case (HIV)* 3.5 5.4
Kentucky Department for Public Health, 2009-2010 Preliminary Data
*Crude rates are not calculated with case numbers < 10
Table 5
Communicable Disease Rates for Franklin County, Kentucky and Healthy KY 2010 Goal
Social and Mental Health
Social and mental factors can directly or indirectly influence overall health status and indi-vidual and community quality of life. Mental health condi-tions and overall psychological well-being and safety may be influenced by substance abuse and violence within the home
and within the community.
The 2007 adult BRFSS reported that 11.1% in the Bluegrass Area Development District, 12.3% in Kentucky and 9.7% in the U.S. had poor mental health.
The survey item specifically indicated 14 or more days of poor mental health, which in-cludes feeling stressed, de-pressed, or having problems with emotions. Women, those with less than a high school education and those earning less than $15,000 per year were more likely to report having poor mental health (KDPH, 2007). Among high school stu-dents in Kentucky 26.7% re-ported feeling sad or hopeless compared to 26.1% in the U.S.
(CDC, 2009). Comp Care, a local facility providing mental health and substance abuse ser-vices, reported a record high number of more than 392 Frank-lin County psychiatric admis-
sions in 2009.
A selected cause of death for Franklin County that stands out when compared to Kentucky is a suicide rate of 14.29 compared to the Kentucky rate of 13.37 (KDPH, 2009 preliminary data). The YRBS reported that 12.5% of Kentucky high school seri-
Page 11 Health Improvement Plan
Community Health Status Assessment
ously considered attempting sui-cide compared to 10.9% in the
U.S. (CDC, 2009).
The most recent data available from KDPH (2004) shows 140 confirmed cases of physical and sexual child abuse and neglect among children in Franklin County compared to 16,024 in Kentucky. There was also 1 homicide reported in Franklin County compared to 216 in
Kentucky. Franklin County re-ported 22 cases of domestic vio-lence compared to 5,104 in Kentucky. Among high school students in Kentucky 15.5% re-ported experiencing dating vio-lence compared to 9.8% in the
U.S. (CDC, 2009).
KDPH (2004) reported 1 fatal injury crash and 29 non-fatal crashes involving drinking driv-ers compared to 226 and 2,743
in Kentucky.
Social and Mental Health
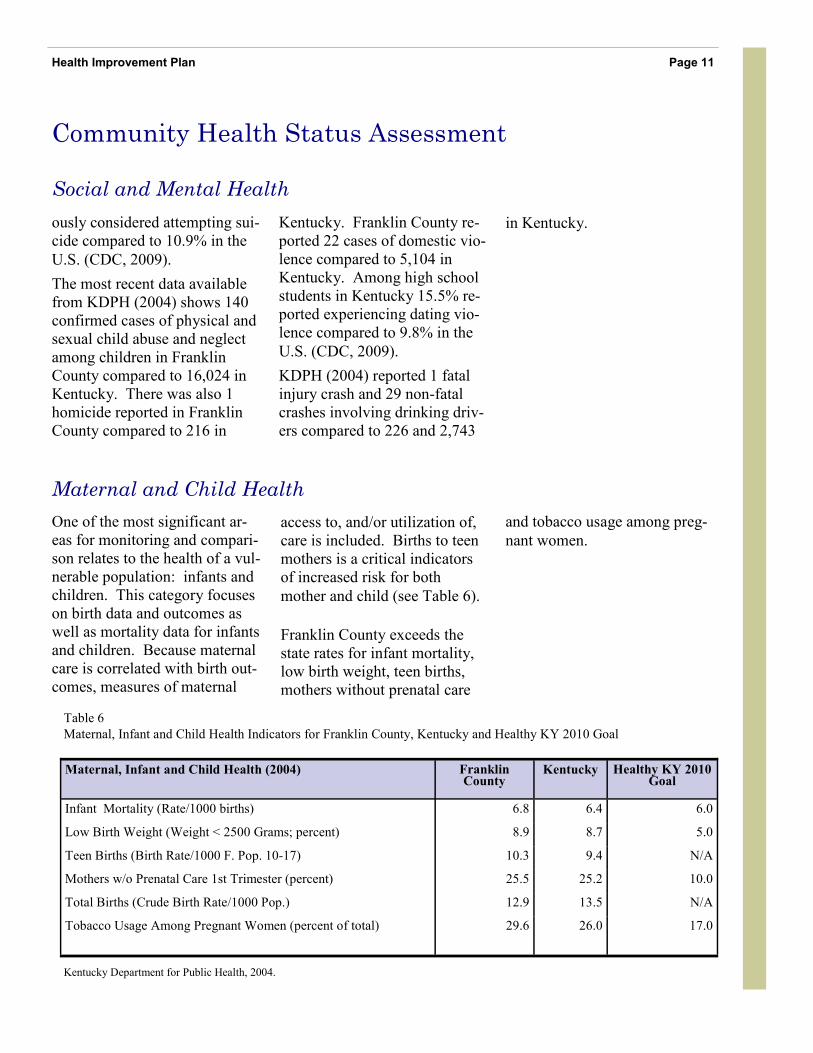
One of the most significant ar-eas for monitoring and compari-son relates to the health of a vul-nerable population: infants and children. This category focuses on birth data and outcomes as well as mortality data for infants and children. Because maternal care is correlated with birth out-comes, measures of maternal
access to, and/or utilization of, care is included. Births to teen mothers is a critical indicators of increased risk for both
mother and child (see Table 6).
Franklin County exceeds the state rates for infant mortality, low birth weight, teen births, mothers without prenatal care
and tobacco usage among preg-
nant women.
Maternal and Child Health
Maternal, Infant and Child Health (2004) Franklin County
Kentucky Healthy KY 2010 Goal
Infant Mortality (Rate/1000 births) 6.8 6.4 6.0
Low Birth Weight (Weight < 2500 Grams; percent) 8.9 8.7 5.0
Teen Births (Birth Rate/1000 F. Pop. 10-17) 10.3 9.4 N/A
Mothers w/o Prenatal Care 1st Trimester (percent) 25.5 25.2 10.0
Total Births (Crude Birth Rate/1000 Pop.) 12.9 13.5 N/A
Tobacco Usage Among Pregnant Women (percent of total) 29.6 26.0 17.0
Kentucky Department for Public Health, 2004.
Table 6
Maternal, Infant and Child Health Indicators for Franklin County, Kentucky and Healthy KY 2010 Goal

Franklin County Mobilizing for Action through Planning and Partnerships Page 12
Community Health Status Assessment
The leading causes of death for Franklin County (see Table 7) are malignant neoplasms (all cancers), diseases of heart, chronic lower respiratory diseases, cere-brovascular dis-eases, accidents (unintentional in-juries), Alz-heimer’s disease, diabetes mellitus, nephritis, nephrotic syn-drome and nephrosis, essential (primary) hypertension and hy-pertensive renal disease and in-fluenza and pneumonia. Nine of the top 10 leading causes of
death for Franklin County over-lap with the leading causes of death for Kentucky (see Table
8).
When comparing chronic dis-ease mortality rates (see Table 9) Franklin County exceeds the Kentucky rate and Healthy KY 2010 Goal for malignant neo-
plasms.
In health out-comes, which included mortal-ity and morbidity, Franklin County was ranked 9 out of Kentucky’s 120 counties (County Health
Rankings, 2011)
Mortality
Causes of Death (Case Numbers; Preliminary Data) 2006 2007 2008 2009
Malignant Neoplasms 97 117 109 125
Diseases of Heart 111 98 111 83
Chronic Lower Respiratory Diseases 30 23 35 32
Cerebrovascular Diseases 27 30 24 17
Accidents (Unintentional Injuries) 26 17 17 20
Alzheimer’s Disease 16 18 14 17
Diabetes Mellitus 11 8 16 10
Nephritis, Nephrotic Syndrome and Nephrosis 13 7 10 9
Essential (Primary) Hypertension and Hypertensive Renal Disease 8 4 14 6
Influenza and Pneumonia 5 8 9 10
Table 7
Top Ten Leading Causes of Death in Franklin County
Kentucky Department for Public Health, 2009 Preliminary Data
Causes of Death (Case Numbers; Preliminary Data) 2006 2007 2008 2009
Diseases of Heart 10,277 9,795 9,748 9,410
Malignant Neoplasms 9,337 9,580 9,362 9,421
Chronic Lower Respiratory Diseases 2,389 2,608 2,846 2,797
Accidents (Unintentional Injuries) 2,357 2,224 2,198 2,215
Cerebrovascular Diseases 2,177 2,107 1,990 1,948
Alzheimer’s Disease 1,146 1,189 1,344 1,319
Diabetes Mellitus 1,135 1,079 1,181 1,328
Nephritis, Nephrotic Syndrome and Nephrosis 921 976 952 924
Influenza and Pneumonia 923 881 904 952
Septicemia 625 662 654 695
Table 8
Top Ten Leading Causes of Death in Kentucky
Kentucky Department for Public Health, 2009 Preliminary Data

Page 13 Health Improvement Plan
Forces of Change Assessment
Franklin County conducted the
Forces of Change Assessment
on May 21, 2009. During the
Forces of Change Assessment
over 35 Franklin County com-
munity members and leaders
used brainstorming techniques
to identify trends, factors and
events that impact the health of
our community. The findings
were as follows:
Environmental Forces of
Change:
• H1N1
• Carbon footprint
• Water quality
• Riverfront development
• Community design
• Food supply
• Capital city
• World Equestrian Games
Economic Forces of Change:
• Budget
• Utility costs
• Medication costs
• Franklin County population
• Gas prices
• Uninsured/Underinsured
Social Forces of Change:
• Unemployment
• Homelessness
• Prescription drug abuse
• Hispanic population
• Tobacco prevention educa-
tion
• Pregnancy
• Poor dental hygiene
• Childhood mental health
services/mental retardation
• Sexually transmitted dis-
eases
• Aging population
• High school drop out rate
• Personal responsibility
• Obesity
Legal/Political Forces of
Change:
• Police and prosecution ser-
vices
• National health insurance
Ethical Forces of Change:
• Government services
Chronic Disease (Crude Mortality Rate/100,000 Pop.; 2009 Pre-liminary Data)
Franklin County
Kentucky Healthy KY 2010 Goal
Heart Disease 169.5 218.1 200.0
Malignant Neoplasms 255.3 218.4 220.7
Diabetes 20.4 30.8 28.0
Stroke 34.7 45.2 35.0
Table 9
Chronic Disease Mortality Rates for Franklin County, Kentucky and Healthy KY 2010 Goal
Kentucky Department for Public Health, 2009 Preliminary Data. Adjusted to the US 2009 population.
Community Health Status Assessment
Mortality

Franklin County Mobilizing for Action through Planning and Partnerships Page 14
Community Themes and Strengths Assessment
facilities
• Need more handicap
friendly facilities
• Need elderly friendly trans-
portation
• Need to publicize social ser-
vices & networks of support
• Need more specialized
healthcare services
• Chronic diseases
• Poor diets
• Cancer
Three hundred and eighty-eight
Franklin County residents and
workers completed a Quality of
Life Survey. The survey was
issued in both electronic and
paper format from August to
November 2009. The purpose
was to gather perspectives from
community members and to
identify problems that could be
addressed through community
action.
Over half of respondents, 64.1%,
were satisfied with the quality
of life in Franklin County, rank-
ing it either a 4 or 5 on a 5 point
scale. Only 4.4% of respon-
dents rated their health status as
either a 1 or 2. Including those
respondents who rated their
health status as 3 or below
causes the proportion to jump to
20.9%. The BRFSS used a
similar 5 point scale and re-
ported findings of fair or poor
general health for 15.4% of the
Bluegrass Area Development
District, 20% of Kentucky and
15% of the U.S. (KDPH, 2008).
Franklin County Quality of Life
survey responses indicate that
Franklin County community
members perceive chronic dis-
eases (23.1%), poor diet
(17.9%) and cancer (16.5%) as
the three most important health
issues facing Franklin County.
Open-ended responses were
categorized as either strengths
or weaknesses and key findings
included:
Strengths:
• Parks and museum
• Nice neighborhoods
• Growing hospital
• Wonderful place to raise
kids
• Abundance of activities for
younger children
• Safe environment
• Good programs at Senior
Citizen Center
• Ready fire and emergency
personnel
• Readily available networks of support (Churches,
United Way, Red Cross)
Weaknesses:
• More entertainment needed
• Need more events
• Need more no/low cost wellness activities (fitness
center, water park)
• Need more options for un-
and underinsured
• Unemployment
• Homelessness
• Need more after hours
healthcare
• Great need for dental clinic
• Need another pediatric of-
fice
• Growing crime
• Drug abuse
• Need after school programs
• Not enough activities for
tweens and teens
• Need more daycare options
• Need more assisted living

Page 15 Health Improvement Plan
Local Public Health System Assessment
moderate. Essential public
health services number 7 and 4
refer to the capacity of the pub-
lic health system to link people
to needed personal health ser-
vices and mobilize community
partnerships to identify and
solve health problems. These
scores supported the need for
Franklin County MAPP’s for-
mation, which should improve
the delivery of these essential
public health services through
improved coordination of health
services and partnerships.
This Franklin County public
health system was assessed us-
ing the National Public Health
Performance Standards Program
(NPHPSP) developed by the
CDC (2007) with the following
program partner organizations:
American Public Health Asso-
ciation, Association of State and
Territorial Health Officials, Na-
tional Association of County
and City Health Officials, Na-
tional Association of Local
Boards of Health, National Net-
work of Public Health Institutes
and Public Health Foundation.
The purpose of this assessment
was to identify our
public health sys-
tem’s strengths and
weaknesses and
then decide upon
opportunities for
continuous im-
provement.
The local health
department is only
one of many part-
ners in Franklin
County’s public
health system. The
public health sys-
tem includes the
local public health
department, other
governmental
agencies, health-
care providers, hu-
man service or-
ganizations,
schools and uni-
versities, faith institutions,
youth development organiza-
tions, economic and philan-
thropic organizations, environ-
mental agencies and many oth-
ers. Over 72 of Franklin
County’s public health system
partners completed the NPHPSP
instrument in a one day session
held on September 9, 2008.
The findings rated the delivery
of the 10 essential public health
services (see Figure 2). The
only ratings scoring below sig-
nificant were essential public
health services numbers 7 and 4,
which both received scores of
Figure 2. Franklin County NPHPSP rankings of the 10 Essential Public Health Services

Franklin County Mobilizing for Action through Planning and Partnerships Page 16
References
Centers for Disease Control and Prevention (2010). Community Health Assessment aNd Group
Evaluation (CHANGE). Retrieved May 12, 2010 from http://www.cdc.gov/
healthycommunitiesprogram/ tools/change.htm
Centers for Disease Control and Prevention (2007). National Public Health Performance Standards
Program. Retrieved June 16, 2008 from http://www.cdc.gov/nphpsp/PDF/UserGuide.pdf
Centers for Disease Control and Prevention (2009). Youth Risk Behavior Survey. Retrieved June 30,
2011 from http://www.cdc.gov/healthyyouth/yrbs/factsheets/index.htm#compare
Childhood Obesity Action Network (2009). State Obesity Profiles. Retrieved June 2, 2010 from http://
childhealthdata.org/browse/snapshots/obesity-2007?geo=56
Comp Care (2009). [Psychiatric Admissions]. Unpublished raw data.
County Health Rankings (2011). 2011 Franklin, Kentucky. Retrieved June 29, 2011 from http://
www.countyhealthrankings.org/kentucky/franklin
Franklin County ACHIEVE (2011). [CHANGE Tool Data]. Unpublished raw data.
Franklin County Health Department (2008). [BMI Data for 4th or 5th Grade]. Unpublished raw data.
Franklin County Health Department (2010). [HIV Reports]. Unpublished raw data.
Franklin County MAPP (2011). Community Health Improvement Plan. Retrieved Sept. 13, 2011 from
http://www.fchd.org
Human Impact Partners (2010). Health Impact Assessments. Retrieved July 11, 2011 from
http://www.humanimpact.org/
Kentucky Department for Public Health (2009). [Franklin County and Kentucky Leading and Selected
Causes of Death, 2006-2009; STD Reports]. Unpublished raw data.

References
Page 17 Health Improvement Plan
Kentucky Department for Public Health (2004). Health and Social Indicators. Retrieved October 12,
2008 from http://chfs.ky.gov/NR/rdonlyres/A47FE032-D152-4E8B-81C5-
63D81A24E16C/0/2004_CountyHealthProfiles_Cty_Master.pdf
Kentucky Department for Public Health (2005). Healthy Kentuckians 2010. Retrieved December 10,
2008 from http://chfs.ky.gov/dph/hk2010.htm
Kentucky Department for Public Health (2008). Reportable Disease Annual Summary. Retrieved Jan-
uary 19, 2010 from http://chfs.ky.gov/dph/epi/reportablediseases.htm
Kentucky Department for Public Health and Centers for Disease Control and Prevention (2007). Ken-
tucky Behavioral Risk Factor Surveillance System. Retrieved May 24, 2010 from http://
chfs.ky.gov/NR/rdonlyres/03A25234-15ED-43B0-A26F-
85F0457B0B52/0/2007BRFSSAnnualDataReport.pdf
Kentucky Department for Public Health and Centers for Disease Control and Prevention (2008). Ken-
tucky Behavioral Risk Factor Surveillance System. Retrieved May 24, 2010 from http://
chfs.ky.gov/NR/rdonlyres/73E49DF2-81D3-4E05-BDC3-DA348F4E7F1E/0/
Kentucky2008BRFSSAnnualReport.pdf
National Association of County and City Health Officials (2008). MAPP Handbook. Retrieved. Oc-
tober 12, 2008, from http://www.naccho.org/topics/infrastructure/mapp/framework/mapppubs.
Cfm
National Prevention Council (2011). National Prevention Strategy. Retrieved August 14, 2011 from
http://www.healthcare.gov/center/councils/nphpphc/strategy/report.pdf
U.S. Census Bureau (2010). Franklin County, Kentucky. Retrieved May 24, 2010 from
http://quickfacts.census.gov/qfd/states/21/21073.html

Franklin County Mobilizing for Action through Planning and Partnerships Page 18
References
U.S. Census Bureau (2009). Income and Poverty. Retrieved May 24, 2010 from
http://www.census.gov/cgibin/saipe/saipe.cgi?year=2009&type=county&table=county&submit
=States%20%26%20Counties&display_data=Display%20Data&state=21&areas=21073
U.S. Department of Health and Human Services (2009). Community Health Status Indicators Project.
Retrieved May 12,2010 from http://www.communityhealth.hhs.gov/homepage.aspx?j=1
U.S. Department of Health and Human Services (2011). Healthy People 2020. Retrieved June 30, 2011
from http://www.healthypeople.gov/2020/topicsobjectives2020/default.aspx
United States Department of Labor (2011). Local Area Unemployment Statistics Maps. Retrieved
September 6, 2011 from http://data.bls.gov/map/MapToolServlet

Community Pictures
Page 19 Health Improvement Plan
Cove Springs Hummingbird Workshop
Access Soup Kitchen and Men’s Shelter
Elkhorn Elementary School Garden

Franklin County Mobilizing for Action through Planning and Partnerships Page 20
Franklin County MAPP
Contact Information:
Judy A. Mattingly
Franklin County Health Department
851 East-West Connector
Frankfort, KY 40601
Phone: 502-564-5559
Fax: 502-564-5672
E-mail: [email protected]
www.fchd.org