Embed Size (px)
Citation preview

103:3167-3183, 2010. First published Mar 31, 2010; doi:10.1152/jn.00932.2009 J NeurophysiolFrancesco Savelli and James J. Knierim
You might find this additional information useful...
for this article can be found at: Supplemental material http://jn.physiology.org/cgi/content/full/jn.00932.2009/DC1
89 articles, 29 of which you can access free at: This article cites http://jn.physiology.org/cgi/content/full/103/6/3167#BIBL
including high-resolution figures, can be found at: Updated information and services http://jn.physiology.org/cgi/content/full/103/6/3167
can be found at: Journal of Neurophysiologyabout Additional material and information http://www.the-aps.org/publications/jn
This information is current as of September 17, 2010 .
http://www.the-aps.org/.American Physiological Society. ISSN: 0022-3077, ESSN: 1522-1598. Visit our website at (monthly) by the American Physiological Society, 9650 Rockville Pike, Bethesda MD 20814-3991. Copyright © 2010 by the
publishes original articles on the function of the nervous system. It is published 12 times a yearJournal of Neurophysiology
on Septem
ber 17, 2010 jn.physiology.org
Dow
nloaded from

Hebbian Analysis of the Transformation of Medial Entorhinal Grid-CellInputs to Hippocampal Place Fields
Francesco Savelli1,3 and James J. Knierim1,2,3
1Zanvyl Krieger Mind/Brain Institute, 2Solomon H. Snyder Department of Neuroscience, Johns Hopkins University, Baltimore, Maryland;and 3Department of Neurobiology and Anatomy, University of Texas Medical School, Houston, Texas
Submitted 16 October 2009; accepted in final form 25 March 2010
Savelli F, Knierim JJ. Hebbian analysis of the transformation ofmedial entorhinal grid-cell inputs to hippocampal place fields. JNeurophysiol 103: 3167–3183, 2010. First published March 31, 2010;doi:10.1152/jn.00932.2009. The discovery of grid cells in the medialentorhinal cortex (MEC) permits the characterization of hippocampalcomputation in much greater detail than previously possible. Thepresent study addresses how an integrate-and-fire unit driven bygrid-cell spike trains may transform the multipeaked, spatial firingpattern of grid cells into the single-peaked activity that is typical ofhippocampal place cells. Previous studies have shown that in theabsence of network interactions, this transformation can succeed onlyif the place cell receives inputs from grids with overlapping verticesat the location of the place cell’s firing field. In our simulations, theselection of these inputs was accomplished by fast Hebbian plasticityalone. The resulting nonlinear process was acutely sensitive to smallinput variations. Simulations differing only in the exact spike timingof grid cells produced different field locations for the same place cells.Place fields became concentrated in areas that correlated with theinitial trajectory of the animal; the introduction of feedback inhibitorycells reduced this bias. These results suggest distinct roles for plas-ticity of the perforant path synapses and for competition via feedbackinhibition in the formation of place fields in a novel environment.Furthermore, they imply that variability in MEC spiking patterns or inthe rat’s trajectory is sufficient for generating a distinct populationcode in a novel environment and suggest that recalling this code in afamiliar environment involves additional inputs and/or a differentmode of operation of the network.
I N T R O D U C T I O N
An understanding of how information is processed by thecircuits of the hippocampal formation can provide a mechanis-tic explanation for the role of this area in learning and memory(Eichenbaum et al. 2007; O’Keefe and Nadel 1978; Squire etal. 2004). Hippocampal principal neurons have spatially selec-tive firing fields (“place fields”) confined to a restricted regionof a typical recording area (O’Keefe and Dostrovsky 1971)although they can display multiple fields in larger environ-ments (Fenton et al. 2008). In contrast, one of the major inputsto the hippocampus, the medial entorhinal cortex (MEC),contains spatially specific firing patterns that are periodic(Hafting et al. 2005). Each MEC “grid cell” fires in multiplelocations arranged as vertices of an equilateral triangular (orhexagonal) grid spanning the recording area. Hippocampalplace cells are thought to build their place fields mainly byconverting the many-location responses of grid cells into firingthat is usually restricted to a single location (McNaughton et al.
2006; O’Keefe and Burgess 2005; but see Kropff and Treves2008 for an alternative view). Understanding the rules thatgovern this transformation would be a major step forward inunderstanding hippocampal computation and function.
It has been proposed that place fields can be generated fromgrid cell inputs by a simple summation and threshold opera-tion. That is, if a place cell receives input from an arbitrary setof grid cells, the activation of the place cell can be preventedeverywhere except in the single region where the input to thecell is maximal (McNaughton et al. 2006; O’Keefe and Bur-gess 2005). This cutoff mechanism could be implemented bythe postsynaptic spiking threshold. However, if the geometricalignment of the input grids is unconstrained, distinct subsetsof coactive inputs will almost invariably generate similarlyhigh levels of synaptic excitation in multiple regions coveringthe majority of the environment (Solstad et al. 2006). A simplethreshold mechanism would not be able to single out one ofthese regions. The only circumstance in which this mechanismwould work in a purely feedforward manner is if there was asingle location where most of the afferent grid cells onto aplace cell shared a common vertex, which would then summateto cause the place cell to fire at that particular location and failto reach threshold at other locations (Solstad et al. 2006).
A subset of grids with overlapping vertices at a singlelocation could be optimally selected from randomly alignedgrid inputs by choosing a suitable synaptic weight vector, e.g.,via Fourier analysis (Solstad et al. 2006), a fitting algorithm(Blair et al. 2007), or independent component analysis (Fran-zius et al. 2007). It is not known, however, how this task canbe autonomously accomplished at a behaviorally relevant timescale with physiological mechanisms. In the present study, weinvestigated a Hebbian learning rule within a minimal, spikingnetwork model of a layer of grid-cell inputs with modifiableconnections onto an output layer. The model is not intended tosimulate the output of a particular subregion of the hippocam-pus (e.g., dentate gyrus or CA1), any of which receive far morecomplex inputs than the reduced set of pure grid-cell inputsstudied here. The model can be thought of as an explicitinvestigation of MEC grid inputs onto CA1 cells in the absenceof the CA3 Schaffer collateral system (Brun et al. 2002) orperhaps onto individual dendrites of a DG granule cell (Leu-tgeb et al. 2007; Ujfalussy et al. 2009). However, we wereprimarily concerned with the problem of how a simple, feed-forward network could accomplish the grid-to-place trans-formation problem in a general form, to generate insightsthat might be applicable at some level to all hippocampalsubfields.
Address for reprint requests and other correspondence: F. Savelli, ZanvylKrieger Mind/Brain Institute, Johns Hopkins University, 338 Krieger Hall,3400 N. Charles St., Baltimore, MD 21218 (E-mail:[email protected]).
J Neurophysiol 103: 3167–3183, 2010.First published March 31, 2010; doi:10.1152/jn.00932.2009.
31670022-3077/10 Copyright © 2010 The American Physiological Societywww.jn.org
on Septem
ber 17, 2010 jn.physiology.org
Dow
nloaded from

M E T H O D S
Computational model and simulations
Both place cells and their grid cell inputs were simulated as spikingunits. Place cells of the hippocampus were modeled as integrate-and-fire neurons. Their inputs were spike trains derived from a phenom-enological characterization of the activity of MEC grid cells ofvarying phases, orientations, and scales, along the trajectory followedby a real rat recorded in our laboratory during a 15-min segment of aforaging session in a walled square box (60 � 60 cm). This designmade the simulated course of activity of place cells and their inputstemporally and behaviorally relevant to typical experimental condi-tions.
A triangular grid template of each grid cell was defined by theposition of one of its vertices (phase), the orientation of the vector
linking this vertex with one of its neighbors (orientation), and theintervertex distance (scale) (Hafting et al. 2005). The firing rate in theexcitation map of this grid decreased exponentially with the square ofthe distance from the nearest vertex in proportion to the scale of thegrid. In particular, the normalized firing rate (ranging from 0 to 1) atany position was computed as exp[�d2/(k � s2)], where s is the scaleof the grid, d is the distance of the position from the closest vertex ofthe underlying grid template, and k is a factor (held constant at 0.018throughout the paper) chosen to make the simulated grids appearsimilar to published data (Hafting et al. 2005). The normalized firingrate was used to modulate the instantaneous rate of an inhomogeneousPoisson spike train according to the rat’s trajectory. We implementedthe generation of the spike train via dynamic thinning (Dayan andAbbott 2001). Briefly, at each iteration of the algorithm, the next spikeinterval was sampled from the exponential distribution of eventintervals of a Poisson process of maximal rate (20 Hz, correspondingto the peaks of the grid); intervals shorter than 3 ms were set to 3 msto create a refractory period. As the simulation proceeded, wheneverthe interval expired, the spike was accepted with a probability givenby the normalized firing rate of the grid cell calculated for the currentposition. Positions were sampled at 30 Hz from the trajectory fol-lowed by the rat during an unconstrained foraging session lasting 37min. Figure 1A illustrates the rat’s trajectory (gray) and the spikes (reddots) for three simulated grid cells of different scales.
Two random number generators were used, both of the “MersenneTwister” type (Gnu Scientific Library’s implementation). The firstassigned the geometric properties of phase, orientation, and scale tothe grid inputs and set up the synaptic connectivity between theseinputs and the postsynaptic cells (explained in the following text). Thesecond was dedicated to the generation of the grid-cell spike trains.The separation of these two sources of randomness allowed us to runsimulations that were identical except for the exact spike timing of theinput trains by changing only the seed of the second random numbergenerator. We used this type of manipulation when studying theremapping properties of the model.
5-10 minutes 10-15 minutes0-5 minutes
cell 92
1 2 3
t0--t1 t1--t2 t2--t3 t3--t4 t4--t5
020406080
100
5 51010
020406080
100
0 30 60 90 120 160 180
time (minutes)
syna
pses
time (seconds)
t0 t1 t2 t3 t4 t5
syna
pses
C
B
D
E
F
pool of 1000 grid cells
500 place cells
100 grid inputs per place cell
A
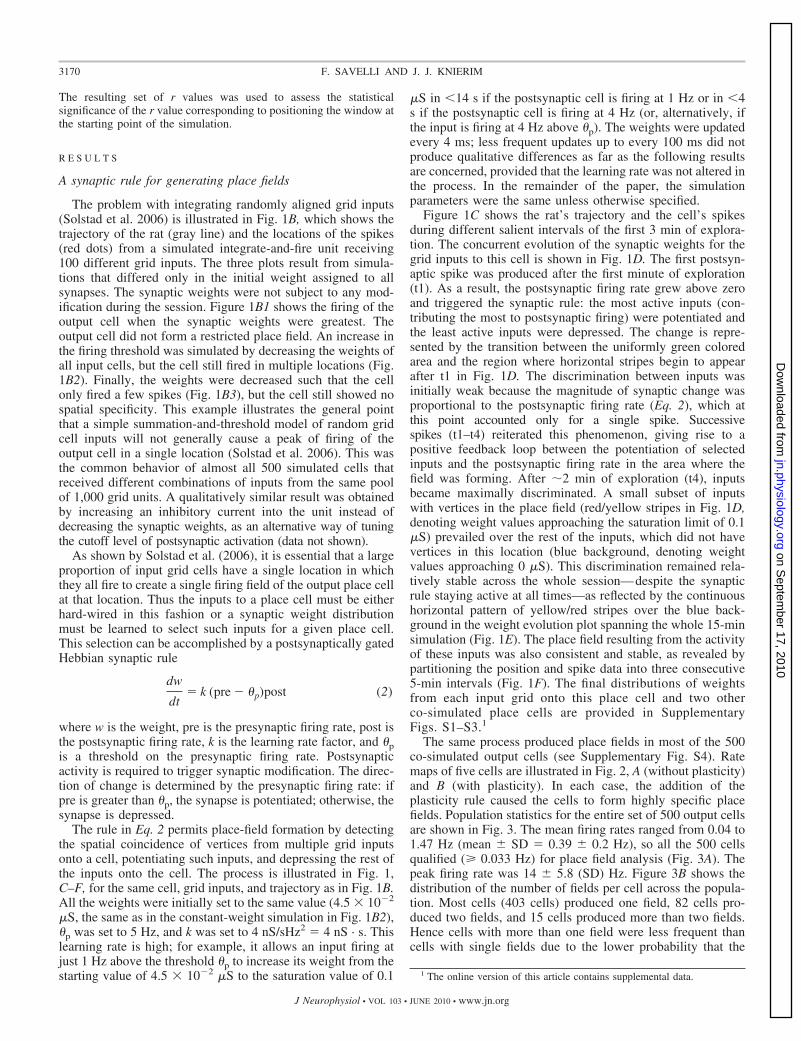
FIG. 1. Basic elements of the simulations and place-field generation bysynaptic plasticity. A: grid cells were simulated as inhomogeneous Poissonspike trains in which the momentary firing rate was modulated depending onthe predetermined geometrical properties of the grid cell and on the position ofthe rat. A 15-min trajectory segment of a real rat foraging in a 60 cm2 squarebox was used. Three examples of grid cells are shown. The gray lines show therat’s trajectories, and the red dots indicate the locations of the rat when thesimulated grid cell fired spikes. Place cells were simulated as integrate-and-fire units taking synaptic inputs from the grid cells. Each simulation contained1,000 grid cells of varying scale, phase, and orientation and 500 place cells.Each place cell received inputs from 100 distinct grid cells that were randomlyselected from the pool of 1,000 grid cells. B: uniform integration of randomlyaligned grid inputs with constant and equal synaptic weights does not produceplace fields. The gray line represents the rat’s cumulative trajectory (15 min),and the red dots denote the location of spikes produced by the integrate-and-fire output cell receiving 100 grid inputs (dot size is scaled to improvevisualization). B1–B3: the outcome of the same simulation run with differentweights (B1, w � 7.0 � 10�2 �S; B2, w � 4.5 � 10�2 �S; B3, w � 3.7 �10�2 �S; weights have physical dimensions of a conductance; see METHODS).Decreasing the weights causes a reduction of firing in the output cell but thefiring does not become more spatially concentrated. C: postsynaptically gatedsynaptic plasticity supports the formation of a place field by clustering spatiallycoincident inputs. Trajectory and spikes during salient epochs of the fieldformation within the first 3 min of exploration are shown. The inputs, initialweights, and all parameters were the same as in B2 except for the inclusion ofthe synaptic plasticity rule of Eq. 2. D: temporal evolution (x axis) of theweights for the 100 grid inputs (y axis) during the 1st 3 min of foraging. Blueindicates a synaptic weight (w) of 0 and red indicates maximum synapticweight. E: temporal evolution of weights as in D but for the whole duration ofthe foraging session. F: the resulting spatial response is consistent during thewhole simulation.
3168 F. SAVELLI AND J. J. KNIERIM
J Neurophysiol • VOL 103 • JUNE 2010 • www.jn.org
on Septem
ber 17, 2010 jn.physiology.org
Dow
nloaded from

The membrane dynamics of hippocampal place cells was modeled by
Cm
dV
dt� �gl(V � El) � �
s�gs(V � Es) (1)
where V is the membrane voltage, Cm is the membrane capacitance (2nF), gl is the leak conductance (0.2 �S), and El is the leak reversalpotential (�65 mV). The synaptic contribution to membrane dynam-ics was modeled with dynamic conductances; for each synapse s, gs isits conductance and Es is its reversal potential. Whenever V crossedthe firing threshold (�50 mV), a 1-ms spike event was superimposed.For the following refractory period (3 ms), V was kept at its restingpotential (�70 mV), after which the integration of the voltage dy-namics according to Eq. 1 was resumed. The membrane voltage V wasnever allowed to decrease below the lower bound �100 mV orincrease above 100 mV by artificially clipping voltages outside theseextremes (the dynamics of the conductances was not manipulated).Equation 1 was numerically integrated by the exponential Eulermethod with a 1-ms time step. When inhibitory interneurons wereemployed, they had the same physiological parameters as in thepreceding text.
In this conductance-based model, the synaptic conductance gs was0 in the absence of presynaptic activity. To model synaptic activity, gs
was instantaneously incremented by a quantity ws every time apresynaptic spike occurred and decayed exponentially to 0 accordingto the equation dgs/dt � �gs/�s. For excitatory synapses, the timeconstant �s was set to 2 ms, after the dynamics of AMPA receptors(Colquhoun et al. 1992). For inhibitory synapses, �s was set to 6 msto follow the slower course of GABA receptor dynamics. The reversalpotentials Es of excitatory and inhibitory synapses were set to 0 and�70 mV, respectively. The value of ws depended on previous poten-tiation or depression of synapse s by synaptic plasticity, as describedbelow (Eq. 2). This variable, therefore played the role of synapticweight (generally indicated with just the letter w in the rest of thepaper) and was the subject of synaptic modification whenever synap-tic plasticity was active in the simulation. The initial value of ws at allsynapses was 4.5 � 10�2 �S, unless otherwise specified. The weightwas artificially kept from becoming negative or growing above asaturation limit of 0.1 �S.
Presynaptic and postsynaptic firing rates used in the synaptic rule(see Eq. 2 below) were computed by convolving the presynaptic andpostsynaptic spike trains with an exponential kernel. The time con-stant of the kernel (�r) was generally set to 100 ms, but the effect ofgreater time constants was studied as well.
We used two types of networks in the simulations. The basicversion contained 1,000 grid-cell spike-train generators as input to500 integrate-and-fire units, representing potential place cells of thehippocampus (Fig. 1A). The phase, orientation, and scale of the gridswere uniformly sampled as follows. The 1,000 units were first dividedinto 10 groups of 100 units that corresponded to 10 different scales ofintervertex spacing, ranging from 30 to 53 cm by constant increments.This was the range of intervertex spacings observed in roughly themost dorsal 1 mm extension of the dorsocaudal MEC (Hafting et al.2005). Each group was in turn split into 10 subgroups, each of 10units, corresponding to 10 different orientations separated by 6°increments. The first orientation value was sampled randomly in the0–6° range independently for each different scale. Finally, the phasesof the 10 units in each of these scale�orientation subgroups wereuniformly sampled over the entire enclosure covered by the rat’strajectory. Each of the 500 integrate-and-fire hippocampal units re-ceived 100 excitatory synaptic inputs that were uniformly sampledwithout repetition from the available pool of 1,000 grid-cell spike-train generators. Hence the same input unit was generally shared bydifferent hippocampal cells.
The second network type included 50 additional integrate-and-fireunits as feedback interneurons. These interneurons received excitatoryinputs from the hippocampal cells and made inhibitory synapses (see
preceding text) onto the same class of cells. The main results de-scribed in this paper could be qualitatively reproduced with manysimulations varying in the number and strength of the synapticconnections. The quantitative results we report refer to the followingparameters. Each excitatory unit projected to 40 randomly chosen butdistinct interneurons (excitatory synapses); each interneuron projectedto 300 randomly chosen but distinct excitatory units (inhibitorysynapses). The strength of these excitatory and inhibitory synapseswas not subject to plasticity: ws for inhibitory synapses was set to 0.2�S and ws for excitatory synapses was set to 0.8 �S.
In each simulation, the computational model was run over a 15-minsegment of the tracked rat’s 37-min trajectory in accordance with therun-time of a typical physiological recording experiment of placecells. The output of the simulations mainly consisted of the times-tamps of every spike for each cell and the weight of every input toeach cell sampled every 100 ms. These data were stored in files andanalyzed off-line.
Simulations were implemented in C�� with use of the GnuScientific Library. Data analysis and plotting were implemented inPython using the NumPy and Matplotlib libraries as provided by theEnthought Python Distribution (Enthought, Austin, TX).
Data analysis
The average firing rate of a cell was calculated as the number ofspikes it fired during the simulated session divided by the duration ofthe session. To compute firing rate maps, the recording enclosure wassegmented into �3 � 3 cm bins. The firing rate in a bin wascalculated as the number of spikes that occurred when the rat occupiedthe bin divided by the time spent by the rat in the bin. The rate mapswere not smoothed. Bins that were visited for periods totaling �233ms were excluded from further analysis. The rate map was normalizedby dividing every bin by the maximum value across all bins. For cellswith an average firing rate �0.033 Hz, place fields were defined assets of at least four contiguous bins (36 cm2) if the bins all had value�0.15 (i.e., �15% of the maximal bin value) and at least one bin hada mean firing rate �1 Hz. When one or more place fields weredetected on a rate map, their size and relative contribution to the totalcell activity were computed. Size was simply computed by countingthe number of bins composing the field. The proportion of “in-field”firing was computed as the ratio between the sum of rates in the binsthat belonged to any detected field and the sum of the rates in all thebins of the map. High values of this ratio indicated that most of thecell’s firing occurred within the boundaries of the detected place fieldswith sparse firing occurring outside the fields. The size and in-fieldfiring proportion were conservative estimates in that the cutoff value(15% of the peak rate) for the boundaries of the place fields oftentended to exclude the fringes of the field. Whenever a distribution orthe statistics of peak firing rates is reported, it comprises only the cellsthat were included in place field analysis (i.e., with mean firing rate�0.033 Hz).
To determine whether place fields were distributed homogeneouslythroughout the environment, the cumulative rate map of a cell popu-lation was computed. For each bin of the cumulative rate map, thesum of the corresponding bins in the individual rate maps of all thecells in the population was first computed. Bins excluded from furtheranalysis in individual maps were excluded from the cumulative map.Finally, the bins of the cumulative rate map were normalized withrespect to the greatest bin value. To investigate whether the spatialbiases represented by the cumulative rate map correlated with theinitial segment of the rat’s trajectory, an occupancy map for the firstminute of trajectory was correlated with the cumulative rate map. Theoccupancy map had the same dimensions as the cumulative map andits bin values represented the time the rat spent in them within thesegment of trajectory under consideration. This procedure was thenapplied to all the trajectory segments obtained by sliding a 1-min timewindow by 1-s steps along the entire available trajectory (37 min).
3169GRID CELL TO PLACE CELL TRANSFORMATION
J Neurophysiol • VOL 103 • JUNE 2010 • www.jn.org
on Septem
ber 17, 2010 jn.physiology.org
Dow
nloaded from
The resulting set of r values was used to assess the statisticalsignificance of the r value corresponding to positioning the window atthe starting point of the simulation.
R E S U L T S
A synaptic rule for generating place fields
The problem with integrating randomly aligned grid inputs(Solstad et al. 2006) is illustrated in Fig. 1B, which shows thetrajectory of the rat (gray line) and the locations of the spikes(red dots) from a simulated integrate-and-fire unit receiving100 different grid inputs. The three plots result from simula-tions that differed only in the initial weight assigned to allsynapses. The synaptic weights were not subject to any mod-ification during the session. Figure 1B1 shows the firing of theoutput cell when the synaptic weights were greatest. Theoutput cell did not form a restricted place field. An increase inthe firing threshold was simulated by decreasing the weights ofall input cells, but the cell still fired in multiple locations (Fig.1B2). Finally, the weights were decreased such that the cellonly fired a few spikes (Fig. 1B3), but the cell still showed nospatial specificity. This example illustrates the general pointthat a simple summation-and-threshold model of random gridcell inputs will not generally cause a peak of firing of theoutput cell in a single location (Solstad et al. 2006). This wasthe common behavior of almost all 500 simulated cells thatreceived different combinations of inputs from the same poolof 1,000 grid units. A qualitatively similar result was obtainedby increasing an inhibitory current into the unit instead ofdecreasing the synaptic weights, as an alternative way of tuningthe cutoff level of postsynaptic activation (data not shown).
As shown by Solstad et al. (2006), it is essential that a largeproportion of input grid cells have a single location in whichthey all fire to create a single firing field of the output place cellat that location. Thus the inputs to a place cell must be eitherhard-wired in this fashion or a synaptic weight distributionmust be learned to select such inputs for a given place cell.This selection can be accomplished by a postsynaptically gatedHebbian synaptic rule
dw
dt� k (pre � �p)post (2)
where w is the weight, pre is the presynaptic firing rate, post isthe postsynaptic firing rate, k is the learning rate factor, and �pis a threshold on the presynaptic firing rate. Postsynapticactivity is required to trigger synaptic modification. The direc-tion of change is determined by the presynaptic firing rate: ifpre is greater than �p, the synapse is potentiated; otherwise, thesynapse is depressed.
The rule in Eq. 2 permits place-field formation by detectingthe spatial coincidence of vertices from multiple grid inputsonto a cell, potentiating such inputs, and depressing the rest ofthe inputs onto the cell. The process is illustrated in Fig. 1,C–F, for the same cell, grid inputs, and trajectory as in Fig. 1B.All the weights were initially set to the same value (4.5 � 10�2
�S, the same as in the constant-weight simulation in Fig. 1B2),�p was set to 5 Hz, and k was set to 4 nS/sHz2 � 4 nS · s. Thislearning rate is high; for example, it allows an input firing atjust 1 Hz above the threshold �p to increase its weight from thestarting value of 4.5 � 10�2 �S to the saturation value of 0.1
�S in �14 s if the postsynaptic cell is firing at 1 Hz or in �4s if the postsynaptic cell is firing at 4 Hz (or, alternatively, ifthe input is firing at 4 Hz above �p). The weights were updatedevery 4 ms; less frequent updates up to every 100 ms did notproduce qualitative differences as far as the following resultsare concerned, provided that the learning rate was not altered inthe process. In the remainder of the paper, the simulationparameters were the same unless otherwise specified.
Figure 1C shows the rat’s trajectory and the cell’s spikesduring different salient intervals of the first 3 min of explora-tion. The concurrent evolution of the synaptic weights for thegrid inputs to this cell is shown in Fig. 1D. The first postsyn-aptic spike was produced after the first minute of exploration(t1). As a result, the postsynaptic firing rate grew above zeroand triggered the synaptic rule: the most active inputs (con-tributing the most to postsynaptic firing) were potentiated andthe least active inputs were depressed. The change is repre-sented by the transition between the uniformly green coloredarea and the region where horizontal stripes begin to appearafter t1 in Fig. 1D. The discrimination between inputs wasinitially weak because the magnitude of synaptic change wasproportional to the postsynaptic firing rate (Eq. 2), which atthis point accounted only for a single spike. Successivespikes (t1–t4) reiterated this phenomenon, giving rise to apositive feedback loop between the potentiation of selectedinputs and the postsynaptic firing rate in the area where thefield was forming. After �2 min of exploration (t4), inputsbecame maximally discriminated. A small subset of inputswith vertices in the place field (red/yellow stripes in Fig. 1D,denoting weight values approaching the saturation limit of 0.1�S) prevailed over the rest of the inputs, which did not havevertices in this location (blue background, denoting weightvalues approaching 0 �S). This discrimination remained rela-tively stable across the whole session—despite the synapticrule staying active at all times—as reflected by the continuoushorizontal pattern of yellow/red stripes over the blue back-ground in the weight evolution plot spanning the whole 15-minsimulation (Fig. 1E). The place field resulting from the activityof these inputs was also consistent and stable, as revealed bypartitioning the position and spike data into three consecutive5-min intervals (Fig. 1F). The final distributions of weightsfrom each input grid onto this place cell and two otherco-simulated place cells are provided in SupplementaryFigs. S1–S3.1
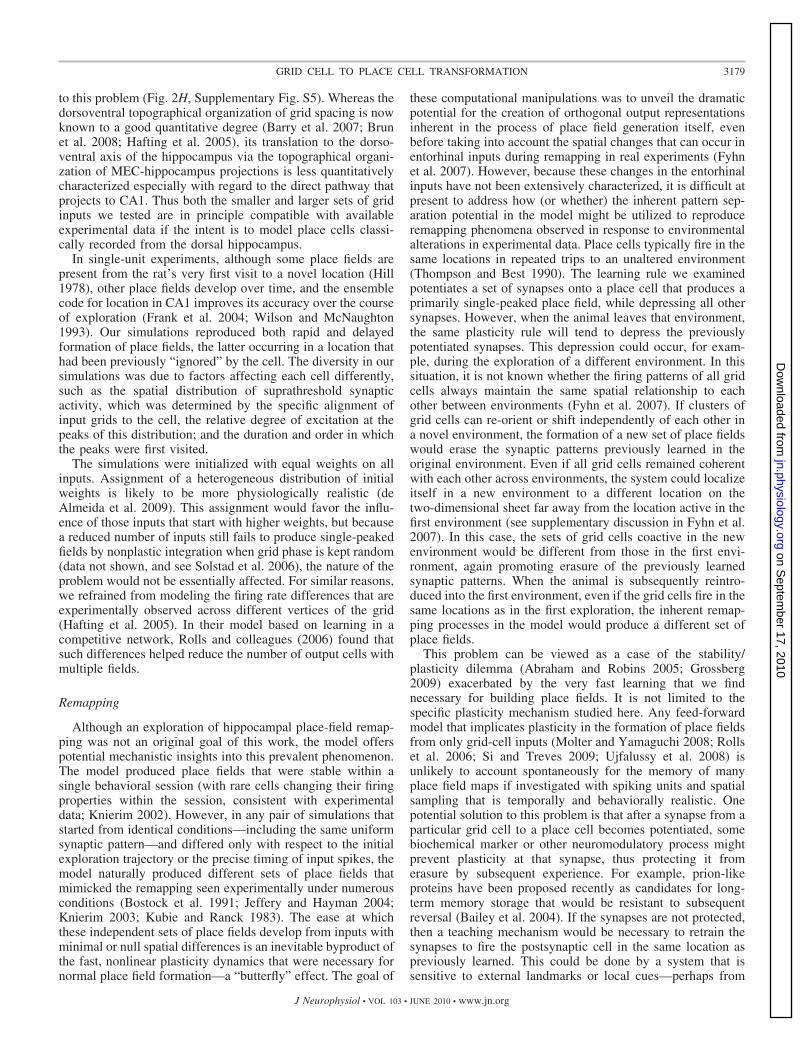
The same process produced place fields in most of the 500co-simulated output cells (see Supplementary Fig. S4). Ratemaps of five cells are illustrated in Fig. 2, A (without plasticity)and B (with plasticity). In each case, the addition of theplasticity rule caused the cells to form highly specific placefields. Population statistics for the entire set of 500 output cellsare shown in Fig. 3. The mean firing rates ranged from 0.04 to1.47 Hz (mean � SD � 0.39 � 0.2 Hz), so all the 500 cellsqualified ( 0.033 Hz) for place field analysis (Fig. 3A). Thepeak firing rate was 14 � 5.8 (SD) Hz. Figure 3B shows thedistribution of the number of fields per cell across the popula-tion. Most cells (403 cells) produced one field, 82 cells pro-duced two fields, and 15 cells produced more than two fields.Hence cells with more than one field were less frequent thancells with single fields due to the lower probability that the
1 The online version of this article contains supplemental data.
3170 F. SAVELLI AND J. J. KNIERIM
J Neurophysiol • VOL 103 • JUNE 2010 • www.jn.org
on Septem
ber 17, 2010 jn.physiology.org
Dow
nloaded from

same set of potentiated grid inputs would coincide in multiplespots of the recording enclosure. It is not known precisely howmany place cells fire in multiple locations in a given environ-ment, and the answer is almost certainly a complicated func-tion of hippocampal subregion (CA1, CA3, DG) (Chawla et al.2005; Vazdarjanova and Guzowski 2004), size of the environ-ment (Fenton et al. 2008; Henriksen et al. 2009), behavioral
task/trajectories (e.g., open-field foraging versus linear trackrunning), and other variables. We made no attempt to alter theproportion of cells with single place fields to match a prede-termined proportion of single- versus multiple-field cells givenour simulated environment and behavior, although subsequentsimulations intended to analyze other aspects of the modelwere found to affect this proportion [see simulations with
cell 162 cell 163 cell 164 cell 165 cell 1662 2 2 2 2
17 20 15 17 11B
Simulation 1
ASimulation 0
353
15 7 5 16 4
2 2 1 2 2
30 20 26 23 22
5 11 6 10 5
0.6 0.5C
Simulation 2
DSimulation 3
ESimulation 4
FSimulation 5
GSimulation 6
HSimulation 7
22 35 14 18 21
FIG. 2. Qualitative comparison of different simulations.Rate maps in the same column correspond to the same cellreceiving the same inputs and were produced by simulations inwhich only the form or parameters of the synaptic rule changed(row H is an exception in that it receives different inputs; seetext). The number above each rate map denotes the peak firingrate corresponding to the red color in the rate map. A: simula-tion 0: synaptic weights were fixed and no synaptic plasticitywas present. Integration of grid inputs does not produce strongspatial specificity in the output cells. B: simulation 1: thepostsynaptically gated rule (Eq. 2, �p � 5 Hz) was active at alltimes. Place fields with strong spatial specificity are producedwith the learning rule (see also Supplementary Fig. S4).C: simulation 2: same as B but with �p � 10 Hz. Fewer inputswere potentiated because of the higher �p threshold, resulting inlower firing rates, but spatial selectivity was generally pre-served. The 2 rate maps enclosed by the dashed rectangle didnot meet the mean firing rate criterion (�0.033 Hz) for inclu-sion in the data analysis. D: simulation 3: same as B butheterosynaptic depression was excluded from the rule (�p � 5Hz, �d � 0.05 Hz). This exclusion caused the runaway poten-tiation of all or most inputs, leading to very high firing rates anda loss of spatial selectivity that was similar to A. E: simulation4: same as C, but heterosynaptic depression was excluded fromthe rule (�p � 10 Hz, �d � 0.05 Hz). In this case, the higher �p
threshold prevented the runaway potentiation observed in D butstill caused a loss of spatial selectivity compared with C, mostlybecause of the emergence of multiple place fields per cell.F: simulation 5: the loss of spatial selectivity due to the lack ofheterosynaptic depression (�p � 5 Hz, �d � 0.3 Hz) wasrecovered by the addition of intervertex background firing ofthe grid cell (0.5 Hz) and by a slower integration of thepresynaptic spikes into the rate value used in the synaptic rule(see also Supplementary Fig. S6). This modification allowed thenecessary function of heterosynaptic depression to be recoveredin the form of homosynaptic depression. G: simulation 6: sameas B but the rate of learning in the synaptic rule was 20 timesslower. Place fields did not form within the foraging sessionduration (15 min). H: simulation 7: same as B but the grid inputswere sampled from a larger intervertex spacing range (70–93cm) compared with all other simulations in the paper (30–53cm). Using this larger range produces place fields closer in sizeto typical dorsal hippocampus recordings (see also Supplemen-tary Fig. S5).
150
100
50
0.5 1.0 1.500.0
num
ber o
f cel
ls
A200
150
100
50
00.2 0.4 0.6 0.8 1.0
C
200
400
0 1 2 3 40
300
100
B200
150
100
50
00 100 200 300
D
FIG. 3. Quantitative verification of the quality of the place fields developed by 500 co-simulated place cells. The simulation was run with parameters as inFig. 2B. A: average firing rates across the entire simulation. B: number of fields per cell. Most cells developed a single field. C: relative proportion of firingoccurring inside the area of the place fields counted in B. Most of the cell activity took place inside these fields. D: size of the fields counted in B. All fieldsare 1 order of magnitude smaller than the recording box (3,600 cm2).
3171GRID CELL TO PLACE CELL TRANSFORMATION
J Neurophysiol • VOL 103 • JUNE 2010 • www.jn.org
on Septem
ber 17, 2010 jn.physiology.org
Dow
nloaded from
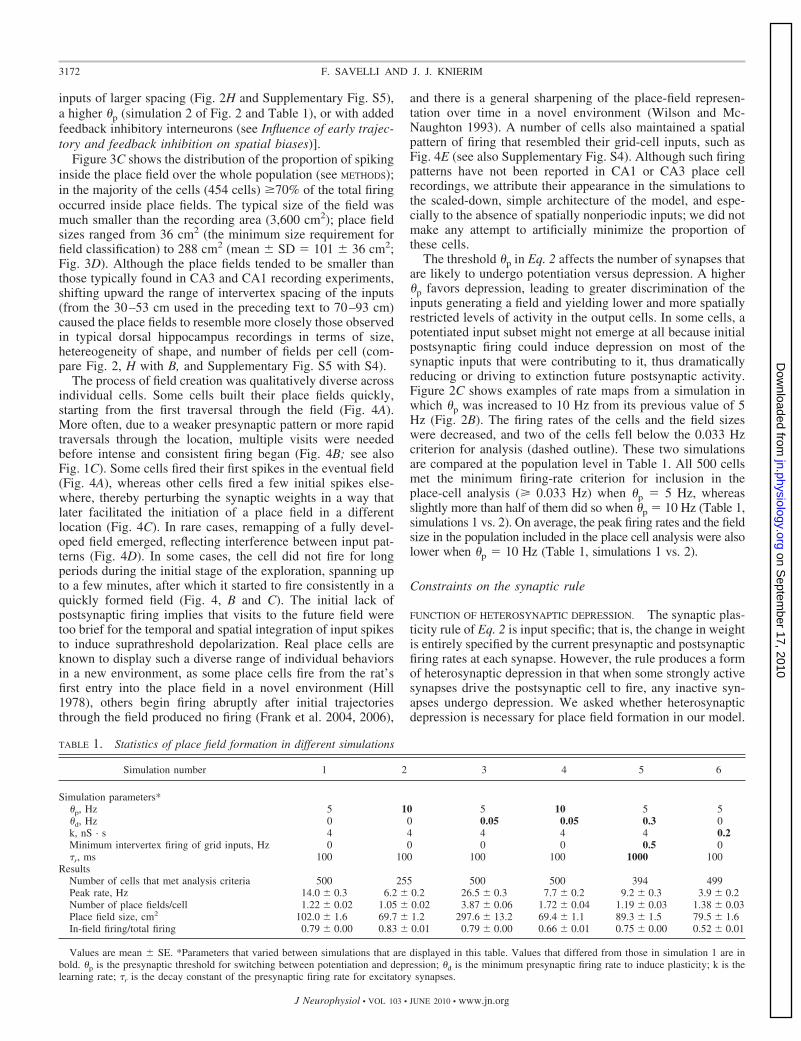
inputs of larger spacing (Fig. 2H and Supplementary Fig. S5),a higher �p (simulation 2 of Fig. 2 and Table 1), or with addedfeedback inhibitory interneurons (see Influence of early trajec-tory and feedback inhibition on spatial biases)].
Figure 3C shows the distribution of the proportion of spikinginside the place field over the whole population (see METHODS);in the majority of the cells (454 cells) �70% of the total firingoccurred inside place fields. The typical size of the field wasmuch smaller than the recording area (3,600 cm2); place fieldsizes ranged from 36 cm2 (the minimum size requirement forfield classification) to 288 cm2 (mean � SD � 101 � 36 cm2;Fig. 3D). Although the place fields tended to be smaller thanthose typically found in CA3 and CA1 recording experiments,shifting upward the range of intervertex spacing of the inputs(from the 30–53 cm used in the preceding text to 70–93 cm)caused the place fields to resemble more closely those observedin typical dorsal hippocampus recordings in terms of size,hetereogeneity of shape, and number of fields per cell (com-pare Fig. 2, H with B, and Supplementary Fig. S5 with S4).
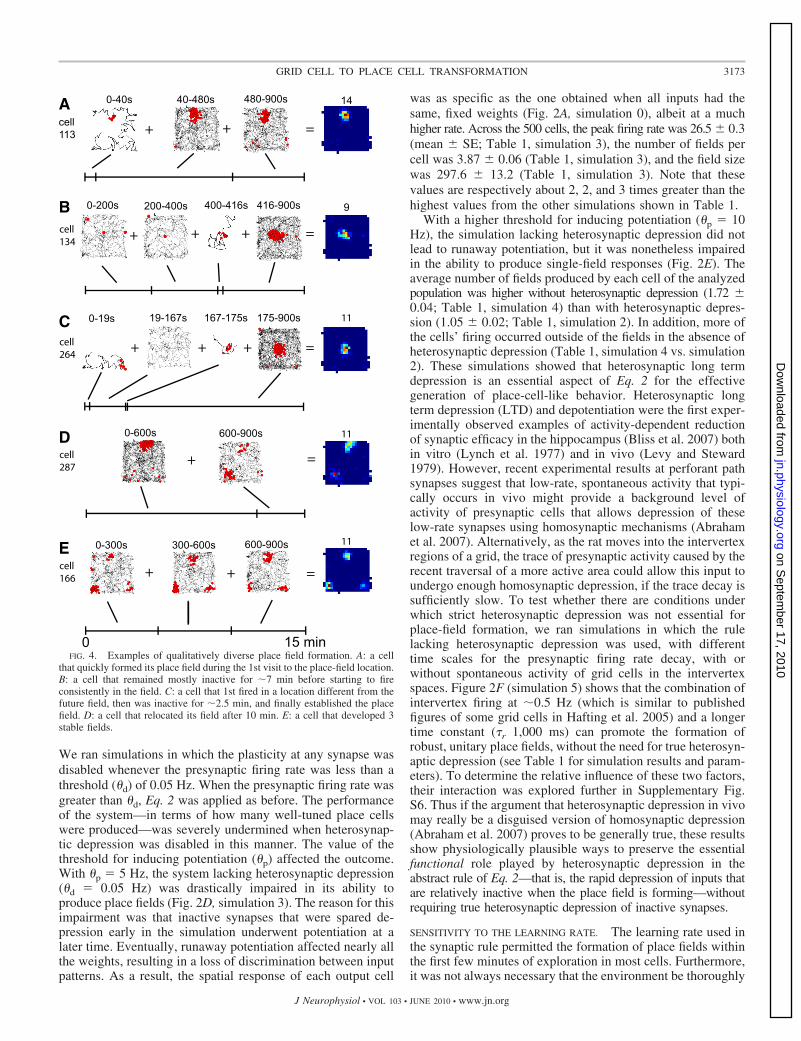
The process of field creation was qualitatively diverse acrossindividual cells. Some cells built their place fields quickly,starting from the first traversal through the field (Fig. 4A).More often, due to a weaker presynaptic pattern or more rapidtraversals through the location, multiple visits were neededbefore intense and consistent firing began (Fig. 4B; see alsoFig. 1C). Some cells fired their first spikes in the eventual field(Fig. 4A), whereas other cells fired a few initial spikes else-where, thereby perturbing the synaptic weights in a way thatlater facilitated the initiation of a place field in a differentlocation (Fig. 4C). In rare cases, remapping of a fully devel-oped field emerged, reflecting interference between input pat-terns (Fig. 4D). In some cases, the cell did not fire for longperiods during the initial stage of the exploration, spanning upto a few minutes, after which it started to fire consistently in aquickly formed field (Fig. 4, B and C). The initial lack ofpostsynaptic firing implies that visits to the future field weretoo brief for the temporal and spatial integration of input spikesto induce suprathreshold depolarization. Real place cells areknown to display such a diverse range of individual behaviorsin a new environment, as some place cells fire from the rat’sfirst entry into the place field in a novel environment (Hill1978), others begin firing abruptly after initial trajectoriesthrough the field produced no firing (Frank et al. 2004, 2006),
and there is a general sharpening of the place-field represen-tation over time in a novel environment (Wilson and Mc-Naughton 1993). A number of cells also maintained a spatialpattern of firing that resembled their grid-cell inputs, such asFig. 4E (see also Supplementary Fig. S4). Although such firingpatterns have not been reported in CA1 or CA3 place cellrecordings, we attribute their appearance in the simulations tothe scaled-down, simple architecture of the model, and espe-cially to the absence of spatially nonperiodic inputs; we did notmake any attempt to artificially minimize the proportion ofthese cells.
The threshold �p in Eq. 2 affects the number of synapses thatare likely to undergo potentiation versus depression. A higher�p favors depression, leading to greater discrimination of theinputs generating a field and yielding lower and more spatiallyrestricted levels of activity in the output cells. In some cells, apotentiated input subset might not emerge at all because initialpostsynaptic firing could induce depression on most of thesynaptic inputs that were contributing to it, thus dramaticallyreducing or driving to extinction future postsynaptic activity.Figure 2C shows examples of rate maps from a simulation inwhich �p was increased to 10 Hz from its previous value of 5Hz (Fig. 2B). The firing rates of the cells and the field sizeswere decreased, and two of the cells fell below the 0.033 Hzcriterion for analysis (dashed outline). These two simulationsare compared at the population level in Table 1. All 500 cellsmet the minimum firing-rate criterion for inclusion in theplace-cell analysis ( 0.033 Hz) when �p � 5 Hz, whereasslightly more than half of them did so when �p � 10 Hz (Table 1,simulations 1 vs. 2). On average, the peak firing rates and the fieldsize in the population included in the place cell analysis were alsolower when �p � 10 Hz (Table 1, simulations 1 vs. 2).
Constraints on the synaptic rule
FUNCTION OF HETEROSYNAPTIC DEPRESSION. The synaptic plas-ticity rule of Eq. 2 is input specific; that is, the change in weightis entirely specified by the current presynaptic and postsynapticfiring rates at each synapse. However, the rule produces a formof heterosynaptic depression in that when some strongly activesynapses drive the postsynaptic cell to fire, any inactive syn-apses undergo depression. We asked whether heterosynapticdepression is necessary for place field formation in our model.
TABLE 1. Statistics of place field formation in different simulations
Simulation number 1 2 3 4 5 6
Simulation parameters*�p, Hz 5 10 5 10 5 5�d, Hz 0 0 0.05 0.05 0.3 0k, nS · s 4 4 4 4 4 0.2Minimum intervertex firing of grid inputs, Hz 0 0 0 0 0.5 0�r, ms 100 100 100 100 1000 100
ResultsNumber of cells that met analysis criteria 500 255 500 500 394 499Peak rate, Hz 14.0 � 0.3 6.2 � 0.2 26.5 � 0.3 7.7 � 0.2 9.2 � 0.3 3.9 � 0.2Number of place fields/cell 1.22 � 0.02 1.05 � 0.02 3.87 � 0.06 1.72 � 0.04 1.19 � 0.03 1.38 � 0.03Place field size, cm2 102.0 � 1.6 69.7 � 1.2 297.6 � 13.2 69.4 � 1.1 89.3 � 1.5 79.5 � 1.6In-field firing/total firing 0.79 � 0.00 0.83 � 0.01 0.79 � 0.00 0.66 � 0.01 0.75 � 0.00 0.52 � 0.01
Values are mean � SE. *Parameters that varied between simulations that are displayed in this table. Values that differed from those in simulation 1 are inbold. �p is the presynaptic threshold for switching between potentiation and depression; �d is the minimum presynaptic firing rate to induce plasticity; k is thelearning rate; �r is the decay constant of the presynaptic firing rate for excitatory synapses.
3172 F. SAVELLI AND J. J. KNIERIM
J Neurophysiol • VOL 103 • JUNE 2010 • www.jn.org
on Septem
ber 17, 2010 jn.physiology.org
Dow
nloaded from
We ran simulations in which the plasticity at any synapse wasdisabled whenever the presynaptic firing rate was less than athreshold (�d) of 0.05 Hz. When the presynaptic firing rate wasgreater than �d, Eq. 2 was applied as before. The performanceof the system—in terms of how many well-tuned place cellswere produced—was severely undermined when heterosynap-tic depression was disabled in this manner. The value of thethreshold for inducing potentiation (�p) affected the outcome.With �p � 5 Hz, the system lacking heterosynaptic depression(�d � 0.05 Hz) was drastically impaired in its ability toproduce place fields (Fig. 2D, simulation 3). The reason for thisimpairment was that inactive synapses that were spared de-pression early in the simulation underwent potentiation at alater time. Eventually, runaway potentiation affected nearly allthe weights, resulting in a loss of discrimination between inputpatterns. As a result, the spatial response of each output cell
was as specific as the one obtained when all inputs had thesame, fixed weights (Fig. 2A, simulation 0), albeit at a muchhigher rate. Across the 500 cells, the peak firing rate was 26.5 � 0.3(mean � SE; Table 1, simulation 3), the number of fields percell was 3.87 � 0.06 (Table 1, simulation 3), and the field sizewas 297.6 � 13.2 (Table 1, simulation 3). Note that thesevalues are respectively about 2, 2, and 3 times greater than thehighest values from the other simulations shown in Table 1.
With a higher threshold for inducing potentiation (�p � 10Hz), the simulation lacking heterosynaptic depression did notlead to runaway potentiation, but it was nonetheless impairedin the ability to produce single-field responses (Fig. 2E). Theaverage number of fields produced by each cell of the analyzedpopulation was higher without heterosynaptic depression (1.72 �0.04; Table 1, simulation 4) than with heterosynaptic depres-sion (1.05 � 0.02; Table 1, simulation 2). In addition, more ofthe cells’ firing occurred outside of the fields in the absence ofheterosynaptic depression (Table 1, simulation 4 vs. simulation2). These simulations showed that heterosynaptic long termdepression is an essential aspect of Eq. 2 for the effectivegeneration of place-cell-like behavior. Heterosynaptic longterm depression (LTD) and depotentiation were the first exper-imentally observed examples of activity-dependent reductionof synaptic efficacy in the hippocampus (Bliss et al. 2007) bothin vitro (Lynch et al. 1977) and in vivo (Levy and Steward1979). However, recent experimental results at perforant pathsynapses suggest that low-rate, spontaneous activity that typi-cally occurs in vivo might provide a background level ofactivity of presynaptic cells that allows depression of theselow-rate synapses using homosynaptic mechanisms (Abrahamet al. 2007). Alternatively, as the rat moves into the intervertexregions of a grid, the trace of presynaptic activity caused by therecent traversal of a more active area could allow this input toundergo enough homosynaptic depression, if the trace decay issufficiently slow. To test whether there are conditions underwhich strict heterosynaptic depression was not essential forplace-field formation, we ran simulations in which the rulelacking heterosynaptic depression was used, with differenttime scales for the presynaptic firing rate decay, with orwithout spontaneous activity of grid cells in the intervertexspaces. Figure 2F (simulation 5) shows that the combination ofintervertex firing at �0.5 Hz (which is similar to publishedfigures of some grid cells in Hafting et al. 2005) and a longertime constant (�r 1,000 ms) can promote the formation ofrobust, unitary place fields, without the need for true heterosyn-aptic depression (see Table 1 for simulation results and param-eters). To determine the relative influence of these two factors,their interaction was explored further in Supplementary Fig.S6. Thus if the argument that heterosynaptic depression in vivomay really be a disguised version of homosynaptic depression(Abraham et al. 2007) proves to be generally true, these resultsshow physiologically plausible ways to preserve the essentialfunctional role played by heterosynaptic depression in theabstract rule of Eq. 2—that is, the rapid depression of inputs thatare relatively inactive when the place field is forming—withoutrequiring true heterosynaptic depression of inactive synapses.
SENSITIVITY TO THE LEARNING RATE. The learning rate used inthe synaptic rule permitted the formation of place fields withinthe first few minutes of exploration in most cells. Furthermore,it was not always necessary that the environment be thoroughly
cell113 =
0-40s 40-480s 480-900s
0-200s 200-400s 400-416s 416-900s 9
+ + + =cell134
+ + + =cell264
0-19s 19-167s 167-175s 175-900s
cell287
=
11
+ +
14A
B
C
D 600-900s0-600s
E 0-300s
+
300-600s 600-900s
+ + =
11
cell166
0
11
15 minFIG. 4. Examples of qualitatively diverse place field formation. A: a cell
that quickly formed its place field during the 1st visit to the place-field location.B: a cell that remained mostly inactive for �7 min before starting to fireconsistently in the field. C: a cell that 1st fired in a location different from thefuture field, then was inactive for �2.5 min, and finally established the placefield. D: a cell that relocated its field after 10 min. E: a cell that developed 3stable fields.
3173GRID CELL TO PLACE CELL TRANSFORMATION
J Neurophysiol • VOL 103 • JUNE 2010 • www.jn.org
on Septem
ber 17, 2010 jn.physiology.org
Dow
nloaded from

explored before a stable field was formed (e.g., Fig. 4A).Although these properties mimic the behavior of many realplace cells (Frank et al. 2004, 2006; Hill 1978; Wilson andMcNaughton 1993) and are consistent with the fast learningessential for the putative role of the hippocampus in episodicmemory (Knierim et al. 2006; Manns and Eichenbaum 2006;O’Keefe and Nadel 1978; Squire et al. 2004; Vargha-Khademet al. 1997), they are somewhat incompatible with the operat-ing conditions of most analytical and computational studies ofsynaptic learning rules (see, for instance, Dayan and Abbott2001; Gerstner and Kistler 2002). In these studies, the rate ofsynaptic change is assumed to be small compared with the rateof presentation of the input patterns. This assumption usuallyenables the mathematical derivation of the final steady state ofthe synaptic weights, which usually reflects some statisticalproperties of the stimulus space. For this purpose, the space ofinput patterns must be repeatedly experienced in its entirety forthe learning system to reach the final state. In the case ofplace-field formation, this requirement would imply waitinguntil the animal has sampled the environment multiple times,in contrast with experimental observations.
To test the importance of a fast learning rate for place-fieldformation, we ran simulations with a range of learning ratesthat are an order of magnitude slower than that used so far.When learning was ten times slower (k � 0.4 nS · s in Eq. 2),visual inspection of firing rate maps of the output cells revealedfields that formed more slowly and were still weak (or absent)by the end of the 15-min session in about half the population.When learning was 20 times slower (k � 0.2 nS · s), theproportion of such cells was higher still (Fig. 2G). Inspectionof the temporal evolution of the weights revealed that discrim-ination between inputs took much longer to build up underthese conditions (not shown). Table 1 (simulation 6) shows thequantitative analysis of the fields of the whole population inthis simulation. Note the lower average peak firing rates andin-field firing and the higher average number of fields per cellcompared with simulation 1 of Fig. 2 and Table 1. It thusappears that fast learning is a critical aspect of the transforma-tion of grid inputs to unitary place fields.
PRESYNAPTICALLY GATED RULE. A logical variation of thepostsynaptically gated Hebbian rule (Eq. 2) is a presynapticallygated rule, in which the polarity of plasticity depends on thepostsynaptic firing rate
dw
dt� k (post � �p)pre (3)
The postsynaptically gated and presynaptically gated rules areequivalent if the rate of learning is sufficiently slower than thepresentation of the input patterns and if �p is set to the aver-age presynaptic (for Eq. 2) or postsynaptic (for Eq. 3) firing rateacross all the input patterns (Dayan and Abbott 2001). Whenthese conditions are met, both rules amount to a covariancerule (Dayan and Sejnowski 1993; Sejnowski 1977). Becausethe postsynaptically gated rule (Eq. 2) with a slow learning ratedoes not generate place fields in a time frame consistent withexperimental data, it is worth asking empirically if Eq. 3 couldwork as well as Eq. 2 in the latter’s successful regime of fastlearning (k � 4 nS · s). Simulations showed that the presyn-aptically gated rule with fast learning did not form strong,unitary place fields. For any cell, either positive or negative
runaway of all the weights occurred, leading to poor spatialspecificity because of a lack of input selection or because of theloss of all excitatory drive onto the output cell. Figure 5illustrates the resulting bimodal distribution of mean firingrates across the population (�p � 1 Hz; higher values increasethe proportion of cells that become inactive but do not quali-tatively change the main result). Intuitively, this result can beunderstood as follows. The presynaptically gated rule eitherpotentiates or depresses all active synapses at any given time(while leaving inactive synapses unchanged, since the rule ispresynaptically gated). Potentiation occurs at all active syn-apses whenever postysynaptic firing is above �p, whereasdepression occurs at all active synapses whenever postsynapticfiring is below �p. Because a grid input to a place cell with asingle field will typically exhibit more firing fields outside ofthe place field than inside it, the mean balance of plasticityoccurring at this input will be negative. In this case, runawaydepression of the inputs will eventually occur. If instead theplace field area covers the majority of the input’s vertices, themean balance of plasticity at that input will be positive. In thiscase, runaway potentiation of most or all inputs will eventuallyoccur. Thus a synaptic weight distribution that generates sin-gle-peaked place fields from grid cell inputs is an unstable statewhen the presynaptically gated rule is active with fastplasticity.
The failure of simulations with the presynaptically gated ruleand the poor performance of the simulations in which thepostynaptically gated rule is applied with a slow learning rate suggestthat successful place-field formation requires that the systemwork in the region of parameter space far away from the regionwhere both rules converge appreciably to the covariance rule.
Effects on population coding
INFLUENCE OF EARLY TRAJECTORY AND FEEDBACK INHIBITION ON
SPATIAL BIASES. As noted in the preceding text, cells can formstable fields before the exploration of the environment is
400
350
300
250
200
150
100
50
0
A
0 2 4 6 8 10 12 14
B
num
ber o
f cel
ls
mean firing rates (Hz)
FIG. 5. Bimodal distribution of spatial response with the presynapticallygated synaptic rule. The application of this rule leads to either runawaypotentiation or depression of all the weights of any cell; this in turn causeseither elevated, indiscriminate firing or the loss of activity in the postsynapticcell. This pattern is reflected in the bimodal distribution of mean firing rates inthe histogram. A: rate maps of two sample cells that lost firing. B: rate maps of2 sample cells that fired strongly over much of the environment. A simplethreshold on these rate maps would produce activity reminiscent of the dentategyrus, in which the majority of cells are silent and a minority fire in multiplelocations (Chawla et al. 2005; Jung and McNaughton 1993; Leutgeb et al.2007).
3174 F. SAVELLI AND J. J. KNIERIM
J Neurophysiol • VOL 103 • JUNE 2010 • www.jn.org
on Septem
ber 17, 2010 jn.physiology.org
Dow
nloaded from

complete (e.g., Fig. 4A). The order in which different locationsare initially visited might therefore be relevant for where cellswill form their fields. This consideration raises the question ofwhether the initial stage of exploration exerts an influence overthe final global distribution of place fields (O’Keefe andConway 1978), which is not always uniform across the envi-ronment (Hetherington and Shapiro 1997; Wiener et al. 1989).
To address this question, we ran simulations with 15-minepochs of the rat’s exploration starting from different timepoints of the entire 37-min foraging session. All other param-eters and starting conditions of the simulations were identicalto that of simulation 1. We calculated a cumulative rate map(CRM) from each simulation by summing the normalizedindividual rate maps of all the place cells. The CRMs showedthat place fields did not spread across the recording enclosureuniformly; rather they tended to concentrate in certain regionsand miss other regions (Fig. 6A). The regions that wereover-represented were different in each simulation. An occu-pancy map was calculated for the first 60-s trajectory of eachsimulation, and these maps were positively correlated with theCRMs for their respective simulations (Fig. 6, A and C). It wasimportant to determine whether the resulting r values werehigher than those expected by correlating the CRMs with anyarbitrary trajectory. A sample of r values was computed bysliding a 60-s window in 1-s increments along the entire37-min trajectory and calculating the correlation of the CRMwith the occupancy map for each increment. The r values ofthe initial trajectories shown in Fig. 6C were all in the top 6%of the simulated sample (P � 0.03, P � 0.04, P � 0.03, P �
0.002, P � 0.06), demonstrating that there is a significantrelationship between the initial trajectory in an environmentand the bias in the locations of place field formation.
The pronounced heterogeneity of the place-field distributionproduced by the simple, feedforward model is greater than thattypically observed in place-field studies. Many types of feed-back interneurons are prevalent in the hippocampus (Freundand Buzsaki 1996). The spatial biases revealed by the CRMswere mitigated when a subpopulation of generalized, feedbackinhibitory interneurons—receiving excitatory connectionsfrom the output place cells and making inhibitory connectionsback onto them—was added to the model (Fig. 6D). Intu-itively, feedback inhibition reduced the gap between denselyand scarcely populated areas by introducing mutual inhibition/competition between place cells, which prevented too manycells from being active enough to start building a field at thesame time. In this way, feedback inhibition made the globalactivity spread more uniformly in the environment. The inter-neurons fired in the range �22–25 Hz, whereas the excitatoryunits projecting to these interneurons fired between 0 and �0.5Hz. An additional effect of feedback inhibition was a generalreduction of average firing rates in the population of placecells. The mean (for all simulated cells) and peak (for the cellsmeeting the criterion of place cell analysis) firing rates withoutfeedback inhibition were respectively 0.39 � 0.2 (SD) Hz and14 � 5.8 Hz compared with 0.07 � 0.07 and 5.6 � 2.7 Hzwhen inhibition was present (Fig. 6, column 1). Furthermore,all 500 excitatory cells in the simulation without inhibitionfired at �0.033 Hz—the criterion for inclusion in the place-cell
Different simulations, trajectory epoch used (minutes):
B trajectories (whole epoch)
A cumulative rate maps (whole epoch duration)
500 cells 500 cells 499 cells 499 cells 499 cells
12 16 10 14E individual rate map of cell 4 (whole epoch)
20
0-15 5-20 10-25 15-30 20-35
D cumulative rate maps with feedback inhibition (whole epoch)
323 cells310 cells315 cells308 cells318 cells
p < 0.03 p < 0.03 p < 0.03 p < 0.002 p < 0.06
C trajectories (first 60 s of epoch)
FIG. 6. Effects of early trajectory on place field location anddensity. The 5 columns represent 5 different simulations thatwere identical except for the choice of the 15-min epoch oftrajectory data. A: cumulative rate map of all cells showinginhomogeneous place field density across the simulated popu-lation. B: cumulative trajectory of each 15-min epoch. Thespatial sampling was comparable across different simulations.C: trajectory data for the 1st 60 s of each epoch. Occupancymaps (not shown) were calculated from these early trajectories.The occupancy maps were correlated with the respective cu-mulative rate maps in A: place fields concentrated mostly in thelocations first explored by the rat (r values: 0.34, 0.25, 0.33,0.54, 0.21; occupancy maps were not smoothed prior to corre-lation). D: the biases in the distribution of fields shown in A arereduced when a subpopulation of feedback inhibitory interneu-rons is added to the place cells. E: different place fieldsdeveloped by the same cell across the simulations in A. Thechange of spatial density in the cumulative rate maps is madepossible by a similar individual “remapping” of the majority ofthe cells.
3175GRID CELL TO PLACE CELL TRANSFORMATION
J Neurophysiol • VOL 103 • JUNE 2010 • www.jn.org
on Septem
ber 17, 2010 jn.physiology.org
Dow
nloaded from

analysis—but only 318 did so in the simulation with inhibition.Among these 318 cells, the percentage of cells with more thanone field was drastically reduced (under 4%) compared withthe simulation without inhibition (�19%). Thus in addition tospreading out the distribution of place fields, the inhibitionprevented a large number of cells from firing in more than onelocation in the environment.
REMAPPING. Across different environments (and sometimeswithin the same environment), place cells can change their
relative firing locations or change their average firing rates(Bostock et al. 1991; Knierim 2003; Leutgeb et al. 2004, 2005;Muller and Kubie 1987; Skaggs and McNaughton 1998). Thisphenomenon, called remapping, is thought to reflect the role ofthe hippocampus in contextual learning. We asked in whatcircumstances our simulations would produce different mapseven if starting with the same grid cell inputs and the sameuniform synaptic weights. As already shown, different placefields developed when the early trajectory was modified in thesimulations described in the previous section. Indeed the spa-tial reorganization of place-field density (Fig. 6A) implied thatthe majority of the cells individually relocated their fieldsacross simulations; an example of such a cell is shown in Fig.6E. This result suggests that where a place field fires in aparticular environment may depend in part on the rat’s earlyexploration trajectories in that environment as speculated byO’Keefe and Conway in their pioneering studies of place-fieldformation and cue control (O’Keefe and Conway 1978).
An even simpler perturbation of the field-generating processthat produced diverging maps consisted of small variations inthe timing of spike input patterns. This variation was accom-plished by repeating the simulation with a different realizationof each grid cell’s Poisson spike train. This was implementedby changing the seed of the random number generator (RNG)used in the grid-cell spike trains’ generation process (Fig. 7A).All other stochastic aspects of the simulation—such as networkconnectivity and grid cells’ geometric and firing properties—were handled by another RNG with a seed that was notchanged between simulations (see METHODS). Nonstochasticaspects, such as the initially uniform weights, were also iden-tical. The spike-timing alterations had a minimal effect on theoverall pattern of firing of the grid cells (Fig. 7B). These smallalterations, which occurred independently for each grid input,caused similar small alterations in the exact spiking of postsyn-aptic place cells (Fig. 7C). The resulting differences in themomentary values of both pre- and postsynaptic firing rates inturn triggered plasticity differentially in terms of timing, loca-tion, magnitude, and direction of synaptic efficacy changes.Eventually, this caused the fast, nonlinear dynamics of the fieldformation to diverge, leading to the potentiation of differentsets of synapses and thus to different field locations (Fig. 7D).
A Grid cell - 1st 60 s
B Grid cell - whole session
C Place cell - 1st 60 s
D Place cell - whole session
18Hz 17Hz 6Hz
E Cell 32
18Hz 7Hz 17Hz
F Cell 26
14Hz 13Hz 14Hz
G Cell 24
H Cumulative rate maps
500 cells 498 cells 499 cells
FIG. 7. Effects on place field location of exact timing and location of gridcell spikes. The 3 columns represent 3 simulations that were identical exceptfor the initialization of the random number generator affecting the exact timingof the grid cell spikes. As a result, grid cells spiked at slightly different timesand locations without altering their overall spatial firing pattern; by contrast,many place cells generated their place fields in distinct locations. A: anexample of an input grid cell that spiked at slightly different locations andtimes during the 1st 60 s. The trajectory of the rat, as well as every other modelparameter, did not change. B: the cumulative spatial firing patterns of this cellobserved over the whole 15-min sessions were not affected appreciably. C: anexample of an output place cell showing similar differences in early spiking.D: firing observed at the time scale of the whole session reveal that the samecell produced firing fields in 3 distinct locations. E: rate maps of a sample cellthat changed location and number of place fields across the 3 simulations.F: rate maps of a cell that changed field location between the 1st and 2ndsimulations and firing rate between the second and 3rd simulations. G: ratemaps of a cell that did not appreciably change either field location or firing rate.H: cumulative rate maps computed from all cells of the simulated populationthat met analysis criteria. The spatial biases of place field density did notchange across simulations in spite of the concurrent individual changes inplace field locations (because the initial trajectory of the rat did not changeacross simulations—compare with Fig. 6A).
3176 F. SAVELLI AND J. J. KNIERIM
J Neurophysiol • VOL 103 • JUNE 2010 • www.jn.org
on Septem
ber 17, 2010 jn.physiology.org
Dow
nloaded from

Not all cells produced different fields every time the RNG’sseed was changed. Rather, different combinations of locationand rate remapping (or lack thereof) were expressed through-out the population of place cells (Fig. 8, E–G), in a manner
reminiscent of partial remapping of real place cells (Knierim2003; Knierim and McNaughton 2001; Skaggs and McNaugh-ton 1998; Tanila et al. 1997). (Note that we used the termremapping here to denote the phenomenology of the simula-tions producing different place fields for the same outputneurons, analogous to the phenomenology of real place cellremapping. However, the simulations always started from theidentical uniform synaptic weights pattern; there was no se-quential history between simulations. See DISCUSSION for furtherelaboration.) The spatial biases of the population (as shown byCRMs) remained the same despite the underlying individualrelocation of place fields (Fig. 7H) unlike the remappingobtained by changing the rat’s trajectory (Fig. 6A). This resultis consistent with the previous observation that the spatialbiases reliably depended on the details of the initial trajectory,which was unaltered in the RNG seed simulations.
Figure 8 illustrates quantitative details of the remapping thatoccurred between simulations varying in trajectory (A and B,0–15 and 5–20 min, respectively) or in spike timing (C and D);both sets of simulations included feedback interneurons (as inFig. 6D). Figure 8, A and C, illustrates scatter plots of indi-vidual mean firing rates for all cells. Values for the samereference simulation are reported on the abscissa for both A andC, whereas values for the simulations with modified trajectoryand grid spike timing are reported on the ordinates of A and C,respectively. In both cases, low-rate cells in one simulationcould turn into high-rate cells in the other. Dashed linesindicate the 0.033 Hz threshold used for inclusion in theplace-field analysis; many cells that do not reach threshold in onesimulation are above threshold in the other. Figure 8, B and D,shows the distributions of distances between the field developed inone simulation and the field developed in the other. Only cells thatproduced exactly one field in both simulations were included: 196such cells were produced in the remapping by change of trajectory(B) and 204 cells in the remapping by change of spike timing (D).(The distance between the 2 fields is the distance between thecenters of mass of their areas in the rate maps in a common frameof reference.) In both cases, at least half of these cells experienceda relocation of their fields by a distance �15 cm. Conversely, alarge fraction of cells changed their firing locations by only smallamounts (�5 cm). Partial remapping was therefore widely presentin the cell population to a similar extent in simulations varied bytrajectory and input spike timing. Similar results were obtainedfrom simulations that did not include feedback interneurons (Fig.8, E–H). The only major difference between the simulations withand without feedback inhibition is the overall higher firing rate ofthe simulation without feedback, which eliminated the number ofcells that fell below firing-rate threshold but had little effect on theproportion of cells that changed their place field locations.
D I S C U S S I O N
Previous theoretical investigations of the grid-to-placefield transformation hypothesized that some form of synap-tic plasticity is involved in restricting the firing of a placecell to a single location (Blair et al. 2007; Franzius et al.2007; Molter and Yamaguchi 2008; Rolls et al. 2006; Si andTreves 2009; Solstad et al. 2006; Ujfalussy et al. 2008). Wehave shown here that a physiologically plausible, Hebbianlearning rule is capable of selecting inputs only from gridcells that share a common vertex location to accomplish this
mean firing rate (Hz)
0.4
0.2
0.2 0.4
0.4
0.2
0.2 0.4mean firing rate (Hz)
mea
n fir
ing
rate
(Hz)
CATrajectory-induced remapping Spike-timing-induced remapping
mea
n fir
ing
rate
(Hz)
mean firing rate (Hz)mean firing rate (Hz)
mea
n fir
ing
rate
(Hz)
GE
mea
n fir
ing
rate
(Hz)
0.5 1.0 1.5
1.0
0.5
1.5
1.0
0.5
1.5
0.5 1.0 1.5
DB
20 40 60place field distance (cm)
num
ber o
f cel
ls
60
80
40
20
place field distance (cm)
num
ber o
f cel
ls
20 40 60
60
80
40
20
HF
20 40 60place field distance (cm)
num
ber o
f cel
ls
60
80
40
20
place field distance (cm)
num
ber o
f cel
ls
20 40 60
60
140
100
20
100
FIG. 8. Varying place field locations and/or mean firing rate across simulationsthat differ only in the rat’s early trajectory or in the input spike timing. A: scatterplot of mean firing rates of each simulated place cell in a reference simulation(abscissa, 0–15 min epoch of trajectory data) and in a simulation with a differentstart time (ordinate, 5–20 min epoch). Dashed lines indicate the firing ratethreshold criterion for inclusion in data analysis (�0.033 Hz). Cells that did notmeet the criterion in one simulation could still meet the criterion in the other; thefiring rates of these cells are denoted by the dots on the left of the vertical dashedline and above the horizontal dashed line, or by the dots below the horizontaldashed line and on the right of the vertical dashed line. Cells could have negligibleactivity in one simulation while being among the most active in the other.B: histogram of the distance between the place fields created in the reference vs.altered simulations as in A for each simulated cell that produced exactly 1 field inboth simulations. The majority of cells produced different fields between the 2simulations. C and D: these graphs are similar to A and B except that the alteredsimulation was obtained from the same reference simulation by changing the seedof the random number generator involved in the generation of the input spike trains(instead of the trajectory epoch starting point). Changes in place field locationsand/or mean firing rates were similar in the 2 types of manipulations. E–H: sameas A–D but in a simulation that does not contain feedback inhibition. The amountof remapping that occurs from both trajectory changes and spike-timing changesis similar in the simulations run with and without inhibition.
3177GRID CELL TO PLACE CELL TRANSFORMATION
J Neurophysiol • VOL 103 • JUNE 2010 • www.jn.org
on Septem
ber 17, 2010 jn.physiology.org
Dow
nloaded from

task (Solstad et al. 2006). Our investigations revealed thatwithin the confines of our model fast learning dynamics andsome form of heterosynaptic depression are required totransform the multipeaked input of grid cells into single-peaked output of place cells. In addition, the model providespotential insights into the heterogeneous temporal dynamicsof place-field formation, the prevalent remapping phenom-ena, and the potential separation of the roles of synapticplasticity and network competition via feedback inhibi-tion.
Plasticity
Our model assumes that plasticity plays a major role inplace-field formation, an assumption that is made plausible bythe ubiquity of synaptic plasticity in all subfields of the hip-pocampus. A challenge to this assumption comes from a studyin which rats were injected systemically with CPP [a blocker ofthe N-methyl-D-aspartate (NMDA) receptor]. These animalsformed apparently normal place fields in a novel environment,but they were unable to reactivate these same place fields whenreintroduced into the same environment the next day (Kentroset al. 1998; Shapiro and Eichenbaum 1999). This result sug-gested that NMDA-dependent plasticity may be implicated inthe long-term stability of place fields but not in their creation.In contrast, other studies using genetic knock-out techniqueshave shown decreased quality of place fields in novel environ-ments when NMDA receptors were disrupted (McHugh et al.1996; Nakazawa et al. 2004), a result that is more in agreementwith our model. The reasons for the discrepancies among thesestudies are not clear, but they may be due to species differencesand/or differences in recording or behavioral techniques. Al-ternatively, it is entirely possible that a form of non-NMDAreceptor plasticity that operates in accordance with the presentcomputational model could still support the grid to placetransformation (Kentros et al. 1998). Further experiments anda more anatomically and biophysically detailed model of thehippocampus will be required to address the discrepanciesbetween these studies and the respective roles on NMDA-dependent and -independent forms of plasticity in place-fieldformation.
The properties of the learning rule are suggestive of theheterosynaptic depression/depotentiation of an inactive path-way when postsynaptic activation is driven by a second path-way (Abraham et al. 2007; Levy and Steward 1979; Lynch etal. 1977). We systematically tested our computational model toverify the extent to which the rule operates in agreement withthis experimental phenomenon, especially in its more recentcharacterization (Abraham et al. 2007) as a form of homosyn-aptic depression “in disguise.” In our simulations, successfulgeneration of single place fields could only be accomplishedwith a faithful implementation of the heterosynaptic depressionof silent inputs, unless the presynaptic activity trace wasassumed to decay relatively slowly (500 ms to 1 s timeconstant; Fig. 2F and Supplementary Fig. S6). In the lattercase, the resulting slower input integration provides a sufficientwindow of opportunity for depression to act homosynapticallyas the rat moves from a peak to a trough of the grid. Deter-mining the exact biophysical implementation of this functionwas beyond the scope of the present work, but a plausiblecandidate might be the binding of glutamate onto NMDA
receptors; this permits Ca2� influx into the spine at the occur-rence of back-propagating action potentials. In this scenario,the dependence of the direction of plasticity on the level of thepresynaptic rate in Eq. 2 would naturally reflect the long-heldhypothesis that the level of [Ca2�] in the spine determineswhether LTP or LTD is induced at the synapse (Artola andSinger 1993; Bear et al. 1987; Lisman 1989; Shouval et al.2002). The time constant of the slow components of the decayof the glutamate binding to NMDA receptors (up to 600 ms)(Lester et al. 1990) appears compatible with the parameterrange that succeeded in producing place fields in our simula-tions without proper heterosynaptic depression. Physiologicalrealizations of the mechanism inherent in the postsynapticallygated synaptic rule could conceivably involve other forms ofcellular plasticity as well. For instance, the global decrease inmembrane excitability that accompanies input-specific LTPobserved in CA1 Schaffer collaterals reduces the ability ofnonpotentiated inputs to contribute to later postsynaptic firing(Fan et al. 2005; Narayanan and Johnston 2007). Thus thisphenomenon—if present at perforant path synapses as well—could have a functional net effect similar to that of heterosyn-aptic depression in Eq. 2.
It is possible that models of plasticity or parameter valuesthat escaped our investigation could produce a grid to placetransformation as effectively as accomplished by the rule inEq. 2. Because this rule produces a crude form of synapticcompetition, one might conclude that any synaptic rule with asimilar property should be able to make place fields from gridinputs. For example, the BCM rule (Bienenstock et al. 1982)can refine the spatial response of a unit taking inputs fromboundary-related cells into a place field (Barry and Burgess2007; Barry et al. 2006; Lever et al. 2002). The BCM rule’srate of synaptic change must be considerably slower than therate of presentation of input patterns to enable temporal com-petition between these patterns (Bienenstock et al. 1982;Dayan and Abbott 2001), thus requiring extensive spatialsampling of the recording enclosure. By contrast, our simula-tions suggest that the rate of synaptic change must be fast togenerate fields at a realistic time scale, and some of these fieldswere formed before the environment was fully explored, as isoften experimentally observed (Frank et al. 2004; Hill 1978).The present model does not exclude that an additional learningscheme like the BCM rule could affect the final place-cellresponse, possibly by eliminating additional fields and/or gov-erning the integration of nongrid inputs into the hippocampalplace representation (Barry and Burgess 2007; Barry et al.2006), but this additional mechanism would need to operate farfrom the timescale of a foraging session that we were con-cerned with in this study.
Place field generation
The place fields generated by our simulations tended to besmaller than those typically found in CA3 and CA1 recordingexperiments. Incorporation of other inputs to the cells (e.g.,boundary cells) (Lever et al. 2009; Savelli et al. 2008; Solstadet al. 2008), more complex network dynamics (Maurer et al.2006), or temporal organization of the inputs (Molter andYamaguchi 2008) might make the sizes of the fields moresimilar to those seen in experimental recordings. We also notedthat the use of inputs with larger grids was an obvious solution
3178 F. SAVELLI AND J. J. KNIERIM
J Neurophysiol • VOL 103 • JUNE 2010 • www.jn.org
on Septem
ber 17, 2010 jn.physiology.org
Dow
nloaded from
to this problem (Fig. 2H, Supplementary Fig. S5). Whereas thedorsoventral topographical organization of grid spacing is nowknown to a good quantitative degree (Barry et al. 2007; Brunet al. 2008; Hafting et al. 2005), its translation to the dorso-ventral axis of the hippocampus via the topographical organi-zation of MEC-hippocampus projections is less quantitativelycharacterized especially with regard to the direct pathway thatprojects to CA1. Thus both the smaller and larger sets of gridinputs we tested are in principle compatible with availableexperimental data if the intent is to model place cells classi-cally recorded from the dorsal hippocampus.
In single-unit experiments, although some place fields arepresent from the rat’s very first visit to a novel location (Hill1978), other place fields develop over time, and the ensemblecode for location in CA1 improves its accuracy over the courseof exploration (Frank et al. 2004; Wilson and McNaughton1993). Our simulations reproduced both rapid and delayedformation of place fields, the latter occurring in a location thathad been previously “ignored” by the cell. The diversity in oursimulations was due to factors affecting each cell differently,such as the spatial distribution of suprathreshold synapticactivity, which was determined by the specific alignment ofinput grids to the cell, the relative degree of excitation at thepeaks of this distribution; and the duration and order in whichthe peaks were first visited.
The simulations were initialized with equal weights on allinputs. Assignment of a heterogeneous distribution of initialweights is likely to be more physiologically realistic (deAlmeida et al. 2009). This assignment would favor the influ-ence of those inputs that start with higher weights, but becausea reduced number of inputs still fails to produce single-peakedfields by nonplastic integration when grid phase is kept random(data not shown, and see Solstad et al. 2006), the nature of theproblem would not be essentially affected. For similar reasons,we refrained from modeling the firing rate differences that areexperimentally observed across different vertices of the grid(Hafting et al. 2005). In their model based on learning in acompetitive network, Rolls and colleagues (2006) found thatsuch differences helped reduce the number of output cells withmultiple fields.
Remapping
Although an exploration of hippocampal place-field remap-ping was not an original goal of this work, the model offerspotential mechanistic insights into this prevalent phenomenon.The model produced place fields that were stable within asingle behavioral session (with rare cells changing their firingproperties within the session, consistent with experimentaldata; Knierim 2002). However, in any pair of simulations thatstarted from identical conditions—including the same uniformsynaptic pattern—and differed only with respect to the initialexploration trajectory or the precise timing of input spikes, themodel naturally produced different sets of place fields thatmimicked the remapping seen experimentally under numerousconditions (Bostock et al. 1991; Jeffery and Hayman 2004;Knierim 2003; Kubie and Ranck 1983). The ease at whichthese independent sets of place fields develop from inputs withminimal or null spatial differences is an inevitable byproduct ofthe fast, nonlinear plasticity dynamics that were necessary fornormal place field formation—a “butterfly” effect. The goal of
these computational manipulations was to unveil the dramaticpotential for the creation of orthogonal output representationsinherent in the process of place field generation itself, evenbefore taking into account the spatial changes that can occur inentorhinal inputs during remapping in real experiments (Fyhnet al. 2007). However, because these changes in the entorhinalinputs have not been extensively characterized, it is difficult atpresent to address how (or whether) the inherent pattern sep-aration potential in the model might be utilized to reproduceremapping phenomena observed in response to environmentalalterations in experimental data. Place cells typically fire in thesame locations in repeated trips to an unaltered environment(Thompson and Best 1990). The learning rule we examinedpotentiates a set of synapses onto a place cell that produces aprimarily single-peaked place field, while depressing all othersynapses. However, when the animal leaves that environment,the same plasticity rule will tend to depress the previouslypotentiated synapses. This depression could occur, for exam-ple, during the exploration of a different environment. In thissituation, it is not known whether the firing patterns of all gridcells always maintain the same spatial relationship to eachother between environments (Fyhn et al. 2007). If clusters ofgrid cells can re-orient or shift independently of each other ina novel environment, the formation of a new set of place fieldswould erase the synaptic patterns previously learned in theoriginal environment. Even if all grid cells remained coherentwith each other across environments, the system could localizeitself in a new environment to a different location on thetwo-dimensional sheet far away from the location active in thefirst environment (see supplementary discussion in Fyhn et al.2007). In this case, the sets of grid cells coactive in the newenvironment would be different from those in the first envi-ronment, again promoting erasure of the previously learnedsynaptic patterns. When the animal is subsequently reintro-duced into the first environment, even if the grid cells fire in thesame locations as in the first exploration, the inherent remap-ping processes in the model would produce a different set ofplace fields.
This problem can be viewed as a case of the stability/plasticity dilemma (Abraham and Robins 2005; Grossberg2009) exacerbated by the very fast learning that we findnecessary for building place fields. It is not limited to thespecific plasticity mechanism studied here. Any feed-forwardmodel that implicates plasticity in the formation of place fieldsfrom only grid-cell inputs (Molter and Yamaguchi 2008; Rollset al. 2006; Si and Treves 2009; Ujfalussy et al. 2008) isunlikely to account spontaneously for the memory of manyplace field maps if investigated with spiking units and spatialsampling that is temporally and behaviorally realistic. Onepotential solution to this problem is that after a synapse from aparticular grid cell to a place cell becomes potentiated, somebiochemical marker or other neuromodulatory process mightprevent plasticity at that synapse, thus protecting it fromerasure by subsequent experience. For example, prion-likeproteins have been proposed recently as candidates for long-term memory storage that would be resistant to subsequentreversal (Bailey et al. 2004). If the synapses are not protected,then a teaching mechanism would be necessary to retrain thesynapses to fire the postsynaptic cell in the same location aspreviously learned. This could be done by a system that issensitive to external landmarks or local cues—perhaps from
3179GRID CELL TO PLACE CELL TRANSFORMATION
J Neurophysiol • VOL 103 • JUNE 2010 • www.jn.org
on Septem
ber 17, 2010 jn.physiology.org
Dow
nloaded from

the lateral entorhinal cortex—providing input to DG or CA3that drives the place cell to fire in the same location. Even aweak spatial bias might bootstrap the same set of grid cells andplace cells to fire in synchrony as before (especially if coupledwith hypothesized attractor dynamics provided by the recurrentcollateral system in the CA3 region), driving the system topotentiate the same synapses as in the previous session. In thelight of the experimental suggestion that long-term memory ofplace fields is NMDA dependent but their generation is not(Kentros et al. 1998), such a teaching process should beexperimentally distinguishable from the field formation. Al-though this necessity for constant relearning may seem ineffi-cient, there is experimental evidence that CA1 place fieldsundergo plasticity (revealed through backward expansion ofplace field size and location) every time an animal enters afamiliar environment after a sufficient delay (�24 h) (Ekstromet al. 2001; Mehta et al. 1997). Such plasticity in familiarenvironments is not evident in CA3 (Lee et al. 2004), suggest-ing that the mossy fiber and recurrent collateral inputs in CA3may be part of the long-term memory system that allows CA3cells to fire at the same location in repeated trips to anenvironment. The Schaffer collateral system may then teachthe CA1 cells to fire in the same location each time relative tothe incoming MEC input, thus providing the intersession place-field stability observed in most experimental studies.
Comparison with different mechanistic models
Rolls and colleagues (2006) proposed the first mechanisticmodel for the grid-to-place transformation. The model com-bined synaptic plasticity in place cells with a partial winner-take-all rule regulating their population activity to introducecompetition between them. Plasticity was implemented asHebbian potentiation of feed-forward projections from gridcells accompanied by fast weight renormalization and wasshown necessary to generate place fields. This framework waslargely shared by later studies that investigated how additionalfactors such as phase precession of grid cell firing (Molter andYamaguchi 2008) or putative inputs from the lateral entorhinalcortex (Si and Treves 2009) could contribute to the propertiesof the transformation. Our study suggests decoupled roles forplasticity and competition: plasticity alone is sufficient forgenerating unitary place fields in single cells, whereas networkcompetition may distribute fields more evenly across the en-vironment and reduce the number of active cells. We alsoprovided the first detailed analysis of the nature of the plasticityrule in relation to its success in producing place fields based ona spiking model.
A complementary hypothesis was investigated by deAlmeida and colleagues (2009), who showed that the winner-take-all rule can produce multipeaked place fields similar tothose recorded from dentate gyrus without requiring synapticplasticity as long as the initial conditions encompassed a widerange of synaptic weight values. This hypothesis has theadvantage of not requiring the inputs to be aligned at onevertex location because competition can in principle nonlin-early amplify even slight differences of postsynaptic activationacross space. The stability of the place fields obtained with thismechanism, however, needs to be confirmed with a spikingmodel using nonphenomenological network competition, real-istic spatial sampling, and noninstantaneous kinetics of synap-
tic excitation. For instance, the total momentary excitatorydrive to a place cell firing in its field is a function of the recenttrajectory, not only of the current position, due to the slow timecourse of the excitatory contribution of NMDA channels,which may be greater than the faster AMPA contribution (deAlmeida et al. 2009). In our simulations, this effect provedbeneficial for a less-than-ideal implementation of heterosynap-tic depression (Supplementary Fig. S6), but in a model thatresolves competition on the fast timescale of one gammaoscillation as proposed by de Almeida and colleagues (2009),it could cause different sets of winners to emerge acrossdistinct traversals of the same location as a function of theapproaching trajectory. Nonetheless, the existence of modelsbased on different physiological mechanisms (plasticity vs.network competition) suggests that the problem of place fieldformation is still experimentally underconstrained.
Hayman and Jeffery (2008) have suggested that contextualinputs from LEC and grid inputs from MEC may be clusteredonto individual branches of a DG granule cell dendritic treesuch that the contextual input determines which branch isactive and thereby produces context-specific firing of the cell.Ujfalussy and colleagues (2009) have investigated the samenotion in a mechanistic model employing a plasticity rule—with similar heterosynaptic depression properties as in ourstudy—applied separately to each postsynaptic dendriticbranch rather than to the postsynaptic soma as in our model.Each branch received both visual and grid-cell inputs and couldcreate a place field in one environment. The cell summated thedifferent dendritic contributions thus giving rise to the inde-pendently modifiable, multiple firing fields typical of DGgranule cells (Leutgeb et al. 2007). This may be a fruitful lineof investigation into determining both context specificity ofplace fields as well as place-field stability in repeated trips tothe same environment—a problem that we discussed in theprevious section. A disadvantage of applying plasticity in acompartmentalized fashion, however, was that heterosynapticdepression could not work across branches. Manual interven-tion was hence necessary to silence those branches that did notreach sufficient activation for plasticity to depress their inputs(Ujfalussy et al. 2009).
Experimental tests
Some implications of the present model provide suggestionsfor future experimental research. The core prediction can beasserted as follows. While the field of a place cell is developingin a novel environment, every grid cell input that has anintervertex space at the place-field location must experience afast reduction of its excitatory influence on the place cell. Thereduction will need to be especially pronounced if the input athand is not already depotentiated or depressed prior to theexposure to the new environment. Ideally, this predictionwould be tested with intracellular recording of a single hip-pocampal place cell (Epsztein et al. 2010; Harvey et al. 2009;Lee et al. 2009), and (some of) its input grid cells during theanimal’s foraging session, by gauging the EPSPs provokedindependently by each input via microstimulation before andafter the session. This would be an extremely difficult exper-iment with current technology, however. Alternatively, theprediction could be tested in vitro by the quasi-simultaneousphotostimulation of multiple dendritic sites (Gasparini and
3180 F. SAVELLI AND J. J. KNIERIM
J Neurophysiol • VOL 103 • JUNE 2010 • www.jn.org
on Septem
ber 17, 2010 jn.physiology.org
Dow
nloaded from

Magee 2006; Losonczy and Magee 2006) in the stratum lacu-nosum-moleculare (where the perforant path entorhinal inputsmake their connections) of a proximal CA1 cell the somapotential of which is also recorded. The stimulation could bedriven by the first stage of our simulations—which producesspike trains according to modeled grid cells and the trackedposition of the rat. The spikes produced by the cell could beused with this positional data to build a virtual spatial rate map(based on the positions of the rat that correspond to the outputspikes in the simulation). Assuming a virtual place field is thusproduced, the EPSPs resulting from periodic independent stim-ulation of the different inputs could be used to monitor whethereach input’s excitatory influence on the postsynaptic cellevolves in accordance with the prediction. This experimentamounts to replacing the integrate-and-fire “place cell” unit inour simulations with a real cell in vitro. With the caveat that thespatial resolution of photostimulation does not currently attaincontrol of single synapses (Gasparini and Magee 2006; Loson-czy and Magee 2006), the results could provide preliminaryevidence in favor or against the model. Note that strongevidence consistent with the model would require that thealterations in synaptic efficacy occur rapidly to reflect therequirement for fast plasticity shown by the model. Similarly,plasticity should occur when the postsynaptic cell fires, and thesign of plasticity should depend on the activity level of thepresynaptic input. These predictions are specific to the currentmodel rather than to a generic Hebbian plasticity model.
The emergent properties of the model have potential exper-imental implications as well. Some studies of place cells havedemonstrated an over-representation of the boundaries of anenvironment compared with the center (Hetherington and Sha-piro 1997; Wiener et al. 1989; but see Muller et al. 1987). Wenoted that minor changes in the initial exploration trajectoryare sufficient to modify the location where place cells formtheir fields, and the locations visited the most in this earlyphase are more likely to eventually host place fields. This resultsuggests that one contributing factor to this boundary over-representation may be the tendency of rodents to first explorethe edges of a novel environment before venturing out into thecenter (Drai and Golani 2001; Drai et al. 2001; Tchernichovskiand Benjamini 1998; Tchernichovski et al. 1998), in addition tothe possibility that the over-representation is partly inheritedfrom boundary cells in MEC (Savelli et al. 2008; Solstad et al.2008) or re-entrant subiculum outputs (Lever et al. 2009).Experimental manipulations could be performed to systemati-cally constrain the early rat’s trajectory (Hayman et al. 2008)and test the influence of the early trajectory on the inhomoge-neities of field distributions. Moreover, in our simulations, wefound that feedback inhibition considerably reduces the inten-sity of this influence. The prediction follows that if it werepossible to inactivate feedback interneurons of the hippocam-pus (like OLM cells) (Freund and Buzsaki 1996) selectivelywithout otherwise compromising normal place field formation,the global spatial distribution of place fields would become lessuniform and possibly more concentrated in the areas firstexplored by the rat.
A C K N O W L E D G M E N T S
We thank M. Mauk and H. Shouval for helpful discussions, K. Zhang andS. Deshmukh for comments on the manuscript, J. Siegel for the rat trajectorydata, and G. Rao for assistance with manuscript preparation.
G R A N T S
This work was supported by National Institute of Neurological Disorders andStroke Grant P01 NS-038310 and by a postdoctoral fellowship to F. Savelli fromthe International Human Frontier Science Organization (LT00683/2006-C).
D I S C L O S U R E S
No conflicts of interest are declared by the authors.
R E F E R E N C E S
Abraham WC, Logan B, Wolff A, Benuskova L. “Heterosynaptic” LTD inthe dentate gyrus of anesthetized rat requires homosynaptic activity. JNeurophysiol 98: 1048–1051, 2007.
Abraham WC, Robins A. Memory retention–the synaptic stability versusplasticity dilemma. Trends Neurosci 28: 73–78, 2005.
Artola A, Singer W. Long-term depression of excitatory synaptic transmis-sion and its relationship to long-term potentiation. Trends Neurosci 16:480–487, 1993.
Bailey CH, Kandel ER, Si K. The persistence of long-term memory: amolecular approach to self-sustaining changes in learning-induced synapticgrowth. Neuron 44: 49–57, 2004.
Barry C, Burgess N. Learning in a geometric model of place cell firing.Hippocampus 17: 786–800, 2007.
Barry C, Hayman R, Burgess N, Jeffery KJ. Experience-dependent rescal-ing of entorhinal grids. Nat Neurosci 10: 682–684, 2007.
Barry C, Lever C, Hayman R, Hartley T, Burton S, O’Keefe J, Jeffery K,Burgess N. The boundary vector cell model of place cell firing and spatialmemory. Rev Neurosci 17: 71–97, 2006.
Bear MF, Cooper LN, Ebner FF. A physiological basis for a theory ofsynapse modification. Science 237: 42–48, 1987.
Bienenstock EL, Cooper LN, Munro PW. Theory for the development ofneuron selectivity: orientation specificity and binocular interaction in visualcortex. J Neurosci 2: 32–48, 1982.
Blair HT, Welday AC, Zhang K. Scale-invariant memory representationsemerge from moire interference between grid fields that produce thetaoscillations: a computational model. J Neurosci 27: 3211–3229, 2007.
Bliss T, Collingridge G, Morris R. Synaptic plasticity in the hippocampus.In: The Hippocampus Book, edited by Andersen P, Morris R, Amaral D,Bliss T, O’Keefe J. New York: Oxford, 2007, p. 343–474.
Bostock E, Muller RU, Kubie JL. Experience-dependent modifications ofhippocampal place cell firing. Hippocampus 1: 193–205, 1991.
Brun VH, Otnass MK, Molden S, Steffenach HA, Witter MP, Moser MB,Moser EI. Place cells and place recognition maintained by direct entorhinal-hippocampal circuitry. Science 296: 2243–2246, 2002.
Brun VH, Solstad T, Kjelstrup KB, Fyhn M, Witter MP, Moser EI, MoserMB. Progressive increase in grid scale from dorsal to ventral medialentorhinal cortex. Hippocampus 18: 1200–1212, 2008.
Chawla MK, Guzowski JF, Ramirez-Amaya V, Lipa P, Hoffman KL,Marriott LK, Worley PF, McNaughton BL, Barnes CA. Sparse, envi-ronmentally selective expression of Arc RNA in the upper blade of therodent fascia dentata by brief spatial experience. Hippocampus 15: 579–586, 2005.
Colquhoun D, Jonas P, Sakmann B. Action of brief pulses of glutamate onAMPA/kainate receptors in patches from different neurons of rat hippocam-pal slices. J Physiol 458: 261–287, 1992.
Dayan P, Abbott LF. Theoretical Neuroscience: Computational and Mathe-matical Modeling of Neural Systems. Cambridge, MA: The MIT Press.2001.
Dayan P, Sejnowski TJ. The variance of covariance rules for associativematrix memories and reinforcement learning. Neural Comput 5: 205–209,1993.
de Almeida L, Idiart M, Lisman JE. The input-output transformation of thehippocampal granule cells: from grid cells to place fields. J Neurosci 29:7504–7512, 2009.
Drai D, Golani I. SEE: a tool for the visualization and analysis of rodentexploratory behavior. Neurosci Biobehav Rev 25: 409–426, 2001.
Drai D, Kafkafi N, Benjamini Y, Elmer G, Golani I. Rats and mice sharecommon ethologically relevant parameters of exploratory behavior. BehavBrain Res 125: 133–140, 2001.
Eichenbaum H, Yonelinas AP, Ranganath C. The medial temporal lobe andrecognition memory. Annu Rev Neurosci 30: 123–152, 2007.
3181GRID CELL TO PLACE CELL TRANSFORMATION
J Neurophysiol • VOL 103 • JUNE 2010 • www.jn.org
on Septem
ber 17, 2010 jn.physiology.org
Dow
nloaded from
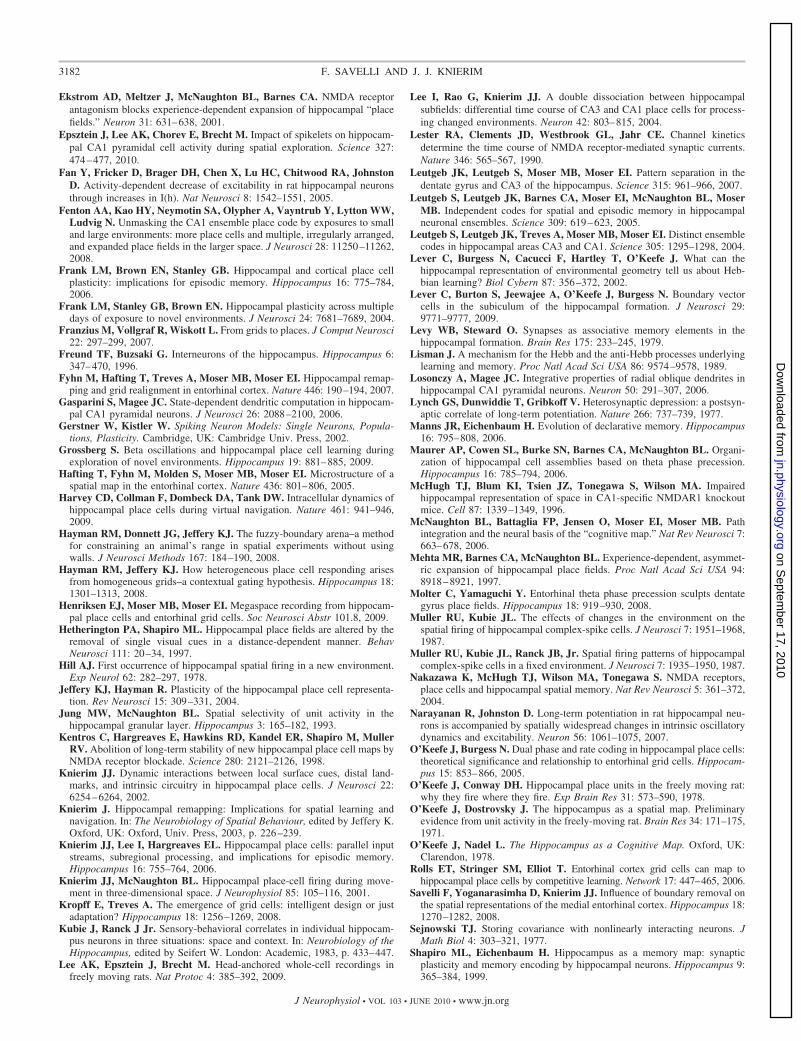
Ekstrom AD, Meltzer J, McNaughton BL, Barnes CA. NMDA receptorantagonism blocks experience-dependent expansion of hippocampal “placefields.” Neuron 31: 631–638, 2001.
Epsztein J, Lee AK, Chorev E, Brecht M. Impact of spikelets on hippocam-pal CA1 pyramidal cell activity during spatial exploration. Science 327:474–477, 2010.
Fan Y, Fricker D, Brager DH, Chen X, Lu HC, Chitwood RA, JohnstonD. Activity-dependent decrease of excitability in rat hippocampal neuronsthrough increases in I(h). Nat Neurosci 8: 1542–1551, 2005.
Fenton AA, Kao HY, Neymotin SA, Olypher A, Vayntrub Y, Lytton WW,Ludvig N. Unmasking the CA1 ensemble place code by exposures to smalland large environments: more place cells and multiple, irregularly arranged,and expanded place fields in the larger space. J Neurosci 28: 11250–11262,2008.
Frank LM, Brown EN, Stanley GB. Hippocampal and cortical place cellplasticity: implications for episodic memory. Hippocampus 16: 775–784,2006.
Frank LM, Stanley GB, Brown EN. Hippocampal plasticity across multipledays of exposure to novel environments. J Neurosci 24: 7681–7689, 2004.
Franzius M, Vollgraf R, Wiskott L. From grids to places. J Comput Neurosci22: 297–299, 2007.
Freund TF, Buzsaki G. Interneurons of the hippocampus. Hippocampus 6:347–470, 1996.
Fyhn M, Hafting T, Treves A, Moser MB, Moser EI. Hippocampal remap-ping and grid realignment in entorhinal cortex. Nature 446: 190–194, 2007.
Gasparini S, Magee JC. State-dependent dendritic computation in hippocam-pal CA1 pyramidal neurons. J Neurosci 26: 2088–2100, 2006.
Gerstner W, Kistler W. Spiking Neuron Models: Single Neurons, Popula-tions, Plasticity. Cambridge, UK: Cambridge Univ. Press, 2002.
Grossberg S. Beta oscillations and hippocampal place cell learning duringexploration of novel environments. Hippocampus 19: 881–885, 2009.
Hafting T, Fyhn M, Molden S, Moser MB, Moser EI. Microstructure of aspatial map in the entorhinal cortex. Nature 436: 801–806, 2005.
Harvey CD, Collman F, Dombeck DA, Tank DW. Intracellular dynamics ofhippocampal place cells during virtual navigation. Nature 461: 941–946,2009.
Hayman RM, Donnett JG, Jeffery KJ. The fuzzy-boundary arena–a methodfor constraining an animal’s range in spatial experiments without usingwalls. J Neurosci Methods 167: 184–190, 2008.
Hayman RM, Jeffery KJ. How heterogeneous place cell responding arisesfrom homogeneous grids–a contextual gating hypothesis. Hippocampus 18:1301–1313, 2008.
Henriksen EJ, Moser MB, Moser EI. Megaspace recording from hippocam-pal place cells and entorhinal grid cells. Soc Neurosci Abstr 101.8, 2009.
Hetherington PA, Shapiro ML. Hippocampal place fields are altered by theremoval of single visual cues in a distance-dependent manner. BehavNeurosci 111: 20–34, 1997.
Hill AJ. First occurrence of hippocampal spatial firing in a new environment.Exp Neurol 62: 282–297, 1978.
Jeffery KJ, Hayman R. Plasticity of the hippocampal place cell representa-tion. Rev Neurosci 15: 309–331, 2004.
Jung MW, McNaughton BL. Spatial selectivity of unit activity in thehippocampal granular layer. Hippocampus 3: 165–182, 1993.
Kentros C, Hargreaves E, Hawkins RD, Kandel ER, Shapiro M, MullerRV. Abolition of long-term stability of new hippocampal place cell maps byNMDA receptor blockade. Science 280: 2121–2126, 1998.
Knierim JJ. Dynamic interactions between local surface cues, distal land-marks, and intrinsic circuitry in hippocampal place cells. J Neurosci 22:6254–6264, 2002.
Knierim J. Hippocampal remapping: Implications for spatial learning andnavigation. In: The Neurobiology of Spatial Behaviour, edited by Jeffery K.Oxford, UK: Oxford, Univ. Press, 2003, p. 226–239.
Knierim JJ, Lee I, Hargreaves EL. Hippocampal place cells: parallel inputstreams, subregional processing, and implications for episodic memory.Hippocampus 16: 755–764, 2006.
Knierim JJ, McNaughton BL. Hippocampal place-cell firing during move-ment in three-dimensional space. J Neurophysiol 85: 105–116, 2001.
Kropff E, Treves A. The emergence of grid cells: intelligent design or justadaptation? Hippocampus 18: 1256–1269, 2008.
Kubie J, Ranck J Jr. Sensory-behavioral correlates in individual hippocam-pus neurons in three situations: space and context. In: Neurobiology of theHippocampus, edited by Seifert W. London: Academic, 1983, p. 433–447.
Lee AK, Epsztein J, Brecht M. Head-anchored whole-cell recordings infreely moving rats. Nat Protoc 4: 385–392, 2009.
Lee I, Rao G, Knierim JJ. A double dissociation between hippocampalsubfields: differential time course of CA3 and CA1 place cells for process-ing changed environments. Neuron 42: 803–815, 2004.
Lester RA, Clements JD, Westbrook GL, Jahr CE. Channel kineticsdetermine the time course of NMDA receptor-mediated synaptic currents.Nature 346: 565–567, 1990.
Leutgeb JK, Leutgeb S, Moser MB, Moser EI. Pattern separation in thedentate gyrus and CA3 of the hippocampus. Science 315: 961–966, 2007.
Leutgeb S, Leutgeb JK, Barnes CA, Moser EI, McNaughton BL, MoserMB. Independent codes for spatial and episodic memory in hippocampalneuronal ensembles. Science 309: 619–623, 2005.
Leutgeb S, Leutgeb JK, Treves A, Moser MB, Moser EI. Distinct ensemblecodes in hippocampal areas CA3 and CA1. Science 305: 1295–1298, 2004.
Lever C, Burgess N, Cacucci F, Hartley T, O’Keefe J. What can thehippocampal representation of environmental geometry tell us about Heb-bian learning? Biol Cybern 87: 356–372, 2002.
Lever C, Burton S, Jeewajee A, O’Keefe J, Burgess N. Boundary vectorcells in the subiculum of the hippocampal formation. J Neurosci 29:9771–9777, 2009.
Levy WB, Steward O. Synapses as associative memory elements in thehippocampal formation. Brain Res 175: 233–245, 1979.
Lisman J. A mechanism for the Hebb and the anti-Hebb processes underlyinglearning and memory. Proc Natl Acad Sci USA 86: 9574–9578, 1989.
Losonczy A, Magee JC. Integrative properties of radial oblique dendrites inhippocampal CA1 pyramidal neurons. Neuron 50: 291–307, 2006.
Lynch GS, Dunwiddie T, Gribkoff V. Heterosynaptic depression: a postsyn-aptic correlate of long-term potentiation. Nature 266: 737–739, 1977.
Manns JR, Eichenbaum H. Evolution of declarative memory. Hippocampus16: 795–808, 2006.
Maurer AP, Cowen SL, Burke SN, Barnes CA, McNaughton BL. Organi-zation of hippocampal cell assemblies based on theta phase precession.Hippocampus 16: 785–794, 2006.
McHugh TJ, Blum KI, Tsien JZ, Tonegawa S, Wilson MA. Impairedhippocampal representation of space in CA1-specific NMDAR1 knockoutmice. Cell 87: 1339–1349, 1996.
McNaughton BL, Battaglia FP, Jensen O, Moser EI, Moser MB. Pathintegration and the neural basis of the “cognitive map.” Nat Rev Neurosci 7:663–678, 2006.
Mehta MR, Barnes CA, McNaughton BL. Experience-dependent, asymmet-ric expansion of hippocampal place fields. Proc Natl Acad Sci USA 94:8918–8921, 1997.
Molter C, Yamaguchi Y. Entorhinal theta phase precession sculpts dentategyrus place fields. Hippocampus 18: 919–930, 2008.
Muller RU, Kubie JL. The effects of changes in the environment on thespatial firing of hippocampal complex-spike cells. J Neurosci 7: 1951–1968,1987.
Muller RU, Kubie JL, Ranck JB, Jr. Spatial firing patterns of hippocampalcomplex-spike cells in a fixed environment. J Neurosci 7: 1935–1950, 1987.
Nakazawa K, McHugh TJ, Wilson MA, Tonegawa S. NMDA receptors,place cells and hippocampal spatial memory. Nat Rev Neurosci 5: 361–372,2004.
Narayanan R, Johnston D. Long-term potentiation in rat hippocampal neu-rons is accompanied by spatially widespread changes in intrinsic oscillatorydynamics and excitability. Neuron 56: 1061–1075, 2007.
O’Keefe J, Burgess N. Dual phase and rate coding in hippocampal place cells:theoretical significance and relationship to entorhinal grid cells. Hippocam-pus 15: 853–866, 2005.
O’Keefe J, Conway DH. Hippocampal place units in the freely moving rat:why they fire where they fire. Exp Brain Res 31: 573–590, 1978.
O’Keefe J, Dostrovsky J. The hippocampus as a spatial map. Preliminaryevidence from unit activity in the freely-moving rat. Brain Res 34: 171–175,1971.
O’Keefe J, Nadel L. The Hippocampus as a Cognitive Map. Oxford, UK:Clarendon, 1978.
Rolls ET, Stringer SM, Elliot T. Entorhinal cortex grid cells can map tohippocampal place cells by competitive learning. Network 17: 447–465, 2006.
Savelli F, Yoganarasimha D, Knierim JJ. Influence of boundary removal onthe spatial representations of the medial entorhinal cortex. Hippocampus 18:1270–1282, 2008.
Sejnowski TJ. Storing covariance with nonlinearly interacting neurons. JMath Biol 4: 303–321, 1977.
Shapiro ML, Eichenbaum H. Hippocampus as a memory map: synapticplasticity and memory encoding by hippocampal neurons. Hippocampus 9:365–384, 1999.
3182 F. SAVELLI AND J. J. KNIERIM
J Neurophysiol • VOL 103 • JUNE 2010 • www.jn.org
on Septem
ber 17, 2010 jn.physiology.org
Dow
nloaded from

Shouval HZ, Bear MF, Cooper LN. A unified model of NMDA receptor-dependent bidirectional synaptic plasticity. Proc Natl Acad Sci USA 99:10831–10836, 2002.
Si B, Treves A. The role of competitive learning in the generation of DG fieldsfrom EC inputs. Cogn Neurodyn 3: 177–187, 2009.
Skaggs WE, McNaughton BL. Spatial firing properties of hippocampal CA1populations in an environment containing two visually identical regions. JNeurosci 18: 8455–8466, 1998.
Solstad T, Boccara CN, Kropff E, Moser MB, Moser EI. Representation ofgeometric borders in the entorhinal cortex. Science 322: 1865–1868, 2008.
Solstad T, Moser EI, Einevoll GT. From grid cells to place cells: a mathe-matical model. Hippocampus 16: 1026–1031, 2006.
Squire LR, Stark CE, Clark RE. The medial temporal lobe. Annu RevNeurosci 27: 279–306, 2004.
Tanila H, Shapiro ML, Eichenbaum H. Discordance of spatial representationin ensembles of hippocampal place cells. Hippocampus 7: 613–623, 1997.
Tchernichovski O, Benjamini Y. The dynamics of long-term exploration inthe rat. II. An analytical model of the kinematic structure of rat exploratorybehavior. Biol Cybern 78: 433–440, 1998.
Tchernichovski O, Benjamini Y, Golani I. The dynamics of long-termexploration in the rat. I. A phase-plane analysis of the relationship betweenlocation and velocity. Biol Cybern 78: 423–432, 1998.
Thompson LT, Best PJ. Long-term stability of the place-field activity ofsingle units recorded from the dorsal hippocampus of freely behaving rats.Brain Res 509: 299–308, 1990.
Ujfalussy B, Erõs P, Somogyvári Z, Kiss T. Episodes in space: a modellingstudy of hippocampal place representation. In: From Animal to Animats 10,edited by Asada M, Hallam JCT, Meyer J-A, Tani J. Berlin: Springer, 2008,p. 123–136.
Ujfalussy B, Kiss T, Erdi P. Parallel computational subunits in dentategranule cells generate multiple place fields. PLoS Comput Biol 5: e1000500,2009.
Vargha-Khadem F, Gadian DG, Watkins KE, Connelly A, Van PW,Mishkin M. Differential effects of early hippocampal pathology on episodicand semantic memory. Science 277: 376–380, 1997.
Vazdarjanova A, Guzowski JF. Differences in hippocampal neuronal popu-lation responses to modifications of an environmental context: evidence fordistinct, yet complementary, functions of CA3 and CA1 ensembles. JNeurosci 24: 6489–6496, 2004.
Wiener SI, Paul CA, Eichenbaum H. Spatial and behavioral correlates ofhippocampal neuronal activity. J Neurosci 9: 2737–2763, 1989.
Wilson MA, McNaughton BL. Dynamics of the hippocampal ensemble codefor space. Science 261: 1055–1058, 1993.
3183GRID CELL TO PLACE CELL TRANSFORMATION
J Neurophysiol • VOL 103 • JUNE 2010 • www.jn.org
on Septem
ber 17, 2010 jn.physiology.org
Dow
nloaded from


![NEURurofisiologia - neurophysiology[1]](https://img.dokumen.tips/doc/110x75/5571f1d449795947648bb940/neururofisiologia-neurophysiology1.jpg)


