Embed Size (px)
Citation preview
FRAMING CHINA-MALAYSIA TRADERELATIONS BEYOND ASEAN: FACTORING
THE REGIONAL COMPREHENSIVEECONOMIC PARTNERSHIP
Evelyn S. DevadasonUniversity of Malaya, Malaysia
ABSTRACT
The paper frames the trade relationship between China and Malaysia within the context of ASEANand the impending RCEP. Specifically trade potentials are derived for the bilateral partnershipwithin the two structures to identify whether China's external options under the RCEP affect herrelationship with Malaysia. Potentials for trade expansion between China and Malaysia, estimatedthrough a three-dimensional panel gravity model, are found to be marginally lower under the RCEPstructure relative to ASEAN. More importantly, trade potentials appear exhaustedfor major productstraded under both contexts. This suggests a change (decline) in the trade posture of the China-Malaysia partnership as relative advantages are most likely to be altered under the expanded matrixof Chinese relations with RCEP members. In coping with the larger matrix structure, both nationsshould innovate new forms of bilateral cooperation, beyond trade, to enhance their strategic
partnership.
JEL Classifications: F14, F15, 053Keywords: China, Malaysia, ASEAN, RCEP, Trade PotentialsAuthor's Email Address:[email protected]
INTRODUCTION
The Regional Comprehensive Economic Partnership (RCEP) includes all ten members ofthe Association of Southeast Asian Nations (ASEAN) and the six free trade agreement(FTA) partners - China, Japan, South Korea, India, Australia and New Zealand. The RCEP,an ASEAN-centred proposal, was launched in 2012, with the likelihood of completion byend of2015. The 16 RCEP participating countries account for almost half of the world'spopulation, approximately 30 per cent of global gross domestic product (GDP) and over aquarter of world exports.
Since the inception of the RCEP, there has been a proliferation of studiesexamining the feasibility of this region-wide FTA in consolidating the various ASEAN+1
i
agreements (Urata, 2013; Fukunaga and Isono, 2013). The RCEP is expected to deepencurrent engagement that has already been achieved between ASEAN and her FTA partners,thereby reinforcing ASEAN centrality in the wider Asia-Pacific regional infrastructure(Leal-Arcas, 2013; Das, 2014). Fukunaga and Isono (2013) however point out that thecompeting initiatives under the trilateral FTA that launched its negotiation in March 2013,the China-Japan-Korea (CJK) FTN, is likely to have negative impacts on all ASEAN

economies due to trade and investment diversion. Since the RCEP also includes the threelarge tripartite economies, the RCEP framework may result in different dynamics in theengagement between China and the ASEAN economies (see also Panda, 2014). Under theRCEP expanded regional matrix of relations, China could change its posture towardsSoutheast Asia as new economic opportunities emerge. This issue is taken up in this paperby focusing specifically on China-Malaysia relations to identify how likely bilateralengagement through trade cooperation will play out with the RCEP relative to ASEAN3
•
To achieve this objective, the paper compares bilateral trade potentials for the China-Malaysia partnership within the narrow context of ASEAN4, from that of the expandedRCEP framework using a three-dimensional augmented panel gravity model. (AppendixTable 1 briefly profiles trade links between China and Malaysia).
The rest of this paper is organized as follows. Section 2 details the method anddata employed to estimate trade potentials in China-Malaysia partnership. Based on theestimated trade potentials in Section 2, the paper will then go on to discuss the implicationsfor the asymmetric China-Malaysia relationship beyond ASEAN to RCEP in Section 3.Section 4 concludes.
ESTIMATING TRADE POTENTIALS IN CHINA-MALAYSIA PARTNERSHIP:THE ASEAN VERSUS THE RCEP CONTEXTS
Interpretative Model
This paper employs the extended gravity model, developed by Chengang et al. (2010) basedon Baltagi et al. (2003) and Egger (2002), to derive trade potentials in China-Malaysiapartnership in the context of ASEAN and the RCEP. Using a panel data framework, thegravity equation is specified as follows:
InTRADEijt = /ldnGDPTijt + /l2SIMGDPijt + /l3lnGDij + /l4lnFDSTijt + /lsSIMFDSijt +/lrfiLFACijt + /l7DUMContigij + /lsDUMLandij + /l9DUMComlangij + G + eijt
where TRADEijt is country j's (reporter) total trade with country} (partner) in year t. Thetrade model identification above is particularly important when a gravity model is appliedto a single-country, instead to pairs of countries (Chan-Hyun, 2005). Since this studyexamines one-way bilateral trade flows in the context of China-A SEAN and China-RCEP,country j or the reporter country refers specifically to China. The other variables are asdefined below.GDPT= total GDP of countries i and}SIMGDP = similarity in the levels ofGDP in i and}GD = geographical distance between i and}FDST= total inward FDI stock ofj and}SIMFDS = similarity in inward FDI stocks in i and}RLFAC = relative factor endowments in j and}DUMContig = dummy variable set equal to 1 if j and} are contiguous, and 0 otherwiseDUMLand = dummy variable set equal to 1 if either i or} is a landlocked country, and 0
otherwise

DUMComlang = dummy variable set equal to 1 if i and j share a common official language,and 0 otherwise
In equation (1), /3 represents the coefficient estimates, G is time effects and f:ijt is a white-noise disturbance term.
The above equation follows from a standard gravity model comprising grossdomestic product (GDP) and geographical distance (GD) between countries, augmentedwith the stocks of inward foreign direct investment (FDS) and relative factor endowments(RLFAC) on the basis that the latter two variables are closely related to a country's tradecapabilities and transaction costs respectively. The following explains the theories thatunderlie the selection of the explanatory variables in equations (1) and (2), beginning withthe core variables of the gravity model.
The level ofGDP of both reporter and partner countries are supposed to positivelyaffect their trade. Instead of using the levels of GDP of both countries independently, thetotal GDP of both partners, GDPT, is included in the estimations to jointly captureeconomies of scale or the size effect. The higher the GDPT, the larger the trade flows,given that a greater division of labour and specialization becomes feasible under a largerscale of operation.
However, the level of GDP alone may not be sufficient to explain trade as thesimilarities of the two trading partners GDPs are of no less importance. From a theoreticalperspective, similarity in the level ofGDP (SIMGDP) or convergence in income levels (ortastes) is likely to increase trade either through the expansions in trade in manufactures orthe increase in scope for product diversity.
The next core argument of the gravity model is the GD variable. GD remainsimportant for considerations of transport costs (Egger, 2000), transaction costs (Bergstrand,1985; Edmonds et al., 2008) and timeliness in delivery (Rojid, 2006), and is included in theestimations. Thus, the expectations are for /33 < 0 (Tinbergen, 1962; Poyhonen, 1963).
Theoretically, foreign direct investment (FDI) contributes to intra-firm tradethrough global production networks and the increase in product variety in the host economy.This in tum increases the volume of trade, mainly through intra-industry trade (IIT).However, if FDI and trade are substitutes, for example if FDI is mainly channelled intodomestic production of the host economy, then, it does not necessarily contribute toexpansions in exports. As such, the relationship between FDS and international traderemains inconclusive.
The distribution of FDS amongst trade partners is also considered important forinternational trade. If the size of FDS is similar between trade partners, one may expectsimilar volumes and varieties of bilateral exports from the partner countries. Followingwhich, the import capabilities of both partner countries are also likely to be similar, leadingto expansions in bilateral trade. Conversely, if the size of FDS is uneven between tradepartners, the country with a smaller stock, offers less export capabilities and likewisesmaller import capabilities, resulting in lower expansions in bilateral trade. Based on thisreasoning, a positive relationship is envisaged between SIMFDS and trade.
Differences in factor endowments or factor intensity (capital-labour ratio or K/L)do matter for international trade (Debaere, 2003; Frankel et al., 1995; Ghosh and Yamarik,2004; Baxter and Kouparitsas, 2006; Cieslik, 2009). Traditional neoclassical trade theoriessuggest that comparative advantages based on differences in factor endowments explainbasically IT. Alternatively, newer trade theories based on economies of scale and productdifferentiation attribute similarities in factor endowments to trade expansions through IIT.

Thus, the differences and similarities of factor endowments (apart from SIMGDP) areclosely linked to the structure of trade. If the structure of trade is IT-based, differences infactor endowments' will most likely facilitate trade expansion vis-a-vis similarities in factorendowments. In this respect, the expected sign for /36 will be positive (negative) if'Tl' (lIT)dominates.
Finally, border or contiguity effects (DUMContig), landlocked effects(DUMLand), and common language (DUMComlang) are included in the baselineestimations. Common language is considered a measure of cultural distance. When twocountries speak the same language, it makes communication easy and reduces transactioncosts between them.
Empirical Strategy
The paper employs both the random effects (RE) and the Hausman and Taylor (henceforthHT, 1981) technique to estimate equation (1). The RE estimator is chosen for the followingreasons, despite the fact that the Fixed Effects (FE) estimator is much more common ingravity models than the RE estimator. The RE estimator has the advantage of not requiringthe exclusion of variables that are time invariant. In this case, both the distance (GD),border or contiguity effects (DUMContig), landlocked effects (DUMLand) and commonlanguage (DUMComlang) are invariant across time periods, and these variables are ofconsiderable interest to this study. Furthermore, all of the variables exhibit more variationin the data across country-pair-product group (between variation) than over time (withinvariation). This is not surprising given the large number of cross-section entities (based oncountry-pair-product groups) used for the estimations, which are believed to have someinfluence on bilateral trade. As such, a FE may not work well for data with minimal withinvariation or for variables that change slowly over time. Since FDI and new growth theoriessuggest that GDPT and FDST are likely to be endogenous, the HT technique is employed(see also Egger, 2002).
Based on the RE and HT estimations of the gravity model, China's trade potentialswith Malaysia are derived. Trade potentials, the ratio of predicted trade (p, arrived at bythe estimated value of the dependent variable) to actual/ observed trade (A), are comparedwithin the sample of China-ASEAN and China-RCEP, respectively. If the value of P/Aexceeds one (under-trading), then there is potential for expansion of trade with therespective country.
Data
The dataset includes China's trade with the 10 countries of the ASEAN (Malaysia,Singapore, Thailand, Philippines, Indonesia, Brunei, Cambodia, Laos, Myanmar andVietnam) and 15 countries of the RCEP (ASEANI0, Japan, South Korea, India, Australiaand New Zealand). The data span the period 1992-2012 (annual). The primary data onexport and import flows based on the Harmonized System (HS) nomenclature is derivedfrom the UN COMTRADE database. The data on GDP, labour force (L) and gross fixedcapital formation (GFCF) are sourced from the World Bank Development Indicators andGlobal Development Finance (online World dataBANK). The data on FDS is obtained from

the online database of the United Nations Conference on Trade and Development(UNCTAD), which is UNCTADstat. Data for GD on the basis of the average distancebetween the capitals for country-pairs and the information for country-pair contiguity(DUMContig), country-pair common language (DUMComlang) and landlocked(DUMLand) countries are extracted from the CEPII database. The definition andmeasurement of the key variables used in regression analysis are summarized in AppendixTable 2.
Potentials for expansions in the Chinese trade with Malaysia are estimatedseparately within the ASEAN and RCEP samples. The empirical estimations constitute athree-dimensional balanced panel of 30,555 observations (17 country-pairs x 97 productgroups x 21 years; the cross-section dimension relates to the country-pair-product group)for China-RCEP trade and 20,370 observations (10 country-groups x 97 product groups x21 years) for China-ASEAN trade. The broad product groups" in the cross-sectionaldimension refer to the 97 sectors at the Harmonized System (HS) 2-digit level, as listed inAppendix Table 3.
Results
Appendix Table 4 presents the results of the RE and HT models on the determinants of tradeflows in China-ASEAN and China-RCEP partnerships. Qualitatively, the HT results arefound to be similar to the RE estimates. Based on the HT estimations of the gravity model,China's trade potentials with Malaysia are derived and presented in Figure 1. Tradepotentials for the entire time span (1992-2012) are calculated on the basis of the averagevalues ofP and A across the 97 sectors.
Figure 1 caricatures the estimated trade potentials of China with Malaysia withinthe context of ASEAN and the RCEP. The results indicate that predicted trade isconsistently higher than actual trade for China-Malaysia partnership in the ASEAN context.However, there is less potentials for China to increase her trade with Malaysia within theexpanded RCEP framework. In both contexts, the spread between actual and predictedtrade flows remains rather close.
To further forward our understanding on trade potentials of China in Malaysiawithin the context of ASEAN and the RCEP, trade potentials are derived for the majorproducts traded in the bilateral China-Malaysia partnership. The product categoriesconsidered are HS85 and HS84 (see Appendix Table 3), which made up 43 per cent and 9per cent of total trade between China and Malaysia in 2012. Both product groups havedominated bilateral trade between China and Malaysia over the period of review. The plotsof the estimated trade potentials are presented in Figure 2.
Interestingly, potentials of China to increase trade with Malaysia in the HS85category appear to erode with time, while it remains exhausted for the HS84 category overthe period of review. The declining trade potentials in major products traded between bothparties suggest a need to broaden the base of China-Malaysia trade. Overtrading in productsof the HS85 category in the recent past reflects the density of networks in electronics withinAsia's regional trade, of which China is a central player. For 2012, China overtraded withMalaysia in 39 sectors and 58 sectors based on the derived trade potentials estimates fromthe China-A SEAN and China-RCEP members respectively.

FIGURE 1. CHINA: TRADE POTENTIALS WITH MALAYSIA, 1992-2012
1.10001.08001.06001.04001.02001.00000.9800
I 0.96000.94000.9200
1992 1994 1996 1998 2000 2002 2004 2006 2008 2010 2012
..... ASEAN ..... RCEP
Notes: Derived from the HTestimates in Appendix Table 3.Trade potentials refer to the ratio ofpredicted to actual values of trade flows.
FIGURE 2. CHINA: TRADE POTENTIALS WITH MAJOR SECTORS OFMALAYSIA, 1992-2012
HS85
1.80001.70001.60001.50001.40001.30001.20001.10001.00000.90000.8000
..... ASEAN ..... RCEP
HS84
0.8200
0.8000
0.7800
0.7600
0.7400
0.7200
0.7000
0.6800
0.6600N'<:t\OOOON'<:t\OOOON0'>0'>0'>0'>00000 __0'>0'>0'>0'>0000000----NN<"'INNNN
..... ASEAN ..... RCEP
Notes: Derivedfrom the HT estimates in Appendix Table 3 Trade potentials refer to the ratio ofpredicted to actual values of trade flows. HS85 - Electrical machinery, equipment parts thereof;
sound recorder etc.; and HS84 - Nuclear reactors, boilers, machinery and mechanicalappliances; parts.
Taken together, the results on the lower trade potentials of China with Malaysiaunder the expanded RCEP framework relative to the ASEAN region and the exhausted tradepotentials of China in Malaysia for a larger number of product categories within the RCEP,

imply changes in the Chinese trade posture towards Malaysia with the RCEP. The structuralmatrix of the RCEP members is likely to alter the relative advantages and trade interactionsbetween China and Malaysia. Supporting this fact are two observations noted from thedrivers of trade between China and her trading partners of ASEAN and RCEP. First,similarities in factor endowments drive China-ASEAN trade flows while differences infactor endowments govern China-RCEP trade. Second, the larger size effects on trade inthe RCEP relative to that of ASEAN reflect the inclusion of big economies in the former(see Appendix Table 4).
Neither sides can therefore control the likely changes linked to the expandingregional matrix and the asymmetric relationships that follow. In coping with the largermatrix of Chinese relations with the RCEP members, the focus on trade should no longerbe the major concern of the China-Malaysia bilateral partnership. The starting point is therecognition that any asymmetries (created by disparity in capacities) associated with therelationship between the Chinese regional power and smaller Malaysian partner should beconsidered normal (see also Womack, 2012). The asymmetries have in fact not disturbedtrade interdependence. Since exchanges cannot be equal, the task now is to manage bilateralasymmetries through a broader framing of the China-Malaysia relationship. What followsis a discussion on how asymmetry may be redefined and addressed in terms of bilateralcooperation in non-traditional areas.
MANAGING ASYMMETRIC7 RELATIONSHIP: BROADER FRAMING OFCHINA-MALAYSIA COOPERATION
Since economic pragmatism was made a central theme of Malaysia's China policy since the1980s (Cheng-Chwee, 2013), trade cooperation became the foundation of economiccollaboration between China and Malaysia. Trade interactions, boosted by complementaryeconomic structures between China and Malaysia, guide the process of mutual engagementbetween both economies to date. The consequences of the above is the current asymmetricbilateral cooperation in the China-Malaysia context, which calls for a scaling up of the scopeof cooperation. Cooperation beyond the traditional economic realm, more specifically, hasonly begun to surface in the last four years. Apart from trade, investment and finance hasbeen added as economic contact points in this partnership.
To boost bilateral investment cooperation, the twin industrial parks, the China-Malaysia Qinzhou Industrial Park (QIP, launched in 2012) and the Malaysia-China KuantanIndustrial Park (MCKIP) have been earmarked for this purpose. Likewise, to enhancefinancial linkages, in 2009, Bank Negara Malaysia (the country's central bank) and theChina Banking Regulatory Commission (CBRC) signed a memorandum of understanding(MOU) to forge cooperation between the two regulatory authorities on banking supervision.
Apart from investment and finance, higher education and tourism have been addedinto the list of commercial ties to generate robust links between both parties. In education,this involved the signing of a mutual recognition agreement on higher education (signed in2011) to boost education exchanges between the two nations; submissions of accreditationof higher learning institutions by both parties; and setting up ofaXiamen University branchcampus in Malaysia. As for tourism, the Malaysian Association of Tour and Travel Agents(MATTA) signed a memorandum of cooperation with the China Muslim Travel Association(CMTA) in 2011.

The so-called non-traditional nodes of cooperation are contingent on history,leadership and culture (Womack, 2010). The common understanding and growingconvergence of interests of both parties on 'Asian values' and 'multipolarity' has become afoundation for the partnership. Following which, visits of state to reaffirm and solidify therelationships has become embryonic and has transcended leadership changes in bothcapitals. A testimony to this from the Malaysian perspective is that both the successors ofMahathir Mohamad as Prime Minister, Abdullah Badawi and Najib Razak, chose China asthe first country outside ASEAN to visit upon taking office, in 2003 and 2009 respectively.
CONCLUDING REMARKS
Within the context of ASEAN and the impending RCEP, the paper examines the tradepotentials between China and Malaysia. The derived trade potentials for the China-Malaysia bilateral partnership are compared across the two regional structures to providesome indications whether China's external options can influence her relationship withMalaysia. The findings of the study are summarized as follows. First, lower potentials forChina's trade expansion with Malaysia are noted in the RCEP context relative to theASEAN. Second, China seems to be overtrading with Malaysia in a majority of sectorswithin the RCEP relative to the ASEAN. Comparisons of the potentials for trade expansionwithin both structures suggest a change (decline) in the trade posture of the China-Malaysiapartnership. A possible reason for this is that relative advantages are most likely to be alteredunder the expanded matrix of Chinese relations with RCEP vis-a-vis the ASEAN.
The study also provides indications on the direction of commercial ties betweenboth nations. Both countries, China and Malaysia, should innovate new forms of bilateralcooperation, beyond trade to enhance their strategic partnership. As the potentials to tradebetween China and Malaysia reduce (or even become exhausted) under the expandedrelations ofRCEP, the need to inject a fresh momentum in areas such as education, tourism,science and technology, becomes even more pressing to sustain and balance bilateralcooperation between China and Malaysia. From the Malaysian side, it is even more criticalto cultivate ties with China in these diverse areas, as China has many suitors. Further, theasymmetrical investment links between both parties bring to the fore the current gaps inbilateral cooperation. Malaysia's outward investment to China is six times that of theChinese investments in Malaysia.
Broader economic cooperation motivated by commercial payoffs should thereforebe the focus of the China-Malaysia partnership. The Five-Year Programme for Economicand Trade Cooperation that was recently signed by China and Malaysia in 20l3, providesfor the expanded (higher level) bilateral economic cooperation recommended in the paper,as it covers the entire spectrum of activities beyond trade in merchandise goods.
In the case of the China-Malaysia partnership, proximity and socio-culturallinkswill help facilitate bilateral cooperation in the various areas the mentioned above, and sub-national cooperation at the people-to-people level. In fact, the RCEP is also likely to paymore attention to physical, institutional and people-to-people connectivity (Das, 2014).With Malaysia taking the reins of ASEAN in 2015 and China's support for the RCEP, thelinks between China and Malaysia are expected to be strengthened.
APPENDIX TABLE 1. DATA NOTE ON CIDNA-MALAYSIA TRADE LINKS
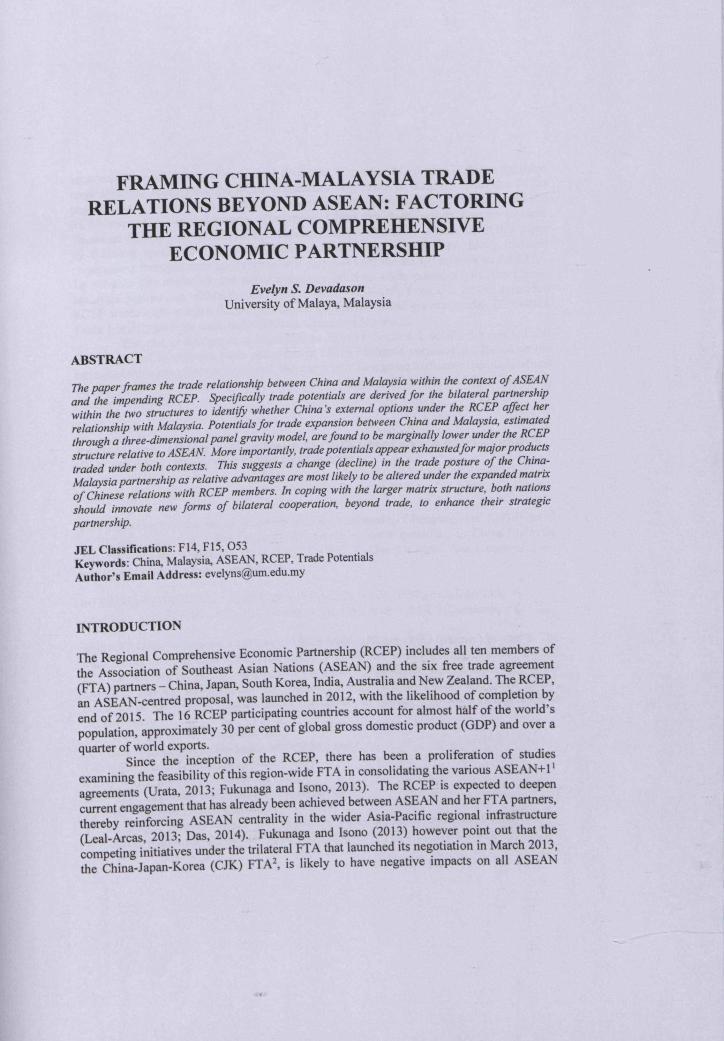
Being the first country in Southeast Asia to establish diplomatic relations with China thatdates back 40 years, it is not surprising to note that the Sino-Malaysia trade is tenacious andpersistent in character. The long relationship between both parties has culminated intoChina emerging as Malaysia's number one trading partner and likewise, Malaysia asChina's largest trading partner in Southeast Asia. China's trade with Malaysia increasedfrom US$1476 million US$94831 million between 1992 and 2012, recording an averageannual growth rate of 24 per cent. China and Malaysia are set to achieve a total bilateraltrade of US$160 billion by 2017. China, however, recorded consistent deficits for theperiod of review. The importance of China as a big import market is also well demonstratedin the trade patterns of Asia.
CHINA: BILATERAL TRADE WITH MALAYSIA, 1992-2012(IN US$ MILLION)
200000
til 150000ca 100000~
50000
1992 1994 1996 1998 2000 2002 2004 2006 2008 2010 2012..... Exports ...... Imports ..... Total Trade
Source: UN COMTRADE.
Based on market shares of China's trade with the ASEAN and RCEP members,Malaysia has grown in importance as a trading partner to the former over the decades.Malaysia constitutes 24 per cent and 8 per cent of total trade of China with ASEAN andRCEP in 2012, respectively. Malaysia is more important as an import source relative to anexport destination for China within the ASEAN region and the expanded RCEP.
MARKET SHARES OF MALAYSIA IN CIDNA'S TRADE (IN %)
with ASEAN with RCEPYear Exports Imports Total Trade Exports Imports Total Trade1992 13.83 18.81 16.25 3.28 3.63 3.472000 14.79 24.71 20.36 3.39 5.84 4.742012 17.88 29.77 23.70 6.85 8.95 8.01
Source: UN COMTRADE.

APPENDIX TABLE 2. DEFINITION ANDMEASUREMENT OF VARIABLES
Variable
TRADE
GDPT
SIMGDP
FDST
SIMFDS
Definition
Real exports
Total real GDP
Similarity in thelevels of GDP orrelative size of tradepartners
Total real inwardforeign direct investment(FDI) stock
Similarity in the inwardFDI stock of trade partners
Measurement
Total exports plus imports, expressed incurrent USD, deflated by the CPI index,with 2005 as the base year.
GDPTij = GDPi + GDPjwhere GDP, expressed in current USD,is deflated by the GDP deflator with 2005as the base year
CDp2SIMCDP'j = 1- '2
(CDP, + CDPj)where 0 S SIMGDPij S 0.5
If SIMGDPij = 0 (absolute divergence in size)SIMGDPij = 0.5 (equal country size)
FDSTij =FDSi + FDSj
For associate and subsidiary enterprises, it is thevalue of the share of their capital and reserves(including retained profits) attributable to theparent enterprise (this is equal to total assets minustotal liabilities), plus the net indebtedness of theassociate or subsidiary to the parent firm. Forbranches, it is the value of fixed assets and thevalue of current assets and investments,
excluding the amounts due from the parent, lessthe liabilities to third parties. The FDS, expressedin current USD, is deflated by the CPI index with2005 as the base year.
FDS2SIMFDS'j = 1- ,
(FDS, + FDSj)2
Variable Definition Measurement
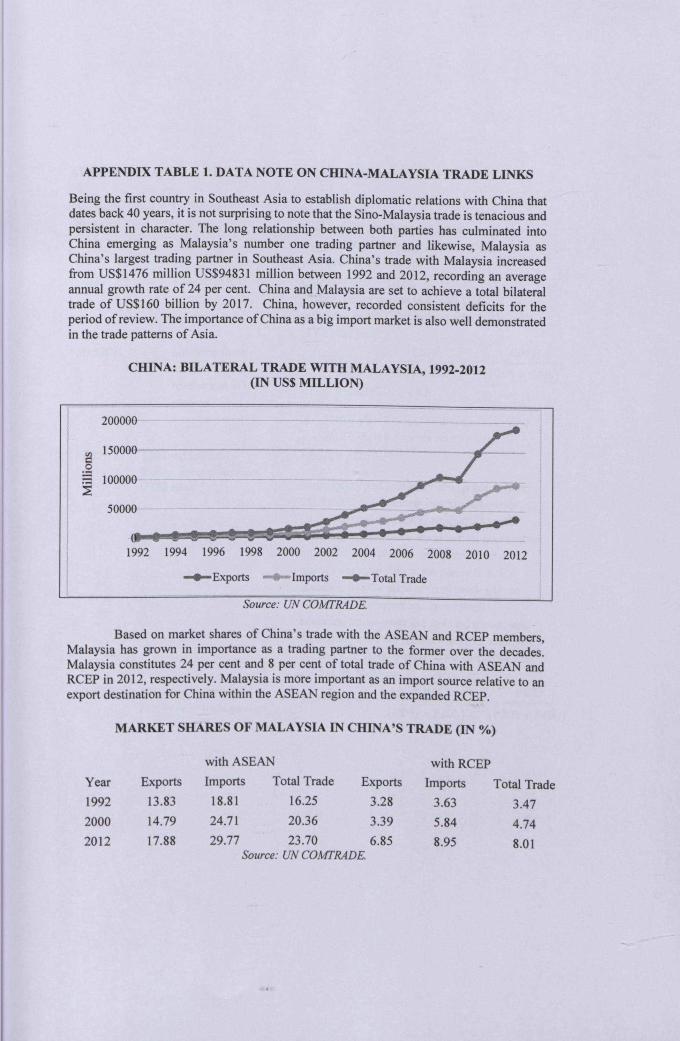
RLFAC Similarity in capital- RLFACij = Iln(Kjt!Ljt)-1n(Kit!Lit)1labour ratios or thedistance between where K = capital stock; and L = labour force
countries in terms ofIf RLFACij = 0 (same proportion of factor endowments)relative factor
endowments The estimated capital stock is K, = GFCFt + (1 -1i)Kt-1
Total labour force comprises people ages 15 and olderwho meet the International Labour Organization definitionof the economically active population.
The GFCF consists of outlays on additions to the fixedassets (land improvements, plant, machinery and equipmentpurchases; construction of roads, railways and the like) ofthe economy plus the net changes in the level of inventories.The GFCF, expressed in current USD, is deflated by the CPIindex with 2000 as the base year. Using the data on GFCF,K is estimated using the standard perpetual inventorycalculation method (Miller & Upadhyay, 2000):
Ko = GFCFo / [/..gd+ (1 - /..)gw + Ii ]
where the initial or base year is 1970.
gd = average growth rate of the GDP series for the relatedcountry for the period of review
gw = estimated average world growth rate for the period ofreview
/..= 0.25, measure of mean reversion in growth ratesIi= 0.05, assumed rate of depreciation
GD Geographical distance The average distance (in kilometres) between the capitalsofi andj.

APPENDIX TABLE 3. PRODUCT DESCRIPTION
HS Code
01Description
Live animals
02 Meat and edible meat offal
03 Fish & crustacean, mollusc & other aquatic invertebrate
04 Dairy products; bird's eggs; natural honey; edible product nes
05 Products of animal origin, nes or included
06 Live tree & other plants; bulb, root; cut flowers etc.
07 Edible vegetables, certain roots & tubers
08 Edible fruit & nuts; peel of citrus fruit or melons
09 Coffee, tea, mate & spices
10 Cereals
11 Product milling industry; malt; starches; inulin; wheat gluten
12 Oil seed, oleage fruits; miscellaneous grain, seed, fruit etc.
13 Lac; gums, resin, other vegetable saps & extracts
14 Vegetable plaiting materials; vegetable products nes
15 Animal/vegetable fats & oils & their cleavage products etc.
16 Preparation of meat, fish or crustaceans, molluscs etc.
17 Sugars & sugar confectionary
18 Cocoa & cocoa preparation
19 Preparation of cereal, flour, starch/milk; pastry cooks' products
20 Preparation of vegetable, fruit, nuts or other parts of plants
21 Miscellaneous edible preparations
22 Beverages, spirits & vinegar
23 Residues & waste from the food industry; preparation animal fodder
24 Tobacco & manufactured tobacco substitutes
25 Salt; sulphur; earth & stone; plastering mat; lime & cement
26 Ores, slag & ash
27 Mineral fuels, oils & product of their distillation etc.
28 Inorganic chemicals; compounds of precious metals; radioactive elements etc.
29 Organic chemicals
30 Pharmaceutical products
31 Fertilisers
32 Tanning/dyeing extract; tannins & derives; pigments etc.
33 Essential oils & resinoids; perfumes; cosmetic/toilet preparation

HS Code
34
3536
37
38
39
4041
42
43
44
45
46
47
48
495051
52
5354
5556
57
58
59
6061
6263
64
65
66
Description
Soap, organic surface-active agents, washing preparation etc.
A1buminoidal substance; modified starches; glues; enzymes
Explosives; pyrotechnic products; matches; pyrophoric alloy etc.
Photographic or cinematographic goods
Miscellaneous chemical products
Plastics & articles thereof
Rubber & articles thereof
Raw hides and skins (other than fur skins) & leather
Articles of leather; saddlery/hamess; travel goods etc.
Fur skins & artificial fur; manufactures thereof
Wood & articles of wood; wood charcoal
Cork & articles of cork
Manufactures of straw, esparto/other plaiting material etc.
Pulp of wood/of other fibrous cellulosic material; waste etc.
Paper & paperboard; art of paper, pulp, paper/paperboard
Printed books, newspapers, pictures & other products etc.
Silk
Wool, fine/coarse animal hair, horsehair yarn & fabric
Cotton
Other vegetable textile fibres; paper yam & woven fabric
Man-made filaments
Man-made staple fibres
Wadding, felt & nonwoven; yams; twine, cordage etc.
Carpets and other textile floor coverings
Special woven fabric; tufted textile fabric; lace; tapestries etc.
Impregnated, coated, coverllaminated textile fabric etc.
Knitted or crocheted fabric
Articles of apparel & clothing access, knitted or crocheted
Articles of apparel & clothing access, not knitted/crocheted
Other made up textile articles; sets; worn clothing etc.
Footwear, gaiters & the like; parts of such articles
Headgear & parts thereof
Umbrellas, walking sticks, seat sticks, whips etc.

HS Code
67686970
71
7273
7475
767779
8081
8283
8485
8687
88899091
9293
9495
9697
99
Description
Prepared feathers & down; artificial flowers; articles of human hair
Art of stone, plaster, cement, asbestos, mica/sim mat
Ceramic products
Glass & glassware
Natural/cultured pearls, precious stones & metals, coin etc.
Iron & steel
Articles of iron or steel
Copper & articles thereof
Nickel & articles thereof
Aluminium & articles thereof
Lead & articles thereof
Zinc & articles thereof
Tin & articles thereof
Other base metals; cements & articles thereof
Tools, implements, cutlery, spoon & fork, of base metal etc.
Miscellaneous articles of base metal
Nuclear reactors, boilers, machinery & mechanical appliance; parts
Electrical machinery, equipment parts thereof; sound recorder etc.
Railway/tramway locomotives, rolling stock & parts thereof etc.
Vehicles other than railway/tramway rolling stock, parts & accessories
Aircraft, spacecraft & parts thereof
Ships, boats & floating structures
Optical, photo, cine, checking, precision etc.
Clocks, watches & parts thereof
Musical instruments; parts & accessories of such articles
Arms & ammunition; parts & accessories thereof
Furniture. bedding, mattress, material support, cushion etc.
Toys, games & sports requisites; parts & accessories thereof
Miscellaneous manufactured articles
Works of art, collectors' pieces & antiques
Commodities, nes

APPENDIX TABLE 4. DETERMINANTS OF TRADE FLOWS
China-ASEAN China-RCEPVariables RE HT RE HT
InGDPT 0.198 0.171 ** 0.980*** 0.862***(0.135) (0.088) (0.129) (0.063)
SIMGDP 0.062*** 0.062*** 0.031 *** 0.028***(0.009) (0.004) (0.004) (0.002)
InGD -2.826*** -2.693*** -0.938**** -0.967***(0.722) (0.799) (0.129) (0.182)
InFDST -3.057*** -2.802*** -0.081 0.166(0.622) (0.723) (0.254) (0.266)
SIMFDS 0.054*** 0.045*** 0.035*** 0.028***(0.008) (0.008) (0.004) (0.003)
RLFAC -0.184* -0.106* 0.136* 0.194***(0.100) (0.056) (0.075) (0.041)
DUMContig -0.274 -0.236 -0.594** -0.514**(0.362) (0.419) (0.236) (0.263)
DUMComlang 3.490*** 3.535*** 1.580*** 1.586***(0.346) (0.395) (0.227) (0.303)
DUMLandlocked -3.737*** -3.876*** -4.164*** -4.434***(0.550) (0.504) (0.530) (0.452)
Constant 115.656*** 108.478*** -3.585 -6.514(17.978) (20.644) (7.867) (7.455)
Year effects Yes Yes Yes YesNo. of observations 20370 20370 30555 30555No. of groups 970 970 1455 1455R2 overall 0.317 0.319Wald test 1993.36 7078.25 2802.98 11562.76Breusch-Pagan LM test 85015.88 140000
Notes: The dependent variable is InTRADE. RE - random effects; HT -Hausman-Taylor. Standarderrors are in parentheses. ***, **, and * show 1%, 5%, and 10% significance, respectively.

ENDNOTES
1 ASEAN has signed the trade in goods agreement with all six FTA partners, ASEAN-China FTA(ACFTA), ASEAN-Japan Comprehensive Economic Partnership (AJCEP), ASEAN-Republic ofKorea FTA (AKFTA), ASEAN-India FTA (AIFTA) and ASEAN-Australia- New Zealand FTA(AANZFTA).2 The CJK accounts for 72.2 per cent ofGDP within the RCEP and contributes 21 per centof total intra-regional trade.3 It is justified to compare China-Malaysia relations within ASEAN and RCEP since the RCEP isgenerally seen as an 'ASEAN-t+' formula Further, China views RCEP as an extension of China-ASEAN engagement (panda, 2014).4 ASEAN and China enacted a FTA (ASEAN-China FTA or ACFTA) in goods trade in July 2005and completed the liberalization process in January 2010.5. It should be borne in mind that differences in factor endowments are also crucial in determining
vertical liT, but, to a lesser degree (Chan-Hyun, 2005).6. This level of aggregation balances the issue of disaggregatedversus aggregated analysis and also
reduces the problem of a standard sample selection bias.7 Asymmetries refer to the bilateral lopsided cooperation in terms of the focus of engagement in thepast; managing asymmetries include mUIti-lateralizing(or broadening) cooperation to non-traditionalareas.
REFERENCES
Baitagi, Badi, R., Egger, P. and Pfaffermayr, M., "A Generalized Design forBilateral Trade Flow Models", Economics Letters, 2003, Vol. 80, No.3, pp. 391-397.
Baxter, Marianne and Kouparitsas, M.A., "What Determines Bilateral TradeFlows?" NBER Working Paper No.12188 (Cambridge Massachusetts: National Bureau ofEconomic Research, 2006), accessed December 12, 2011,http://cid.bqp.gob.peibiblio/papers/nber/2006/abril/w 12188.pdf;
Bergstrand, Jeffrey, R., "The Gravity Equation in International Trade: SomeMicroeconomic Foundations and Empirical Evidence", Review of Economics and Statistics,1985, Vol. 67, No.3, pp. 474-481;
Chan-Hyun Sohn, "Does the Gravity Model Explain South Korea's Trade Flows?"Japanese Economic Review, 2005, Vol. 56, No.4, pp. 417-430.
Chengang Wang, Wei, Y. and Liu, x., "Determinants of Bilateral Trade Flows inDECD Countries: Evidence from Gravity Panel Data Models", World Economy, 2010, Vol.33, No.7, pp. 894-915.
Cheng-Chwee, Kuik, "Making Sense of Malaysia's China Policy: Asymmetry,Proximity, and Elite's Domestic Authority", Chinese Journal of International Politics,2013, Vol. 6, No.4, pp. 429-467.
Cieslik, Andrzej, "Bilateral Trade Volumes, the Gravity Equation and FactorProportions", Journal of International Trade and Economic Development, 2009, Vol. 18,No.1, pp. 37-59.
Das, Sanchita Basu, The Political Economy of the Regional ComprehenSiveEconomic Partnership (RCEP) and the Trans-Pacific Partnership (TPP) Agreements: AnASEAN Perspective (Singapore: Institute of Southeast Asian Studies (ISEAS), 2014).
Debaere, Peter, "Relative Factor Abundance and Trade", Journal of PoliticalEconomy, 2003, Vol. 11, No.3, pp. 589-610.
Edmonds, Cristopher, Croix, S.L. and Yao L., "China Trade: Busting Gravity'sBounds", Journal of Asian Economies, 2008, Vol. 19, Nos. 5-6, pp. 455-466.
Egger, Peter, H., "A Note on the Proper Econometric Specification of the GravityEquation", Economics Letters, 2000, Vol. 66, No.1, pp. 25-31.
Egger, Peter, H., "An Econometric View on the Estimation of Gravity Models andthe Calculation of Trade Potentials", World Economy, 2002, Vol. 25, No.2, pp. 297-312.
Frankel, Jeffrey, Stein, E. and Shang-Jin W., "Trading Blocs and the Americas:The Natural, the Unnatural and the Supernatural", Journal of Development Economics,1995, Vol. 47, No.1, pp. 61-95.
Fukunaga, Yoshifumi and Isono, I., "Taking ASEAN+ 1 FTAs towards the RCEP:A Mapping Study", ERIA Discussion Paper 2013-02 (Tokyo: Economic Research Institutefor ASEAN and East Asia, ERIA, 2013), accessed February 14, 2014,http://www.eria.orglERIA-DP-2013-02.pdf
Ghosh, Sucharita and Yamarik, S., "Are Regional Trading Arrangements TradeCreating? An Application of Extreme Bounds Analysis", Journal of InternationalEconomics, 2004, Vol. 63, No.2, pp. 369-395.
Hausman, Jerry A. and Taylor, W.E., "Panel Data and Unobservable IndividualEffects", Econometrica, 1981, Vol. 49, No.6, pp.1377-1398.
Leal-Areas, Rafeal, "China and thee Regional Comprehensive EconomicPartnership", Journal of Global Policy and Governance, 2013, Vol. 2, No.2, pp. 287-304.
Miller, Stephen M. and Upadhay, M.P., "The Effects of Openness, TradeOrientation and Human Capital on Total Factor Productivity", Journal of DevelopmentEconomics, 2000, Vol. 63, No.2, pp. 399-423.
Panda, Jagannath P., "Factoring the RCEP and the TPP: China, India and thePolitics of Regional Integration", Strategic Analysis, 2014, Vol. 38, No.1, pp.49-67.
Poyhonen, Pertti, "A Tentative Model for the Volume of Trade betweenCountries", Weltwirtschafliches Archiv, 1963, Vol. 90, No.1, pp. 93-99.
Rojid, Sawkut, "COMESA Trade Potential: A Gravity Approach", AppliedEconomics Letters, 2006, Vol. 13, No. 14, pp. 947-951.
Tinbergen, Jan, Shaping the World Economy: Suggestions for an InternationalEconomic Policy (New York: Twentieth Century Fund, 1962).
Urata, Shujiro, Constructing and multilateralizing the Regional ComprehensiveEconomic Partnership: an Asian Perspective, ADBI Working Paper Series No. 449 (Tokyo:Asian Development Bank Institute, ADBI, 2013), accessed February 14, 2014,http://www.adbi.org/files/2013.12.02.wp449.regional.economic.partnership.asia.pdf
Womack, Brantly, China Among Unequals: Asymmetric Foreign Relationships inAsia (Singapore: World Scientific, 2010).


![Norfolk Post (Norfolk, Va.) 1865-08-25 [p ] · Rt shields in thecityofNorfolk orPortsmouth, desir-lug thepaper left regularly attheir houses or places of business, will be served](https://img.dokumen.tips/doc/110x75/5e7113f37711622684032e23/norfolk-post-norfolk-va-1865-08-25-p-rt-shields-in-thecityofnorfolk-orportsmouth.jpg)

![Defect detection in FSW steel plates by NDT methodsijrpublisher.com/gallery/361-december-2018.pdfInspection of Hull Welds’. Anish Kumar et al [3] in thePaper titled “Development](https://img.dokumen.tips/doc/110x75/5f96529d6980c142dd4f6526/defect-detection-in-fsw-steel-plates-by-ndt-inspection-of-hull-weldsa-anish-kumar.jpg)


![Evaluating the Academic Performance of K-12 Students in the ...children[18].Albert[18]maintainsthattheissueofout-of school children in the Philippines is associated with psy- chological,health,andeconomicfactors.Assuch,thepaper](https://img.dokumen.tips/doc/110x75/6100656790e1ed483f6778ed/evaluating-the-academic-performance-of-k-12-students-in-the-children18albert18maintainsthattheissueofout-of.jpg)