Embed Size (px)
Citation preview

Fourth Quarter 2020March 9, 2021 – 11:00 AM ET
INVESTOR PRESENTATION

Continuing OperationsFinancial results are on a continuing operations basis, which excludes the Performance Materials business from all quarterly and yearly results presented, unless otherwise indicated.
Forward-Looking StatementsSome of the information contained in this presentation, the conference call during which this presentation is reviewed and any discussions that follow constitutes “forward-looking statements”. Forward-looking statements can be identified by words such as “anticipates,” “intends,” “plans,” “seeks,” “believes,” “estimates,” “expects,” “projects” and similar references to future periods. Forward-looking statements are based on our current expectations and assumptions regarding our business, the economy and other future conditions. Because forward-looking statements relate to the future, they are subject to inherent uncertainties, risks and changes in circumstances that are difficult to predict. Examples of forward looking statements include, but are not limited to, statements regarding the sale of the Performance Chemicals business segment, including the intended uses of proceeds therefrom, our future results of operations, financial condition, liquidity, prospects, growth, strategies, capital allocation programs, product and service offerings and end use demand trends, including the impact of the COVID-19 pandemic on such items, and financial 2021 outlook. Our actual results may differ materially from those contemplated by the forward-looking statements. We caution you, therefore, against relying on any of these forward-looking statements. They are neither statements of historical fact nor guarantees or assurances of future performance. Important factors that could cause actual results to differ materially from those in the forward-looking statements include, but are not limited to, our ability to close on the sale of the Performance Chemicals business segment on our anticipated timeline, or at all, our ability to successfully integrate Chem32, regional, national or global political, economic, business, competitive, market and regulatory conditions, including the ongoing COVID-19 pandemic, tariffs, and trade disputes, currency exchange rates and other factors, including those described in the sections titled “Risk Factors” and “Management Discussion & Analysis of Financial Condition and Results of Operations” in our filings with the SEC, which are available on the SEC’s website at www.sec.gov. Any forward-looking statement made by us in this presentation, the conference call during which this presentation is reviewed and any discussions that follow speaks only as of the date on which it is made. Factors or events that could cause our actual results to differ may emerge from time to time, and it is not possible for us to predict all of them. We undertake no obligation to update any forward-looking statement, whether as a result of new information, future developments or otherwise, except as may be required by applicable law.
Non-GAAP Financial MeasuresThis presentation includes certain non-GAAP financial measures, including adjusted EBITDA, adjusted EBITDA margin, adjusted free cash flow and net debt, which are provided to assist in an understanding of our business and its performance. These non-GAAP financial measures should be considered only as supplemental to, and not as superior to, financial measures prepared in accordance with GAAP. Non-GAAP financial measures should be read only in conjunction with consolidated financials prepared in accordance with GAAP. Reconciliations of non-GAAP measures to the relevant GAAP measures are provided in the appendix of this presentation.The Company is not able to provide a reconciliation of the Company’s non-GAAP financial guidance to the corresponding GAAP measures without unreasonable effort because of the inherent difficulty in forecasting and quantifying certain amounts necessary for such a reconciliation such as certain non-cash, nonrecurring or other items that are included in net income and EBITDA as well as the related tax impacts of these items and asset dispositions / acquisitions and changes in foreign currency exchange rates that are included in cash flow, due to the uncertainty and variability of the nature and amount of these future charges and costs.
Zeolyst Joint VentureZeolyst International and Zeolyst C.V. (our 50% owned joint ventures that we refer to collectively as the “Zeolyst Joint Venture”), are accounted for as an equity method investment in accordance with GAAP. The presentation of the Zeolyst Joint Venture’s sales in this presentation represents 50% of the sales of the Zeolyst Joint Venture. We do not record sales by the Zeolyst Joint Venture as revenue and such sales are not consolidated within our results of operations. However, our adjusted EBITDA reflects our share of the earnings of the Zeolyst Joint Venture that have been recorded as equity in net income from affiliated companies in our consolidated statements of income for such periods and includes Zeolyst Joint Venture adjustments on a proportionate basis based on our 50% ownership interest. Accordingly, our adjusted EBITDA margins are calculated including 50% of the sales of the Zeolyst Joint Venture for the relevant periods in the denominator.
LEGAL DISCUSSION
2

ACHIEVEMENTS OVER THE PAST YEAR
3
o Delivered on key targets including adjusted FCF of $153 milliono Continued to reduce debt and reinvest in business while also
returning $245 million of cash to shareholders
o Significant actions toward higher-growth, expanded margin potential for “Target PQ” portfolio: Signed definitive agreement to sell Performance Chemicals business
and closed on sale of Performance Materials business at attractive valuations Acquired Chem32, a niche catalysts service company to complement Refining Services
o > 45% safety improvement versus 2019; top quartile industry performanceo ~ 27% Adjusted EBITDA margins demonstrate strength and stability of platform
OPERATIONAL
FINANCIAL
STRATEGIC
FOCUS AREA HIGHLIGHTS
COMMERCIAL
PQ Marked by Sound Operations, Differentiating Technologies, New Capital Allocation Strategy and Sustainable Businesses with Valuation Uplift Potential
o Completed meaningful new long term supply agreement in Refining Serviceso Executed new supply agreement and extended contract within Silica Catalystso Commercialized two new customer products for diesel emission control

4
BUSINESS
2020 % TOTAL SALES1
Refining Services2
Regeneration for Fuel Catalyst Recycling
Virgin Sulfuric Acid for Automotive, Electronics & Industrial
~35%
~30%
(1) Sales percentage includes proportionate 50% share of sales from Zeolyst JV. Sales percentages are % of total 2020 sales by Refining Services and Catalysts business segments.(2) Refining Services reflects its two largest end uses with an aggregation of smaller end uses of natural resources and packaging & engineered plastics into industrial & process chemicals.
Major product lines, regeneration services and virgin sulfuric acid are aligned to these summarized end uses(3) Catalysts sales includes proportionate 50% share of sales from Zeolyst JV, which serves packaging & engineered plastics and fuels & emission controls end usesSource: U.S. Energy Information Administration; Rhein Associates; PQ Estimates
EXPECTED DEMAND TRENDS
EXPECTED 2021 DEMAND TREND
• 2H 2020 sulfuric acid demand improvement resulted in 2020 demand flat to 2019
• 2021 demand growth expected at 4-5% vs 2020 driven by the recovery of automotive production and a strong mining sector – particularly copper
• Gasoline demand ~10% below 2019 levels until vaccine widely distributed• Q1 ice storm impacted Gulf Coast production• Expect production to ramp for summer season; alkylate demand growth to
continue in 2022+ driven by higher octane fuel blending
Catalysts3
Packaging and Engineered Plastics
Fuels & Emission Control
~20%
~15%
• Lower refinery production during 2020 caused ~ 6 month extension of catalyst bed life
• 2H refinery turnaround schedule is stronger than H1 and continued demand growth in 2022
• Refinery emission control for heavy duty diesel is recovering quickly primarily due to improvement in Europe and China demand
• Strong Q4 polyethylene demand led to a ~3% demand increase 2020 vs 2019
• Mid-single digit demand growth is expected to continue in 2021 as polyethylene packaging and films play an increasingly important role in consumer consumption patterns (increasing online purchases and health & hygiene considerations)
Mid-single digit or higher demand growth vs 2020 Flat or below 2020
Fuels & Emission Controls
Packaging & Engineered Plastics
Industrial & Process Chemicals
END USE
KEY PRODUCTS 1H 2H…
END USE DEMAND RECOVERY IS BENEFITING BOTH TARGET PQ BUSINESSES; FUEL PRODUCTION EXPECTED TO LAG 3 TO 6 MONTHS

FOURTH QUARTER AND FULL YEAR 2020 FINANCIAL RESULTS
5(1) Adjusted EBITDA margin calculation includes proportionate 50% share of sales from Zeolyst Joint Venture
($ in millions)
Fourth Quarter
2020
Fourth Quarter
2019$
Change%
Change
Sales 281.5 283.5 (2.0) (0.7)
Adjusted EBITDA 81.8 91.1 (9.3) (10.2)Adjusted EBITDA Margin1 (%) 26.4 27.5 (110 bps)
($ in millions)
FullYear2020
FullYear2019
$Change
% Change
Sales 1,107.4 1,199.9 (92.5) (7.7)
Adjusted EBITDA 338.0 393.9 (55.9) (14.2)Adjusted EBITDA Margin1 (%) 27.3 28.7 (140 bps)
o 2020 sales and Adjusted EBITDA were down on lower volume demand due to global pandemic; Catalysts was hardest hit as refineries deferred change-outs beyond 2020 while demand recovered during the year in Refining Services and Performance Chemicals
o Adjusted EBITDA margin of more than 27% reflects aggressive actions to match production with demand to reduce costs

6
o Regeneration services sales declined on lower refinery utilization; Virgin acid sales increased on higher spot sales
o Adjusted EBITDA reflects lower sales volumes consistent with continued lockdowns
o Adjusted EBITDA margin in line, benefiting from product mix and solid cost containment efforts
REFINING SERVICES
($ in millions)
Fourth Quarter
2020
Fourth Quarter
2019$
Change%
Change
Sales 103.2 105.6 (2.4) (2.3)
Adjusted EBITDA 40.7 41.9 (1.2) (2.9)Adjusted EBITDA Margin (%) 39.4 39.7 (30 bps)
Q4 Change FactorsSales: %
Volume (2.5)Price/Mix 0.2Currency -
Sales Change (2.3)

CATALYSTS
7
o Silica Catalysts down on lower MMA catalyst demando Zeolyst JV lower on deferred hydrocracking change-
outs, and pace of recovery for custom and emission control catalysts in heavy-duty diesel production
o Adjusted EBITDA and margin reflect reduced volumes and unfavorable product mix
(1) Adjusted EBITDA margin calculation includes proportionate 50% share of sales from Zeolyst Joint Venture
($ in millions)
Fourth Quarter
2020
Fourth Quarter
2019$
Change%
Change
Sales
Silica Catalysts 20.9 23.3 (2.4) (10.3)
Zeolyst JV 28.9 47.3 (18.4) (38.9)
Adjusted EBITDA 14.8 28.4 (13.6) (47.9)Adjusted EBITDA Margin1 (%)
29.7 40.2 (1050 bps)
Q4 Change FactorsSales: %
Volume (6.4)Price/Mix (3.0)Currency (0.9)
Sales Change (10.3)

PERFORMANCE CHEMICALS
8
o Sales increased with recovery of sodium silicate for industrial applications and continued strong silicas demand in surface coatings
o Adjusted EBITDA and margins benefitted from favorable volumes in addition to transformation and cost reduction initiatives
Q4 Change FactorsSales: %
Volume 2.4
Price/Mix (0.4)
Currency (0.2)
Sales Change 1.8
($ in millions)
Fourth Quarter
2020
Fourth Quarter
2019$
Change%
Change
Sales 158.2 155.4 2.8 1.8
Adjusted EBITDA 35.5 33.0 2.5 7.6Adjusted EBITDA Margin (%) 22.4 21.2 120 bps

ADJUSTED FREE CASH FLOW AND LEVERAGE
9
Achieved robust adjusted free cash flow and maintained stable leverage profile despite downturn impacts of COVID-19 pandemic
4.9x4.5x
3.9x 3.8x
2017 2018 2019 2020
NET DEBT/ADJUSTED EBITDA RATIO
25
134
166153
2017 2018 2019 2020
ADJUSTED FREE CASH FLOW ($mm)

TARGET PQ OUTLOOK – CONTINUING OPERATIONS
10
TARGET PQ – CONTINUING OPERATIONS1
($ in millions,except per share)
2020Actual
2021Outlook
Sales2 $496 $555 – 565Adjusted EBITDA $196 $215 – 225Adjusted Free Cash Flow3,4 $153 $75 – 85Capital Expenditures5 $46 $50 – 55Depreciation & Amortization
PQ $77 $80 - 85Zeolyst JV $15 $14 - 16
o Net proceeds from Performance Chemicals sale earmarked for:o Special dividend of $2.50 to $3.25 per shareo Debt reduction in range of $450 million to $550 million
o Expect year-end pro forma leverage in the mid-to-high 3x rangeo Performance Chemicals expected to be reported as a discontinued operation
effective Q1 2021
(1) Represents Refining Services, Catalysts and unallocated Corporate only, except otherwise noted(2) GAAP sales only; Excludes proportionate 50% share of Zeolyst Joint Venture sales target of $140 million to $150 million versus $129 million in 2020(3) Adjusted free cash flow defined as net cash provided by operating activities less purchases of property, plant and equipment, adjusted for proceeds
from sale of assets, net interest proceeds on swaps designated as net investment hedges and cash paid for costs related to segment disposals(4) Includes proportionate share of cash generation from discontinued operations for the period presented. 2020 includes Performance Materials until
the transaction close on December 14, 2020. 2021 includes Performance Chemicals through an estimated September 30, 2021 transaction close(5) Excludes Zeolyst Joint Venture Capital Expenditures
+ 10 – 15% in 2021 from 2020 assuming midpoint of guidance
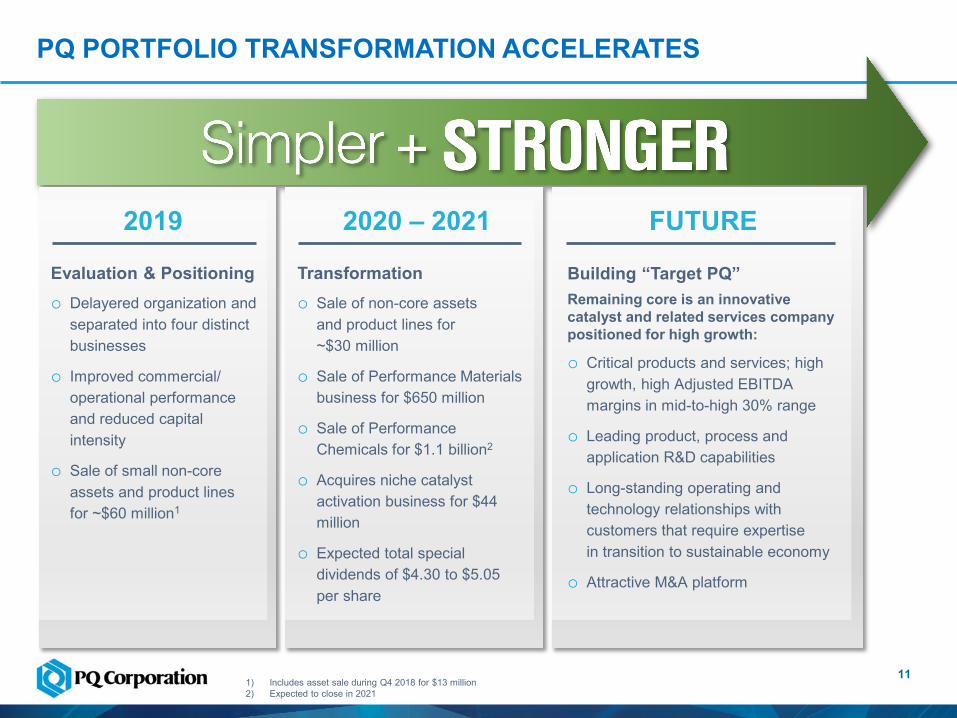
PQ PORTFOLIO TRANSFORMATION ACCELERATES
11
FUTURE2019 2020 – 2021
1) Includes asset sale during Q4 2018 for $13 million2) Expected to close in 2021
Building “Target PQ”Remaining core is an innovative catalyst and related services company positioned for high growth:
o Critical products and services; high growth, high Adjusted EBITDA margins in mid-to-high 30% range
o Leading product, process and application R&D capabilities
o Long-standing operating and technology relationships with customers that require expertise in transition to sustainable economy
o Attractive M&A platform
Transformationo Sale of non-core assets
and product lines for ~$30 million
o Sale of Performance Materials business for $650 million
o Sale of Performance Chemicals for $1.1 billion2
o Acquires niche catalyst activation business for $44 million
o Expected total special dividends of $4.30 to $5.05 per share
Evaluation & Positioningo Delayered organization and
separated into four distinct businesses
o Improved commercial/operational performance and reduced capital intensity
o Sale of small non-core assets and product lines for ~$60 million1

THE FUTURE IS BRIGHT
12Note: Estimated average organic growth from 2020 to 2025; sales growth includes growth from the Zeolyst Joint Venture
High Single Digit
CASH CONVERSION
High Single Digit
Mid to High 30’s%
Higher than 75%
Innovative Pure-Play Catalyst And Services Company
ORGANIC SALES
GROWTH
ADJUSTED EBITDA
GROWTH
ADJUSTED EBITDA
MARGIN

13
APPENDIX

QUARTERLY SEGMENT SALES, ADJUSTED EBITDA AND MARGINS
14
For the Quarter Ended
(1) Adjusted EBITDA margin calculation includes proportionate 50% share of net sales from Zeolyst Joint Venture
* Rounding discrepancies may arise when rounding results from dollars (in thousands) to dollars (in millions)
Three months endedDecember 31, 2020
Year endedDecember 31, 2020
Three Months EndedDecember 31, 2019
Year endedDecember 31, 2019($ in millions except %, unaudited)
Sales:Refining Services 103.2 401.9 105.6 447.1Silica Catalysts 20.9 94.0 23.3 85.7Performance Chemicals 158.2 614.7 155.4 670.5Eliminations (0.8) (3.2) (0.8) (3.4)
Total sales 281.5 1,107.4 283.5 1,199.9Zeolyst joint venture sales 28.9 128.6 47.3 170.3
Adjusted EBITDA:Refining Services 40.7 157.2 41.9 175.6Catalysts 14.8 74.5 28.4 107.8Performance Chemicals 35.5 142.4 33.0 151.5
Total Segment Adjusted EBITDA 91.0 374.1 103.3 434.9Corporate (9.2) (36.1) (12.2) (41.0)
Total Adjusted EBITDA 81.8 338.0 91.1 393.9
Adjusted EBITDA Margin:Refining Services 39.4% 39.1% 39.7% 39.3%Catalysts1 29.7% 33.5% 40.2% 42.1%Performance Chemicals 22.4% 23.2% 21.2% 22.6%
Total Adjusted EBITDA Margin1 26.4% 27.3% 27.5% 28.7%

SALES AND ADJUSTED EBITDA MAJOR CHANGE FACTORS
1515
ADJUSTED EBITDA
SALES
Sales(in $ millions and %)
Three months ended December 31, 2020PQ Group
Holdings IncRefining Services Catalysts
Performance Chemicals
Sales: $ % $ % $ % $ %Volume (0.5) (0.2) (2.6) (2.5) (1.5) (6.4) 3.7 2.4
Price/Mix (1.1) (0.4) 0.2 0.2 (0.7) (3.0) (0.6) (0.4)Currency (0.4) (0.1) — — (0.2) (0.9) (0.3) (0.2)
Sales Change (2.0) (0.7) (2.4) (2.3) (2.4) (10.3) 2.8 1.8
Adj EBITDA(in $ millions and %)
Three months ended December 31, 2020PQ Group
Holdings IncRefining Services Catalysts
Performance Chemicals
Adj EBITDA: $ % $ % $ % $ %Volume/Mix (14.2) (15.6) (2.8) (6.8) (12.3) (43.3) 1.6 4.8Price (0.4) (0.4) 0.2 0.5 — — (0.6) (1.8)Variable Cost 0.8 0.9 0.3 0.7 0.4 1.4 0.5 1.6Currency (0.1) (0.1) (5.5) (13.1) — — — —Other 4.6 5.0 6.6 15.8 (1.7) (6.0) 1.0 3.0
Adj EBITDA Change (9.3) (10.2) (1.2) (2.9) (13.6) (47.9) 2.5 7.6
Year Ended December 31, 2020PQ Group
Holdings IncRefining Services Catalysts
Performance Chemicals
$ % $ % $ % $ %(64.6) (5.4) (26.7) (6.0) 10.6 12.4 (48.6) (7.2)
(11.9) (1.0) (18.5) (4.1) (1.2) (1.4) 7.8 1.2(16.0) (1.3) — — (1.1) (1.3) (15.0) (2.3)
(92.5) (7.7) (45.2) (10.1) 8.3 9.7 (55.8) (8.3)
Year Ended December 31, 2020PQ Group
Holdings IncRefining Services Catalysts
Performance Chemicals
$ % $ % $ % $ %(57.1) (14.5) (20.1) (11.4) (11.7) (10.9) (24.5) (16.2)(11.1) (2.8) (18.5) (10.5) (0.4) (0.4) 7.8 5.115.9 4.0 13.6 7.7 (0.5) (0.5) 3.1 2.1(3.8) (1.0) — — (0.3) (0.3) (3.5) (2.3)0.2 0.1 6.6 3.7 (20.4) (18.8) 8.0 5.3
(55.9) (14.2) (18.4) (10.5) (33.3) (30.9) (9.1) (6.0)

ADJUSTED FREE CASH FLOW
16
(1) Excludes net interest proceeds on swaps designated as net investment hedges(2) Excludes the Company’s proportionate 50% share of capital expenditures from the Zeolyst Joint Venture
* Rounding discrepancies may arise when rounding results from dollars (in thousands) to dollars (in millions)
($ in millions)Full Year
2020Full Year
2019
Cash Flow from Operations before interest and tax 349.0 401.9
Less: Cash paid for taxes 35.0 17.4
Less: Cash paid for interest1 90.4 116.8
Cash Flow from Operations 223.6 267.7
Less: Purchases of property, plant and equipment2 109.6 127.6
Free Cash Flow 114.0 140.1Plus: Proceeds from sale of assets 11.1 17.6
Plus: Net interest proceeds on currency swaps 5.0 8.5Plus: Cash paid for costs related to segment
disposals 22.5 —
Adjusted Free Cash Flow 152.5 166.2

RECONCILIATION OF NET INCOME TO SEGMENT ADJUSTED EBITDA
17
(1) For additional information with respect to each adjustment, see “Reconciliation of Non-GAAP Financial Measures”(2) Other expense (income), net includes debt extinguishment costs
* Rounding discrepancies may arise when rounding results from dollars (in thousands) to dollars (in millions)
Three months endedDecember 31, 2020
Year endedDecember 31, 2020
Three Months EndedDecember 31, 2019
Year endedDecember 31, 2019($ in millions)
Reconciliation of net income attributable to PQ Group Holdings Inc. to Segment Adjusted EBITDA
Net income (loss) attributable to PQ Group Holdings Inc. (182.8) (176.3) 28.2 65.1Provision for (benefit from) income taxes (77.9) (48.1) (4.1) 39.7Interest expense, net 14.4 67.0 20.9 87.1Depreciation and amortization 39.5 151.8 39.1 151.8
EBITDA (206.8) (5.6) 84.1 343.7Joint venture depreciation, amortization and interest(a) 3.6 14.7 3.5 14.7Amortization of investment in affiliate step-up(b) 1.6 6.6 1.7 7.5Goodwill impairment charge 260.0 260.0 — —Debt extinguishment costs 8.5 25.0 1.8 3.4Net (gain) loss on asset disposals(c) 3.5 (0.1) (5.3) (13.2)Foreign currency exchange (gain) loss(d) (2.8) (4.2) (2.7) 2.4LIFO (benefit) expense(e) (0.6) (5.2) 0.7 9.7Transaction and other related costs(f) 5.2 8.6 1.6 0.4Equity-based compensation 5.5 21.5 4.1 16.2Restructuring, integration and business optimization expenses(g) 5.7 15.6 2.6 3.6Defined benefit plan pension cost(h) 0.1 — 0.7 3.0Other(i) (1.7) 1.1 (1.7) 2.5
Adjusted EBITDA 81.8 338.0 91.1 393.9Unallocated corporate costs 9.2 36.1 12.2 41.0Total Segment Adjusted EBITDA1 91.0 374.1 103.3 434.9
EBITDA Adjustments by Line ItemEBITDA (206.8) (5.6) 84.1 343.7
Cost of goods sold 1.2 (1.1) 1.3 11.6Selling, general and administrative expenses 7.1 24.8 4.9 18.8Other operating expense (income), net 270.1 280.2 (2.8) (5.4)Equity in net (income) from affiliated companies 1.7 6.6 1.7 7.5Other expense (income), net 2 4.9 18.4 (1.6) 3.0Joint venture depreciation, amortization and interest(a) 3.6 14.7 3.5 14.7
Adjusted EBITDA 81.8 338.0 91.1 393.9

a) We use Adjusted EBITDA as a performance measure to evaluate our financial results. Because our Catalysts segment includes our 50% interest in the Zeolyst Joint Venture, weinclude an adjustment for our 50% proportionate share of depreciation, amortization and interest expense of the Zeolyst Joint Venture.
b) Represents the amortization of the fair value adjustments associated with the equity affiliate investment in the Zeolyst Joint Venture as a result of the combination of the businessesof PQ Holdings Inc. and Eco Services Operations LLC (“Eco”) in May 2016 (the “Business Combination”). We determined the fair value of the equity affiliate investment and the fairvalue step-up was then attributed to the underlying assets of the Zeolyst Joint Venture. Amortization is primarily related to the fair value adjustments associated with fixed assets andintangible assets, including customer relationships and technical know-how.
c) When asset disposals occur, we remove the impact of net gain/loss of the disposed asset because such impact primarily reflects the non-cash write-off of long-lived assets no longerin use. During the year ended December 31, 2019, the net gain on asset disposals includes the gains related to the sale of a non-core product line and sale of property.
d) Reflects the exclusion of the foreign currency transaction gains and losses in the statements of income primarily related to the non-permanent intercompany debt denominated inlocal currency translated to U.S. dollars.
e) Represents non-cash adjustments to the Company’s LIFO reserves for certain inventories in the U.S. that are valued using the LIFO method, which we believe provides a means ofcomparison to other companies that may not use the same basis of accounting for inventories.
f) Represents the costs related to several transactions that are completed, pending or abandoned and that we believe are not representative of our ongoing business operations.
g) Includes the impact of restructuring, integration and business optimization expenses which are incremental costs that are not representative of our ongoing business operations.
h) Represents adjustments for defined benefit pension plan costs in our statement of income. More than two-thirds of our defined benefit pension plan obligations are under definedbenefit pension plans that are frozen, and the remaining obligations primarily relate to plans operated in certain of our non-U.S. locations that, pursuant to jurisdictional requirements,cannot be frozen. As such, we do not view such expenses as core to our ongoing business operations.
i) Other costs consist of certain expenses that are not core to our ongoing business operations, including environmental remediation-related costs associated with the legacyoperations of our business prior to the Business Combination, capital and franchise taxes, and non-cash asset retirement obligation accretion. Included in this line-item are roundingdiscrepancies that may arise from rounding from dollars (in thousands) to dollars (in millions).
DESCRIPTIONS FOR RECONCILIATION OF NON-GAAP FINANCIAL MEASURES
18