Embed Size (px)
Citation preview

1
STAR BULK CARRIERS CORP.
REPORTS RESULTS FOR THE FOURTH QUARTER AND YEAR ENDED DECEMBER 31, 2014
AND PROVIDES UPDATE ON FINANCING AND SALE OF VESSELS
ATHENS, GREECE, March 19, 2015 – Star Bulk Carriers Corp. (the "Company" or "Star Bulk") (Nasdaq: SBLK), a global shipping company focusing on the transportation of dry bulk cargoes, today announced its unaudited financial and operating results for the fourth quarter and the year ended December 31, 2014.
Financial Highlights
(1) See the table at the back of this release for a reconciliation of EBITDA and Adjusted EBITDA to Net Cash Provided by Operating Activities, which is the most directly comparable financial measure calculated and presented in accordance with generally accepted accounting principles in the United States (“U.S. GAAP”).
In addition, the Company announced that it has entered today into a committed term sheet with DNB Bank (DNB), SEB Bank (SEB) and the Export-Import Bank of China (CEXIM) for the financing of seven newbuilding vessels, for an amount of up to $227.5 million. At this stage, the Company has secured financing for the 30 out of the 32 newbuilding vessels under construction and is currently on the final stages of negotiating the terms for the financing of its last two newbuilding vessels.
Finally, Star Bulk announced today that it has entered into a binding agreement to sell for demolition the M/V Star Monika, a 71,500 dwt Panamax vessel, built in 1993, to an unaffiliated third party. The Company expects to deliver the vessel to her buyers by end of March 2015.
Three months
ended
Three months
ended
Twelve
months
ended
Twelve
months
ended
December 31,
2014
December 31,
2013
December 31,
2014
December
31, 2013
Total Revenues $65,650 $16,349 $147,387 $69,894
EBITDA (1) $15,611 $6,974 $41,138 $30,847
Adjusted EBITDA (1) $16,564 $7,387 $43,565 $32,331
Net income / (loss) ($8,074) $54 ($11,723) $1,850
Adjusted Net income / (loss) ($5,539) $2,068 ($3,183) $9,686
Earnings / (loss) per share basic and diluted ($0.083) $0.002 ($0.20) $0.13
Adjusted earnings/ (loss) per share basic and diluted ($0.06) $0.07 ($0.05) $0.69
Average Number of Vessels 50.8 13.2 28.9 13.3
Time Charter Equivalent Rate ("TCE") $11,384 $14,467 $12,161 $14,427
Average OPEX per day per vessel $4,704 $5,392 $5,037 $5,564
(Expressed in thousands of U.S. dollars,
except for daily rates and per share data)

2
Petros Pappas, Chief Executive Officer of Star Bulk, commented: “This past year has been a transformational
one for the Company, after the merger with Oceanbulk and the acquisition of 34 vessels from Excel Maritime,
making Star Bulk the largest U.S. listed dry bulk company with a fleet of 98 vessels on a fully delivered basis.
Against a backdrop of weakening market conditions in the fourth quarter of 2014, Star Bulk reported full year
revenues of $147.4 million and adjusted EBITDA of $43.6 million. For the fourth quarter, the Company reported
revenues of $65.6 million and adjusted EBITDA of $16.6 million.
We are committed to take measures to protect our shareholders’ equity value and enhance our ability to
weather what has proved as one of the most challenging dry bulk markets in the last 40 years. More
specifically:
Regarding revenue, we have announced the formation of Capesize Chartering Ltd., in cooperation with
four other capesize owners and we are seeking to create similar arrangements for other dry bulk
segments. Moreover, we have managed to outperform the Baltic Indices on an adjusted basis for the
fourth year in a row across all vessel sizes.
Regarding OPEX, we are focused on taking advantage of our increased scale to further enhance our
operational capabilities and reduce our operating expenses. In an environment where low break-even
rates are crucial, our average operating expenses per vessel for 2014 were at $4,750/day, down 14.0%
year-over-year, making us one of the lowest cost dry bulk operators. We will continue to take advantage
of our economies of scale, to further drive down costs while maintaining the highest standards of safety
and quality.
Regarding debt financing, we have been successful in tapping both existing and new banking relationships
to secure $906.0m of committed debt financing for 30 out of our 32 newbuilding vessels, proving our
ability to source secured debt financing even in this difficult market. We are currently in final negotiations
with two major lending institutions for the financing of our two remaining newbuilding vessels.
Regarding our ships, we have disposed of five older 90’s built Panamax and Handymax vessels and there
will be further disposals of vessels that do not fit the profile of our fleet. Importantly, we have agreed to
defer certain pre - delivery instalments for newbuilding vessels from 2015 to 2016, as well as to delay
vessel deliveries.
Regarding our balance sheet, we have raised $245 million of new equity in January 2015 to fully fund our
newbuilding program and increase our cash reserves. The participation of many prominent institutional
investors, including our major shareholders Oaktree Capital Management, Monarch Alternative Capital
and Angelo, Gordon & Co, as well as of my family and my business associates was a welcome endorsement
of our company.
We remain optimistic regarding the fundamental long-term dynamics of the dry bulk industry. Although 2015
will be challenging, we expect a significant correction in the supply of vessels which combined with continued
strong demand for commodities will create the necessary conditions for a healthier market in the future.”
3
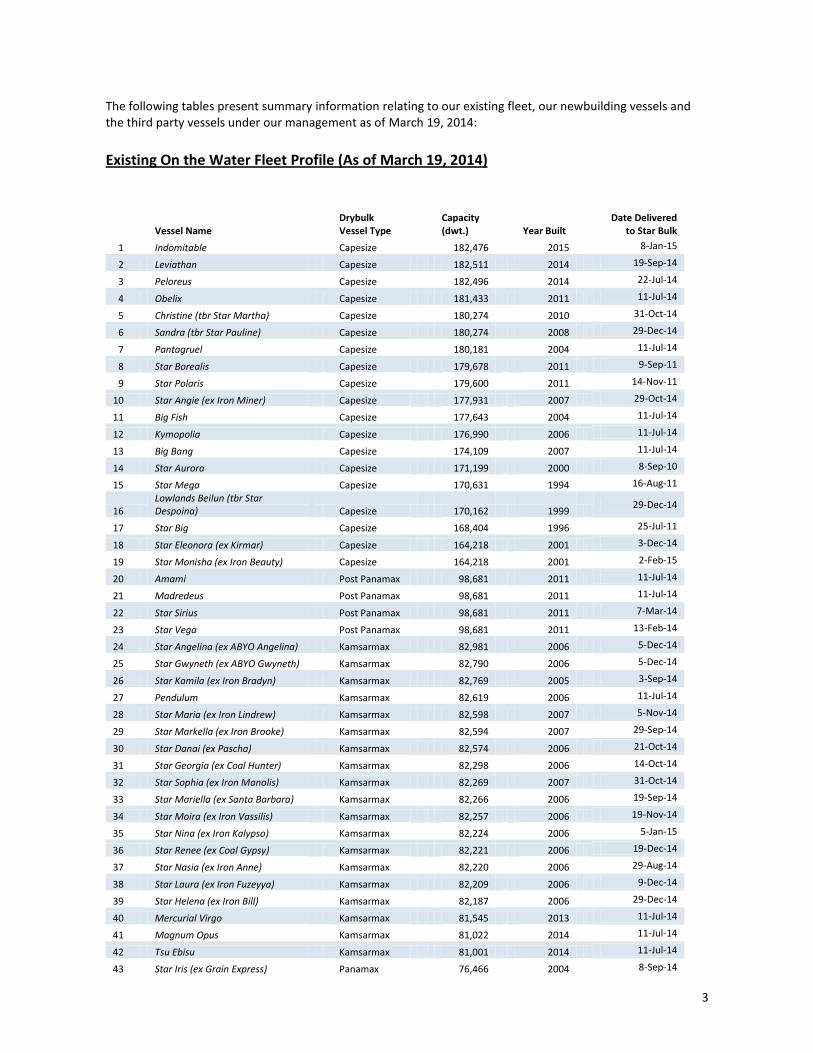
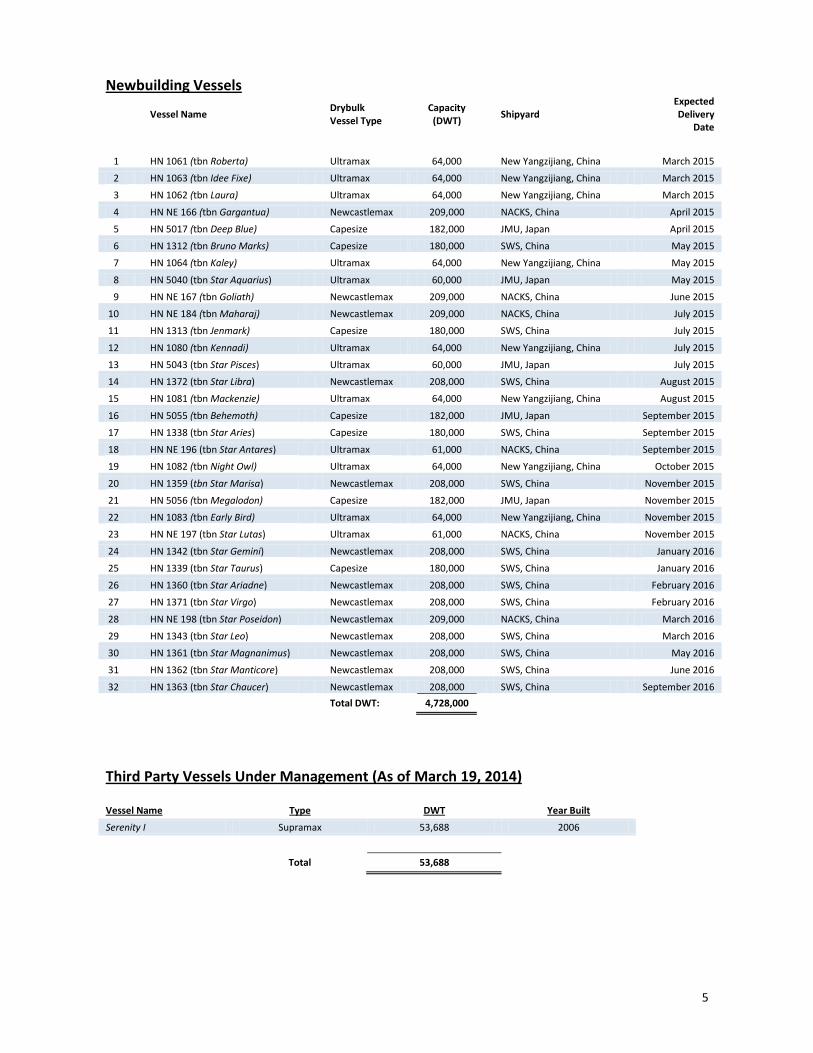
The following tables present summary information relating to our existing fleet, our newbuilding vessels and the third party vessels under our management as of March 19, 2014: Existing On the Water Fleet Profile (As of March 19, 2014)
Vessel Name Drybulk Vessel Type
Capacity (dwt.) Year Built
Date Delivered to Star Bulk
1 Indomitable Capesize
182,476
2015 8-Jan-15
2 Leviathan Capesize 182,511 2014 19-Sep-14
3 Peloreus Capesize
182,496
2014 22-Jul-14
4 Obelix Capesize 181,433 2011 11-Jul-14
5 Christine (tbr Star Martha) Capesize
180,274
2010 31-Oct-14
6 Sandra (tbr Star Pauline) Capesize 180,274 2008 29-Dec-14
7 Pantagruel Capesize
180,181 2004 11-Jul-14
8 Star Borealis Capesize 179,678 2011 9-Sep-11
9 Star Polaris Capesize
179,600 2011 14-Nov-11
10 Star Angie (ex Iron Miner) Capesize 177,931 2007 29-Oct-14
11 Big Fish Capesize
177,643 2004 11-Jul-14
12 Kymopolia Capesize 176,990 2006 11-Jul-14
13 Big Bang Capesize
174,109 2007 11-Jul-14
14 Star Aurora Capesize 171,199 2000 8-Sep-10
15 Star Mega Capesize
170,631 1994 16-Aug-11
16 Lowlands Beilun (tbr Star Despoina) Capesize 170,162 1999
29-Dec-14
17 Star Big Capesize
168,404 1996 25-Jul-11
18 Star Eleonora (ex Kirmar) Capesize 164,218 2001 3-Dec-14
19 Star Monisha (ex Iron Beauty) Capesize
164,218
2001 2-Feb-15
20 Amami Post Panamax 98,681 2011 11-Jul-14
21 Madredeus Post Panamax
98,681
2011 11-Jul-14
22 Star Sirius Post Panamax 98,681 2011 7-Mar-14
23 Star Vega Post Panamax
98,681 2011 13-Feb-14
24 Star Angelina (ex ABYO Angelina) Kamsarmax 82,981 2006 5-Dec-14
25 Star Gwyneth (ex ABYO Gwyneth) Kamsarmax
82,790
2006 5-Dec-14
26 Star Kamila (ex Iron Bradyn) Kamsarmax 82,769 2005 3-Sep-14
27 Pendulum Kamsarmax
82,619 2006 11-Jul-14
28 Star Maria (ex Iron Lindrew) Kamsarmax 82,598 2007 5-Nov-14
29 Star Markella (ex Iron Brooke) Kamsarmax
82,594
2007 29-Sep-14
30 Star Danai (ex Pascha) Kamsarmax 82,574 2006 21-Oct-14
31 Star Georgia (ex Coal Hunter) Kamsarmax
82,298
2006 14-Oct-14
32 Star Sophia (ex Iron Manolis) Kamsarmax 82,269 2007 31-Oct-14
33 Star Mariella (ex Santa Barbara) Kamsarmax
82,266
2006 19-Sep-14
34 Star Moira (ex Iron Vassilis) Kamsarmax 82,257 2006 19-Nov-14
35 Star Nina (ex Iron Kalypso) Kamsarmax
82,224
2006 5-Jan-15
36 Star Renee (ex Coal Gypsy) Kamsarmax 82,221 2006 19-Dec-14
37 Star Nasia (ex Iron Anne) Kamsarmax
82,220
2006 29-Aug-14
38 Star Laura (ex Iron Fuzeyya) Kamsarmax 82,209 2006 9-Dec-14
39 Star Helena (ex Iron Bill) Kamsarmax
82,187
2006 29-Dec-14
40 Mercurial Virgo Kamsarmax 81,545 2013 11-Jul-14
41 Magnum Opus Kamsarmax
81,022
2014 11-Jul-14
42 Tsu Ebisu Kamsarmax 81,001 2014 11-Jul-14
43 Star Iris (ex Grain Express) Panamax
76,466
2004 8-Sep-14

4
44 Star Aline (ex IronKnight) Panamax 76,429 2004 4-Sep-14
45 Star Emily (ex Grain Harvester) Panamax
76,417
2004 16-Sep-14
46 Star Christianna (ex Isminaki) Panamax 74,577 1998 6-Oct-14
47 Star Natalie (ex Angela Star) Panamax
73,798
1998 29-Aug-14
48 Star Nicole (ex Elinakos) Panamax 73,751 1997 14-Jan-15
49 Star Vanessa (ex Coal Pride) Panamax
72,493
1999 7-Nov-14
50 Star Claudia (ex Happyday) Panamax 71,662 1997 20-Jan-15
51 Star Monika (ex Birthday) Panamax
71,504
1993 10-Oct-14
52 Star Challenger Ultramax 61,462 2012 12-Dec-13
53 Star Fighter Ultramax
61,455
2013 30-Dec-13
54 Honey Badger Ultramax 61,297 2015 27-Feb-15
55 Wolverine Ultramax
61,297
2015 27-Feb-15
56 Maiden Voyage Supramax 58,722 2012 11-Jul-14
57 Strange Attractor Supramax
55,742 2006 11-Jul-14
58 Star Omicron Supramax 53,489 2005 17-Apr-08
59 Star Gamma Supramax
53,098 2002 4-Jan-08
60 Star Zeta Supramax 52,994 2003 2-Jan-08
61 Star Delta Supramax
52,434 2000 2-Jan-08
62 Star Theta Supramax 52,425 2003 6-Dec-07
63 Star Epsilon Supramax
52,402 2001 3-Dec-07
64 Star Cosmo Supramax 52,246 2005 1-Jul-08
65 Star Kappa Supramax
52,055 2001 14-Dec-07
66 Star Michele (ex Emerald) Handymax 45,588 1998 14-Oct-14
Total dwt:
6,795,599
Acquired Fleet to be delivered
Vessel Name Drybulk Vessel Type
Capacity (DWT)
Year Built Shipyard
Ore Hansa (tbr Star Jennifer) Kamsarmax 82,209 2006 Tsuneishi Japan
Total DWT: 82,209
5
Newbuilding Vessels
Vessel Name
Drybulk Vessel Type
Capacity (DWT)
Shipyard Expected Delivery
Date
1 HN 1061 (tbn Roberta) Ultramax 64,000 New Yangzijiang, China March 2015
2 HN 1063 (tbn Idee Fixe) Ultramax 64,000 New Yangzijiang, China March 2015
3 HN 1062 (tbn Laura) Ultramax 64,000 New Yangzijiang, China March 2015
4 HN NE 166 (tbn Gargantua) Newcastlemax 209,000 NACKS, China April 2015
5 HN 5017 (tbn Deep Blue) Capesize 182,000 JMU, Japan April 2015
6 HN 1312 (tbn Bruno Marks) Capesize 180,000 SWS, China May 2015
7 HN 1064 (tbn Kaley) Ultramax 64,000 New Yangzijiang, China May 2015
8 HN 5040 (tbn Star Aquarius) Ultramax 60,000 JMU, Japan May 2015
9 HN NE 167 (tbn Goliath) Newcastlemax 209,000 NACKS, China June 2015
10 HN NE 184 (tbn Maharaj) Newcastlemax 209,000 NACKS, China July 2015
11 HN 1313 (tbn Jenmark) Capesize 180,000 SWS, China July 2015
12 HN 1080 (tbn Kennadi) Ultramax 64,000 New Yangzijiang, China July 2015
13 HN 5043 (tbn Star Pisces) Ultramax 60,000 JMU, Japan July 2015
14 HN 1372 (tbn Star Libra) Newcastlemax 208,000 SWS, China August 2015
15 HN 1081 (tbn Mackenzie) Ultramax 64,000 New Yangzijiang, China August 2015
16 HN 5055 (tbn Behemoth) Capesize 182,000 JMU, Japan September 2015
17 HN 1338 (tbn Star Aries) Capesize 180,000 SWS, China September 2015
18 HN NE 196 (tbn Star Antares) Ultramax 61,000 NACKS, China September 2015
19 HN 1082 (tbn Night Owl) Ultramax 64,000 New Yangzijiang, China October 2015
20 HN 1359 (tbn Star Marisa) Newcastlemax 208,000 SWS, China November 2015
21 HN 5056 (tbn Megalodon) Capesize 182,000 JMU, Japan November 2015
22 HN 1083 (tbn Early Bird) Ultramax 64,000 New Yangzijiang, China November 2015
23 HN NE 197 (tbn Star Lutas) Ultramax 61,000 NACKS, China November 2015
24 HN 1342 (tbn Star Gemini) Newcastlemax 208,000 SWS, China January 2016
25 HN 1339 (tbn Star Taurus) Capesize 180,000 SWS, China January 2016
26 HN 1360 (tbn Star Ariadne) Newcastlemax 208,000 SWS, China February 2016
27 HN 1371 (tbn Star Virgo) Newcastlemax 208,000 SWS, China February 2016
28 HN NE 198 (tbn Star Poseidon) Newcastlemax 209,000 NACKS, China March 2016
29 HN 1343 (tbn Star Leo) Newcastlemax 208,000 SWS, China March 2016
30 HN 1361 (tbn Star Magnanimus) Newcastlemax 208,000 SWS, China May 2016
31 HN 1362 (tbn Star Manticore) Newcastlemax 208,000 SWS, China June 2016
32 HN 1363 (tbn Star Chaucer) Newcastlemax 208,000 SWS, China September 2016
Total DWT: 4,728,000
Third Party Vessels Under Management (As of March 19, 2014)
Vessel Name Type DWT Year Built
Serenity I Supramax 53,688 2006
Total 53,688
6
Recent Developments
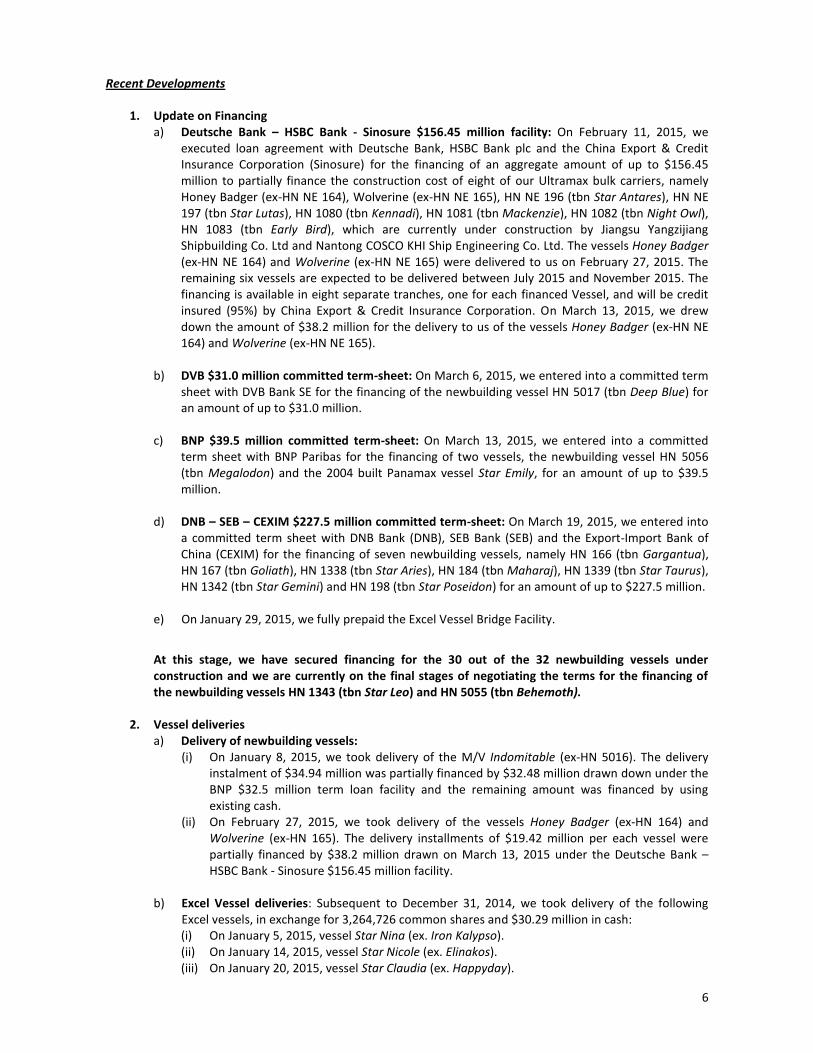
1. Update on Financing a) Deutsche Bank – HSBC Bank - Sinosure $156.45 million facility: On February 11, 2015, we
executed loan agreement with Deutsche Bank, HSBC Bank plc and the China Export & Credit Insurance Corporation (Sinosure) for the financing of an aggregate amount of up to $156.45 million to partially finance the construction cost of eight of our Ultramax bulk carriers, namely Honey Badger (ex-HN NE 164), Wolverine (ex-HN NE 165), HN NE 196 (tbn Star Antares), HN NE 197 (tbn Star Lutas), HN 1080 (tbn Kennadi), HN 1081 (tbn Mackenzie), HN 1082 (tbn Night Owl), HN 1083 (tbn Early Bird), which are currently under construction by Jiangsu Yangzijiang Shipbuilding Co. Ltd and Nantong COSCO KHI Ship Engineering Co. Ltd. The vessels Honey Badger (ex-HN NE 164) and Wolverine (ex-HN NE 165) were delivered to us on February 27, 2015. The remaining six vessels are expected to be delivered between July 2015 and November 2015. The financing is available in eight separate tranches, one for each financed Vessel, and will be credit insured (95%) by China Export & Credit Insurance Corporation. On March 13, 2015, we drew down the amount of $38.2 million for the delivery to us of the vessels Honey Badger (ex-HN NE 164) and Wolverine (ex-HN NE 165).
b) DVB $31.0 million committed term-sheet: On March 6, 2015, we entered into a committed term
sheet with DVB Bank SE for the financing of the newbuilding vessel HN 5017 (tbn Deep Blue) for an amount of up to $31.0 million.
c) BNP $39.5 million committed term-sheet: On March 13, 2015, we entered into a committed
term sheet with BNP Paribas for the financing of two vessels, the newbuilding vessel HN 5056 (tbn Megalodon) and the 2004 built Panamax vessel Star Emily, for an amount of up to $39.5 million.
d) DNB – SEB – CEXIM $227.5 million committed term-sheet: On March 19, 2015, we entered into
a committed term sheet with DNB Bank (DNB), SEB Bank (SEB) and the Export-Import Bank of China (CEXIM) for the financing of seven newbuilding vessels, namely HN 166 (tbn Gargantua), HN 167 (tbn Goliath), HN 1338 (tbn Star Aries), HN 184 (tbn Maharaj), HN 1339 (tbn Star Taurus), HN 1342 (tbn Star Gemini) and HN 198 (tbn Star Poseidon) for an amount of up to $227.5 million.
e) On January 29, 2015, we fully prepaid the Excel Vessel Bridge Facility.
At this stage, we have secured financing for the 30 out of the 32 newbuilding vessels under construction and we are currently on the final stages of negotiating the terms for the financing of the newbuilding vessels HN 1343 (tbn Star Leo) and HN 5055 (tbn Behemoth).
2. Vessel deliveries a) Delivery of newbuilding vessels:
(i) On January 8, 2015, we took delivery of the M/V Indomitable (ex-HN 5016). The delivery instalment of $34.94 million was partially financed by $32.48 million drawn down under the BNP $32.5 million term loan facility and the remaining amount was financed by using existing cash.
(ii) On February 27, 2015, we took delivery of the vessels Honey Badger (ex-HN 164) and Wolverine (ex-HN 165). The delivery installments of $19.42 million per each vessel were partially financed by $38.2 million drawn on March 13, 2015 under the Deutsche Bank – HSBC Bank - Sinosure $156.45 million facility.
b) Excel Vessel deliveries: Subsequent to December 31, 2014, we took delivery of the following
Excel vessels, in exchange for 3,264,726 common shares and $30.29 million in cash: (i) On January 5, 2015, vessel Star Nina (ex. Iron Kalypso). (ii) On January 14, 2015, vessel Star Nicole (ex. Elinakos). (iii) On January 20, 2015, vessel Star Claudia (ex. Happyday).

7
(iv) On February 2, 2015, vessel Star Monisha (ex. Iron Beauty). (v) On March 5, 2015, vessel Rodon. We drew down $19.8 million of debt proceeds under the DNB $120.0 million facility and the Citi $100.0 million facility to finance part of the cash consideration for the above vessels. So far we have taken delivery of 33 out of the 34 Excel vessels. The final Excel vessel, Ore Hansa (tbr Star Jennifer) is expected to be delivered to the Company by March 31, 2015.
3. Vessel sales
On January 16, 2015, January 27, 2015, March 5, 2015 and March 19, 2015 we entered into separate agreements with third parties to sell the vessels Star Julia, Star Tatianna, Rodon and Star Monika, respectively, four of the Excel Vessels, at market terms. The vessels were delivered to their new owners on February 4, 2015, February 9, 2015, and March 12, 2015, respectively, except from the vessel Star Monika which is expected to be delivered by the end of March 2015.
4. Other subsequent events
a) Equity offering: On January 14, 2015, we completed a primary underwritten public offering of 49,000,418 of common shares, at a price of $5.00 per share. The aggregate proceeds, net of underwriters’ commissions, were $242.2 million. The net proceeds from the offering are expected to be used for the financing of our newbuilding program and general corporate purposes.
b) Outsourcing of certain procurement services: As of January 1, 2015, we have engaged Ship
Procurement Services S.A. (SPS), an unaffiliated third party company, to provide to our fleet certain procurement services at a daily fee of $295 per vessel. SPS will be offering procurement services to a potential fleet of approximately 150 vessels and Star Bulk expects to achieve synergies through economies of scale on the operating expenses and the dry docking costs of the vessels.

8
Fourth Quarter 2014 and 2013 Results (*)
(*) Amounts relating to variations in period – on – period comparisons shown in this section are derived from the actual numbers in our books and records.
For the fourth quarter of 2014, total voyage revenues were $65.5 million compared to $15.7 million for the fourth quarter of 2013. This increase is mainly attributed to the increase of the average number of vessels to 50.8 in the fourth quarter of 2014 from 13.2 vessels in the fourth quarter of 2013, as a result of the acquisition of Oceanbulk Carriers LLC and Oceanbulk Shipping LLC (collectively “Oceanbulk”), two ship-owning entities affiliated with the family of Mr. Pappas (the “Pappas Companies”), the two Heron Vessels and 28 out of the 34 Excel Vessels. Management fee income during the fourth quarter of 2014 was $0.2 million compared to $0.7 million for the fourth quarter of 2013. This decrease is mainly due to the decrease in the average number of third and related party vessels under management to 2.2 vessels in the fourth quarter of 2014 from 10.0 vessels in the fourth quarter of 2013. As a result of the acquisition of Oceanbulk and the Pappas Companies, eleven vessels under our management that were part of the fleets of Oceanbulk and the Pappas Companies became part of our fleet as of July 11, 2014. We therefore stopped receiving fees for the management of these vessels.
For the fourth quarter of 2014, operating loss was $2.7 million compared to operating income of $1.3 million for the fourth quarter of 2013.
Net loss for the fourth quarter of 2014, was $8.1 million, or $0.08 loss per basic and diluted share, calculated on 97,623,578 weighted average number of basic and diluted shares. Net income for the fourth quarter of 2013 was $0.05 million, or $0.002 earnings per basic and diluted share, based on 28,286,004 and 28,488,902 weighted average number of basic and diluted shares, respectively.
Net loss for the fourth quarter of 2014 mainly included the following non-cash items:
Amortization of fair value of above market acquired time charters of $1.6 million, or $0.02 per basic and diluted share, associated with time charters attached to vessels acquired in the third quarter of 2011 (namely Star Big and Star Mega), vessels acquired as part of the merger with Oceanbulk, in July 2014 (namely Amami and Madredeus) and one Excel vessel (namely Christine). These assets are amortized over the respective charter parties΄ duration as a decrease to voyage revenues;
Expenses of $1.0 million, or $0.01 per basic and diluted share, relating to the stock based compensation recognized in connection with the shares issued to our directors and employees;
Equity in income of investee of $0.1 million, or $0.001 per basic and diluted share.
Excluding these non-cash items, net loss for the fourth quarter of 2014 would amount to $5.5 million, or $0.06 loss, per basic and diluted share, respectively, based on 97,623,578 weighted average number of basic and diluted shares.
Net income for the fourth quarter of 2013 included the following non-cash items:
Amortization of fair value of above market acquired time charters of $1.6 million, or $0.06 per basic and diluted share, associated with the acquired vessels Star Big and Star Mega, which are amortized over the remaining period as a decrease to voyage revenues;
Expenses of $0.4 million, or $0.02, per basic and diluted share, relating to the stock based compensation recognized in connection with shares issued to our directors and employees; and
Unrealized gain of $0.03 million, or $0.001 per basic and diluted share, in connection with the mark to market valuation of our derivatives, which had not been designated as cash flow hedges.
Excluding these non-cash items, net income for the fourth quarter of 2013 would amount to $2.1 million, or $0.07 earnings per basic and diluted share, based on 28,286,004 and 28,488,902 weighted average number of basic and diluted shares, respectively.
Adjusted EBITDA for the fourth quarter of 2014 and 2013, was $16.6 million and $7.4 million, respectively. A reconciliation of EBITDA and adjusted EBITDA to net cash provided by cash flows from operating activities is set forth in the following pages.

9
We owned and operated an average of 50.8 and 13.2 vessels during the fourth quarter of 2014 and 2013 respectively, which earned an average Time Charter Equivalent, or “TCE” daily rate of $11,384 and $14,467, respectively. We refer you to the information under the heading "Summary of Selected Data” set forth below for information regarding our calculation of TCE rates.
For the fourth quarter of 2014, voyage expenses were $21.7 million compared to $0.7 million for the fourth quarter of 2013. The increase in voyage expenses was due to the increase in the average number of vessels in the fourth quarter of 2014, as a result of the acquisition of Oceanbulk, the Pappas Companies, two Heron Vessels and most of the Excel Vessels and the increased level of spot market activity.
For the fourth quarter of 2014 and 2013, vessel operating expenses totalled $22.0 million and $6.6 million respectively. The increase in operating expenses was mainly due to the higher average number of vessels in the fourth quarter of 2014 compared to the fourth quarter of 2013. Our average daily operating expenses per vessel for the fourth quarter of 2014 were $4,704 compared to $5,392 during the fourth quarter of 2013, representing 13% reduction, as a result of synergies and economies of scale from operating a larger fleet. In addition vessel operating expenses for the fourth quarter of 2014 and 2013, include an amount of $1.5 million and $0.2 million, respectively, related to one time pre-delivery and pre-joining expenses incurred in connection with the delivery of the new vessels in our fleet during the fourth quarter of 2014 and 2013, respectively. Pre-joining and pre-delivery expenses relate to the expenses for the initial crew manning, as well as the initial supply of stores for the vessel upon delivery.
Dry docking expenses for the fourth quarter of 2014 and 2013 amounted to $0.5 million and $1.3 million respectively. The amount of the dry docking expense for a vessel is highly dependent on the size, age, and overall condition of the vessel. During the fourth quarter of 2014, only one of our Supramax vessels underwent dry docking survey, which was commenced in late December 2014 and completed in January 2015. During the fourth quarter of 2013, two Supramax vessels underwent dry docking surveys.
Depreciation expense increased to $16.6 million for the fourth quarter of 2014, compared to $4.0 million for the fourth quarter of 2013, due to the increase in the average number of vessels in our fleet and the corresponding increase in the depreciable asset base.
General and Administrative expenses, for the fourth quarter of 2014 and 2013 were $7.8 million and $2.7 million, respectively. This increase was mainly due to a 153% increase in our average number of employees during the fourth quarter of 2014 compared to the same period in 2013, due to the increase of our fleet to 50.8 vessels on average in the fourth quarter of 2014, as compared to 13.2 vessels on average in the fourth quarter of 2013.
For the fourth quarter of 2014 other operational gain amounted to $0.2 million and regards a gain from a protection and indemnity claim. For the fourth quarter of 2013, other operational gain amounted to $0.5 million representing the payment of the instalments due to us, under a previous settlement agreement for a commercial claim.
In September 2010, we signed an agreement to sell a 45% interest in the future proceeds related to the settlement of certain commercial claims. As a result, in connection with the settlement amount of $0.5 million described in other operational gain above, during the fourth quarter of 2013, we incurred an expense of $0.2 million which is included under other operational loss.
Interest and finance costs for the fourth quarter of 2014 and 2013 were $5.0 million and $1.3 million, respectively. The increase is attributable to higher average balance of our outstanding indebtedness amounting to $692.3 million for the fourth quarter of 2014 compared to $191.8 million for the fourth quarter of 2013. Additionally for the fourth quarter of 2014, interest and finance costs included an amount of $1.0 million relating to realized interest rate swap loss. There was no interest swap loss included in the interest and finance costs for the fourth quarter of 2013 since at that time our interest rate swaps did not qualify for hedge accounting. Interest and finance costs for the fourth quarter of 2014 and 2013, included interest capitalized from general debt amounting to $3.5 million and $0.5 million, respectively, in connection with the payments made for our newbuilding vessels.
During the fourth quarter of 2014, we recorded an amount of $0.7 million under loss on debt extinguishment, in connection with the non-cash write off of unamortized deferred finance charges due to the partial prepayment of Excel Vessel Bridge Facility.
10
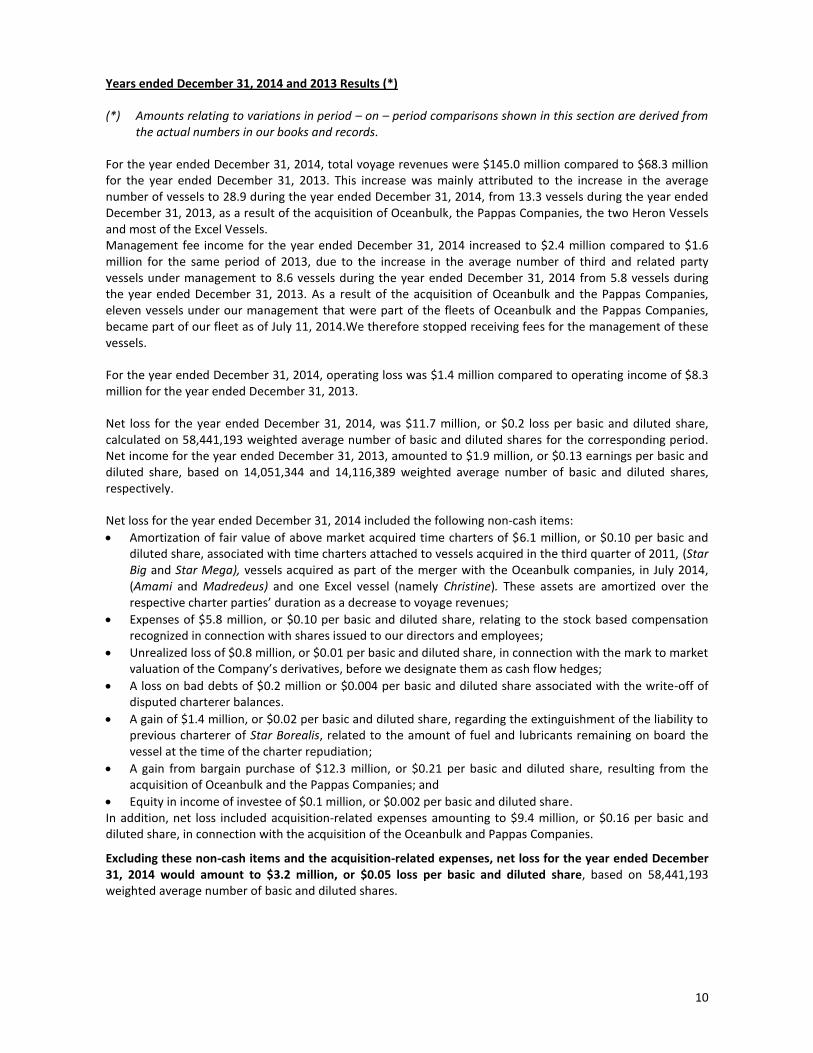
Years ended December 31, 2014 and 2013 Results (*)
(*) Amounts relating to variations in period – on – period comparisons shown in this section are derived from the actual numbers in our books and records.
For the year ended December 31, 2014, total voyage revenues were $145.0 million compared to $68.3 million for the year ended December 31, 2013. This increase was mainly attributed to the increase in the average number of vessels to 28.9 during the year ended December 31, 2014, from 13.3 vessels during the year ended December 31, 2013, as a result of the acquisition of Oceanbulk, the Pappas Companies, the two Heron Vessels and most of the Excel Vessels. Management fee income for the year ended December 31, 2014 increased to $2.4 million compared to $1.6 million for the same period of 2013, due to the increase in the average number of third and related party vessels under management to 8.6 vessels during the year ended December 31, 2014 from 5.8 vessels during the year ended December 31, 2013. As a result of the acquisition of Oceanbulk and the Pappas Companies, eleven vessels under our management that were part of the fleets of Oceanbulk and the Pappas Companies, became part of our fleet as of July 11, 2014.We therefore stopped receiving fees for the management of these vessels.
For the year ended December 31, 2014, operating loss was $1.4 million compared to operating income of $8.3 million for the year ended December 31, 2013.
Net loss for the year ended December 31, 2014, was $11.7 million, or $0.2 loss per basic and diluted share, calculated on 58,441,193 weighted average number of basic and diluted shares for the corresponding period. Net income for the year ended December 31, 2013, amounted to $1.9 million, or $0.13 earnings per basic and diluted share, based on 14,051,344 and 14,116,389 weighted average number of basic and diluted shares, respectively.
Net loss for the year ended December 31, 2014 included the following non-cash items:
Amortization of fair value of above market acquired time charters of $6.1 million, or $0.10 per basic and diluted share, associated with time charters attached to vessels acquired in the third quarter of 2011, (Star Big and Star Mega), vessels acquired as part of the merger with the Oceanbulk companies, in July 2014, (Amami and Madredeus) and one Excel vessel (namely Christine). These assets are amortized over the respective charter parties’ duration as a decrease to voyage revenues;
Expenses of $5.8 million, or $0.10 per basic and diluted share, relating to the stock based compensation recognized in connection with shares issued to our directors and employees;
Unrealized loss of $0.8 million, or $0.01 per basic and diluted share, in connection with the mark to market valuation of the Company’s derivatives, before we designate them as cash flow hedges;
A loss on bad debts of $0.2 million or $0.004 per basic and diluted share associated with the write-off of disputed charterer balances.
A gain of $1.4 million, or $0.02 per basic and diluted share, regarding the extinguishment of the liability to previous charterer of Star Borealis, related to the amount of fuel and lubricants remaining on board the vessel at the time of the charter repudiation;
A gain from bargain purchase of $12.3 million, or $0.21 per basic and diluted share, resulting from the acquisition of Oceanbulk and the Pappas Companies; and
Equity in income of investee of $0.1 million, or $0.002 per basic and diluted share. In addition, net loss included acquisition-related expenses amounting to $9.4 million, or $0.16 per basic and diluted share, in connection with the acquisition of the Oceanbulk and Pappas Companies.
Excluding these non-cash items and the acquisition-related expenses, net loss for the year ended December 31, 2014 would amount to $3.2 million, or $0.05 loss per basic and diluted share, based on 58,441,193 weighted average number of basic and diluted shares.

11
Net income for the year ended December 31, 2013 included the following non-cash items:
Amortization of fair value of above market acquired time charters of $6.4 million, or $0.45 per basic and diluted share, associated with acquired time charters of Star Big and the Star Mega. These assets are amortized over their remaining period as a decrease to voyage revenues;
Expenses of $1.5 million, or $0.11 per basic and diluted share, relating to stock based compensation recognized in connection with the shares issued to our directors and employees;
Unrealized gain of $0.1 million, or $0.01 per basic and diluted share, in connection with the mark to market valuation of our derivatives, which had not been designated as cash flow hedges; and
Loss on sale of vessel of $0.1 million or $0.01 per basic and diluted share in connection with the sale of Star Sigma, which concluded in March 2013.
Excluding these non-cash items, net income for the year ended December 31, 2013 would amount to $9.7 million, or $0.69 earnings per basic and diluted share, respectively, based on 14,051,344 and 14,116,389 weighted average number of basic and diluted shares, respectively.
Adjusted EBITDA for the year ended December 31, 2014 and 2013, was $43.6 million and $32.3 million, respectively. A reconciliation of EBITDA and adjusted EBITDA to net cash provided by cash flows from operating activities is set forth below under the heading “EBITDA and adjusted EBITDA Reconciliation”.
We owned and operated an average of 28.9 and 13.3 vessels during the year ended December 31, 2014 and 2013, respectively, earning an average TCE daily rate of $12,161 and $14,427, respectively. We refer you to the information under the heading "Summary of Selected Data" set forth below for further information regarding our calculation of TCE rates.
For the year ended December 31, 2014, voyage expenses were $42.3 million compared to $7.5 million for the year ended December 31, 2013. The increase in voyage expenses was mainly due to the increase in the average number of vessels for the year ended December 31, 2014, as a result of the acquisition of Oceanbulk, the Pappas Companies, Heron Vessels and most of the Excel Vessels and the increased level of spot market activity.
For the year ended December 31, 2014 and 2013, vessel operating expenses were $53.1 million and $27.1 million, respectively. The increase in operating expenses was mainly due to higher average number of vessels during the year ended December 31, 2014 as compared to the year ended December 31, 2013. In addition, vessel operating expenses for the year ended December 31, 2014 and 2013 include an amount of $3.0 million and $0.2 million, respectively, related to one-time pre-delivery and pre-joining expenses incurred in connection with the delivery of the new vessels in our fleet. Pre-joining and pre-delivery expenses relate to the expenses for the initial crew manning, as well as the initial supply of stores for the vessel upon delivery. Our average daily operating expenses per vessel for the year ended December 31, 2014 were $5,037 compared to $5,564 during the year ended December 31, 2013, representing a 10% reduction, as a result of synergies and economies of scale from operating a larger fleet. Excluding the amount of pre-joining and pre-delivery expenses, our average daily operating expenses per vessel for the year ended December 31, 2014 and 2013 would have been $4,750 and $5,523, respectively, reduced by 14%.
Dry docking expenses for year ended December 31, 2014 and 2013 were $5.4 million and $3.5 million, respectively. During the year ended December 31, 2014, two of our Capesize vessels (one of which is among our oldest vessels; thus the relevant expense was high) and two Supramax vessel underwent dry docking surveys. During the year ended December 31, 2013, one Capesize and three Supramax vessels underwent dry docking surveys.
Depreciation expense increased to $37.2 million for the year ended December 31, 2014, compared to $16.1 million for the year ended December 31, 2013, due to the increase in the average number of vessels in our fleet and the corresponding increase in the depreciable asset base.

12
General and Administrative expenses, for the year ended December 31, 2014 and 2013 were $32.7 million and $9.9 million respectively. The increase was mainly due to: a) acquisition-related expenses of $9.4 million incurred during the year ended December 31, 2014, in
connection with the acquisition of Oceanbulk and the Pappas Companies; b) an 83% increase in our average number of employees during the year ended December 31, 2014
compared to the year ended December 31, 2013, due to the increase of our fleet to 28.9 vessels on average during the year ended December 31, 2014, as compared to 13.3 vessels on average during the year ended December 31, 2013; and
c) stock based compensation expense of $1.8 million during the year ended December 31, 2014 relating to a severance payment in shares to our former Chief Executive Officer.
Excluding acquisition related expenses and the non-cash stock based compensation expenses and deducting the management fee income, the net cash daily G&A expenses per vessel for the year ended December 31, 2014 and 2013 were $1,440 and $1,402, respectively. As a portion of the general and administrative expenses is fixed and not directly dependent on the number of vessels under management and as we have hired employees in anticipation of a greater fleet under management, going forward, we believe that our net daily cash G&A expenses per vessel will be reduced due to synergies and economies of scale.
Bad debt expenses was $ 0.2 million for the year ended December 31, 2014, representing a write-off related to unpaid hires from charterers since we determined that such amounts were not recoverable. No bad debt expense was recognized during the year ended December 31, 2013.
Other operational gain amounting to $10.0 million for the year ended December 31, 2014, consisted of:
a) $8.0 million of revenue from the sale to a non-related third party of the claim against the previous charterer of Star Borealis for charter party repudiation due to early redelivery of the vessel;
b) $1.4 million regarding the extinguishment of the liability to the previous charterer of Star Borealis, related to the amount of fuel and lubricants remaining on board at the time of the charter repudiation;
c) $0.2 million received as a rebate from our previous manning agent; and d) a $0.5 million gain derived from a hull and machinery and protection and indemnity claims. Other operational gain amounting to $3.8 million during the year ended December 31, 2013 mainly consisted of revenues of $2.7 million, representing payment of installments due to us under settlement agreements for two commercial claims and a gain of $1.0 million from a hull and machinery claim.
For the year ended December 31, 2014, other operational loss was $0.1 million. In September 2010, we signed an agreement to sell a 45% interest in the future proceeds related to the settlement of certain commercial claims. As a result, in connection with the settlement of one of the commercial claims described in other operational gain above, during the year ended December 31, 2013, we incurred an expense of $1.1 million, which is included under other operational loss for the year ended December 31, 2013.
For the year ended December 31, 2013, loss on sale of vessel of $0.1 million represents a loss on sale of Star Sigma that concluded in March 2013. The vessel was delivered to her new owners in April 2013.
During the year ended December 31, 2014, we recorded a gain from bargain purchase of $ 12.3 million, resulting from the acquisition of Oceanbulk and the Pappas Companies, representing the excess of the fair value of the net assets acquired over the aggregate purchase consideration.
Loss on derivative financial instruments of $0.8 million for the year ended December 31, 2014 represents the non-cash loss from the mark to market valuation of four of our interest rate swaps up to August 31, 2014, the date we designated the respective interest rate swaps as cash flow hedges. The change in the fair value of these swaps, after the hedging designation had been recorded in equity to the extent these hedges were effective. Gain on derivative financial instruments of $0.09 million during the year ended December 31, 2013, represented the non-cash gain from the mark to market valuation of two interest rate swaps outstanding as of December 31, 2013 that were not designated as cash flow hedges.
For the year ended December 31, 2014 and 2013, interest and finance costs were $9.6 million and $6.8 million, respectively. The increase is attributable to higher average balance of our outstanding indebtedness amounting

13
to $412.3 million for the year ended December 31, 2014 compared to $200.2 million for the year ended December 31, 2013. Additionally for the year ended December 31, 2014 interest and finance costs included an amount of $1.1 million relating to interest rate swap loss. No interest swap loss was included in interest and finance costs for the year ended December 31, 2013 since at that time our interest rate swaps did not qualify for hedge accounting. Interest and finance costs for the year ended December 31, 2014 and 2013, also included interest capitalized from general debt amounting to $7.8 million and $0.6 million, respectively, in connection with the payments made for our newbuilding vessels.
During the year ended December 31, 2014, we recorded an amount of $0.7 million under loss on debt extinguishment, in connection with the non-cash write off of unamortized deferred finance charges due to the partial prepayment of Excel Vessel Bridge Facility.

14
Liquidity and Capital Resources
Cash Flows Net cash provided by operating activities for the year ended December 31, 2014 and 2013, were $12.8 million and $27.5 million, respectively. The TCE rate for the year ended December 31, 2014 and 2013 was $12,161 and $14,427, respectively.
Net cash used in investing activities for the year ended December 31, 2014 and 2013 was $437.1 million and $107.6 million, respectively.
For the year ended December 31, 2014, net cash used in investing activities consisted of:
$117.9 million paid for advances and other capitalized expenses for our newbuilding vessels,
$400.0 million paid for the acquisition of secondhand vessels (including Heron Vessels and most of the Excel Vessels),
$0.6 million paid for the acquisition of other fixed assets,
$0.2 million paid for the acquisition of 33% of the total outstanding common stock of Interchart Shipping Inc., a Liberian company that acts as a chartering broker to our fleet,
$4.9 million cash consideration paid for the acquisition of the above fair market charter parties attached to Excel Vessels namely Christine, Lowlands Beilun, Sandra, and
a net increase of $11.5 million in restricted cash, offset by:
hull and machinery insurance proceeds amounting to $0.6 million,
$96.3 million cash assumed as part of the acquisition of Oceanbulk and the Pappas Companies acquisition and
$1.1 million received, representing the 20% advance received based on the agreement signed in December 2014 to sell the vessel Star Kim (one of the Excel Vessels), which was delivered to her new owners in January 2015.
For the year ended December 31, 2013, net cash used in investing activities consisted of:
$67.9 million paid for advances and other capitalized expenses for our newbuilding vessels,
$59.9 million paid for the acquisition of secondhand vessels and other fixed assets, offset by:
$8.3 million of proceeds from the sale of Star Sigma,
a decrease of $7.7 million in restricted cash and
$4.3 million of hull and machinery insurance proceeds.
Net cash provided by financing activities for the year ended December 31, 2014 and 2013 was $456.7 and $112.0 million, respectively.
For the year ended December 31, 2014, net cash provided by financing activities consisted of:
proceeds from bank loans and Excel Vessel Bridge Facility of $587.2 million for the financing of a) delivery installments for three of our newbuilding vessels (two of them delivered in 2014 and one delivered in early January 2015), b) secondhand vessels and c) partial refinancing of the Excel Vessel Bridge Facility,
$50.0 million proceeds from the issuance of our senior unsecured notes due 2019,
financing fees paid amounting to $6.5 million and
loan regular repayment installments as well as partial prepayment of Excel Vessel Bridge Facility amounting to $173.9 million.
For the year ended December 31, 2013, net cash provided by financing activities consisted of:
gross proceeds from the rights offering and the underwritten public offering amounting to$150.9 million less offering expenses of $4.9 million,
loan installment payments and prepayments of $33.8 million and
$0.3 million of financing fees paid.
15
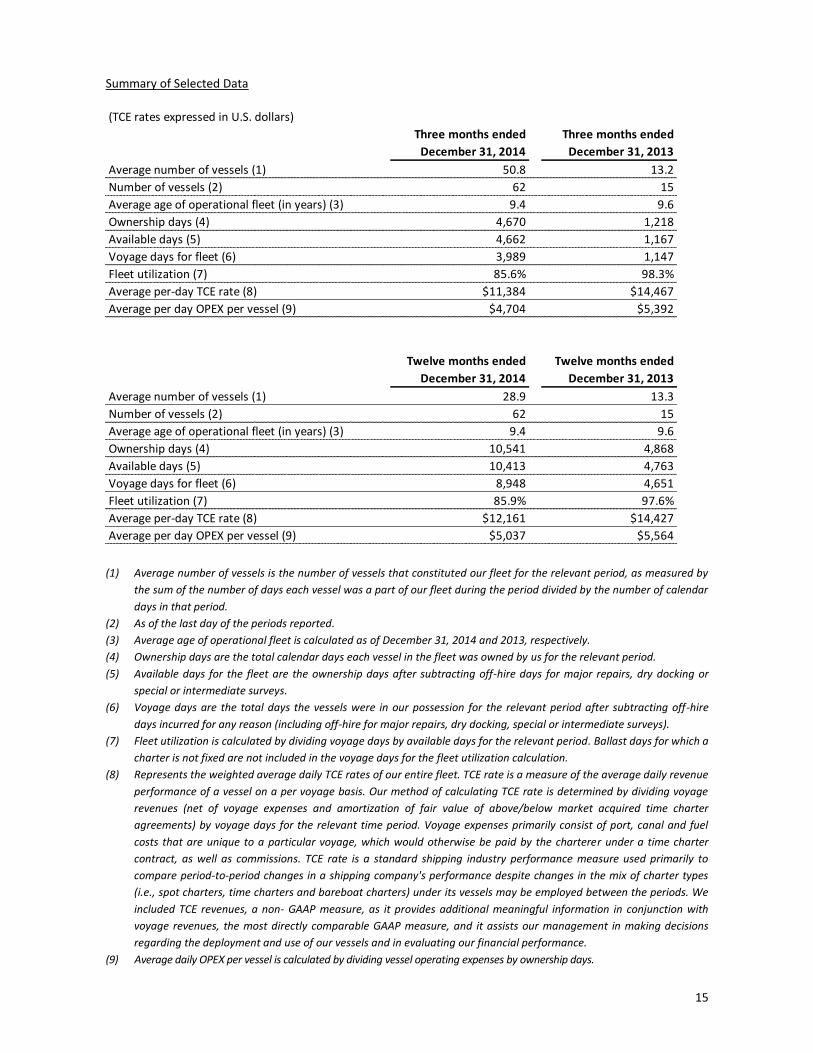
Summary of Selected Data
(1) Average number of vessels is the number of vessels that constituted our fleet for the relevant period, as measured by
the sum of the number of days each vessel was a part of our fleet during the period divided by the number of calendar
days in that period.
(2) As of the last day of the periods reported.
(3) Average age of operational fleet is calculated as of December 31, 2014 and 2013, respectively.
(4) Ownership days are the total calendar days each vessel in the fleet was owned by us for the relevant period.
(5) Available days for the fleet are the ownership days after subtracting off-hire days for major repairs, dry docking or
special or intermediate surveys.
(6) Voyage days are the total days the vessels were in our possession for the relevant period after subtracting off-hire
days incurred for any reason (including off-hire for major repairs, dry docking, special or intermediate surveys).
(7) Fleet utilization is calculated by dividing voyage days by available days for the relevant period. Ballast days for which a
charter is not fixed are not included in the voyage days for the fleet utilization calculation.
(8) Represents the weighted average daily TCE rates of our entire fleet. TCE rate is a measure of the average daily revenue
performance of a vessel on a per voyage basis. Our method of calculating TCE rate is determined by dividing voyage
revenues (net of voyage expenses and amortization of fair value of above/below market acquired time charter
agreements) by voyage days for the relevant time period. Voyage expenses primarily consist of port, canal and fuel
costs that are unique to a particular voyage, which would otherwise be paid by the charterer under a time charter
contract, as well as commissions. TCE rate is a standard shipping industry performance measure used primarily to
compare period-to-period changes in a shipping company's performance despite changes in the mix of charter types
(i.e., spot charters, time charters and bareboat charters) under its vessels may be employed between the periods. We
included TCE revenues, a non- GAAP measure, as it provides additional meaningful information in conjunction with
voyage revenues, the most directly comparable GAAP measure, and it assists our management in making decisions
regarding the deployment and use of our vessels and in evaluating our financial performance.
(9) Average daily OPEX per vessel is calculated by dividing vessel operating expenses by ownership days.
(TCE rates expressed in U.S. dollars)
Three months ended Three months ended
December 31, 2014 December 31, 2013
Average number of vessels (1) 50.8 13.2
Number of vessels (2) 62 15
Average age of operational fleet (in years) (3) 9.4 9.6
Ownership days (4) 4,670 1,218
Available days (5) 4,662 1,167
Voyage days for fleet (6) 3,989 1,147
Fleet utilization (7) 85.6% 98.3%
Average per-day TCE rate (8) $11,384 $14,467
Average per day OPEX per vessel (9) $4,704 $5,392
Twelve months ended Twelve months ended
December 31, 2014 December 31, 2013
Average number of vessels (1) 28.9 13.3
Number of vessels (2) 62 15
Average age of operational fleet (in years) (3) 9.4 9.6
Ownership days (4) 10,541 4,868
Available days (5) 10,413 4,763
Voyage days for fleet (6) 8,948 4,651
Fleet utilization (7) 85.9% 97.6%
Average per-day TCE rate (8) $12,161 $14,427
Average per day OPEX per vessel (9) $5,037 $5,564

16
Unaudited Consolidated Condensed Statement of Operations
(Expressed in thousands of U.S. dollars except for
share and per share data)
Three
months
ended
December
31, 2014
Three
months
ended
December
31, 2013
Twelve
months
ended
December
31, 2014
Twelve
months
ended
December
31, 2013
Revenues:
Voyage Revenues 65,500 15,662 145,041 68,296
Management Fee Income 150 687 2,346 1,598
Total revenues 65,650 16,349 147,387 69,894
Expenses:
Voyage expenses (21,671) (669) (42,341) (7,549)
Vessel operating expenses (21,967) (6,568) (53,096) (27,087)
Dry-docking expenses (484) (1,342) (5,363) (3,519)
Depreciation (16,640) (4,034) (37,150) (16,061)
Management fees (35) - (158) -
Bad debt expense - - (215) -
General and administrative expenses (7,756) (2,702) (32,723) (9,910)
Other operational gain 219 499 10,003 3,787
Other operational loss - (225) (94) (1,125)
Loss on sale of vessel - - - (87)
Gain from bargain purchase - - 12,318 -
Operating income (2,684) 1,308 (1,432) 8,343
Interest and finance costs (4,985) (1,309) (9,575) (6,814)
Interest and other income 174 24 629 230
Loss on debt extinguishment (652) - (652) -
(Loss) / Gain on derivative financial instruments (4) 31 (799) 91
Total other expenses, net (5,467) (1,254) (10,397) (6,493)
Income / (loss) before equity in investee (8,151) 54 (11,829) 1,850
Equity in income of investee 77 - 106 -
Net income / (loss) (8,074) 54 (11,723) 1,850
Earnings / (loss) per share, basic (0.083)$ 0.002$ (0.20)$ 0.13$
Earnings / (loss) per share, diluted (0.083)$ 0.002$ (0.20)$ 0.13$
Weighted average number of shares outstanding,
basic97,623,578 28,286,004 58,441,193 14,051,344
Weighted average number of shares outstanding,
diluted97,623,578 28,488,902 58,441,193 14,116,389

17
Unaudited Consolidated Condensed Balance Sheets
Unaudited Cash Flow Data
ASSETSDecember 31,
2014
December 31,
2013
Cash and restricted cash 89,352 55,410
Other current assets 45,078 8,269
TOTAL CURRENT ASSETS 134,430 63,679
Advances for vessels under construction and acquisition
of vessels and other assets454,612 67,932
Vessels and other fixed assets, net 1,441,851 326,674Long-term investment 634 0Restricted cash 10,620 620Fair value of above market acquired time charter 11,908 7,978
Other non-current assets 8,029 1,205
TOTAL ASSETS 2,062,084 468,088
Current portion of long-term debt (including Excel Vessels
Brigde Facility)96,485 18,286
Other current liabilities 43,713 11,448
TOTAL CURRENT LIABILITIES 140,198 29,734
Long-term debt (including Excel Vessel Brigde Facility) 715,308 172,048
8% 2019 Senior Notes 50,000
Other non-current liabilities 2,276 200
TOTAL LIABILITIES 907,782 201,982
STOCKHOLDERS' EQUITY 1,154,302 266,106
TOTAL LIABILITIES AND STOCKHOLDERS' EQUITY 2,062,084 468,088
(Expressed in thousands of U.S. dollars)
12,819 27,495
(437,075) (107,618)
456,708 111,971
Twelve months
ended
December 31,
2013
Net cash provided by operating activities
Net cash used in investing activities
Net cash provided by financing activities
Twelve months
ended
December 31,
2014
(Expressed in thousands of U.S. dollars)

18
EBITDA and adjusted EBITDA Reconciliation
We consider EBITDA to represent net income before interest, income taxes, depreciation and amortization.
EBITDA does not represent and should not be considered as an alternative to net income or cash flow from
operations, as determined by United States generally accepted accounting principles, or U.S. GAAP, and our
calculation of EBITDA may not be comparable to that reported by other companies. EBITDA is included herein
because it is a basis upon which we assess our liquidity position, it is used by our lenders as a measure of our
compliance with certain loan covenants and because we believe that it presents useful information to investors
regarding our ability to service and/or incur indebtedness.
We excluded non-cash gains/losses related to sale of vessels, loss on bad debt, change in fair value of
derivatives, stock-based compensation expense recognized during the period and certain other items (such as
the transaction costs incurred in connection with the acquisition of Oceanbulk and the Pappas Companies) to
derive adjusted EBITDA. We excluded the above non-cash items and one-time items to derive adjusted EBITDA,
because we believe that these items do not reflect the operational cash inflows and outflows of our fleet.
The following table reconciles net cash provided by operating activities to EBITDA and adjusted EBITDA:
(Expressed in thousands of U.S. dollars
Twelve months
ended
December 31,
2014
Twelve months
ended
December 31,
2013
Three months
ended
December 31,
2014
Three months
ended
December 31,
2013
Net cash provided by/(used in) operating
activities 12,819 27,495 5,150 5,064
Net decrease / (increase) in current assets 23,507 (4,183) (2,079) 356
Net increase / (decrease) in operating liabilities,
excluding current portion of long term debt(9,709) 1,927 9,756 796
Loss on debt extinguishment (652) - (652)
Stock – based compensation (5,834) (1,488) (998) (444)
Change in fair value of derivatives (1,717) 91 (863) 31
Total other expenses, net 8,917 6,062 5,220 1,171
Loss on sale of vessel - (87) - -
Bad debt expense (215) - - -
Gain from Hull & Machinery claim 237 1,030 - -
Gain from bargain purchase 12,318 - - -
Write-off of liability in other operational gain
(non cash gain)1,361 - - -
Equity in income of investee 106 - 77 -
EBITDA 41,138 30,847 15,611 6,974
Less:
Change in fair value of derivatives - (91) - (31)
Gain from bargain purchase (12,318) - - -
Write-off of liability in other operational gain non
cash gain(1,361) - - -
Equity in income of investee (106) - (77) -
Plus:
Change in fair value of derivatives 799 - 4 -
Stock-based compensation 5,834 1,488 998 444
Loss on sale of vessel - 87 - -
Loss on bad debt 215 - - -
Severance cash payment 891 - - -
Transaction costs related to Oceanbulk & Pappas
companies acquisition8,473 - 28 -
Adjusted EBITDA 43,565 32,331 16,564 7,387
19
Conference Call details:
Our management team will host a conference call to discuss our financial results tomorrow, March 20, 2015, at 11 a.m., Eastern Time (ET).
Participants should dial into the call 10 minutes before the scheduled time using the following numbers: 1(866) 819-7111 (from the US), 0(800) 953-0329 (from the UK) or + (44) (0) 1452 542 301 (from outside the US). Please quote "Star Bulk."
A replay of the conference call will be available until Friday March 27, 2015. The United States replay number is 1(866) 247-4222; from the UK 0(800) 953-1533; the standard international replay number is (+44) (0) 1452 550 000 and the access code required for the replay is: 3128607#.
Slides and audio webcast: There will also be a simultaneous live webcast over the Internet, through the Star Bulk website (www.starbulk.com). Participants to the live webcast should register on the website approximately 10 minutes prior to the start of the webcast.
About Star Bulk Star Bulk is a global shipping company providing worldwide seaborne transportation solutions in the dry bulk sector. Star Bulk’s vessels transport major bulks, which include iron ore, coal and grain and minor bulks which include bauxite, fertilizers and steel products. Star Bulk was incorporated in the Marshall Islands on December 13, 2006 and maintains executive offices in Athens, Greece. Its common stock trades on the Nasdaq Global Select Market under the symbol "SBLK”. On a fully delivered basis, Star Bulk will have a fleet of 98 vessels, with an aggregate capacity of 11.5 million dwt, consisting of Newcastlemax, Capesize, Kamsarmax, Panamax, Post-Panamax, Ultramax, Supramax and Handymax vessels with carrying capacities between 45,588 dwt and 209,000 dwt. Our fleet currently includes 66 operating vessels, 1 second hand vessel to be delivered by March 31, 2015 and 32 newbuilding vessels currently under construction at shipyards in Japan and China. All of the newbuilding vessels are expected to be delivered during 2015 and 2016.
Forward-Looking Statements Matters discussed in this press release may constitute forward-looking statements. The Private Securities Litigation Reform Act of 1995 provides safe harbor protections for forward-looking statements in order to encourage companies to provide prospective information about their business. Forward-looking statements include statements concerning plans, objectives, goals, strategies, future events or performance, and underlying assumptions and other statements, which are other than statements of historical facts.
The Company desires to take advantage of the safe harbor provisions of the Private Securities Litigation Reform Act of 1995 and is including this cautionary statement in connection with this safe harbor legislation. The words “believe,” “anticipate,” “intends,” “estimate,” “forecast,” “project,” “plan,” “potential,” “may,” “should,” “expect,” “pending” and similar expressions identify forward-looking statements.
The forward-looking statements in this press release are based upon various assumptions, many of which are based, in turn, upon further assumptions, including without limitation, examination by the Company’s management of historical operating trends, data contained in its records and other data available from third parties. Although the Company believes that these assumptions were reasonable when made, because these assumptions are inherently subject to significant uncertainties and contingencies which are difficult or impossible to predict and are beyond the Company’s control, the Company cannot assure you that it will achieve or accomplish these expectations, beliefs or projections.
In addition to these important factors, other important factors that, in the Company’s view, could cause actual results to differ materially from those discussed in the forward-looking statements include general dry bulk shipping market conditions, including fluctuations in charterhire rates and vessel values, the strength of world economies the stability of Europe and the Euro, fluctuations in interest rates and foreign exchange rates, changes in demand in the dry bulk shipping industry, including the market for our vessels, changes in our

20
operating expenses, including bunker prices, dry docking and insurance costs, changes in governmental rules and regulations or actions taken by regulatory authorities, potential liability from pending or future litigation, general domestic and international political conditions, potential disruption of shipping routes due to accidents or political events, the availability of financing and refinancing, our ability to meet requirements for additional capital and financing to complete our newbuilding program and grow our business, vessel breakdowns and instances of off‐hire, risks associated with vessel construction, potential exposure or loss from investment in derivative instruments, potential conflicts of interest involving our Chief Executive Officer, his family and other members of our senior management, and our ability to complete acquisition transactions as planned. Please see our filings with the Securities and Exchange Commission for a more complete discussion of these and other risks and uncertainties. The information set forth herein speaks only as of the date hereof, and the Company disclaims any intention or obligation to update any forward‐looking statements as a result of developments occurring after the date of this communication.
Contacts
Company:
Simos Spyrou, Christos Begleris
Co ‐ Chief Financial Officers
Star Bulk Carriers Corp.
c/o Star Bulk Management Inc.
40 Ag. Konstantinou Av.
Maroussi 15124
Athens, Greece
Email: [email protected]
www.starbulk.com
Investor Relations / Financial Media:
Nicolas Bornozis
President
Capital Link, Inc.
230 Park Avenue, Suite 1536
New York, NY 10169
Tel. (212) 661‐7566
E‐mail: [email protected]
www.capitallink.com