Embed Size (px)
Citation preview

FOURTH QUARTER 2015 EARNINGS CALLFebruary 29, 2016
FOURTH QUARTER EARNINGS CALL AGENDA
2Fourth Quarter 2015 Earnings Call
Fourth Quarter Update – Robert Abernathy, Chairman
and Chief Executive Officer
Fourth Quarter Results and 2016 Outlook – Steve Voskuil, Chief Financial Officer
CONFERENCE CALL REMINDERS
3Fourth Quarter 2015 Earnings Call
FORWARD-LOOKING INFORMATION
Certain matters in this presentation and conference call, including our 2016 outlook, expectations and planning assumptions, and any estimates, projections, and statements relating to our business plans or objectives, constitute forward-looking statements and are based upon management’s expectations and beliefs concerning future events impacting the Company.
These statements are subject to risks and uncertainties, including currency exchange risks, cost savings and reductions, raw material, energy, and other input costs, competition, market demand, economic condition, and legislative and regulatory actions. There can be no assurance that these future events will occur as anticipated or that the Company’s results will be as estimated. Forward-looking statements speak only as of the date they were made, and we undertake no obligation to publicly update them. For a more complete listing and description of other factors that could cause the Company’s future results to differ materially from those expressed in any forward-looking statements, see the Company’s most recent Form 10-K and Quarterly Reports on Form 10-Q.
NON-GAAP FINANCIAL MEASURES
Management believes that non-GAAP financial measures enhance investors’ understanding and analysis of the company’s performance. As such, results and outlook have been adjusted to exclude certain items for relevant time periods as indicated in the non-GAAP reconciliations to the comparable GAAP financial measures included in this presentation and in today’s earnings release posted on our website (www.halyardhealth.com/investors).

FOURTH QUARTER UPDATEROBERT ABERNATHY, CHAIRMAN AND CHIEF EXECUTIVE OFFICER

FOURTH QUARTER UPDATE
5
• Achieved 2015 goals of completing the separation and building capabilities
- Exiting TSAs, establishing capabilities, rebranding & repackaging
- Medical Devices performed in line with expectations
• Initiate first steps in transformation
Fourth Quarter 2015 Earnings Call
FOURTH QUARTER AND FULL-YEAR RESULTS
6Fourth Quarter 2015 Earnings Call
• Faced difficult S&IP markets
- Defending leading market positions
- Bringing innovation to our categories
- Maximizing cash flow
• Results in line with revised expectations
- Fourth quarter adjusted diluted EPS of $0.57
- Full-year adjusted diluted EPS of $2.11
- Fourth quarter net sales totaled $401 million
- Net sales for 2015 were $1.6 billion

MEDICAL DEVICES RESULTS
7Fourth Quarter 2015 Earnings Call
• Solid quarter with 6 percent growth- Third consecutive quarter of 5 percent or
more growth
- Three percent growth for the year
• Growth driven by Interventional Pain- Continued robust performance from COOLIEF
• ON-Q volume returned to growth
• Respiratory and Digestive Health in line with expectations

SURGICAL AND INFECTION PREVENTION RESULTS
8Fourth Quarter 2015 Earnings Call
• Fourth quarter net sales declined 9 percent- Cycled against a strong quarter a year ago
• Annual net sales in line with revised expectations
• Challenging markets- Input costs declined
- Selling prices contracted
- Aggressive competition for market share
• Dynamics expected to continue in 2016

BALANCE SHEET AND CASH FLOW
9Fourth Quarter 2015 Earnings Call
• Ended the year with $130 million of cash - Reduced debt by $50 million
• Balanced cash generation
• 2016 free cash flow generation in excess of $100 million- Lower capital spending
- Lower separation expenses

10
HALYARD TRANSFORMATION
• Increase R&D investment
• Enhance Medical Devices
• Become leading Medical Devices company
PORTFOLIO CULTURE
• Healthcare focus
• Bold and agile
• Innovative spirit
COMPANY
• IT rationalization
• Gain operational efficiencies
• Optimize tax structure
Vision for the future of Halyard
Fourth Quarter 2015 Earnings Call

DELIVER OUR 2016 PLAN
11Fourth Quarter 2015 Earnings Call
Annual adjusted diluted EPS of $1.45 to $1.65
Net sales to decline 2 to 5 percent

FUEL GROWTH PIPELINE
12Fourth Quarter 2015 Earnings Call
• Accelerate investment in Pain platforms- Build on momentum and leading positions in non-
narcotic therapies
• Focus on innovation- Launch 10 product line extensions
• Complete first acquisition- Grow Medical Devices

13Fourth Quarter 2015 Earnings Call
• Built a solid foundation
• Ready to lead Halyard through next stage
• Confident in our strategy
FOURTH QUARTER SUMMARY

FOURTH QUARTER 2015 RESULTSSTEVE VOSKUIL, CHIEF FINANCIAL OFFICER

FOURTH QUARTER CONSOLIDATED PERFORMANCE
15Fourth Quarter 2015 Earnings Call
$439$401
Q4 2014 Q4 2015
Total Net Sales
36%
15%• Cycled against strong quarter; $13 million pandemic preparedness sales
• $10 million net sales impact due to unfavorable currency exchange rates
• Lower volumes to Kimberly-Clark
• Gross Margin impacted by lower production volumes
Change in NS Q4
Total Change -9%
Volume -2%
Price/Mix -2%
Currency -2%
Other -3%
Millions
$164
$136
Q4 2014 Q4 2015
Adjusted Gross Profit
37% 34%

FOURTH QUARTER CONSOLIDATED PERFORMANCE
16Fourth Quarter 2015 Earnings Call
$77
$41
Q4 2014 Q4 2015
Adjusted Operating Profit
18%
10%
36%
15%
• Lower S&IP sales volume and pricing
• Production curtailment
• Increased R&D investment
• Planned stand-alone costs
• Adjusted operating profit excludes:
- $8 million post-spin related charges
- $7 million intangible amortization expense
- $8 million for litigation matters
- $2 million downward revision of previously announced non-cash goodwill impairment
Millions
TAX UPDATE
17
• 2015 effective tax rate benefited from the passage of the R&D tax credit
• R&D tax credit not in 2015 guidance
• Took initial steps in tax planning
• Expect tax rate variability- Operational changes could cause upfront
increase followed by reductions in future years
Fourth Quarter 2015 Earnings Call

FOURTH QUARTER S&IP
18Fourth Quarter 2015 Earnings Call
$299
$263
Q4 2014 Q4 2015
S&IP Net Sales
36%
15%
$48
$27
Q4 2014 Q4 2015
Operating Profit
10%
• Cycled against strong quarter a year ago
• Share loss in Surgical Drapes and Gowns and Protective Apparel
• Lower operating profit due to lower sales volume and selling price, higher manufacturing costs and planned stand-alone costs
16%
Change in NS Q4
Total Change -12%
Volume -5%
Price/Mix -2%
Currency -3%
Other -2%
Millions
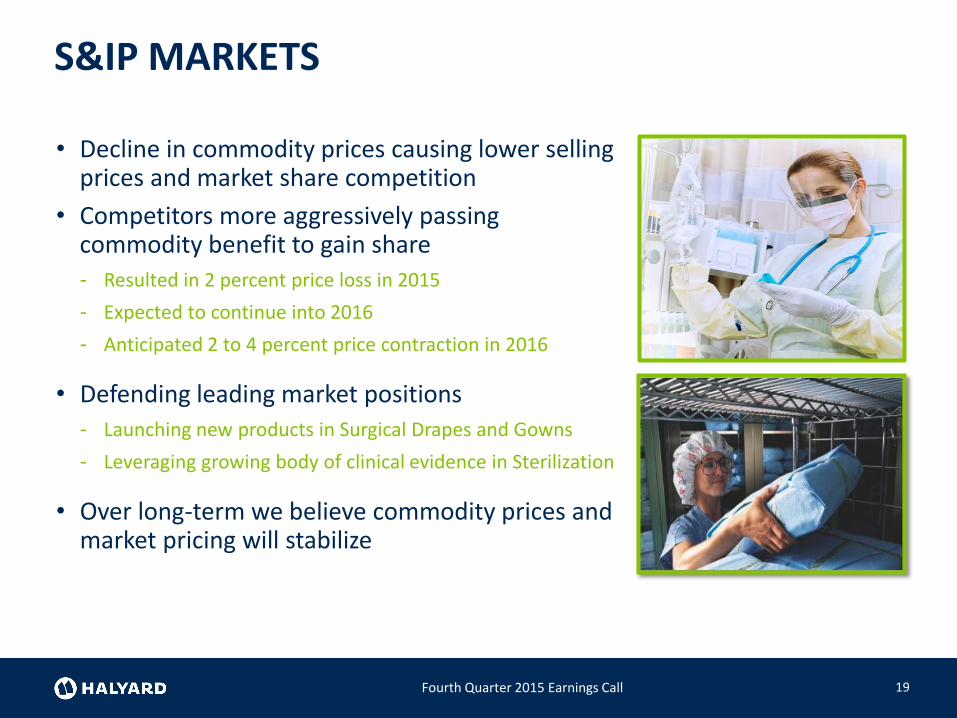
• Decline in commodity prices causing lower selling prices and market share competition
• Competitors more aggressively passing commodity benefit to gain share
- Resulted in 2 percent price loss in 2015
- Expected to continue into 2016
- Anticipated 2 to 4 percent price contraction in 2016
• Defending leading market positions
- Launching new products in Surgical Drapes and Gowns
- Leveraging growing body of clinical evidence in Sterilization
• Over long-term we believe commodity prices and market pricing will stabilize
19Fourth Quarter 2015 Earnings Call
S&IP MARKETS

$28
$21
Q4 2014 Q4 2015
Operating Profit
16%22%
FOURTH QUARTER MEDICAL DEVICES
20Fourth Quarter 2015 Earnings Call
$128
$134
Q4 2014 Q4 2015
Devices Net Sales
36%
15%• Third consecutive quarter of growth at or above 5 percent
• Continued momentum in COOLIEF
• Third consecutive quarter of growth for ON-Q; Second consecutive quarter of year-over-year growth
• Operating profit driven by higher volume and lower G&A offset by strategic R&D investment and increased selling expense
Change in NS Q4
Total Change 5%
Volume 6%
Price/Mix 0%
Currency -1%
Other 0%
Millions

2015 CONSOLIDATED PERFORMANCE
21Fourth Quarter 2015 Earnings Call
$1,672
$1,574
2014 2015
Total Net Sales
36%
15%
$617
$545
2014 2015
Adjusted Gross Profit
37% 35%
Millions
Change in NS 2015
Total Change -6%
Volume -1%
Price/Mix -1%
Currency -3%
Other -1%
• Currency negatively affected sales by 3 percent• Results impacted by lower sales to Kimberly-Clark

2015 CONSOLIDATED PERFORMANCE
22Fourth Quarter 2015 Earnings Call
36%
• Adjusted Operating Profit decreased due to lower selling prices, higher distribution costs and stand-alone costs
$326
$220
2014 2015
Adjusted EBITDA
$288
$181
2014 2015
Adjusted Operating Profit
17%11%
Millions

2015 S&IP
23Fourth Quarter 2015 Earnings Call
$1,139
$1,030
2014 2015
S&IP Net Sales
36%
15%
$166
$98
2014 2015
Operating Profit
10%
• Higher Exam Glove volume in Latin America & Asia-Pacific
• Lower volume in Surgical Drapes and Gowns, Facial Protection and Exam Gloves sales to Kimberly-Clark
• Selling prices declined primarily in Sterilization and Exam Gloves
• Operating profit declined due to lower volumes and selling prices, higher distribution and stand-alone costs
15%
Change in NS 2015
Total Change -10%
Volume -3%
Price/Mix -2%
Currency -3%
Other -2%
Millions

$105 $108
2014 2015
Operating Profit
21%21%
2015 MEDICAL DEVICES
24Fourth Quarter 2015 Earnings Call
$502$510
2014 2015
Devices Net Sales
36%
15%• Volume increase driven by strong demand in Interventional Pain
• Solid growth in Digestive Health
• Operating Profit increase driven by higher sales volume partially offset by higher selling and R&D expenses
Change in NS 2015
Total Change 2%
Volume 3%
Price/Mix 0%
Currency -1%
Other 0%
Millions

2016 OUTLOOKSTEVE VOSKUIL, CHIEF FINANCIAL OFFICER

2016 Outlook Summary
26Fourth Quarter 2015 Earnings Call
2016 Expectation
Adjusted diluted EPS $1.45 to $1.65
Net sales -2 to -5 percent
Medical Devices 3 to 5 percent
S&IP, excluding sales to Kimberly-Clark -3 to -5 percent
S&IP sales to Kimberly-Clark $40 to $45 million
Corporate sales $5 to $15 million
FX translation impact on net sales -0.5 to -1.5 percent
Commodity inflation $5 to $10 million
Research & Development $35 to $40 million
Spin-related transitional costs $10 to $15 million
Adjusted effective tax rate 33 to 35 percent

SUMMARY
27
• Delivered adjusted diluted EPS ahead of revised guidance
• Medical Devices growth in line with plan
• Committed to defending S&IP leading market share positions and innovating in our categories while maximizing cash flow
• Shifting our portfolio to faster growing, higher margin Medical Devices
Fourth Quarter 2015 Earnings Call

Q&A

APPENDICES
NON-GAAP RECONCILIATIONS
30Fourth Quarter 2015 Earnings Call
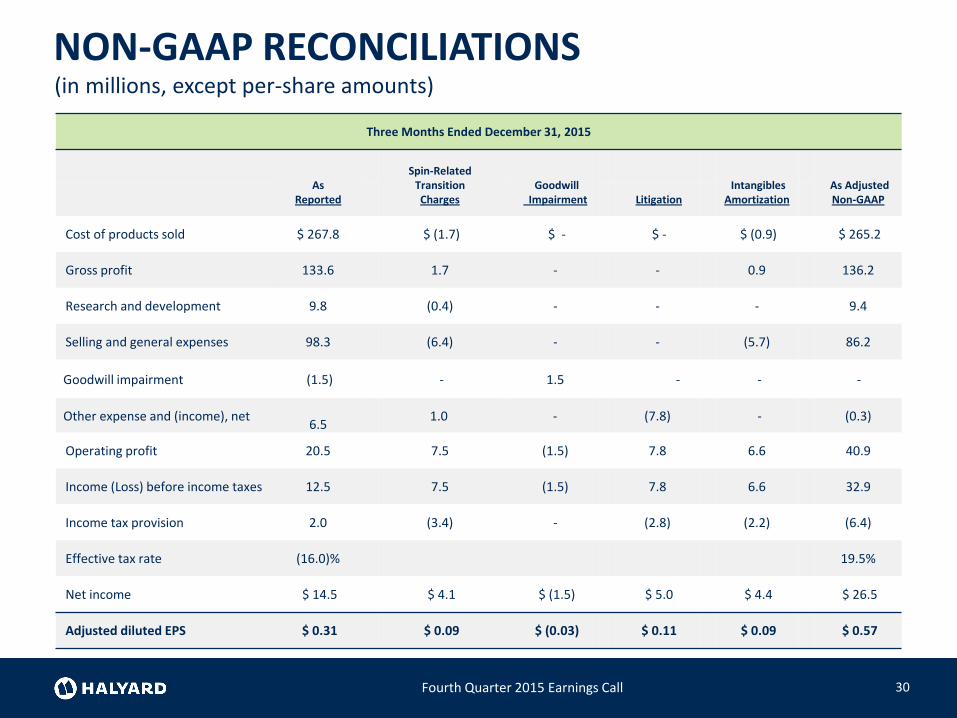
Three Months Ended December 31, 2015
AsReported
Spin-RelatedTransitionCharges
Goodwill Impairment
Intangibles Amortization
As Adjusted Non-GAAPLitigation
Cost of products sold $ 267.8 $ (1.7) $ - $ - $ (0.9) $ 265.2
Gross profit 133.6 1.7 - - 0.9 136.2
Research and development 9.8 (0.4) - - - 9.4
Selling and general expenses 98.3 (6.4) - - (5.7) 86.2
Goodwill impairment (1.5) - 1.5 - - -
Other expense and (income), net6.5
1.0 - (7.8) - (0.3)
Operating profit 20.5 7.5 (1.5) 7.8 6.6 40.9
Income (Loss) before income taxes 12.5 7.5 (1.5) 7.8 6.6 32.9
Income tax provision 2.0 (3.4) - (2.8) (2.2) (6.4)
Effective tax rate (16.0)% 19.5%
Net income $ 14.5 $ 4.1 $ (1.5) $ 5.0 $ 4.4 $ 26.5
Adjusted diluted EPS $ 0.31 $ 0.09 $ (0.03) $ 0.11 $ 0.09 $ 0.57
(in millions, except per-share amounts)
31Fourth Quarter 2015 Earnings Call
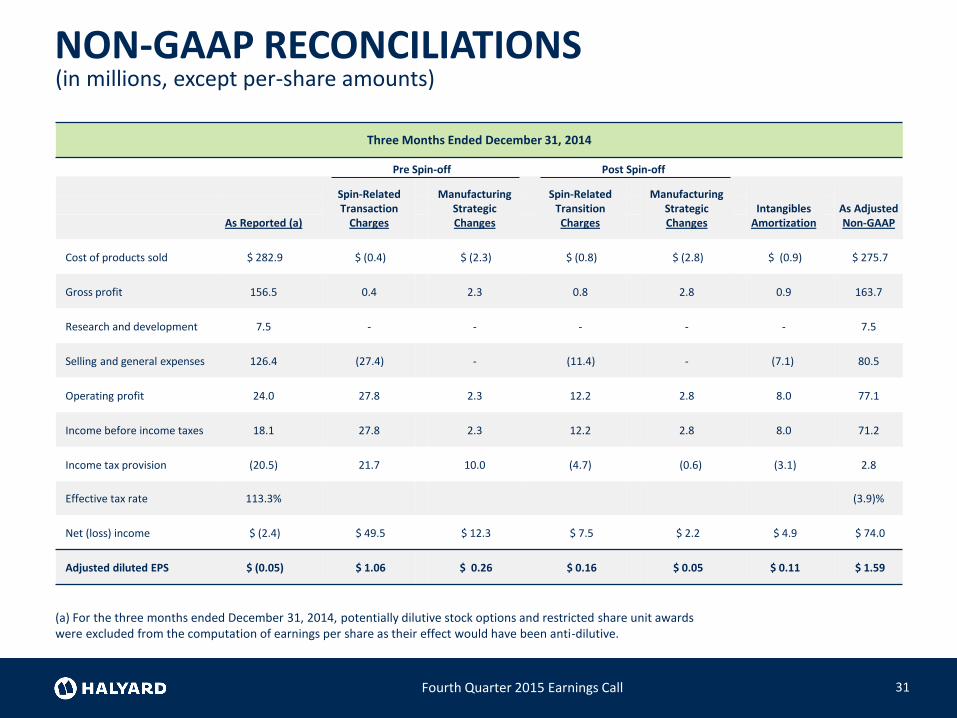
Three Months Ended December 31, 2014
Pre Spin-off Post Spin-off
Spin-RelatedTransaction
Charges
ManufacturingStrategicChanges
Spin-RelatedTransitionCharges
ManufacturingStrategicChanges
IntangiblesAmortization
As AdjustedNon-GAAPAs Reported (a)
Cost of products sold $ 282.9 $ (0.4) $ (2.3) $ (0.8) $ (2.8) $ (0.9) $ 275.7
Gross profit 156.5 0.4 2.3 0.8 2.8 0.9 163.7
Research and development 7.5 - - - - - 7.5
Selling and general expenses 126.4 (27.4) - (11.4) - (7.1) 80.5
Operating profit 24.0 27.8 2.3 12.2 2.8 8.0 77.1
Income before income taxes 18.1 27.8 2.3 12.2 2.8 8.0 71.2
Income tax provision (20.5) 21.7 10.0 (4.7) (0.6) (3.1) 2.8
Effective tax rate 113.3% (3.9)%
Net (loss) income $ (2.4) $ 49.5 $ 12.3 $ 7.5 $ 2.2 $ 4.9 $ 74.0
Adjusted diluted EPS $ (0.05) $ 1.06 $ 0.26 $ 0.16 $ 0.05 $ 0.11 $ 1.59
(a) For the three months ended December 31, 2014, potentially dilutive stock options and restricted share unit awards were excluded from the computation of earnings per share as their effect would have been anti-dilutive.
NON-GAAP RECONCILIATIONS(in millions, except per-share amounts)

32Fourth Quarter 2015 Earnings Call
Year Ended December 31, 2015
As Reported (a)
Spin-RelatedTransitionCharges
ManufacturingStrategic Changes
GoodwillImpairment
IntangiblesAmortization
As AdjustedNon-GAAPLitigation
Cost of products sold $ 1,042.8 $ (9.9) $ (0.3) $ - $ - $ (3.2) $ 1,029.4
Gross profit 531.6 9.9 0.3 - - 3.2 545.0
Research and development 32.3 (1.4) - - - - 30.9
Selling and general expenses 398.5 (43.6) - - -(22.6)
332.3
Goodwill impairment 474.0 - - (474.0) - - -
Other expense and (income), net 4.5 1.0 12.3 - (16.9) - 0.9
Operating (loss) profit (377.7) 53.9 (12.0) 474.0 16.9 25.8 180.9
(Loss) income before income taxes (410.5) 53.9 (12.0) 474.0 16.9 25.8 148.1
Income tax provision (15.8) (21.1) 3.6 - (6.3) (9.6) (49.2)
Effective tax rate (3.8)% 33.2%
Net (loss) income $ (426.3) $ 32.8 $ (8.4) $ 474.0 $ 10.6 $ 16.2 $ 98.9
Adjusted diluted EPS $ (9.15) $ 0.71 $ (0.18) $ 10.13 $ 0.23 $ 0.35 $ 2.11
(a) For the year ended December 31, 2015, potentially dilutive stock options and restricted share unit awards were excluded from the computation of earnings per share as their effect would have been anti-dilutive.
NON-GAAP RECONCILIATIONS(in millions, except per-share amounts)

33Fourth Quarter 2015 Earnings Call
Year Ended December 31, 2014
Pre Spin-off Post Spin-off
As Reported
Spin-RelatedTransaction
Charges
ManufacturingStrategicChanges
Spin-RelatedTransitionCharges
ManufacturingStrategicChanges
IntangiblesAmortization
As AdjustedNon-GAAP
Cost of products sold $ 1,123.5 $ (4.5) $ (57.0) $ (0.8) $ (2.8) $ (3.6) $ 1,054.8
Gross profit 548.6 4.5 57.0 0.8 2.8 3.6 617.3
Research and development 33.6 (0.1) - - - - 33.5
Selling and general expenses 424.5 (84.4) - (11.4) - (28.6) 300.1
Operating profit 94.3 89.0 57.0 12.2 2.8 32.2 287.5
Income before income taxes 91.2 89.0 57.0 12.2 2.8 32.2 284.4
Income tax provision (64.1) (1.0) (10.5) (4.7) (0.6) (12.4) (93.3)
Effective tax rate 70.3% 32.8%
Net income $ 27.1 $ 88.0 $ 46.5 $ 7.5 $ 2.2 $ 19.8 $ 191.1
Adjusted diluted EPS $ 0.58 $ 1.89 $ 1.00 $ 0.16 $ 0.05 $ 0.43 $ 4.11
NON-GAAP RECONCILIATIONS(in millions, except per-share amounts)

34Fourth Quarter 2015 Earnings Call
Three Months Ended December 31, 2015
As ReportedSpin-Related
Transition ChargesGoodwill
Impairment Litigation As Adjusted
Net Income $ 14.5 $ 4.1 $ (1.5) $ 5.0 $ 22.1
Interest expense, net 8.0 - - - 8.0
Income tax provision (2.0) 3.4 - 2.8 4.2
Depreciation and amortization 16.8 - - - 16.8
EBITDA $ 37.3 $ 7.5 $ (1.5) $ 7.8 $ 51.1
Three Months Ended December 31, 2014
Pre Spin-off Post Spin-off
Spin-RelatedTransaction
Charges
Manufacturing StrategicChanges
Spin-RelatedTransition
Charges
Manufacturing StrategicChanges
As AdjustedAs Reported
Net (Loss) Income $ (2.4) $ 49.5 $ 12.3 $ 7.5 $ 2.2 $ 69.1
Interest expense, net 5.9 - - - - 5.9
Income tax provision 20.5 (21.7) (10.0) 4.7 0.6 (5.9)
Depreciation and amortization 23.8 - (2.3) (0.5) (3.2) 17.8
EBITDA $ 47.8 $ 27.8 $ - $ 11.7 $ (0.4) $ 86.9
NON-GAAP RECONCILIATIONS(in millions)

35Fourth Quarter 2015 Earnings Call
Year Ended December 31, 2014
Pre Spin-off Post Spin-off
As ReportedSpin-Related
Transaction ChargesManufacturing
Strategic ChangesSpin-Related
Transition ChargesManufacturing
Strategic ChangesAs
Adjusted
Net Income $ 27.1 $ 88.0 $ 46.5 $ 7.5 $ 2.2 $ 171.3
Interest expense, net 3.1 - - - - 3.1
Income tax provision 64.1 1.0 10.5 4.7 0.6 80.9
Depreciation and amortization 85.4 (1.1) (9.7) (0.5) (3.2) 70.9
EBITDA $ 179.7 $ 87.9 $ 47.3 $ 11.7 $ (0.4) $ 326.2
Year Ended December 31, 2015
As ReportedSpin-Related
Transition ChargesManufacturing
Strategic ChangesGoodwill
Impairment Litigation As Adjusted
Net (Loss) Income $ (426.3) $ 32.8 $ (8.4) $ 474.0 $ 10.6 $ 82.7
Interest expense, net 32.8 - - - - 32.8
Income tax provision 15.8 21.1 (3.6) - 6.3 39.6
Depreciation and amortization
65.4 (0.8) - - - 64.6
EBITDA $ (312.3) $ 53.1 $ (12.0) $ 474.0 $ 16.9 $ 219.7
NON-GAAP RECONCILIATIONS(in millions)
36Fourth Quarter 2015 Earnings Call
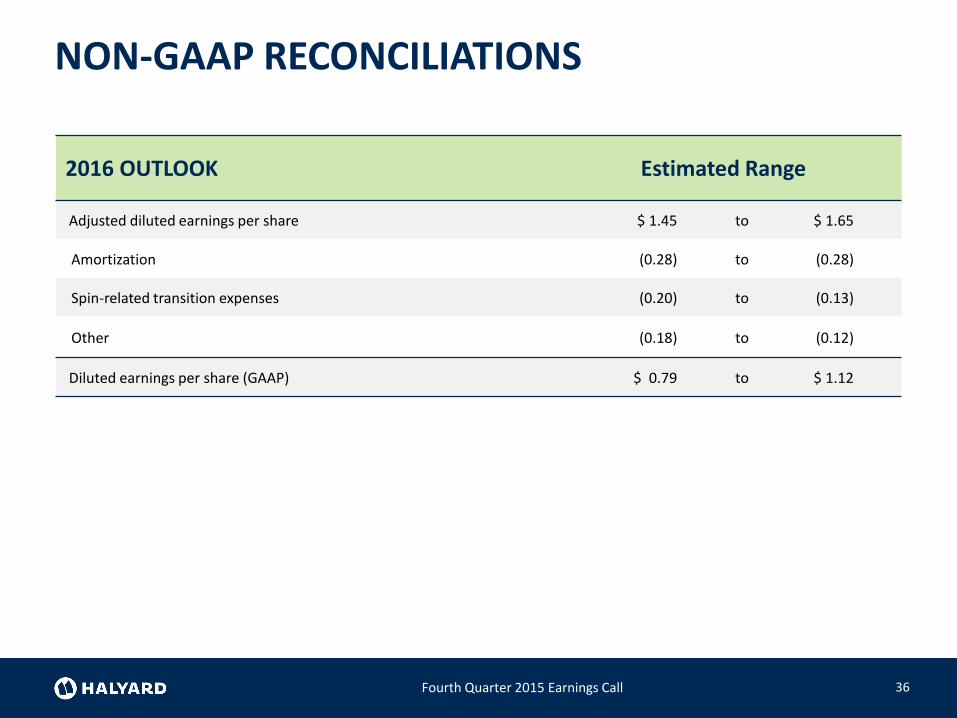
2016 OUTLOOK Estimated Range
Adjusted diluted earnings per share $ 1.45 to $ 1.65
Amortization (0.28) to (0.28)
Spin-related transition expenses (0.20) to (0.13)
Other (0.18) to (0.12)
Diluted earnings per share (GAAP) $ 0.79 to $ 1.12
NON-GAAP RECONCILIATIONS