Embed Size (px)
Citation preview

Comprehensive Summaries of Uppsala Dissertationsfrom the Faculty of Medicine 1344
Fourier Transform InfraredSpectroscopy in IndustrialHygiene Applications
Assessment of Emissions from and Exposures inWood Processing Industries
BY
URBAN SVEDBERG
ACTA UNIVERSITATIS UPSALIENSISUPPSALA 2004

To my children, Alve and Aron

List of Papers
I Svedberg U, Galle B. Assessment of Terpene Levels and Workers’ Exposure in Sawmills with Long Path FTIR. Ap-plied Occupational and Environmental Hygiene 15(9): 686-694, 2000.
II Welling I, Mielo T, Räiaänen J, Hyvärinen M, Liukkonen T, Nurkka T, Lonka P, Rosenberg C, Peltonen Y, Svedberg U, Jäppinen P. Characterization and Control of Terpene Emis-sions in Finnish Sawmills. Aihaj 62:172-175, 2001.
III Svedberg U, Högberg H-E, Högberg J, Galle B. Emission of hexanal and carbon monoxide from storage of wood pellets, a potential occupational and domestic health hazard. Annals of Occupational Hygiene. DOI 10.1093/annhyg/meh015, 2004. In Press
IV Svedberg U, Samuelsson J, Jirjis R. Determination of the overall terpene emissions from sawmills by the use of FTIR and tracer gas. Submitted
Reprints were made with the kind permission of the publishers.

Contents
Introduction.....................................................................................................9 Absorption Spectroscopy .........................................................................10 The FTIR Instrument................................................................................12
The interferometer ...............................................................................12 How an interferogram becomes a spectrum ........................................14 FTIR versus dispersive instruments.....................................................17 Infrared detectors .................................................................................18 FTIR sampling strategies.....................................................................19 Identification........................................................................................21 Quantitation .........................................................................................22
Specific Air Flows....................................................................................24 The Forest Industries. ...............................................................................24
The sawmills........................................................................................25 The wood pellet industry .....................................................................26
The Wood Chemistry ...............................................................................26
Aims of the Thesis ........................................................................................28
Material and Methods ...................................................................................29 Paper I ......................................................................................................29 Paper II .....................................................................................................30 Paper III....................................................................................................31 Paper IV ...................................................................................................31 Statistical Methods ...................................................................................32
Results...........................................................................................................33 Paper I ......................................................................................................33 Paper II .....................................................................................................34 Paper III....................................................................................................34 Paper IV ...................................................................................................36
Discussion .....................................................................................................38 Paper I ......................................................................................................38 Paper II .....................................................................................................39 Paper III....................................................................................................40
Formation of hexanal through autoxidation.........................................41

Formation of hexanal through biological degradation mechanism......42 Formation of carbon monoxide ...........................................................44
Paper IV ...................................................................................................45 Evaluation of the FTIR technique ............................................................46
Conclusions...................................................................................................48 Suggestions for Future Research..............................................................48
Acknowledgements.......................................................................................50
References.....................................................................................................51
Abbreviations
CLS Classical Least Square Emission In this thesis, emission means the release of a
gaseous substance in the air. Exposure In this thesis, exposure means the inhalation of
gaseous compounds. FTIR Fourier Transform Infrared Spectroscopy IR Infrared LOD Limit of detection NMVOC non-methane volatile organic compounds OEL Occupational exposure limit (international use)
based on an 8-hour time weighted average (TWA) exposure
PEL Permissible exposure limit published by the U.S.Department of Labor Occupational Safety &Health Administration and based on an 8-hour time weighted average (TWA) exposure
SNR Signal-to-noise ratio TLV Threshold limit values are suggested exposure
limits recommended by a self-appointed committee of a private organization, the American Conference of Governmental Industrial Hygienists (ACGIH).The TLV is occasionally different from the PEL. The TLV is not an enforceable standard.


9
Introduction
The essence of occupational and environmental hygiene is exposure assess-ment. The tools available to the occupational and environmental hygienist include non-instrumental methods such as interviews, work-history compila-tions, ocular inspections, and the use of advanced analytical equipment and computer modeling. The increasing use of epidemiological methods for risk assessment relies on the correct description of exposure. Regretfully, expo-sure assessment is often a weak link in both individual investigations and research because there are not enough resources allocated to carry out ap-propriate measurements. The often crude methods used and incomplete as-sumptions about exposure and emissions may cause significant errors of estimation and result in wrong or inconclusive deductions about related medical symptoms and health effects.
The 1970s and 1980s were the heydays of occupational hygiene in Swe-den. High exposures of organic solvents, metals, and toxic dusts in several industrial branches justified extensive sampling programs. Today, many of these grave problems are rectified, at least in larger industries and in the industrialized world. Currently, an exposure scenario has emerged where low-level occupational factors amalgamate with environmental exposures and give rise to complex exposure patterns with diffuse symptoms and health effects.
An increased environmental awareness have lead to sharpened demands from the general public, labor unions, consumer organizations, regulatory authorities, and environmental certification bodies to assess exposures in and emissions from industrial establishments (ISO 14001, OHSAS 18001, EMAS). The setting of occupational exposure limits is part of risk manage-ment. Since exposure levels in the workplace are becoming lower and lower, traditional epidemiology will face difficulties in revealing any effects and new methods must be explored for successful regulatory risk assessment (Edling and Lundberg, 2000).
Miniaturization of devices and particularly the validation of passive moni-tors for an increasing number of compounds have improved personal sam-pling (Eriksson, 1994). Industrial branches with scant historical exposure data have forced researchers to develop advanced methods for retrospective exposure assessment (Plato et al., 1997). The development of biological markers and physiological response indicators are important tools to assess environmental exposure (Norback and Wieslander, 2002). The technological

10
advances in immunological methodology is increasingly used in industrial hygiene applications (Lillienberg et al., 2000). However, the development of new biological and epidemiological methods complement improved tech-niques for air monitoring. The development and acceptance of new air sam-pling techniques must be part and parcel of the continuous process to meet new challenges within occupational and environmental hygiene.
Air sampling techniques can be divided roughly in enrichment and direct-reading methods. An enrichment method concentrates the sample through adsorption on a solid, absorption in a liquid (impinger method) or filtering. The sample is then analyzed in a laboratory. A direct-reading method is based on the use of a sensor, which reacts on the concentration of the com-pound in the air. The direct-reading instruments are used to record long-term variations in concentration and identify peak exposures. Unless very coarse temporal resolution is satisfactory, enrichment techniques can be excluded. Typical direct-reading instruments include personal warning devices, de-signed to sound an alarm when unacceptable concentrations of a dangerous chemical are reached. Assessment of lower levels and for comparison to occupational exposure limits usually requires more advanced instrumenta-tion that are generally too large to be worn by individuals. An ideal direct-reading method combines high temporal resolution with high sensitivity and specificity, but normally these parameters are in direct conflict with each other.
The present work focuses on the use of Fourier Transform Infrared Spec-troscopy (FTIR). The FTIR instruments are based on absorption spectros-copy but represent a significant improvement over traditional spectrometers. Its proven analytical capacity has made FTIR a common laboratory method but it can also be used as a direct-reading method in field. However, it has yet to prove its suitability for the sometimes-rough conditions experienced in occupational environments. In this thesis, the application of FTIR technique in occupational and environmental hygiene is exemplified by the assessment of emissions from and exposures in wood processing industries.
Absorption Spectroscopy The science of spectroscopy is the study of spectra. In 1667, Isaac Newton studied the dispersion of white light in a prism and showed how the light could be separated into its color components, a spectrum. However, a simple prism separates the colors poorly and it was not until 1859 that Bunsen and Kirchhoff invented the spectroscope to analyze chemical composition, a refinement of the prism with lenses and slits. Spectra are of two general types, absorption and emission spectra. The work in this thesis deals only with absorption spectroscopy.

11
Light is composed of a magnetic and an electric field positioned perpen-dicular to each other. It is the electric component that interacts with mole-cules. The propagation of light in space is described by a sinusoidal wave. The speed of light c, is a product of wavelength ( ) and frequency ( ), c =
. The energy of light is proportional to its frequency (or wavelength) ac-cording to E = h = hc/ where E = photon energy in joules and h = Planck’s constant. In infrared spectroscopy, the wavelength is commonly expressed as wavenumbers (W), the reciprocal of the wavelength, expressed in cm-1, W = 1/ . The wavenumber can also be described as the number of waves per centimeter. The light energy can then be written as E = hcW.Thus, high wavenumber light has more energy than low wavenumber light.
The infrared spectrum covers the wavenumber range between 14,000- 10 cm-1. The IR region is further divided into far-infrared (400-4 cm-1), mid-infrared (4000-400 cm-1 ) and near-IR (14,000-4000 cm-1). The region most useful for occupational surveys is the mid-IR region and the majority of FTIR instruments operate in this region.
As the name implies, absorption spectroscopy is the study of absorption of light energy in spectra. The energy in the light can be absorbed by elec-tronic, rotational, or vibrational transitions in molecules, corresponding to electromagnetic radiation in the ultraviolet, infrared and micro-wave to mm-wave regions. When infrared light interacts with matter the chemical bonds and the functional groups in the molecules starts to vibrate. For a given bond or functional group, the absorption is in the same wavenumber range regard-less of the structure of the rest of the molecule. For instance, the C = O stretch of a carbonyl group occurs at 1700 cm-1 in ketones, aldehydes and carboxylic acids. This is how infrared absorption spectroscopy can be used for chemical identification.
In the 18th century (Bouguer in 1729 and Lambert in 1760), it was recog-nized that when electromagnetic light is absorbed the power of the transmit-ted energy decreases exponentially with path length (Figure 1). The fraction of light intensity which is transmitted is given by T = I/I0 = 10-kb, where T is called the transmittance, k is a constant and b is the pathlength. In 1852, Beer and Bernard showed that a similar dependence of T holds for the concentra-tion C; T= I/I0 = 10-k’C, where k’ is a new constant. Combining these two laws produces Lambert-Beer’s law, which describes the dependence of T on both the pathlength and concentration and is written T = I/I0 = 10-abC, where a is a combined constant of k and k’. The logarithmic form of this expression is described by log T = log I/I0 = -abC. From this expression it can be seen that the negative logarithm of T is proportional to pathlength and concentra-tion. By defining a new term, absorbance A, as –logT , the expression can be rewritten as A = abC. This is the popular form of Lambert-Beer’s law and is the basis for all quantitative work in infrared spectroscopy.

12
The constant a, is known as absorptivity and is dependent on the wave-length and fundamental physical properties of the molecule. It is given the unit (concentration x pathlength)-1 and cancels out the other two variables making absorbance a unitless quantity.
CI0 I
bFigure 1. Absorption of radiation.
The FTIR Instrument The FTIR instrument is built around an interferometer, an IR source, a detec-tor, an analytical cell, and a computer for running the instrument and proc-essing of data. The analytical cell can be replaced by an open path optical system. The hardware components and the procedures for identification, quantitation, and sampling strategies are briefly described below.
The interferometer The essential components of FTIR instruments make up an interferometer. The original design of the interferometer was invented by Albert Michelson in 1880 (Michelson, 1891). In 1907, he became the first American to be awarded the Nobel Prize "for his optical precision instruments and the spec-troscopic and metrological investigations carried out with their aid."
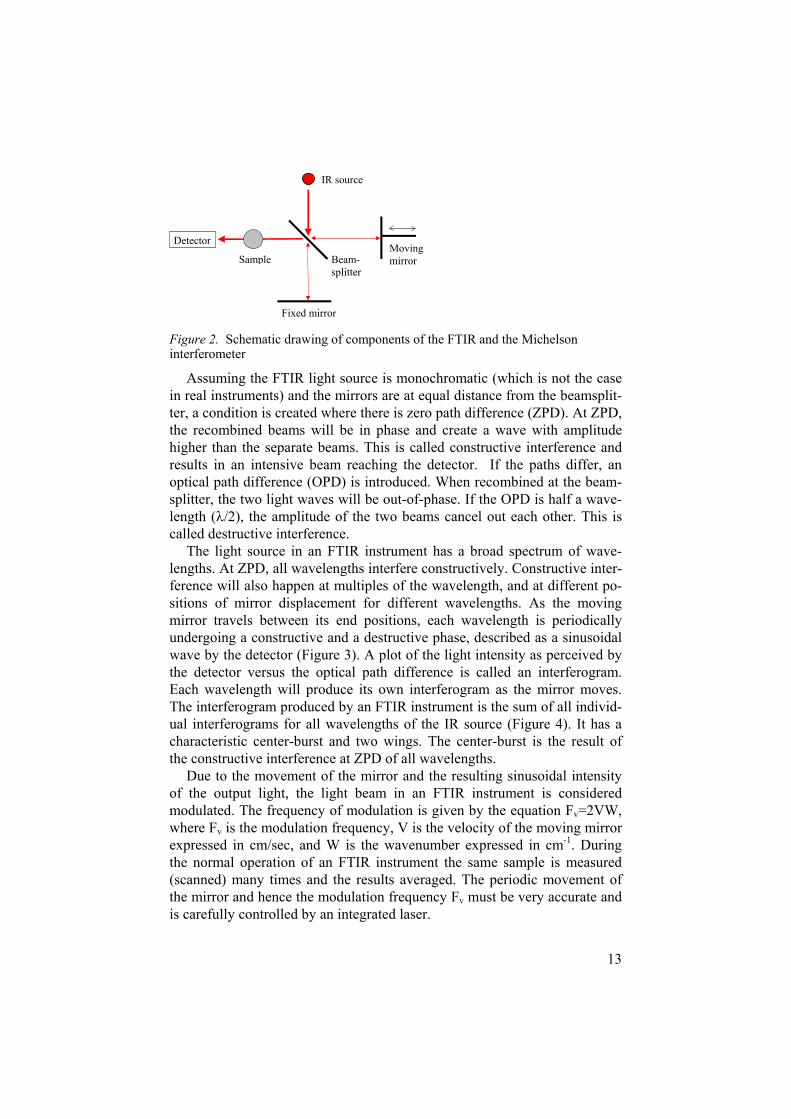
The incoming light beam in the interferometer is divided into two sepa-rate light paths in a beamsplitter where half of the radiation is reflected and the rest transmitted. The transmitted light travels to a fixed mirror and the reflected light to a moving mirror. The reflected light from the fixed mirror and the transmitted light from the moving mirror recombines at the beams-plitter, travels through the sample, and hits the surface of the detector. The interplay between the components of the interferometer is illustrated in Figure 2.
13
IR source
Fixed mirror
MovingmirrorSample
Detector
Beam-splitter
Figure 2. Schematic drawing of components of the FTIR and the Michelson interferometer
Assuming the FTIR light source is monochromatic (which is not the case in real instruments) and the mirrors are at equal distance from the beamsplit-ter, a condition is created where there is zero path difference (ZPD). At ZPD, the recombined beams will be in phase and create a wave with amplitude higher than the separate beams. This is called constructive interference and results in an intensive beam reaching the detector. If the paths differ, an optical path difference (OPD) is introduced. When recombined at the beam-splitter, the two light waves will be out-of-phase. If the OPD is half a wave-length ( /2), the amplitude of the two beams cancel out each other. This is called destructive interference.
The light source in an FTIR instrument has a broad spectrum of wave-lengths. At ZPD, all wavelengths interfere constructively. Constructive inter-ference will also happen at multiples of the wavelength, and at different po-sitions of mirror displacement for different wavelengths. As the moving mirror travels between its end positions, each wavelength is periodically undergoing a constructive and a destructive phase, described as a sinusoidal wave by the detector (Figure 3). A plot of the light intensity as perceived by the detector versus the optical path difference is called an interferogram. Each wavelength will produce its own interferogram as the mirror moves. The interferogram produced by an FTIR instrument is the sum of all individ-ual interferograms for all wavelengths of the IR source (Figure 4). It has a characteristic center-burst and two wings. The center-burst is the result of the constructive interference at ZPD of all wavelengths.
Due to the movement of the mirror and the resulting sinusoidal intensity of the output light, the light beam in an FTIR instrument is considered modulated. The frequency of modulation is given by the equation Fv=2VW,where Fv is the modulation frequency, V is the velocity of the moving mirror expressed in cm/sec, and W is the wavenumber expressed in cm-1. During the normal operation of an FTIR instrument the same sample is measured (scanned) many times and the results averaged. The periodic movement of the mirror and hence the modulation frequency Fv must be very accurate and is carefully controlled by an integrated laser.

14
Optical path difference
Inte
nsity
ZPD
Figure 3. The sinusoidal waves from three different wavelengths and the sum of their amplitudes at the top. At ZPD all wavelengths interfere constructively.
Optical path difference (OPD)
Vol
tage
Figure 4. An interferogram
How an interferogram becomes a spectrum According to Fourier’s theorem, any mathematical function can be expressed as a sum of sinusoidal waves. An interferogram is simply a sum of sinusoi-dal waves and each wave contains unique information about the position and amplitude of a given peak. The interferogram is converted to a single beam spectrum by a mathematical process called Fourier transformation. To un-derstand the underlying mathematics behind the Fourier transformation is beyond the scope of this thesis; its understanding is not required for the suc-cessful use of the FTIR instrument. The single beam spectrum is merely a plot of the detector response and has an x-axis expressed in wavenumbers

15
and an y-axis expressed in intensity response. Infrared spectra are plotted with high wavenumbers to the left on the x-axis. When a sample is placed in the light path, the energy levels at specific wavelengths corresponding to specific bonds and functional groups are absorbed. Hence in the unprocessed single beam spectrum the spectral features are described as negative peaks (Figure 5).
0
1
2
3
4
5001000150020002500300035004000
Wavenumber (cm-1)
Inte
nsity
H2OCO2
Figure 5. A reference spectrum (red) and a sample spectrum of a mixture of xylene and acetone (black).
A single beam spectrum without a sample in the light path is called a ref-erence spectrum (or background spectrum). The appearance of the reference spectrum gives information on the instrumental component characteristics, such as the infrared source energy, detector response, mirror reflectance, beam splitter and windows throughput. Water and carbon dioxide is always present in the spectral features of the reference spectrum unless extreme measures have been taken to eliminate those compounds from the light path both inside the FTIR instrument and in the sample compartment. A reference spectrum is usually collected before collecting the sample spectrum. A new reference spectrum should be collected at appropriate intervals throughout the measurement to minimize instrumental factors such as baseline drifts and changes in background concentrations of water and carbon dioxide. The difference between the reference spectrum and the sample spectrum should ideally only be the signal from the sample compound of interest, so when superimposed on each other they should look identical except for those peaks representing the sample compound(s).

16
In the FTIR instrument, the reference spectrum (I0) is measured without a sample in the compartment. A new measurement is then taken after the sam-ple is introduced, and a sample spectrum (I) is obtained. A measure of the amount of light which is transmitted (T) at different wavenumbers is given by %T = I/I0 x100. A plot of the %T versus wavenumber is called a transmit-tance spectrum (Figure 6).
50%
60%
70%
80%
90%
100%
5001000150020002500300035004000
Wavenumber (cm-1)
Tran
smitt
ance
Figure 6. A transmittance spectrum of a mixture of xylene and acetone.
As previously mentioned, the transmittance spectrum is not proportional to concentration and must be converted to an absorbance spectrum for the quantitative analysis (Figure 7).
0.00
0.05
0.10
0.15
0.20
0.25
0.30
5001000150020002500300035004000
Wavenumber (cm-1)
Abs
orba
nce
Figure 7. An absorbance spectrum of a mixture of xylene and acetone

17
FTIR versus dispersive instruments Before the development of FTIR instruments, infrared analysis was based on dispersive techniques. To many occupational hygienists, the classic MIRAN 1A instrument is well known. The IR source in dispersive instruments may be the same as in the FTIR, but the light is directed through the sample, onto a prism, or grating instead of an interferometer. When the light is reflected, a spectrum of wavelengths is produced. The desired wavelength is focused through a narrow slit onto the detector by adjusting the prism or grating. Scanning through all wavelengths can produce a full IR spectrum. However, this is very time consuming and the resolution is much less compared to the FTIR, which typically operates around one wavenumber resolution. The resolution of the MIRAN instrument is approximately 1% of the wavelength, i.e., 4-40 cm-1 in the 400-4000 wavenumber region. Figure 8, illustrates the effect of how different resolution settings affect the carbon monoxide spec-trum.
1 cm-1
0
0.1
0.2
0.3
0.4
0.5
202020402060208021002120214021602180220022202240
Wavenumber
Abs
orba
nce
2 cm-1
0
0.05
0.1
0.15
0.2
0.25
0.3
0.35
202020402060208021002120214021602180220022202240
Wavenumber
Absorbance
4 cm-1
0
0.05
0.1
0.15
0.2
0.25
202020402060208021002120214021602180220022202240
Absorbance
Wav
enum
ber
32 cm-1
0
0.02
0.04
0.06
0.08
0.1
0.12
0.14
0.16
0.18
0.2
202020402060208021002120214021602180220022202240
Wavenumber
Abs
orba
nce
Figure 8. The effect of spectral resolution on the carbon monoxide IR spectrum
The signal to noise ratio (SNR) is significantly higher with the FTIR in-strument. The first reason for this is the high energy throughput (Jacquinot advantage). All the light from the IR source passes through the sample and hits the detector for all wavelengths simultaneously. In the dispersive in-strument, only a fraction of the energy of the IR source hits the detector. The second reason is the multiplex advantage (Fellgett advantage). When the dispersive instrument scans the IR spectrum, the light from each wavelength will hit the detector only a fraction of the total time, while the FTIR instru-

18
ment measures all wavelengths simultaneously every scan. Typically, one scan in a dispersive instrument takes 10 minutes, whereas it takes one sec-ond with the FTIR (4 cm-1 resolution), i.e., 600 scans in the same time. By averaging many scans the noise can be significantly reduced since the SNR ratio is proportional to the square root of the number of scans (N). Due to the modulation of the light and the required precision movement of the mirror in the interferometer, the wavenumber scale is very accurate in the FTIR in-strument. This is still another advantage over dispersive techniques.
Infrared detectorsThe infrared detector translates the incoming infrared light into an electric signal. The detector element is a crystal of various chemical compositions, mounted in a casing and behind an infrared transparent window to protect it from the environment. Infrared detectors can be divided into two types: thermal detectors and quantum detectors (Griffiths and de Haseth, 1986). Thermal detectors, as the name implies, senses a change in temperature and converts this to a thermal electromotive force (thermocouples), a change in resistance of a conductor (bolometers), or a movement acting on a dia-phragm by an expansion of a gas (pneumatic detectors). Because of their slow response time, the thermal detectors are seldom used in modern FTIR systems. The exception is the pyroelectric bolometer.
A pyroelectric substance becomes electrically polarized when heated (a temperature dependent capacitor). The pyroelectric detectors are made from a single crystalline wafer of a pyroelectric material, the most common used in FTIR is deuterated triglycine sulfate (DTGS). The changing degree of polarization upon exposure to the incoming IR radiation can be observed as a change in electrical signal. The response time of the pyroelectric detectors is fast, they are inexpensive, and operate at room temperature. However, the sensitivity is not that high.
In applications where higher sensitivity is required, the quantum detectors are preferred. The detector element is usually made of a semi-conducting, solid crystalline material, which is deposited on a glass surface and sealed in an evacuated chamber. They operate on the principle that electrons will be excited to a higher energy level when exposed to the infrared radiation, which intrinsically is characterized by a quantum nature. Absorption of in-frared radiation forces non-conducting electrons to a higher conducting level and the electrical resistance of the semiconductor decreases. In the mid-infrared region, only very small energy levels are required to excite the elec-trons. The most commonly used quantum detector is the mercury cadmium telluride (MCT) detector. The low energy needed to excite the electrons makes the MCT detector susceptible to thermal agitation of the crystal, re-sulting in electrical noise. In addition, this requires quantum detectors to be cooled and thermally insulated from the environment. Cooling is normally

19
accomplished by liquid nitrogen (77K), stored in an 8 or 24 hour Dewar flask integrated with the detector unit. To maintain prolonged cooling, the space between the detector and the Dewar is evacuated. In our work, where long-term sampling was common, we found that the 24-hour Dewar has an advantage since it only needs replenishment of liquid nitrogen once per day. Losing the vacuum will result in loss of spectra and an increased risk that water from the ambient air accumulates inside the detector assembly. Water must be removed by extended pumping of the detector (several days) using a high rated vacuum pump. Contaminating water appears as a broad spectral feature at about 3,300 cm-1, growing as ice accumulates on the cold detector and window surfaces. The sensitivity of the MCT detector is about 10 times better compared to the DTGS. The sampling speed is also higher and thus the signal-to-noise ratio is significantly improved.
The indium antimonide (InSb) detector is a sensitive alternative to the MCT. It has 5-10 times better signal-to-noise ratio. The disadvantage is the limited wavenumber region with a spectral cut-off at about 1800 cm-1, which excludes the valuable fingerprint region between 600-1300 cm-1.
The sensitivity of a detector is expressed as the specific detectivity D* (D star). The composition of the crystalline material affects the D* and is higher for a narrow wavenumber range detector. Detector noise is unavoidable and is present in all spectra. To minimize noise, the active area of the detector should be as small as possible and match the optical image of the IR source.
FTIR sampling strategies There are essentially two different sampling strategies to choose from in FTIR gas-phase analysis; closed cell or open path system.
Cell sampling In the closed cell sampling system, the sample air is pulled through an ana-lytical cell where the infrared light path traverses. A typical cell consists of a borosilicate glass or a metal cylinder with infrared transparent windows and sample air inlet and outlet valves. Gas cells are of single or multi-pass type. In the single-pass cell, the IR light travels through the cell once. The size of the single-pass cell can be just a few centimeters. In the multi-pass cell (or White cells, named after the inventor), mirrors with matching focal lengths are mounted inside the cell. The incoming light is reflected a number of times inside the cell, producing a longer light path before the final reflection out of the cell and to the detector.
Some important parameters to consider when choosing an analytical gas cell are the optical pathlength, the cell volume, the materials of the windows, and if it is going to be subject to heating, evacuation, or pressurization. A long pathlength with many reflections is paid for by loss of transmittance that eventually will outweigh the gain in pathlength. Sometimes a small cell

20
volume is desirable, e.g., for monitoring of fast fluctuations of a source. A compromise between cell volume and pathlength usually is necessary. The choice of cell window material is critical. Important factors are the light throughput, the transmitted frequency range and the resistance to water and temperature. Common window materials are potassium bromide, silver bro-mide, and zinc selenide. Potassium bromide is inexpensive and has excellent light throughput however, susceptible to moisture and fogs easily. Silver bromide and zinc selenide both have high light throughput, are water resis-tant and good choices for a broad range of applications.
Open path sampling For the purpose of this thesis, open path means a cell design open to the am-bient air, not enclosed in a cell chamber. In some publications, the term long path is preferred (including Paper I), and the technique is sometimes referred to as remote sensing. The term open path better reflects the technique since there are closed cells on the market with several hundred meters pathlength, which also are called long path cells. Just as in cell sampling, the path-integrated concentration along the light path is measured, however now ex-tended in the space of the room. A significant advantage with the open path technique is the non-invasiveness with the sample air. Pumping is not re-quired and problems with adsorption and leakage in sampling lines are eliminated.
Early open path-FTIR systems were developed to meet demands by the environmental authorities in the United States to monitor outdoor air pollut-ants (Herget and Brasher, 1979). Several publications describe open path surveys in outdoor field applications or have modeled open path-FTIR appli-cations in controlled ventilation chambers (Spartz et al., 1989) (Russwurm et al., 1991) (Grant, 1992) (Piccot et al., 1996) (Yost et al., 1992) (Piccot et al.,1994) (Yost et al., 1994) (Todd, 1996). Only a few reports describe the use of open path techniques in occupational environments (Xiao et al., 1993) (Malachowski et al., 1994).
Open path systems are of single, double, or multi-pass configuration, de-pending on how many times the light traverses the system. They are of sin-gle-ended or double-ended design. A single-ended system has the transmit-ting and receiving components integrated in one unit located at one end of the system and a passive mirror positioned at the other end. A double-ended system has the source and detector at opposite ends of the optical path. Open path systems can be further defined in active and passive system. An active system indicates that the IR source is an electrically heated hot source. A passive system uses a background heat source, such as a hot smokestack, a warm wall of a house, the sun, etc, and uses the temperature difference be-tween the passive source and the sample gas. Passive systems, with the sun as the IR source, have been used to monitor stratospheric nitrogen oxides and halogen containing compounds (Galle et al., 1999).

21
IdentificationAn IR spectrum can be plotted in either transmittance or absorbance for identification of unknown compounds. Identification can be done by inter-preting the spectral features along the wavenumber axis and assigning the corresponding functional groups or by comparing the unknown spectra with known library spectra. Figure 9, illustrates the characteristic infrared regions of some of the compounds dealt with in this thesis.
-pinene
0.00
0.05
0.10
0.15
0.20
0.25
0.30
0.35
70080090010001100120013001400Wavenumber
Abs
orba
nce
Formic acid
0.00
0.20
0.40
0.60
0.80
1.00
1.20
70080090010001100120013001400Wavenumber
Abs
orba
nce
Methanol
0.00
0.50
1.00
1.50
2.00
2.50
70080090010001100120013001400Wavenumber
Abs
orba
nce
Acetone
0.00
0.05
0.10
0.15
0.20
0.25
0.30
0.35
0.40
0.45
0.50
70080090010001100120013001400Wavenumber
Abs
orba
nce
Ethanol
0.00
0.20
0.40
0.60
0.80
1.00
1.20
1.40
1.60
1.80
2.00
70080090010001100120013001400Wavenumber
Abs
orba
nce
Hexanal
0.00
0.05
0.10
0.15
0.20
0.25
0.30
0.35
0.40
0.45
0.50
2500255026002650270027502800285029002950
Wavenumber
Abs
orba
nce
Figure 9. IR spectra of selected gasoues compounds discussed in the present work. Note the different wavenumber regions.
The identification of unknown compounds is straightforward when ana-lyzing single component samples but rapidly becomes more difficult with increasing number of unknowns. Although different compounds have char-acteristic spectral features, they may still be difficult to identify in mixtures. A compound with low concentration may appear as a ripple on the surface of

22
a high concentration compound. In Figure 10, the fingerprint regions of indi-vidual monoterpene spectra have been superimposed. The dominant peaks of
-pinene and 3-careene overlap at 780 cm-1 but may be resolved at several other wavelengths. However, there are no peaks that are completely free from overlap from another compound. The identification process may be very time-consuming. The more information that is available about the po-tential sample compounds the easier the identification process will be.
0
0.05
0.1
70075080085090095010001050110011501200125013001350Wavenumbers (cm-1)
Abs
orba
nce
A-pinene
B-pinene
3-Carene
Limonene
.
Figure 10. Absorbance spectra of the monoterpenes found in the sawmill. The rela-tive concentrations correspond to the levels in the sawmill air described in Paper I.
QuantitationInfrared spectra must be in absorbance mode for quantitative work. By com-paring peak height or peak area with a spectrum of known concentration and pathlength the concentration of an unknown spectrum is determined. The peak areas and peak heights of absorbance peaks are related to the concen-tration according to Lambert-Beer’s law. In liquid and gas-phase work, the pathlength is known and external standards are used. Solid samples such as KBr pellets may require the use of internal standards if the pathlength is not exactly known. Spectra of standards can be generated in the lab or by relying on spectra databases. However, some databases do not indicate pathlength and concentration and are useful for identification purposes only.
The quantitation work is straightforward when non-overlapping peaks can be identified and can be done by simple comparison with calibrated spectra. However, in the real world it is more common with compounds in mixtures and severe overlapping of peaks. For the successful quantitation of com-pounds in mixtures, the application of a multi-component analysis may be required. Different least square techniques can be used in infrared spectros-

23
copy; the most common are partial least square (PLS), inverse least square (ILS) and classical least square (CLS). It is difficult to say which method will work best in different situations. In our work, we have exclusively used CLS.
The CLS technique uses the additive linear relationship between the com-ponent absorbance and component concentration. It calculates calibration equations that are used to predict the concentration of the components in unknown samples (Haaland and Easterling, 1982, Haaland et al., 1985). A reconstructed spectrum minimizes the difference between the known com-ponent spectra and the unknown sample. The CLS algorithm is sensitive to unknown compounds and baseline effects, which may cause severe misin-terpretation of spectra. Therefore, it is important to check the shape and size of the residual absorbance. Ideally it should be a straight line with just the noise (Figure 11). Although PLS is designed to better handle real mixtures with unknown compounds, we found it difficult to make it work properly. We decided to use the CLS analysis since it produced good predictions in our studies; however, an extra effort was needed to identify the compounds in the spectra before the CLS algorithm was applied.
The successful application of the CLS method requires modification of the calibration matrix to fit the characteristics of each set of sample spectra. This may include the choice of the wavenumber region and inclusion or ex-clusion of compounds. The sample spectra may also be corrected by a num-ber of techniques to enhance the appearance before quantitation. The only spectral correction made in our sample spectra was compensation for sloping baselines. When the CLS method did not work well, a less specific method was used by simply comparing the areas of target peaks with those of pure or mixed spectra with known concentrations.
-0.1
-0.08
-0.06
-0.04
-0.02
0
0.02
7007508008509009501000105011001150Wavenumber (cm-1)
Res
idua
l abs
orba
nce
0
0.1
0.2
0.3
0.4
0.5
0.6
0.7
0.8
Abs
orba
nce
Figure 11. A CLS reconstructed spectrum is superimposed on the corresponding field spectrum from a sawmill. The residual absorbance line is shown in a different scale (top).

24
Specific Air Flows The often crude assumptions about the nature of diffuse airflow through indoor spaces may cause significant errors in estimating emissions and high-lights the need for alternative strategies to approach the problem. Almost all buildings are affected by natural ventilation and particularly large industrial process rooms with limited mechanical ventilation and numerous openings.
The airflow connected to mechanical ventilation can be determined using direct measurement in ventilation ducts. However, in the case of diffuse ventilation, methods based on pressure differences will not be useful, and a tracer gas method should be considered. There are three tracer gas tech-niques normally used; the concentration-decay method, the constant-emission method, or the constant-concentration method (Grieve, 1991). All methods are based on the continuity equation, or the principle of mass con-servation for a steady, one-dimensional flow in a room with fixed areas of inlets and outlets. In the work presented in this thesis, the concentration-decay method was used. A tracer gas is distributed and thoroughly mixed into the room air. Then the source is removed and the concentration of the tracer gas is measured over time. Provided that the airflow is constant and there is good mixing of the air, the tracer gas decays exponentially over time. The air-exchange rate (N) is given as:
N= (lnC0-lnCt)/t
where; Co is the concentration at the time when the concentration starts to show an exponential decay, Ct is the concentration at time = t, and t is the time between Ct and Co. By plotting the natural logarithm of C versus time a straight line is obtained during the exponential decay. The slope of the line is a direct measure of the airflow expressed as the number of room volumes exchanged at every increment of time t.
Any gas with infrared absorption can be used as tracer gas. Commonly used is nitrous oxide (N2O), which has an absorption band around 2236 cm-1.Sulfurhexafluoride (SF6) was previously widely used as a tracer because it has a distinct strong IR absorption peak at 948.1 cm-1. However, SF6 is ex-pensive and is considered to be a potent contributor to depletion of the stratospheric ozone layer.
The Forest Industries. To a large extent, the Scandinavian countries are covered by forests. The Swedish forestry industry, the wood processing industry (e.g., sawmills, joinery shops) and the pulp and paper industry employed a total of 94,600 people in 2002, or 2.2 % of the national workforce. The value of the export

25
of forest products was 14% of the national export of goods (National Board of Forestry, 2003). The present studies focus on the sawmills and pellet pro-ducers operating in the boreal region in Sweden and Finland.
The sawmills Early sawmills used manual sawing, but they where gradually replaced by mills powered by water wheels. The water wheel dominated until the mid 19th century, when the development of the steam sawmill revolutionized the process. The sawmills no longer needed to be located near water streams and were instead built along the seashores to facilitate shipping of the prod-ucts. However, the transportation of timber was still done by waterways. The late 19th century was the zenith of the saw-milling industry. In the Sundsvall region in central Sweden, where one of the present studies was done, two major rivers flow into the ocean and the protection of the island of Alnö made it a perfect location for the establishment of sawmills. The first steam sawmill in Sweden was established in 1849 in Tunadal in Sundsvall (Jerbo et al., 1984). By the end of the 19th century, there were 43 steam sawmills in the region with 900 permanent and 1500 seasonal employees. The many sawmills inspired the poet Elias Sehlstedt in 1872 to write "Och hela ham-nen som en spegel låg. Och såg vid såg jag såg, hvarthelst jag såg” (…and saw by saw, I saw, wherever I saw).”
The Swedish sawmill industry has experienced considerable restructuring and aggregation into few but larger units. Between 1995 and 2000, the num-ber of sawmills producing 100,000 m3 or more increased from 33 to 49 (National Board of Forestry, 2003). The number of man-hours needed to produce a cubic meter of sawn material decreased from 7 to 1.5 hours be-tween the years 1953 to 1995 (National Board of Forestry, 1999). In 2001, a total of 16 million m3 of sawn material was produced, 99% from the two Scandinavian conifers, Norway spruce (Picea abies), and Scots pine (Pinussylvestris). In 1992, the total industrial emission of non-methane volatile organic compounds (NMVOC) in Sweden was 111,800 tons (Stenhammar, 1992). The terpene emissions from sawmills dominated at an estimated 25,000 tons annually, based on processing of about 30 million cubic meters of barked roundwood. The original source of the emission figure from saw-mills was not given and hence it has not been possible to conclude how it was determined.
The common occupational hazards in sawmills are tripping and falling during the rolling of logs, dangerous machinery, sawdust, mold, noise, and terpene vapors (ILO, 1983). However, the presence of volatile terpenes in the workroom air is even today unknown to some sawmill operators. Saw-mill workers exposed to terpenes have demonstrated increased bronchial responsiveness, decreased diffusion capacity, higher prevalence of dyspnoea
26
and increased eye irritation than non-exposed controls (Eriksson et al.,1996), (Eriksson et al., 1997), (Malmberg et al., 1994) (Hedenstierna et al.,1984). Exposure to 3-carene, may result in chronic lung function impairment (Falk et al., 1991).
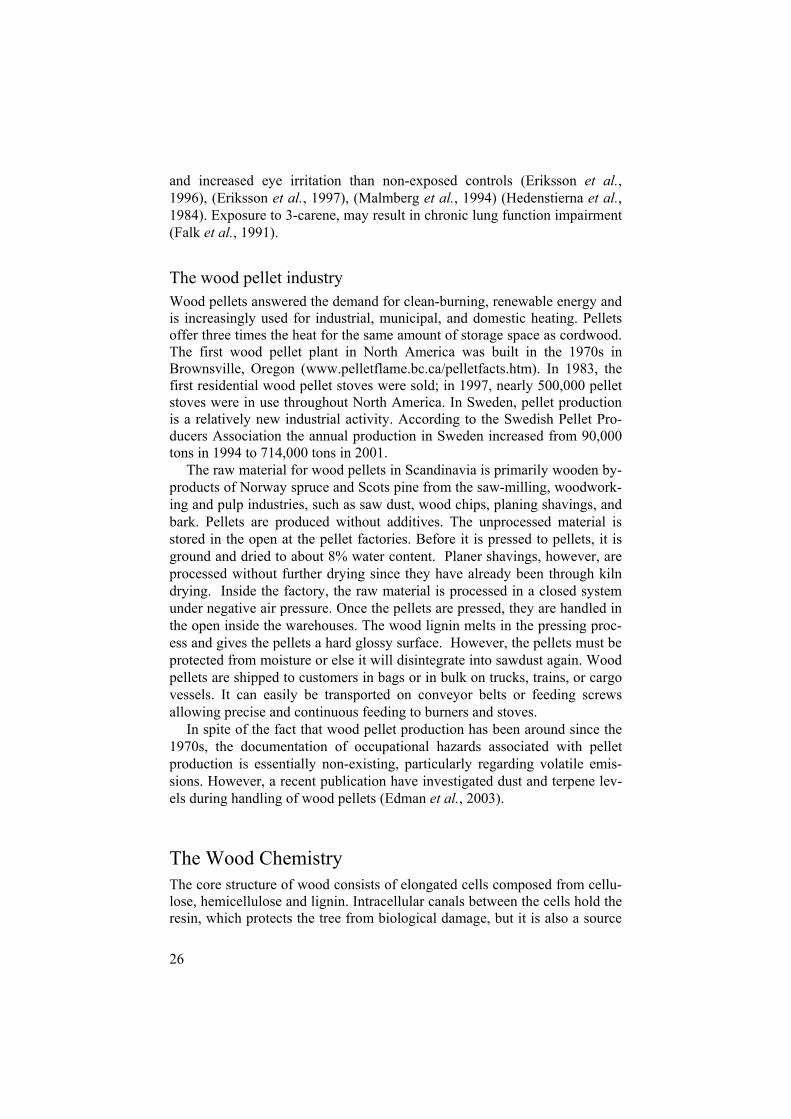
The wood pellet industry Wood pellets answered the demand for clean-burning, renewable energy and is increasingly used for industrial, municipal, and domestic heating. Pellets offer three times the heat for the same amount of storage space as cordwood. The first wood pellet plant in North America was built in the 1970s in Brownsville, Oregon (www.pelletflame.bc.ca/pelletfacts.htm). In 1983, the first residential wood pellet stoves were sold; in 1997, nearly 500,000 pellet stoves were in use throughout North America. In Sweden, pellet production is a relatively new industrial activity. According to the Swedish Pellet Pro-ducers Association the annual production in Sweden increased from 90,000 tons in 1994 to 714,000 tons in 2001.
The raw material for wood pellets in Scandinavia is primarily wooden by-products of Norway spruce and Scots pine from the saw-milling, woodwork-ing and pulp industries, such as saw dust, wood chips, planing shavings, and bark. Pellets are produced without additives. The unprocessed material is stored in the open at the pellet factories. Before it is pressed to pellets, it is ground and dried to about 8% water content. Planer shavings, however, are processed without further drying since they have already been through kiln drying. Inside the factory, the raw material is processed in a closed system under negative air pressure. Once the pellets are pressed, they are handled in the open inside the warehouses. The wood lignin melts in the pressing proc-ess and gives the pellets a hard glossy surface. However, the pellets must be protected from moisture or else it will disintegrate into sawdust again. Wood pellets are shipped to customers in bags or in bulk on trucks, trains, or cargo vessels. It can easily be transported on conveyor belts or feeding screws allowing precise and continuous feeding to burners and stoves.
In spite of the fact that wood pellet production has been around since the 1970s, the documentation of occupational hazards associated with pellet production is essentially non-existing, particularly regarding volatile emis-sions. However, a recent publication have investigated dust and terpene lev-els during handling of wood pellets (Edman et al., 2003).
The Wood Chemistry The core structure of wood consists of elongated cells composed from cellu-lose, hemicellulose and lignin. Intracellular canals between the cells hold the resin, which protects the tree from biological damage, but it is also a source

27
of reserve energy. The resin consists of terpenes, resin acids, and fats. Ter-penes are unsaturated aliphatic cyclic hydrocarbons and contain branched 5-carbon units, often linked into ring structures. Formally, the terpenes can be regarded as polymers of the hydrocarbon isoprene CH2 = C(CH3)-CH = CH2,(C5H8) . They are classified into different chemical groups depending upon the number of isoprene units. Thus two isoprene units are found in the monoterpenes (C10H16), three in the sesquiterpenes (C15H24), further forming diterpenes (C20H32), and triterpenes (C30H48). About 90 % of the terpene content of Norway spruce and Scots pine consist of the four monoterpenes
-pinene, -pinene, 3-carene, and limonene (Kimland and Norin, 1972). The monoterpenes exists in different isomeric and enantiomeric forms.
Both Scots pine and Norway spruce are softwoods. The emission of monoterpenes from hardwoods is in general negligible in comparison to softwoods. According to Groth, the natural abundance of monoterpenes in Scots pine is 0.22% and Norway spruce 0.04% calculated relative to the dry wood weight (Groth, 1958). An extensive investigation of the steam distilled turpentine content in North American wood species showed contents of monoterpenes for pine 0.3-0.4% and spruce 0.02-0.1% (Drew and Pylant, 1966).
The biogenic terpene emissions show considerable seasonal and diurnal variation as well as latitudinal differences. Peak emissions are reached in the summer while during the winter months the emissions are almost zero (Finlayson-Pitts and Pitts, 1986) (Jansson, 1992). The composition of ter-penes varies with location. In southern Sweden, the emissions from Norway Spruce were 70% -pinene out of the total, compared to only 6% in the northern part where 3-carene was predominant (Jansson, 1992). Daytime concentrations of total terpenes in the pine forest in the central part of Swe-den ranged from 0.06 to 3 g/m3 while the nighttime concentrations ranged between 1.2 to 48 g/m3. Peak values were found around 4 a.m. and the lowest levels around noon.

28
Aims of the Thesis
The overall aim of this thesis, was to evaluate the use of FTIR spectroscopy as an approach to the increasingly difficult sampling challenges within the field of occupational and environmental hygiene. The thesis comprises four studies focusing on various field applications of the FTIR technology. The strategy was to collect data in the field as far as possible, but in some spe-cific applications, experimental studies in the laboratory were justified. All studies relate to the sawmill and pellet industries. The immediate aims in the different studies are as follows;
- to describe and evaluate the feasibility of applying open path-FTIR tech-nique in a sawmill environment and compare with traditional adsorbent sampling (Paper I).
- to collect field data in the sawsheds of sawmills to determine the produc-tion based specific emission rates of monoterpenes (Paper II).
- to investigate the presence and formation of volatile degradation products from wood pellets, a commodity made from by-products from the sawmill industry (Paper III).
- to assess the overall terpene emissions from sawmills by applying FTIR and tracer gas techniques, and predict concentrations in close vicinity to a mill (Paper IV).

29
Material and Methods
Paper I The objective was to describe and evaluate the feasibility of applying open path-FTIR technique at a sawmill and compare with traditional adsorbent sampling. Sawmills are known to generate terpene concentrations in work-place air above the OELs. The FTIR instrument was fitted with open path optics and positioned so that the optical path traversed the entire 60-meter length of the sawshed. Parallel sampling with personal charcoal adsorbent tubes was done to validate the FTIR results. The personal sampling equip-ment was turned off during the periods when workers left the sawshed for scheduled breaks. Parallel sampling was also performed with a portable di-rect-reading photo ionizing detector to establish the spatial distribution of terpenes along the optical path of the FTIR. The measurements were done on four different occasions in the same sawmill.
The open path system, single-ended, and double-pass design, was based on a Newtonian telescope (Figure 12). It was developed using standard opti-cal components and adapted to fit on top of the FTIR unit (Axelsson et al.,1992). The open path optics reduced the divergence of the outgoing light from the FTIR instrument, which exited the instrument as a 1" diameter beam with 47 mradians divergence (47 m per 1000m). The beam was fo-cused with a parabolic mirror (focal length 14 cm) and via a small flat mirror deflected onto a 10-inch spherical mirror (1 m focal length) used for both transmitting and receiving light. Since the divergence is inversely propor-tional to the focal length, the divergence of the outgoing beam was reduced to 7 mradians. The transmitted light was projected across the sawshed onto two gold-coated 5-inch cube corner mirrors (retroreflectors), reflected back to the spherical mirror and via two small flat mirrors and a final parabolic mirror focused onto the MCT detector. A retroreflector is a self-compensating mirror that is insensitive to position and movement. Parallel incident light will be returned to the light source regardless of the retrore-flector’s physical orientation.
Alignment of the open path optics was achieved by introducing a 24 V halogen lamp in the light path at the optical system’s first focal point. This produced a visible image of the lamp that could be adjusted onto the retrore-

30
flector and further onto the detector surface. Removal of the halogen lamp let the IR light travel along the same path, and once the detector sensed the IR signal, final alignment was easily done for maximum signal response.
Calibration spectra of the monoterpenes (+,-)-a-pinene, s-(-)-b-pinene, (+)- 3-carene, s-limonene, and ethanol were generated using a 5.6 liter, 20.25 meter analytical gas cell fitted with a closed loop injection system. Aliquots of the liquid compounds were injected to cover the absorbance ranges encountered in the field samples. A water vapor spectrum that closely represented the average air humidity in the mill was synthetically derived from a database.
IRexit
MCT
10-100 m
IR beam
Main mirror Retroreflector1st focal point
2nd f.p
Figure 12. Schematic drawing of the double-pass open path system used in Paper I, mounted on top of a Bomem MB 100 FTIR instrument. The optical path is simplified.
Paper II The objective was to collect field data in the sawsheds of sawmills to deter-mine the production based specific emission rates of monoterpenes. If the emission rates and the air flow rates are known, the concentration levels in a sawmill can be predicted based on the production volumes. The emission rates can hence be used to design the ventilation system so that the occupa-tional exposure limits for monoterpenes are met.
The terpene concentrations were measured with charcoal adsorbents dur-ing one work shift in three sawmills in summer and winter. Data was col-lected during sawing of both pine and spruce. The samples were taken in the workers’ breathing zone along the saw line, in exhaust ducts, and close to the suction area of ceiling exhaust fans. The adsorbents were desorbed with CS2and analyzed with capillary gas chromatography. Open-path FTIR was used in one mill with the optical path extending along the entire length of the sawshed. The purpose was to describe the fluctuations of the terpene levels in the sawshed as an indicator of the fluctuations in the exhaust ducts. The FTIR configuration and methodology was similar to the study in Paper I. The flow rates of the air exhausts were determined by direct measurements

31
in ventilation ducts using Pitot tubes and manometers and direct-reading air flow equipment (Alnor Compuflow).
Paper III The study describes the presence and formation of volatile compounds, par-ticularly hexanal and carbon monoxide, during storage of wood pellets. Sup-plementary monitoring of emissions from kiln drying of wood was per-formed to determine if the formation of carbon monoxide and hexanal was specific for wood pellet production or more general in nature. Experimental laboratory studies with wood pellets were performed to confirm the results from the field studies. Extensive literature surveys were made on the forma-tion of hexanal and carbon monoxide and on the toxicology of hexanal.
The FTIR method was used in cell-sampling configuration. Sampling was performed in three industrial pellet warehouses, in a domestic small storage, in a lumber kiln dryer, and in the experimental studies in the laboratory. Adsorbent sampling was performed in one pellet warehouse, in the labora-tory study, in three residential houses, and an outdoor background reference.
Paper IV Diffuse airflow (uncontrolled airflow) driven by natural ventilation or leak-age was a recognized source of measurement error in Paper II as well as in other field and experimental studies. This study approaches the problems of diffuse airflows and diffuse emissions by applying FTIR and a tracer gas technique. The immediate objective was to assess the overall terpene emis-sions by a section-by-section approach, and from there, assess the produc-tion-based specific emission, and by a dispersion model, the concentrations in close vicinity to a large mill. The parameters used for the emission calcu-lations were terpene concentrations, air exchange rates, and production fig-ures.
Terpene data was collected by FTIR spectroscopy using a cell-sampling configuration. Data was collected in the sawshed and the kiln dryer of a sawmill. The emissions from wood chips and bark were determined in ex-perimental studies performed in the laboratory. The specific airflow in the sawshed and the kiln dryer was determined by using the tracer gas concen-tration-decay method. A gas cylinder equipped with a timed valve was al-lowed to release a tracer gas at fixed intervals in a position where a rapid and homogenous distribution was achieved. A squared Pearson’s correlation coefficient (r2) of the log-linear decay of 0.95 or higher was employed as the inclusion criteria for the decay-rate analysis. A lower coefficient indicated

32
inhomogeneous ventilation. The flux of monoterpenes and the decays of the tracer gas were simultaneously measured with the FTIR instrument.
Statistical Methods The data in the four papers is presented using descriptive statistics, time se-ries, absolute values, arithmetic means, standard deviations, linear regression analysis, Pearson’s correlation coefficients, intra-class correlation, and clas-sical least square (K-matrix) methodology.

33
Results
The main finding from the studies in Paper I-IV are briefly summarized in the following sections.
Paper IThe fluctuations of the terpenes in the sawmill were principally governed by the production pattern with changes of shift and scheduled breaks (Figure 13). A change from pine to spruce production was made the last 24 hours of measurement and is accompanied by a distinct drop in the terpene levels. The work-shift average terpene concentrations exceeded the Swedish 8-hour occupational exposure limit of 150 mg/m3 during pine sawing but were well below the limit during spruce sawing. The personal adsorbent sampling showed good agreement with the parallel open path FTIR sampling (r = 0.99, intraclass coefficient = 0.96).
166167
181
138
2214
0
50
100
150
200
250
300
12:00 00:00 12:00 00:00 12:00 00:00 12:00 00:00 12:00
Tota
l ter
pene
con
cent
ratio
n (m
g/m
3)
Figure 13. Variation of the terpene concentration in the sawmill measured with open path FTIR. The mean concentrations are indicated in the boxes.
34
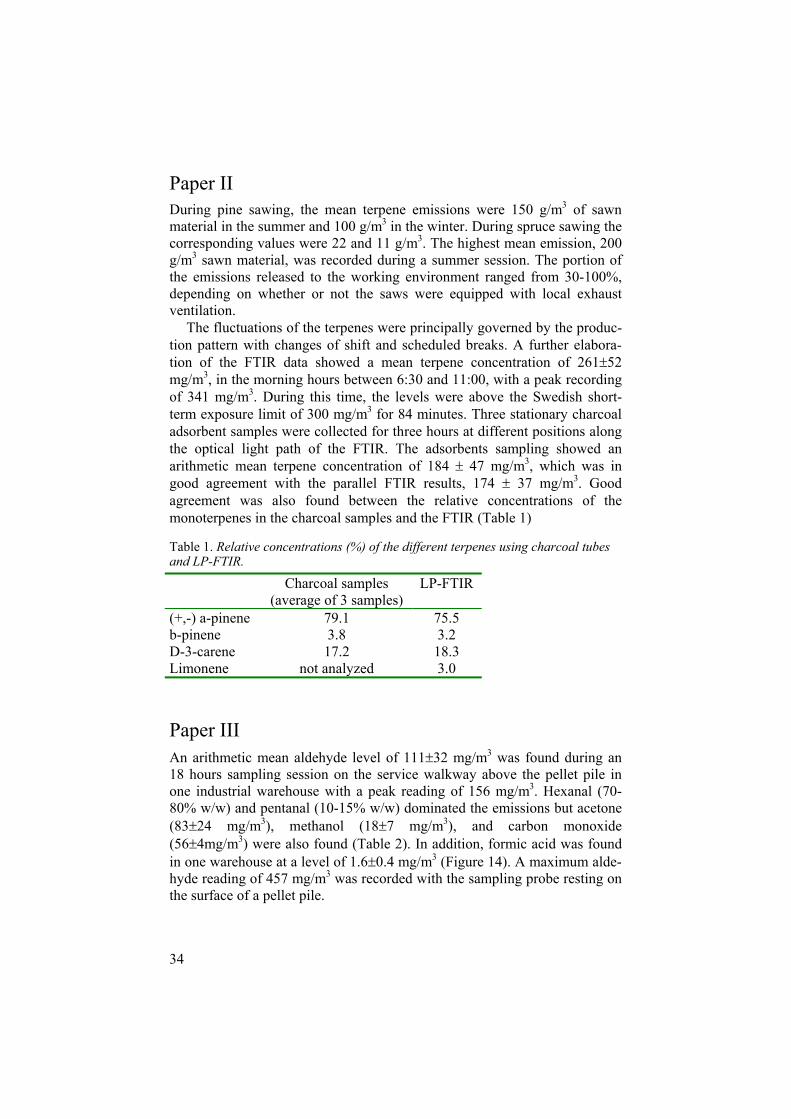
Paper II During pine sawing, the mean terpene emissions were 150 g/m3 of sawn material in the summer and 100 g/m3 in the winter. During spruce sawing the corresponding values were 22 and 11 g/m3. The highest mean emission, 200 g/m3 sawn material, was recorded during a summer session. The portion of the emissions released to the working environment ranged from 30-100%, depending on whether or not the saws were equipped with local exhaust ventilation.
The fluctuations of the terpenes were principally governed by the produc-tion pattern with changes of shift and scheduled breaks. A further elabora-tion of the FTIR data showed a mean terpene concentration of 261 52 mg/m3, in the morning hours between 6:30 and 11:00, with a peak recording of 341 mg/m3. During this time, the levels were above the Swedish short-term exposure limit of 300 mg/m3 for 84 minutes. Three stationary charcoal adsorbent samples were collected for three hours at different positions along the optical light path of the FTIR. The adsorbents sampling showed an arithmetic mean terpene concentration of 184 47 mg/m3, which was in good agreement with the parallel FTIR results, 174 37 mg/m3. Good agreement was also found between the relative concentrations of the monoterpenes in the charcoal samples and the FTIR (Table 1)
Table 1. Relative concentrations (%) of the different terpenes using charcoal tubes and LP-FTIR.
Charcoal samples (average of 3 samples)
LP-FTIR
(+,-) a-pinene 79.1 75.5 b-pinene 3.8 3.2 D-3-carene 17.2 18.3 Limonene not analyzed 3.0
Paper III An arithmetic mean aldehyde level of 111 32 mg/m3 was found during an 18 hours sampling session on the service walkway above the pellet pile in one industrial warehouse with a peak reading of 156 mg/m3. Hexanal (70-80% w/w) and pentanal (10-15% w/w) dominated the emissions but acetone (83 24 mg/m3), methanol (18 7 mg/m3), and carbon monoxide (56 4mg/m3) were also found (Table 2). In addition, formic acid was found in one warehouse at a level of 1.6 0.4 mg/m3 (Figure 14). A maximum alde-hyde reading of 457 mg/m3 was recorded with the sampling probe resting on the surface of a pellet pile.

35
Table 2. Peak readings in mg/m3on the service walkways and on top of a pellet pile.
Plant A Service walk-
way
Plant BService walk-
way
Plant BTop of pile
OELmg/m3
Aldehydes 61 156 457 N/A Methanol 9 27 37 250 Acetone 31 117 329 600 Formic acid 2 0 0 5 CO 57 61 85 40
The emissions from pellets inside a domestic storage room varied with the ambient temperature and peaked in the midst of the warm season after two months storage. Arithmetic mean aldehyde levels of 98 4 mg/m3 and car-bon monoxide 123 10 mg/m3 were recorded inside the storage room and a peak reading of 6 mg/m3 in a room adjacent to this poorly sealed storage room. Elevated levels of hexanal, 0.056 and 0.084 mg/m3, were recorded inside two domestic houses in rooms adjacent to the storage rooms. An out-door reference showed zero aldehyde concentration. Experimental laboratory studies where pellets were exposed to an ambient air stream showed forma-tion of aldehydes and carbon monoxide and thus confirmed the findings of the field studies.
0.05
0.1
0.15
0.2
0.25
0.3
0.35
0.4
70012001700220027003200
Wavenumber (cm-1)
Abs
orba
nce
Aldehydes
C-H band
Carbonmonoxide
Acetone
Formic acid
Methanol
WaterCO2
Figure 14. An FTIR spectrum from the service walkway in a pellet warehouse.

36
Paper IV The dominating terpene emissions from the sawmill emanated from the saw-shed and drying sections. The emissions from bark piles were just 1% of the total during pine sawing but 20% during spruce sawing. The total emissions and the section-by-section figures are presented in Table 3. The figures for spruce were obtained by taking 10% of the emission figures for pine based on a previous established ratio presented in Paper II. The exception was the emission from bark where the emission was higher from spruce, as shown in the present study. Apart from terpenes, methanol, ethanol, hexanal, and car-bon monoxide were detected; some of which are dealt with in Paper III.
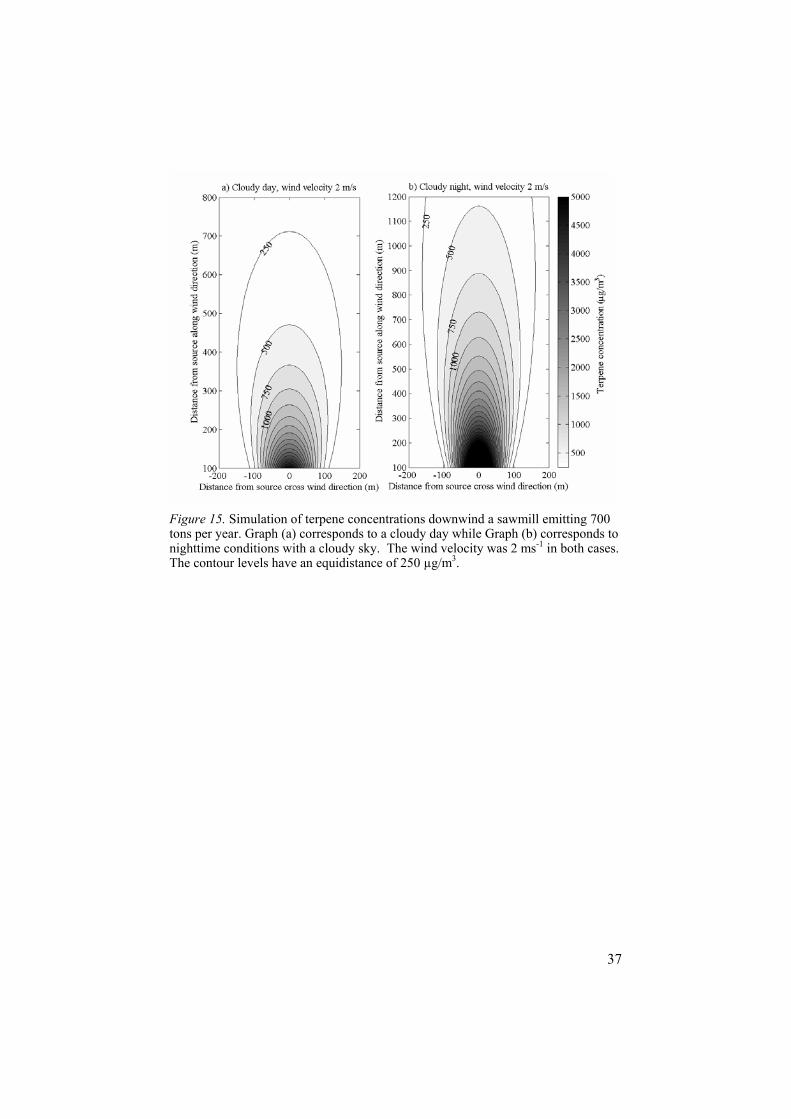
The total annual emission of terpenes from a large sawmill, processing one million cubic meters round wood of Scots pine, is approximately 700 tons. The source dispersion model predicted a terpene concentration of up to 1500 g/m3, 500 meters downwind from such size sawmill (Figure 15).
Table 3. Total monoterpene emissions from Scots pine and Norway spruce, ex-pressed as grams/m3 of solid wood under bark.
Scots pine
Norway spruce.
Sawing, trimming, and chipping 260 26* Sorting 90** 9* Drying 200 20* Wood chip and sawdust storage (one week) 100 10* Bark storage (one week) 8 17 Total 658 82
* Calculated values, 10 % of corresponding value for Scots pine. ** Calculated value, 1/3 of sawing, trimming, and chipping.
37
Figure 15. Simulation of terpene concentrations downwind a sawmill emitting 700 tons per year. Graph (a) corresponds to a cloudy day while Graph (b) corresponds to nighttime conditions with a cloudy sky. The wind velocity was 2 ms-1 in both cases. The contour levels have an equidistance of 250 µg/m3.

38
Discussion
Paper I The open path FTIR application described offered a robust and convenient arrangement for continuous monitoring of gases over extended periods. The overall diffuse emissions and absence of strong point sources in the sawshed explained the good agreement found between open path FTIR and personal adsorbent samples. An averaging effect on the personal exposure is achieved when workers moved around in the sawshed.
However, there are some methodological issues to discuss. In the sawmill environment, the continuous low frequency vibrations from heavy machin-ery and the intermittent shock vibrations from falling logs limited the avail-able positions of the FTIR. Vibrations might disturb the internal alignment and performance of the open path FTIR instrument and the use of a vibra-tion-isolated platform may be considered. The present FTIR instrument tol-erated some vibrations; however, some spectra were distorted. The retrore-flector is inherently insensitive to vibrations. A common cause for baseline shift in the FTIR spectra was the temporary beam blockage when workers passed through the optical path resulting in baseline shift and reduced SNR. The baseline shift was dealt with by introducing a randomized baseline shift in the calibration spectra. Beam blockage should be minimized but balanced against the need for correct workers’ exposure. Ideally the beam should trav-erse workers’ breathing zone.
The detection limit for -pinene at 64 co-added scans, 1 cm-1 resolution and 120 m total path length was approximately 1.5 mg/m3 calculated as twice the peak-to-peak noise level. By using the less specific CH-stretch region 3000 cm-1, the detection limit increased to 0.1 mg/m3. The open path FTIR set-up was a research configuration that could be further opti-mized for improved optical throughput. The outgoing beam had a divergence largely overfilling the retroreflectors, and the projection of the retroreflectors on the detector did not fill the entire detector area, giving room for mechani-cal movement without affecting the signal amplitude. The detection limit could significantly be improved by using a larger retroreflector array. Opti-mizing the retroreflector area so that perfect overlap is achieved will result in better signal, but it may render the system more vibration sensitive, because
39
a small mechanical displacement will make part of the returning beam fall outside the area which the detector sees and part of the signal amplitude will be lost. This problem could be overcome by using an array of retrore-flectors significantly larger than the acceptance angle of the detector.
Furthermore, the results show that the quantitation of the four individual terpene levels was not consistent below 50 mg/m3, where the relative con-centrations of -pinene and 3-carene starts deviating, however not affect-ing, the total terpene concentration. This disagreement was further empha-sized when data from spruce sawing was analyzed. It was assumed that the relative terpene concentrations should be consistent regardless of the total concentration in air. It was first speculated that the observed inverse depend-ence between -pinene and carene below 50 mg/m3 could be explained by the contribution of an unknown compound, such as an oxidation product with spectral resemblance of terpenes. However, a more plausible explana-tion is that the signal-to-noise ratio is too low and the CLS analysis is af-fected by the noise in spectra.
The collection of good reference spectra with the open path FTIR intro-duces some difficulties since the sample air cannot be eliminated from the optical path. The presence of IR-signal from sample compounds in the refer-ence spectra will lead to underestimation of concentrations. One solution is to install the open path system in an environment free from sample com-pounds and collect reference spectra. However, instrumental factors, par-ticularly alignment differences, cannot be perfectly reproduced from one location to the other. Poor reference spectra may cause skewed baselines and large residual absorbance leading to severe misinterpretation of both identity and quantity of sample compounds. The same problem occurs if reference spectra collected in a cell are used. Spectral manipulation may sometimes be the final resort for obtaining a useful reference spectrum. The sample signal is synthetically removed and a “clean” reference is created. This may be an acceptable solution if the SNR is high. There is no general rule to answer which way works best. A considerable advantage of FTIR spectroscopy is that all spectral information from a sample session is stored in the computer and available for post-session experimentation.
In our study, time series of spectra were collected. Those spectra collected minutes before the sawmill process started in the morning contained negligi-ble contribution from the sample compounds and were used as reference spectra.
Paper II The work in Paper II pointed at the difficulties with diffuse airflows and hence uncertainties introduced in the emission calculations. The relatively few charcoal samples may have introduced a sample bias, however the larg-

40
est measurement error was assumed to be the uncontrolled diffuse airflow leading to underestimation of emissions. The exposure levels inside the Fin-nish sawmills corresponded well to the results from the Swedish mill inves-tigated in Paper I. The seasonal differences reflected in the emissions may be the result of biochemical factors in the wood or simply due to the fact that the wood was colder. In addition to emission control measures on the ma-chinery, the construction of well-ventilated control rooms from where work-ers can supervise the process should be considered. Control rooms are seen in many mills today; however, many were constructed to reduce noise expo-sure and some even take supply air from inside the sawshed.
Paper III The high levels of hexanal and carbon monoxide recorded in connection with the storage of wood pellets may constitute an occupational and domes-tic health hazard. The results from lumber drying show that the emissions of hexanal and carbon monoxide are not limited to wood pellets but are caused by general degradation processes of wood, facilitated by drying at elevated temperature. The emission of carbon monoxide from wood materials at low temperatures (less than 100oC) has not previously been reported in the litera-ture. The toxicological literature survey conclude that the available scientific information on hexanal is insufficient to determine the potential risks to health. However, the data presented in the present study seems sufficient for undertaking preventive measures to reduce exposure to hexanal.
Several compounds were detected that conventional adsorbent sampling methods would not detect, particularly carbon monoxide, formic acid, methanol, and formaldehyde. The IR-signal in the “fingerprint region” (600-1300 cm-1) was too weak to resolve individual aldehydes at the concentra-tions found. The strong aldehyde peak at 2712 cm-1 has approximately equal absorption for the dominating straight-chain aldehydes found in this study. The FTIR results were expressed as hexanal equivalents based on the quanti-tation of this peak. The mutual concentration of the aldehydes was estab-lished by adsorbent sampling and analysis with gas chromatography. Form-aldehyde has a characteristic infrared spectrum and could be singled out from the other aldehydes. Only single-point calibration was used for carbon monoxide (38 mg/m3), however, we estimate that the calibration error was less than 10%. Condensation of water in sampling lines was a problem in the kiln drying measurements since they were not heated. The flow rate was minimized to reduce the absolute moisture burden in the system. The con-densate was collected in a water trap and analyzed separately and it was concluded that none of the target compounds were absorbed.

41
Formation of hexanal through autoxidation Hexanal and pentanal are previously known as low-level emittants from wood and wood products and are often identified in indoor air investigations at levels between 0-0.005 mg/m3 (Brown et al., 1994). Emissions of hexanal from medium density fiberboard products (MDF) have been reported to lin-ger for several months (Brown, 1999). The short chain aldehydes are re-ported to make up more than 50% of the volatile organic compounds emitted from MDF (Baumann et al., 2000).
Hexanal and other alkanals are not naturally occurring compounds in wood but degradation products of other constituents of wood. These alde-hydes are probably formed by the oxidative degradation of natural lipids present in wood. Scots pine contains 3-5% of the dry weight of triglycerides and free fatty acids, where linoleic acid, a polyunsaturated acid, is the major constituent, which amounts to just less than 50% of the total fatty acid de-rivatives (Piispanen and Saranpaa, 2002). Approximately the same amount is found in Norway spruce (Hoell and Piezconka, 1978). Hence, wood pellets can contain up to 20 gram/kg linoleic acid that can be degraded by oxygen. Oxidation of linoleic acids or its esters yields hexanal as the major volatile component (Back and Allen, 2000). Such reactions can be either enzyme catalyzed or occur through a so-called autoxidation process (Noordermeer et al., 2000) (Schieberle and Grosch, 1981) (Frankel et al., 1989). Because of the high temperature involved in pellet production, with enzyme denatura-tion as a probable consequence, the major path for this process in pellets is most likely proceeding through autoxidation.
The first step in the autoxidation process is called initiation (Figure 16 steps 1 and 2), where for example a metal ion in the material reacts with oxygen yielding a peroxy radical bound to the metal (step 1) (Smith and March, 2001). Heat and light are possible alternative mechanisms of radical formation in the material. The radical formed abstracts one of the hydrogen atoms in a -CH2-group positioned between two double bonds in the fatty acid and forms an allyl radical (Korcek et al., 1972). This radical is stabilized by resonance, and it is a mean of the three forms shown in step 2. In the follow-ing chain reaction, the allyl radical reacts with oxygen forming a peroxy radical (step 3). Then the peroxy radical reacts with the fatty acid (step 4) and recreates an allyl radical, which enters step 3 again and the chain reac-tion has started. The chain reaction continues as long as there is oxygen pre-sent in the system, and provided that the radicals do not react with each other. One possible route leading to hexanal is illustrated in Figure 18 (a) (Schieberle and Grosch, 1981). The presence of hexanoic acid in some sam-ples in the laboratory experiments presented in Paper III, is explained by the autoxidation of hexanal to hexanoic.

42
Figure 16. Spontaneous autoxidation of polyunsaturated lipids in the presence of oxygen and radical initiators. Step 1 2: Initiation. Step 3 and 4: Chain reaction.
Formation of hexanal through biological degradation mechanism Due to the high production temperatures, wood pellets should be more or less sterile when they are placed in the warehouses. A recent study of micro-bial components from various biofuels reported low dustiness in terms of all microbial components from wood pellets and wood briquettes (Madsen et al., 2004). If wood pellets are stored in humid environments it is not unlikely that microbiological activities are initiated. Our study concluded that when newly produced, hot pellets were placed in the warehouses, evaporation of residual water in the pellets occurred. The resulting humid air migrated to the colder surface layer of the pile, where condensation occurred, giving moist pellets that partially disintegrated to sawdust.
Microorganisms could contribute to the degradation of fatty acid deriva-tives. Several different enzyme systems could be activated in the initial steps of the degradation (Noordermeer et al., 2001) (Veldink et al., 1977) The biological degradation starts with a lipid attaching to the iron-containing enzyme lipoxygenase. The formed Fe-(III)-complex abstracts a hydrogen atom from the polyunsaturated lipid, which then forms an allyl radical, si-multaneously as a protonated Fe-(II)enzyme is formed (step i in Figure 17 (Schilstra et al., 1994)). The formed radical reacts with oxygen (step ii).Next the peroxy radical is reduced to the anion of Fe-(II), which is simulta-neously transformed to Fe-(III) (step iii). A proton is transferred to the per-oxy anion and the neutral hydroperoxide leaves the enzyme as the Fe-(III)-enzyme complex is regenerated (step iv) and can start a new catalytic cycle.

43
H-Enz-FeII
R'RH H
R'RH
O2
H-Enz-FeII
R'RH
H
HO OH-Enz-FeIII
Enz-FeIII
R'RH
HO O
R'RH
HO OH
i
ii
iii
iv
Figure 17. Oxidative degradation of polyunsaturated lipids caused by an iron-enzyme system in living organisms. i) Radical formation by an iron-(III)-enzyme, where Fe(III) is reduced to Fe(II). ii) Reaction with oxygen. iii) Oxidation of iron. iv) The hydroperoxide product from the lipid leaves and the Fe-(III)-enzyme is re-generated and can start a new catalytic cycle.
The mechanism for the formation of hydroperoxides through autoxidation and enzyme catalyzed oxidation are hence similar since they are both radical mediated reactions. The continued degradation of the formed hydroperoxides leads to the formation of hexanal as the dominant volatile product and is briefly described in Figure 18a. A detailed mechanistic proposal for how hexanal can be formed from the initially formed hydroperoxide by means of cytochrome P450 enzymes is described in Figure 18b (Noordermeer, Van Dijken, 2000)

44
Figure 18 a) Degradation of linoleic acid derivative to hexanal through autoxidation or via enzyme catalysis. b) The mechanism for the cytochrome P450 enzyme medi-ated catalytic degradation of a hydroperoxylated linoleic acid derivative.
Formation of carbon monoxide The emission from pellets of one-carbon compounds containing oxygen and hydrogen such as methanol, formaldehyde, and formic acid is not surprising. The last two compounds may be autoxidation products of methanol. Other one-carbon compounds are carbon monoxide and carbon dioxide. The high level of carbon monoxide in the pellet warehouses was unexpected. It is well known that during the thermal anaerobic degradation of wood (pyrolysis) carbon monoxide is formed. However, low-temperature emission of carbon monoxide from wood products has not been reported previously. Carbon monoxide has a characteristic IR spectrum and cannot be mistakenly identi-fied. It was at one point suspected that carbon monoxide could be trapped in the wood pellet if the raw material was dried in direct contact with hot flue gases generated in a gas or wood pellet burner. This kind of manufacturing process was used in two of the investigated plants. However, carbon monox-ide formation was also detected both from pellets produced with indirect drying methods and from raw material (planer shavings) which were not additionally dried. In addition, measurements in a lumber dryer also demon-strated that formation of carbon monoxide occurred as the drying process advanced.
When various organic matters are stored at room temperature, particularly in the presence of air and light, small amounts of carbon monoxide can be observed and the formation is enhanced by increased temperature (Levitt et al., 1995). Microsomal lipids also produce carbon monoxide during peroxi-

45
dation, initiated via different Fe-(III) complexes. After initiation, the reaction appears to be non-enzymatic, an autoxidative process (Wolff and Bidlack, 1976). Carbon monoxide (300-400 ppm) has been observed in the air above 7000 ton of rapeseed stored in a sealed warehouse and the calculated specific emission rate was estimated to 200 mg/ton/day (Reuss and Pratt, 2001). Car-bon monoxide has been found in a wheat grain warehouse with a specific emission rate of 9 mg/ton/day (Whittle et al., 1994). These emission rates can be compared with the specific emission rates we have found in the small pellet storage, which ranged between 100 and 885 mg/ton/day.
The more rapid formation of carbon monoxide in materials with a high fat content (rapeseed) compared to those with a low fat content (wheat) indi-cates that carbon monoxide may be formed through the autoxidative degra-dation of fats. The measurements in this study indicate that the carbon mon-oxide and hexanal emission often correlate. We therefore suggest that the carbon monoxide formation observed during storage of the wood pellets is caused by the autoxidation of residual lipophilic extractives present in pel-lets, mainly fats and fatty acids. However, carbon monoxide formation from other organic materials present in wood such as cellulose, hemicellulose, and lignin cannot be ruled out.
Paper IV There is limited data from field measurements of VOC emission from saw-mills. To the best of our knowledge, there are no published reports where the overall emissions have been investigated. Apart from the report in Paper II, there are only a few studies of emissions from sawmills, e.g., experimental kiln drying (Ingram and Templeton, 2000) (Englund and Nussbaum, 2000) (NCASI, 1996), and wood chip storage (Hiltgen and Myers, 1996) (Axelssonet al., 1992). Several of these reports recognized the uncontrolled diffuse airflow as an important factor of uncertainty, and others were based on ex-tractive sampling with the prime motive to look at product loss rather than emission.
The use of FTIR in combination with a tracer gas technique successfully resolved the previous difficulties with diffuse uncontrolled ventilation. The integrated characteristics of both mechanical and natural ventilation of the sawmill process rooms were established. It was found that natural ventilation might account for more than half of the total ventilation even when seem-ingly large capacity exhaust fans were installed. Natural ventilation changes over time, and multiple determinations of the airflow were conveniently arranged by the use of a timed valve connected to the tracer gas source.
The large amount of terpenes emitted from a large sawmill raises con-cerns about the location of sawmills in close vicinity to residential areas. The dispersion modeling indicated that several hundred meters distance is re-
46
quired to obtain concentration levels below 1% of the Swedish occupational exposure limit, a rule of thumb sometimes used for ambient exposures when other data is lacking.
Evaluation of the FTIR technique Field studies are always affected by large measurement errors of systematic and random nature. The instrumental errors of the FTIR are considered to be negligible compared to uncertainties associated with the temporal and spatial variation of airborne concentrations. Long-term sampling with an open path FTIR technique described in Paper I can minimize these uncertainties. The path-integrated characteristics of the open path method replace numerous point samplers to obtain the same data. Long time series can be collected with minimum effort. The FTIR instrumentation equipped with a DTGS detector can be left unattended for days, weeks, or months. All data is saved in the computer, which allows unlimited post-session experimentation and re-analysis of results.
The non-invasiveness of sample air minimizes sampling and analytical er-rors. Typically, the instrumental errors of calibration and spectral interfer-ence are estimated to be less than 10 %.
The qualitative and quantitative analysis of the parallel sampling with FTIR and charcoal adsorbents showed good agreement in all studies. How-ever, aerial measurements can never fully replace personal monitoring for assessment of exposure.
One of the major strengths of the FTIR method is that several compounds in mixtures with widely different chemical nature can be measured simulta-neously. Few other methods allow sampling of low molecular weight com-pounds like carbon monoxide and methanol alongside the higher weight compounds. The high temporal resolution, a few seconds, makes the identi-fication of short peaks possible, which may be of importance in exposure assessments. High specificity is attained by detailed spectral resolution and successful identification of compounds can often be done without an ad-vanced spectral identification process.
The on-site quantitative and qualitative analysis provides excellent screening capacity in environments with unknown compounds and allows the operator to interactively experiment with ventilation or other process parameters to minimize emissions and exposures.
The major disadvantages found with the FTIR are the relatively high ini-tial instrumental costs. For the beginner a relatively long training period is required, particularly for software. There is a serious lack of training courses on gas-phase FTIR. The limitations of the analytical capacity may, particu-larly due to overlapping peaks or insufficient sensitivity, require the use of other sampling and analytical methods. The problem of condensation in

47
sampling lines and the analytical cell must be dealt with when sampling hu-mid environments. Severe vibrations in industrial environments may limit the available positions of the instrument. Another limitation is the relatively heavy FTIR instrument ( 40 kg) and may at times require two people to install.
Considering the information obtained from infrared spectroscopy, it is remarkable that there are so few users of FTIR instrumentation within the discipline in Sweden as well as in other countries. In the last five years, apart from the publications in this thesis, there are no peer-reviewed Swedish pub-lications on the use of FTIR for gas-phase analysis in occupational environ-ments. A Finnish research team have studied solvent emissions with open-path FTIR (Raisanen and Niemela, 2002) (Raisanen and Niemela, 1999). Most publications originate from United States (Wu et al., 2003) (Yost et al.,2003) (Ross and Todd, 2002) (Farhat and Todd, 2000) (Todd et al., 2001) (Todd, 2000), however, recent work from Taiwan and England is recognized (Li et al., 2002) (Simpson, 2003).

48
Conclusions
Open path FTIR offers a robust and convenient arrangement for continuous long-term monitoring of gases in industrial environments. The qualitative and quantitative analysis of the parallel sampling with FTIR methods and charcoal and Tenax adsorbents shows good agreement. Vibrations may dis-turb the internal alignment and performance of the open path FTIR instru-ment and temporary beam blockage may cause reduced SNR. Limited SNR reduces sensitivity and may cause difficulties resolving individual compound concentrations. Hence, complementary sampling with enrichment methods may be required.
Several compounds in mixtures can be measured simultaneously with FTIR instruments. Few other methods allow sampling of low molecular weight compounds like carbon monoxide and methanol alongside the higher weight compounds, and this is the reason for the discovery of previously non-reported compounds in emissions from storage of wood pellets. Diffuse airflow can be characterized by using FTIR spectroscopy and a tracer gas technique. Synchronous monitoring of tracer gas and emission compounds permits efficient experimental set-ups for long-term measure-ments.
All in all, the FTIR methodology represents a significant advancement in measurement technology. It provides a high level of performance and adapt-ability for a broad range of applications, in the field and in the laboratory. In spite of the relatively high instrumental costs, FTIR spectroscopy should be considered a standard technique within occupational and environmental hy-giene.
Suggestions for Future Research The open path technique can be developed in several aspects. Optimizing the optical configurations for better light throughput has already been men-tioned. The extended optical path used in Paper I and II limits its use in many occupational environments due to spatial constraints. The increasingly lower concentrations of environmental pollutants call for even longer path-lengths. This contradiction can be resolved by folding the light path numer-ous times. A multi-pass open cell has been designed by Galle et al. (Galle, 1999). It has a 1-km optical pathlength over a base path of 25 m. The infra-

49
red light is folded and refocused 40 times before it reaches the detector. The detection level is in the ppb range. A special version with a 5 m base path and a total optical pathlength of 200 m has been developed for small spaces. This unit has been used in some preliminary tests in the field. This design may be useful in a variety of situations, e.g., occupational exposure assess-ment, ambient air monitoring, monitoring of vehicle emissions, and meas-urement of carbon monoxide as an indicator environmental tobacco smoke.
The dynamics of the atmospheric degradation of monoterpenes has been investigated in an experimental study using long-path FTIR in a quartz chamber (Liu and Hu, 2001). The improved open path FTIR technique may be a useful tool to investigate atmospheric degradation of emissions down-wind from an emission source as well as the concentrations in residential areas.
The findings related to the toxicology of hexanal needs to be further in-vestigated. An application has been submitted for financing of further studies aiming at investigating at what air levels n-hexanal causes mucosal irritation. Healthy volunteers will be exposed to n-hexanal vapors under controlled conditions. Effects will be monitored via questionnaires as well as measurements of lung function, nasal congestions, and eye blink frequency. The study is conditional to approval by the ethical committee and the final goal is the adoption of occupational expsoure limits.
The suggested pathways for the formation of hexanal and carbon monoxide both depend on the prescence of oxygen. The storage of wood pellets in closed spaces may result in the simultaneous depletion of oxygen as carbon monoxide and hexanal are formed. The combined toxic effect from carbon monoxide exposure and oxygen deficiency may be extremely dangerous. Further studies should be conducted to investigate the critical factors for the formation of carbon monoxide.
The results from lumber drying showed that the emissions of hexanal and carbon monoxide were not limited to wood pellets. Other studies have re-ported elevated levels of carbon monoxide in storage of farm products. It seems appropriate to launch a broad project aiming at screening environ-ments with potential emissions. This should include the transportation chain of products and a more thorough investigation of the exposures to domestic end-users.

50
Acknowledgements
I want to express my sincere appreciation to those who have made this thesis possible.
Thanks to my major supervisor Professor Christer Edling for accepting me as a graduate student at the Dept. of Medical Sciences / Occupational & Envi-ronmental Medicine. Thanks for your support and encouragement.
Thanks to my second supervisor, Bo Galle for introducing me to the techni-cal aspects around FTIR instrumentation and particularly for encouraging me to use open path techniques.
Thanks to my third supervisor, Hans-Erik Högberg, for the discussions around aspects of wood chemistry.
Thanks to Tohr Nilsson for providing the opportunity to do research and providing a research-friendly environment.
Thanks to my colleagues at the department of Occupational and Environ-mental Medicine.
Thanks to Kåre Eriksson for reading my manuscripts and sorting out what goes where.
Thanks to Tony Waldron for valuable comments.
Thanks to Hans Malker and the FoU-center of Landstinget Västernorrland for providing scholarships.
Thanks to all the co-authors of the papers included in the thesis.
Thanks to the personnel at the sawmills and pellet warehouses for showing great interest in the work.

51
References
Axelsson H, Boström C-Å, Cooper D, Svedberg U. (1992) Measurements of terpene emissions from wood chip piles using Fourier transform infrared spectroscopy (FTIR). Nordic Pulp & Paper Research Journal; (3):155-158.
Axelsson H, MacLaren S, Galle B, Mellqvist J, Kloo H, Svedberg U.(1992) Development of a Long path fourier transform infrared (LP-FTIR) instru-ment for measurements of diffuse VOC emissions from the automobile in-dustry. In: International Conference on Monitoring Toxic Chemicals and Biomarkers; 1992; Berlin: SPIE.
Back EL, Allen LH.(2000) Pitch control, wood resin and deresination. At-lanta: Tappi Press 0-89852-519-5.
Baumann MGD, Lorenz LF, Batterman SA, Zhang G-Z. (2000) Aldehyde emissions from particleboard and medium density fiberboard products. For-est Prod. J; 50(9):75-82.
Brown SK. (1999) Chamber assessment of formaldehyde and VOC emis-sions from wood-based panels. Indoor Air; 9(3):209-15.
Brown SK, Sim MR, Abramson MJ, Gray CN. (1994) Concentrations of Volatile Organic Compounds in Indoor Air-A review. Indoor Air; 4:123-134.
Drew J, Pylant GD, Jr. (1966) Turpentine from the Pulpwoods of the United States and Canada. TAPPI; 49(10):430-438.
Edling C, Lundberg P. (2000) The significance of neurobehavioral tests for occupational exposure limits: an example from Sweden. Neurotoxicology; 21(5):653-8.
Edman K, Lofstedt H, Berg P, Eriksson K, Axelsson S, Bryngelsson I, Fedeli C. (2003) Exposure assessment to alpha- and beta-pinene, delta(3)-carene and wood dust in industrial production of wood pellets. Ann Occup Hyg; 47(3):219-26.
Englund F, Nussbaum RM. (2000) Monoterpenes in Scots Pine and Norway Spruce and their Emission during Kiln Drying. Holzforschung; 54:449-456.

52
Eriksson K. (1994) Evaluation of a diffusive sampler for air sampling of monoterpenes. Analyst; 119:85-88.
Eriksson K, Levin J, Sandström T, Lindström-Espeling K, Linden G, Stjern-berg N. (1997) Terpene exposure and respiratory effects among workers in Swedish joinery shops. Scandinavian Journal of Work, Environment and Health; 23:114-20.
Eriksson K, Stjernberg N, Levin J, Hammarström U, Ledin M. (1996) Ter-pene exposure and respiratory effects among sawmill workers. Scandinavian Journal of Work, Environment and Health; 22:182-90.
Falk A, A L, Hagberg M, Hjelm E, Wang Z. (1991) Human exposure to 3-carene by inhalation; toxicokinetics, effects on pulmonary function and oc-currence of irritative and CNS symptoms.. Toxicol Appl Pharmacol; 110(2):198-205.
Farhat SK, Todd LA. (2000) Evaluation of open-path FTIR spectrometers for monitoring multiple chemicals in air. Appl Occup Environ Hyg; 15(12):911-23.
Finlayson-Pitts BJ, Pitts JNJ.(1986) Atmospheric chemistry : fundamentals and experimental techniques. New York: Wiley-Interscience publication 0-471-88227-5.
Frankel EN, Hu ML, Tappel AL. (1989) Rapid headspace gas chromatogra-phy of hexanal as a measure of lipid peroxidation in biological samples. Lipids; 24(11):976-81.
Galle B. Development and application of Methods based on DOAS and FTIR Absorption Spectroscopy for Atmospheric Research. Göteborg: Chalmers University of Technology; 1999.
Galle B, Mellqvist J, Arlander DW, Flöisand I, Chipperfield MP, Lee AM. (1999) Ground based FTIR measurements of stratospheric species from Har-estua, Norway during SESAME and comparison with models. Journal of Atmospheric Chemistry; 32:147-164.
Grant WB. (1992) Optical remote measurement of toxic gases. Journal of the Air & Waste Management Association; 42(1):18-30.
Grieve PW.(1991) Measuring ventilation using tracer-gases. Naerum: Bruel & Kjaer
Griffiths PR, de Haseth JA.(1986) Fourier Transform Infrared Spectroscopy. New York: Wiley-Interscience publication

53
Groth AB. (1958) Investigations on Swedish turpentine. Svensk Papper-stidning; 61(10):311-321.
Haaland DM, Easterling RG. (1982) Application of New least-squares meth-ods for the quantitative infrared analysis of multicomponent samples. Ap-plied spectroscopy; 36(6):665-673.
Haaland DM, Easterling RG, Vopicka DA. (1985) Multivariate least-squares methods applied to the quantitative spectral analysisof multicomponent sam-ples. Applied Spectroscopy; 39(1):73-84.
Hedenstierna G, Alexandersson R, Rosén G, Wimander K, Randma E. (1984) Subjektiva besvär och lungfunktion vid yrkesmässig exponering för sågångor. Arbete och Hälsa; (8):1-20.
Herget WF, Brasher JD. (1979) Remote measurement of gaseous pollutant concentrations using a mobile Fourier transform interferometer system. Ap-plied Optics; 18(20):3404-3420.
Hiltgen KD, Myers T.(1996) A method to determine VOC emissions from chip piles. In: 1996 International Environmental Conference; 1996; Orlando, FL, USA: TAPPI Press. p. 607-615.
Hoell W, Piezconka K. (1978) Lipids in the sap and heartwood of Picea abies (L.) Karst. Zeitschrift fur Pflantzenphysiologie; 87:191-198.
ILO.(1983) Encyclopaedia of occupational health and safety. 3 ed. Geneva: International Labour Organisation 92-2-103289-2.
Ingram LL, Templeton CM. (2000) Knot, heartwood, and sapwood extrac-tives related to VOCs from drying southern pine lumber. Journal of Wood Chemistry and technology; 20(4):415-439.
Jansson R. Monoterpenes from the boreal coniferous forest: Their role in atmospheric chemistry. Stockholm: Stockholm University; 1992.
Jerbo A-L, Nilsson O, Liliequist I, Schnell J-B. (1984) Industriminnen i Västernorrland. Delrapport 1 i Ljunganutredningen. Sundsvall: Sundsvall Museum. Report No.: 1.
Kimland B, Norin T. (1972) Wood extractives of common spruce, Piceaabies (L.) Karst. Svensk Papperstidning; (10):403-409.
54
Korcek S, Chenier JHB, Howaqrd JA, Ingold KU. (1972) Absolute rate con-stants for hydrocarbon autoxidation. XXI Activation energies for propaga-tion and the correlation of propagation rate constants with carbon-hydrogen bond strengths. Canadian Journal Chemistry; 50:2285-97.
Levitt MD, Ellis C, Springfield J, Engel RR. (1995) Carbon monoxide gen-eration from hydrocarbons at ambient and physiological temperature: a sen-sitive indicator of oxidant damage? Journal of Chromatorgraphy; 695:324-328.
Li SH, Li SN, Shih HY, Yi HD, Chiang CY. (2002) Personnel exposure to waste sevoflurane and nitrous oxide during general anesthesia with cuffed endotracheal tube. Acta Anaesthesiol Sin; 40(4):185-90.
Lillienberg L, Baur X, Doekes G, Belin L, Raulf-Heimsoth M, Sander I, Stahl A, Thissen J, Heederik D. (2000) Comparison of four methods to as-sess fungal alpha-amylase in flour dust. Ann Occup Hyg; 44(6):427-33.
Liu ZR, Hu D. (2001) [Determination of rate constants of gas-phase reac-tions of alpha-pinene and beta-pinene with ozone]. Guang Pu Xue Yu Guang Pu Fen Xi; 21(5):585-7.
Madsen AM, Martensson L, Schneider T, Larsson L. (2004) Microbial Dustiness and Particle Release of Different Biofuels. Ann Occup Hyg.
Malachowski MS, Levine SP, Herring G, Spear RC, Yost M, Yi Z. (1994) Workplace and environmental air contaminant concentrations measured by open path Fourier transform infrared spectroscopy: a statistical process con-trol techniquie to detect changes from normal operating conditions. Journal of the Air & Waste Management Association; 44(May):673-682.
Malmberg P, Rask-Andersen A, Eriksson K. (1994) Bronkiell reaktivitet och lungfunktion hos sågare och justerverksarbetare. Yrke och Hälsa; (26).
Michelson A. (1891) Phil. Mag.; 5(31).
National Board of Forestry S.(1999) Statistical Yearbook of Forestry. Jönköping: National Board of Forestry 91-88462-40-4.
National Board of Forestry S.(2003) Statistical Yearbook of Forestry. Jönköping: National Board of Forestry 91-88462-54-4.
NCASI. (1996) A small-scale study on method 25A measurements of vola-tile organic compound emissions from lumber drying. Research Triangle Park: National Council of the paper industry for air and stream improve-ment, Inc. July 1996. Report No.: TB 718.
55
Noordermeer MA, Van Dijken AJ, Smeekens SC, Veldink GA, Vliegenthart JF. (2000) Characterization of three cloned and expressed 13-hydroperoxide lyase isoenzymes from alfalfa with unusual N-terminal sequences and differ-ent enzyme kinetics. Eur J Biochem; 267(9):2473-82.
Noordermeer MA, Veldink GA, Vliegenthart JF. (2001) Fatty acid hydrop-eroxide lyase: a plant cytochrome p450 enzyme involved in wound healing and pest resistance. Chembiochem; 2(7-8):494-504.
Norback D, Wieslander G. (2002) Biomarkers and chemosensory irritations. Int Arch Occup Environ Health; 75(5):298-304.
Piccot SD, Masemore SS, Lewis-Bevan W, Ringler ES, Harris BD. (1996) Field assessment of a new method for estimation emission rates from volume sources using open-path FTIR spectroscopy. Journal of the Air & Waste Management Association; 46(February):159-171.
Piccot SD, Masemore SS, Ringler ES, Srinivasan S, Kirchgessner DA, Her-get WF. (1994) Validation of a method for estimation pollution emission rates from area sources using Open-path FTIR spectroscopy and dispersion modelling techniques. Journal of the Air & Waste Management Association; 44(March):271-279.
Piispanen R, Saranpaa P. (2002) Neutral lipids and phospholipids in Scots pine (Pinus sylvestris) sapwood and heartwood. Tree Physiol; 22(9):661-6.
Plato N, Gustavsson P, Krantz S. (1997) Assessment of past exposure to man-made vitreous fibers in the Swedish prefabricated house industry. Am J Ind Med; 32(4):349-54.
Raisanen J, Niemela R. (1999) The evaluation of a low resolution fourier transform infrared (FTIR) gas analyser for monitoring of solvent emission rates under field conditions. J Environ Monit; 1(6):549-52.
Raisanen J, Niemela R. (2002) On-line monitoring of solvent emission rates using an open path FTIR analyser. Ann Occup Hyg; 46(5):501-6.
Reuss R, Pratt S. (2001) Accumulation of carbon monoxide and carbon diox-ide in stored canola. Journal of Stored Products Research; 37:23-24.
Ross KR, Todd LA. (2002) Field evaluation of a transportable open-path FTIR spectrometer for real-time air monitoring. Appl Occup Environ Hyg; 17(2):131-43.

56
Russwurm GM, Kagann RH, Simpson OA, McClenny WA, Herget WF. (1991) Long-path FTIR measurements of volatile organic compounds in an industrial setting. Journal of the Air & Waste Management Association; 41:1062-1066.
Schieberle P, Grosch W. (1981) Model experiments about the formation of volatile carbonyl compounds. J. Am. Oil Chem. Soc; 58:602-7.
Schilstra MJ, Veldink GA, Vliegenthart JF. (1994) The dioxygenation rate in lipoxygenase catalysis is determined by the amount of iron (III) lipoxy-genase in solution. Biochemistry; 33(13):3974-9.
Simpson AT. (2003) Comparison of methods for the measurement of mist and vapor from light mineral oil-based metalworking fluids. Appl Occup Environ Hyg; 18(11):865-76.
Smith MB, March J.(2001) Advanced organic chemistry, Reactions, mecha-nisms and Structure. 5 ed. New York: John Wiley & Sons, Inc
Spartz ML, Witkowski MR, Fateley JH, Jarvis JM, White JS, Paukstelis JV, Hammaker RM, Fateley WG, Carter RE, al e. (1989) Evaluation of a mobile FTIR system for rapid VOC determination. Part I: Preliminary qualitative and quantitative calibration results. Environmental Laboratory; (11):15-28.
Stenhammar S. (1992) Utsläpp till luft av flyktiga organiska kolväten (Emis-sions to air of VOC, Summary in English). Solna: Naturvårdsverket (Swed-ish Environmental Protection Agency). Report No.: 4312.
Todd L. (1996) Evaluation of an Open-Path Fourier Transform Infrared Spectrophotometer Using an Exposure chamber. Applied Occupational and Environmental Hygiene; 11(11):1327-1334.
Todd LA. (2000) Mapping the air in real-time to visualize the flow of gases and vapors: occupational and environmental applications. Appl Occup Envi-ron Hyg; 15(1):106-13.
Todd LA, Farhat SK, Mottus KM, Mihlan GJ. (2001) Experimental evalua-tion of an environmental CAT scanning system for mapping chemicals in air in real-time. Appl Occup Environ Hyg; 16(1):45-55.
Veldink GA, Vliegenthart JF, Boldingh J. (1977) Plant lipoxygenases. Prog Chem Fats Other Lipids; 15(2):131-66.
Whittle CP, Waterford CJ, Annis PC, Banks HJ. (1994) The production and accumulation of carbon monoxide in stored dry grain. Journal of Stored Products Research; 30:23-26.

57
Wolff DG, Bidlack WR. (1976) The formation of carbon monoxide during peroxidation of microsomal lipids. Biochemical and Biophysical Research Communications; 73:850-857.
Wu CF, Yost MG, Varr J, Hashmonay RA. (2003) Applying open-path FTIR with a bi-beam strategy to evaluate personal exposure in indoor environ-ments: experimental results of a validation study. AIHA J (Fairfax, Va); 64(2):181-8.
Xiao H, Levine SP, Nowak J, Puskar M, Spear RC. (1993) Analysis of or-ganic vapors in the workplace by remote sensing Fourier transform infrared spectroscopy. Am Ind Hyg Assoc J; 54(9):545-56.
Yost M, Xiao H, Spear R, Levine S. (1992) Comparative testing of an FTIR remote optical sensor with area samplers in a controlled ventilation chamber. American Industrial Hygiene Association Journal; 53(Oct):611-616.
Yost MG, Gadgil AJ, Dreschner AC, Zhou Y, Simonds MA, Levine SP, Nazaroff WW, Saisan PA. (1994) Imaging indoor tracer-gas concentrations with computed tomography: Experimental results with a remote sensing FTIR system. American Industrial Hygiene Association Journal; 55(May):395-402.
Yost MG, Rose MA, Morgan MS. (2003) An evaluation of Fourier trans-form infrared (FTIR) spectroscopy for detecting organic solvents in expired breath. Appl Occup Environ Hyg; 18(3):160-9.

Acta Universitatis UpsaliensisComprehensive Summaries of Uppsala Dissertations
from the Faculty of MedicineEditor: The Dean of the Faculty of Medicine
Distribution:Uppsala University Library
Box 510, SE-751 20 Uppsala, Swedenwww.uu.se, [email protected]
ISSN 0282-7476ISBN 91-554-5941-2
A doctoral dissertation from the Faculty of Medicine, Uppsala University,is usually a summary of a number of papers. A few copies of the completedissertation are kept at major Swedish research libraries, while the sum-mary alone is distributed internationally through the series Comprehen-sive Summaries of Uppsala Dissertations from the Faculty of Medicine.(Prior to October, 1985, the series was published under the title “Abstracts ofUppsala Dissertations from the Faculty of Medicine”.)