Embed Size (px)
Citation preview
This article was downloaded by: [University of Illinois at Urbana-Champaign]On: 18 March 2015, At: 21:27Publisher: Taylor & FrancisInforma Ltd Registered in England and Wales Registered Number: 1072954 Registered office:Mortimer House, 37-41 Mortimer Street, London W1T 3JH, UK
Applied Spectroscopy ReviewsPublication details, including instructions for authors and subscriptioninformation:http://www.tandfonline.com/loi/laps20
Fourier Transform Infrared (FTIR)Spectroscopy of Biological TissuesZanyar Movasaghi a , Shazza Rehman b & Dr. Ihtesham ur Rehman aa Department of Materials , Interdisciplinary Research Centre in BiomedicalMaterials, School of Engineering and Material Sciences, Queen MaryUniversity of London , London, UKb Department of Medical Oncology , Guy's and St Thomas' Hospital NHSFoundation Trust , London, UKPublished online: 04 Feb 2008.
To cite this article: Zanyar Movasaghi , Shazza Rehman & Dr. Ihtesham ur Rehman (2008) Fourier TransformInfrared (FTIR) Spectroscopy of Biological Tissues, Applied Spectroscopy Reviews, 43:2, 134-179, DOI:10.1080/05704920701829043
To link to this article: http://dx.doi.org/10.1080/05704920701829043
PLEASE SCROLL DOWN FOR ARTICLE
Taylor & Francis makes every effort to ensure the accuracy of all the information (the “Content”)contained in the publications on our platform. However, Taylor & Francis, our agents, and ourlicensors make no representations or warranties whatsoever as to the accuracy, completeness, orsuitability for any purpose of the Content. Any opinions and views expressed in this publicationare the opinions and views of the authors, and are not the views of or endorsed by Taylor &Francis. The accuracy of the Content should not be relied upon and should be independentlyverified with primary sources of information. Taylor and Francis shall not be liable for anylosses, actions, claims, proceedings, demands, costs, expenses, damages, and other liabilitieswhatsoever or howsoever caused arising directly or indirectly in connection with, in relation to orarising out of the use of the Content.
This article may be used for research, teaching, and private study purposes. Any substantialor systematic reproduction, redistribution, reselling, loan, sub-licensing, systematic supply, ordistribution in any form to anyone is expressly forbidden. Terms & Conditions of access and usecan be found at http://www.tandfonline.com/page/terms-and-conditions
Fourier Transform Infrared (FTIR)Spectroscopy of Biological Tissues
Zanyar Movasaghi,1 Shazza Rehman,2 and Ihtesham ur
Rehman1
1Department of Materials, Interdisciplinary Research Centre
in Biomedical Materials, School of Engineering and Material Sciences,
Queen Mary University of London, London, UK2Department of Medical Oncology, Guy’s and St Thomas’ Hospital NHS
Foundation Trust, London, UK
Abstract: This article reviews some of the recent advances on FTIR spectroscopy in
areas related to natural tissues and cell biology. It is the second review publication
resulting from a detailed study on the applications of spectroscopic methods in biologi-
cal studies and summarizes some of the most widely used peak frequencies and their
assignments. The aim of these studies is to prepare a database of molecular fingerprints,
which will help researchers in defining the chemical structure of the biological tissues
introducing most of the important peaks present in the natural tissues. In spite of
applying different methods, there seems to be a considerable similarity in defining
the peaks of identical areas of the FTIR spectra. As a result, it is believed that
preparing a unique collection of the frequencies encountered in FTIR spectroscopic
studies can lead to significant improvements both in the quantity and quality of
research and their outcomes. This article is the first review of its kind that provides
a precise database on the most important FTIR characteristic peak frequencies for
researchers aiming to analyze natural tissues by FTIR spectroscopy and will be of con-
siderable assistance to those who are focusing on the analysis of cancerous tissues by
FTIR spectroscopy.
Keywords: FTIR spectroscopy, biological tissues, analysis of cancer tissues,
characteristic peak assignments
Address correspondence to Dr. Ihtesham ur Rehman, Department of Materials,
Interdisciplinary Research Centre in Biomedical Materials, School of Engineering
and Material Sciences, Queen Mary University of London, Mile End Road, London
E1 4NS, UK. E-mail: [email protected]
Applied Spectroscopy Reviews, 43: 134–179, 2008
Copyright # Taylor & Francis Group, LLC
ISSN 0570-4928 print/1520-569X online
DOI: 10.1080/05704920701829043
134
Dow
nloa
ded
by [
Uni
vers
ity o
f Il
linoi
s at
Urb
ana-
Cha
mpa
ign]
at 2
1:27
18
Mar
ch 2
015
AIM OF THIS STUDY
The vibrational spectroscopic techniques, including FTIR spectroscopy, are
potential tools for noninvasive optical tissue diagnosis. In recent years, appli-
cations of spectroscopic techniques in biological studies have increased a
great deal, and particularly clinical investigations related to malignancy and
cancer detection by spectroscopic means have attracted attention both by
the clinical and non-clinical researchers.
Several papers have been published on the diagnostic importance of
different spectroscopic and imaging techniques in the area of cancer
detection (1–12). However, there is a gap, as it appears that the details of
the characteristic peak frequencies and their definitions that can be attributed
to specific functional groups present in the biological tissues have not been
fully investigated. Furthermore, there is no paper to date that addresses the
FTIR spectroscopic investigations of biological tissues, as researchers have
to rely on a number of research papers and a majority of the time the interpret-
ation of the spectral data differs significantly. In this article, a significant
amount of spectroscopic investigation reported on biological tissues has
been reviewed and reveals that there are striking similarities in defining
different peak frequencies. As a result, creating a unique database, containing
a detailed study on the works, different chemical bands, and their assignments
of spectral bands could provide significant assistance to research groups
focusing on spectroscopy. This, in turn, can lead to considerable improve-
ments in the quality and quantity of the research done.
This article aims to present a wide and detailed collection of interpretation
of FTIR spectral frequencies. It is envisaged that this article will be of signifi-
cant assistance to research groups working on FTIR spectroscopy of biological
tissues.
INTRODUCTION
Recently, spectroscopy has emerged as one of the major tools for biomedical
applications and has made significant progress in the field of clinical evalu-
ation. Research has been carried out on a number of natural tissues using spec-
troscopic techniques, including FTIR spectroscopy. These vibrational
spectroscopic techniques are relatively simple, reproducible, nondestructive
to the tissue, and only small amounts of material (micrograms to
nanograms) with a minimum sample preparation are required. In addition,
these techniques also provide molecular-level information allowing investi-
gation of functional groups, bonding types, and molecular conformations.
Spectral bands in vibrational spectra are molecule specific and provide
direct information about the biochemical composition. These bands are
relatively narrow, easy to resolve, and sensitive to molecular structure,
conformation, and environment.
FTIR Spectroscopy of Biological Tissues 135
Dow
nloa
ded
by [
Uni
vers
ity o
f Il
linoi
s at
Urb
ana-
Cha
mpa
ign]
at 2
1:27
18
Mar
ch 2
015
A considerably wide field of medical and biological studies has been
covered by spectroscopic methods in recent years. It is strongly believed
that in studies related to spectroscopic techniques, both the reliable exper-
imental procedure and characterization of spectral peak positions and their
assignment along with accurate peak detection and definition are of crucial
importance. Although a number of scientists have used different techniques,
it seems that there is a marked similarity in their spectral interpretation of
comparable areas in their collected spectra.
These spectral interpretation investigations reported to date have been
tabulated in Table 1, which provides a detailed account of spectral frequencies
of the biological tissues.
FTIR SPECTROSCOPY
FTIR spectroscopy is a vibrational spectroscopic technique that can be used
to optically probe the molecular changes associated with diseased tissues
(13–15). The method is employed to find more conservative ways of
analysis to measure characteristics within tumor tissue and cells that would
allow accurate and precise assignment of the functional groups, bonding
types, and molecular conformations. Spectral bands in vibrational spectra
are molecule specific and provide direct information about the biochemical
composition. FTIR peaks are relatively narrow and in many cases can be
associated with the vibration of a particular chemical bond (or a single func-
tional group) in the molecule (16, 17).
A detailed definition of Raman spectroscopy and its application in bio-
logical studies has been presented (18). Although Raman spectroscopy and
FTIR are relevant techniques, with their respective spectra complementary
to one another, there are some differences between these two techniques.
Probably the most important difference is the type of samples that can be
investigated by each of these methods. FTIR mainly deals with non-
aqueous samples, while Raman is as effective with aqueous samples as it is
with non-aqueous ones. This is because of the problem mostly taken place
with FTIR spectroscopy; the problem is due to strong absorption bands of
water (19–21). In Raman, however, fluorescence and the strong effect of
glass (mostly as containers) are the most significant problems during
analysis. Raman requires minimal sample preparation and can perform
confocal imaging, whereas FTIR requires comparatively more sample prep-
aration and does not have the ability of confocal imaging. Furthermore, the
physical effect of infrared is created by absorption and mainly influences
the dipole and ionic bands such as O-H, N-H, and C55O. Raman effect orig-
inates from scattering (emission of scattered light) and changing of the polar-
izability of covalent bands like C55C, C-S, S-S, and aromatics. In other words,
FTIR spectroscopy is due to changes in dipole moment during molecular
vibration, whereas Raman spectroscopy involves a change in polarizability
Z. Movasaghi, S. Rehman, and I. ur Rehman136
Dow
nloa
ded
by [
Uni
vers
ity o
f Il
linoi
s at
Urb
ana-
Cha
mpa
ign]
at 2
1:27
18
Mar
ch 2
015
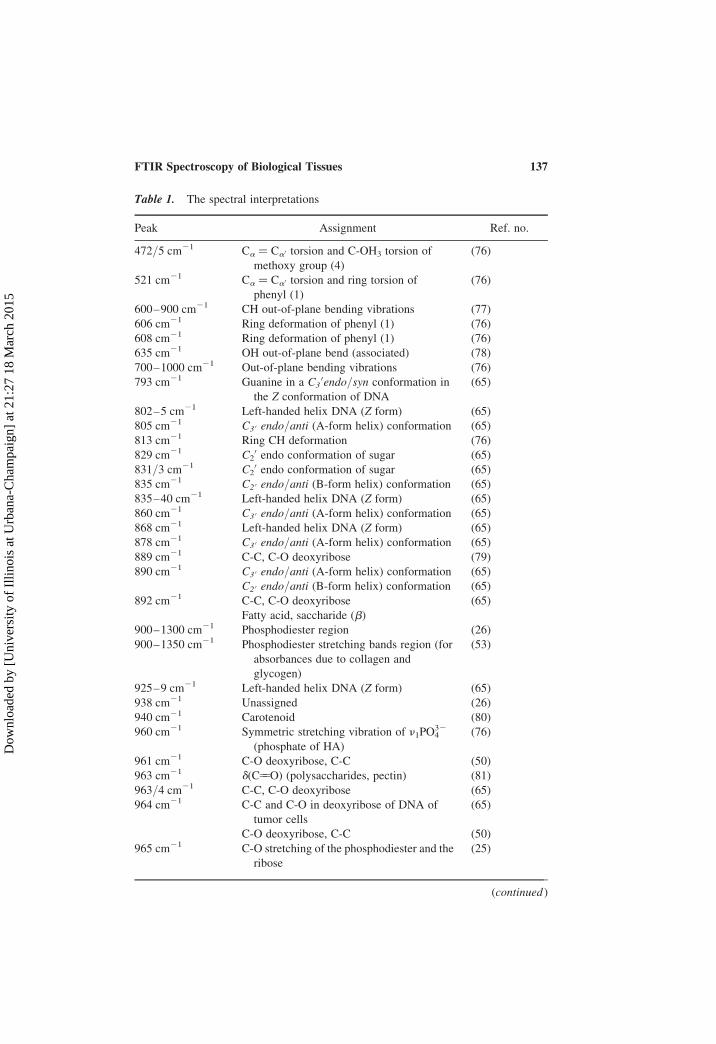
Table 1. The spectral interpretations
Peak Assignment Ref. no.
472/5 cm21 Ca ¼ Ca0 torsion and C-OH3 torsion of
methoxy group (4)
(76)
521 cm21 Ca ¼ Ca0 torsion and ring torsion of
phenyl (1)
(76)
600–900 cm21 CH out-of-plane bending vibrations (77)
606 cm21 Ring deformation of phenyl (1) (76)
608 cm21 Ring deformation of phenyl (1) (76)
635 cm21 OH out-of-plane bend (associated) (78)
700–1000 cm21 Out-of-plane bending vibrations (76)
793 cm21 Guanine in a C30endo/syn conformation in
the Z conformation of DNA
(65)
802–5 cm21 Left-handed helix DNA (Z form) (65)
805 cm21 C3 0 endo/anti (A-form helix) conformation (65)
813 cm21 Ring CH deformation (76)
829 cm21 C20 endo conformation of sugar (65)
831/3 cm21 C20 endo conformation of sugar (65)
835 cm21 C2 0 endo/anti (B-form helix) conformation (65)
835–40 cm21 Left-handed helix DNA (Z form) (65)
860 cm21 C3 0 endo/anti (A-form helix) conformation (65)
868 cm21 Left-handed helix DNA (Z form) (65)
878 cm21 C3 0 endo/anti (A-form helix) conformation (65)
889 cm21 C-C, C-O deoxyribose (79)
890 cm21 C3 0 endo/anti (A-form helix) conformation (65)
C2 0 endo/anti (B-form helix) conformation (65)
892 cm21 C-C, C-O deoxyribose (65)
Fatty acid, saccharide (b)
900–1300 cm21 Phosphodiester region (26)
900–1350 cm21 Phosphodiester stretching bands region (for
absorbances due to collagen and
glycogen)
(53)
925–9 cm21 Left-handed helix DNA (Z form) (65)
938 cm21 Unassigned (26)
940 cm21 Carotenoid (80)
960 cm21 Symmetric stretching vibration of n1PO432
(phosphate of HA)
(76)
961 cm21 C-O deoxyribose, C-C (50)
963 cm21 d(C55O) (polysaccharides, pectin) (81)
963/4 cm21 C-C, C-O deoxyribose (65)
964 cm21 C-C and C-O in deoxyribose of DNA of
tumor cells
(65)
C-O deoxyribose, C-C (50)
965 cm21 C-O stretching of the phosphodiester and the
ribose
(25)
(continued )
FTIR Spectroscopy of Biological Tissues 137
Dow
nloa
ded
by [
Uni
vers
ity o
f Il
linoi
s at
Urb
ana-
Cha
mpa
ign]
at 2
1:27
18
Mar
ch 2
015
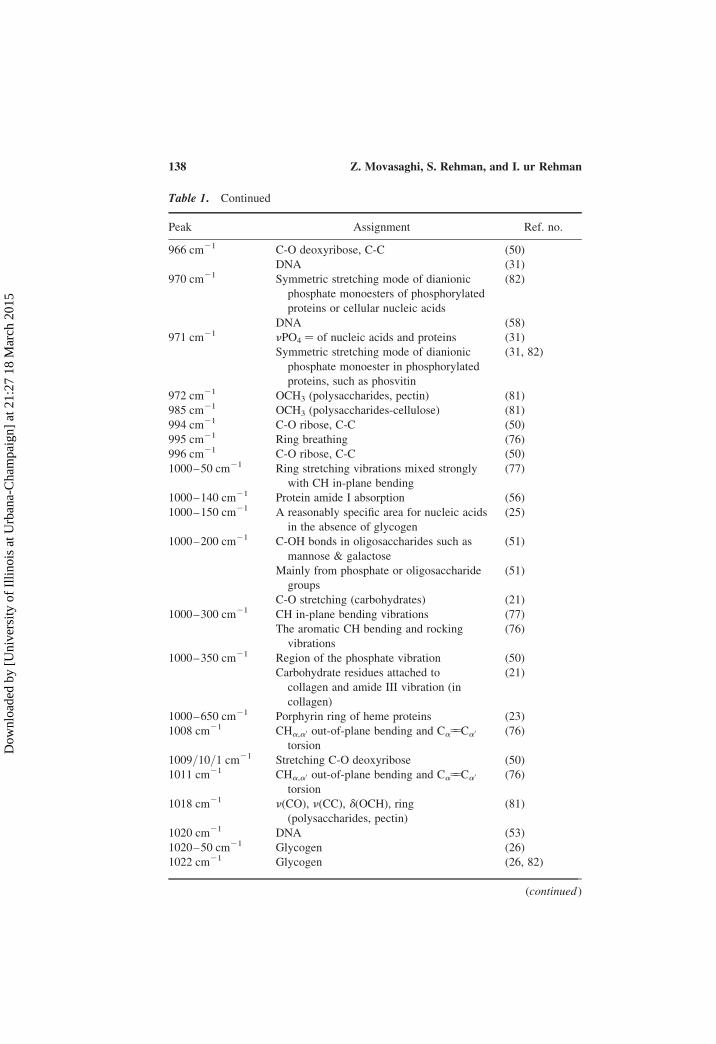
Table 1. Continued
Peak Assignment Ref. no.
966 cm21 C-O deoxyribose, C-C (50)
DNA (31)
970 cm21 Symmetric stretching mode of dianionic
phosphate monoesters of phosphorylated
proteins or cellular nucleic acids
(82)
DNA (58)
971 cm21 nPO4 ¼ of nucleic acids and proteins (31)
Symmetric stretching mode of dianionic
phosphate monoester in phosphorylated
proteins, such as phosvitin
(31, 82)
972 cm21 OCH3 (polysaccharides, pectin) (81)
985 cm21 OCH3 (polysaccharides-cellulose) (81)
994 cm21 C-O ribose, C-C (50)
995 cm21 Ring breathing (76)
996 cm21 C-O ribose, C-C (50)
1000–50 cm21 Ring stretching vibrations mixed strongly
with CH in-plane bending
(77)
1000–140 cm21 Protein amide I absorption (56)
1000–150 cm21 A reasonably specific area for nucleic acids
in the absence of glycogen
(25)
1000–200 cm21 C-OH bonds in oligosaccharides such as
mannose & galactose
(51)
Mainly from phosphate or oligosaccharide
groups
(51)
C-O stretching (carbohydrates) (21)
1000–300 cm21 CH in-plane bending vibrations (77)
The aromatic CH bending and rocking
vibrations
(76)
1000–350 cm21 Region of the phosphate vibration (50)
Carbohydrate residues attached to
collagen and amide III vibration (in
collagen)
(21)
1000–650 cm21 Porphyrin ring of heme proteins (23)
1008 cm21 CHa,a0 out-of-plane bending and Ca55Ca0
torsion
(76)
1009/10/1 cm21 Stretching C-O deoxyribose (50)
1011 cm21 CHa,a0 out-of-plane bending and Ca55Ca0
torsion
(76)
1018 cm21 n(CO), n(CC), d(OCH), ring
(polysaccharides, pectin)
(81)
1020 cm21 DNA (53)
1020–50 cm21 Glycogen (26)
1022 cm21 Glycogen (26, 82)
(continued )
Z. Movasaghi, S. Rehman, and I. ur Rehman138
Dow
nloa
ded
by [
Uni
vers
ity o
f Il
linoi
s at
Urb
ana-
Cha
mpa
ign]
at 2
1:27
18
Mar
ch 2
015

Table 1. Continued
Peak Assignment Ref. no.
1024 cm21 Glycogen (C-O stretch associated with
glycogen)
(26, 82)
1025 cm21 Carbohydrates peak for solutions (3)
Vibrational frequency of -CH2OH groups
of carbohydrates (including glucose,
fructose, glycogen, etc.)
(62)
Glycogen (3, 53)
-CH2OH groups and the C-O stretching
vibration coupled with C-O bending of
the C-OH groups of carbohydrates
(including glucose, fructose, glycogen,
etc.)
(54)
1028 cm21 Glycogen absorption due to C-O and C-C
stretching and C-O-H deformation
motions
(62)
1029/30 cm21 O-CH3 stretching of methoxy groups (76)
1030 cm21 Glycogen vibration (33, 56)
CH2OH vibration (33)
ns C-O (57)
Collagen & phosphodiester groups of
nucleic acids
(54)
1030 cm21 Stretching C-O ribose (50)
1030 cm21 Collagen (45)
1031 cm21 n(CC) skeletal cis conformation, n(CH2OH),
n(CO) stretching coupled with C-O
bending
(45, 61)
Collagen (31, 53)
One of the triad peaks of nucleic acids
(along with 1060 and 1081)
(25)
1032 cm21 O-CH3 stretching of methoxy groups (76)
1033 cm21 n(CC) skeletal cis conformation, n(CH2OH),
n(CO) stretching coupled with C-O
bending
(42, 45)
1034 cm21 Collagen (21)
1035 cm21 Skeletal trans conformation (CC) of DNA (62)
n(CC) skeletal cis conformation, n(CH2OH),
n(CO) stretching coupled with C-O
bending
(45)
Glycogen (82)
n(CO), n(CC), n(CCO), (polysaccharides-
cellulose)
(81)
1037 cm21 n(CC) skeletal cis conformation, n(CH2OH),
n(CO) stretching coupled with C-O bending
(45)
(continued )
FTIR Spectroscopy of Biological Tissues 139
Dow
nloa
ded
by [
Uni
vers
ity o
f Il
linoi
s at
Urb
ana-
Cha
mpa
ign]
at 2
1:27
18
Mar
ch 2
015
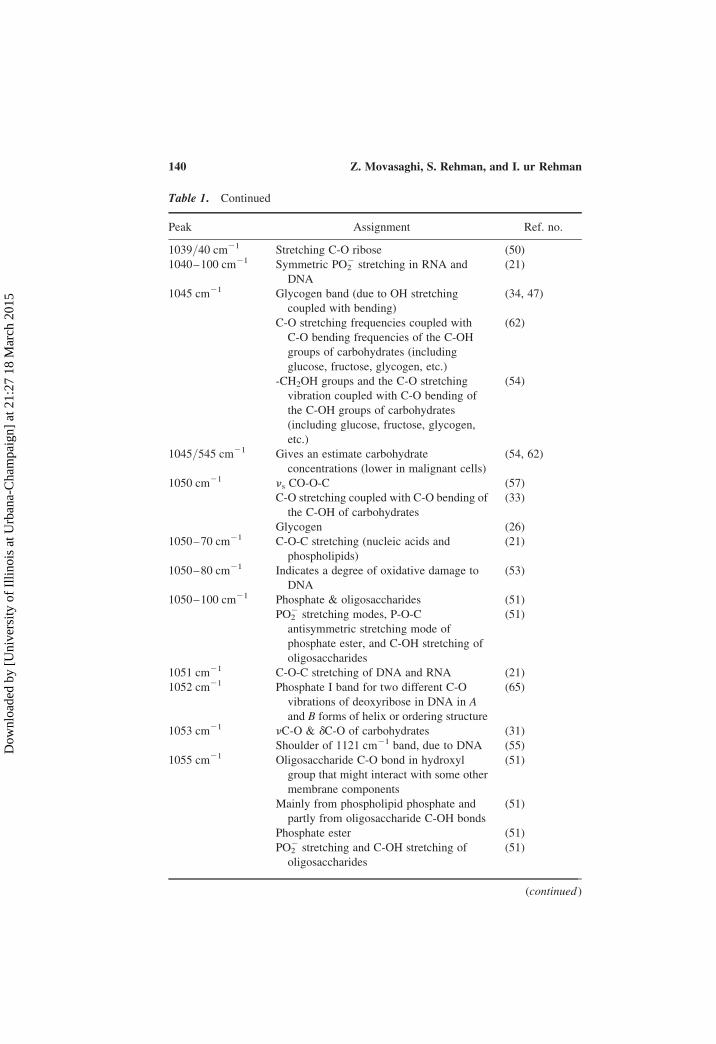
Table 1. Continued
Peak Assignment Ref. no.
1039/40 cm21 Stretching C-O ribose (50)
1040–100 cm21 Symmetric PO22 stretching in RNA and
DNA
(21)
1045 cm21 Glycogen band (due to OH stretching
coupled with bending)
(34, 47)
C-O stretching frequencies coupled with
C-O bending frequencies of the C-OH
groups of carbohydrates (including
glucose, fructose, glycogen, etc.)
(62)
-CH2OH groups and the C-O stretching
vibration coupled with C-O bending of
the C-OH groups of carbohydrates
(including glucose, fructose, glycogen,
etc.)
(54)
1045/545 cm21 Gives an estimate carbohydrate
concentrations (lower in malignant cells)
(54, 62)
1050 cm21 ns CO-O-C (57)
C-O stretching coupled with C-O bending of
the C-OH of carbohydrates
(33)
Glycogen (26)
1050–70 cm21 C-O-C stretching (nucleic acids and
phospholipids)
(21)
1050–80 cm21 Indicates a degree of oxidative damage to
DNA
(53)
1050–100 cm21 Phosphate & oligosaccharides (51)
PO22 stretching modes, P-O-C
antisymmetric stretching mode of
phosphate ester, and C-OH stretching of
oligosaccharides
(51)
1051 cm21 C-O-C stretching of DNA and RNA (21)
1052 cm21 Phosphate I band for two different C-O
vibrations of deoxyribose in DNA in A
and B forms of helix or ordering structure
(65)
1053 cm21 nC-O & dC-O of carbohydrates (31)
Shoulder of 1121 cm21 band, due to DNA (55)
1055 cm21 Oligosaccharide C-O bond in hydroxyl
group that might interact with some other
membrane components
(51)
Mainly from phospholipid phosphate and
partly from oligosaccharide C-OH bonds
(51)
Phosphate ester (51)
PO22 stretching and C-OH stretching of
oligosaccharides
(51)
(continued )
Z. Movasaghi, S. Rehman, and I. ur Rehman140
Dow
nloa
ded
by [
Uni
vers
ity o
f Il
linoi
s at
Urb
ana-
Cha
mpa
ign]
at 2
1:27
18
Mar
ch 2
015
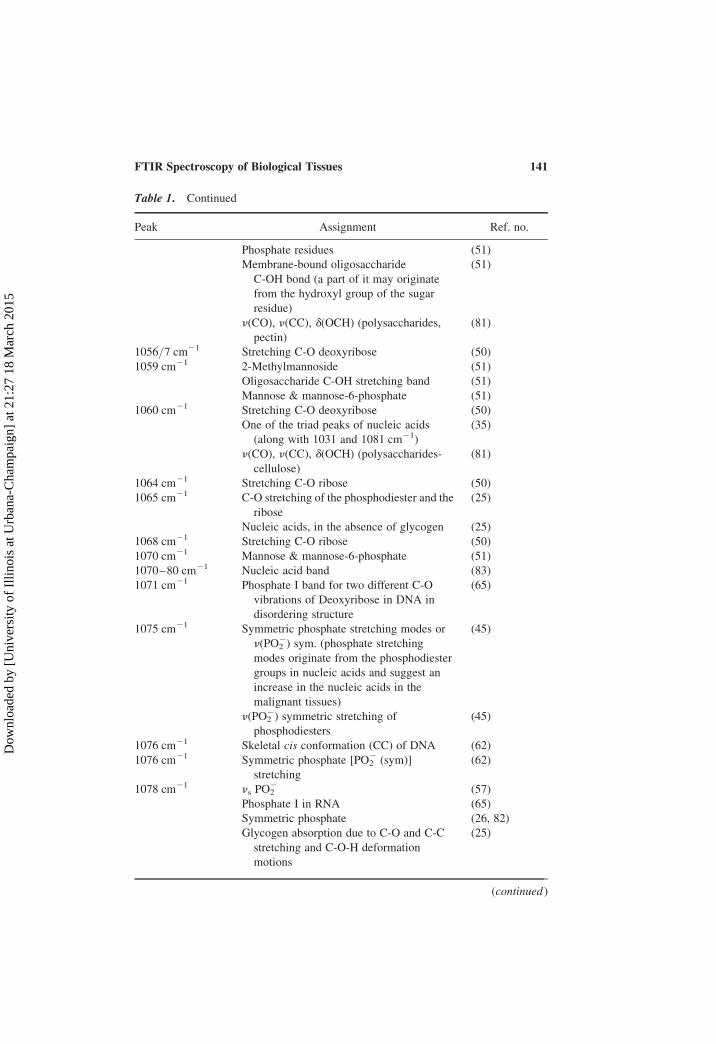
Table 1. Continued
Peak Assignment Ref. no.
Phosphate residues (51)
Membrane-bound oligosaccharide
C-OH bond (a part of it may originate
from the hydroxyl group of the sugar
residue)
(51)
n(CO), n(CC), d(OCH) (polysaccharides,
pectin)
(81)
1056/7 cm21 Stretching C-O deoxyribose (50)
1059 cm21 2-Methylmannoside (51)
Oligosaccharide C-OH stretching band (51)
Mannose & mannose-6-phosphate (51)
1060 cm21 Stretching C-O deoxyribose (50)
One of the triad peaks of nucleic acids
(along with 1031 and 1081 cm21)
(35)
n(CO), n(CC), d(OCH) (polysaccharides-
cellulose)
(81)
1064 cm21 Stretching C-O ribose (50)
1065 cm21 C-O stretching of the phosphodiester and the
ribose
(25)
Nucleic acids, in the absence of glycogen (25)
1068 cm21 Stretching C-O ribose (50)
1070 cm21 Mannose & mannose-6-phosphate (51)
1070–80 cm21 Nucleic acid band (83)
1071 cm21 Phosphate I band for two different C-O
vibrations of Deoxyribose in DNA in
disordering structure
(65)
1075 cm21 Symmetric phosphate stretching modes or
n(PO22) sym. (phosphate stretching
modes originate from the phosphodiester
groups in nucleic acids and suggest an
increase in the nucleic acids in the
malignant tissues)
(45)
n(PO22) symmetric stretching of
phosphodiesters
(45)
1076 cm21 Skeletal cis conformation (CC) of DNA (62)
1076 cm21 Symmetric phosphate [PO22 (sym)]
stretching
(62)
1078 cm21 ns PO22 (57)
Phosphate I in RNA (65)
Symmetric phosphate (26, 82)
Glycogen absorption due to C-O and C-C
stretching and C-O-H deformation
motions
(25)
(continued )
FTIR Spectroscopy of Biological Tissues 141
Dow
nloa
ded
by [
Uni
vers
ity o
f Il
linoi
s at
Urb
ana-
Cha
mpa
ign]
at 2
1:27
18
Mar
ch 2
015
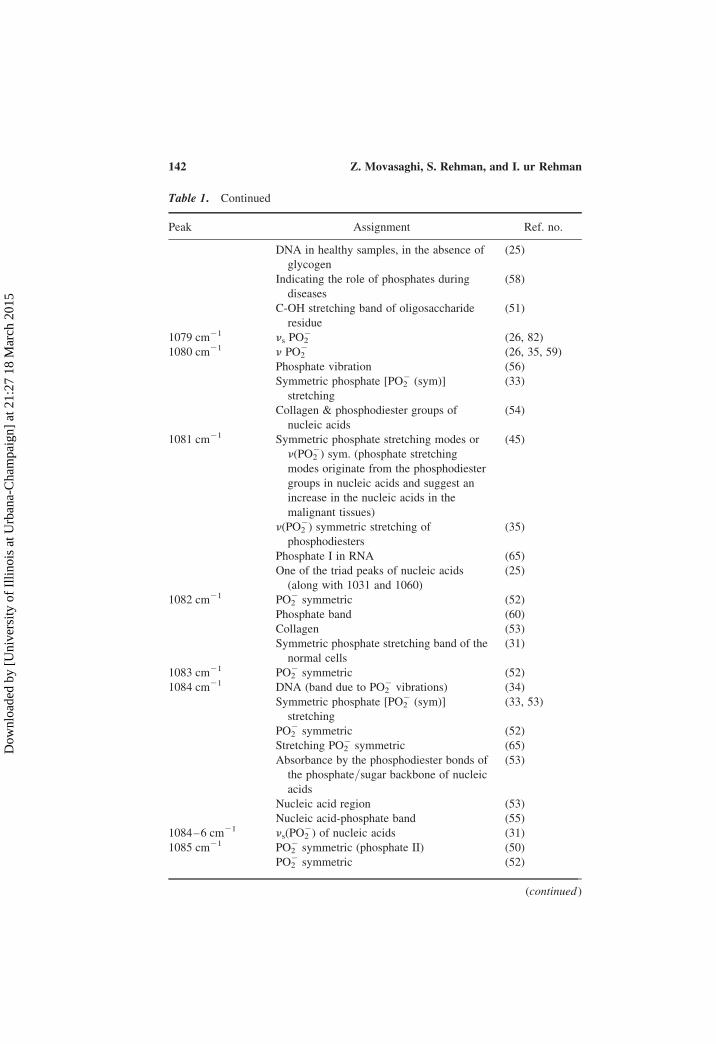
Table 1. Continued
Peak Assignment Ref. no.
DNA in healthy samples, in the absence of
glycogen
(25)
Indicating the role of phosphates during
diseases
(58)
C-OH stretching band of oligosaccharide
residue
(51)
1079 cm21 ns PO22 (26, 82)
1080 cm21 n PO22 (26, 35, 59)
Phosphate vibration (56)
Symmetric phosphate [PO22 (sym)]
stretching
(33)
Collagen & phosphodiester groups of
nucleic acids
(54)
1081 cm21 Symmetric phosphate stretching modes or
n(PO22) sym. (phosphate stretching
modes originate from the phosphodiester
groups in nucleic acids and suggest an
increase in the nucleic acids in the
malignant tissues)
(45)
n(PO22) symmetric stretching of
phosphodiesters
(35)
Phosphate I in RNA (65)
One of the triad peaks of nucleic acids
(along with 1031 and 1060)
(25)
1082 cm21 PO22 symmetric (52)
Phosphate band (60)
Collagen (53)
Symmetric phosphate stretching band of the
normal cells
(31)
1083 cm21 PO22 symmetric (52)
1084 cm21 DNA (band due to PO22 vibrations) (34)
Symmetric phosphate [PO22 (sym)]
stretching
(33, 53)
PO22 symmetric (52)
Stretching PO22 symmetric (65)
Absorbance by the phosphodiester bonds of
the phosphate/sugar backbone of nucleic
acids
(53)
Nucleic acid region (53)
Nucleic acid-phosphate band (55)
1084–6 cm21 ns(PO22) of nucleic acids (31)
1085 cm21 PO22 symmetric (phosphate II) (50)
PO22 symmetric (52)
(continued )
Z. Movasaghi, S. Rehman, and I. ur Rehman142
Dow
nloa
ded
by [
Uni
vers
ity o
f Il
linoi
s at
Urb
ana-
Cha
mpa
ign]
at 2
1:27
18
Mar
ch 2
015

Table 1. Continued
Peak Assignment Ref. no.
Mainly from absorption bands of the
phosphodiester group of nucleic acids and
membrane phospholipids, and partially
protein (amide III). The band
originating from sugar chains (C-OH
band) overlaps.
(52)
Mainly from phospholipid phosphate and
partly from oligosaccharide C-OH bonds
(51)
Phosphate ester (51)
1086 cm21 Symmetric phosphate stretching modes or
n(PO22) sym. (phosphate stretching modes
originate from the phosphodiester groups
in nucleic acids and suggest an increase
in the nucleic acids in the malignant
tissues)
(45)
PO22 symmetric (52)
n(PO22) symmetric stretching of
phosphodiesters
(35, 84)
1087 cm21 PO22 symmetric (phosphate II) (50)
Symmetric stretching of phosphate groups
of phosphodiester linkages in DNA and
RNA
(21)
Symmetric PO22 stretching in RNA and
DNA
(21)
Symmetric stretching of phosphate groups in
phospholipids
(21)
1088–90 cm21 Phosphate I (stretching PO22 symmetric
vibration) in B-form DNA
(65)
1089 cm21 Stretching PO22 symmetric in RNA (65)
1090 cm21 Mannose & mannose6-phosphate (51)
Phosphate ester (C-O-P) band (51)
1090–100 cm21 Phosphate II (stretching PO22 asymmetric
vibration) in A-form RNA
(65)
1094 cm21 Stretching PO22 symmetric (phosphate II) (50)
nasym(C-O-C) (polysaccharides-cellulose) (81)
1095 cm21 Stretching PO22 symmetric (25)
1099/100 cm21 Stretching PO22 symmetric (phosphate II) (50)
1104 cm21 Symmetric stretching P-O-C (50)
1105 cm21 Carbohydrates (55)
1107 cm21 n(CO), n(CC), ring (polysaccharides, pectin) (81)
1110 cm21 n(CO), n(CC) ring (polysaccharides,
cellulose)
(81)
1113/5 cm21 Symmetric stretching P-O-C (50)
(continued )
FTIR Spectroscopy of Biological Tissues 143
Dow
nloa
ded
by [
Uni
vers
ity o
f Il
linoi
s at
Urb
ana-
Cha
mpa
ign]
at 2
1:27
18
Mar
ch 2
015
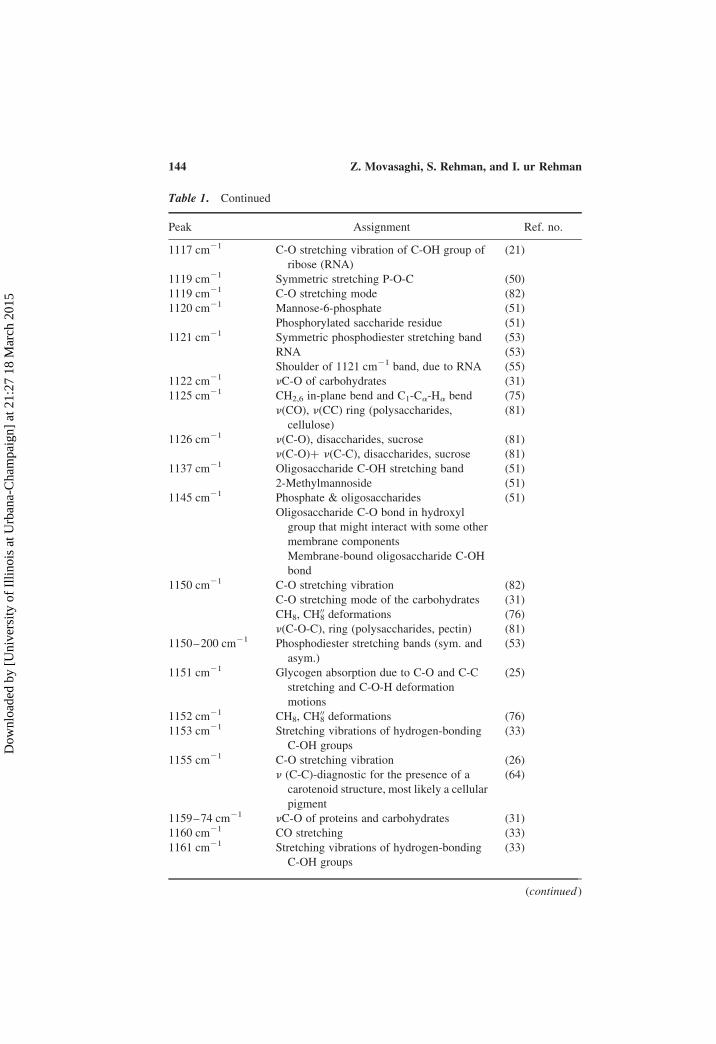
Table 1. Continued
Peak Assignment Ref. no.
1117 cm21 C-O stretching vibration of C-OH group of
ribose (RNA)
(21)
1119 cm21 Symmetric stretching P-O-C (50)
1119 cm21 C-O stretching mode (82)
1120 cm21 Mannose-6-phosphate (51)
Phosphorylated saccharide residue (51)
1121 cm21 Symmetric phosphodiester stretching band (53)
RNA (53)
Shoulder of 1121 cm21 band, due to RNA (55)
1122 cm21 nC-O of carbohydrates (31)
1125 cm21 CH2,6 in-plane bend and C1-Ca-Ha bend (75)
n(CO), n(CC) ring (polysaccharides,
cellulose)
(81)
1126 cm21 n(C-O), disaccharides, sucrose (81)
n(C-O)þ n(C-C), disaccharides, sucrose (81)
1137 cm21 Oligosaccharide C-OH stretching band (51)
2-Methylmannoside (51)
1145 cm21 Phosphate & oligosaccharides (51)
Oligosaccharide C-O bond in hydroxyl
group that might interact with some other
membrane components
Membrane-bound oligosaccharide C-OH
bond
1150 cm21 C-O stretching vibration (82)
C-O stretching mode of the carbohydrates (31)
CH8, CH008 deformations (76)
n(C-O-C), ring (polysaccharides, pectin) (81)
1150–200 cm21 Phosphodiester stretching bands (sym. and
asym.)
(53)
1151 cm21 Glycogen absorption due to C-O and C-C
stretching and C-O-H deformation
motions
(25)
1152 cm21 CH8, CH008 deformations (76)
1153 cm21 Stretching vibrations of hydrogen-bonding
C-OH groups
(33)
1155 cm21 C-O stretching vibration (26)
n (C-C)-diagnostic for the presence of a
carotenoid structure, most likely a cellular
pigment
(64)
1159–74 cm21 nC-O of proteins and carbohydrates (31)
1160 cm21 CO stretching (33)
1161 cm21 Stretching vibrations of hydrogen-bonding
C-OH groups
(33)
(continued )
Z. Movasaghi, S. Rehman, and I. ur Rehman144
Dow
nloa
ded
by [
Uni
vers
ity o
f Il
linoi
s at
Urb
ana-
Cha
mpa
ign]
at 2
1:27
18
Mar
ch 2
015
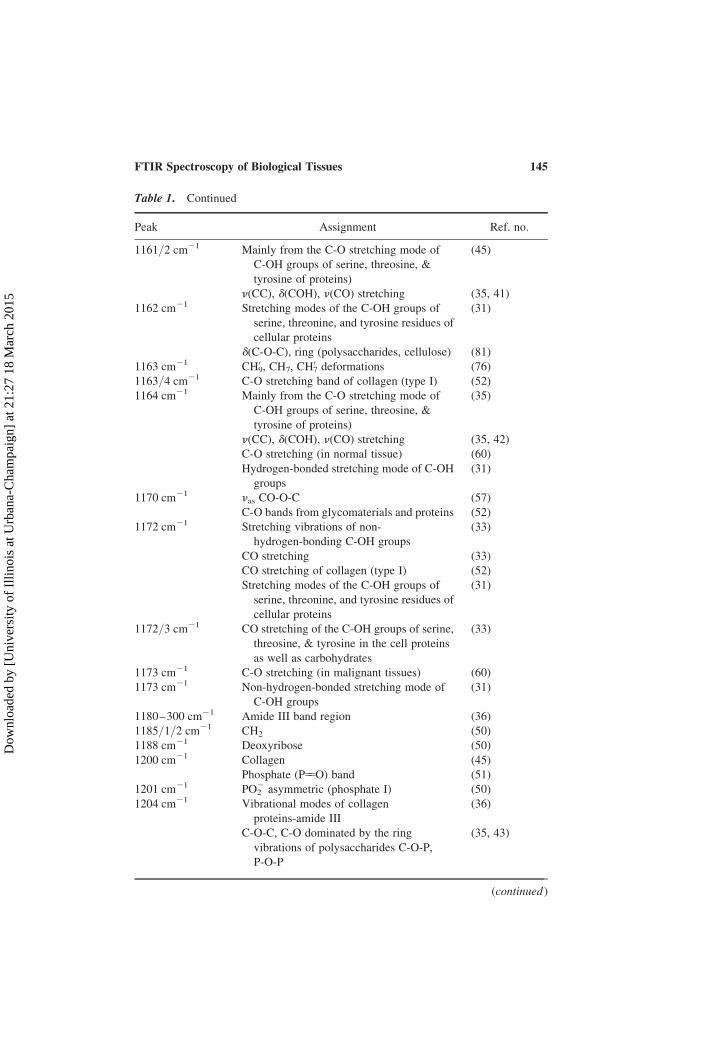
Table 1. Continued
Peak Assignment Ref. no.
1161/2 cm21 Mainly from the C-O stretching mode of
C-OH groups of serine, threosine, &
tyrosine of proteins)
(45)
n(CC), d(COH), n(CO) stretching (35, 41)
1162 cm21 Stretching modes of the C-OH groups of
serine, threonine, and tyrosine residues of
cellular proteins
(31)
d(C-O-C), ring (polysaccharides, cellulose) (81)
1163 cm21 CH09, CH7, CH0
7 deformations (76)
1163/4 cm21 C-O stretching band of collagen (type I) (52)
1164 cm21 Mainly from the C-O stretching mode of
C-OH groups of serine, threosine, &
tyrosine of proteins)
(35)
n(CC), d(COH), n(CO) stretching (35, 42)
C-O stretching (in normal tissue) (60)
Hydrogen-bonded stretching mode of C-OH
groups
(31)
1170 cm21 nas CO-O-C (57)
C-O bands from glycomaterials and proteins (52)
1172 cm21 Stretching vibrations of non-
hydrogen-bonding C-OH groups
(33)
CO stretching (33)
CO stretching of collagen (type I) (52)
Stretching modes of the C-OH groups of
serine, threonine, and tyrosine residues of
cellular proteins
(31)
1172/3 cm21 CO stretching of the C-OH groups of serine,
threosine, & tyrosine in the cell proteins
as well as carbohydrates
(33)
1173 cm21 C-O stretching (in malignant tissues) (60)
1173 cm21 Non-hydrogen-bonded stretching mode of
C-OH groups
(31)
1180–300 cm21 Amide III band region (36)
1185/1/2 cm21 CH2 (50)
1188 cm21 Deoxyribose (50)
1200 cm21 Collagen (45)
Phosphate (P55O) band (51)
1201 cm21 PO22 asymmetric (phosphate I) (50)
1204 cm21 Vibrational modes of collagen
proteins-amide III
(36)
C-O-C, C-O dominated by the ring
vibrations of polysaccharides C-O-P,
P-O-P
(35, 43)
(continued )
FTIR Spectroscopy of Biological Tissues 145
Dow
nloa
ded
by [
Uni
vers
ity o
f Il
linoi
s at
Urb
ana-
Cha
mpa
ign]
at 2
1:27
18
Mar
ch 2
015
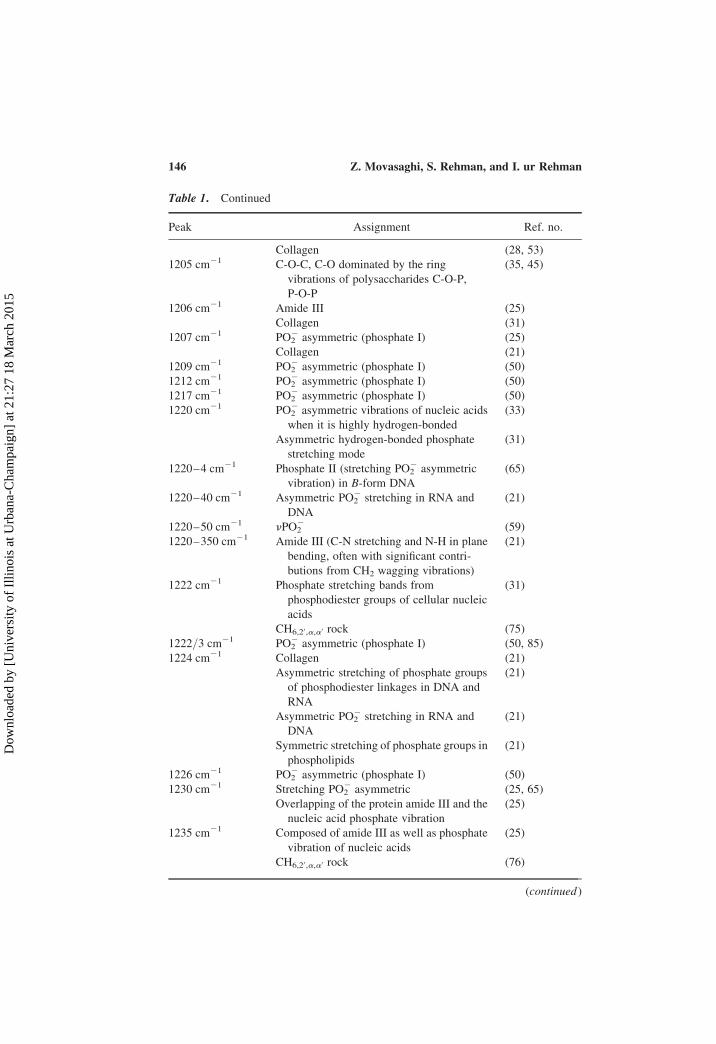
Table 1. Continued
Peak Assignment Ref. no.
Collagen (28, 53)
1205 cm21 C-O-C, C-O dominated by the ring
vibrations of polysaccharides C-O-P,
P-O-P
(35, 45)
1206 cm21 Amide III (25)
Collagen (31)
1207 cm21 PO22 asymmetric (phosphate I) (25)
Collagen (21)
1209 cm21 PO22 asymmetric (phosphate I) (50)
1212 cm21 PO22 asymmetric (phosphate I) (50)
1217 cm21 PO22 asymmetric (phosphate I) (50)
1220 cm21 PO22 asymmetric vibrations of nucleic acids
when it is highly hydrogen-bonded
(33)
Asymmetric hydrogen-bonded phosphate
stretching mode
(31)
1220–4 cm21 Phosphate II (stretching PO22 asymmetric
vibration) in B-form DNA
(65)
1220–40 cm21 Asymmetric PO22 stretching in RNA and
DNA
(21)
1220–50 cm21 nPO22 (59)
1220–350 cm21 Amide III (C-N stretching and N-H in plane
bending, often with significant contri-
butions from CH2 wagging vibrations)
(21)
1222 cm21 Phosphate stretching bands from
phosphodiester groups of cellular nucleic
acids
(31)
CH6,20,a,a0 rock (75)
1222/3 cm21 PO22 asymmetric (phosphate I) (50, 85)
1224 cm21 Collagen (21)
Asymmetric stretching of phosphate groups
of phosphodiester linkages in DNA and
RNA
(21)
Asymmetric PO22 stretching in RNA and
DNA
(21)
Symmetric stretching of phosphate groups in
phospholipids
(21)
1226 cm21 PO22 asymmetric (phosphate I) (50)
1230 cm21 Stretching PO22 asymmetric (25, 65)
Overlapping of the protein amide III and the
nucleic acid phosphate vibration
(25)
1235 cm21 Composed of amide III as well as phosphate
vibration of nucleic acids
(25)
CH6,20,a,a0 rock (76)
(continued )
Z. Movasaghi, S. Rehman, and I. ur Rehman146
Dow
nloa
ded
by [
Uni
vers
ity o
f Il
linoi
s at
Urb
ana-
Cha
mpa
ign]
at 2
1:27
18
Mar
ch 2
015

Table 1. Continued
Peak Assignment Ref. no.
1236 cm21 Amide III and asymmetric phosphodiester
stretching mode (nasPO22), mainly from
the nucleic acids
(36)
nasPO22 of nucleic acids (31)
1236–42 cm21 Relatively specific for collagen and nucleic
acids
(53)
1236/7 cm21 Stretching PO22 asymmetric (phosphate I) (50)
1237 cm21 PO22 asymmetric (phosphate I) (50)
PO22 asymmetric (44)
1238 cm21 Stretching PO22 asymmetric (phosphate I) (50)
Asymmetric phosphate [PO22 (asym.)]
stretching modes
(33)
Stretching PO22 asymmetric (65)
Amide III (25)
1238/9 cm21 Asymmetric PO22 stretching (52)
1240 cm21 nasPO22 (26, 45)
Collagen (21, 31)
Asymmetric non-hydrogen-bonded phos-
phate stretching mode (phosphate
stretching modes originate from the
phosphodiester groups of nucleic acids
and suggest an increase in the nucleic
acids in the malignant tissues)
(31)
Mainly from absorption bands of the
phosphodiester group of nucleic acids and
membrane phospholipids, and partially
protein (amide III)
(45)
Amide III (52)
PO22 asymmetric vibrations of nucleic acids
when it is non-hydrogen-bonded
(52)
nasPO22 (33)
Collagen (57)
Asymmetric phosphodiester stretching band (53)
Amide III (53)
PO22 ionized asymmetric stretching (45)
n(PO22) asymmetric stretching of
phosphodiesters
(35, 62)
Composed of amide III mode of collagen
protein and the asymmetric stretching
mode of the phosphodiester groups of
nucleic acids
(26, 45, 47, 61)
Asymmetric stretching mode of
phosphodiester groups of nucleic acids
(31)
(continued )
FTIR Spectroscopy of Biological Tissues 147
Dow
nloa
ded
by [
Uni
vers
ity o
f Il
linoi
s at
Urb
ana-
Cha
mpa
ign]
at 2
1:27
18
Mar
ch 2
015
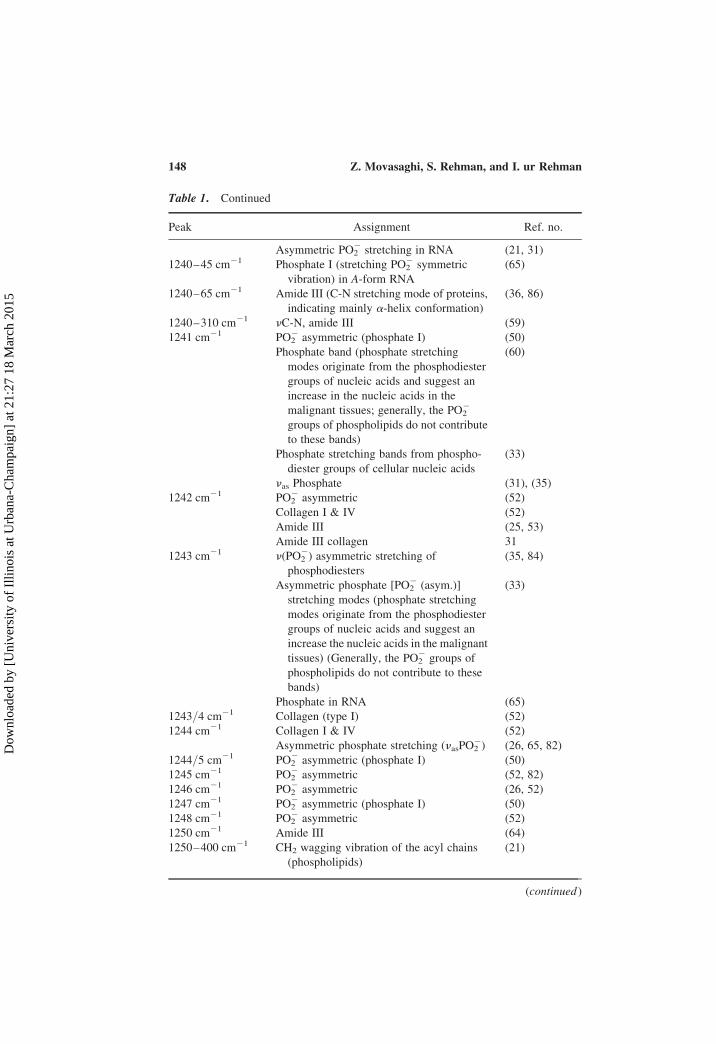
Table 1. Continued
Peak Assignment Ref. no.
Asymmetric PO22 stretching in RNA (21, 31)
1240–45 cm21 Phosphate I (stretching PO22 symmetric
vibration) in A-form RNA
(65)
1240–65 cm21 Amide III (C-N stretching mode of proteins,
indicating mainly a-helix conformation)
(36, 86)
1240–310 cm21 nC-N, amide III (59)
1241 cm21 PO22 asymmetric (phosphate I) (50)
Phosphate band (phosphate stretching
modes originate from the phosphodiester
groups of nucleic acids and suggest an
increase in the nucleic acids in the
malignant tissues; generally, the PO22
groups of phospholipids do not contribute
to these bands)
(60)
Phosphate stretching bands from phospho-
diester groups of cellular nucleic acids
(33)
nas Phosphate (31), (35)
1242 cm21 PO22 asymmetric (52)
Collagen I & IV (52)
Amide III (25, 53)
Amide III collagen 31
1243 cm21 n(PO22) asymmetric stretching of
phosphodiesters
(35, 84)
Asymmetric phosphate [PO22 (asym.)]
stretching modes (phosphate stretching
modes originate from the phosphodiester
groups of nucleic acids and suggest an
increase the nucleic acids in the malignant
tissues) (Generally, the PO22 groups of
phospholipids do not contribute to these
bands)
(33)
Phosphate in RNA (65)
1243/4 cm21 Collagen (type I) (52)
1244 cm21 Collagen I & IV (52)
Asymmetric phosphate stretching (nasPO22) (26, 65, 82)
1244/5 cm21 PO22 asymmetric (phosphate I) (50)
1245 cm21 PO22 asymmetric (52, 82)
1246 cm21 PO22 asymmetric (26, 52)
1247 cm21 PO22 asymmetric (phosphate I) (50)
1248 cm21 PO22 asymmetric (52)
1250 cm21 Amide III (64)
1250–400 cm21 CH2 wagging vibration of the acyl chains
(phospholipids)
(21)
(continued )
Z. Movasaghi, S. Rehman, and I. ur Rehman148
Dow
nloa
ded
by [
Uni
vers
ity o
f Il
linoi
s at
Urb
ana-
Cha
mpa
ign]
at 2
1:27
18
Mar
ch 2
015

Table 1. Continued
Peak Assignment Ref. no.
1255 cm21 Amide III (25)
1256 cm21 PO22 asymmetric (phosphate I (50)
1262 cm21 PO22 asymmetric (phosphate I) (50)
1265 cm21 PO22 asymmetric (phosphate I) (50)
CHa0 rocking (76)
1272/3 cm21 CHa0 rocking (76)
1276 cm21 N-H thymine (50)
1278 cm21 Vibrational modes of collagen proteins-
amide III
(36)
1278/9 cm21 Deformation N-H (50)
1280 cm21 Collagen (45)
Amide III (25)
1282 cm21 Amide III band components of proteins (35, 45)
Collagen (21, 53)
1283 cm21 Collagen (31)
1283–1339 cm21 Collagen (31)
1284 cm21 Amide III band components of proteins (41)
Collagen (21)
1287 cm21 Deformation N-H (50)
1288 cm21 N-H thymine (50)
1291/2 cm21 N-H thymine (50)
1294/5/6 cm21 Deformation N-H cytosine (50)
1306 cm21 Unassigned band (82)
1307 cm21 Amide III (25)
1310 cm21 Amide III (59)
1312 cm21 Amide III band components of proteins (35, 45)
1317 cm21 Amide III band components of proteins (35, 45)
Collagen (31)
1327/8 cm21 Stretching C-N thymine, adenine (50)
1328 cm21 Benzene ring mixed with the CH in-plane
bending from the phenyl ring and the
ethylene bridge
(76)
1330 cm21 CH2 wagging (35, 43)
1335 cm21 d(CH), ring (polysaccharides, pectin) (81)
1335 cm21 d(CH), ring (polysaccharides, pectin) (81)
1336 cm21 d(CH), ring (polysaccharides, cellulose) (81)
1337 cm21 Collagen (53)
1337/8 cm21 CH2 wagging (35, 42, 47)
1339 cm21 Collagen (31)
In-plane C-O stretching vibration combined
with the ring stretch of phenyl
76
1340 cm21 CH2 wagging (35, 45)
Collagen (21, 45)
(continued )
FTIR Spectroscopy of Biological Tissues 149
Dow
nloa
ded
by [
Uni
vers
ity o
f Il
linoi
s at
Urb
ana-
Cha
mpa
ign]
at 2
1:27
18
Mar
ch 2
015
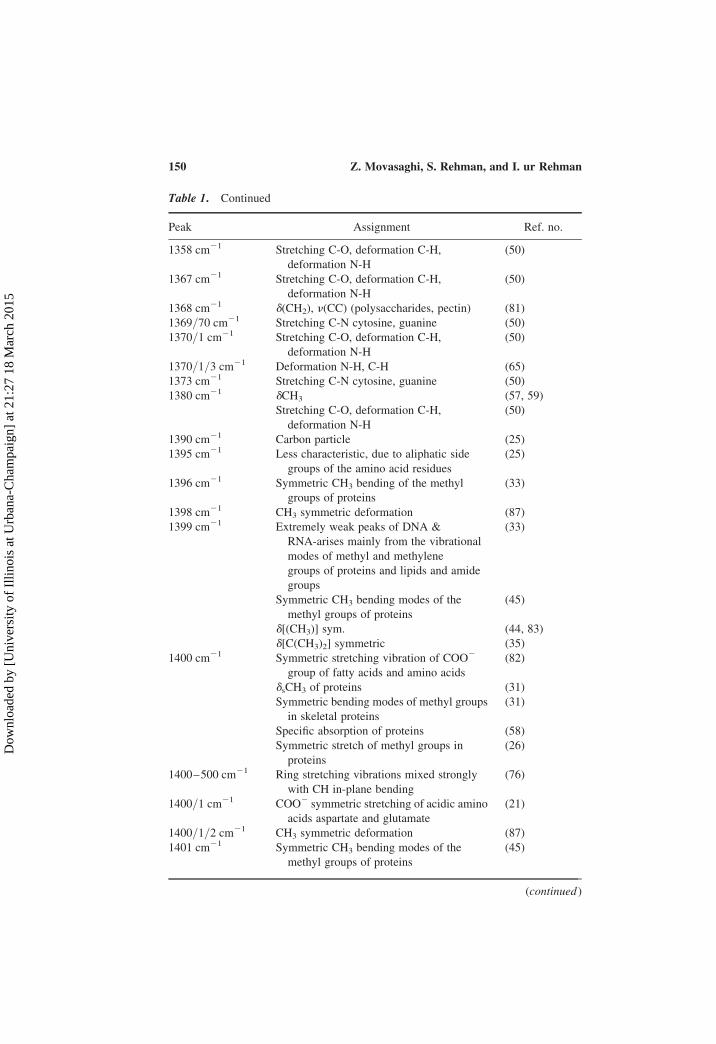
Table 1. Continued
Peak Assignment Ref. no.
1358 cm21 Stretching C-O, deformation C-H,
deformation N-H
(50)
1367 cm21 Stretching C-O, deformation C-H,
deformation N-H
(50)
1368 cm21 d(CH2), n(CC) (polysaccharides, pectin) (81)
1369/70 cm21 Stretching C-N cytosine, guanine (50)
1370/1 cm21 Stretching C-O, deformation C-H,
deformation N-H
(50)
1370/1/3 cm21 Deformation N-H, C-H (65)
1373 cm21 Stretching C-N cytosine, guanine (50)
1380 cm21 dCH3 (57, 59)
Stretching C-O, deformation C-H,
deformation N-H
(50)
1390 cm21 Carbon particle (25)
1395 cm21 Less characteristic, due to aliphatic side
groups of the amino acid residues
(25)
1396 cm21 Symmetric CH3 bending of the methyl
groups of proteins
(33)
1398 cm21 CH3 symmetric deformation (87)
1399 cm21 Extremely weak peaks of DNA &
RNA-arises mainly from the vibrational
modes of methyl and methylene
groups of proteins and lipids and amide
groups
(33)
Symmetric CH3 bending modes of the
methyl groups of proteins
(45)
d[(CH3)] sym. (44, 83)
d[C(CH3)2] symmetric (35)
1400 cm21 Symmetric stretching vibration of COO2
group of fatty acids and amino acids
(82)
dsCH3 of proteins (31)
Symmetric bending modes of methyl groups
in skeletal proteins
(31)
Specific absorption of proteins (58)
Symmetric stretch of methyl groups in
proteins
(26)
1400–500 cm21 Ring stretching vibrations mixed strongly
with CH in-plane bending
(76)
1400/1 cm21 COO2 symmetric stretching of acidic amino
acids aspartate and glutamate
(21)
1400/1/2 cm21 CH3 symmetric deformation (87)
1401 cm21 Symmetric CH3 bending modes of the
methyl groups of proteins
(45)
(continued )
Z. Movasaghi, S. Rehman, and I. ur Rehman150
Dow
nloa
ded
by [
Uni
vers
ity o
f Il
linoi
s at
Urb
ana-
Cha
mpa
ign]
at 2
1:27
18
Mar
ch 2
015
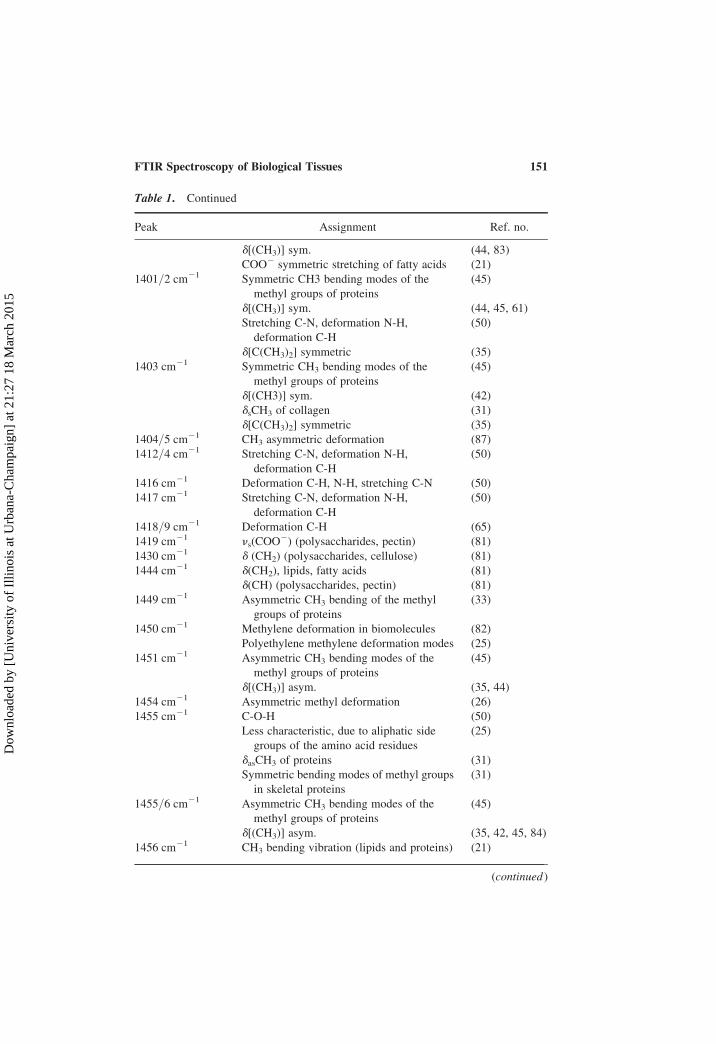
Table 1. Continued
Peak Assignment Ref. no.
d[(CH3)] sym. (44, 83)
COO2 symmetric stretching of fatty acids (21)
1401/2 cm21 Symmetric CH3 bending modes of the
methyl groups of proteins
(45)
d[(CH3)] sym. (44, 45, 61)
Stretching C-N, deformation N-H,
deformation C-H
(50)
d[C(CH3)2] symmetric (35)
1403 cm21 Symmetric CH3 bending modes of the
methyl groups of proteins
(45)
d[(CH3)] sym. (42)
dsCH3 of collagen (31)
d[C(CH3)2] symmetric (35)
1404/5 cm21 CH3 asymmetric deformation (87)
1412/4 cm21 Stretching C-N, deformation N-H,
deformation C-H
(50)
1416 cm21 Deformation C-H, N-H, stretching C-N (50)
1417 cm21 Stretching C-N, deformation N-H,
deformation C-H
(50)
1418/9 cm21 Deformation C-H (65)
1419 cm21 ns(COO2) (polysaccharides, pectin) (81)
1430 cm21 d (CH2) (polysaccharides, cellulose) (81)
1444 cm21 d(CH2), lipids, fatty acids (81)
d(CH) (polysaccharides, pectin) (81)
1449 cm21 Asymmetric CH3 bending of the methyl
groups of proteins
(33)
1450 cm21 Methylene deformation in biomolecules (82)
Polyethylene methylene deformation modes (25)
1451 cm21 Asymmetric CH3 bending modes of the
methyl groups of proteins
(45)
d[(CH3)] asym. (35, 44)
1454 cm21 Asymmetric methyl deformation (26)
1455 cm21 C-O-H (50)
Less characteristic, due to aliphatic side
groups of the amino acid residues
(25)
dasCH3 of proteins (31)
Symmetric bending modes of methyl groups
in skeletal proteins
(31)
1455/6 cm21 Asymmetric CH3 bending modes of the
methyl groups of proteins
(45)
d[(CH3)] asym. (35, 42, 45, 84)
1456 cm21 CH3 bending vibration (lipids and proteins) (21)
(continued )
FTIR Spectroscopy of Biological Tissues 151
Dow
nloa
ded
by [
Uni
vers
ity o
f Il
linoi
s at
Urb
ana-
Cha
mpa
ign]
at 2
1:27
18
Mar
ch 2
015
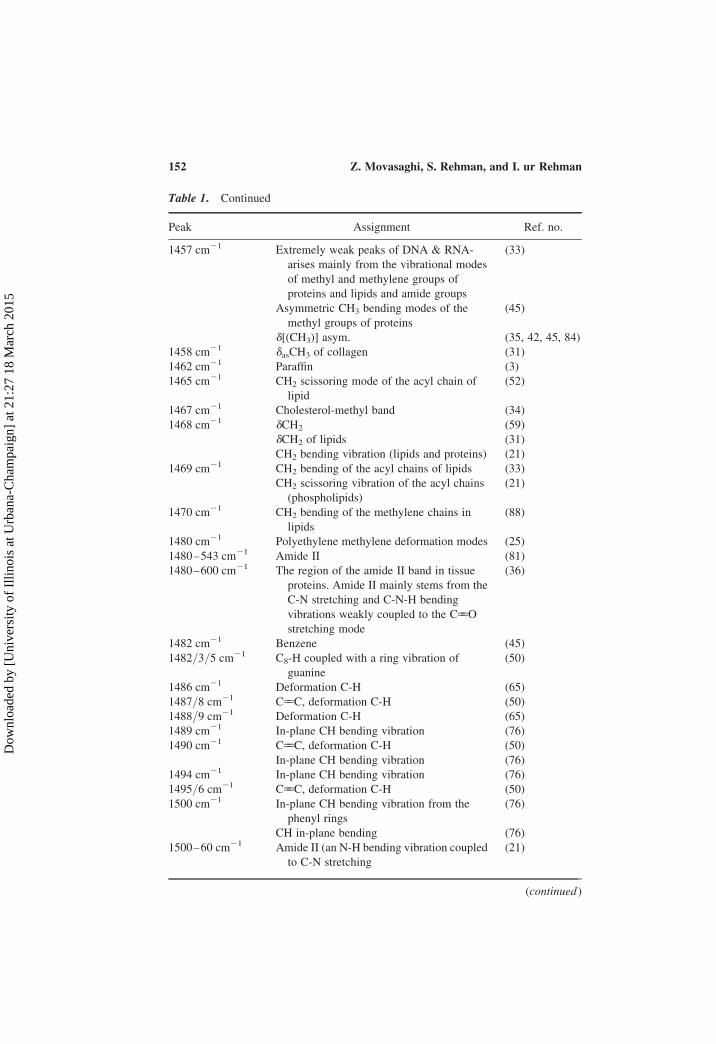
Table 1. Continued
Peak Assignment Ref. no.
1457 cm21 Extremely weak peaks of DNA & RNA-
arises mainly from the vibrational modes
of methyl and methylene groups of
proteins and lipids and amide groups
(33)
Asymmetric CH3 bending modes of the
methyl groups of proteins
(45)
d[(CH3)] asym. (35, 42, 45, 84)
1458 cm21 dasCH3 of collagen (31)
1462 cm21 Paraffin (3)
1465 cm21 CH2 scissoring mode of the acyl chain of
lipid
(52)
1467 cm21 Cholesterol-methyl band (34)
1468 cm21 dCH2 (59)
dCH2 of lipids (31)
CH2 bending vibration (lipids and proteins) (21)
1469 cm21 CH2 bending of the acyl chains of lipids (33)
CH2 scissoring vibration of the acyl chains
(phospholipids)
(21)
1470 cm21 CH2 bending of the methylene chains in
lipids
(88)
1480 cm21 Polyethylene methylene deformation modes (25)
1480–543 cm21 Amide II (81)
1480–600 cm21 The region of the amide II band in tissue
proteins. Amide II mainly stems from the
C-N stretching and C-N-H bending
vibrations weakly coupled to the C55O
stretching mode
(36)
1482 cm21 Benzene (45)
1482/3/5 cm21 C8-H coupled with a ring vibration of
guanine
(50)
1486 cm21 Deformation C-H (65)
1487/8 cm21 C55C, deformation C-H (50)
1488/9 cm21 Deformation C-H (65)
1489 cm21 In-plane CH bending vibration (76)
1490 cm21 C55C, deformation C-H (50)
In-plane CH bending vibration (76)
1494 cm21 In-plane CH bending vibration (76)
1495/6 cm21 C55C, deformation C-H (50)
1500 cm21 In-plane CH bending vibration from the
phenyl rings
(76)
CH in-plane bending (76)
1500–60 cm21 Amide II (an N-H bending vibration coupled
to C-N stretching
(21)
(continued )
Z. Movasaghi, S. Rehman, and I. ur Rehman152
Dow
nloa
ded
by [
Uni
vers
ity o
f Il
linoi
s at
Urb
ana-
Cha
mpa
ign]
at 2
1:27
18
Mar
ch 2
015
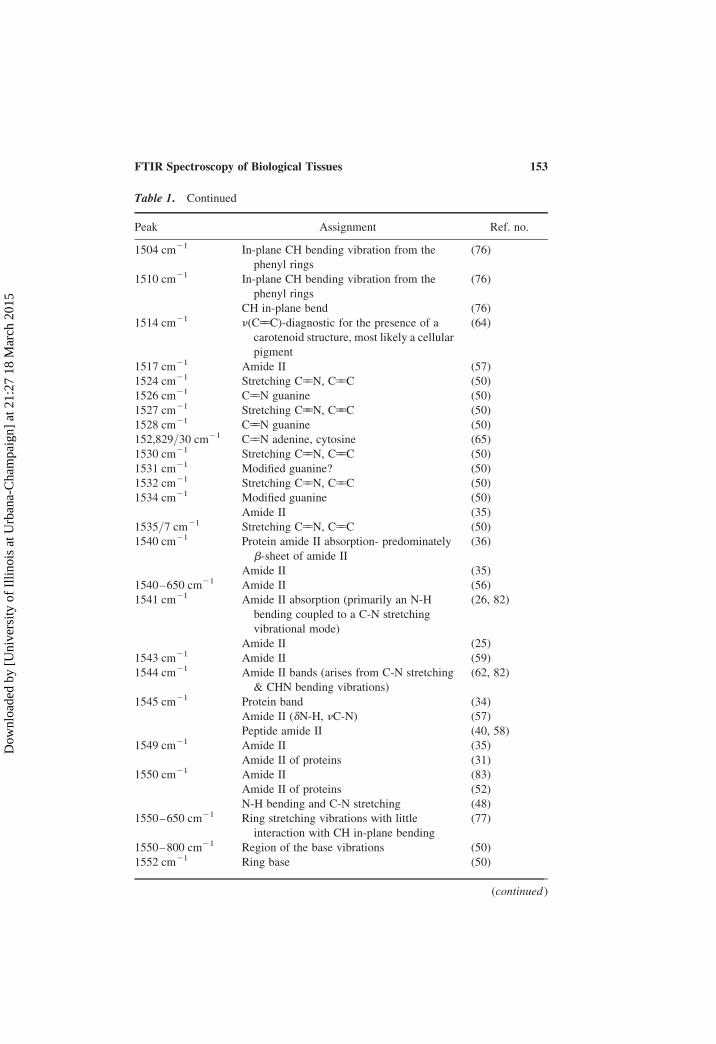
Table 1. Continued
Peak Assignment Ref. no.
1504 cm21 In-plane CH bending vibration from the
phenyl rings
(76)
1510 cm21 In-plane CH bending vibration from the
phenyl rings
(76)
CH in-plane bend (76)
1514 cm21 n(C55C)-diagnostic for the presence of a
carotenoid structure, most likely a cellular
pigment
(64)
1517 cm21 Amide II (57)
1524 cm21 Stretching C55N, C55C (50)
1526 cm21 C55N guanine (50)
1527 cm21 Stretching C55N, C55C (50)
1528 cm21 C55N guanine (50)
152,829/30 cm21 C55N adenine, cytosine (65)
1530 cm21 Stretching C55N, C55C (50)
1531 cm21 Modified guanine? (50)
1532 cm21 Stretching C55N, C55C (50)
1534 cm21 Modified guanine (50)
Amide II (35)
1535/7 cm21 Stretching C55N, C55C (50)
1540 cm21 Protein amide II absorption- predominately
b-sheet of amide II
(36)
Amide II (35)
1540–650 cm21 Amide II (56)
1541 cm21 Amide II absorption (primarily an N-H
bending coupled to a C-N stretching
vibrational mode)
(26, 82)
Amide II (25)
1543 cm21 Amide II (59)
1544 cm21 Amide II bands (arises from C-N stretching
& CHN bending vibrations)
(62, 82)
1545 cm21 Protein band (34)
Amide II (dN-H, nC-N) (57)
Peptide amide II (40, 58)
1549 cm21 Amide II (35)
Amide II of proteins (31)
1550 cm21 Amide II (83)
Amide II of proteins (52)
N-H bending and C-N stretching (48)
1550–650 cm21 Ring stretching vibrations with little
interaction with CH in-plane bending
(77)
1550–800 cm21 Region of the base vibrations (50)
1552 cm21 Ring base (50)
(continued )
FTIR Spectroscopy of Biological Tissues 153
Dow
nloa
ded
by [
Uni
vers
ity o
f Il
linoi
s at
Urb
ana-
Cha
mpa
ign]
at 2
1:27
18
Mar
ch 2
015
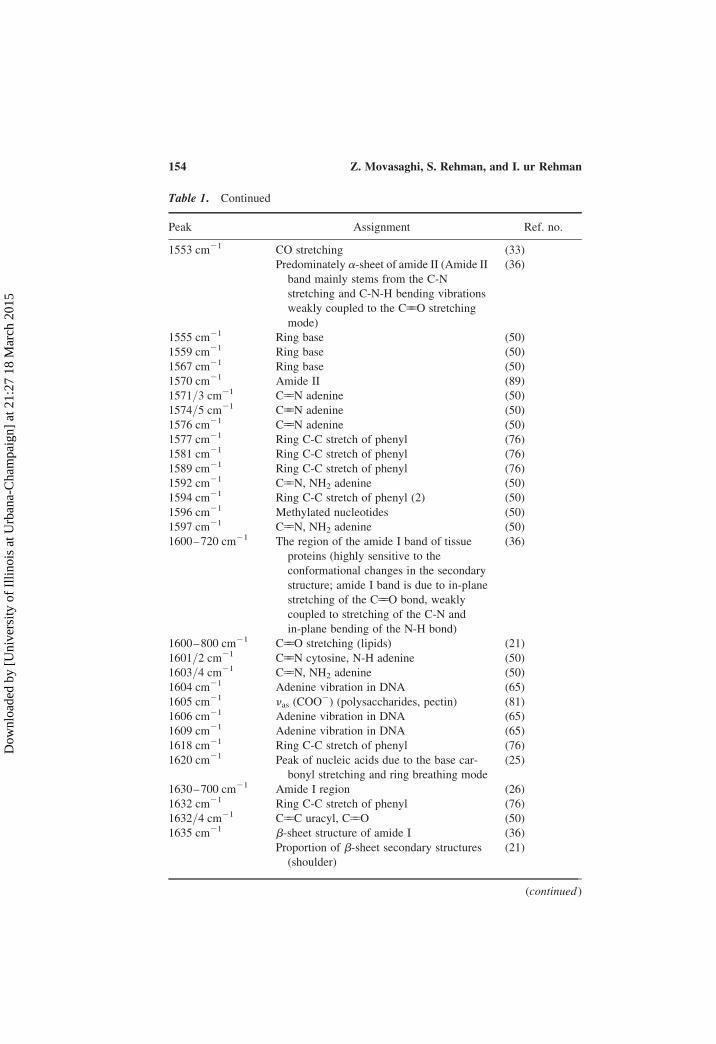
Table 1. Continued
Peak Assignment Ref. no.
1553 cm21 CO stretching (33)
Predominately a-sheet of amide II (Amide II
band mainly stems from the C-N
stretching and C-N-H bending vibrations
weakly coupled to the C55O stretching
mode)
(36)
1555 cm21 Ring base (50)
1559 cm21 Ring base (50)
1567 cm21 Ring base (50)
1570 cm21 Amide II (89)
1571/3 cm21 C55N adenine (50)
1574/5 cm21 C55N adenine (50)
1576 cm21 C55N adenine (50)
1577 cm21 Ring C-C stretch of phenyl (76)
1581 cm21 Ring C-C stretch of phenyl (76)
1589 cm21 Ring C-C stretch of phenyl (76)
1592 cm21 C55N, NH2 adenine (50)
1594 cm21 Ring C-C stretch of phenyl (2) (50)
1596 cm21 Methylated nucleotides (50)
1597 cm21 C55N, NH2 adenine (50)
1600–720 cm21 The region of the amide I band of tissue
proteins (highly sensitive to the
conformational changes in the secondary
structure; amide I band is due to in-plane
stretching of the C55O bond, weakly
coupled to stretching of the C-N and
in-plane bending of the N-H bond)
(36)
1600–800 cm21 C55O stretching (lipids) (21)
1601/2 cm21 C55N cytosine, N-H adenine (50)
1603/4 cm21 C55N, NH2 adenine (50)
1604 cm21 Adenine vibration in DNA (65)
1605 cm21 nas (COO2) (polysaccharides, pectin) (81)
1606 cm21 Adenine vibration in DNA (65)
1609 cm21 Adenine vibration in DNA (65)
1618 cm21 Ring C-C stretch of phenyl (76)
1620 cm21 Peak of nucleic acids due to the base car-
bonyl stretching and ring breathing mode
(25)
1630–700 cm21 Amide I region (26)
1632 cm21 Ring C-C stretch of phenyl (76)
1632/4 cm21 C55C uracyl, C55O (50)
1635 cm21 b-sheet structure of amide I (36)
Proportion of b-sheet secondary structures
(shoulder)
(21)
(continued )
Z. Movasaghi, S. Rehman, and I. ur Rehman154
Dow
nloa
ded
by [
Uni
vers
ity o
f Il
linoi
s at
Urb
ana-
Cha
mpa
ign]
at 2
1:27
18
Mar
ch 2
015
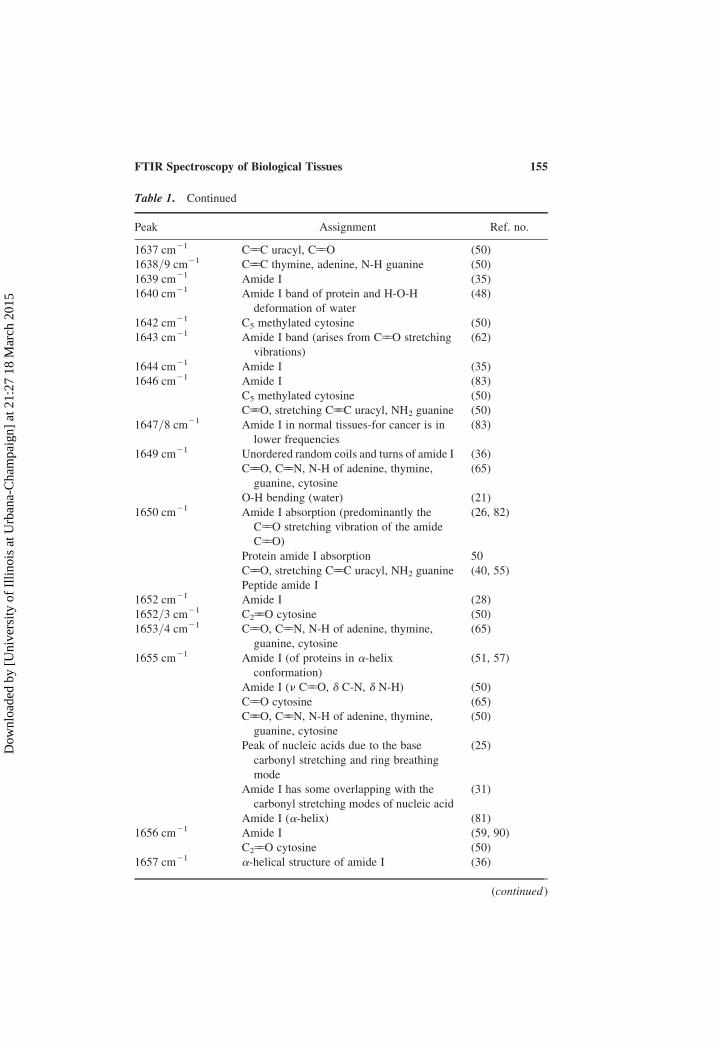
Table 1. Continued
Peak Assignment Ref. no.
1637 cm21 C55C uracyl, C55O (50)
1638/9 cm21 C55C thymine, adenine, N-H guanine (50)
1639 cm21 Amide I (35)
1640 cm21 Amide I band of protein and H-O-H
deformation of water
(48)
1642 cm21 C5 methylated cytosine (50)
1643 cm21 Amide I band (arises from C55O stretching
vibrations)
(62)
1644 cm21 Amide I (35)
1646 cm21 Amide I (83)
C5 methylated cytosine (50)
C55O, stretching C55C uracyl, NH2 guanine (50)
1647/8 cm21 Amide I in normal tissues-for cancer is in
lower frequencies
(83)
1649 cm21 Unordered random coils and turns of amide I (36)
C55O, C55N, N-H of adenine, thymine,
guanine, cytosine
(65)
O-H bending (water) (21)
1650 cm21 Amide I absorption (predominantly the
C55O stretching vibration of the amide
C55O)
(26, 82)
Protein amide I absorption 50
C55O, stretching C55C uracyl, NH2 guanine (40, 55)
Peptide amide I
1652 cm21 Amide I (28)
1652/3 cm21 C255O cytosine (50)
1653/4 cm21 C55O, C55N, N-H of adenine, thymine,
guanine, cytosine
(65)
1655 cm21 Amide I (of proteins in a-helix
conformation)
(51, 57)
Amide I (n C55O, d C-N, d N-H) (50)
C55O cytosine (65)
C55O, C55N, N-H of adenine, thymine,
guanine, cytosine
(50)
Peak of nucleic acids due to the base
carbonyl stretching and ring breathing
mode
(25)
Amide I has some overlapping with the
carbonyl stretching modes of nucleic acid
(31)
Amide I (a-helix) (81)
1656 cm21 Amide I (59, 90)
C255O cytosine (50)
1657 cm21 a-helical structure of amide I (36)
(continued )
FTIR Spectroscopy of Biological Tissues 155
Dow
nloa
ded
by [
Uni
vers
ity o
f Il
linoi
s at
Urb
ana-
Cha
mpa
ign]
at 2
1:27
18
Mar
ch 2
015
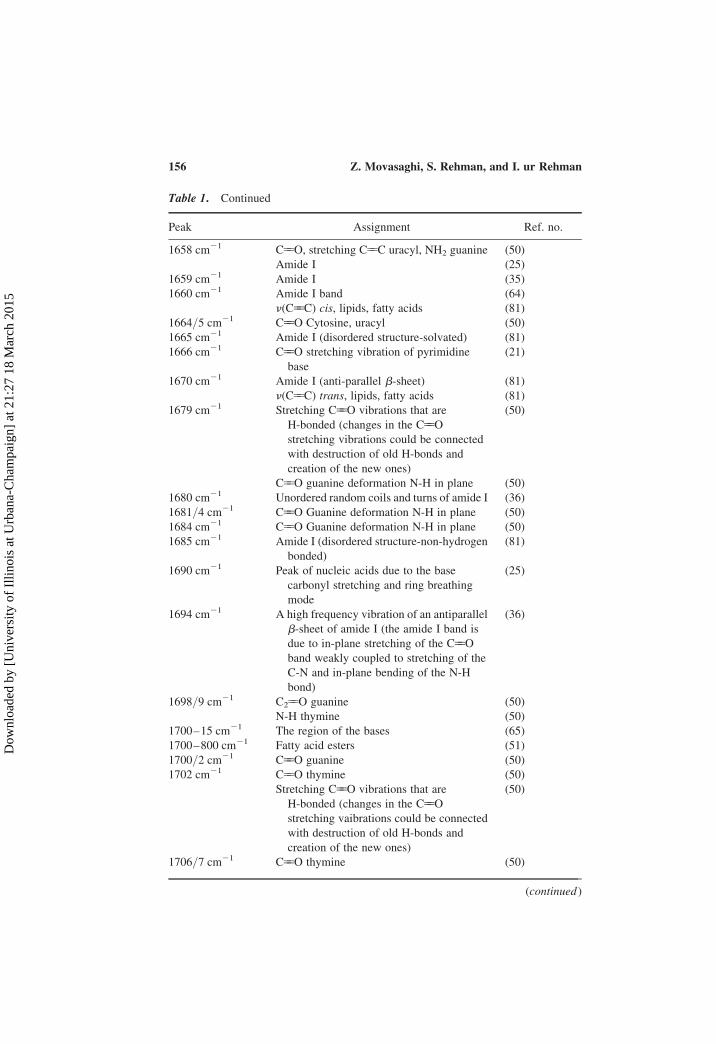
Table 1. Continued
Peak Assignment Ref. no.
1658 cm21 C55O, stretching C55C uracyl, NH2 guanine (50)
Amide I (25)
1659 cm21 Amide I (35)
1660 cm21 Amide I band (64)
n(C55C) cis, lipids, fatty acids (81)
1664/5 cm21 C55O Cytosine, uracyl (50)
1665 cm21 Amide I (disordered structure-solvated) (81)
1666 cm21 C55O stretching vibration of pyrimidine
base
(21)
1670 cm21 Amide I (anti-parallel b-sheet) (81)
n(C55C) trans, lipids, fatty acids (81)
1679 cm21 Stretching C55O vibrations that are
H-bonded (changes in the C55O
stretching vibrations could be connected
with destruction of old H-bonds and
creation of the new ones)
(50)
C55O guanine deformation N-H in plane (50)
1680 cm21 Unordered random coils and turns of amide I (36)
1681/4 cm21 C55O Guanine deformation N-H in plane (50)
1684 cm21 C55O Guanine deformation N-H in plane (50)
1685 cm21 Amide I (disordered structure-non-hydrogen
bonded)
(81)
1690 cm21 Peak of nucleic acids due to the base
carbonyl stretching and ring breathing
mode
(25)
1694 cm21 A high frequency vibration of an antiparallel
b-sheet of amide I (the amide I band is
due to in-plane stretching of the C55O
band weakly coupled to stretching of the
C-N and in-plane bending of the N-H
bond)
(36)
1698/9 cm21 C255O guanine (50)
N-H thymine (50)
1700–15 cm21 The region of the bases (65)
1700–800 cm21 Fatty acid esters (51)
1700/2 cm21 C55O guanine (50)
1702 cm21 C55O thymine (50)
Stretching C55O vibrations that are
H-bonded (changes in the C55O
stretching vaibrations could be connected
with destruction of old H-bonds and
creation of the new ones)
(50)
1706/7 cm21 C55O thymine (50)
(continued )
Z. Movasaghi, S. Rehman, and I. ur Rehman156
Dow
nloa
ded
by [
Uni
vers
ity o
f Il
linoi
s at
Urb
ana-
Cha
mpa
ign]
at 2
1:27
18
Mar
ch 2
015

Table 1. Continued
Peak Assignment Ref. no.
1707 cm21 C55O guanine (50)
1708 cm21 C55O thymine (50)
1712/9 cm21 C55O (50)
1713/4/6 cm21 C55O thymine (50)
1717 cm21 C55O thymine (50)
Amide I (arises from C55O stretching
vibration)
(21)
C55O stretching vibration of DNA and RNA (21)
C55O stretching vibration of purine base (21)
1719 cm21 C55O (50)
1725–45 cm21 C55O stretching band mode of the fatty acid
ester
(51)
1728/9 cm21 C55O band (51)
1730 cm21 Absorption band of fatty acid ester (51)
Fatty acid ester band (51)
1736 cm21 C55O stretching (lipids) (21)
1739 cm21 n(C55O) (polysaccharides, hemicellulose) (91)
1740 cm21 C55O (53, 83)
C55O stretching (lipids) (21)
Ester C55O stretching vibration
(phospholipids)
(21)
1743 cm21 C55O stretching mode of lipids (40)
1745 cm21 Ester group (C55O) vibration of
triglycerides
(83)
n(C55O) (polysaccharides, pectin) (81)
1750 cm21 n(C55C) lipids, fatty acids (81)
1997/2040/53/58 cm21
The band of second order (50)
2100 cm21 A combination of hindered rotation and O-H
bending (water)
(21)
2600 cm21 H-bonded NH vibration band (65)
2633/678 cm21 Stretching N-H (NH3þ) (50)
2727/731 cm21 Stretching N-H (NH3þ) (50)
2761 cm21 CH3 modes (23)
2765/66/69/99 cm21
Stretching N-H (NH3þ) (50)
2800 cm21 Stretching N-H (NH3þ) (50)
2800–3000 cm21 C-H (57)
Lipid region (21, 53)
CH3,CH2-lipid and protein (51)
2800–3100 cm21 C-H stretching vibrations of methyl
(CH3) & methylene (CH2) groups &
olefins
(83)
(continued )
FTIR Spectroscopy of Biological Tissues 157
Dow
nloa
ded
by [
Uni
vers
ity o
f Il
linoi
s at
Urb
ana-
Cha
mpa
ign]
at 2
1:27
18
Mar
ch 2
015
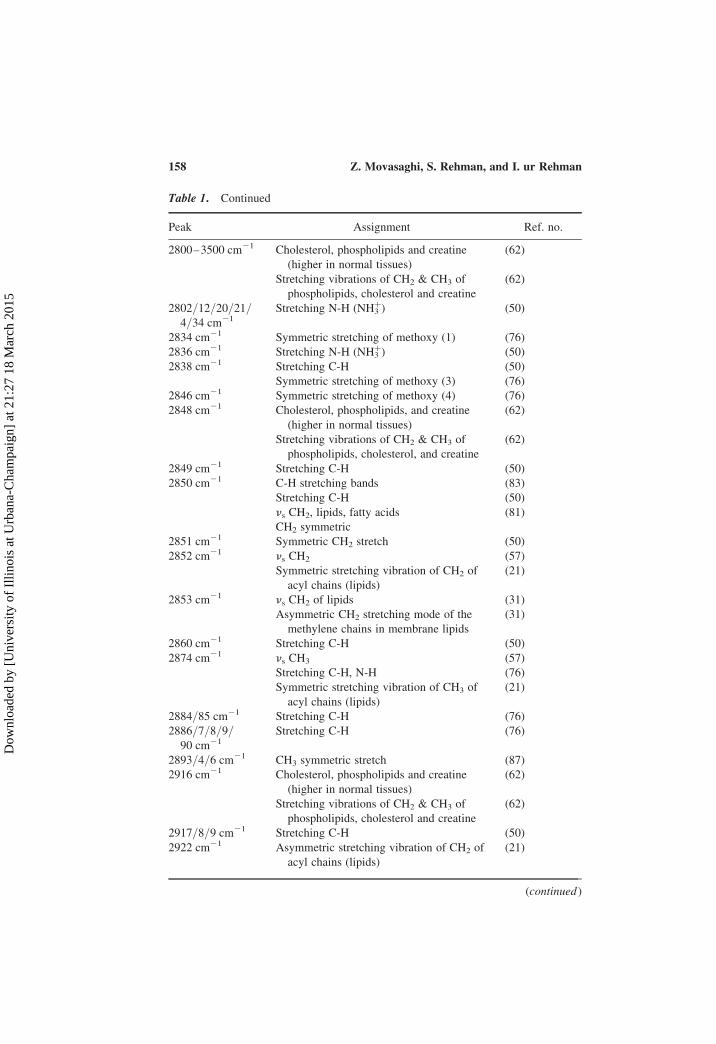
Table 1. Continued
Peak Assignment Ref. no.
2800–3500 cm21 Cholesterol, phospholipids and creatine
(higher in normal tissues)
(62)
Stretching vibrations of CH2 & CH3 of
phospholipids, cholesterol and creatine
(62)
2802/12/20/21/4/34 cm21
Stretching N-H (NH3þ) (50)
2834 cm21 Symmetric stretching of methoxy (1) (76)
2836 cm21 Stretching N-H (NH3þ) (50)
2838 cm21 Stretching C-H (50)
Symmetric stretching of methoxy (3) (76)
2846 cm21 Symmetric stretching of methoxy (4) (76)
2848 cm21 Cholesterol, phospholipids, and creatine
(higher in normal tissues)
(62)
Stretching vibrations of CH2 & CH3 of
phospholipids, cholesterol, and creatine
(62)
2849 cm21 Stretching C-H (50)
2850 cm21 C-H stretching bands (83)
Stretching C-H (50)
ns CH2, lipids, fatty acids (81)
CH2 symmetric
2851 cm21 Symmetric CH2 stretch (50)
2852 cm21 ns CH2 (57)
Symmetric stretching vibration of CH2 of
acyl chains (lipids)
(21)
2853 cm21 ns CH2 of lipids (31)
Asymmetric CH2 stretching mode of the
methylene chains in membrane lipids
(31)
2860 cm21 Stretching C-H (50)
2874 cm21 ns CH3 (57)
Stretching C-H, N-H (76)
Symmetric stretching vibration of CH3 of
acyl chains (lipids)
(21)
2884/85 cm21 Stretching C-H (76)
2886/7/8/9/90 cm21
Stretching C-H (76)
2893/4/6 cm21 CH3 symmetric stretch (87)
2916 cm21 Cholesterol, phospholipids and creatine
(higher in normal tissues)
(62)
Stretching vibrations of CH2 & CH3 of
phospholipids, cholesterol and creatine
(62)
2917/8/9 cm21 Stretching C-H (50)
2922 cm21 Asymmetric stretching vibration of CH2 of
acyl chains (lipids)
(21)
(continued )
Z. Movasaghi, S. Rehman, and I. ur Rehman158
Dow
nloa
ded
by [
Uni
vers
ity o
f Il
linoi
s at
Urb
ana-
Cha
mpa
ign]
at 2
1:27
18
Mar
ch 2
015
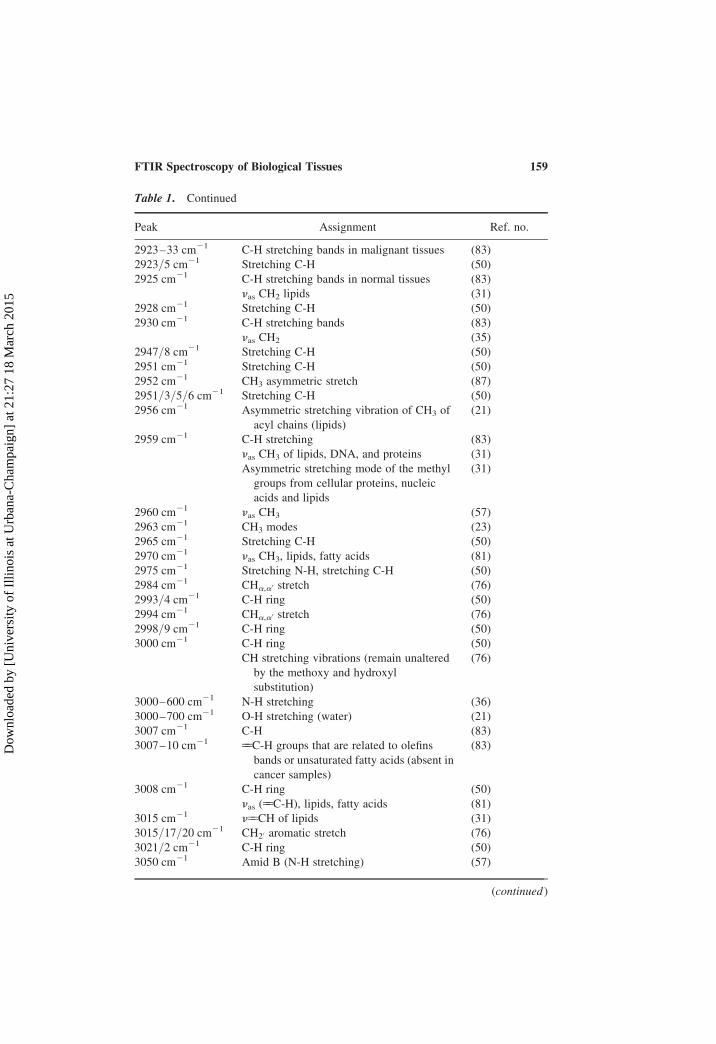
Table 1. Continued
Peak Assignment Ref. no.
2923–33 cm21 C-H stretching bands in malignant tissues (83)
2923/5 cm21 Stretching C-H (50)
2925 cm21 C-H stretching bands in normal tissues (83)
nas CH2 lipids (31)
2928 cm21 Stretching C-H (50)
2930 cm21 C-H stretching bands (83)
nas CH2 (35)
2947/8 cm21 Stretching C-H (50)
2951 cm21 Stretching C-H (50)
2952 cm21 CH3 asymmetric stretch (87)
2951/3/5/6 cm21 Stretching C-H (50)
2956 cm21 Asymmetric stretching vibration of CH3 of
acyl chains (lipids)
(21)
2959 cm21 C-H stretching (83)
nas CH3 of lipids, DNA, and proteins (31)
Asymmetric stretching mode of the methyl
groups from cellular proteins, nucleic
acids and lipids
(31)
2960 cm21 nas CH3 (57)
2963 cm21 CH3 modes (23)
2965 cm21 Stretching C-H (50)
2970 cm21 nas CH3, lipids, fatty acids (81)
2975 cm21 Stretching N-H, stretching C-H (50)
2984 cm21 CHa,a0 stretch (76)
2993/4 cm21 C-H ring (50)
2994 cm21 CHa,a0 stretch (76)
2998/9 cm21 C-H ring (50)
3000 cm21 C-H ring (50)
CH stretching vibrations (remain unaltered
by the methoxy and hydroxyl
substitution)
(76)
3000–600 cm21 N-H stretching (36)
3000–700 cm21 O-H stretching (water) (21)
3007 cm21 C-H (83)
3007–10 cm21 55C-H groups that are related to olefins
bands or unsaturated fatty acids (absent in
cancer samples)
(83)
3008 cm21 C-H ring (50)
nas (55C-H), lipids, fatty acids (81)
3015 cm21 n55CH of lipids (31)
3015/17/20 cm21 CH20 aromatic stretch (76)
3021/2 cm21 C-H ring (50)
3050 cm21 Amid B (N-H stretching) (57)
(continued )
FTIR Spectroscopy of Biological Tissues 159
Dow
nloa
ded
by [
Uni
vers
ity o
f Il
linoi
s at
Urb
ana-
Cha
mpa
ign]
at 2
1:27
18
Mar
ch 2
015
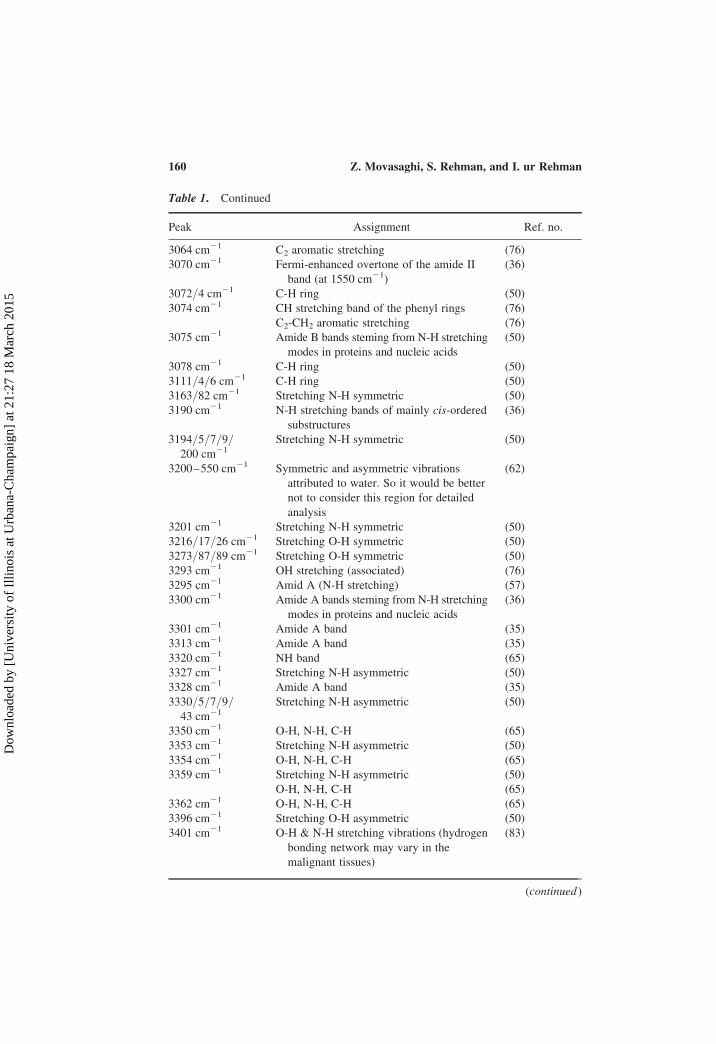
Table 1. Continued
Peak Assignment Ref. no.
3064 cm21 C2 aromatic stretching (76)
3070 cm21 Fermi-enhanced overtone of the amide II
band (at 1550 cm21)
(36)
3072/4 cm21 C-H ring (50)
3074 cm21 CH stretching band of the phenyl rings (76)
C2-CH2 aromatic stretching (76)
3075 cm21 Amide B bands steming from N-H stretching
modes in proteins and nucleic acids
(50)
3078 cm21 C-H ring (50)
3111/4/6 cm21 C-H ring (50)
3163/82 cm21 Stretching N-H symmetric (50)
3190 cm21 N-H stretching bands of mainly cis-ordered
substructures
(36)
3194/5/7/9/200 cm21
Stretching N-H symmetric (50)
3200–550 cm21 Symmetric and asymmetric vibrations
attributed to water. So it would be better
not to consider this region for detailed
analysis
(62)
3201 cm21 Stretching N-H symmetric (50)
3216/17/26 cm21 Stretching O-H symmetric (50)
3273/87/89 cm21 Stretching O-H symmetric (50)
3293 cm21 OH stretching (associated) (76)
3295 cm21 Amid A (N-H stretching) (57)
3300 cm21 Amide A bands steming from N-H stretching
modes in proteins and nucleic acids
(36)
3301 cm21 Amide A band (35)
3313 cm21 Amide A band (35)
3320 cm21 NH band (65)
3327 cm21 Stretching N-H asymmetric (50)
3328 cm21 Amide A band (35)
3330/5/7/9/43 cm21
Stretching N-H asymmetric (50)
3350 cm21 O-H, N-H, C-H (65)
3353 cm21 Stretching N-H asymmetric (50)
3354 cm21 O-H, N-H, C-H (65)
3359 cm21 Stretching N-H asymmetric (50)
O-H, N-H, C-H (65)
3362 cm21 O-H, N-H, C-H (65)
3396 cm21 Stretching O-H asymmetric (50)
3401 cm21 O-H & N-H stretching vibrations (hydrogen
bonding network may vary in the
malignant tissues)
(83)
(continued )
Z. Movasaghi, S. Rehman, and I. ur Rehman160
Dow
nloa
ded
by [
Uni
vers
ity o
f Il
linoi
s at
Urb
ana-
Cha
mpa
ign]
at 2
1:27
18
Mar
ch 2
015

(22). Another difference existing between the techniques is their resolution.
While Raman has lateral resolution of 1–2 mm and confocal resolution of
2.5 mm, FTIR does not provide the possibility of confocal resolution, and
its lateral resolution is 10–20 mm (23).
FTIR SPECTROSCOPY BIOLOGICAL RESEARCH
A wide range of biological studies have been covered by FTIR analysis.
These studies include cervix (24–32), lung (33–35), breast (21, 36–39),
skin (40–44), gastrointestinal tissue (45–48), brain (49–51), oral tissue
(52), lymphoid tissue (53), lymphocytes (childhood leukemia) (54), non-
Hodgkin’s lymphoma (55), prostate (56, 57), colon (58–61), fibroblasts
(62), bacteria (63, 64), tumor cells (65), DNA (66), anti-cancer drug (67),
tissue processing (68), cancer detection (69), tissue preservation (70) cytotox-
icity and heating (71), plant tissue (72), gallstones (73), glucose measurement
(74), and bone (75). This part of this article presents a brief summary of
experimental procedure that has been applied by different research groups.
It is believed that knowing what has been considered in Materials and
Methods of different studies can lead to a better understanding of peak
definitions obtained.
Wood et al. (24) reported on FTIR spectroscopy as a biodiagnostic tool
for cervical cancer. The spectra of the normal epithelial cells illustrated
intense glycogen bands at 1022 cm21 and 1150 cm21 and a pronounced
symmetric phosphate stretch at 1078 cm21. The spectral features suggestive
of dysplastic or malignant transformations were mainly pronounced
Table 1. Continued
Peak Assignment Ref. no.
3410/16/20/22 cm21
Stretching O-H asymmetric (50)
3430 cm21 N-H stretching bands of mainly
trans-ordered substructures
(36)
3435/442 cm21 Stretching O-H asymmetric (50)
3500–600 cm21 OH bonds (65)
3506 cm21 OH stretching (free) (75)
3524/28/42 cm21 Stretching O-H (50)
3561 cm21 OH stretching (free) (76)
3570/77/78/82/90/9 cm21
Stretching O-H (50)
3611 cm21 O-H & N-H stretching vibrations (hydrogen
bonding network may vary in the
malignant tissues)
(83)
FTIR Spectroscopy of Biological Tissues 161
Dow
nloa
ded
by [
Uni
vers
ity o
f Il
linoi
s at
Urb
ana-
Cha
mpa
ign]
at 2
1:27
18
Mar
ch 2
015
symmetric and asymmetric phosphate modes and a reduction in the glycogen
band intensity. This study demonstrated the potential of the automated FTIR
cervical screening technology in the clinical environment.
Chiriboga et al. (25) reported on differentiation and maturation of the epi-
thelial cells in the human cervix using infrared spectroscopy. Different layers
of human cervical squamous tissue, representing different cellular maturation
stages, exhibited quite dissimilar spectral patterns. Thus, it was concluded that
this technique presents a powerful tool to monitor cell maturation and differ-
entiation. In addition, a proper interpretation of the state of health of cells
exfoliated from such tissues would be obtained through a detailed understand-
ing of the spectra of the individual layers.
Wood et al. (26) carried out an FTIR microspectroscopic investigation of
cell types and potential confounding variables in screening for cervical malig-
nancies. The aim of the study was to determine the effectiveness of infrared
spectroscopy in the diagnosis of cervical cancer and dysplasia. It was found
that leukocytes, and in particular lymphocytes, have spectral features in the
phosphodiester region (1300–900 cm21), suggestive of changes indicative
of malignancy. The use of ethanol as a fixative and dehydrating agent
resulted in retention of glycogen and thus minimized the spectral changes in
the glycogen region due to sampling technique. Erythrocyte spectra
exhibited a reduction in glycogen band intensity but could be discerned by
a relatively low-intensity ns PO22 band. Endocervical mucin spectra exhibit
a reduction glycogen band and a very pronounced ns PO22 band, which was
similar in intensity to the corresponding band in HeLa ns PO22 cells.
Sindhuphak et al. (27) screened cervical cell samples of Thai women by
using FTIR spectroscopy and compared the results to the histologic diagnosis.
Two hundred seventy-five cervical cell specimens were received from patients
undergoing hysterectomy. Histological examinations showed 108 abnormal
cases and 167 abnormal cases. FTIR results versus histology showed sensi-
tivity of 96.3% and specificity of 96.4%. False-negative and false-positive
rates were 3.7 and 3.6%, respectively.
A study was conducted by Mordechai et al. (28) on formalin-fixed
melanoma and cervical cancer by FTIR microspectroscopy (FTIR-MSP) to
detect common biomarkers that occur in both types of cancer, distinguishing
them from the respective non-malignant tissues. The spectra were analyzed for
changes in levels of biomolecules such as RNA, DNA, phosphates, and carbo-
hydrates. Whereas carbohydrate levels showed a good diagnostic potential for
detection of cervical cancer, this was not the case for melanoma. However,
variation of the RNA/DNA ratio as measured at 1121/1020 cm21 showed
similar trends between non-malignant and malignant tissues in both types of
cancer. The ratio was higher for malignant tissues in both types of cancer.
Chiriboga et al. (29) carried out a comparative study of spectra of biopsies
of cervical squamous epithelium and of exfoliated cervical cells using infrared
spectroscopy. A comparison of infrared absorption spectra obtained from the
different layers of squamous epithelium from the human cervix and infrared
Z. Movasaghi, S. Rehman, and I. ur Rehman162
Dow
nloa
ded
by [
Uni
vers
ity o
f Il
linoi
s at
Urb
ana-
Cha
mpa
ign]
at 2
1:27
18
Mar
ch 2
015

spectra obtained from exfoliated cervical cells was done. It was shown that the
technique is a sensitive tool to monitor maturation and differentiation of
human cervical cells. Therefore, it was concluded that this spectroscopic
method provides new insights into the composition and state of health of exfo-
liated cells.
Wong et al. (30) carried out research on exfoliated cells and tissues from
human endocervix and ectocervix by FTIR and ATR/FTIR spectroscopy.
They measured the transmission infrared spectra of exfoliated endocervical
mucin-producing columnar epithelial cells and the attenuated total reflectance
(ATR) infrared spectra of the single-columnar cell layer on the endocervical
tissues and compared with the corresponding infrared spectra of ectocervical
squamous cells and squamous epithelium. The effects of the contaminated
connective tissue on the infrared spectra of the endocervical columnar epi-
thelial tissue demonstrated that ATR/FTIR is a more desirable method than
the transmission method to obtain meaningful and good quality infrared
spectra of tissue samples, particularly for samples consisting of thin layers
of different types of tissues. Substantial differences in the infrared spectra
between the columnar cells and squamous cells on the endocervical and ecto-
cervical tissues, respectively, were evident. The strong glycogen bands in the
infrared spectrum of the ectocervical squamous cells were absent in the
spectrum of endocervical columnar cells. These spectral changes were
similar to that observed in malignant squamous cells. Therefore, if the
decrease in the intensity of the glycogen bands is used as the only criterion
for the determination of the cellular abnormalities in the cervix, the
presence of a large number of normal endocervical columnar cells in the
cervical specimen would lead to a false result. Consequently, it was
concluded that in addition to the glycogen bands, other features in the
infrared spectra should be considered for evaluation of abnormalities in exfo-
liated cervical epithelial cells.
A pressure-tuning FTIR spectroscopic study of carcinogenesis in human
endometrium was reported by Fung et al. (31). The spectra of normal tissues
differed from those obtained for grade I and grade III adenocarcinoma.
Changes in the spectra of malignant samples were observed in the
symmetric and asymmetric stretching bands of the phosphodiester
backbones of nucleic acids, the CH stretching region, the C-O stretching
bands of the C-OH groups of carbohydrates and cellular protein residuals,
and the pressure dependence of the CH2 stretching mode. These spectral
changes in the endometrium were reproducible. It was also found for the
first time that the epithelium in the normal endometrium exhibits unique struc-
tural properties compared with the epithelium of other normal human tissues.
Wang et al. (33) focused on the microscopic FTIR studies of lung cancer
cells in pleural fluid. The results demonstrate significant spectral differences
between normal, lung cancer, and tuberculous cells. The most considerable
differences were in the ratio of peak intensities of 1030 and 1080 cm21
bonds (originated mainly in glycogen and phosphodiester groups of nucleic
FTIR Spectroscopy of Biological Tissues 163
Dow
nloa
ded
by [
Uni
vers
ity o
f Il
linoi
s at
Urb
ana-
Cha
mpa
ign]
at 2
1:27
18
Mar
ch 2
015

acids). One of the important advantages of this method was the possibility of
obtaining quick and reliable results.
The research of Yano et al. (34) was about direct measurement of human
lung cancerous and non-cancerous tissues by FTIR microscopy, in order to
answer the question of whether this technique can be used as a clinical tool
or not. The corrected peak heights (H1045 and H1467) obtained from the
bands at 1045 cm21 and 1465 cm21, which are due to glycogen and choles-
terol, were chosen for a quantitative evaluation of the malignancy. It was
concluded that these peaks are an exceptionally useful factor for discrimi-
nation of the cancerous tissues from the non-cancerous ones. If the H1045/H1467 ratio from measured spectrum is larger than 1.4, it could be said
with confidence that the tissue contains squamous cell carcinoma (SCC) or
adenocarcinoma at least partially. Furthermore, they carried out the micro-
scopic mapping of the tissues containing both cancerous and non-cancerous
sections, demonstrating that the color map reflects small changes in the
spatial distribution of cancer cells in the tissues.
Yang et al. (35) reported on tumor cell invasion by FTIR microspectro-
scopy. In this study, a three-dimensional artificial membrane using collagen
type I, one of the main components of basal membranes of the lung tissue,
was established in order to investigate tumor cell invasion of lung cancer.
The mapping images obtained with FTIR microspectroscopy were validated
with standard histological section analysis. The FTIR image produced using
a single wave number at 1080 cm21, corresponding to PO22 groups in DNA
from cells, correlated well with the histological section, which clearly
revealed a cell layer and invading cells within the membrane. Furthermore,
the peaks corresponding to amide A, I and II in the spectra of the invading
cells shifted compared to the non-invading cells, which may relate to the
changes in conformation and/or heterogeneity in the phenotype of the cells.
The data presented in this study demonstrate that FTIR microspectroscopy
can be a fast and reliable technique to assess tumor invasion in vitro.
Eckel et al. (36) analyzed the IR spectra of normal, hyperplasia, fibroade-
noma, and carcinoma tissues of human breast. They worked on characteristic
spectroscopic patterns in the proteins bands of the tissue. Some of the results
of their experiments are as follows: (A) In carcinomatous tissues the bands in
the region of 3000–3600 cm21 shifted to lower frequencies. (B) The
3300 cm21/3075 cm21 absorbance ratio was significantly higher for the
fibroadenoma. (C) For the malignant tissues, the frequency of a-helix amide
I band decreased, while the corresponding b-sheet amide I band frequency
increased. (D) 1657 cm21/1635 cm21 and 1553 cm21/1540 cm21 absor-
bance ratios were the highest for fibroadenoma and carcinoma. (E) The
1680 cm21/1657 cm21 absorbance ratio decreased significantly in the order
of normal, hyperplasia, fibroadenoma, and carcinoma. (F) The 1651 cm21/1545 cm21 absorbance ratio increased slightly for fibroadenoma and
carcinoma. (G) The bands at 1204 cm21 and 1278 cm21, assigned to the
vibrational modes of the collagen, did not appear in the original spectra as
Z. Movasaghi, S. Rehman, and I. ur Rehman164
Dow
nloa
ded
by [
Uni
vers
ity o
f Il
linoi
s at
Urb
ana-
Cha
mpa
ign]
at 2
1:27
18
Mar
ch 2
015

the resolved peaks and were distinctly stronger for the carcinoma tissues. (H)
The 1657 cm21/1204 cm21 and 1657 cm21/1278 cm21 absorbance ratios,
both yielding information on the relative content of collagen, increased in
the order of normal, hyperplasia, carcinoma, and fibroadenoma.
The main focus area of the comparative infrared spectroscopic study of
Fabian et al. (21) was on human breast tumors, human breast tumor cell
lines, and xenografted human tumor cells. The results indicated that substantial
differences exist on a macroscopic level between the tumors, tumor cell lines,
and xenografted tumor cells, which are related to the presence of a significant
connective tissue matrix in the tumors. On a macroscopic level, tumor cell xeno-
grafts appear, in spectroscopic terms, to be relatively homogenous with a rela-
tively weak signature characteristic of connective tissue. Differences on a
microscopic level between adjacent small (30 mm2) areas of the same xeno-
grafted tumor could be detected, which were due to local variations in
collagen content. In addition to variations in collagen content, variations in
the deposition of microscopic fat droplets throughout both human and xeno-
grafted tumors could be detected. The results indicated the care with which
infrared spectroscopic studies of tissues must be carried out to avoid incorrect
interpretation of results due to an incomplete understanding of tissue pathology.
The study of Sukuta and Bruch (40) was on factor analysis of cancer FTIR
evanescent wave fiberoptical (FTIR-FEW) spectra. The purpose of the
research was to isolate pure biochemical compounds and spectra and to
classify skin cancer tumors. Apart from fulfilling the primary goals, it was
demonstrated that the combination of FTIR-FEW technique and chemical
factor analysis has the potential of a clinical diagnostic tool.
Wong et al. (41) applied infrared spectroscopy combined with high
pressure (pressure-tuning infrared spectroscopy) for studying the paired
sections of basal cell carcinomas (BCC) and normal skin from 10 patients.
In this study, atmospheric pressure IR spectra from BCC were dramatically
different from those from the corresponding normal skin. Compared to their
normal controls, BCCs displayed increased hydrogen bonding of the phospho-
diester group of nucleic acids, decreased hydrogen bonding of the C-OH
groups of proteins, increased intensity of the band at 972 cm21, a decreased
intensity ratio between the CH3 stretching and CH2 stretching bands, and
accumulation of unidentified carbohydrates.
Lucassen et al. (42) used attenuated total reflectance Fourier transform
infrared (ATR-FTIR) spectroscopy to measure hydration of the stratum
corneum. It was believed that the determination of the hydration state of the
skin is necessary to obtain basic knowledge about the penetration and loss
of water in the skin stratum corneum. In this study, direct band fitting of the
water bending, combination, and OH stretch bands over the 4000–
650 cm21 wave number range were applied. Separate band fits of water,
normal stratum corneum, and occluded hydrated stratum corneum spectra
were obtained, yielding band parameters of the individual water contributions
in the bending mode at 1640 cm21, the combination band at 2125 cm21, and
FTIR Spectroscopy of Biological Tissues 165
Dow
nloa
ded
by [
Uni
vers
ity o
f Il
linoi
s at
Urb
ana-
Cha
mpa
ign]
at 2
1:27
18
Mar
ch 2
015
the OH stretches in the hydrated skin stratum corneum spectra. They
concluded that band fit analysis of hydrated skin stratum corneum
ATR-FTIR spectra offers the possibility for quantitative determination of indi-
vidual water band parameters.
McIntosh et al. (43) used infrared spectroscopy to examine basal cell
carcinoma to explore distinctive characteristics of basal cell carcinoma
versus normal skin samples and other skin neoplasms. Spectra of epidermis,
tumor, follicle sheath, and dermis were acquired from unstained frozen
sections and analyzed qualitatively, by t-tests and by linear discriminant
analyses. Dermal spectra were significantly different from the other skin com-
ponents mainly due to absorptions from collagen in dermis. Spectra of normal
epidermis and basal cell carcinoma were significantly different by virtue of
subtle differences in protein structure and nucleic acid content. Linear discri-
minant analysis characterized spectra as arising from basal cell carcinoma,
epidermis, or follicle sheath with 98.7% accuracy. Use of linear discriminant
analysis accurately classified spectra as arising from epidermis overlying basal
cell carcinoma versus epidermis overlying non-tumor–bearing skin in 98.0%
of cases. Spectra of basal cell carcinoma, squamous cell carcinoma, nevi, and
malignant melanoma were qualitatively similar. Distinction of basal cell
carcinoma, squamous cell carcinoma, and melanocytic lesions by linear discri-
minant analyses, however, was 93.5% accurate. Therefore, spectral separation
of abnormal versus normal tissue was achieved with high sensitivity and
specificity (43).
Barry et al. (44) recorded Fourier transform (FT) Raman and infrared
spectra of the outermost layer of human skin, the stratum corneum. Assign-
ments consistent with the FT Raman vibrations were made for the first time
and compared with assignments from the FTIR spectrum. The results demon-
strated that FT Raman spectroscopy holds several advantages over FTIR in
studies of human skin. The molecular and conformational nature of human
skin, and modifications induced by drug or chemical treatments, may be
assessed by FT Raman spectroscopy.
Fujioka et al. (45) reported on discrimination between normal and
malignant human gastric tissues by FTIR spectroscopy. Their aim was to
determine whether malignant and normal human gastric tissues can be distin-
guished by the technique. As a result, 22 out of 23 gastric tissue samples and 9
out of 12 gastric normal samples were correctly segregated, yielding 88.6%
accuracy. Subsequently, they concluded that FTIR spectroscopy can be a
useful tool for screening gastric cancer.
Weng et al. (46) studied tumors from stomach, small intestine, colon,
rectum, liver, and other parts of the digestive system, with FTIR fiber optics
and FT-Raman spectroscopic techniques. The spectra of samples were
recorded on a Magna750 FTIR spectrometer with a mercury cadmium
telluride detector (MCD) and mid-infrared optical fiber. The measurements
were carried out by touching the sample with an attenuated total reflectance
(ATR) probe. FT-Raman spectra of the samples were recorded on a 950
Z. Movasaghi, S. Rehman, and I. ur Rehman166
Dow
nloa
ded
by [
Uni
vers
ity o
f Il
linoi
s at
Urb
ana-
Cha
mpa
ign]
at 2
1:27
18
Mar
ch 2
015
FT-Raman spectrometer. The results indicate that (i) the C55O stretching band
of adipose can be observed in some normal tissues but is rarely found in
malignant tissues, (ii) the relative intensities I1460/I1400 are high for normal
tissue but low for malignant tissue. For most normal tissues the intensities
for the 1250 cm21 band are stronger than for band around 1310 cm21,
while the 1310 cm21 band in malignant tissues is often stronger than the
1250 cm21 bands.
In a study reported by Mordechai et al. (47), adenocarcinoma and normal
colonic tissues were studied. FTIR microspectroscopy was employed to
analyze thin tissue specimens and a direct comparison with normal histopatho-
logical analysis, which served as a gold reference. Several unique differences
between normal and cancerous intestinal specimens were observed. The
cancerous intestine showed weaker absorption strength over a wide region. In
addition, IR absorption spectra from intestinal tissues (normal and cancerous)
with other biological tissue samples were also effectively compared.
A diagnostic research was carried out by Li et al. (48), which aimed at
classifying endoscopic gastric biopsies into healthy, gastritis, and malignancy
through the use of FTIR spectroscopy. A total of 103 endoscopic samples,
including 19 cases of cancer, 35 cases of chronic atrophic gastritis, 29 cases
of chronic superficial gastritis, and 20 healthy samples, were investigated by
ATR-FTIR. Significant differences were observed in FTIR spectra of these
four types of gastric biopsies. It was demonstrated that the sensitivity of the
method for healthy, superficial gastritis, atrophic gastritis, and gastric
cancer was 90, 90, 66, and 74%, respectively. It was concluded that FTIR
spectroscopy can be a useful technique for monitoring disease processes in
gastric endoscopic biopsies (48).
Choo et al. (49) applied infrared spectra of human central nervous system
tissue for diagnosis of Alzheimer’s disease (AD). In addition, they presented a
means of classifying the spectroscopic data non-subjectively using several
multivariate methods. The results demonstrated that IR spectroscopy can
potentially be used in the diagnosis of AD from autopsy tissue. It was
shown that correct classification of white and grey matter from brains ident-
ified by standard pathological methods as heavily, moderately, and
minimally involved can be achieved with success rates of greater than 90%
using appropriate methods. Classification of tissue as either control or AD
was achieved with a success rate of 100%.
FTIR spectra of RNA isolated from brain tumor (glioma) and DNA
isolated from low-dose gamma-irradiated epididymis cells of rats from the
Chernobyl accident zone were investigated by Dovbeshko et al. (50). The
aim was to study nucleic acid damage and report on the existence of
damage in the primary, secondary, and tertiary structure of nucleic acid,
which seem to be connected with modification of bases and sugars, and redis-
tribution of the H-bond network. It has also been reported that a great amount
of statistical data and good mathematical approaches are needed for the use of
these data as diagnostic criteria.
FTIR Spectroscopy of Biological Tissues 167
Dow
nloa
ded
by [
Uni
vers
ity o
f Il
linoi
s at
Urb
ana-
Cha
mpa
ign]
at 2
1:27
18
Mar
ch 2
015

Yoshida et al. (51) measured the FTIR spectra of brain microsomal
membranes prepared from rats fed under two dietary oil conditions with
and without brightness-discrimination learning tasks: one group fed a-linole-
nate deficient oil (safflower oil) and the other group fed the sufficient oil
(perilla oil) from mothers to offspring. The infrared spectra of microsomes
under the two dietary conditions without the learning task showed no signifi-
cant difference in the range 1000–3000 cm21. Only after the learning task
were the infrared spectral differences noted between the microsomal
membranes from both groups. Spectral differences were observed mainly in
the absorption bands of fatty acid ester at around 1730 cm21 (sn-2
position), those of phosphate and oligosaccharides in the range of 1050–
1100 cm21, and a band at around 1145 cm21. These results suggest changes
in hydration of membrane surface and modification in oligosaccharide
environment (removal or modification) of microsomes, which may be corre-
lated in part with dietary oil–induced changes in learning performance.
Fukuyama et al. (52) used FTIR microscopy for studying the differences
between oral squamous cell carcinoma and normal mucosa (normal gingival
epithelium or normal subgingival tissue). The tissue spectra were compared
with the purified human collagen and keratin. One half of every tissue
specimen was measured with FTIR and the other half was investigated histo-
logically. The obtained data suggested that this technique is applicable to
clinical diagnostics.
Andrus and Strickland (53) used FTIR spectroscopy for cancer grading.
Freeze-dried tissue samples from lymphoid tumors were studied. The absor-
bance ratio of 1121 cm21/1020 cm21 increased, along with the emergence
of an absorbance pulse at 1121 cm21, with increasing clinicopathological
grade of malignant lymphoma. This study proposed the above ratio as an
index of the cellular RNA/DNA ratio after subtraction of the overlapping
absorbances, if present, due to collagen or glycogen. Absorbance attributable
to collagen increased lymphoma grade and was greater in benign inflamma-
tory tumors than in low-grade lymphomas. It was also suggested that the
ratio trend may form the basis of a universal cancer grading parameter to
assist with cancer treatment decisions and may also be useful in the analysis
of cellular growth perturbation induced by drugs or other therapies.
Mordechai et al. (54) applied FTIR microscpectroscopy for the follow-up
of childhood leukemia chemotherapy. A case study was presented where lym-
phocytes isolated from two children before and after the treatment were
characterized using FTIR microspectroscopy. Significant changes in the
spectral pattern in the 800–1800 cm21 region were found after the
treatment. Preliminary analysis of the spectra revealed that the protein
content decreased in the T-type acute lymphoblastic leukemia (ALL)
patient before the treatment in comparison to the age-matched controls. It
was shown that the chemotherapy treatment results in decreased nucleic
acids, total carbohydrates, and cholesterol contents to a remarkable extent
in both B and T-type ALL patients.
Z. Movasaghi, S. Rehman, and I. ur Rehman168
Dow
nloa
ded
by [
Uni
vers
ity o
f Il
linoi
s at
Urb
ana-
Cha
mpa
ign]
at 2
1:27
18
Mar
ch 2
015
Andrus (55) collected the spectra of various grades of malignant non-
Hodgkin’s lymphoma. Structural changes to lipids and proteins in the wave
number region of 2800–300 cm21, seen as increasing CH3/CH2 ratio and
decreasing symmetric CH2/asymmetric CH2 ratio, were found to occur with
increasing lymphoma grade. Rising ribose content (1121 cm21) was seen to
correlate with rising 996/966 cm21 ratio (an index of RNA/DNA) with
increasing malignancy grade as well. It was concluded that this method can
potentially be applied to clinical cancer grading or in vitro cancer treatment
sensitivity testing.
In another study, Gazi et al. (56), applying FTIR microspectroscopy,
could separate the paraffin-embedded tissues samples of benign and
cancerous prostate. They could also separate the FTIR spectra of prostate
cancer cell lines derived from different metastatic sites. It was found that
the ratio of peak areas of 1030 and 1080 cm21 (corresponding to glycogen
and phosphate vibrations respectively) suggest a potential method for the
differentiation of benign from malignant cells. It should be mentioned that
the tissues were analyzed after mounting onto a BaF2 plate and subsequent
removal wax using CitroclearTM
followed by acetone.
Paluszkiewicz (57) reported on human cancer prostate tissues using FTIR
microspectroscopy and SRIXE techniques. The tissue samples were also
analyzed by a histopathologist. In this research, differences between
cancerous and non-cancerous parts of the analyzed tissues were observed
for both methods.
Argov et al. (58) reported on FTIR microspectroscopic study of inflam-
matory bowel disease (IBD) as an intermediate stage between normal and
cancer. In this work, FTIR microspectroscopy was used to evaluate IBD
cases and to study the IR spectral characteristics with respect to cancer and
normal tissues from formalin-fixed colonic biopsies from patients. IBD
tissues could be segregated from cancer or normal ones using certain par-
ameters such as phosphate content and RNA/DNA ratios. The results
exhibited that FTIR microspectroscopy can detect biochemical changes in
morphologically identical IBD and cancer tissues and suggest which cases
of IBD may require further evaluation for carcinogenesis.
Richter et al. (59) used FTIR spectroscopy in combination with positron
emission tomography to identify the tumor tissues. Thin tissue sections of
human squamous carcinoma from hypopharynx and human colon adenocarci-
noma grown in nude mice were investigated. Tumor tissues could successfully
be identified by FTIR spectroscopy, while it was not possible to accomplish
this with PET alone. On the other hand, PET permitted the noninvasive
screening for suspicious tissues inside the body, which could not be
achieved by FTIR.
Rigas et al. (60) applied FTIR spectroscopy to study the tissue sections of
human colorectal cancer. Pairs of tissue samples from colorectal cancer and
histologically normal mucosa 5–10 cm away from the tumor were obtained
from 11 patients who underwent partial colectomy. All cancer specimens
FTIR Spectroscopy of Biological Tissues 169
Dow
nloa
ded
by [
Uni
vers
ity o
f Il
linoi
s at
Urb
ana-
Cha
mpa
ign]
at 2
1:27
18
Mar
ch 2
015
displayed abnormal spectra compared with the corresponding normal tissues.
These changes involved the phosphate and C-O stretching bands, the CH
stretch region, and the pressure dependence of the CH2 bending and C55O
stretching modes. It was indicated that in colonic malignant tissue, there are
changes in the degree of hydrogen-bonding of (i) oxygen atoms of the
backbone of nucleic acids (increased); (ii) OH groups of serine, tyrosine,
and threonine residues (any or all of them) of cell proteins (decreased); and
(iii) the C55O groups of the acyl chains of membrane lipids (increased). In
addition, it was shown that changes occurred in the structure of proteins and
membrane lipids (as judged by the changes in their ratio of methyl to
methylene groups) and in the packing and the conformational structure of
the methylene chains of membrane lipids.
Rigas and Wong (61) studied seven human colon cell lines by infrared
spectroscopy including study of several spectral parameters under high
pressure (pressure tuning spectroscopy). The seven adenocarcinoma cell lines
displayed almost all of the important spectroscopic features of colon cancer
tissues: (a) increased hydrogen bonding of the phosphodiester groups of
nucleic acids; (b) decreased hydrogen bonding of the C-OH groups of carbo-
hydrates and proteins; (c) a prominent band at 972 cm21; and (d) a shift of
the band normally appearing at 1082 cm21 to 1086 cm21. These cell lines
differed spectroscopically from the colon cancer tissues in that: (a) they
displayed a band at 991 cm21, which is weak in colon tissues; and (b) the
packing and degree of disorder of membrane lipids were close to those
observed in normal colonic tissues. They concluded that these findings (i)
establish IR spectroscopy, used in combination with pressure tuning, as a
useful method to address problems of tumor biology in cell culture systems;
(ii) indicate that these cell lines offer a useful experimental model to explore
the origin of the spectroscopic changes that we observed in colon cancer
tissues; and (iii) support the idea that the malignant colonocyte is the likely
source of all or most spectroscopic abnormalities of human colon cancer.
In vitro viral carcinogenesis was studied by Huleihel (62). In this study,
FTIR microscopy was used to investigate spectral differences between
normal and malignant fibroblasts transformed by retrovirus infection. Signifi-
cant differences were observed between cancerous and normal cells. It was
concluded that the contents of vital cellular metabolites were significantly
lower in the transformed cells than in the normal cells. In addition, as an
attempt to identify cellular components responsible for the spectral dissimila-
rities, they found considerable differences between DNA of normal and
cancerous cells.
In a proof-of-concept study, Mossoba et al. (63) made an investigation on
printing microarrays of bacteria for identification by infrared microscopy.
They used the technique as a tool for rapid bacteria identification and could
demonstrate its effectiveness.
According to a published paper by Naumann (64), FTIR and FT-NIR
Raman spectra of intact microbial cells are highly specific, fingerprint-like
Z. Movasaghi, S. Rehman, and I. ur Rehman170
Dow
nloa
ded
by [
Uni
vers
ity o
f Il
linoi
s at
Urb
ana-
Cha
mpa
ign]
at 2
1:27
18
Mar
ch 2
015
signatures that can be used to (i) discriminate between diverse microbial
species and strains; (ii) detect in situ intracellular components or structures
such as inclusion bodies, storage materials, or endospores; (iii) detect and
quantify metabolically released CO2 in response to various different sub-
stances; and (iv) characterize growth-dependent phenomena and cell drug
interactions. Particularly interesting applications arise by means of a light
microscope coupled to the spectrometer. FT-IR spectra of microcolonies con-
taining less than 103 cells can be obtained from colony replica by a stamping
technique that transfers microcolonies growing on culture plates to a special
IR sample holder. FTIR and FT-NIR Raman spectroscopy can also be used
in tandem to characterize medically important microorganisms.
Dovbeshko et al. (65) carried out an FTIR reflectance study on surface
enhanced IR absorption of nucleic acids from tumor cells. The application of
this method to nucleic acids isolated from tumor cells revealed some possible
peculiarities of their structural organization, namely, the appearance of
unusual sugar and base conformations, modification of the phosphate
backbone, and redistribution of the H-bond net. The spectra of the RNA from
the tumor cells showed more sensitivity to the grade of malignancy than the
spectra of the DNA. After application of the anticancer drug doxorubicin to
sensitive and resistant strains, the DNA isolated from these strains had
different spectral features, especially in the region of the phosphate I and II bands.
Jalkanen et al. (66) used vibrational spectroscopy to study protein and DNA
structure, hydration, and binding of biomolecules, as a combined theoretical and
experimental approach. The systems studied systematically were the amino
acids, peptides, and a variety of small molecules. The goal was to interpret
the experimentally measured vibrational spectra for these molecules to the
greatest extent possible and to understand the structure, function, and electronic
properties of these molecules in their various environments. It was also believed
that the application of different spectroscopic methods to biophysical and
environmental assays is expanding, and therefore a true understanding of the
phenomenon from a rigorous theoretical basis is required.
FTIR and NIR-FT Raman spectral features of the anti-cancer drug com-
bretastatin-A4 were studied by Binoy et al. (67). The vibrational analysis
showed that the molecule exhibits similar geometric behavior as cis-stilbene
and has undergone steric repulsion resulting in phenyl ring twisting with
respect to the ethylenic plane.
Faolin et al. (68) carried out a study examining the effects of tissue pro-
cessing on human tissue sections using vibrational spectroscopy. This study
investigated the effect of freezing, formalin fixation, wax embedding, and
dewaxing. Spectra were recorded from tissue sections to examine biochemical
changes before, during, and after processing with both Raman and FTIR spec-
troscopy. New peaks due to freezing and formalin fixation as well as shifts in
the amide bands resulting from changes in protein conformation and possible
cross-links were found. Residual wax peaks were observed clearly in the
Raman spectra. In the FTIR spectra a single wax contribution was seen,
FTIR Spectroscopy of Biological Tissues 171
Dow
nloa
ded
by [
Uni
vers
ity o
f Il
linoi
s at
Urb
ana-
Cha
mpa
ign]
at 2
1:27
18
Mar
ch 2
015
which may contaminate the characteristic CH3 deformation band in biological
tissue. This study confirmed that formalin-fixed paraffin processed (FFPP)
sections have diagnostic potential.
Sahu and Mordechai (69) studied FTIR spectroscopy in cancer detection.
The areas of focus were the distinction of premalignant and malignant cells
and tissues from their normal state using specific parameters obtained from
the spectra. It was concluded that while the method still requires pilot
studies and designed clinical trials to ensure the applicability of such
systems for cancer diagnosis, substantial progress has been made in incorpor-
ating advances in computational into the system to increase the sensitivity of
the entire setup, making it an objective and sensitive technique suitable for
automation to suit the demands of the medical community.
THE CHARACTERISTIC PEAK FREQUENCIES
It is believed that accurate peak definitions can have significant influence on
reliability of the results provided through different spectroscopic techniques.
Studies reported to date in the literature indicate that most of the scientists
have mainly used the previously published articles in order to define the
data acquired from the spectra collected. However, without having a
reliable and detailed database that can cover most of the required peaks in
the spectral range, it would be a time-consuming task to find the meanings
of different unknown peak intensities. In biological studies, for instance,
where a wide range of chemical bands and functional groups can be attributed
to every single peak, finding appropriate meanings, which can demonstrate the
clinical importance of the technique and achieved results, can be one of the
most important steps in finalizing a spectroscopic research work. As a
result, and with the aim of putting these shortages aside, a wide range of
most frequently seen peaks in FTIR studies are presented in Table 1.
SUMMARY
FTIR spectroscopy has become a well-accepted and widely used method to
characterize biological tissues. The technique of FTIR spectroscopy has
become a technique of choice for scientists interested in finding the chemical
structural properties of natural and synthetic tissues. Not surprisingly, an
increasing number of research groups is showing interest in applying FTIR
spectroscopy for different objectives and methodologies, and a considerable
amount of time and financial resources are being allocated to this area. The
information presented in this review can result in significant savings, particu-
larly in terms of time that scientists, especially the non-spectroscopists, have
to spend for defining spectral data. The literature compiled in this review will
help in precise and speedy interpretation of the spectral data. The tabulated
Z. Movasaghi, S. Rehman, and I. ur Rehman172
Dow
nloa
ded
by [
Uni
vers
ity o
f Il
linoi
s at
Urb
ana-
Cha
mpa
ign]
at 2
1:27
18
Mar
ch 2
015
part, which is the main and comprehensive part of this article, is presented in a
way that will surely make it easy to follow for researchers and will help in
understanding the important characteristic peaks that are present in FTIR
spectra of biological tissues. It is envisaged that considering the type of
samples being investigated and the chemical bands and functional groups that
can possibly exist in the samples, the peak frequencies can be located in the
table, and the appropriate interpretations could be made with confidence. Fur-
thermore, having a detailed knowledge of the list of peaks that can be
assigned to different biochemical compounds (such as lipids, proteins, or
nucleic acids) would lead to a better correlation between the chemical structural
and the medical aspects of spectroscopy. The lipid contents and the chemical
structure of these compounds can be evaluated using peak frequencies at
2956 cm21 (asymmetric stretching vibration of CH3 of acyl chains),
2922 cm21 (asymmetric stretching vibration of CH2 of acyl chains),
2874 cm21 (symmetric stretching vibration of CH3 of acyl chains),
2852 cm21 (symmetric stretching vibration of CH2 of acyl chains), and
1600–1800 cm21 (C55O stretching). The specifications of protein contents of
biological samples can also be understood from 1717 cm21 (amide I, arising
from C55O stretching vibration), 1500–600 cm21 (amide II, N-H bending
vibration coupled to C-N stretching), and 1220–1350 cm21 (amide III, C-N
stretching and N-H in plane bending, often with significant contributions
from CH2 wagging vibrations). The peaks related to nucleic acids are as
follows: 1717 cm21 (C55O stretching vibration of purine base), 1666 cm21
(C55O stretching vibration of pyrimidine base), 1220–1240 cm21 (asymmetric
PO22 stretching), 1117 cm21 (C-O stretching vibration of C-OH group of
ribose), 1040–100 cm21 (symmetric stretching of phosphate groups of phos-
phodiester linkages), and 1050–70 cm21 (C-O-C stretching) (21). However,
it would be more useful to have further and continuous review of this field to
improve this work on regular basis and to keep it updated to prepare a unique
database that can be used for different methodologies. In addition to the
different research topics being covered on a regular basis, this review may
provide significant assistance not only to spectroscopists but also in areas
related to biomaterials sciences, chemistry, and tissue engineering.
REFERENCES
1. Mahadevan-Jansen, A. and Richards-Kortum, R. (1997) Raman spectroscopy forcancer detection, 19th Int. Conf. IEEE EMBS, Chicago, Oct 30–Nov 2.
2. Hanlon, E.B., Manoharan, R., Koo, T.-W., Shafer, K.E., Motz, J.T.,Fitzmaurice, M., Kramer, J.R., Itzkan, I., Dasari, R.R., and Feld, M.S. (2000)Prospects for in vivo Raman spectroscopy. Physics in Medicine and Biology,45: 1–59.
3. Dukor, R.K. (2002) Vibrational spectroscopy in the detection of cancer. Biomedi-cal Applications, 5: 3335–3359.
FTIR Spectroscopy of Biological Tissues 173
Dow
nloa
ded
by [
Uni
vers
ity o
f Il
linoi
s at
Urb
ana-
Cha
mpa
ign]
at 2
1:27
18
Mar
ch 2
015

4. Choo-Smith, L.-P., Edwards, H.G.M., Endtz, H.P., Kros, J.M., Heule, F., Barr, H.,
Robinson, J.S., Jr., Bruining, H.A., and Pupells, G.J. (2002) Medical applications
of Raman spectroscopy: from proof of principle to clinical implementation. Biopo-
lymers (Biospectroscopy), 67: 1–9.
5. Swinson, B., Jerjes, W., El-Maaytah, M., Norris, P., and Hopper, C. (2002) Optical
techniques in diagnosis of head and neck malignancy. Oral Oncology, 42:221–228.
6. Shaw, R.A. and Mantsch, H.H. (1999) Vibrational biospectroscopy: from plants to
animals to humans. A historical perspective. Journal of Molecular Structure,
480–481: 1–13.
7. Petrich, W. (2001) Mid-infrared and Raman spectroscopy for medical diagnostics.
Applied Spectroscopy Reviews, 36 (2&3): 181–237.
8. Zeng, H., McWilliams, A., and Lam, S. (2004) Optical spectroscopy and imaging
for early lung cancer detection: a review. Photodiagnosis and Photodinamic
Therapy, 1: 111–122.9. Parker, M.F. (2005) Emerging technology in cervical cancer screening: spec-
troscopy. Clinical Obstetrics and Gynecology, 48 (1): 209–217.
10. Dekker, E. and Fockens, P. (2005) Advances in colonic imaging: new endoscopic
imaging methods. European Journal of Gasteroenterology and Hepatology,
17 (8): 803–808.
11. Demos, S.G., Vogel, A.J., and Gandjbakhche, A.H. (2006) Advances in optical
spectroscopy and imaging of breast lesions. Journal of Mammary Gland
Biology, 11: 165–181.
12. Pitt, G.D., Batchelder, D.N., Bennett, R., Bormett, R.W., Hayward, I.P.,Smith, B.J.E., Williams, K.P.J., Yang, Y.Y., Baldwin, K.J., and Webster, S.
(2005) Engineering aspects and applications of the new Raman instrumentation.
IEE Proceedings-Science, Measurement and Technology, 152 (6): 241–318.
13. Ellis, D.I. and Goodacre, R. (2006) Metabolic fingerprinting in disease diagnosis:
biomedical applications of infrared and Raman spectroscopy. Analyst, 131:
875–885.
14. Choo-Smith, L.P., Maquelin, K., van Vreeswijk, T., Bruining, H.A., Puppels, G.J.,
Ngo Thi, N.A., Kirschner, C., Naumann, D., Ami, D., Villa, A.M., Orsini, F.,
Doglia, S.M., Lamfarraj, H., Sockalingum, G.D., Manfait, M., Allouch, P., andEndtz, H.P. (2001) Investigating microbial (micro)colony heterogeneity by
vibrational spectroscopy. Applied Environironmental Microbiology, 67 (4):
1461–1469.
15. Kidder, L.H., Colarusso, P., Stewart, S.A., Levin, I.W., Appel, N.M., Lester, D.S.,
Pentchev, P.G., and Lewis, E.N. (1999) Infrared spectroscopic imaging of the bio-
chemical modifications induced in the cerebellum of the Niemann–Pick type C
mouse. Journal of Biomedical Optics, 4 (1): 7–13.
16. Kang, G.S., Ko, H.J., and Choi, C.K. (2003) Chemical bond structure of a-C:F
films with a low dielectric constant deposited by using CH4/CF4 ICPCVD.
Journal of the Korean Physical Society, 42 (5): 676–681.17. Hofman, M., Pasieczna, S., Wachowski, L., and Ryczkowski, J. (2006) Speciation
of functional groups formed on the surface of carbonaceous materials modified by
NO. Journal of Physics IV France, 137: 287–290.
18. Movasaghi, Z., Rehman, S., and Rehman, I.U. (2007) Raman spectroscopy of bio-
logical tissues. Applied Spectroscopy Reviews, 42 (5): 493–541.
19. Mandeville, C.W., Webster, J.D., Rutherford, M.J., Taylor, B.E., Timbal, A., and
Faure, K. (2002) Determination of molar absorptivities for infrared absorption
bands of H2O in andesitic glasses. American Mineralogist, 87: 813–821.
Z. Movasaghi, S. Rehman, and I. ur Rehman174
Dow
nloa
ded
by [
Uni
vers
ity o
f Il
linoi
s at
Urb
ana-
Cha
mpa
ign]
at 2
1:27
18
Mar
ch 2
015
20. Seaman, S.J., Dyar, M.D., Marinkovic, N., and Dunbar, N.W. (2006) An FTIR
study of hydrogen in anorthoclase and associated melt inclusions. American
Mineralogist, 91: 12–20.
21. Fabian, H., Jackson, M., Murphy, L., Watson, P.H., Fichtner, I., and Mantsch, H.H.
(1995) A comparative infrared spectroscopic study of human breast tumors and
breast tumor cell xenografts. Biospectroscopy, 1 (1): 37–45.22. Conroy, J., Ryder, A.G., Leger, M.N., Hennessey, K., and Madden, M.G. (2005)
Qualitative and quantitative analysis of chlorinated solvents using Raman Spec-
troscopy and machine learning. Proceedings of the International Society of
Optical Engineers, 5826: 131–142.
23. Alfano, R.R., Tang, G.C., Pradhan, A., Lam, W., Choy, D.S.J., and Opher, E.
(1987) Optical spectroscopic diagnosis of cancer and normal breast tissues.
Journal of the Optical Society of America B, 1987, 6 (5): 1015..
24. Wood, B.R., Quinn, M.A., Burden, F.R., and McNaughton, D. (1996) An investi-
gation into FT-IR spectroscopy as a bio-diagnostic tool for cervical cancer. Bios-pectroscopy, 2: 143–153.
25. Chiriboga, L., Xie, P., Yee, H., Vigorita, V., Zarou, D., Zakim, D., and Diem, M.
(1998) Infrared spectroscopy of human tissue. I. Differentiation and maturation of
epithelial cells in the human cervix. Biospectroscopy, 4: 47–53.
26. Wood, B.R., Quinn, M.A., Tait, B., Ashdown, M., Hislop, T., Romeo, M., and
McNaughton, D. (1998) FTIR microspectroscopic study of cell types and
potential confounding variables in screening for cervical malignancies. Biospec-
troscopy, 4: 75–91.
27. Sindhuphak, R., Issaravanich, S., Udomprasertgul, V., Srisookho, P.,Warakamin, S., Sindhuphak, S., Boonbundarlchai, R., and Dusitsin, N. (2003)
A new approach for the detection of cervical cancer in Thai women. Gynecologic
Oncology, 90: 10–14.
28. Mordechai, S., Sahu, R.K., Hammody, Z., Mark, S., Kantarovich, K.,
Guterman, H., Podshyvalov, J., Goldstein, J., and Argov, S. (2004) Possible
common biomarkers from FTIR microspectroscopy of cervical cancer and
melanoma. Journal of Microscopy, 215 (1): 86–91.
29. Chiriboga, L., Xie, P., Vigorita, V., Zarou, D., Zakin, D., and Diem, M. (1998)
Infrared spectroscopy of human tissue. II. A comparative study of spectra ofbiopsies of cervical squamous epithelium and of exfoliated cervical cells. Biospec-
troscopy, 4: 55–59.
30. Wong, P.T.T., Lacelle, S., Fung, M.F.K., Senterman, M., and Mikhael, N.Z. (1995)
Characterization of exfoliated cells and tissues from human endocervix and ecto-
cervix by FTIR and ATR/FTIR spectroscopy. Biospectroscopy, 1 (5): 357–364.
31. Fung, M.F.K., Senterman, M.K., Mikhael, N.Z., Lacelle, S., and Wong, P.T.T.
(1996) Pressure-tuning fourier transform infrared spectroscopic study of carcino-
genesis in human endometrium. Biospectroscopy, 2: 155–165.
32. Utzinger, U.R.S., Heintzelman, D.L., Mahadevan-Jansen, A., Malpica, A.,
Follen, M., and Richards-Kortum, R. (2001) Near-infrared Raman spectroscopyfor in vivo detection of cervical precancers. Applied Spectroscopy, 55 (8):
955–959.
33. Wang, H.P., Wang, H.-C., and Huang, Y.-J. (1997) Microscopic FTIR studies of
lung cancer cells in pleural fluid. Science of the Total Environment, 204: 283–287.
34. Yano, K., Ohoshima, S., Grotou, Y., Kumaido, K., Moriguchi, T., and
Katayama, H. (2000) Direct measurement of human lung cancerous and noncan-
cerous tissues by fourier transform infrared microscopy: can an infrared micro-
scope be used as a clinical tool? Analytical Biochemistry, 287: 218–225.
FTIR Spectroscopy of Biological Tissues 175
Dow
nloa
ded
by [
Uni
vers
ity o
f Il
linoi
s at
Urb
ana-
Cha
mpa
ign]
at 2
1:27
18
Mar
ch 2
015
35. Yang, Y., Sule-Suso, J., Sockalingum, G.D., Kegelaer, G., Manfait, M., and El
Haj, A.J. (2005) Study of tumor cell invasion by Fourier transform infrared micro-
spectroscopy. Biopolymers, 78: 311–317.
36. Eckel, R., Huo, H., Guan, H.-W., Hu, X., Che, X., and Huang, W.-D. (2001)
Characteristic infrared spectroscopic patterns in the protein bands of human
breast cancer tissue. Vibrational Spectroscopy, 27: 165–173.
37. Kline, N.J. and Treado, P.J. (1997) Raman chemical imaging of breast tissue.
Journal of Raman Spectroscopy, 28: 119–124.
38. Shafer-Peltier, K.E., Haka, A.S., Fitzmaurice, M., Crowe, J., Dasar, R.R., and
Feld, M.S. (2002) Raman microspectroscopic model of human breast tissue: impli-
cations for breast cancer diagnosis in vivo. Journal of Raman Spectroscopy, 33:
552–563.
39. Frank, C.J., McCreecy, R.L., and Redd, D.C.B. (1995) Raman spectroscopy of
normal and diseased human breast tissues. Analytical Chemistry, 67: 777–783.
40. Sukuta, S. and Bruch, R. (1999) Factor analysis of cancer Fourier transform
infrared evanescent wave fiberoptical (FTIR-FEW) spectra. Lasers in Surgery
and Medicine, 24: 382–388.
41. Wong, P.T.T., Goldstein, S.M., Grekin, R.C., Godwin, T.A., Pivik, C., and
Rigas, B. Distinct infrared spectroscopic patterns of human basal cell
carcinoma. Cancer Research, 53 (4): 762–765.
42. Lucassen, G.W., Van Veen, G.N., and Jansen, J.A. (1998) Band analysis of
hydrated human skin stratum corneum attenuated total reflectance Fourier
transform infrared spectra in vivo. Journal of Biomedical Optics, 3: 267–280.
43. McIntosh, L.M., Jackson, M., Mantsch, H.H., Stranc, M.F., Pilavdzic, D., and
Crowson, A.N. (1999) Infrared spectra of basal cell carcinomas are distinct from
non-tumor-bearing skin components. Journal of Investigative Dermatology, 112:
951–956.
44. Barry, B.W., Edwards, H.G.M., and Williams, A.C. (1992) Fourier transform
Raman and infrared vibrational study of human skin: assignment of spectral
bands. Journal of Raman Spectroscopy, 23: 641–645.
45. Fujioka, N., Morimoto, Y., Arai, T., and Kikuchi, M. (2004) Discrimination
between normal and malignant human gastric tissues by Fourier transform
infrared spectroscopy. Cancer Detection & Prevention, 28: 32–36.
46. Weng, S.F., Ling, X.F., Song, Y.Y., Xu, Y.Z., Li, W.H., Zhang, X., Yang, L.,
Sun, W., Zhou, X., and Wu, J. (2000) FT-IR fiber optics and FT-Raman
spectroscopic studies for the diagnosis of cancer. American Clinical Laboratory,
19 (7): 20.
47. Mordechai, S., Salman, A.O., Argov, S., Cohen, B., Erukhimovitch, V.,
Goldstein, J., Chaims, O., and Hammody, Z. (2000) Fourier-transform infrared
spectroscopy of human cancerous and normal intestine. Proceedings of the
SPIE, 3918: 66–77.
48. Li, Q.B., Sun, X.J., Xu, Y.Z., Yang, L.M., Zhang, Y.F., Weng, S.F., Shi, J.S., and
Wu, J.G. (2005) Diagnosis of gastric inflammation and malignancy in endoscopic
biopsies based on Fourier transform infrared spectroscopy. Clinical Chemistry,
51 (2): 346–350.
49. Choo, L.-P., Mansfield, J.R., Pizzi, N., et al. (1995) Infrared spectra of human
central nervous system tissue: Diagnosis of Alzheimer’s disease by multivariate
analyses. Biospectroscopy, 1 (2): 141–148.
50. Dovbeshko, G.I., Gridina, N.Y., Kruglova, E.B., and Pashchuk, O.P. (1997) FTIR
spectroscopy studies of nucleic acid damage. Talanta, 53: 233–246.
Z. Movasaghi, S. Rehman, and I. ur Rehman176
Dow
nloa
ded
by [
Uni
vers
ity o
f Il
linoi
s at
Urb
ana-
Cha
mpa
ign]
at 2
1:27
18
Mar
ch 2
015
51. Yoshida, S., Miyazaki, M., Sakai, K., Takeshita, M., Yuasa, S., Sato, A.,
Kobayashi, T., Watanabe, S., and Okuyama, H. (1997) Fourier transform
infrared spectroscopic analysis of rat brain microsomal membranes modified by
dietary fatty acids: possible correlation with altered learning behavior. Biospectro-
scopy, 3 (4): 281–290.
52. Fukuyama, Y., Yoshida, S., Yanagisawa, S., and Shimizu, M. (1999) A study on
the differences between oral squamous cell carcinomas and normal oral mucosas
measured by Fourier transform infrared spectroscopy. Biospectroscopy, 5:
117–126.
53. Andrus, P.G.L. and Strickland, R.D. (1998) Cancer grading by Fourier transform
infrared spectroscopy. Biospectroscopy, 4: 37–46.
54. Mordechai, S., Mordechai, J., Ramesh, J., Levi, C., Huleihel, M.,
Erukhimovitch, V., Moser, A., and Kapelushnik, J. (2001) Application of FTIR
microspectroscopy for the follow-up of childhood leukaemia chemotherapy, Pro-
ceedings of SPIE Subsurface and Surface Sensing Technologies and Applications
III, 4491: 243–250.
55. Andrus, P.G. (2006) Cancer monitoring by FTIR spectroscopy. Technology in
Cancer Research and Treatment, 5 (2): 157–167.
56. Gazi, E., Dwyer, J., Gardner, P., Ghanbari-Siakhani, A., Wde, A.P., Lockyer, N.P.,
Vickerman, J.C., Clarke, N.W., Shanks, J.H., Scott, L.J., Hart, C.A., and
Brown, M. (2003) Applications of Fourier transform infrared microspectroscopy
in studies of benign prostate and prostate cancer. A pilot study. Journal of
Pathology, 201: 99–108.
57. Paluszkiewicz, C. and Kwiatek, W.M. (2001) Analysis of human cancer prostate
tissues using FTIR microscopy and SXIXE techniques. Journal of Molecular
Structure, : 565–566, 329–334.
58. Argov, S., Sahu, R.K., Bernshtain, E., Salam, A., Shohat, G., Zelig, U., and
Mordechai, S. (2004) Inflammatory bowel diseases as an intermediate stage
between normal and cancer: a FTIR-microspectroscopy approach. Biopolymers,
75: 384–392.
59. Richter, T., Steiner, G., Abu-Id, M.H., Salzer, R., Gergmann, R., Rodig, H., and
Johannsen, B. (2002) Identification of tumor tissue by FTIR spectroscopy in com-
bination with positron emission tomography. Vibrational Spectroscopy, 28:
103–110.
60. Rigas, B., Morgello, S., Goldman, I.S., and Wong, P.T.T. (1999) Human colorectal
cancers display abnormal Fourier-transform infrared spectra, Proceedings of the
National Academy of Sciences USA, 87: 8140–8144.
61. Rigas, B. and Wong, P.T.T. (1992) Human colon adenocarcinoma cell lines
display infrared spectroscopic features of malignant colon tissues. Cancer
Research, 52: 84–88.
62. Huleihel, M., Salman, A., Erukhimovich, V., Ramesh, J., Hammody, Z., and
Mordechai, S. (2002) Novel optical method for study of viral carcinogenesis in
vitro. Journal of Biochemical and Biophysical Methods, 50: 111–121.
63. Mossoba, M.M., Al-Khaldi, S.F., Kirkwood, J., Fry, F.S., Sedman, J., and
Ismail, A.A. (2005) Printing microarrays of bacteria for identification by
infrared microspectroscopy. Vibrational Spectroscopy, 38: 229–235.
64. Naumann, D. (1998) Infrared and NIR Raman spectroscopy in medical micro-
biology 3257: 245–257.
65. Dovbeshko, G.I., Chegel, V.I., Gridina, N.Y., Repnytska, O.P., Shirshov, Y.M.,
Tryndiak, V.P., Todor, I.M., and Solyanik, G.I. (2002) Surface enhanced IR
FTIR Spectroscopy of Biological Tissues 177
Dow
nloa
ded
by [
Uni
vers
ity o
f Il
linoi
s at
Urb
ana-
Cha
mpa
ign]
at 2
1:27
18
Mar
ch 2
015

absorption of nucleic acids from tumor cells: FTIR reflectance study. Biopolymer
(Biospectroscopy), 67: 470–486.
66. Jalkanen, K.J., Wurtz Jurgensen, V., Claussen, A., Rahim, A., Jensen, G.M.,
Wade, R.C., Nardi, F., Jung, C., Degtyarenko, I.M., Nieminen, R.M.,
Herrmann, F., Knapp-Mohammady, M., Niehaus, T.A., Frimand, K., and
Suhai, S. (2006) Use of vibrational spectroscopy to study protein and DNAstructure, hydration, and binding of biomolecules: A combined theoretical and
experimental approach. Journal of Quantum Chemistry, 106: 1160–1198.
67. Binoy, J., Abraham, J.P., Joe, I.H., Jayakumar, V.S., Petit, G.R., and Nielsen, O.F.
(2004) NIR-FT Raman and FT-IR spectral studies and ab initio calculations of the
anti-cancer drug combretastatin-A4. Journal of Raman Spectroscopy, 35:
939–946.
68. Faolain, E.O., Hunter, M.B., Byrne, J.M., Kelehan, P., McNamer, M., Byrne, H.J.,
and Lyng, F.M. (2005) A study examining the effects of tissue processing on
human tissue sections using vibrational spectroscopy. Vibrational Spectroscopy,38: 121–127.
69. Sahu, P.K. and Mordechai, S. (2005) Fourier transform infrared spectroscopy in
cancer detection. Future Oncology, 1: 635–647.
70. Pleshko, N.L., Boskey, A.L., and Mendelsohn, R. (1991) An FT-IR microscopic
investigation of the effects of tissue preservation on bone. Calcified Tissue Inter-
national, 51 (1): 72–77.
71. Holman, H.Y.N., Martin, M.C., and McKinney, W.R. (2003) Synchrotron-based
FTIR spectromicroscopy: cytotoxicity and heating considerations. Journal of Bio-
logical Physics, 29 (2–3): 275–286.72. Budevska, B.O., Sum, S.T., and Jones, T.J. (2003) Application of multivariate
curve resolution for analysis of FT-IR microspectroscopic images of in situ
plant tissue. Applied Spectroscopy, 57: 124–131.
73. Kleiner, O., Ramesh, J., Huleihel, M., Cohen, B., Kantarovich, K., Levi, C.,
Polyak, B., Marks, R.S., Mordehai, J., Cohen, Z., and Mordechai, S. (2002) A com-
parative study of gallstones from children and adults using FTIR spectroscopy and
fluorescence microscopy. BMC Gastroenterology, 2: 3.
74. Tarumi, M., Shimada, M., Murakami, T., Tamura, M., Shimada, M., Arimoto, H.,
and Yamada, Y. (2003) Simulation study of in vitro glucose measurement by NIRspectroscopy and a method of error reduction. Physics in Medicine and Biology,
48: 2373–2390.
75. Smith, R. and Rehman, I.U. (1994) Fourier transform Raman spectroscopic studies
of human bone. Journal of Material Science; Materials in Medicine, 5 (9&10):
775–778.
76. Schulz, H. and Baranska, M. (2007) Identification and qualification of valuable
plant substances by IR and Raman spectroscopy. Vibrational Spectroscopy, 43:
13–25.
77. Chiang, H.-P., Song, R., Mou, B., Li, K.P., Chiang, P., Wang, D., Tse, W.S., and
Ho, L.T. (1999) Fourier transform Raman spectroscopy of carcinogenic polycyclicaromatic hydrocarbons in biological systems: binding to heme proteins. Journal of
Raman Spectroscopy, 30: 551–555.
78. Farguharson, S., Shende, C., Inscore, F.E., Maksymiuk, P., and Gift, A. (2005)
Analysis of 5-fluorouracil in saliva using surface-enhanced Raman spectroscopy.
Journal of Raman Spectroscopy, 36: 208–212.
79. Li, X., Lin, J., Ding, J., Wang, S., Liu, Q., and Qing, S. (2004) Raman spectroscopy
and fluorescence for the detection of liver cancer and abnormal liver tissue, Annual
Inter Conf IEEE EMBS, San Francisco, September 1–5.
Z. Movasaghi, S. Rehman, and I. ur Rehman178
Dow
nloa
ded
by [
Uni
vers
ity o
f Il
linoi
s at
Urb
ana-
Cha
mpa
ign]
at 2
1:27
18
Mar
ch 2
015
80. Hanlon, E.B., Manoharan, R., Koo, T.-W., Shafer, K.E., Motz, J.T.,Fitzmaurice, M., Kramer, J.R., Itzkan, I., Dasari, R.R., and Feld, M.S. (2000)Prospects for in vivo Raman spectroscopy. Physics in Medicine and Biology,45: 1–59.
81. Shetty, G., Kedall, C., Shepherd, N., Stone, N., and Barr, H. (2006) Raman spec-troscopy: evaluation of biochemical changes in carcinogenesis of oesophagus.British Journal of Cancer, 94: 1460–1464.
82. Wood, B.R., Quinn, M.A., Burden, F.R., and McNaughton, D. (1996) An investi-gation into FT-IR spectroscopy as a bio-diagnostic tool for cervical cancer. Bios-pectroscopy, 2: 143–153.
83. Wu, J.-G., Xu, Y.-Z., Sun, C.-W., Soloway, R.D., Xu, D.-F., Wu, Q.-G.,Sun, K.-H., Weng, S.-F., and Xu, G.-X. (2001) Distinguishing malignant fromnormal oral tissues using FTIR fiber-optic techniques. Biopolymer (Biospectro-scopy), 62: 185–192.
84. Wong, P.T.T., Papavassiliou, E.D., and Rigas, B. (1991) Phosphodiester stretchingbands in the infrared spectra of human tissues and cultured cells. Applied Spec-troscopy, 45: 1563–1567.
85. Huang, Z., McWilliams, A., Lui, M., McLean, D.I., Lam, S., and Zeng, H. (2003)Near-infrared Raman spectroscopy for optical diagnosis of lung cancer. Inter-national Journal of Cancer, 107: 1047–1052.
86. Stone, N., Kendall, C., Smith, J., Crow, P., and Barr, H. (2004) Raman spec-troscopy for identification of epithelial cancers. Faraday Discussions, 126:141–157.
87. Agarwal, R., Tandon, P., and Gupta, V.D. (2006) Phonon dispersion in poly(dimethylsilane). Journal of Organometallic Chemistry, 691: 2902–2908.
88. Laska, J. and Widlarz, J. (2005) Spectroscopic and structural characterization ofloe molecular weight fractions of polyaniline. Polymer, 46: 1485–1495.
89. Lau, D.P., Huang, Z., Lui, H., Man, C.S., Berean, K., Morrison, M.D., andZeng, H. (2003) Raman spectroscopy for optical diagnosis in normal andcancerous tissue of the nasopharynx—Preliminary findings. Lasers in Surgeryand Medicine, 32: 210–214.
90. Frank, C.J., McCreecy, R.L., and Redd, D.C.B. (1995) Raman spectroscopy ofnormal and diseased human breast tissues. Analytical Chemistry, 67: 777–783.
91. Ruiz-Chica, A.J., Medina, M.A., Sanchez-Jimenez, F., and Ramirez, F.J. (2004)Characterization by Raman spectroscopy of conformational changes on guanine-cytosine and adenine-thymine oligonucleotides induced by aminooxy analoguesof spermidine. Journal of Raman Spectroscopy, 35: 93–100.
FTIR Spectroscopy of Biological Tissues 179
Dow
nloa
ded
by [
Uni
vers
ity o
f Il
linoi
s at
Urb
ana-
Cha
mpa
ign]
at 2
1:27
18
Mar
ch 2
015


