Embed Size (px)
Citation preview

www.wjpps.com Vol 7, Issue 5, 2018.
1535
Ashok et al. World Journal of Pharmacy and Pharmaceutical Sciences
FORMULATION AND EVALUATION OF DARIFENACIN HBr
EXTENDED RELEASE TABLETS
Vadiyala Ashok* and A. Seetha Devi
Department of Pharmaceutics, Hindu College of Pharmacy, Amaravathi Road, Guntur,
Andhra Pradesh, India-522002.
ABSTRACT
The objective of this study was to develop and evaluate Darifenacin
Hydro bromide Extended Release matrix tablet by using various grades
and ratios of hydroxy propyl methyl cellulose (HPMC), Xanthan gum,
Ethyl cellulose as rate controlling hydrophilic polymers and
bioequivalent testing with the innovator ENABLEX (prepared by
Novartis Pharma, Europe). The drug was compatible with the
formulation components. Hence Lactose Anhydrous, Di calcium
Phosphate (DC grade), Xanthan gum, Ethyl cellulose, HPMCK4M,
HPMCK100M, opadry orange were selected as excipients for the lab
scale development. Blends were evaluated for various parameters such
as bulk density, tapped density, Carr’s index, Hausner’s ratio and the
parameters evaluated for the matrix tablet are Drug content, hardness,
Friability, weight variation and Thickness and all physicochemical properties are within the
limits. Drug release from tablets complies with the prescribed limits. Formulation
development from F1 to F13 was executed to optimize the composition. At the final, the
dissolution profile of the batches F11 was closer with the reference product. The stability
studies were performed for the optimized formulation F11 at the accelerated conditions
(400C/75% RH) for two months and at stress conditions (60
0C/90% RH) for one month. The
results were indicated that all results were in limits after two months period. Hence the
optimized formulation F11 was stable. Finally the combinations of high viscous and low
viscous hydroxy propyl methyl cellulose polymers were used to develop a optimized formula
that was similar with the innovators product ENABLEX.
WORLD JOURNAL OF PHARMACY AND PHARMACEUTICAL SCIENCES
SJIF Impact Factor 7.421
Volume 7, Issue 5, 1535-1554 Research Article ISSN 2278 – 4357
Article Received on
17 March 2018,
Revised on 07 April 2018,
Accepted on 28 April 2018
DOI: 10.20959/wjpps20185-11615
*Corresponding Author
Vadiyala Ashok
Department of
Pharmaceutics, Hindu
College of Pharmacy,
Amaravathi Road, Guntur,
Andhra Pradesh, India-
522002.

www.wjpps.com Vol 7, Issue 5, 2018.
1536
Ashok et al. World Journal of Pharmacy and Pharmaceutical Sciences
KEYWORDS: Darifenacin Hydro bromide, Extended Release Tablets, Dissolution profile,
Controlled Release Polymers.
1. INTRODUCTION
ORAL DRUG DELIVERY
Oral drug delivery has been known for decades as the most widely utilized route of
administration among all the routes that has been explored for the systemic delivery of drugs
via various pharmaceutical products of different dosage form. Nowadays most of the
pharmaceutical scientists are involved in developing an ideal DDS. This ideal system should
have advantage of single dose for whole duration of the treatment and it should deliver the
drug directly at specific site. Scientists have succeeded to develop a system that can be as
near to an ideal system and it encourages the scientists to develop controlled release system[1-
3].
Extended Release Dosage Forms
It is defined as the one that allows at least a twofold reduction in dosing frequency as
compared to that of conventional dosage forms. Extended release (ER) dosage forms release
drug slowly, so that plasma concentrations are maintained at a therapeutic level for a
prolonged period of time (usually between 8 and 24 hours). Extended release oral drug
formulations have been used since the 1960s to enhance performance and increase patient
compliance. By incorporating the dose for 24hrs into one tablet from which the drug is slowly
released, peaks of high plasma concentration and troughs of low plasma concentrations can
be prevented. This helps to avoid the side effects associated with high concentration and lack
of activity associated with low plasma concentrations-giving better overall therapy. In
addition, in the treatment of diseases that is asymptomatic-such as hypertension-patients
generally remember morning and evening medication, but tend to forgot doses in between.
Once or twice daily dosing thus improves therapy through the constant presence of the drug[4-
6].
TYPES OF EXTENDED RELEASE PRODUCTS[6-9]
General approaches to manufacturing an extended-release drug product include the use of a
matrix structure in which the drug is suspended or dissolved, the use of a rate-controlling
membrane through which the drug diffuses, or a combination of both. Among the many types
of commercial preparations available, none works by a single drug-release mechanism. Most
extended-release products release drug by a combination of processes involving dissolution,

www.wjpps.com Vol 7, Issue 5, 2018.
1537
Ashok et al. World Journal of Pharmacy and Pharmaceutical Sciences
permeation, and diffusion. The single most important factor is water permeation, without
which none of the product release mechanisms would operate. Controlling the rate of water
influx into the product generally dictates the rate at which the drug dissolves. Once the drug
is dissolved, the rate of drug diffusion may be further controlled to a desirable rate. Table
shows some common extended-release product examples and the mechanisms for controlling
drug release, and lists the compositions for some drugs.
Table-1: Examples of Oral Extended-Release Products.[10]
Type Trade Name Rationale
Erosion tablet
Constant-T Theophylline
Tenuate Dospan Diethylpropion HCl dispersed in hydrophilic matrix
Tedral SA
Combination product with a slow-erosion component
(theophylline, ephedrine HCl) and an initial-release
component theophylline, ephedrine HCl,
Phenobarbital)
Waxy matrix tablet Kaon Cl Slow release of potassium chloride to reduce GI
irritation
Coated pellets in
capsule Ornade spansule
Combination phenyl propanolamine HCl and
chlorpheniramine with initial- and extended-release
component
Pellets in tablet Theo-Dur Theophylline
Leaching
Ferro-Gradumet
(Abbott)
Ferrous sulfate in a porous plastic matrix that is
excreted in the stool; slow release of iron decreases GI
irritation
Desoxyn
gradumet tablet
(Abbott)
Methamphetamine methylacrylate methyl methacrylate
copolymer, povidone, magnesium stearate; the plastic
matrix is porous
Coated ion exchange Tussionex Cation ion-exchange resin complex of hydrocodone
and phenyltoloxamine
Flotation–diffusion Val release Diazepam
Osmotic delivery
Acutrim Phenyl propanolamine HCl (Oros delivery system)
Procardia-XL
GITS—gastrointestinal therapeutic system with NaCl-
driven (osmotic pressure) delivery system for
nifedipine
Microencapsulation
Bayer timed-
release Aspirin
Nitrospan Microencapsulated nitroglycerin
Micro-K
Extencaps Potassium chloride microencapsulated particles
2. MATERIALS AND METHODS USED
2.1. Materials used
Darifenacin HBr, Lactose anhydrous (DC Grade), Dicalcium phosphate, Xanthan gum, Ethyl
cellulose, Methocel K4M, Methocel K100M, Magnesium stearate, Opadry orange.
www.wjpps.com Vol 7, Issue 5, 2018.
1538
Ashok et al. World Journal of Pharmacy and Pharmaceutical Sciences
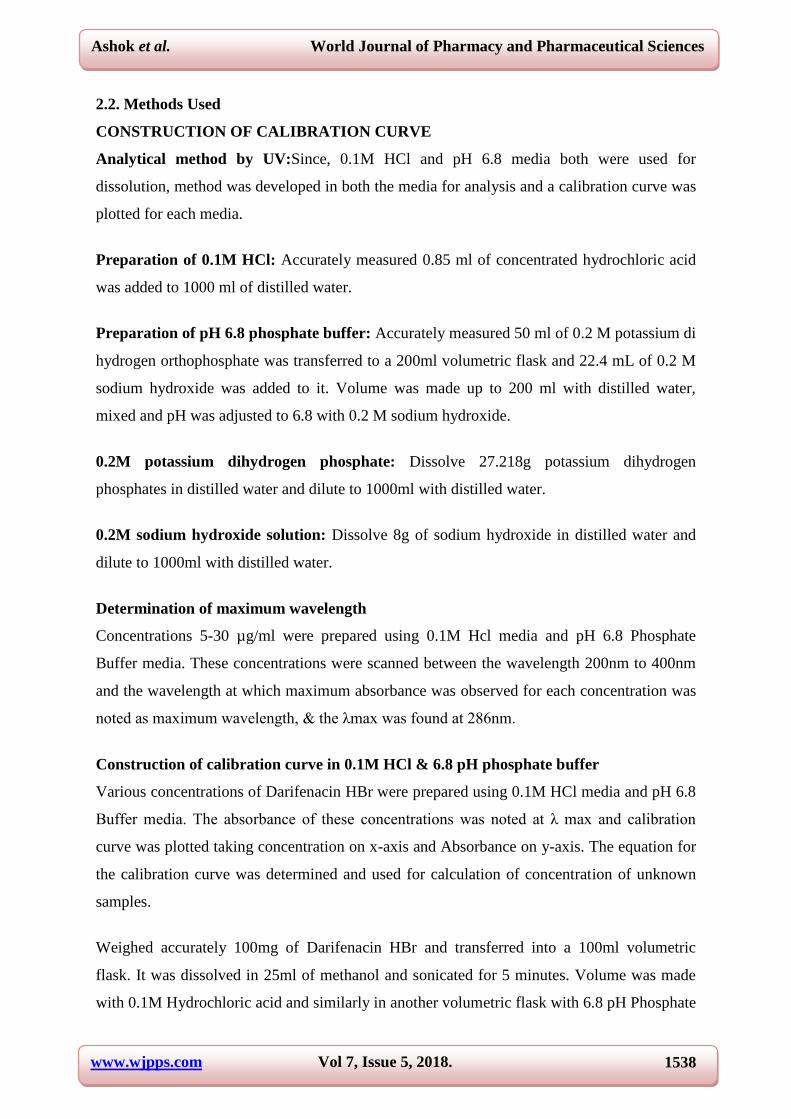
2.2. Methods Used
CONSTRUCTION OF CALIBRATION CURVE
Analytical method by UV:Since, 0.1M HCl and pH 6.8 media both were used for
dissolution, method was developed in both the media for analysis and a calibration curve was
plotted for each media.
Preparation of 0.1M HCl: Accurately measured 0.85 ml of concentrated hydrochloric acid
was added to 1000 ml of distilled water.
Preparation of pH 6.8 phosphate buffer: Accurately measured 50 ml of 0.2 M potassium di
hydrogen orthophosphate was transferred to a 200ml volumetric flask and 22.4 mL of 0.2 M
sodium hydroxide was added to it. Volume was made up to 200 ml with distilled water,
mixed and pH was adjusted to 6.8 with 0.2 M sodium hydroxide.
0.2M potassium dihydrogen phosphate: Dissolve 27.218g potassium dihydrogen
phosphates in distilled water and dilute to 1000ml with distilled water.
0.2M sodium hydroxide solution: Dissolve 8g of sodium hydroxide in distilled water and
dilute to 1000ml with distilled water.
Determination of maximum wavelength
Concentrations 5-30 µg/ml were prepared using 0.1M Hcl media and pH 6.8 Phosphate
Buffer media. These concentrations were scanned between the wavelength 200nm to 400nm
and the wavelength at which maximum absorbance was observed for each concentration was
noted as maximum wavelength, & the λmax was found at 286nm.
Construction of calibration curve in 0.1M HCl & 6.8 pH phosphate buffer
Various concentrations of Darifenacin HBr were prepared using 0.1M HCl media and pH 6.8
Buffer media. The absorbance of these concentrations was noted at λ max and calibration
curve was plotted taking concentration on x-axis and Absorbance on y-axis. The equation for
the calibration curve was determined and used for calculation of concentration of unknown
samples.
Weighed accurately 100mg of Darifenacin HBr and transferred into a 100ml volumetric
flask. It was dissolved in 25ml of methanol and sonicated for 5 minutes. Volume was made
with 0.1M Hydrochloric acid and similarly in another volumetric flask with 6.8 pH Phosphate

www.wjpps.com Vol 7, Issue 5, 2018.
1539
Ashok et al. World Journal of Pharmacy and Pharmaceutical Sciences
buffer. It was mixed well to get a concentration of 1000μg/ml. From the stock solution10 ml
was withdrawn & dilute to 100ml with respective Medias to get 100μg/ml. From this solution
withdraw 1,2,3,4,5,6 ml solutions and was further diluted to 20 ml to give 5,10,15,20,25 &
30μg/ml concentrations respectively, and the absorbance was noted at 286 nm against 0.1M
HCl as a blank. A plot of concentrations of drug versus absorbance was plotted42
.The linear
regression analysis was done on absorbance data points.
Preparation of Darifenacin HBr matrix tablets[11-14]
All the matrix Darifenacin tablets, each containing 200mg of Darifenacin, were prepared by
direct compression method
The steps involved:
Sieve the API and other ingredients individually through sieve no.40 except magnesium
Stearate which is passed through sieve no.60.
Uniformly blend the API and lactose anhydrous in a polythene bag for 5min.
Add DCP to above mixture and mix for 3min.
Add the polymer/s to above blend and total blend was loaded to a blender and mix for 15
min.
Lubricate the blend with Magnesium Stearate.
Compress the lubricated blend into tablets using 8 mm concave shaped punch in a single
rotary tablet press (8 stations).
Coating of Darifenacin HBr matrix tablets[15-17]
The tablets were film coated with the opadry orange to control the drug release. The %
weight build up of tablets was 3%.

www.wjpps.com Vol 7, Issue 5, 2018.
1540
Ashok et al. World Journal of Pharmacy and Pharmaceutical Sciences
MANUFACTURING FLOW CHART
Collecting of all excipients & drug (Darifenacin)
↓
Sifting
↓
Drug mixing with excipients
↓
Sifting of Drug -Excipients
↓
Blending
↓
Tablet compression
↓
Film coating
Figure-8: Schematic representation of manufacturing procedure of darifenacin tablets.
EVALUATION STUDIES
Pre compression parameters[18-20]
Pre compression parameters like Angle of repose, bulk density, tapped density, Carr’s index
and Hausners ratio were determined for all the powder blends of formulations F1-F13 as for
the described procedures.
Post compression studies of the prepared formulations[20-22]
Weight variation, Hardness, Friability, Dissolution Studies, Disintegration Studies and Assay
procedures were determined as per described manner.
3. RESULTS
Table-2: Preliminary studies report.
COMPONENT
OBSERVATION
At 400
C/75% RH and 500
C/90%RH
INITIAL 15 days 30 days 15 days 30 days
Pure API White - - - -
API + Lactose White - - - -
API+DCP(Dc grade) White - - - -
API + Xanthan gum Light Yellow - - - -
API + Ethyl cellulose White - - - -
API+HPMC K 4M White - - - -
API+HPMC 100 M White - - - -
API + Mg Stearate White - - - -
API+ opadry orange Light orange - - - -

www.wjpps.com Vol 7, Issue 5, 2018.
1541
Ashok et al. World Journal of Pharmacy and Pharmaceutical Sciences
Table-3: Flow properties of drug.
Table-4: Composition of Darifenacin oral extended-release tablets.
S.No Name of the
Ingredient
F1
(mg)
F2
(mg)
F3
(mg)
F4
(mg)
F5
(mg)
F6
(mg)
1 Darifenacin HBr 17.84 17.84 17.84 17.84 17.84 17.84
2
Lactose
anhydrous (DC
Grade) 100.16 90.16 60.16 100.16 90.16 100.16
3 DCP (DC Grade) 50 50 60 50 50 60
4 Xanthan gum 30
(15%) 40 (20%) 60 (30%) - - -
5 Ethyl cellulose - - - 30 (15%) 40 (20%) -
6 Methocel K4M - - - - - 20 (10%)
7 Methocel K100M - - - - - -
8 Magnesium
stearate 2 2 2 2 2 2
Total Weight 200 200 200 200 200 200
Film coating (%) 3.0 3.0 3.0 3.0 3.0 3.0
S.No Name of the
Ingredient
F7
(mg)
F8
(mg)
F9
(mg)
F10
(mg)
F11
(mg)
F12
(mg)
F13
(mg)
1 Darifenacin
HBr 17.84 17.84 17.84 17.84 17.84 17.84 17.84
2
Lactose
anhydrous
(DC Grade) 80.16 60.16 40.16 40.16 40.16 40.16 40.16
3 DCP (DC
Grade) 60 60 40 40 50 40 40
4 Xanthan gum - - 60
(30%)
50
(25%) - - -
5 Ethyl
cellulose - - - - - - -
6 Methocel
K4M 40
(20%)
60
(30%)
40
(20%)
50
(25%)
70
(35%)
80
(40%)
90
(45%)
7 Methocel
K100M - - - -
10
(5%)
10
(5%)
10
(5%)
8 Magnesium
stearate 2 2 2 2 2 2 2
Total Weight 200 200 200 200 200 200 200
Film coating
(%) 3.0 3.0 3.0 3.0 3.0 3.0 3.0
S.No Drug
Angle of
Repose
(degrees)
Bulk
density
(gm/ml)
Tapped
density
(gm/ml)
Carr’s index
(%)
Hausner
ratio
1 Darifenacin
HBr 32.90 0.424 0.587 27.76 1.38

www.wjpps.com Vol 7, Issue 5, 2018.
1542
Ashok et al. World Journal of Pharmacy and Pharmaceutical Sciences
Table-5: Data for pre compression studies of the blends.
Formulation
Code
Angle of
Repose
(in degrees)
Bulk
density
(gm/ml)
Tapped
density
(gm/ml)
Compressibility
Index
Hausner’s
ratio
F1 29.37±0.98 0.418±0.006 0.530±0.003 21.08±0.71 1.26±0.01
F2 25.57±0.49 0.434±0.005 0.530±0.002 18.63±0.66 1.23±0.01
F3 23.26±1.33 O.486±0.006 0.590±0.001 17.56±0.94 1.26±0.11
F4 28.75±1.24 0.404±0.006 0.504±0.006 19.86±2.33 1.25±0.04
F5 24.92±0.85 0.427±0.004 0.530±0.004 19.47±0.23 1.25±0.01
F6 26.67±0.46 0.436±0.006 0.546±0.006 20.13±1.76 1.25±0.02
F7 25.64±0.89 0.508±0.01 0.636±0.005 19.98±1.17 1.25±0.02
F8 23.79±0.55 0.547±0.009 0.670±0.008 18.40±0.31 1.23±0.01
F9 24.97±1.14 0.476±0.005 0.574±0.005 16.91±0.30 1.20±0.01
F10 24.07±0.76 0.499±0.004 0.596±0.004 16.20±0.94 1.19±0.01
F11 25.13±0.72 0.457±0.004 0.547±0.005 17.50±2.21 1.19±0.01
F12 24.89±0.67 0.492±0.005 0.588±0.003 16.32±0.52 1.67±0.41
F13 24.48±0.77 0.525±0.003 0.644±0.001 18.48±0.35 1.23±0.01
Table-6: Data for post compression studies of the prepared tablets.
FORMULATION
CODE AVERAGE
Wt (mg)
AVERAGE
HARDNESS
(Kg/cm2)
AVERAGE
THICKNESS
(mm)
FRIABILITY
(%)
F1 200.15±1.78 8.50±0.33 3.60±0.09 0.20
F2 199.60±1.44 8.70±0.53 3.55±0.19 0.15
F3 199.56±1.94 8.30±0.58 3.69±0.02 0.18
F4 201.20±1.60 10.36±0.78 3.55±0.08 0.22
F5 202.35±1.53 10.55±0.50 3.56±0.11 0.24
F6 200.33±1.96 8.40±0.57 3.55±0.08 0.21
F7 200.15±1.48 8.35±0.03 3.68±0.05 0.16
F8 200.32±1.77 8.55±0.68 3.70±0.03 0.21
F9 199.62±2.09 8.60±0.77 3.73±0.02 0.21
F10 199.75±2.54 8.55±0.55 3.58±0.06 0.19
F11 198.45±2.13 8.40±0.56 3.61±0.06 0.20
F12 201.40±2.23 8.75±0.42 3.67±0.05 0.14
F13 199.75±2.97 8.45±0.64 3.62±0.04 0.12
Table-7: Assay data of the prepared tablets.
Formulation
code
Test
Absorbance
AVERAGE Wt
(mg)
DRUG
CONTENT
(ASSAY) mg/tab
ASSAY
(%)
F1 0.023 200.15±1.78 15.44 102.98
F2 0.022 199.60±1.44 14.73 98.23
F3 0.022 199.56±1.94 14.87 99.12
F4 0.021 201.20±1.60 14.17 94.52
F5 0.022 202.35±1.53 14.93 99.58
www.wjpps.com Vol 7, Issue 5, 2018.
1543
Ashok et al. World Journal of Pharmacy and Pharmaceutical Sciences
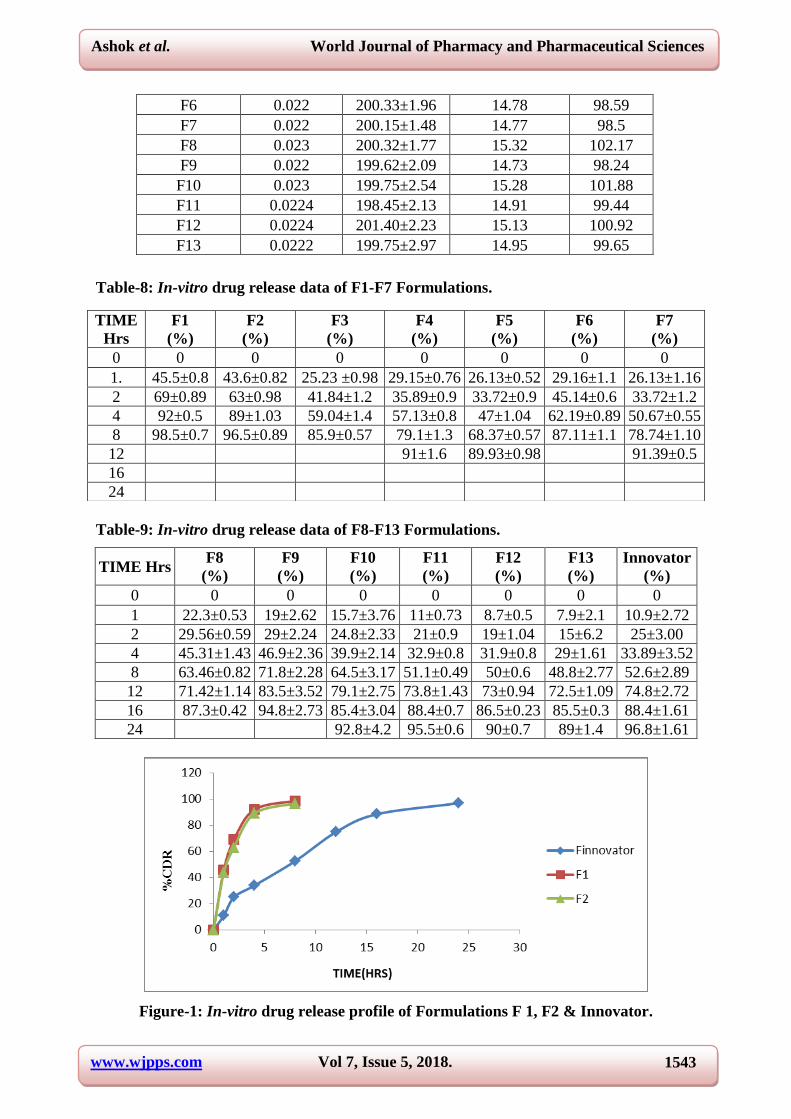
Table-8: In-vitro drug release data of F1-F7 Formulations.
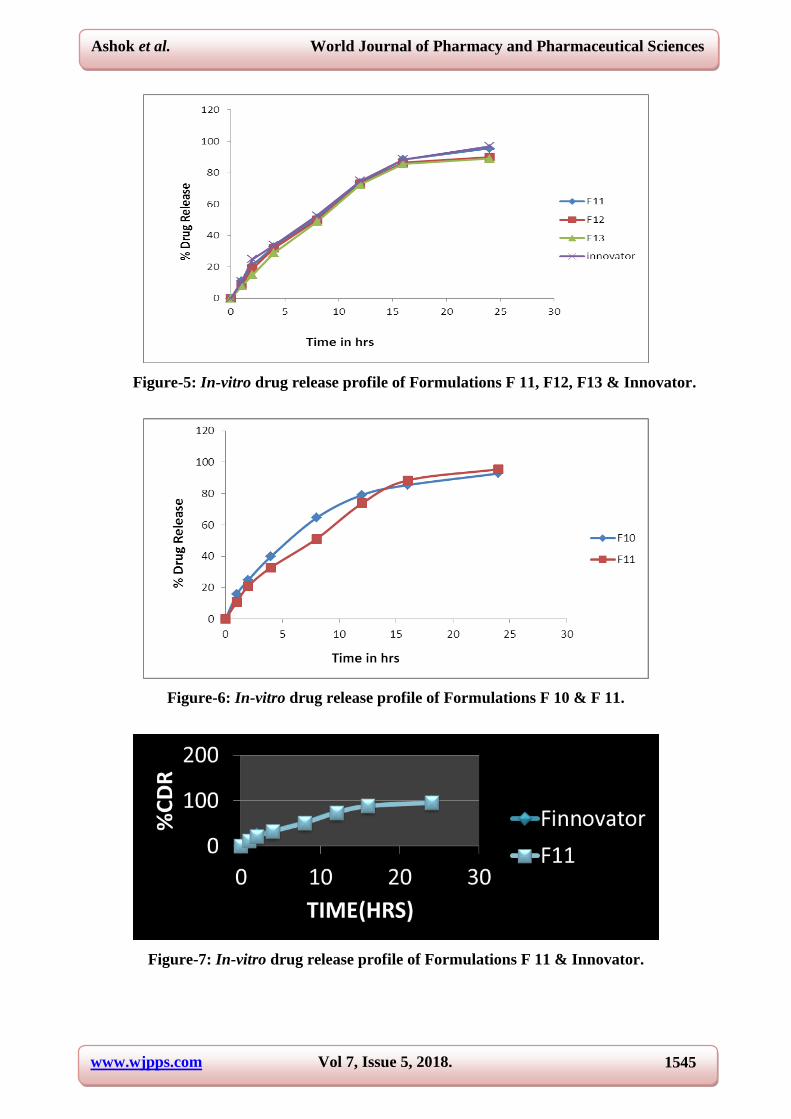
Table-9: In-vitro drug release data of F8-F13 Formulations.
TIME Hrs F8
(%) F9
(%) F10 (%)
F11 (%)
F12 (%)
F13 (%)
Innovator (%)
0 0 0 0 0 0 0 0
1 22.3±0.53 19±2.62 15.7±3.76 11±0.73 8.7±0.5 7.9±2.1 10.9±2.72
2 29.56±0.59 29±2.24 24.8±2.33 21±0.9 19±1.04 15±6.2 25±3.00
4 45.31±1.43 46.9±2.36 39.9±2.14 32.9±0.8 31.9±0.8 29±1.61 33.89±3.52
8 63.46±0.82 71.8±2.28 64.5±3.17 51.1±0.49 50±0.6 48.8±2.77 52.6±2.89
12 71.42±1.14 83.5±3.52 79.1±2.75 73.8±1.43 73±0.94 72.5±1.09 74.8±2.72
16 87.3±0.42 94.8±2.73 85.4±3.04 88.4±0.7 86.5±0.23 85.5±0.3 88.4±1.61
24
92.8±4.2 95.5±0.6 90±0.7 89±1.4 96.8±1.61
Figure-1: In-vitro drug release profile of Formulations F 1, F2 & Innovator.
F6 0.022 200.33±1.96 14.78 98.59
F7 0.022 200.15±1.48 14.77 98.5
F8 0.023 200.32±1.77 15.32 102.17
F9 0.022 199.62±2.09 14.73 98.24
F10 0.023 199.75±2.54 15.28 101.88
F11 0.0224 198.45±2.13 14.91 99.44
F12 0.0224 201.40±2.23 15.13 100.92
F13 0.0222 199.75±2.97 14.95 99.65
TIME
Hrs
F1
(%)
F2
(%)
F3
(%)
F4
(%)
F5
(%)
F6
(%)
F7
(%)
0 0 0 0 0 0 0 0
1. 45.5±0.8 43.6±0.82 25.23 ±0.98 29.15±0.76 26.13±0.52 29.16±1.1 26.13±1.16
2 69±0.89 63±0.98 41.84±1.2 35.89±0.9 33.72±0.9 45.14±0.6 33.72±1.2
4 92±0.5 89±1.03 59.04±1.4 57.13±0.8 47±1.04 62.19±0.89 50.67±0.55
8 98.5±0.7 96.5±0.89 85.9±0.57 79.1±1.3 68.37±0.57 87.11±1.1 78.74±1.10
12 91±1.6 89.93±0.98 91.39±0.5
16
24

www.wjpps.com Vol 7, Issue 5, 2018.
1544
Ashok et al. World Journal of Pharmacy and Pharmaceutical Sciences
Figure-2: In-vitro drug release profile of Formulations F 3, F4, F5 & Innovator.
Figure -3: In-vitro drug release profile of Formulations F 6, F7, F8 & Innovator.
Figure-4: In-vitro drug release profile of Formulations F 9, F10 & Innovator.
www.wjpps.com Vol 7, Issue 5, 2018.
1545
Ashok et al. World Journal of Pharmacy and Pharmaceutical Sciences
Figure-5: In-vitro drug release profile of Formulations F 11, F12, F13 & Innovator.
Figure-6: In-vitro drug release profile of Formulations F 10 & F 11.
Figure-7: In-vitro drug release profile of Formulations F 11 & Innovator.

www.wjpps.com Vol 7, Issue 5, 2018.
1546
Ashok et al. World Journal of Pharmacy and Pharmaceutical Sciences
Table-10: The drug release kinetics of the prepared formulations.
Formulation
code
Zero order First order Higuchi Korsmeyer-peppas
r2 Slope r
2 Slope r
2 Slope r
2
Diffusion
exponent (n)
F-1 0.734 11.60 0.989 -0.236 0.934 36.71 0.681 0.43
F-2 0.734 10.53 0.954 -0.169 0.949 35.83 0.691 0.37
F-3 0.921 9.9 0.994 -0.104 0.995 30.93 0.749 0.36
F-4 0.891 6.874 0.994 -0.087 0.995 27.27 0.783 0.52
F-5 0.936 6.64 0.968 -0.073 0.993 25.69 0.809 0.52
F-6 0.894 9.85 0.956 -0.077 0.998 31.28 0.795 0.29
F-7 0.924 7.06 0.991 -0.088 0.994 27.51 0.810 0.23
F-8 0.922 7.06 0.961 -0.067 0.997 22.97 0.859 0.35
F-9 O.835 3.985 0.996 -0.071 0.973 22.47 0.631 0.29
F10 0.883 03.985 0.951 -0.064 0.984 21.97 0.680 0.29
F11 0.859 4.11 0.982 -0.056 0.966 22.11 0.988 0.694
F-12 0.902 3.974 0.967 -0.045 O.969 21.49 0.781 0.67
F-13 0.906 4.013 0.961 -0.04 0.988 21.57 0.812 0.79
F(I) 0.910 4.11 0.984 -0.062 0.981 22.13 0.733 0.6
Figure-8: The Zero order release kinetics of optimized formula F-11.
Figure-9: the first order release kinetics of optimized formula F-11.

www.wjpps.com Vol 7, Issue 5, 2018.
1547
Ashok et al. World Journal of Pharmacy and Pharmaceutical Sciences
Figure-10: The Higuchi release kinetics of optimized formula F-11.
Figure-11: The korsmeyer-peppas model release kinetics of optimized Formula F-11.
Figure-12: Infra red spectra of pure drug Darifenacin Hydrobromide.

www.wjpps.com Vol 7, Issue 5, 2018.
1548
Ashok et al. World Journal of Pharmacy and Pharmaceutical Sciences
Table-11: Characteristic peaks of pure Darifenacin HBr.
S.No Type of
bond
Type of
vibration
Actual
frequency
Observed
frequency Conformation
1 N-H Stretching 3500-3180 3465.29 Amide
2 C=O Stretching 1680-1630 1668.52 Amide
3 C=O-O-C Stretching 1270-1020 1097.87 Ether
4 C-H Stretching 3100-2900 2957.73 Aromatic
Figure-13: Infra red spectra of pure drug Darifenacin Hydrobromide + Lactose
Anhydrous.
Figure -14: Infra red spectra of pure drug Darifenacin HBr + Dicalcium phosphate (DC
grade).

www.wjpps.com Vol 7, Issue 5, 2018.
1549
Ashok et al. World Journal of Pharmacy and Pharmaceutical Sciences
Figure-15: Infra red spectra of pure drug Darifenacin Hydrobromide + Xanthan gum.
Figure-16: Infra red spectra of pure drug Darifenacin Hydrobromide + Ethyl cellulose.
Figure-17: Infra red spectra of pure drug Darifenacin Hydrobromide + HPMC K4M.

www.wjpps.com Vol 7, Issue 5, 2018.
1550
Ashok et al. World Journal of Pharmacy and Pharmaceutical Sciences
Figure-18: Infra red spectra of pure drug Darifenacin Hydrobromide + HPMC K100M.
Figure-19: Darifenacin HBr DSC report.
Table-12: Stability Summary data of Formulation-11.
Test Name Limits Initial 40°C/75% RH
50°C/90%
RH
1 month 2 months 1 month
Description
Orange colored,
round biconvex
film coated tablets
with plain surface
on both sides
Complies Complies Complies Complies
Dissolution by
UV Method
(%w/w) In Acid
Stage
NLT 25% in 1hr 12% 12.4% 13% 11.8%
Dissolution NLT 85% at 24th 99.2% 99.4% 99.2% 98.8%

www.wjpps.com Vol 7, Issue 5, 2018.
1551
Ashok et al. World Journal of Pharmacy and Pharmaceutical Sciences
by UV Method
(%w/w) in pH
6.8 Buffer stage
hr
Identification by
HPLC
To match with
Standard Complies Complies Complies Complies
Average wt 206mg±2% 206.1 206.3 206.2 206.4
Water by KF (%
W/W) NMT 3.5% 2.2 2.7 2.4 2.7
Assay NLT 90.0 and
NMT 110.0 100.1 99.0 99.6 98.8
Related Substances (%w/w):
Known impurity
I (oxidized
impurity)
NMT 0.50 0.03 0.03 0.05 0.10
Known impurity
II NMT 0.30 0.08 0.07 0.11 0.11
Unknown
impurity NMT 0.50 0.06 0.06 0.08 0.11
Total impurities NMT 1.50 0.18 0.16 0.25 0.32
4. CONCLUSION
The project work entitled, ―Formulation Development and Evaluation of Darifenacin HBr
extended release Matrix Tablets‖ was carried out in the dissertation work. The objective of
this study was to develop and evaluate Darifenacin Hydro bromide Extended Release matrix
tablet by using various grades and ratios of hydroxy propyl methyl cellulose (HPMC),
Xanthan gum, Ethyl cellulose as rate controlling hydrophilic polymers and bioequivalent
testing with the innovator ENABLEX (prepared by Novartis Pharma, Europe).
The drug was compatible with the formulation components. Hence Lactose Anhydrous, Di
calcium Phosphate (DC grade), Xanthan gum, Ethyl cellulose, HPMCK4M, HPMCK100M,
Opadry orange were selected as excipients for the lab scale development.
Blends were evaluated for various parameters such as bulk density, tapped density, Carr’s
index, Hausner’s ratio and the parameters evaluated for the matrix tablet are Drug content,
hardness, Friability, weight variation and Thickness and all physicochemical properties are
within the limits. Drug release from tablets complies with the prescribed limits. Formulation
development from F1 to F13 was executed to optimize the composition. At the final, the
dissolution profile of the batches F11 was closer with the reference product.
The developed matrix tablets followed the first order release model and it was non- fickian
type of diffusion based on the korsmeyer-peppas model.

www.wjpps.com Vol 7, Issue 5, 2018.
1552
Ashok et al. World Journal of Pharmacy and Pharmaceutical Sciences
Similarity factor value for optimized formulation F11 was above 50 indicates that the
dissolution profile of the batch matched with innovators Tablet.
The stability studies were performed for the optimized formulation F11 at the accelerated
conditions (400C/75% RH) for two months and at stress conditions (60
0C/90% RH) for one
month. The results were indicated that all results were in limits after two months period.
Hence the optimized formulation F11 was stable.
Finally the combinations of high viscous and low viscous hydroxy propyl methyl cellulose
polymers were used to develop a optimized formula that was similar with the innovators
product ENABLEX.
5. REFERENCES
1. Berner. B. and Dinh S. Fundamental concepts in controlled release In: A. Kydon ieus, ed.
Treatise on controlled drug delivery. Marcel Oekker, 1992; 1 – 36.
2. Chien. Y-W. Concepts and systems design for rate-controlled drug delivery. In: Chien
ed. novel drug delivery systems. Marcel Dekker, 1992; 43.
3. Sampath kumar K.P., Debjit Bhowmik and Shweta Srivastava. Sustained release drug
delivery system potential. The Pharma Innovation. 2, 2012; 42- 68.
4. http://Pharmacrunch.net/archives, novel-drug-delivery-system, Controlled release drug
delivery system. Jun-2011-12.
5. Chien. Y. W. Potential developments and new approaches in oral controlled-release drug
delivery systems. Drug Dev. Ind. Pharm 1983; 9: 1294 – 1330.
6. Brahmaiah.B, Prasanna Kumar Desu, Sreekanth Nama, S.Satish Babu, Formulation and
evaluation of extended release mucoadhesive microspheres of simvastatin, International
Journal of Pharmaceutical and biomedical Research, ISSN No. 0976-0350, March 2013;
4(1): 57-64.
7. Gudsoorkar V. R., Rambhau D. Sustained release of drugs. The eastern pharmacist, 1993
Sept; 17-21.
8. Colombo P, Conte U, and Gazzaniger A. Drug release modulation by physical restriction
of matrix swelling. Int J Pharm 1990; 63: 43-48.
9. Colombo P, Bettini R, and Massimo G. Drug diffusion front movement is important in
drug release control from swellable matrix tablets. J Pharm Sci 1995; 84(8): 991-997.

www.wjpps.com Vol 7, Issue 5, 2018.
1553
Ashok et al. World Journal of Pharmacy and Pharmaceutical Sciences
10. Nandita G. Das and Sudip K. Das. Control-release of oral dosage forms, formulation. fill
& finish 2003; 10-16.
11. Brahmaiah Bonthagarala, Suryakantha Swain, Pasam Venkateswara Rao,Varun Dasari,
Design and Characterization of Controlled Release Lornoxicam Nanofibers by
Electrospinning Technique, International Journal of Biomedical and Advance Research
2015; 6(03): 220-232.
12. Brahmaiah Bonthagarala, Pasam Venkateswara Rao, Pusuluri Dharani Lakshmi Sai,
K.Venkata Sivaiah, G. Anil Kumar, B.Nageswara Rao, Varun Dasari, Enhancement of
dissolution rate of Clofibrate (BCS Class –II drug) by using liquisolid compact
technology, International Journal of Biomedical and Advance Research 2015; 6(03):
288-298.
13. Chien YW. Controlled and modulated-release drug-delivery systems. In: Swarbrick J,
Baylan JC, eds. Encyclopedia of pharmaceutical technology. New York: Dekker, 1990;
281-313.
14. Janos B, Klara P, Odon P, Geza RJ, Rok D, Stane S and Istvan E. Film coating as a
method to enhance the preparation of tablets from dimenhydrinate crystals. Int
Pharm.2004; 269: 393-401.
15. Leon Shargel, Susanna Wu-Pong and Andrew BC Yu. Modified-release drug products.
In: Applied biopharmaceutics &pharmacokinetics, fifth ed. 2004; 845-856.
16. Brahmaiah.B, Madhu Gudipati, GP Bhagath, Formulation and Evaluation of Gastro
retentive Floating Drug Delivery System of Metoprolol Tartarate, International Journal of
Life Sciences Biotechnology and Pharma Research, ISSN:2250-3137, 2(1): 184-201,
January 2013.
17. NarasimhaRao R., Anusha Reddy M., Swetha Reddy N, Divyasagar P and Keerthana K.
Design and evaluation of metformin hydrochloride extended release tablets by direct
compression. International journal of research in pharmaceutical and biomedical sciences,
2(3): Jul – Sep 2011; 1118-1133.
18. Mulye N.V., Turco S.J., A simple model based on first order kinetics to explain release of
highly water soluble drugs from porous Dicalcium phosphate dehydrates matrices. Drug
Dev. Ind. Pharm. 1995; 21: 943–953.
19. Brahmaiah Bonthagarala, Sreekanth Nama, Leela Madhuri Pola, Enhancement of
Dissolution Rate of Ciprofloxacin by Using Various Solid Dispersion Techniques,
International Journal of Pharmaceutical Sciences and Research, ISSN: 0975-8232, IJPSR,
2013; 4(11): 4376-4383.

www.wjpps.com Vol 7, Issue 5, 2018.
1554
Ashok et al. World Journal of Pharmacy and Pharmaceutical Sciences
20. Brahmaiah Bonthagarala, Sreekanth Nama, Sudarshan Donthiboina, Formulation and
Evaluation of Sustained Release Matrix Tablets of Ozacarbazepine by Using Various
Polymers, Singapore Journal of Pharmaceutical Research, e-ISSN No-1456-9126, Print
ISSN No-1278-9118, 2014; 1(1): 1-7.
21. Schwartz B.J., Simonelli, A.P. and Higuchi W.I. Drug release from wax matrices &
analysis of data with first-order kinetics and with the diffusion-controlled model. J.
Pharm. Sci. 57: 274–277.
22. Colombo P, Conte U, and Gazzaniger A. Drug release modulation by physical restriction
of matrix swelling. Int J Pharm 1990; 63: 43-48.