Embed Size (px)
Citation preview
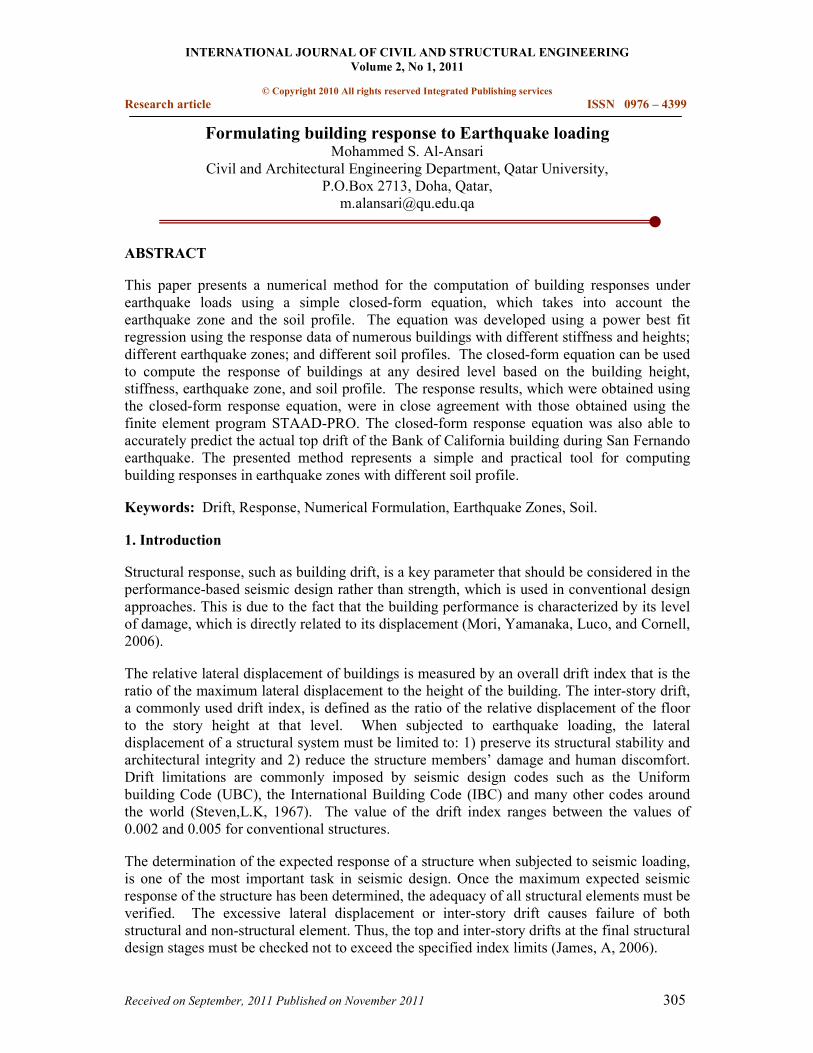
INTERNATIONAL JOURNAL OF CIVIL AND STRUCTURAL ENGINEERING
Volume 2, No 1, 2011
© Copyright 2010 All rights reserved Integrated Publishing services
Research article ISSN 0976 – 4399
Received on September, 2011 Published on November 2011 305
Formulating building response to Earthquake loading Mohammed S. Al-Ansari
Civil and Architectural Engineering Department, Qatar University,
P.O.Box 2713, Doha, Qatar,
ABSTRACT
This paper presents a numerical method for the computation of building responses under
earthquake loads using a simple closed-form equation, which takes into account the
earthquake zone and the soil profile. The equation was developed using a power best fit
regression using the response data of numerous buildings with different stiffness and heights;
different earthquake zones; and different soil profiles. The closed-form equation can be used
to compute the response of buildings at any desired level based on the building height,
stiffness, earthquake zone, and soil profile. The response results, which were obtained using
the closed-form response equation, were in close agreement with those obtained using the
finite element program STAAD-PRO. The closed-form response equation was also able to
accurately predict the actual top drift of the Bank of California building during San Fernando
earthquake. The presented method represents a simple and practical tool for computing
building responses in earthquake zones with different soil profile.
Keywords: Drift, Response, Numerical Formulation, Earthquake Zones, Soil.
1. Introduction
Structural response, such as building drift, is a key parameter that should be considered in the
performance-based seismic design rather than strength, which is used in conventional design
approaches. This is due to the fact that the building performance is characterized by its level
of damage, which is directly related to its displacement (Mori, Yamanaka, Luco, and Cornell,
2006).
The relative lateral displacement of buildings is measured by an overall drift index that is the
ratio of the maximum lateral displacement to the height of the building. The inter-story drift,
a commonly used drift index, is defined as the ratio of the relative displacement of the floor
to the story height at that level. When subjected to earthquake loading, the lateral
displacement of a structural system must be limited to: 1) preserve its structural stability and
architectural integrity and 2) reduce the structure members’ damage and human discomfort.
Drift limitations are commonly imposed by seismic design codes such as the Uniform
building Code (UBC), the International Building Code (IBC) and many other codes around
the world (Steven,L.K, 1967). The value of the drift index ranges between the values of
0.002 and 0.005 for conventional structures.
The determination of the expected response of a structure when subjected to seismic loading,
is one of the most important task in seismic design. Once the maximum expected seismic
response of the structure has been determined, the adequacy of all structural elements must be
verified. The excessive lateral displacement or inter-story drift causes failure of both
structural and non-structural element. Thus, the top and inter-story drifts at the final structural
design stages must be checked not to exceed the specified index limits (James, A, 2006).

Formulating building response to Earthquake loading
Mohammed S. Al-Ansari
International Journal of Civil and Structural Engineering
Volume 2 Issue 1 2011
306
This paper presents a numerical method for the computation of the response of building
structures in earthquake zones (Carpenter, L 2004). The method consists of computing the
building response under earthquake loads using a simple closed-form equation, which takes
into account of the earthquake zone and the soil profile. The equation was developed using a
power best fit regression using the response data of different buildings with different stiffness
and heights; different earthquake zones; and different soil profiles. The closed-form equation
can be used to compute the response of buildings at any desired level based on building
height, stiffness, earthquake zone, and soil profile. Hence, the earthquake formula (E.F.) can
be used for the preliminary design of buildings in order to save time and money.
2. Problem Formulation
Figure 1 shows the structural model a 12-story building. From the basic structural frame
model and side-sway moments, the following equations can be written:
[1]
[2]
Where:
IB = moment of inertia of the building under consideration
∆∆∆∆B = horizontal displacement of the building under consideration
IS = moment of inertia of the standard building
∆∆∆∆S = horizontal displacement of the standard building
Figure 1: Finite Element Model of a 30-Story Concrete Building

Formulating building response to Earthquake loading
Mohammed S. Al-Ansari
International Journal of Civil and Structural Engineering
Volume 2 Issue 1 2011
307
The deflected shape of the building due to earthquake loading could be represented by
different regression models such as polynomial, exponential, power …etc. After several
trials, the power function was found to be the best fit equation to model the response of a
structural system under earthquake loads. The power regression function of structural system
response is given by the following equation:
ββββαααα∆∆∆∆ h B = [3]
Where α and β are constants of the power regression model. By combining Eqs 2 and 3, the
following equation can be derived:
[4]
The displacements of all considered buildings are related to the displacements of the standard
building shown in Figure 2. The moment of inertia Is of the standard building, which is equal
to the sum of the moment of inertia of all columns and shear walls in all floors, is equal to
9.7875 m2. On the other hand, its modulus of elasticity Es is 3.5355 10
7 kN/m
2. The
horizontal displacement was determined using the finite element program STAAD PRO
[10].
Figure 2: Standard Building Floor Plan and Elevation
The regression model constants α and β are determined by solving the following equation:
[5]
Where:
i = Building height index
j = Building shape index
Formulating building response to Earthquake loading
Mohammed S. Al-Ansari
International Journal of Civil and Structural Engineering
Volume 2 Issue 1 2011
308
xi = Height of floor i in meters.
rI = Moment of inertia ratio (B
SI
I
Ir = )
rE = Modulus of elasticity ratio B
SE
E
Er( = )
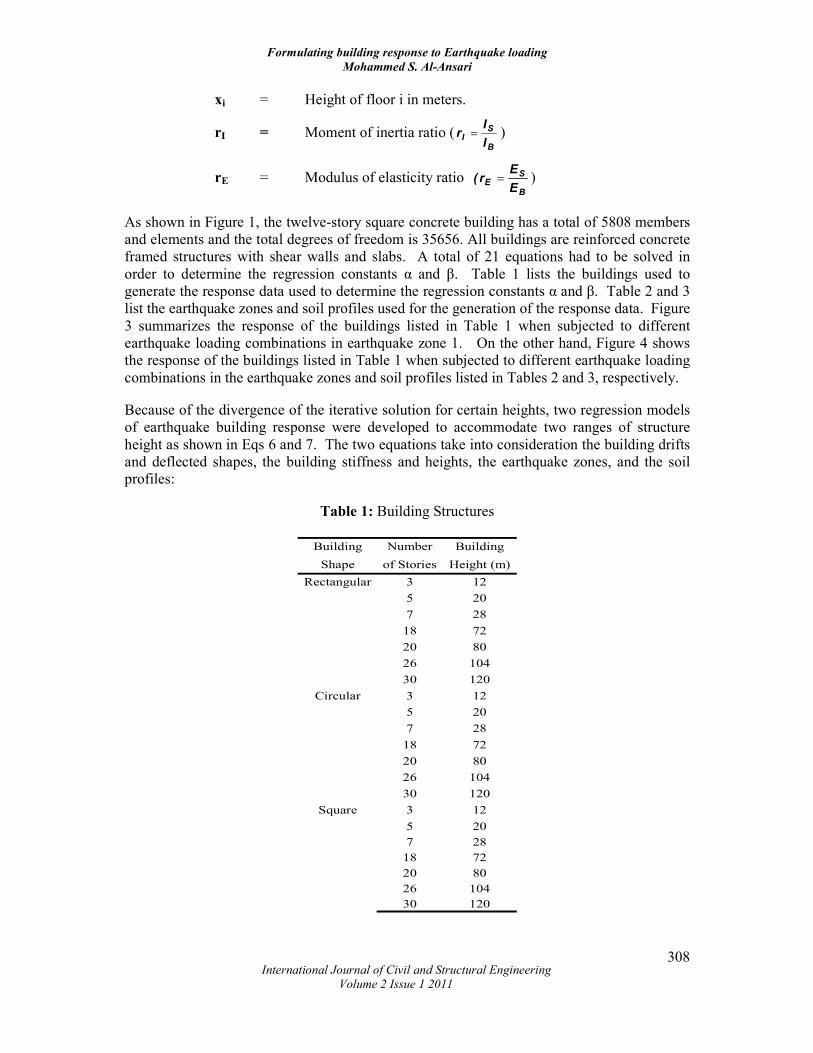
As shown in Figure 1, the twelve-story square concrete building has a total of 5808 members
and elements and the total degrees of freedom is 35656. All buildings are reinforced concrete
framed structures with shear walls and slabs. A total of 21 equations had to be solved in
order to determine the regression constants α and β. Table 1 lists the buildings used to
generate the response data used to determine the regression constants α and β. Table 2 and 3
list the earthquake zones and soil profiles used for the generation of the response data. Figure
3 summarizes the response of the buildings listed in Table 1 when subjected to different
earthquake loading combinations in earthquake zone 1. On the other hand, Figure 4 shows
the response of the buildings listed in Table 1 when subjected to different earthquake loading
combinations in the earthquake zones and soil profiles listed in Tables 2 and 3, respectively.
Because of the divergence of the iterative solution for certain heights, two regression models
of earthquake building response were developed to accommodate two ranges of structure
height as shown in Eqs 6 and 7. The two equations take into consideration the building drifts
and deflected shapes, the building stiffness and heights, the earthquake zones, and the soil
profiles:
Table 1: Building Structures
Building Number Building
Shape of Stories Height (m)
Rectangular 3 12
5 20
7 28
18 72
20 80
26 104
30 120
Circular 3 12
5 20
7 28
18 72
20 80
26 104
30 120
Square 3 12
5 20
7 28
18 72
20 80
26 104
30 120

Formulating building response to Earthquake loading
Mohammed S. Al-Ansari
International Journal of Civil and Structural Engineering
Volume 2 Issue 1 2011
309
Table 2: Earthquake Zones and Soil Profiles
Building Number Earthquake Soil
Shape of Stories Zone Profile
Rectangular 5 1, 2, 3, 4 S1, S2, S3
Circular 12 1, 2, 3, 4 S1, S2, S3
Square 25 1, 2, 3, 4 S1, S2, S3
Table 3: Soil Profile and Soil Types
Profile Name Soil Type
S1 Hard Rock
S2 Rock
S3 Very dense soil and soft rock
Building Height ( m)
0 20 40 60 80 100 120 140
Displacement ( mm )
0
10
20
30
40
50
60
5 Stories
12 Stories
20 Stories
25 stories
30 stories
Figure 3: Building Displacements in Earthquake Zone 1

Formulating building response to Earthquake loading
Mohammed S. Al-Ansari
International Journal of Civil and Structural Engineering
Volume 2 Issue 1 2011
310
All Zones and Soil Profiles
Z1S1 Z1S2 Z1S3 Z2S1 Z2S2 Z2S3 Z3S1 Z3S2 Z3S3 Z4S1 Z4S2 Z4S3
Top Drift (mm)
0
50
100
150
200
250
F.E. 5 Stories
E.F. 5 Stories
F.E.12 Stories
E.F. 12 Stories
F.E. 25 Stories
E.F. 25 Stories
Figure 4: Building Drifts for all Earthquake Zones and Soil Profiles
[6]
And
[7]
Where = Horizontal displacement at the desired level (mm)
x = Height (m)
FS = Factor of safety
= Soil Factor
The soil factor relates building displacements to soil profiles in a specified zone, as shown
in Table 4.
Table 4: Soil Factors
Formulating building response to Earthquake loading
Mohammed S. Al-Ansari
International Journal of Civil and Structural Engineering
Volume 2 Issue 1 2011
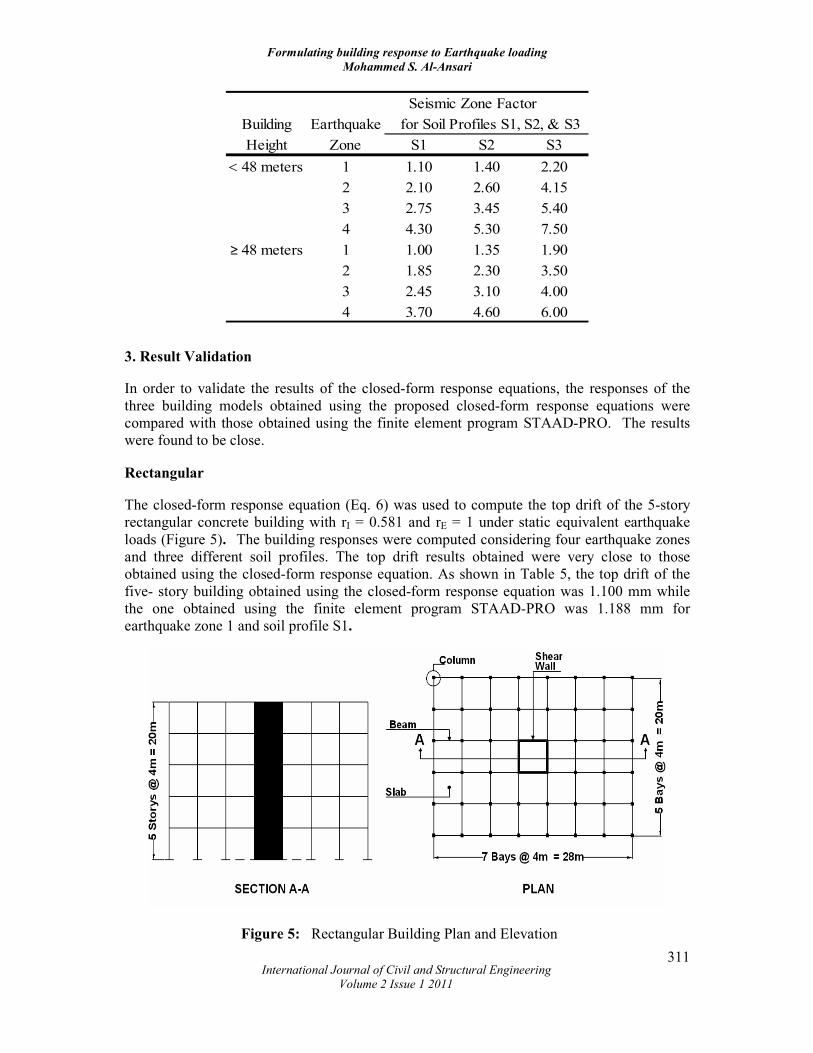
311
Seismic Zone Factor
Building Earthquake for Soil Profiles S1, S2, & S3
Height Zone S1 S2 S3
< 48 meters 1 1.10 1.40 2.20
2 2.10 2.60 4.15
3 2.75 3.45 5.40
4 4.30 5.30 7.50
≥ 48 meters 1 1.00 1.35 1.90
2 1.85 2.30 3.50
3 2.45 3.10 4.00
4 3.70 4.60 6.00
3. Result Validation
In order to validate the results of the closed-form response equations, the responses of the
three building models obtained using the proposed closed-form response equations were
compared with those obtained using the finite element program STAAD-PRO. The results
were found to be close.
Rectangular
The closed-form response equation (Eq. 6) was used to compute the top drift of the 5-story
rectangular concrete building with rI = 0.581 and rE = 1 under static equivalent earthquake
loads (Figure 5). The building responses were computed considering four earthquake zones
and three different soil profiles. The top drift results obtained were very close to those
obtained using the closed-form response equation. As shown in Table 5, the top drift of the
five- story building obtained using the closed-form response equation was 1.100 mm while
the one obtained using the finite element program STAAD-PRO was 1.188 mm for
earthquake zone 1 and soil profile S1.
Figure 5: Rectangular Building Plan and Elevation
Formulating building response to Earthquake loading
Mohammed S. Al-Ansari
International Journal of Civil and Structural Engineering
Volume 2 Issue 1 2011
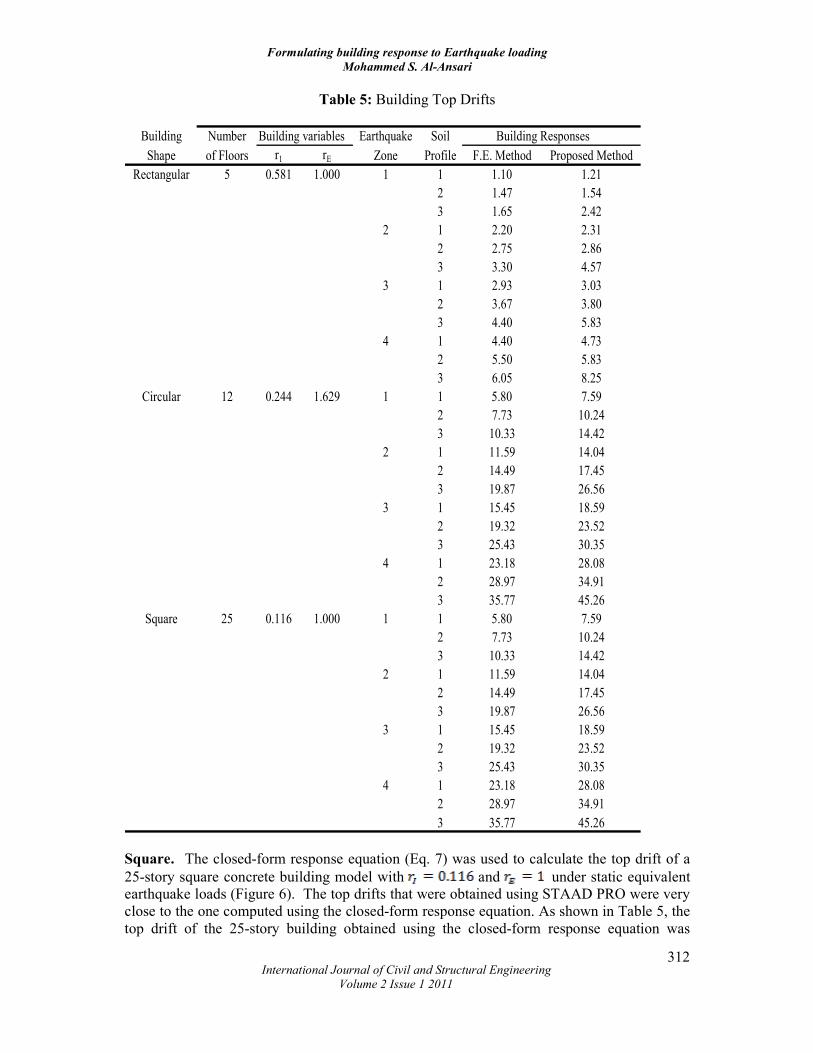
312
Table 5: Building Top Drifts
Building Number Building variables Earthquake Soil Building Responses
Shape of Floors r1 rE Zone Profile F.E. Method Proposed Method
Rectangular 5 0.581 1.000 1 1 1.10 1.21
2 1.47 1.54
3 1.65 2.42
2 1 2.20 2.31
2 2.75 2.86
3 3.30 4.57
3 1 2.93 3.03
2 3.67 3.80
3 4.40 5.83
4 1 4.40 4.73
2 5.50 5.83
3 6.05 8.25
Circular 12 0.244 1.629 1 1 5.80 7.59
2 7.73 10.24
3 10.33 14.42
2 1 11.59 14.04
2 14.49 17.45
3 19.87 26.56
3 1 15.45 18.59
2 19.32 23.52
3 25.43 30.35
4 1 23.18 28.08
2 28.97 34.91
3 35.77 45.26
Square 25 0.116 1.000 1 1 5.80 7.59
2 7.73 10.24
3 10.33 14.42
2 1 11.59 14.04
2 14.49 17.45
3 19.87 26.56
3 1 15.45 18.59
2 19.32 23.52
3 25.43 30.35
4 1 23.18 28.08
2 28.97 34.91
3 35.77 45.26
Square. The closed-form response equation (Eq. 7) was used to calculate the top drift of a
25-story square concrete building model with and under static equivalent
earthquake loads (Figure 6). The top drifts that were obtained using STAAD PRO were very
close to the one computed using the closed-form response equation. As shown in Table 5, the
top drift of the 25-story building obtained using the closed-form response equation was

Formulating building response to Earthquake loading
Mohammed S. Al-Ansari
International Journal of Civil and Structural Engineering
Volume 2 Issue 1 2011
313
93.686 mm while the one obtained using STAAD-PRO was 121.062 mm for earthquake zone
2 and soil profile S3.
Figure 6: Square Building Floor Plan and Elevation
Circular
The top drifts that were obtained using STAAD PRO were very close to those computed
using the closed form response equation. As shown in Table 5 and Figure 7, the top drift of
the 12-story building obtained using the closed-form response equation was 19.316 mm while
the one obtained using STAAD PRO was 23.523 mm in earthquake zone 3 and soil profile S2.

Formulating building response to Earthquake loading
Mohammed S. Al-Ansari
International Journal of Civil and Structural Engineering
Volume 2 Issue 1 2011
314
Figure 7: Circular Building Floor Plan and Elevation
4. Actual Case Example
The example is used to further validate the use of the closed-form response equation for
estimating the response of buildings under earthquake loads. The top drift of the Bank of
California building during San Fernando earthquake was computed using the closed-form
response equation and compared to the one actually measured during the earthquake [11].
The Bank of California building is a 12-story reinforced concrete frame building located at
15250 Ventura Boulevard approximately 23 kilometers from the center of San Fernando
earthquake. Figure 8 and 9 show the transverse section and a typical floor plan of the
building, respectively.
The lateral load resisting system is composed of several components. Much of the resistance
is provided by reinforced concrete moment resisting perimeter frames that extend the full
height of the structure and are composed of columns and spandrel beams. Interior frames to
the third floor were also designed as moment resisting. Above the third floor, the interior
columns and joists were designed to resist only vertical loads. Two shear walls two stories
high also provide lateral resistance in the longitudinal direction. The foundation system
considered of drilled cast-in-place piles ranging from 12 to 17 meters long.
The modulus of elasticity EB of the building is equal to 2.285 107 kN/m
2 while its moment of
inertia IB is equal to 9.087 m4. The total height hT of the building is equal to 52.727 m. The
calculated maximum acceleration of San Fernando earthquake was computed to be 0.3 g,
which corresponds to an earthquake zone of 3. The soil profile is S3 because the soil is silt
all the way down to the bottom of the pile foundation.

Formulating building response to Earthquake loading
Mohammed S. Al-Ansari
International Journal of Civil and Structural Engineering
Volume 2 Issue 1 2011
315
Figure 8: Bank of California Building Transverse Section
Figure 9: Bank of California Building Typical Floor Plan

Formulating building response to Earthquake loading
Mohammed S. Al-Ansari
International Journal of Civil and Structural Engineering
Volume 2 Issue 1 2011
316
Based on the above information, the top displacement of the building under San Fernando
earthquake was computed using the closed-form response equation and was found to be equal
to ∆=277 mm. On the other hand, the actual top displacement of the Bank of California due
to San Fernando earthquake was measured to be 279 mm. This shows that the closed-form
equation was able to accurately predict the actual response of the building even though it was
developed based on equivalent static earthquake loading and linear structural behavior.
5. Conclusions
This paper introduces a numerical method for the computation of the response of building
structures under earthquake loads. The developed closed-form response equations are stable
for buildings with heights up to 120 meters. They gave good drift results when compared
with those obtained using finite element programs for buildings with different height,
stiffness, modulus of elasticity, earthquake zones and soil profiles. The closed-form response
equation was able to accurately predict the actual top drift of the Bank of California building
during San Fernando earthquake. In spite of its simplicity, the closed-form response
equation yielded accurate to conservative results that are acceptable approximation of the top
drift of the building in all earthquake zones and soil profiles.
Acknowledgement
The author would like to acknowledge the financial support provided by Qatar University
through the Internal Grant # QUUG-CENG-CA-09/10-2.
References
1. Mori, Yamanaka, Luco, and Cornell (2006), “A static predictor of seismic demand on
frames based on a post-elastic deflected shape", Earthquake Engineering & Structural
Dynamics, 35(10), pp 1295-1318.
2. Chan, Chun-Man, and Zou (2004), “Elastic and inelastic drift performance
optimization for reinforced concrete buildings under earthquake loads", Earthquake
Engineering & Structural Dynamics, 33(8), pp 929-950.
3. Scholl,R.E (1975), “Effect Prediction Guidelines for Structures Subjected to Ground
Motion”, Report No. JAB-99-115, URS/ Blume Engineers, San Francisco, USA.
4. Steven,L.K (1967), “Elastic Stability of Practical Multi-Story Frames”, Proc. Inst.
Civil Engineers, 36, pp 99-117.
5. International Conference of Building Officials (1997), “Uniform Building Code”,
Whittier, California, U.S.A.
6. James, A (2006), "Comparison of methods to predict response spectra at instrumented
sites given the magnitude and distance of an earthquake”, Journal of Earthquake
Engineering, 10(6), pp 887- 902.
7. Al-Ansari, M. S (2009), “Drift Optimization of High-Rise Buildings in Earthquake
Zones”, Journal of tall and special building, 2, pp 291-307.
Formulating building response to Earthquake loading
Mohammed S. Al-Ansari
International Journal of Civil and Structural Engineering
Volume 2 Issue 1 2011
317
8. Carpenter, L (2004), “High Rise Building Cladding Drift Accommodation”, Journal
of Tall and Special Buildings, 13, pp 439-456.
9. Al-Ansari, M. S (1996), “Earthquake Response of Structures by Structural Mixture
Theory”, Journal of Structural Engineering, ASCE, 122, pp 1198-1207.
10. Bentley System Inc. (2009), “STAAD PRO V8i”, Three Dimensional Static and
Dynamic Finite Element Analysis and Design of Structures, 22700 Savi Ranch Pkwy,
Yorba Linda, CA 92887- 4608.
11. Murphy, L. M (1973), “San Fernando, California. Earthquake of February 9, 1971”,
U.S. Department of Commerce, Washington D.C.