Embed Size (px)
Citation preview

Environ. Sei. Technol. 1083, 17, 753-757
Formaldehyde Release Rate Coefficients from Selected
John A. Pickrell," Brian V. Mokler,t Larry C. Grlffls,s and Charles H. Hobbs
Inhalation Toxicology Research Institute, Lovelace Biomedical and Environmental Research New Mexico 87185
Amblka Bathlja
U.S. Consumer Product Safety Commission, Washington, DC
Many consumer products release formaldehyde into the atmosphere in varying concentrations. A modification of the Japanese Industrial Standard (JIS) desiccator test was used to measure formaldehyde release after conditioning for 46 samples from six different types of consumer products (pressed wood products, clothes, insulation, pa- per, fabric, and carpet). Release rate coefficients were calculated per unit mass (pg g-l dayT1) and surface area (pg mT2 day-l) for each product. The latter coefficient was used to rank the products. The eight highest release coefficients were from pressed wood products. More than half (24) of the products had release coefficients that were less than or equal to 100 pg of formaldehyde released (m2 of product surface area)-l day-l. Individual samples from five of the six types of products were represented in this class. The fraction of total extractable formaldehyde released each day under JIS desiccator conditions at loading of 21 m2/m3 was calculated. Wood products and carpets released - 1-4% of total extractable formaldehyde per day while fiberglass insulation released -10% per day under the conditions of this 2-day test procedure.
Introduction The widespread use of products containing form-
aldehyde-based resins has led to the observation that many of these products release formaldehyde, leading to con- sumer annoyance and health-related complaints. Form- aldehyde levels in houses and trailers have been measured in many cases and have been associated with various symptoms. The most common symptoms include irritation of eyes and upper respiratory tract (1-4). Formaldehyde has produced nasal carcinomas in mice and rats following prolonged exposure to 14.1 (mice and rats) and 5.6 ppm (rats) (1,5-7). These findings have led to an intensified concern with various consumer products that release formaldehyde into the indoor environment.
The Japanese Industrial Standard (JIS) desiccator procedure is widely used to measure formaldehyde release coefficients a t - 100% relative humidity (RH) (8-14). Analysis of consumer products in equilibrium with - 100O RH by the JIS desiccator procedure has been widely ac- cepted as a way of ranking relative release rate coefficients from different products (8, 11, 12).
Formaldehyde is extremely soluble in water (40 g/100 mL of water a t 20 "C) (8). Thus, water content of a product and fluctuations in the content could influence the formaldehyde release by various products. Because others (2,8,15,16) have reported that any change in water content of the product may alter formaldehyde release over a short-term period, it is important that the water content of the product be close to or at equilibrium with the RH of the test atmosphere.
t Present address: Small Particle Technology, Albuquerque, NM
* Present address: Chevron Environmental Health Center, Rich- 87111.
mond, CA 94802.
20201
Consumer Products
Institute, Albuquerque,
Table I. Samples Analyzed by the Modified JIS Desiccator Procedure
no. of different samples
general types of samples analyzed
pressed wood products 1 2 new unwashed clothes 4 insulation products 6 paper products 3 fabric 14 carpet 7
Little systematic information is available concerning the amounts of formaldehyde released by various consumer products. This research was directed toward measuring formaldehyde release rates of various consumer products and providing a ranking by product type. We report relative release coefficients of formaldehyde from 46 con- sumer products including pressed wood products, clothes, insulation products, paper products, and fabrics and car- pets. The percent of total extractable formaldehyde re- leased per day was also determined for selected products.
Methods Forty-six different brands or lots of consumer products
of six different general types were analyzed in this study. All products were collected and provided by the Consumer Product Safety Commission with the exception of two wood products. All products were purchased from com- mercial sources. The time of manufacture relative to purchase was not known. After purchase, samples were encased in plastic wrap until conditioning to minimize release of formaldehyde. One sample each of particle board and interior plywood was obtained locally and is so identified. Table I indicates the number and type of samples analyzed. Each of these products was conditioned at room temperature, and -100% RH until a nearly constant weight was obtained (weight gain <0.1% of the product weight per day). This was necessary to bring the sample near equilibrium with the test atmosphere, and it required from 4 to 9 weeks. Samples were tested by using the JIS desiccator procedure as described by Meyer (8) except that we used a reservoir containing 200 mL of water instead of one containing 300 mL of water. Formaldehyde which was released was collected in the water of this res- ervoir. The JIS desiccator procedure was carried out for all products a t 21 m2/m3 loading [surface area (m2>/ chamber volume (m3)] in a -9-L desiccator (8,17) (Figure 1). Lateral surface area was calculated by using outside dimensions. The surface area on both sides and lateral faces was used in the loading calculations. The volume of six pieces of wood products tested was <12% of cham- ber volume. Other products had similar surface areas and occupied volumes which displaced less than 12% of the chamber air.
A constant release rate of formaldehyde from pressed wood products for 8 days in the JIS desiccator has pre-
0013-936X/83/0917-0753$01 S O / O 0 1983 American Chemical Soclety Envlron. Scl. Technol., Vol. 17, No. 12, 1983 753

Table 11. Release of Formaldehyde from Consumer Products
Fg g-’ day-’ a
(A) Pressed Wood Products particle board
A 4.1-5.3 B 6.7-8.1 C 4.9-7.1 D 0.4-0.4
A (interior) 7.5-9.2 B (exterior) 0.03-0.03
plywood
C (exterior)c ND (O.O1)d paneling
A 19-21 B 4.6-4.7 C 6.9-7.3 D 3.9-4.3 E 0.84-0.86
(B) New Clothes Not Previously Washed men’s shirts (polyester/cotton) 2.5-2.9 ladies’ dresses 3.4-4.9 girls’ dresses (polyester/cotton) 0.9-1.1 children’s clothes (polyester/cotton) 0.2-0.3
0.7 5-in. fiberglass ceiling panel 1.3-1.7 rigid round airduct 0.66-0.72 rigid round fiberglass duct 0.06-0.06 fiberglass 1.0-2.3 3.5-in. fiberglass 0.3-0.7 blackface insulation sheathing 0.03-0.04
(C) Insulation Products
A B C
drapery fabric A (100% cotton) B (100% cotton) C (blend, 77% rayon-23% cotton) D (blend, 77% rayon-23% cotton)
upholstery fabric A (100% nylon) B (100% nylon) C (100% olefin) D (100% olefin) E (100% cotton) F (100% cotton)
latex-backed fabric A B
A B
blend fabric
A (foam-backed) B (foam-backed) C (foam-backed) D E F G
(D) Paper Plates and Cups 0.12-0.36 0.03-0.14 0.10-0.15
(E) Fabrics
2.8-3.0 0.8-0.9 0.3-0.3 ND (O.O1)d
0.03-0.05 0.02-0.02 0-0.02 ND (0.014) ND (0.014) ND (0.015)
0.5-0.6 ND (0.015)
0.3-0.4 0.2-0.3
(F) Carpets 0.05-0.06 0.006-0.01 0-0.002 0.0005-0.0009 0.0007-0.0009 0-0.0009 ND (0.043)d
pg m-2 day-’
13 000-17 000 23 000-26 000 20 000-28 000
1800-2 200
13 000-1 5 000 54-56
ND
32 000-36 000 7 100-7 500 6 400-6 900 5 200-5 600 1480-1 540
380-550 380-750 120-140
15-55
390-540 390-430 150-150 260-620
52-130 340-420
400-1 0 00 75-450
330-335
330-350 90-120 50-50
N D
9-11 6-7 0-5 ND N D ND
90-100 N D
20-30 20-30
60-65 8-13 0-2 0-4 0-1 0-1 ND
a Range of two or more measured values expressed as Fg of formaldehyde (g of product)-’ day-’.
ND = Below limit of detection.
Range of two or more measured values expressed as pg of formaldehyde (m2 of area product)-’ day-’,
viously been reported by our laboratory (14, 17). The measurements in this study were conducted in the first 48-72 h after the product was placed in the desiccator. A 24-h measurement was made a minimum of two times during this period. For each measurement 51 mL of water was withdrawn from the 200-mL reservoir. Analysis of multiple samples of particle board indicated that the variation observed was evenly divided between variation associated with repeated daily measurements on the same
754 Environ. Sci. Technoi., Vol. 17, No. 12, 1983
Characteristics of exterior plywood. Parentheses contain limit of detection.
sample (average coefficient of variation = 10 f 2 % ) and variation associated with different samples of the same product (average coefficient of variation = 13 f 7%). This predicts a combined average coefficient of variation of 16%. The upper and lower boundaries of the ranges re- ported in Table I1 are consistent with these coefficients of variation.
Aqueous formaldehyde was measured by using a mod- ified pararosaniline method (17,18). The formaldehyde
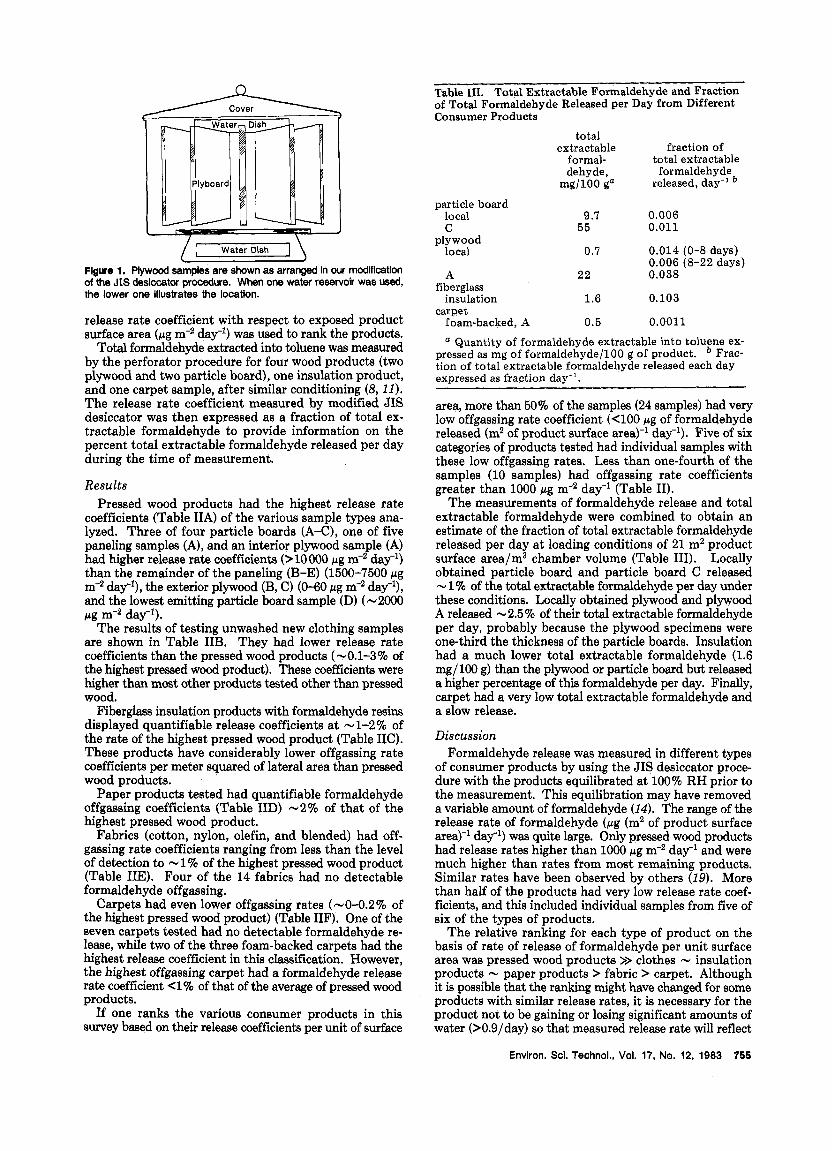
Water Dish 1 Flgure 1. Plywood samples are shown as arranged in our modificatlon of the JIS desiccator procedure. When one water reservoir was used, the lower one illustrates the location.
release rate coefficient with respect to exposed product surface area (pg m-2 day-') was used to rank the products. Total formaldehyde extracted into toluene was measured
by the perforator procedure for four wood products (two plywood and two particle board), one insulation product, and one carpet sample, after similar conditioning (8,11). The release rate coefficient measured by modified JIS desiccator was then expressed as a fraction of total ex- tractable formaldehyde to provide information on the percent total extractable formaldehyde released per day during the time of measurement.
Results Pressed wood products had the highest release rate
coefficients (Table IIA) of the various sample types ana- lyzed. Three of four particle boards (A-C), one of five paneling samples (A), and an interior plywood sample (A) had higher release rate coefficients (>lOOOO pg m-2 day-') than the remainder of the paneling (B-E) (1500-7500 pg m-2 day-I), the exterior plywood (B, C) (0-60 pg m-2 day-'), and the lowest emitting particle board sample (D) (-2000 pg m-2 day-').
The results of testing unwashed new clothing samples are shown in Table IIB. They had lower release rate coefficients than the pressed wood products (-0.1-3% of the highest pressed wood product). These coefficients were higher than most other products tested other than pressed wood.
Fiberglass insulation products with formaldehyde resins displayed quantifiable release coefficients a t - 1-2% of the rate of the highest pressed wood product (Table IIC). These products have considerably lower offgassing rate coefficients per meter squared of lateral area than pressed wood products.
Paper products tested had quantifiable formaldehyde offgassing coefficients (Table IID) -2% of that of the highest pressed wood product.
Fabrics (cotton, nylon, olefin, and blended) had off- gassing rate coefficients ranging from less than the level of detection to - 1 % of the highest pressed wood product (Table IIE). Four of the 14 fabrics had no detectable formaldehyde offgassing.
Carpets had even lower offgassing rates (-0-0.2% of the highest pressed wood product) (Table IIF). One of the seven carpets tested had no detectable formaldehyde re- lease, while two of the three foam-backed carpets had the highest release coefficient in this classification. However, the highest offgassing carpet had a formaldehyde release rate coefficient 4 % of that of the average of pressed wood products.
If one ranks the various consumer products in this survey based on their release coefficients per unit of surface
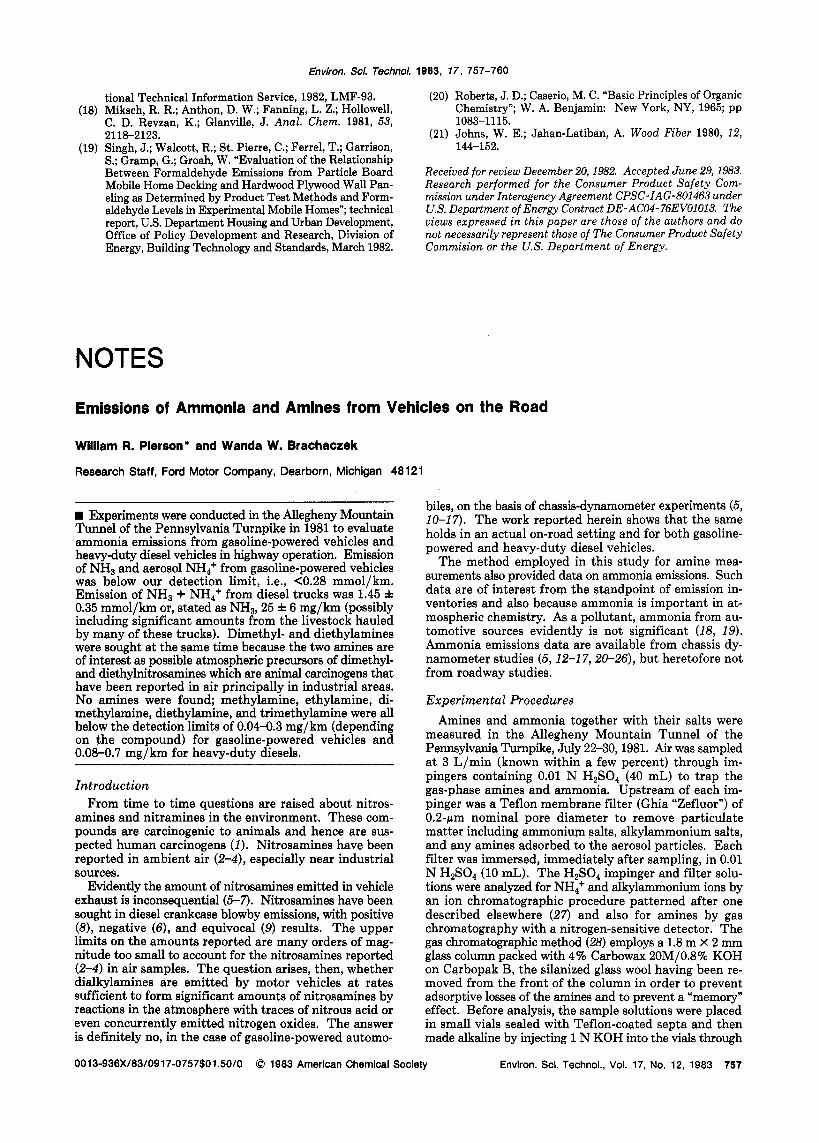
Table 111. Total Extractable Formaldehyde and Fraction of Total Formaldehyde Released per Day from Different Consumer Products
total extractable fraction of
total extractable formal- formaldehyde de hy de,
mg/100 ga released, day-'
particle board local 9.7 0.006 C 55 0.011
local 0.7 0.014 (0-8 days)
A 22 0.038
insulation 1.6 0.103
plywood
0.006 (8-22 days)
fiberglass
carpet foam-backed, A 0.5 0.0011
a Quantity of formaldehyde extractable into toluene ex- Frac- pressed as mg of formaldehyde/100 g of product.
tion of total extractable formaldehyde released each day expressed as fraction day-'.
area, more than 50% of the samples (24 samples) had very low offgassing rate coefficient (<lo0 pg of formaldehyde released (m2 of product surface area)-' day-'). Five of six categories of products tested had individual samples with these low offgassing rates. Less than one-fourth of the samples (10 samples) had offgassing rate coefficients greater than 1000 pg m-2 day-' (Table 11).
The measurements of formaldehyde release and total extractable formaldehyde were combined to obtain an estimate of the fraction of total extractable formaldehyde released per day at loading conditions of 21 m2 product surface area/m3 chamber volume (Table 111). Locally obtained particle board and particle board C released - 1% of the total extractable formaldehyde per day under these conditions. Locally obtained plywood and plywood A released -2.5% of their total extractable formaldehyde per day, probably because the plywood specimens were one-third the thickness of the particle boards. Insulation had a much lower total extractable formaldehyde (1.6 mg/100 g) than the plywood or particle board but released a higher percentage of this formaldehyde per day. Finally, carpet had a very low total extractable formaldehyde and a slow release.
Discussion Formaldehyde release was measured in different types
of consumer products by using the JIS desiccator proce- dure with the products equilibrated at 100% RH prior to the measurement. This equilibration may have removed a variable amount of formaldehyde (14). The range of the release rate of formaldehyde (pg (m2 of product surface area)-' d a y 3 was quite large. Only pressed wood products had release rates higher than 1000 pg m-2 day-l and were much higher than rates from most remaining products. Similar rates have been observed by others (19). More than half of the products had very low release rate coef- ficients, and this included individual samples from five of six of the types of products.
The relative ranking for each type of product on the basis of rate of release of formaldehyde per unit surface area was pressed wood products >> clothes - insulation products - paper products > fabric > carpet. Although it is possible that the ranking might have changed for some products with similar release rates, it is necessary for the product not to be gaining or losing significant amounts of water (>0.9/day) so that measured release rate will reflect
Envlron. Sci. Technol., Vol. 17, No. 12, 1983 755

the true release rate as closely as possible. Considering the surface area of each type of product likely to be present and the relative release rate coefficients, pressed wood products appear to have the greatest potential for form- aldehyde release in a house. Exterior plywoods released very little formaldehyde, possibly because of the use of phenol-formaldehyde instead of urea-formaldehyde resin. Urea-formaldehyde resins hydrolyze slowly in continuous contact with moisture (8). Phenol-formaldehyde resins have a different chemical structure. They lack the chem- ical features which allow urea-formaldehyde to be hy- drolyzed (8,20). The degree to which a second product with a lower release of formaldehyde might reduce the high formaldehyde release of particle board, when they are in combination, is an unresolved question.
Release rate coefficients determined in this report for a variety of products are only one way of assessing the relative potential for release of formaldehyde from these products. The release rate coefficient based on surface area is a more realistic measure of potential release than is one based on weight. In this report, samples were measured at loadings of 21 m2 surface area/m3 chamber volume loading. Values of greater than fivefold higher release of formaldehyde were measured for particle board and ply- wood a t lower loadings of 1.5-1.8 m2 of surface area/m3 of chamber volume (16). The degree to which the ranking in this report would change under loading conditions more like the lower conditions typically present in houses and mobile homes should be investigated in the future.
Total extractable formaldehyde as measured by the perforator procedure (8) provided an interesting adjunct to the measurement of formaldehyde release rate coeffi- cients. Although measured only once for each product, it provided an estimate of the total amount of formaldehyde which is available for release at the time of extraction. Total extractable formaldehyde was correlated with form- aldehyde release coefficients measured at 1.5-1.8 m2 of product surface area/ms of chamber volume loading in a desiccator (r2 = 0.96; p < 0.02) (16).
No such relationship was apparent in this study between total extractable formaldehyde and the fraction that was released per day. Under the conditions of testing used in this study, insulation released a higher fraction of its ex- tractable formaldehyde during the period of testing than did either wood or carpet products (Table 111). Also, the fraction of total extractable formaldehyde released per day a t 21 m2 of product surface area/m3 of chamber volume loading was higher for interior plywood than for particle board or carpet (Table 111). The mechanism for this re- lease of different fractions of total extractable form- aldehyde in different products is poorly understood. However, it may relate to differing total surface area to mass ratios of these products as compared to the lateral surface area used for these calculations. In regard to total surface area, glass fiber insulation would be higher than wood products or carpet. Likewise, lateral surface area of insulation products was probably much less than the available surface area in this product.
Alternatively, this difference may relate to the water content of the product (very low in insulation relative to carpet or wood products). Since formaldehyde moves to the water phase of a wood-water-formaldehyde mixture (21), insulation may have a higher equilibrium pressure for formaldehyde relative to its total extractable form- aldehyde than wood producta and release a higher fraction of its extractable formaldehyde. A third alternative is that formaldehyde and wood may interact within the process of release.
Although both carpet and particle board release only a small fraction of their extractable formaldehyde, the ex- tractable formaldehyde from particle board was -20-100 times higher than that of carpet (considered to be negli- gible). Moreover, particle board can release 225% of its extractable formaldehyde at this initial rate (1 7) over an -40-day time period. On the other hand, insulation re- leased - 10% of its total extractable formaldehyde during 1 day of measurement.
These data and interpretations point the way toward the type of information needed for understanding form- aldehyde release profiles. An initial concern would be with measured room levels of formaldehyde. The information required to convert measured release of formaldehyde in small static chambers (desiccators) to room levels of formaldehyde should be collected. This type of informa- tion should be collected in a well-designed dynamic chamber system over time, so that release measurements may be made in a system with air movement similar to that of a dwelling which would aid in converting formaldehyde release to room levels.
Acknowledgments
The technical assistance of Tina Shifani, the illustrative assistance of Emerson E. Goff, and the scientific and editorial review of Rogene F. Henderson, Ray L. Hanson, Alan R. Dahl, and other members of the ITRI staff are gratefully acknowledged.
Registry No. Formaldehyde, 50-00-0.
Literature Cited (1) Blackwell, M.; Kang, H.; Thomas, A,; Infante, P. Am. Ind.
(2) Committee on Toxicology “Formaldehyde and Its Health Effects”; prepared for Consumer Product Safety Com- mission by National Academy Sciences, March 1980.
(3) Schuck, E. A.; Stephens, E. R.; Middleton, J. T. Arch. Enuiron. Health 1966, 13, 570-575.
(4) Olsen, J. H.; Dossing, M. Am. Ind. Hyg. Assoc. J. 1982,43
Hyg. ASSOC. J. 1981, 42 (7), A34-A46.
- (5), 366-370.
(5) Swenberg, J. A,; Kerns, W. D.; Mitchell, R. I.; Gralla, E. J.; Pavkov, K. L. Cancer Res. 1980,40, 3398-3401.
(6) Albert, R.; Sellakumar, A.; Laskin, S.; Kuschner, M.; Nelson, N.; Snyder, C. A. JNCI, J. Natl. Cancer Inst. 1982,68 (4),
(7) Committee on Indoor Pollutants “Indoor Pollutants”; National Research Council, National Academy Press: Washington, DC, 1981.
(8) Meyer, B. “Urea Formaldehyde Resins”; Addison-Wesley: Reading, MA, 1979; p 423.
(9) Meyer, B.; Koshlap, K. Molecular and Materials Research Division, Lawrence Berkeley Laboratory, University of California, Berkeley, CA 1981, LBL Report 12570 (DRAFT).
(10) Myers, G. E.; Nagoka, M. Symposium on Wood Adhesives-Research, Applications and Needs, Forest Product Laboratories, Madison, WI, Sept 1980.
(11) Myers, G. E.; Nagoka, M. Wood Sci. 1981,13 (3), 14C-150. (12) Sundin, B., presented at The International Particle Board
Series Symposium No. 16, Washington State University, Pullman, WA, March 30-April 1, 1982.
(13) Fujii, S.; Suzuki, T.; Koyagashiro, S. Kenzai Shiken Joho, Transl., 1973, 9 (3), 10-14.
(14) Griffis, L.; Pickrell, J. A. Enuiron. Int. 1983, 9, 3-7. (15) Andersen, I.; Lundquist, G. R.; Molhave, L. Atrnos. Enuiron.
1975, 9, 121-127. (16) Moschondreas, D. J.; Rector, H. E. National Technical
Information Service, 1981, Technical Report LBL-12590, EEB-Vent El-12.
(17) Pickrell, J. A.; Griffis, L. C.; Hobbs, C. H. “Release of Formaldehyde from Various Consumer Products”; final report to the Consumer Product Safety Commission, Lovelace Inhalation Technology Research Institute, Na-
597-603.
756 Envlron. Sci. Technol., Vol. 17, No. 12, 1983
Environ. Sci. Technol. 1903, 17, 757-760
tional Technical Information Service, 1982, LMF-93. (18) Miksch, R. R.; Anthon, D. W.; Fanning, L. Z.; Hollowell,
C. D. Revzan, K.; Glanville, J. Anal. Chem. 1981, 53,
(19) Singh, J.; Walcott, R.; St. Pierre, C.; Ferrel, T.; Garrison, S.; Gramp, G.; Groah, W. “Evaluation of the Relationship Between Formaldehyde Emissions from Particle Board Mobile Home Decking and Hardwood Plywood Wall Pan- eling as Determined by Product Test Methods and Form- aldehyde Levels in Experimental Mobile Homes”; technical report, U.S. Department Housing and Urban Development, Office of Policy Development and Research, Division of Energy, Building Technology and Standards, March 1982.
2118-2123.
(20) Roberts, J. D.; Caeerio, M. C. “Basic Principles of Organic Chemistry”; W. A. Benjamin: New York, NY, 1965; pp 1083-11 15.
(21) Johns, W. E.; Jahan-Latiban, A. Wood Fiber 1980, 12, 144-152.
Received for review December 20,1982. Accepted June 29,1983. Research performed for the Consumer Product Safety Com- mission under Interagency Agreement CPSC-IAG-801463 under U S . Department of Energy Contract DE-AC04-76EV01013. The views expressed in this paper are those of the authors and do not necessarily represent those of The Consumer Product Safety Commision or the U S . Department of Energy.
NOTES
Emissions of Ammonia and Amines from Vehicles on the Road
William R. Plerson” and Wanda W. Brachaczek
Research Staff, Ford Motor Company, Dearborn, Michigan 48 121
Experiments were conducted in the Allegheny Mountain Tunnel of the Pennsylvania Turnpike in 1981 to evaluate ammonia emissions from gasoline-powered vehicles and heavy-duty diesel vehicles in highway operation. Emission of NH3 and aerosol NH4+ from gasoline-powered vehicles was below our detection limit, i.e., K0.28 mmol/km. Emission of NH3 + NH4+ from diesel trucks was 1.45 f 0.35 mmol/km or, stated as NH3, 25 f 6 mg/km (possibly including significant amounts from the livestock hauled by many of these trucks). Dimethyl- and diethylamines were sought a t the same time because the two amines are of interest as possible atmospheric precursors of dimethyl- and diethylnitrosamines which are animal carcinogens that have been reported in air principally in industrial areas. No amines were found; methylamine, ethylamine, di- methylamine, diethylamine, and trimethylamine were all below the detection limits of 0.04-0.3 mg/km (depending on the compound) for gasoline-powered vehicles and 0.08-0.7 mg/km for heavy-duty diesels.
Introduction From time to time questions are raised about nitros-
amines and nitramines in the environment. These com- pounds are carcinogenic to animals and hence are sus- pected human carcinogens (1). Nitrosamines have been reported in ambient air (2-4), especially near industrial sources.
Evidently the amount of nitrosamines emitted in vehicle exhaust is inconsequential (5-7). Nitrosamines have been sought in diesel crankcase blowby emissions, with positive (8), negative (6), and equivocal (9) results. The upper limits on the amounts reported are many orders of mag- nitude too small to account for the nitrosamines reported (2-4) in air samples. The question arises, then, whether dialkylamines are emitted by motor vehicles a t rates sufficient to form significant amounts of nitrosamines by reactions in the atmosphere with traces of nitrous acid or even concurrently emitted nitrogen oxides. The answer is definitely no, in the case of gasoline-powered automo-
biles, on the basis of chassis-dynamometer experiments (5, 10-17). The work reported herein shows that the same holds in an actual on-road setting and for both gasoline- powered and heavy-duty diesel vehicles.
The method employed in this study for amine mea- surements also provided data on ammonia emissions. Such data are of interest from the standpoint of emission in- ventories and also because ammonia is important in at- mospheric chemistry. As a pollutant, ammonia from au- tomotive sources evidently is not significant (18, 19). Ammonia emissions data are available from chassis dy- namometer studies (5, 12-1 7,20-26), but heretofore not from roadway studies.
Experimental Procedures Amines and ammonia together with their salts were
measured in the Allegheny Mountain Tunnel of the Pennsylvania Turnpike, July 22-30,1981. Air was sampled at 3 L/min (known within a few percent) through im- pingers containing 0.01 N H2S04 (40 mL) to trap the gas-phase amines and ammonia. Upstream of each im- pinger was a Teflon membrane filter (Ghia “Zefluor”) of 0.2-pm nominal pore diameter to remove particulate matter including ammonium salts, alkylammonium salts, and any amines adsorbed to the aerosol particles. Each filter was immersed, immediately after sampling, in 0.01 N H2S04 (10 mL). The H2S04 impinger and filter solu- tions were analyzed for NH4+ and alkylammonium ions by an ion chromatographic procedure patterned after one described elsewhere (27) and also for amines by gas chromatography with a nitrogen-sensitive detector. The gas chromatographic method (28) employs a 1.8 m X 2 mm glass column packed with 4% Carbowax 20M/0.8% KOH on Carbopak B, the silanized glass wool having been re- moved from the front of the column in order to prevent adsorptive losses of the amines and to prevent a “memory” effect. Before analysis, the sample solutions were placed in small vials sealed with Teflon-coated septa and then made alkaline by injecting 1 N KOH into the vials through
0013-936X/83/0917-0757$01.50/0 0 1983 American Chemical Society Envlron. Scl. Technol., Vol. 17, No. 12, 1983 757