Embed Size (px)
Citation preview
FORM TI-1207/1999
B-T-3327
The Fracture Strength of Plate and Tubular forms of Monolithic Silicon Carbide (SiC) Produced byChemical Vapor Deposition (CVD)
B.V. Cockeram
USDOE contract No. DE-ACI 1-98 PN38206
This report was prepared as an account of work sponsored by the United States Government. Neitherthe United States, nor the United States Department of Energy, nor any of their employees, nor any oftheir contractors, subcontractors, or their employees, makes any warranty, express or implied, orassumes any legal liability or responsibility for the accuracy, completeness or usefulness of anyinformation, apparatus, product or process disclosed, or represents that its use would not infringeprivately owned rights.
I I
BETTIS ATOMIC POWER LABORATORY WEST MIFFLIN, PENNSYLVANIA 15122-0079
Operated for the U.S. Department of Energyby Bechtel Bettis, Inc.
DISCLAIMER
This repo~ was prepared as an account of work sponsoredby an agency of the United States Government. Neitherthe United States Government nor any agency thereof, norany of their employees, make any warranty, express orimplied, or assumes any legal Iiabiiity or responsibility forthe accuracy, completeness, or usefulness of anyinformation, apparatus, product, or process disciosed, orrepresents that its use wouid not infringe privately ownedrights. Reference herein to any specific commercialproduct, process, or service by trade name, trademark,manufacturer, or otherwise does not necessarily constituteor imply its endorsement, recommendation, or favoring bythe United States Government or any agency thereof. Theviews and opinions of authors expressed herein do notnecessarily state or reflect those of the United StatesGovernment or any agency thereof.

DISCLAIMER
Portions of this document may be illegiblein electronic image products. Images areproduced from the best available originaldocument.
Page 1
‘The Fracture Strenqth of Plate and Tubular forms of Monolithic Silicon Carbide (SiC) Produced
by Chemical Vapor Deposition (CVD) M~VE.D“Jhullaot
B.V. Cockeram@r$.~ ~
Bechtel-Bettis Atomic Power Laboratory, P.O. Box 79, West Mifflin, PA 15122-0079.
Abstract
The fracture strength of silicon carbide (SiC) plate deposits produced by Chemical Vapor
Deposition (CVD) was determined from room-temperature to 1500”C using a standard 4-point
flexural test method (ASTM Cl 161). CVD SiC materials produced by two different
manufacturers are shown to have only slightly different flexural strength values, which appear to
result from differences in microstructure. Although CVD deposition of SiC results in a textured
grain structure, the flexural strength was shown to be independent of the CVD growth direction.
The orientation of machining marks was shown to have the most significant influence on flexural
strength, as expected.
The fracture strength of tubular forms of SiC produced by CVD deposition directly onto a
mandrel was comparable to flexural bars machined from a plate deposit. The tubular (o-ring)
specimens were much smaller in volume than the flexural bars, and higher strength values are
predicted based on Weibull statistical theory for the o-ring specimens. Differences in
microstructure between the plate deposits and deposits made on a mandrel result in different
flaw distributions and comparable strength values for the flexural bar and o-ring specimens.
These results indicate that compression testing of o-rings provides a more accurate strength
measurement for tubular product forms of SiC due to more representative flaw distributions.
‘This work was preformed under USDOE Contract DE-AC11 -98 PN38206.
Page 2
1. Introduction
Mechanical properties must be determined to properly design and predict the
performance of SiC structural components. Fast fracture or flexural tests, which represent the
resistance of a ceramic material to fracture under an applied stress, are the most basic measure
of strength. Flexural test data can be used to derive Weibull statistical data for a specific lot of
material. Weibull statistical data are used to predict the probability of failure for a ceramic
material under an applied stress., The purpose of this work is to measure the strength of SiC
materials produced by Chemical Vapor Deposition (CVD).
CVD SiC has high purity (99.99% pure on a metals basis) and a cubic &SiC structure,
while hot-pressed or sintered SiC has the hexagonal a-SiC structure’. CVD SiC is precipitated
from gas-phase precursors onto a substrate, and uniaxially grows with a preferred grain
orientation to form the solid deposit. CVD SiC material is commercially available from Coors
Ceramics Company, Golden, CO, and Morton Advanced Ceramics, Woburn, MA. Reported
vendor data indicates that the flexural strength, thermal conductivity, and Coefficient of Thermal
Expansion (CTE) are slightly different2)3. These small differences in properties may result from
differences in the CVD deposition parameters and resulting microstructure. One purpose of the
purpose of this work is to determine the flexural strength of Morton and Coors CVD SiC by a 4-
point bend test method in accordance with ASTM Cl 161-944. Since the microstructure is
orientated with respect to the CVD growth direction, flexural test bars were also machined with
the primary stress direction either perpendicular or parallel to the CVD growth direction to
determine if the strength of CVD SiC is isotropic. Furthermore, CVD SiC is typically machined to
form a desired component, which results in fine machining marks that are orientated in the
direction of final grinding. Flexural bars were tested with the machining marks orientated
parallel to the length of the bar and perpendicular to the length of the bar to evaluate the
influence of the machining marks.
Page 3
Since the manufacturing process can have a significant influence on mechanical
properties,, testing of prototypic specimen geometries is important. For example, the most
accurate strength of reaction-bonded SiC tubes was previously determined by the compression
testing of o-ring specimens rather than flexural testing5’G. Another goal of this work is to perform
compression testing on CVD SiC o-rings to compare the strength with flexural test results
obtained from flat plate deposits.
Il. Materials, Test Procedures, and Post-Test Characterization
CVD SiC plate was obtained from Morton Advanced Materials, Woburn, MA (1 1.4cm X
11 .4cm X 0.76cm) and Coors Ceramics, Golden, CO (0.71 cm thick). Flexural bars (5.08cm X
0.635cm X 0.318cm) were machined from the CVD SiC plates in accordance with specimen
size D of ASTM Cl 161-944. All of the bend bars had an as-ground finish. Two separate lots of
Morton and Coors CVD SiC were evaluated.
Table I is a summary of results for the various lots of CVD SiC bars tested. Thirty (30)
bars machined from Lot# 9016 of Morton CVD SiC had the 0.635cm dimension perpendicular to
the CVD growth direction, and the machining marks were parallel to the bar length. Two
different flexural bar orientations were machined from Lot# 9045 of Morton CVD SiC, which had
the machining marks perpendicular to the length of the bar: (1) thirty (30) bars with the 0.635cm
dimension perpendicular to the CVD growth direction, and (2) thirty (30) bars with the 0.635cm
dimension parallel to the CVD growth direction. Thirty (30) bars were machined from Lot# 8372
of Coors CVD SiC with the 0.635cm dimension perpendicular to the CVD growth direction. Two
different bar orientations were machined from Lot# 9063 of Coors CVD SiC: (1) twenty (20) bars
with the 0.635cm dimension perpendicular to the CVD growth direction, and (2) twenty (20) bars
with the 0.635cm dimension parallel to the CVD growth direction. Bars in groups of twenty (20)
from Lot # 9063 of Coors CVD SiC were tested at 800”C, 1090”C, and 1500”C.
Two different tubular (o-ring) geometries of CVD SiC were obtained from Coors
Ceramics: (1) 0.787cm OD, 0.635cm ID, and 0.635cm length, and (2) 0.876cm OD, 0.635cm ID,
and 0.635cm length. All of the tubes had an as-ground finish on the inner diameter and outer
diameter with grinding marks align in the circumferential direction. All of the tubes were
produced in one deposition run (lot #9063), which is the same lot previously used to produce the
flat plates used for flexure testing. The 0.787cm diameter o-rings were tested at room-
temperature (15 rings), 109O”C (16 rings), and 1500°C (15 rings), while the 0.876cm diameter
o-rings were only tested at room-temperature (9 rings) and 1090”C (15 rings).
All flexural tests were performed under 4-point bend loading with an inner span of 19.05
mm and an outer span of 38.1 mm at Composite Testing and Analysis (CT&A), Ann Arbor, Ml in
accordance with ASTM Cl 1614. Tests were performed on an servohydraulic unit equipped with
a precision load cell. For the flexural tests, the center-span deflection of the flexure bars was
measured using a Linear Voltage Differential Transformer (LVDT) that was fitted with a SiC rod
in direct contact with the center of the outer span. Ail flexural tests were performed under
displacement control with a loading rate of 0.05 cm/min. The room temperature tests were
performed at 20°C ~ 2°C with a relative humidity between 45% to 50%. The tests done at high
temperatures (t25°C) were performed in a SiC-element furnace that was flustied with argon
prior to heating and continuously flushed with argon during the test to maintain an oxygen
content less than 10 ppm. For the tests done at 1090”C and 800”C, the furnace temperature
was increased from room temperature to test temperature in 60 minutes. For the tests done at
‘1500”C, the furnace temperature was increased from room temperature to 1500°C in 75
minutes. All test specimens were held at the desired test temperature for 15 minutes prior to
testing.
O-ring compression tests were also performed at CT&A using ASTM Cl 161 as a guide.
The o-ring specimens were loaded in compression between two SiC platens (8 mm x 8 mm),
which were aligned by bringing the platen faces in contact and hydraulically clamping a
hemispherical bearing that was attached to the upper loading platen. A SiC-element furnace
Page 5
was used for specimen heating of the specimen and SiC platens. The tests were performed
under displacement control at a constant loading rate of 0.0083 mm/s. The load line
displacement was measured directly by a water-cooled extensometer that was in contact with
the SiC posts that were used to apply load to the plattens. The wall thickness of the o-rings was
measured using calipers, which produce some level of uncertainty in the measurement of the ID
and OD of the specimen.
Post-test fractographic examinations were performed on the flexural bars and o-ring
specimens using an optical stereo-microscope and Scanning Electron Microscope (SEM) to
identify the flaw location. Metallographic examinations of the flexural bars were performed to
characterize the microstructure of the CVD SiC material. The SiC bars were polished and then
etched for 10 to 30 seconds in mixture of 61 Y. KOH / 397. KN03 (weight%) heated to 500”C.
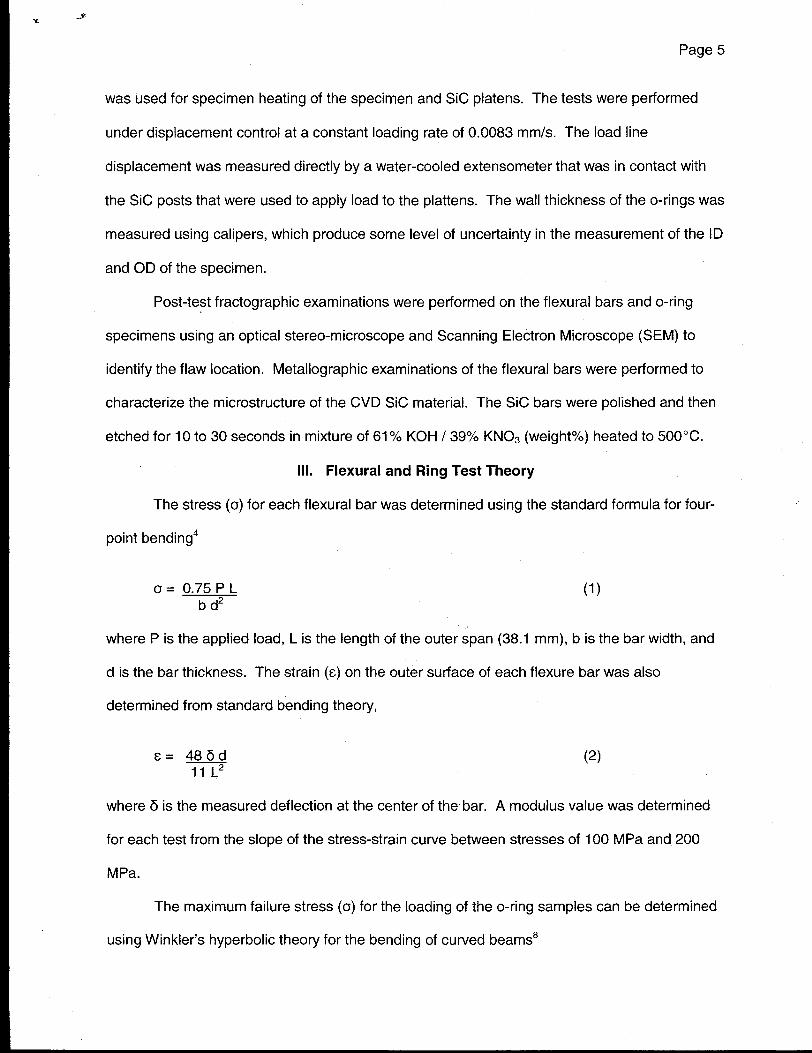
Ill. Flexural and Ring Test Theory
The stress (a) for each flexural bar was determined using the standard formula for four-
point bending4
0=0.75PL (1)b d2
where P is the applied load, L is the length of the outer span (38.1 mm), b is the bar width, and
d is the bar thickness. The strain (c) on the outer surface of each flexure bar was also
determined from standard bending theory,
c= 486d (2)11L2
where 5 is the measured deflection at the center of the bar. A modulus value was determined
for each test from the slope of the stress-strain curve between stresses of 100 MPa and 200
MPa.
The maximum failure stress (o) for the loading of the o-ring samples can be determined
using Winkler’s hyperbolic theory for the bending of curved beams8
Page 6
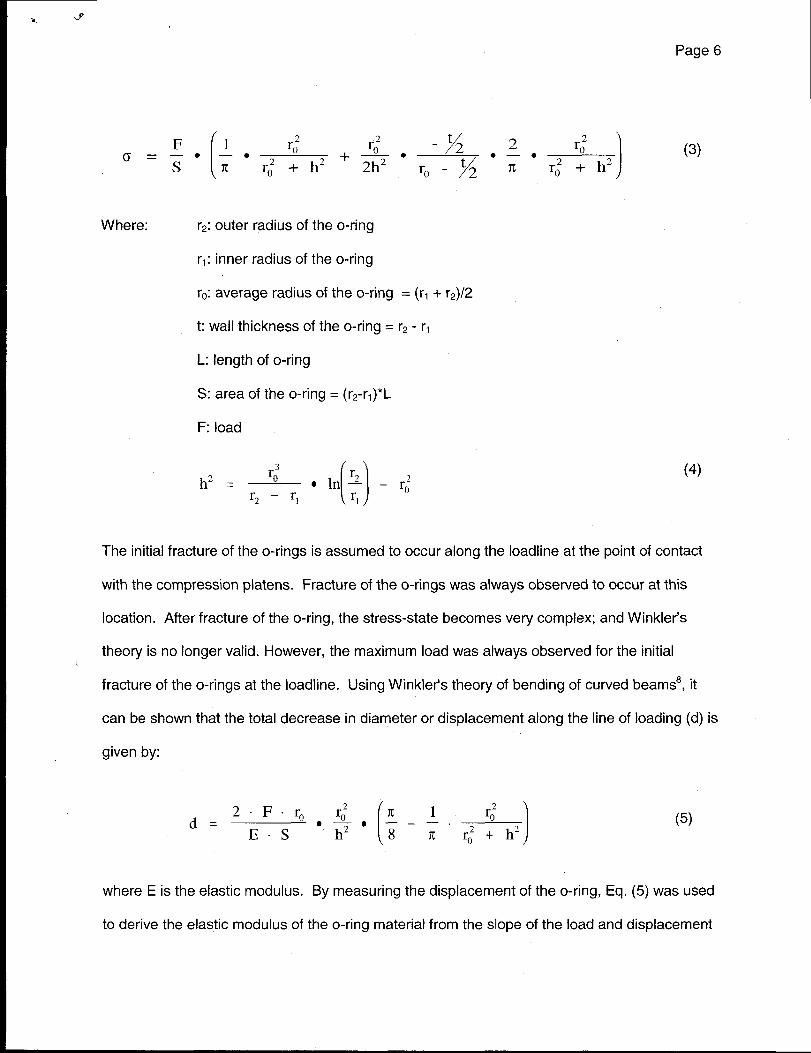
F0=—” s
1 2 2/
_t 2ro ro . 2 2— ●
ro
n r; + h2 ‘2h2ro-~20; ”r~+h2
Where: r2: outer radius of the o-ring
rl: inner radius of the o-ring
rO:average radius of the o-ring = (r, + r2)/2
t: wall thickness of the o-ring = r2 - rl
L: length of o-ring
S: area of the o-ring= (r2-rl)*L
F: load
h2 = ‘;[
r2● ]n—
r2 – rl rl
(3)
(4)
The initial fracture of the o-rings is assumed to occur along the loadline at the point of contact
with the compression platens. Fracture of the o-rings was always observed to occur at this
location. After fracture of the o-ring, the stress-state becomes very complex; and Winkler’s
theory is no longer valid. However, the maximum load was always observed for the initial
fracture of the o-rings at the Ioadline. Using Winkler’s theory of bending of curved beams8, it
can be shown that the total decrease in diameter or displacement along the line of loading (d) is
given by:
2. Fro 2
[
1 2
d= !iL ,5_. roES ‘h28n r; + h2 1
(5)
where E is the elastic modulus. By measuring the displacement of the o-ring, Eq. (5) was used
to derive the elastic modulus of the o-ring material from the slope of the load and displacement
Page 7
curve. The strain at failure can be found by dividing the maximum tensile stress by the elastic
modulus.
Weibull statistics were used to describe the strength distribution for the SiC flexural and
o-ring tests conducted in this work in accordance with ASTM 12397. Weibull modulus (m) and a
characteristic strength (oe) values were determined, and confidence interval (Cl) bands were
determined.
IV. Results and Discussion
(1) Flexural Test Results for Morton CVD SiC
Flexural bars were machined from two different lots of Morton CVD SiC (Table 1) and
then tested at room-temperature: (1) Lot #9016 with the machining marks parallel to the length
of the bend bar, and (2) Lot #9045 with the machining marks perpendicular to the length of the
bend bar. Low fracture stress and strain values were observed for Lot #9045 CVD SiC
compared to the Lot #9016 material, see Table I and Figure 1. This significant difference in
strength values does not represent lot-to-lot variation, but resulted from the difference in
orientation of the machining marks. Since the fracture toughness of SiC is inherently low (Klc =
3.3 MPa{ml’2), the machining marks on the Lot #9045 bars are fine notches or flaw initiation
sites that result in a significantly lower strength and failure strain than Lot #9016 CVD SiC.
Fractography shows in Figure 2a that surface flaws were the fracture initiation site for all Lot
#9045 bars. The surface flaws are machining marks, which results in less scatter in the
strength data and a significantly higher Weibull modulus for Lot #9045 material (Table l). The
fracture initiation sites for the Lot #901 6 material were all located within the volume of the
material near the surface, see Figure 2b. The flaw initiation sites appeared to either be small
miss-orientated grains or microcracks that are inherent to the microstructure, but exact
identification of the flaw types was difficult. The modulus values for Lot #9016 and #9045 CVD
SiC are identical statistically (Table l), which is further evidence that the differences in strength
result from the orientation of the machining marks. The modulus values determined from these
&.,
Page 8
flexural tests are lower than the values reported in literature (461 GPa1)2), which may result from
some error in the displacement measurement. However, these modulus and fracture strain
values can be used for comparison of the results reported in this paper.
Flexural strength data for Lot #9045 CVD SiC bars machined with the 0.635cm
dimension perpendicular to CVD growth direction and 0.635cm dimension parallel to the CVD
growth direction are also compared in Figure 1. The fracture strength and strain values for the
flexural bars with the 0.635cm dimension parallel to CVD growth direction were slightly lower
than the bars with the 0.635cm dimension perpendicular to growth direction. Although the.
differences in fracture strength and fracture strain are very small, the data scatter is low and
these differences are significant statistically to the 95% Cl. The average modulus values are
identical statistically, which indicates that the modulus value is isotropic. These results indicate
that the strength of the CVD SiC maybe slightly anisotropic, with a slightly higher strength
observed for material that has the CVD growth direction parallel to the primary stress direction,
but the differences are small enough that the strength can be considered to be isotropic.
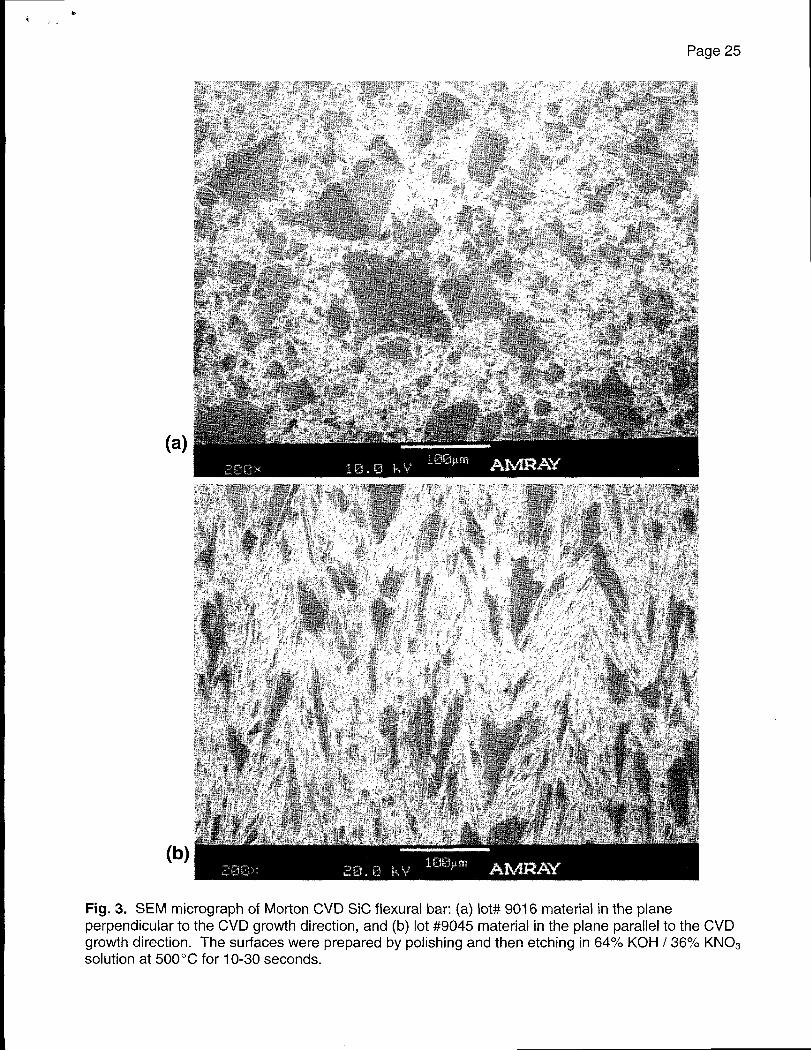
The microstructure in the plane perpendicular to the CVD growth direction (Figure 3a)
consists of a bi-modai distribution of large (100 – 50 ~m) and small (1O – 0.5 ~m) grains. The
microstructure in the plane parallel to the CVD growth direction (Figure 3b) consists of
elongated, acicular-shaped grains with a bimodal distribution of large (100 – 10 ~m diameter)
and small (1O – 0.5 ~m diameter) grains. These examinations indicate that the microstructure
of Morton CVD SiC consists of acicular grains that are aligned parallel to the CVD growth
direction with a bimodal distribution of large (100 – 10 ~m diameter) and small (1O – 0.5 ~m
diameter) grains. Although the Morton CVD SiC microstructure consists of large and small
grains, transgranullar cleavage of these large grains is not observed on the fracture surfaces.
(2) Flexural Test Results for Coors (XD SiC
As summarized in Table 1,flexural bars were machined from two different lots of Coors
CVD SiC at room-temperature with machining marks parallel to the length of the bar: (1) Lot
.*>.
Page 9
#8372 bars machined with the 0.635cm dimension perpendicular to the CVD growth direction,
and (2) Lot #9063 bars with the 0.635cm dimension either perpendicular or parallel to the CVD
growth direction. Figure 1 is a comparison of strength values for Morton and Coors CVD SiC.
Since the Lot #9045 Morton CVD SiC bars had the machining marks aligned perpendicular to
the length of the bar and serving as a notch, the failure strength and stain values are
significantly lower than the Coors material. The strength values and Cl bands for the Lot #8372
Coors SiC are within the range of values for Lot #9016 Morton CVD SiC, see Figure 1, which
indicates that these results are comparable statistically. However, the failure strength and
failure strain values for Lot #9063 Coors CVD SiC are significantly higher than Lot #8372 Coors
CVD SiC and Morton CVD SiC, and the differences are statistically significant to the 95% Cl.
Surface examinations show that the machining marks on the surface of the Lot # 8372 Coors
flexure bars appear slightly longer and deeper than the machining marks on the Lot #9063 bars,
which could possibly have some influence on the fracture stress. These results indicate that the
strength and Weibull modulus of Coors Ceramics CVD SiC can vary from lot-to-lot, but the
fracture strength is at least comparable to Morton CVD SiC.
Although some variation in strength value was observed for the two lots of Coors CVD
SiC, the modulus values are closely similar (Table l). The modulus value for bars from Lot
#9063 CVD SiC bars machined with the 0.635cm dimension perpendicular to the growth
direction and parallel to the growth direction are similar, indicating that the material is fairly
isotropic. The strength values for the bars with the 0.635cm dimension parallel to the CVD
growth direction were slightly higher than the bars machined with the 0.635cm dimension
perpendicular to the CVD growth direction, but the 95% Cl bounds overlap on the Weibull plot
shown in Figure 1. The fracture strength and failure strains for the Lot #9063 Coors CVD SiC
material with the 0.635cm dimension perpendicular or parallel to the CVD growth direction are
comparable statistically to the 95% Cl, which indicates that the mechanical properties of the
Coors CVD SiC material are independent of CVD growth direction.

Page 10
Comparison of the strength values for Lot #9063 Coors CVD SiC measured at room
temperature, 800”C, 1090”C, and 1500”C shows in Figure 4 that slightly higher fracture stress
values were measured at higher temperature and the differences in strength values are
generally significant statistically. The failure strains observed at 800”C and 1090°C are slightly
higher than room temperature, while a significantly higher failure strain is observed at 1500°C,
see Table 1. Furthermore, the modulus values measured at 1090°C (351.6 GPa) and 1500”C
(293.6 GPa) were lower than the room temperature values (357.5 GPa). The decrease in
modulus and increase in fracture strain observed for flexural testing at higher temperatures
indicates that some softening of the material is occurring, which probably represents an
increase in the fracture toughness (Klc) of the material. Higher Klc values are typically observed
for SiC at higher temperatureslO. An increase in K,c would reduce the flaw sensitivity, and result
in a slightly higher flexural strength at higher temperatures. An increase in flexural strength
values at higher temperatures for SiC has been reported2’10’11.
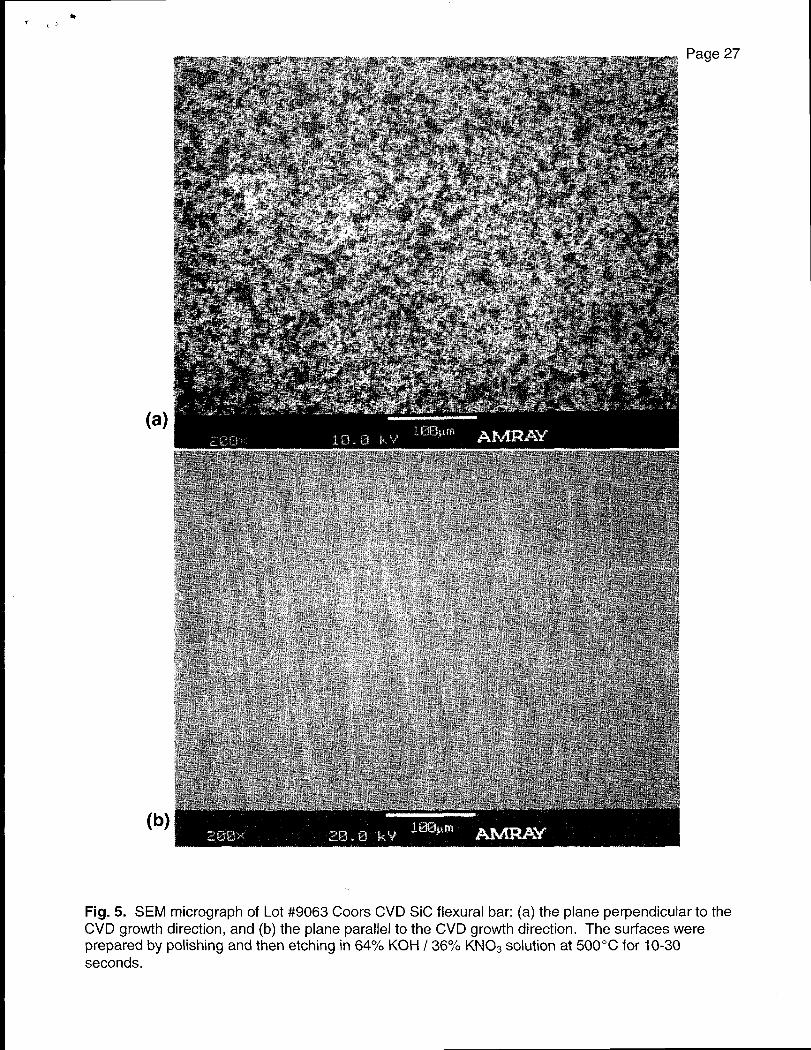
The microstructure of Coors CVD SiC in the plane perpendicular to the CVD growth
direction (Figure 5a) consists of large (50 – 10 ~m) and small (1O – 0.5 ~m) grains. The grain
size of lot #8372 material appears more uniform with a lower fraction of large-sized grains than
the lot #9063 material. The Coors CVD SiC material consists of highly elongated grains in the
plain parallel to the CVD growth direction (Figure 5b). Although the microstructure of Coors
CVD SiC is highly orientated with elongated, high aspect ratio grains aligned parallel to the CVD
growth direction, the material is isotropic with respect to strength and or modulus values.
Comparison of the microstructure for the Coors and Morton CVD SiC in Figures 5 and 3,
respectively, shows that the difference in CVD deposition parameters resulted in quite different
microstructure. The Coors CVD SiC consists of elongated grains that are much longer, smaller
in diameter, and have a higher aspect ratio than the Morton CVD SiC. These differences in the
microstructure of Coors and Morton CVD SiC result in small differences in strength. The
Page 11
i!?1.
strength values for Morton and Coors CVD SiC are within the range of strength values
previously reported for CVD SiCil.
The fracture surfaces of the Coors CVD SiC flexural bars show the high aspect ratio
grains that are aligned parallel to, the 0.635cm dimension (Figure 6), which is consktent with the
microstructure in Figure 5. Fractographic examinations show that the failure site for all the
Coors CVD SiC flexural bars was within the volume of material and near the surface. Although
significant differences in fracture strength were observed between the lot #8372 and lot #9063
material (Table l), an obvious explanation for this strength difference was not revealed by the
fractographic examinations as the flaw initiation sites appeared similar. High magnification SEM
images of the flaw initiation sites indicate that these regions are grains or micro-cracks, and the
true cause of the fracture is not obvious. The lot #8372 has a more homogeneous
microstructure with a lower fraction of the large, elongated grains, which appears to have
influenced the strength.
(3) O-ring compression Test Results
The average stress at the maximum load (oU), strain at maximum load (eu), and average
modulus (E) for each o-ring data set are summarized in Table II with Weibull statistics. A typical
load-displacement curves showed an initial load drop at the maximum applied load, which
corresponds to the first fracture of the o-ring specimens along the line of loading. This fracture
mode is characteristic of compression testing of monolithic ceramic o-ringsG’7.
Higher fracture strength and strain values are observed at higher temperatures, as
previously shown for flexural testing. The decrease in modulus observed for testing of the
0.787cm diameter o-rings at higher temperatures was comparable to that observed for the
flexure tests, while no change in modulus was observed for the 0.876cm diameter o-rings at
1090°C. The decrease in modulus and increase in strength at higher temperatures is likely the
result of a change in deformation mechanism that likely corresponds to a slightly higher Klc
value or less flaw sensitivity. However, the average room-temperature modulus was lower for

,. .3
Page
the thicker 0.876cm diameter specimens (there was no effect of thickness at 1090°C). The
differences in room-temperature modulus are likely attributed to experimental scatter in
dimensional measurements of the o-rings. It should be noted that the influence of errors in
2
dimensional measurements and load measurements on the accuracy of the results (Eqs. (3) to
(5)) are more significant for the testing of a thinner wall o-ring, which may explain some of the
modulus differences for o-rings. The room temperature and 1090”C strength and strain values
for the 0.787cm and 0.876cm diameter o-rings are shown in Figure 7 to be comparable with
slightly larger values observed for the 0.876cm diameter specimens. The size of the data sets
for the o-rings (15 & 9) are less than half the recommended minimum data set size (30 data
points) that is needed for an accurate Weibull anaiysis7, and the statistical significance of these
results should be treated with caution.
The lot of Coors CVD SiC (Lot #9063) used to produce the o-ring specimens is the same
as used for previous flexural testing. Comparison of the fracture strength determined from the
o-ring specimens with the flexural test results shows in Figure 7 that the values for the 0.787cm
diameter o-rings are comparable statistically to the flexural results with slightly higher values for
the 0.876cm o-rings. The test results from different specimen sizes can be compared using
Weibull statistics by normalizing the specimen volumes7. The Weibull equation is typically
integrated or scaled to the specific volume (V) of the test specimen,
[Pf = 1 – exp ( - (o/o@)mdV ) (6)
The effective volume (KV) for any test specimen is derived from the following equation
JKV = (@X)/CJmax)m dV (7)
Where o(x) is the appropriate expression for the stress distribution, and om.Xis the maximum
stress. The effective volume
using data from another type
is used to predict the strength distribution for one type of specimen
of specimen with Eq. (8),
Page 13
(cJI/cJ,)= (KVJ KV1)l’M (8)
Eq. (8) is only valid if the limiting flaw type and flaw distribution is the same for both specimens.
Smaller sized specimens are predicted to have a high strength values. However, the trend
predicted by Eq. (8) was not precisely followed in this work. Higher strength values would be
expected for the 0.787cm diameter o-ring, which had the smallest material volume, but the
strength values for the 0.787cm diameter o-ring in Figure 7 were generally lower or comparable
to the results for the 0.876cm diameter o-rings and comparable to flexure test specimens from
the same lot of material, which had a much larger volume. The small difference in strength
values between the o-ring specimens and flexural bars can only be explained by a difference
flaw distributions between the two specimens.
in
The microstructure of the CVD SiC tube consists of elongated grains aligned parallel to
the CVD growth direction, i.e. parallel to the tube wall thickness, see Figure 8a. The elongated
grains of the o-ring specimens are longer in length (150 – 10 ~m compared to 50 – 10 ~m for
the bars) with a slightly wider diameter(15 – 0.5 ~m compared to 10 – 0.5 Vm for the bars). The
CVD growth of SiC on the graphite mandrel to form the tubes results in the formation of more
elongated grains compared to the plate deposits. Slight differences in deposition conditions
between the plate and mandrel deposits may produce the microstructure differences. The grain
size and structure for the 0.787cm and 0.876cm diameter tubes were similar, and the grain
structure appeared to be uniform through the wall thickness of the o-ring. The elongated grain
structure is resolved on the fracture surfaces of the o-rings in Figure 8b. The high-aspect ratio
grain structure is more obvious on the fracture surface of the flexural bars in Figure 6. The flaw
initiation site was observed to be a small flaw that was located in the volume close to the inner
diameter surface for both the 0.787cm diameter and 0.876cm diameter o-rings tested at either
room temperature, 1090”C, or 1500”C. The high magnification SEM images of the flaw
initiation sites indicate that these regions are either miss-orientated grains or small microcracks,
but exact flaw identification was difficult.

Page 14
The strength of the o-rings was comparable to or only slightly higher than flexural bars
that were machined from plate deposits produced in the same lot (Lot #9063). The grain size of
the o-rings, which were produced by CVD SiC deposition on a graphite mandrel, was different
than the flexural bars, with more elongated grains that were slightly thicker in diameter. The
flaw initiation sites for the o-rings were within the volume near the surface, which was the same
location for the flexural bars. The flaw initiation sites for the o-rings and flexural bars appears to
be grain-type defects or microcracks that are inherent to the specific microstructure, which
indicates that small changes in grain structure can have an influence on the bend strength. The
more elongated grain structure with wider grains results in a different flaw distribution for the o-
rings compared to the flexural bars. The use of flexural test data alone with Weibull statistical
theory would over-estimate of the strength of tubular product forms of CVD SiC. These results
show that the most accurate strength measurement of a ceramic part is obtained from a test
specimen that is produced using a manufacturing process that is as close as possible to the
process used for the component.
V. Summary
Two lots of Morton CVD SiC have been tested at room temperature. The Lot #9016 flexural
bars were machined with an as-ground finish with the machining marks aligned parallel to the
length of the bend bars. Lot #9045 CVD SiC bars had machining marks aligned perpendicular
to the length of the bars, and these machining marks were notches or fracture initiation sites
that resulted in significantly lower strength values and less data scatter (higher Weibull
Modulus) than observed for Lot #901 6 material. Fractographic examinations showed that
surface flaws (machining marks) were the fracture initiation sites for the Lot #9045 CVD SiC,
while volume flaws were the initiation site for the Lot #901 6 material.
Two lots of Coors CVD SiC were tested at room temperature. The flexural strength of Lot
#8372 Coors CVD SiC was comparable statistically to Morton CVD SiC, while the strength of
Lot #9063 Coors CVD SiC was significantly higher. Fractographic examinations indicate that

.,*
Page 15
the flaws initiated within the volume of the Coors CVD SiC, and were similar in appearance to
the flaws observed for Morton CVD SiC. The microstructure of Morton CVD SiC consists of
acicular grains that are aligned parallel to the CVD growth direction with a bimodal distribution of
large (100 – 10pm diameter) and small (1O– 0.5 ~m diameter) grains. Coors CVD SiC
consists of more elongated, highly acicular grains that are aligned parallel to the CVD growth
direction with less grain size variation and smaller grain lengths (50 to 10 ~m) and diameters
(10 to 0.5 ~m) compared to Morton CVD SiC. These differences in microstructure are produced
by differences in CVD deposition parameters. Although the microstructure are different, the
strength values for Morton and Coors CVD SiC are only slightly different, with the Coors
material exhibiting some lot-to-lot variation and values at least comparable to Morton CVD SiC.
The difference in fracture strength, fracture strain, and Weibull modulus for Morton (Lot
#9045) and Coors (Lot # 9063) CVD SiC flexural bars machined with the major stress axis
either perpendicular or parallel to the CVD growth direction were very minor or insignificant.
This indicates that both Morton and Coors CVD SiC are relatively isotropic with respect to
strength and modulus.
Lot #9063 Coors CVD was also flexure tested at 800”C, 1090°C, and 1500”C. Slightly
higher fracture strength and strain values were observed at higher temperature. A slightly lower
modulus was observed for bend testing at 1090”C and 1500”C, which indicates that the
deformation mechanism is changing at higher temperatures.
The fracture strength values of the 0.787cm and 0.876cm diameter Coors o-ring specimens
were determined by compression testing to be comparable statistically. Slightly higher fracture
strengths were measured for the o-rings at 1090”C and 1500°C, and the values were
comparable to flexural bars that were machined from plate deposits from the same lot of
material (#9063). The elastic modulus values measured for the o-rings were comparable to
those measured for the flexural bars, with lower modulus values measured at 1090”C and
J.9.
Page 16
1500”C. The decrease in modulus and increase in strength at higher temperatures indicates
that the mechanism of deformation of SiC has changed at higher test temperatures, as
observed for the flexural bars. An increase in fracture toughness at higher temperatures likely
produces the increase in strength.
Assuming that the same flaw type and flaw distribution are present, higher strength values
are predicted for a smaller sized specimen, based on Weibull statistical theory. The fracture
strength values for the o-ring specimens, which have a significantly smaller volume than the
flexure bars, were comparable statistically to the strength values determined from flexural
specimens. Since the smaller o-ring specimens would be expected to provide higher strength
values, these results indicate that the flaw distributions for the o-ring specimens are different
than the flexural bar specimens. The morphology of the microstructure of the o-ring (tube
deposited on mandrel) and flexural bar (plate deposit) specimens are similar, but the grains of
the o-ring specimens are more elongated (150 – 10 ~m compared to 50 – 10 ~m for the bars)
with a slightly wider diameter (15 – 0.5 ~m compared to 10 – 0.5 pm for the bars) than the
flexure bars. This difference in microstructure results in a different flaw distribution for the o-ring
specimens, as confirmed by fractographic examinations. These results indicate that CVD
deposition of Coors SiC on a mandrel to produce a tubular product does not improve the
strength of the material compared to a plate deposit. Compression testing of o-rings provides a
more accurate strength measurement for tubular product forms, as previously reported5>G.

Page 17
7.0 References
lH.O. Pierson, /-land&)ook of Refractory Carbides and /Vitrides, pp. 121-127, Noyes Publications,Westwood, New Jersey, 1996.2Product Literature for CVD Silicon Carbide”, Morton Advanced Materials, Woburn, MA, 1996.3Product Literature for CVD SiC from Dallas Ceramics, Rowlett, TX, 1998.4Standard Test Method for Flexture Strength of Advanced Ceramics at Ambient Temperature,ASTM Cl 161-94, American Society for Testing and Materials, Philadelphia, PA, 1994.50.M. Jadaan, D.L. Shelleman, J.C. Conway Jr, J.J. Mecholsky Jr., and R.E. Tressler,“Prediction of the Strength of Ceramic Tubular Components: Part I - Analysis”, J. Testing and .Eva/., 19 [3] 181-191 (1991).‘D.L. Shelieman, O.M. Jadaan, J.C. Conway Jr, and J.J. Mecholsky Jr., “Prediction of theStrength of Ceramic Tubular Components: Part II – Experimental Verification”, J. Testing andEva/., 19 [3] 192-200(1991).7Standard Practice for Reporting Uniaxial Strength Data and Estimating Weibull DistributionParameters for Advanced Ceramics, ASTM Cl 239-95, American Society for Testing andMaterials, Philadelphia, PA, 1995.8H. Ford, Advanced Mechanics of Materials, pp. 263-269, Longman, Green and Co. Ltd.,London, 1969.‘R.W. Davidge, et al., “Strength and Delayed Fracture Behavior of Beta Alumina’: Amer. Cerarn.SOC. ML, 58 [8], 771 -774(1 979).10J.J. Cao ,et cl., “In Situ Toughened Silicon Carbide with Al-B-C Additions”, J. Am. Ceram.SOC. ,79 [2], 461-469(1 996).llB.O. Yavuz and R.E. Tressler, “High Temperature Mechanical Behavior of a Chemically VaporDeposited Beta Silicon Carbide”, Cer. ht., 18, 19-26 (1992).
Page 18
.+r
Fiqure Captions
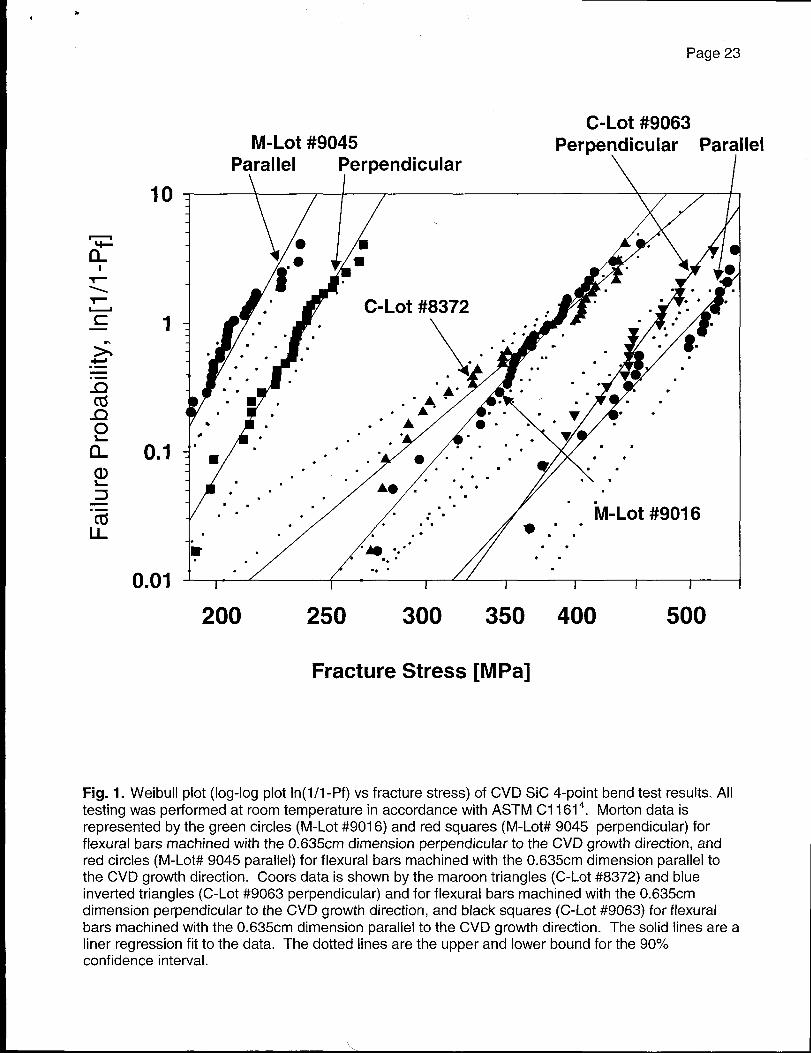
Fig. 1. Weibull plot (log-log plot In(l/l -Pf) vs fracture stress) of CVD SiC 4-point bend test
results. All testing was performed at room temperature
Morton data is represented by the green circles (M-Lot
in accordance with ASTM Cl 1614
#901 6) and red squares (M-Lot# 9045
perpendicular) for flexural bars machined with the 0.635cm dimension perpendicular to the CVD
growth direction, and red circles (M-Lot# 9045 parallel) for flexural bars machined with the
0.635cm dimension parallel to the CVD growth direction. Coors data is shown by the maroon
triangles (C-Lot #8372) and blue inverted triangles (C-Lot #9063 perpendicular) and for flexural
bars machined with the 0.635cm dimension perpendicular to the CVD growth direction, and
black squares (C-Lot #9063) for flexural bars machined with the 0.635cm dimension parallel to
the CVD growth direction. The solid lines are a liner regression fit to the data. The dotted lines
are the upper and lower bound for the 90% confidence interval.
SEM fractograph of Morton CVD SiC material after flexural testing at room temperature:Fig. 2.
(a) lot# 9045 material with the arrow showing the surface flaw as the fracture initiation site, and
(b) lot #901 6 material with the arrow showing a volume flaw (near the surface) as the fracture
initiation site. These flaws are representative of the fracture initiation sites observed on other
flexural bars for material from lots # 9045 and #9016. The 0.635cm dimension was orientated
perpendicular to the CVD growth direction for both flexure bars in this figure.
Fig. 3. SEM micrograph of Morton CVD SiC flexural bar: (a) lot# 9016 material in the plane
perpendicular to the CVD growth direction, and (b) lot #9045 material in the plane parallel to the
CVD growth direction. The surfaces were prepared by polishing and then etching in 64% KOH /
36% KNOS solution at 500°C for 10-30 seconds.
Page 19
Fiqure Captions (Continued}
Fig. 4. Weibull plot of results for Coors CVD SiC (Iot# 9063) bars machined perpendicular to the
growth direction from testing performed at room temperature (green upside-down triangles),
800”C (blue triangles), 1090°C (red squares), and 1500°C (yellow circles). The solid lines are
a liner regression fit to the data. The dotted lines are the upper and lower bound for the 90%
confidence interval.
Fig. 5. SEM micrograph of Lot #9063 Coors CVD SiC flexural bar (a) the plane perpendicular
to the CVD growth direction, and (b) the plane parallel to the CVD growth direction. The
surfaces were prepared by polishing and then etching in 64% KOH / 367. KN03 solution at
500”C for 10-30 seconds.
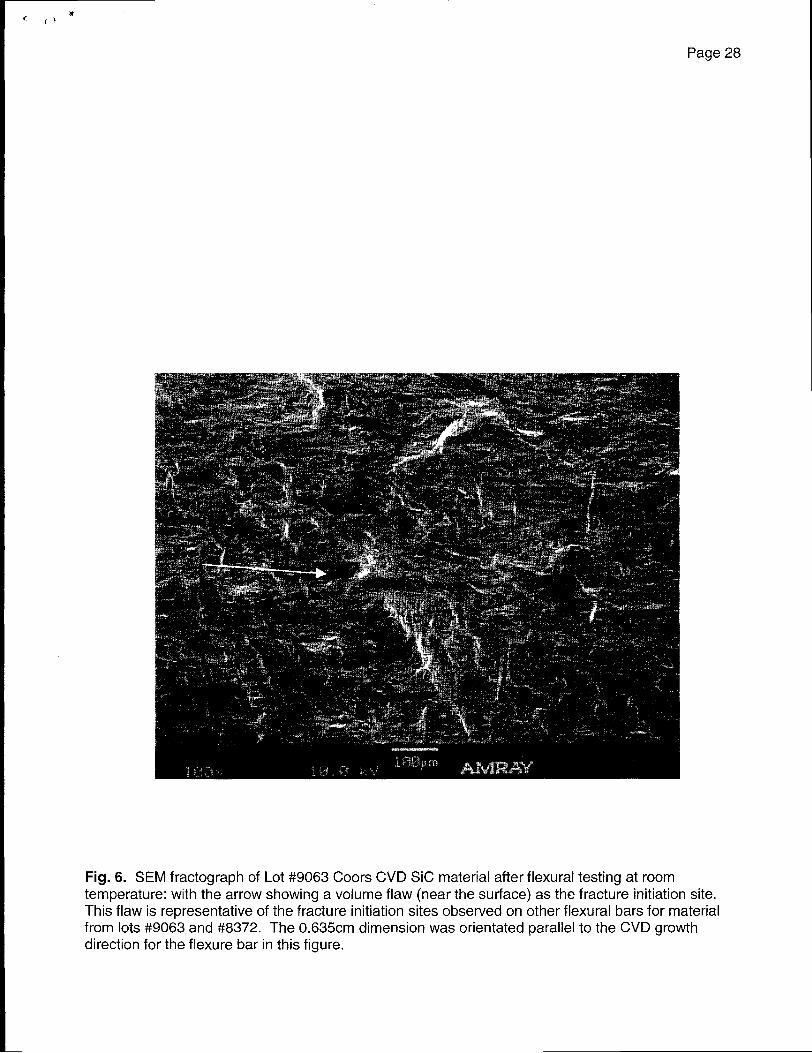
Fig. 6. SEM fractograph of Lot #9063 Coors CVD SiC material after flexural testing at room
temperature: with the arrow showing a volume flaw (near the surface) as the fracture initiation
site. This flaw is representative of the fracture initiation sites observed on other flexural bars for
material from lots #9063 and #8372. The 0.635cm dimension was orientated parallel to the
CVD growth direction for the flexure bar in this figure.
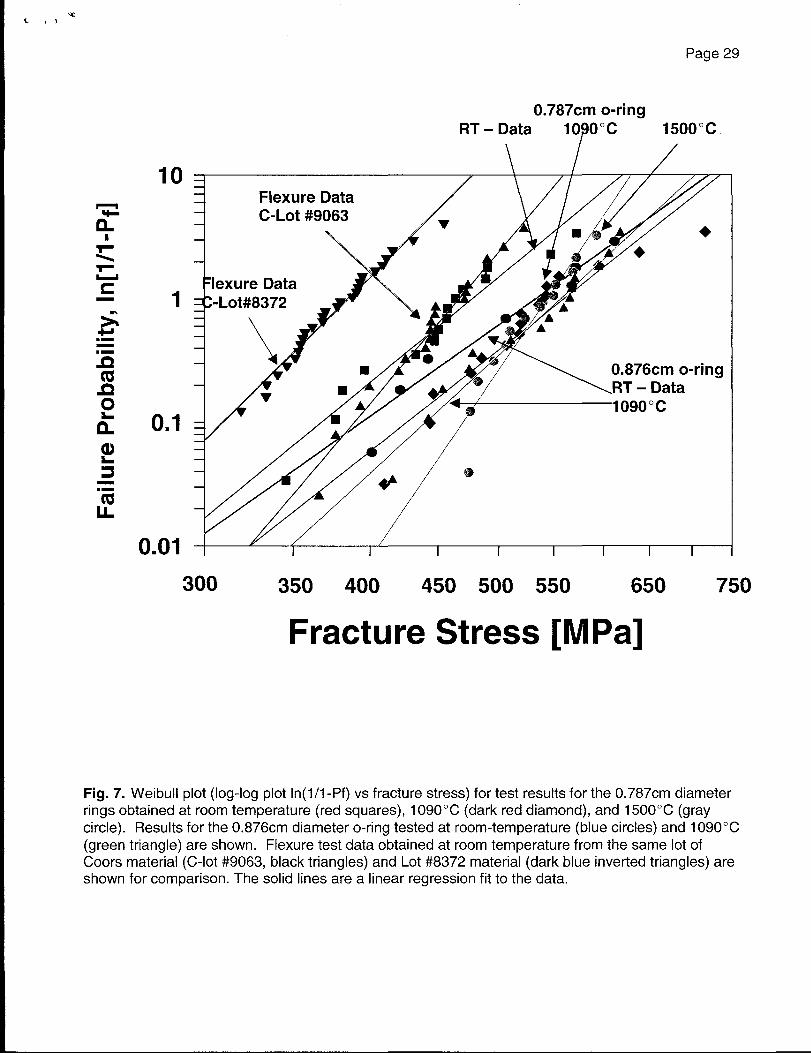
Fig. 7. Weibull plot (log-log plot In(l/l -Pf) vs fracture stress) for test results for the 0.787cm
diameter rings obtained at room temperature (red squares), 1090”C (dark red diamond), and
1500°C (gray circle). Results for the 0.876cm diameter o-ring tested at room-temperature (blue
circles) and 1090°C (green triangle) are shown. Flexure test data obtained at room temperature
from the same lot of Coors material (C-lot #9063, black triangles) and Lot #8372 material (dark
blue inverted triangles) are shown for comparison. The solid lines are a linear regression fit to ~~
the data.
.r
Page 20
Fiqure Captions (Continued]
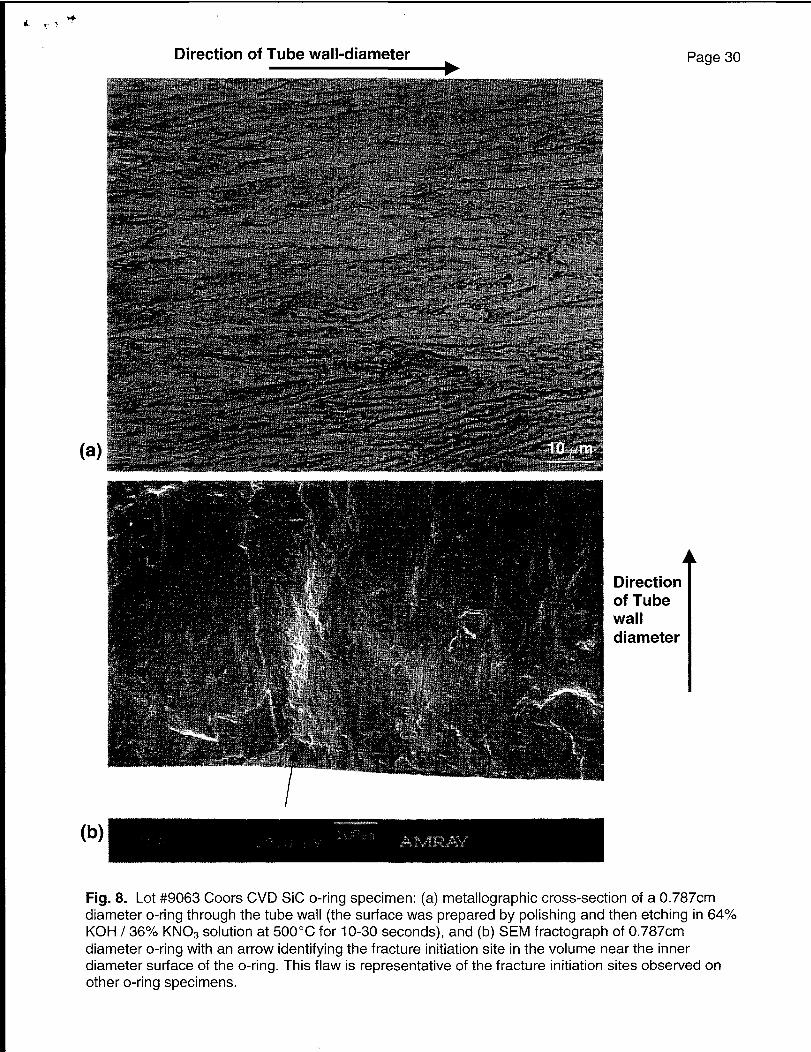
Fig. 8. Lot #9063 Coors CVD SiC o-ring specimen: (a) metallographic cross-section of a
0.787cm diameter o-ring through the tube wall (the surface was prepared by polishing and then
etching in 647. KOH / 367. KN03 solution at 500”C for 10-30 seconds), and (b) SEM
fractograph of 0.787cm diameter o-ring with an arrow identifying the fracture initiation site in the
volume near the inner diameter surface of the o-ring. This flaw is representative of the fracture
initiation sites observed on other o-ring specimens.
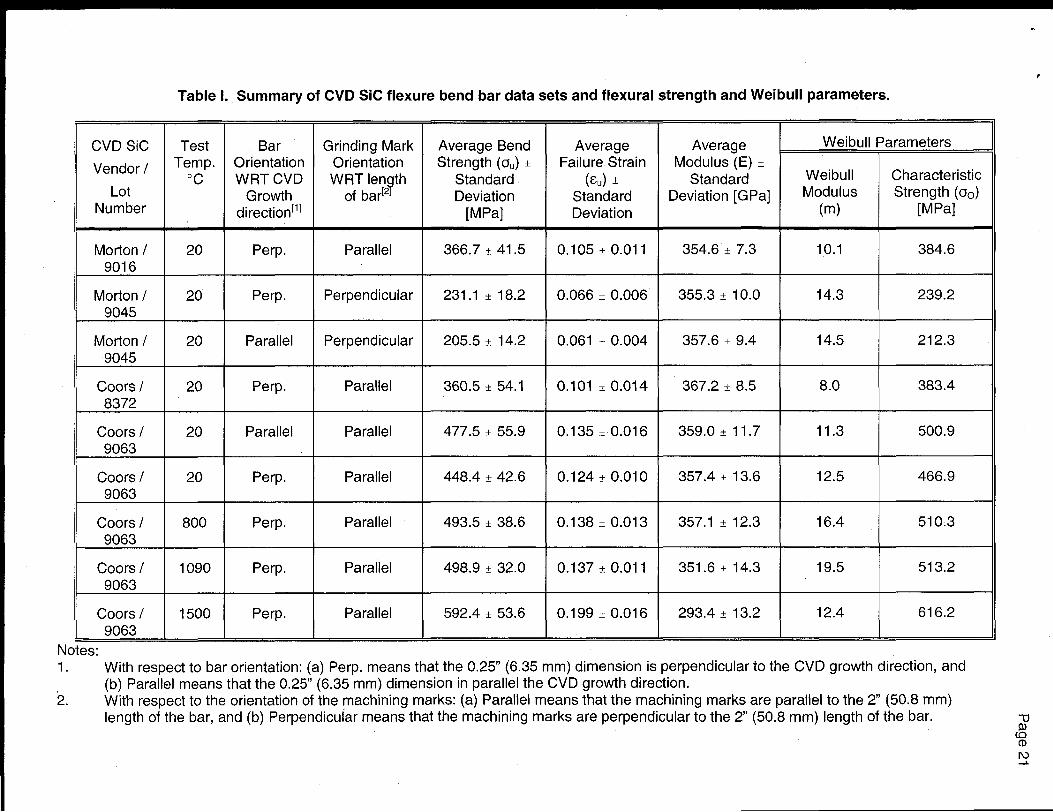
Table L Summary of CVD SiC flexure bend bar data sets and flexural strength and Weibuli parameters.
CVD SiC Test Bar Grinding Mark Average Bend Average Average Weibull Parameters
Vendor / Temp. Orientation Orientation Strength (au) * Failure Strain Modulus (E) +“c WRT CVD WRT Ien th
$Standard (&u) * Standard Weibull Characteristic
Lot Growth of bar[2 Deviation Standard Deviation [GPa] Modulus Strength (Go)Number direction[l] [MPa] Deviation (m) [MPa]
Morton I 20 Perp. Parallel 366.7 t 41.5 0.105 * 0.011 354.6 * 7.3 10.1 384.69016
Morton I 20 Perp. Perpendicular 231.1 i 18.2 0.066 * 0.006 355.3 i 10.0 14.3 239.29045
Morton I 20 Parallel Perpendicular 205.5 Y 14.2 0.061 ~ 0.004 357.6 t 9.4 14.5 212.39045
Coors I 20 Perp. Parallel 360.5 + 54.1 0.101 * 0.014 367.2 * 8.5 8.0 383.48372
Coors I 20 Parallel Parallel 477.5 + 55.9 0.135 * 0.016 359.0 * 11.7 11.3 500.99063
Coors I 20 Perp. Parallel 448.4 + 42.6 0.124 i 0.010 357.4 * 13.6 12.5 466.99063
Coors I 800 Perp. Parallel 493.5 * 38.6 0.138 + 0.013 357.1 ~ 12.3 16.4 510.39063
Coors I 1090 Perp. Parallel 498.9 ~ 32.0 0.137 t 0.011 351.6 i 14.3 19.5 513.29063
Coors I 1500 Perp. Parallel 592.4 + 53.6 0.199 * 0.016 293.4 ~ 13.2 12.4 616.29063
.L–-No~es:1. With respect to bar orientation: (a) Perp. means that the 0.25” (6.35 mm) dimension is perpendicular to the CVD growth direction, and
(b) Parallel means that the 0.25” (6.35 mm) dimension in parallel the CVD growth direction.2. With respect to the orientation of the machining marks: (a) Parallel means that the machining marks are parallel to the 2 (50.8 mm)
length of the bar, and (b) Perpendicular means that the machining marks are perpendicular to the 2 (50.8 mm) length of the bar.
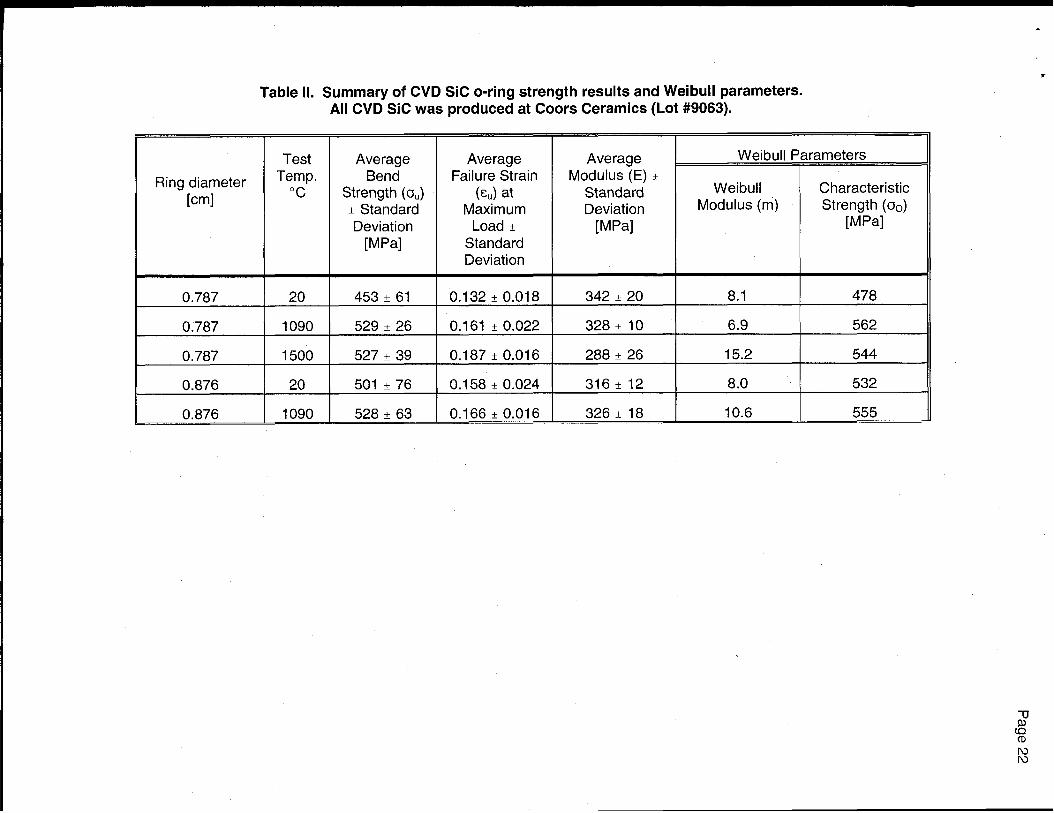
Table Il. Summary of CVD SiC o-ring strength results and Weibull parameters.All CVD SiC was produced at Coors Ceramics (Lot #9063).
Test Average Average Average Weibull Parameters
Ring diameter Temp. Bend Failure Strain Modulus (E) ~
[cm] “c Strength (au) (c,) at Standard Weibull Characteristic
* Standard Maximum Deviation Modulus (m) Strength (CIo)
Deviation Load * [MPa] [MPa]
[MPa] StandardDeviation
0.787 20 453 ~ 61 0.132 t 0.018 342 t 20 8.1 478
0.787 1090 529 * 26 0.161 t 0.022 328~ 10 6.9 562
0.787 1500 527 ~ 39 0.187 * 0.016 288 * 26 15.2 544
0.876 20 501 + 76 0.158 t 0.024 316* 12 8.0 532
0.876 1090 528 A 63 0.166 t 0.016 326* 18 10.6 555
10
1
0.1
M-LotParallel
\
C-Lot#9063#9045 Perpendicular
PerpendicularI \
Page 23
\/l
Parallel
/
/ mv
[)#.......
● m . ..+
+ .+. .
.+ .. .
).. #
\ ‘9+ “
+
.. ... .
. .. . ..“ .
.. .
‘m . .+. . . .
.1 I I I I I I
200 250 300 350
Fracture Stress [M Pa]
400 500
Fig. 1. Weibull plot (log-log plot In(l/l -Pf) vs fracture stress) of CVD SiC 4-point bend test results. Alltesting was performed at room temperature in accordance with ASTM Cl 1614. Morton data isrepresented by the green circles (M-Lot #9016) and red squares (M-Lot# 9045 perpendicular) forflexural bars machined with the 0.635cm dimension perpendicular to the CVD growth direction, andred circles (M-Lot# 9045 parallel) for flexural bars machined with the 0.635cm dimension parallel tothe CVD growth direction. Coors data is shown by the maroon triangles (C-Lot #8372) and blueinverted triangles (C-Lot #9063 perpendicular) and for flexural bars machined with the 0.635cmdimension perpendicular to the CVD growth direction, and black squares (C-Lot #9063) for flexuralbars machined with the 0.635cm dimension parallel to the CVD growth direction. The solid lines arealiner regression fit to the data. The dotted lines are the upper and lower bound for the 90’%.confidence interval.

..
(a)
(b)
Page 24
Fig.2. SEMfractograph of Motion CVDSiCmaterial after flexural testing at room temperature:(a)lot# 9045 material with the arrow showing the surface flaw as the fracture initiation site, and (b) lot#901 6 material with the arrow showing a volume flaw (near the surface) as the fracture initiation site.These flaws are representative of the fracture initiation sites observed on other flexural bars formaterial from lots # 9045 and #9016. The 0.635cm dimension was orientated perpendicular to theCVD growth direction for both flexure bars in this figure.
,.
Page 25
(a)
(b)
Fig. 3. SEM micrograph of Morton CVD SiC flexural bar: (a) lot# 9016 material in the planeperpendicular to the CVD growth direction, and (b) lot #9045 material in the plane parallel to the CVDgrowth direction. The surfaces were prepared by polishing and then etching in 64% KOH / 36% KNO~solution at 500”C for 10-30 seconds.

Page 26
10 =1 / //
1
0.1
/7’Temperature j
\,/ffl<$
3
. /+ .“;-” .. ““” .“4 .+/’ .*.
-i
4 ...-I* /. . ‘/ /
1.
/
.*.. .
. !.
/- . . / / . .
/-”!mvf..:*# .““ 800”CI /. . . / / * ./
o.ol~ /“”k.//”/ .I I I I I
300 350 400
Fracture
500 600 700
Stress [M Pa]
Fig. 4. Weibull plot of results for Coors CVD SiC (lot# 9063) bars machined perpendicular to thegrowth direction from testing performed at room temperature (green upside-down triangles), 800”C(blue triangles), 1090”C (red squares), and 1500°C (yellow circles). The solid lines are a linerregression fit to the data. The dotted lines are the upper and lower bound for the 90% confidenceinterval.
Page 27
(a)
Fig. 5. SEM micrograph of Lot #9063 Coors CVD SiC flexural bar: (a) the plane perpendicular to theCVD growth direction, and (b) the plane parallel to the CVD growth direction. The surfaces wereprepared by polishing and then etching in 64% KOH / 360/. KNO~ solution at 500”C for 10-30seconds.
Page 28
Fig. 6. SEM fractograph of Lot #9063 Coors CVD SiC material after flexural testing at roomtemperature: with the arrow showing a volume flaw (near the surface) as the fracture initiation site.This flaw is representative of the fracture initiation sites observed on other flexural bars for materialfrom lots #9063 and #8372. The 0.635cm dimension was orientated parallel to the CVD growthdirection for the flexure bar in this figure.
10
1
0.1
0.01
=1 Fiexure Data
Page 29
0.787cm o-ringRT - Data Iopo”c 1500°c
1~~~C-Lot #9063 v / +
+
Iexure Data-Lot#8372 A
\
AA
a A
v2??#!?!?i::300 350 400 450 500 550 650
Fracture Stress [MPa]
750
Fig. 7. Weibull plot (log-log plot In(l /1 -Pf) vs fracture stress) for test results for the 0.787cm diameterrings obtained at room temperature (red squares), 1090°C (dark red diamond), and 1500°C (graycircle). Results for the 0.876cm diameter o-ring tested at room-temperature (blue circles) and 1090°C(green triangle) are shown. Flexure test data obtained at room temperature from the same lot ofCoors material (C-lot #9063, black triangles) and Lot #8372 material (dark blue inverted triangles) areshown for comparison. The solid lines are a linear regression fit to the data.
.
(a)
Direction of Tube wall-diameterb
Page 30
Directionof Tubewalldiameter
(b)
Fig. 8. Lot #9063 Coors CVD SiC o-ring specimen: (a) metallographic cross-section of a 0.787cmdiameter o-ring through the tube wall (the surface was prepared by polishing and then etching in 647.KOH / 36% KNO~ solution at 500”C for 10-30 seconds), and (b) SEM fractograph of 0.787cmdiameter o-ring with an arrow identifying the fracture initiation site in the volume near the innerdiameter surface of the o-ring. This flaw is representative of the fracture initiation sites observed onother o-ring specimens.