Embed Size (px)
Citation preview

UNITED STATES SECURITIES AND EXCHANGE COMMISSION
Washington, D.C. 20549
FORM 10-Q
(Mark One)
For the quarterly period ended June 30, 2012
or
For the transition period from to
Commission file number 001-02658
STEWART INFORMATION SERVICES CORPORATION
(Exact name of registrant as specified in its charter)
Registrant’s telephone number, including area code: (713) 625-8100
(Former name, former address and former fiscal year, if changed since last report)
Indicate by check mark whether the registrant (1) has filed all reports required to be filed by Section 13 or 15(d) of the Securities Exchange Act of 1934 during the preceding 12 months (or for such shorter period that the registrant was required to file such reports), and (2) has been subject to such filing requirements for the past 90 days. Yes ⌧ No �
Indicate by check mark whether the registrant has submitted electronically and posted on its corporate Web site, if any, every Interactive Data File required to be submitted and posted pursuant to Rule 405 of Regulation S-T (§232.405 of this chapter) during the preceding 12 months (or for such shorter period that the registrant was required to submit and post such files). Yes ⌧ No �
Indicate by check mark whether the registrant is a large accelerated filer, an accelerated filer, a non-accelerated filer or a smaller reporting company. See the definitions of “large accelerated filer,” “accelerated filer” and “smaller reporting company” in Rule 12b-2 of the Exchange Act.
Indicate by check mark whether the registrant is a shell company (as defined in Rule 12b-2 of the Exchange Act). Yes � No ⌧
On August 3, 2012, the following shares of each of the issuer’s classes of common stock were outstanding:
⌧ QUARTERLY REPORT PURSUANT TO SECTION 13 OR 15(d) OF THE SECURITIES EXCHANGE ACT OF 1934
� TRANSITION REPORT PURSUANT TO SECTION 13 OR 15(d) OF THE SECURITIES EXCHANGE ACT OF 1934
Delaware 74-1677330(State or other jurisdiction ofincorporation or organization)
(I.R.S. Employer Identification No.)
1980 Post Oak Blvd., Houston TX 77056(Address of principal executive offices) (Zip Code)
Large accelerated filer � Accelerated filer ⌧
Non-accelerated filer � (Do not check if a smaller reporting company) Smaller reporting company �
Common, $1 par value 18,301,973 Class B Common, $1 par value 1,050,012

FORM 10-Q QUARTERLY REPORT
QUARTER ENDED JUNE 30, 2012
TABLE OF CONTENTS
As used in this report, “we,” “us,” “our,” the “Company” and “Stewart” mean Stewart Information Services Corporation and our subsidiaries, unless the context indicates otherwise.
- 2 -
Item Page
PART I – FINANCIAL INFORMATION
1. Financial Statements 4
2. Management’s Discussion and Analysis of Financial Condition and Results of Operations 15
3. Quantitative and Qualitative Disclosures About Market Risk 27
4. Controls and Procedures 27
PART II – OTHER INFORMATION
1. Legal Proceedings 28
1A. Risk Factors 28
5. Other Information 28
6. Exhibits 28
Signature 29

CONDENSED CONSOLIDATED STATEMENTS OF OPERATIONS AND COMPREHENSIVE EARNINGS (LOSS)
See notes to condensed consolidated financial statements.
- 3 -
For the Three Months
Ended June 30, For the Six Months
Ended June 30, 2012 2011 2012 2011 ($000 omitted, except per share)
Revenues
Title insurance:
Direct operations 187,574 165,841 339,209 305,070 Agency operations 251,139 213,829 447,460 405,638
Real estate information 40,502 22,564 72,961 53,949 Investment income 3,408 3,882 6,535 7,742 Investment and other gains (losses) – net 1,089 (1,233) 2,533 (1,101)
483,712 404,883 868,698 771,298
Expenses
Amounts retained by agencies 207,014 177,301 369,562 335,748 Employee costs 131,090 116,587 259,323 234,513 Other operating expenses 70,429 64,249 135,292 123,375 Title losses and related claims 38,113 34,984 69,498 66,185 Depreciation and amortization 4,563 4,762 9,088 9,592 Interest 1,286 1,294 2,650 2,572
452,495 399,177 845,413 771,985
Earnings (loss) before taxes and noncontrolling interests 31,217 5,706 23,285 (687) Income tax expense (benefit) 3,175 (1,942) 5,998 1,189
Net earnings (loss) 28,042 7,648 17,287 (1,876) Less net earnings attributable to noncontrolling interests 3,131 1,708 4,533 2,477
Net earnings (loss) attributable to Stewart 24,911 5,940 12,754 (4,353)
Other comprehensive earnings:
Foreign currency translation (3,973) (270) (478) 3,269 Change in unrealized gains and losses 5,246 5,775 8,773 3,361 Reclassification of adjustment for gains and losses included in net income (777) (1,391) (1,545) (1,745)
Other comprehensive earnings, before taxes 496 4,114 6,750 4,885 Income tax expense related to items of comprehensive earnings 2,292 1,734 2,292 2,895
Other comprehensive (loss) earnings, net of taxes (1,796) 2,380 4,458 1,990
Comprehensive earnings (loss) attributable to Stewart 23,115 8,320 17,212 (2,363)
Basic average shares outstanding (000) 19,299 19,216 19,277 19,024 Basic earnings (loss) per share attributable to Stewart 1.29 0.31 0.66 (0.23)
Dilutive average shares outstanding (000) 24,388 24,326 24,367 19,024 Diluted earnings (loss) per share attributable to Stewart 1.05 0.28 0.59 (0.23)
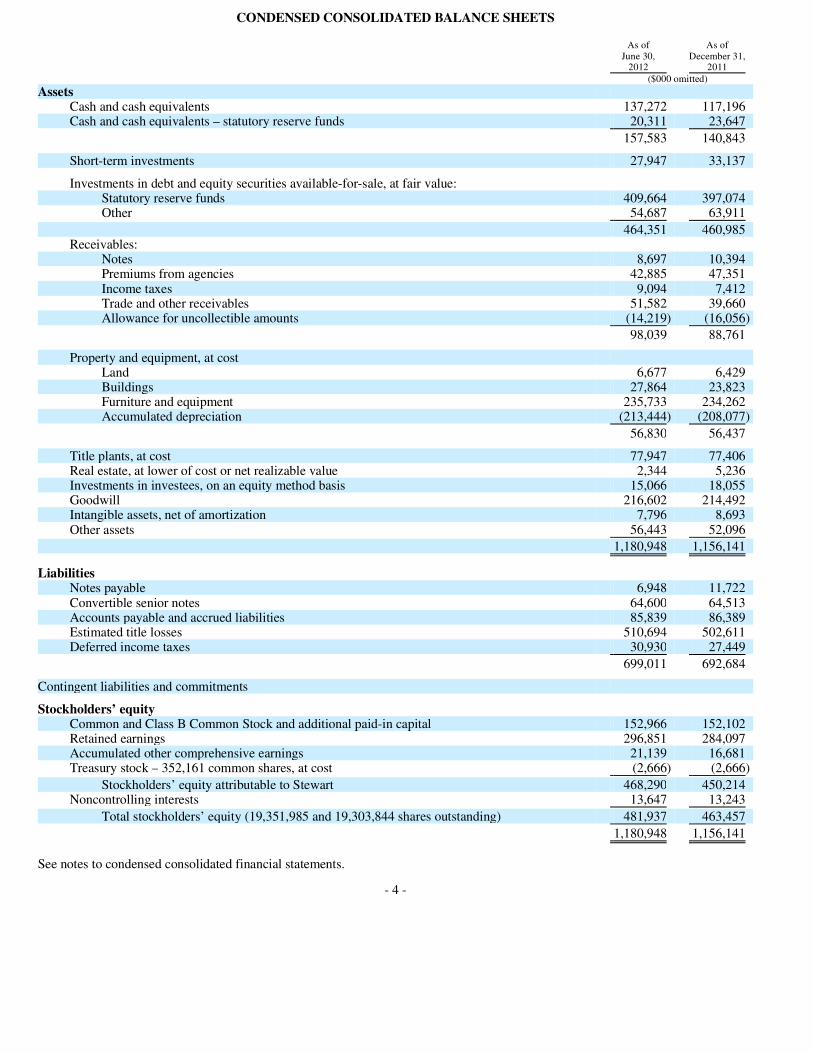
CONDENSED CONSOLIDATED BALANCE SHEETS
See notes to condensed consolidated financial statements.
- 4 -
As of June 30,
2012
As ofDecember 31,
2011 ($000 omitted)
Assets
Cash and cash equivalents 137,272 117,196 Cash and cash equivalents – statutory reserve funds 20,311 23,647
157,583 140,843
Short-term investments 27,947 33,137
Investments in debt and equity securities available-for-sale, at fair value:
Statutory reserve funds 409,664 397,074 Other 54,687 63,911
464,351 460,985 Receivables:
Notes 8,697 10,394 Premiums from agencies 42,885 47,351 Income taxes 9,094 7,412 Trade and other receivables 51,582 39,660 Allowance for uncollectible amounts (14,219) (16,056)
98,039 88,761
Property and equipment, at cost
Land 6,677 6,429 Buildings 27,864 23,823 Furniture and equipment 235,733 234,262 Accumulated depreciation (213,444) (208,077)
56,830 56,437
Title plants, at cost 77,947 77,406 Real estate, at lower of cost or net realizable value 2,344 5,236 Investments in investees, on an equity method basis 15,066 18,055 Goodwill 216,602 214,492 Intangible assets, net of amortization 7,796 8,693 Other assets 56,443 52,096
1,180,948 1,156,141
Liabilities Notes payable 6,948 11,722 Convertible senior notes 64,600 64,513 Accounts payable and accrued liabilities 85,839 86,389 Estimated title losses 510,694 502,611 Deferred income taxes 30,930 27,449
699,011 692,684
Contingent liabilities and commitments
Stockholders’ equity
Common and Class B Common Stock and additional paid-in capital 152,966 152,102 Retained earnings 296,851 284,097 Accumulated other comprehensive earnings 21,139 16,681 Treasury stock – 352,161 common shares, at cost (2,666) (2,666)
Stockholders’ equity attributable to Stewart 468,290 450,214 Noncontrolling interests 13,647 13,243
Total stockholders’ equity (19,351,985 and 19,303,844 shares outstanding) 481,937 463,457
1,180,948 1,156,141
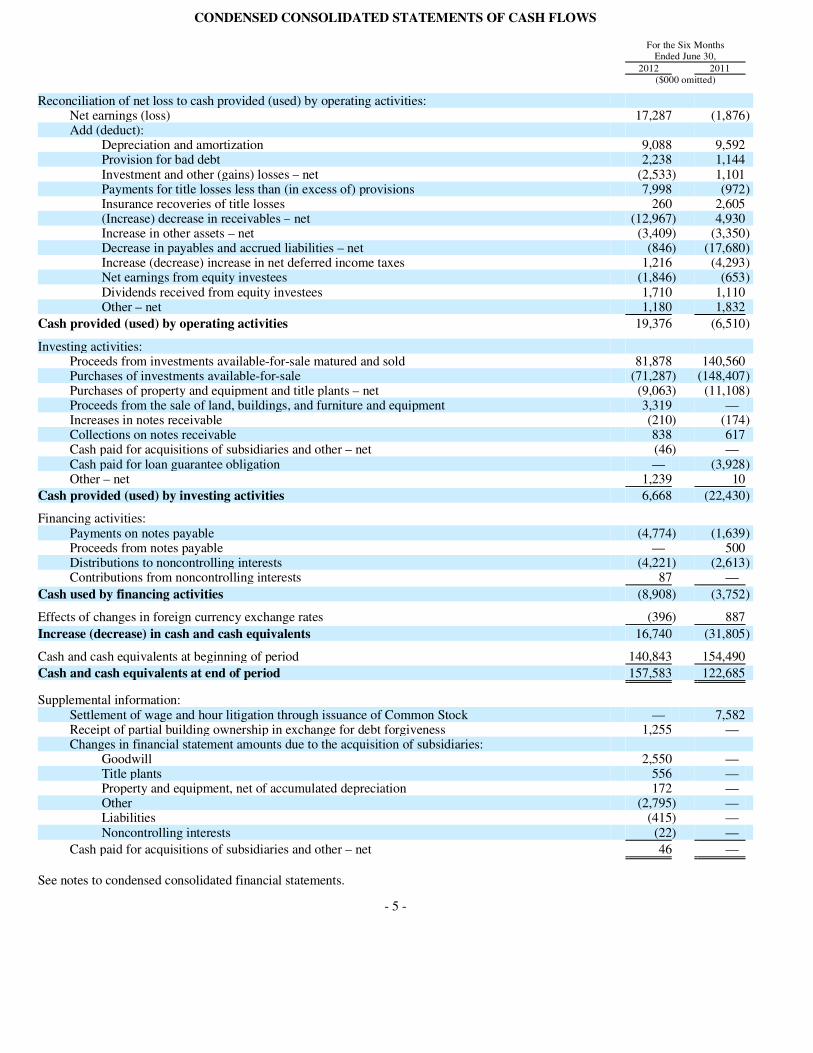
CONDENSED CONSOLIDATED STATEMENTS OF CASH FLOWS
See notes to condensed consolidated financial statements.
- 5 -
For the Six Months
Ended June 30, 2012 2011 ($000 omitted)
Reconciliation of net loss to cash provided (used) by operating activities:
Net earnings (loss) 17,287 (1,876) Add (deduct):
Depreciation and amortization 9,088 9,592 Provision for bad debt 2,238 1,144 Investment and other (gains) losses – net (2,533) 1,101 Payments for title losses less than (in excess of) provisions 7,998 (972) Insurance recoveries of title losses 260 2,605 (Increase) decrease in receivables – net (12,967) 4,930 Increase in other assets – net (3,409) (3,350) Decrease in payables and accrued liabilities – net (846) (17,680) Increase (decrease) increase in net deferred income taxes 1,216 (4,293) Net earnings from equity investees (1,846) (653) Dividends received from equity investees 1,710 1,110 Other – net 1,180 1,832
Cash provided (used) by operating activities 19,376 (6,510)
Investing activities:
Proceeds from investments available-for-sale matured and sold 81,878 140,560 Purchases of investments available-for-sale (71,287) (148,407) Purchases of property and equipment and title plants – net (9,063) (11,108) Proceeds from the sale of land, buildings, and furniture and equipment 3,319 — Increases in notes receivable (210) (174) Collections on notes receivable 838 617 Cash paid for acquisitions of subsidiaries and other – net (46) — Cash paid for loan guarantee obligation — (3,928) Other – net 1,239 10
Cash provided (used) by investing activities 6,668 (22,430)
Financing activities:
Payments on notes payable (4,774) (1,639) Proceeds from notes payable — 500 Distributions to noncontrolling interests (4,221) (2,613) Contributions from noncontrolling interests 87 —
Cash used by financing activities (8,908) (3,752)
Effects of changes in foreign currency exchange rates (396) 887
Increase (decrease) in cash and cash equivalents 16,740 (31,805)
Cash and cash equivalents at beginning of period 140,843 154,490
Cash and cash equivalents at end of period 157,583 122,685
Supplemental information:
Settlement of wage and hour litigation through issuance of Common Stock — 7,582 Receipt of partial building ownership in exchange for debt forgiveness 1,255 — Changes in financial statement amounts due to the acquisition of subsidiaries:
Goodwill 2,550 — Title plants 556 — Property and equipment, net of accumulated depreciation 172 — Other (2,795) — Liabilities (415) — Noncontrolling interests (22) —
Cash paid for acquisitions of subsidiaries and other – net 46 —

NOTES TO CONDENSED CONSOLIDATED FINANCIAL STATEMENTS
NOTE 1 Interim financial statements. The financial information contained in this report for the three and six months ended June 30, 2012 and 2011, and as of June 30, 2012, is unaudited. This report should be read in conjunction with the Company’s Annual Report on Form 10-K for the year ended December 31, 2011.
A. Management’s responsibility. The accompanying interim financial statements were prepared by management, who is responsible for their integrity and objectivity. These financial statements have been prepared in conformity with U.S. generally accepted accounting principles (GAAP), including management’s best judgments and estimates. In the opinion of management, all adjustments necessary for a fair presentation of this information for all interim periods, consisting only of normal recurring accruals, have been made. The Company’s results of operations for interim periods are not necessarily indicative of results for a full year and actual results could differ from those estimates.
B. Consolidation. The condensed consolidated financial statements include all subsidiaries in which the Company owns more than 50% voting rights in electing directors. All significant intercompany amounts and transactions have been eliminated and provisions have been made for noncontrolling interests. Unconsolidated investees, in which the Company typically owns 20% through 50% of the equity, are accounted for by the equity method.
C. Reclassifications. Certain amounts in the 2011 interim financial statements have been reclassified for comparative purposes. Net losses attributable to Stewart, as previously reported, were not affected.
NOTE 2 Investments in debt and equity securities. The amortized costs and fair values follow:
Gross unrealized gains and losses were:
- 6 -
June 30, 2012 December 31, 2011
Amortized
costs Fair
values Amortized
costs Fair
values ($000 omitted)
Debt securities:
Municipal 20,313 21,247 26,721 27,801 Corporate and utilities 236,425 250,026 237,912 244,123 Foreign 161,871 163,637 162,384 164,268 U.S. Government 17,581 19,173 17,530 19,350
Equity securities 9,500 10,268 5,005 5,443
445,690 464,351 449,552 460,985
June 30, 2012 December 31, 2011 Gains Losses Gains Losses ($000 omitted)
Debt securities:
Municipal 934 — 1,080 — Corporate and utilities 13,845 244 9,184 2,973 Foreign 1,930 164 1,937 53 U.S. Government 1,592 — 1,820 —
Equity securities 924 156 442 4
19,225 564 14,463 3,030

Debt securities as of June 30, 2012 mature, according to their contractual terms, as follows (actual maturities may differ due to call or prepayment rights):
As of June 30, 2012, gross unrealized losses on investments and the fair values of the related securities, aggregated by investment category and length of time that individual securities have been in a continuous unrealized loss position, were:
The unrealized loss positions were primarily caused by interest rate fluctuations. The number of investments in an unrealized loss position as of June 30, 2012 was 18. Since the Company does not intend to sell and will more-likely-than-not maintain each debt security until its anticipated recovery, and no significant credit risk is deemed to exist, these investments are not considered other-than-temporarily impaired.
As of December 31, 2011, gross unrealized losses on investments and the fair values of the related securities, aggregated by investment category and length of time that individual securities have been in a continuous unrealized loss position, were:
The Company believes its investment portfolio is diversified and expects no material loss to result from the failure to perform by issuers of the debt securities it holds. Investments made by the Company are not collateralized. Foreign debt securities primarily include Canadian government bonds and United Kingdom treasury bonds.
- 7 -
Amortized
costs Fair
values ($000 omitted)
In one year or less 37,520 37,764 After one year through five years 178,818 182,546 After five years through ten years 195,208 206,430 After ten years 24,644 27,343
436,190 454,083
Less than 12 months More than 12 months Total Losses Fair values Losses Fair values Losses Fair values ($000 omitted)
Debt securities:
Municipal — 400 — — — 400 Corporate and utilities 150 11,916 94 6,185 244 18,101 Foreign 164 64,573 — — 164 64,573 U.S. Government — 510 — — — 510
Equity securities 142 835 14 1,829 156 2,664
456 78,234 108 8,014 564 86,248
Less than 12 months More than 12 months Total Losses Fair values Losses Fair values Losses Fair values ($000 omitted)
Debt securities:
Corporate and utilities 1,944 42,851 1,029 24,830 2,973 67,681 Foreign 53 59,708 — — 53 59,708
Equity securities 4 1,247 — — 4 1,247
2,001 103,806 1,029 24,830 3,030 128,636

NOTE 3 Fair value measurements. The Fair Value Measurements and Disclosures Topic of the FASB ASC defines fair value as the exchange price that would be received for an asset or paid to transfer a liability (an exit price) in the principal, or most advantageous, market for the asset or liability in an orderly transaction between market participants at the measurement date. The Fair Value Measurements Topic establishes a three-level fair value hierarchy that prioritizes the inputs used to measure fair value. This hierarchy requires entities to maximize the use of observable inputs when possible. The three levels of inputs used to measure fair value are as follows:
As of June 30, 2012, financial instruments measured at fair value on a recurring basis are summarized below:
As of December 31, 2011, financial instruments measured at fair value on a recurring basis are summarized below:
- 8 -
• Level 1 – quoted prices in active markets for identical assets or liabilities;
• Level 2 – observable inputs other than quoted prices included in Level 1, such as quoted prices for similar assets and
liabilities in active markets; quoted prices for identical or similar assets and liabilities in markets that are not active; or other inputs that are observable or can be corroborated by observable market data; and
• Level 3 – unobservable inputs that are supported by little or no market activity and that are significant to the fair values of
the assets or liabilities, including certain pricing models, discounted cash flow methodologies and similar techniques that use significant unobservable inputs.
Level 1 Level 2 Fair value
measurements ($000 omitted)
Short-term investments 27,947 — 27,947 Investments available-for-sale:
Debt securities:
Municipal — 21,247 21,247 Corporate and utilities — 250,026 250,026 Foreign 163,637 — 163,637 U.S. Government 19,173 — 19,173
Equity securities 10,268 — 10,268
221,025 271,273 492,298
Level 1 Level 2 Fair value
measurements ($000 omitted)
Short-term investments 33,137 — 33,137 Investments available-for-sale:
Debt securities:
Municipal — 27,801 27,801 Corporate and utilities — 244,123 244,123 Foreign 164,268 — 164,268 U.S. Government 19,350 — 19,350
Equity securities 5,443 — 5,443
222,198 271,924 494,122

As of June 30, 2012, Level 1 financial instruments consist of short-term investments, U.S. and foreign government bonds, and equity securities. Level 2 financial instruments consist of municipal, corporate and utilities bonds. In accordance with the Company’s policies and guidelines, the Company’s third party, registered investment manager invests only in securities rated as investment grade or higher by the major rating services, where observable valuation inputs are significant. All municipal bonds are valued using a third-party pricing service, and the corporate bonds are valued using the market approach, which includes three to ten inputs from relevant market sources, including FINRA’s Trade Reporting and Compliance Engine (TRACE) and independent broker/dealer quotes, bids and offerings, as well as other relevant market data, such as securities with similar characteristics (i.e. sector, rating, maturity, etc.). Broker/dealer quotes, bids and offerings mentioned above are gathered (typically three to ten) and a consensus risk premium spread (credit spread) over risk-free Treasury yields is developed from the inputs obtained, which is then used to calculate the resulting fair value.
NOTE 4 Investment income. Gross realized investment and other gains and losses follows:
Expenses assignable to investment income were insignificant. There were no significant investments as of June 30, 2012 that did not produce income during the year.
Proceeds from the sales of investments available-for-sale follows:
For the six months ended June 30, 2012, investment and other gains (losses) – net included realized gains of $1.9 million from the sale of debt and equity investments available-for-sale.
For the six months ended June 30, 2011, investment and other (losses) gains – net included realized losses on a loan guarantee obligation of $3.9 million. The realized losses were partially offset by realized gains of $2.5 million from the sale of debt investments available-for-sale.
- 9 -
For the Three Months
Ended June 30, For the Six Months
Ended June 30, 2012 2011 2012 2011 ($000 omitted)
Realized gains 1,878 2,741 3,349 3,591 Realized losses (789) (3,974) (816) (4,692)
1,089 (1,233) 2,533 (1,101)
For the Three Months
Ended June 30, For the Six Months
Ended June 30, 2012 2011 2012 2011 ($000 omitted)
Proceeds from sales of investments available-for-sale 35,314 94,971 68,678 110,759
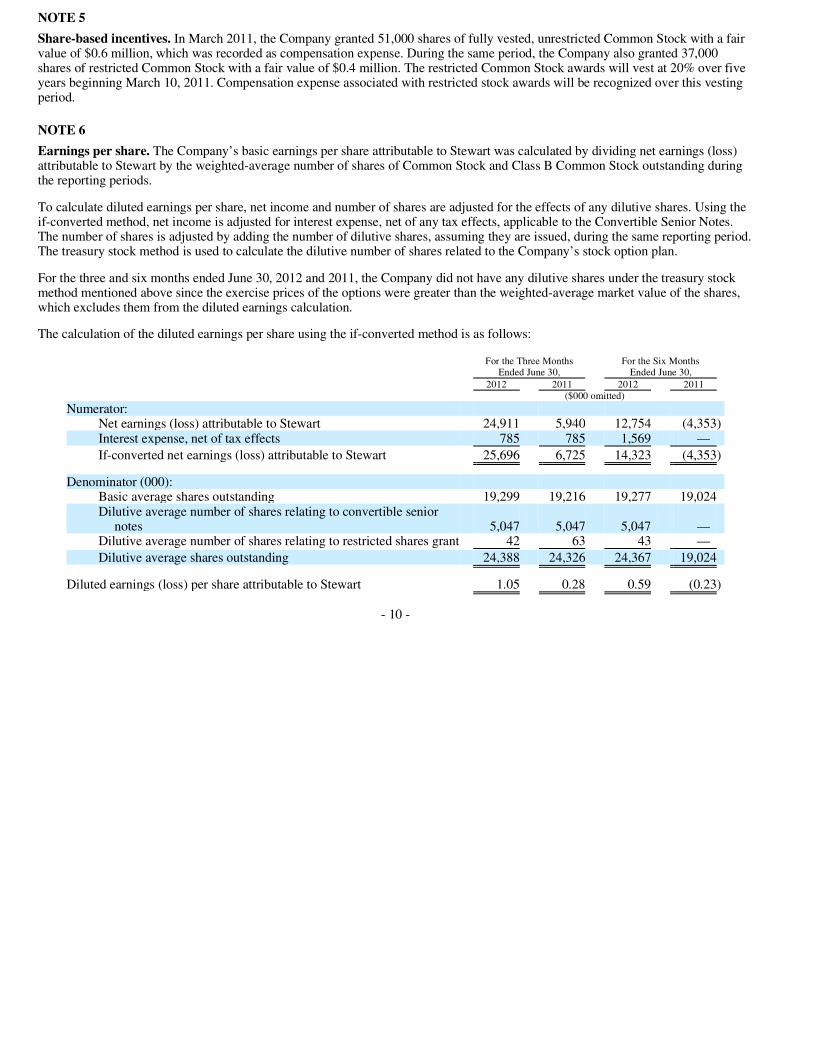
NOTE 5 Share-based incentives. In March 2011, the Company granted 51,000 shares of fully vested, unrestricted Common Stock with a fair value of $0.6 million, which was recorded as compensation expense. During the same period, the Company also granted 37,000 shares of restricted Common Stock with a fair value of $0.4 million. The restricted Common Stock awards will vest at 20% over five years beginning March 10, 2011. Compensation expense associated with restricted stock awards will be recognized over this vesting period.
NOTE 6 Earnings per share. The Company’s basic earnings per share attributable to Stewart was calculated by dividing net earnings (loss) attributable to Stewart by the weighted-average number of shares of Common Stock and Class B Common Stock outstanding during the reporting periods.
To calculate diluted earnings per share, net income and number of shares are adjusted for the effects of any dilutive shares. Using the if-converted method, net income is adjusted for interest expense, net of any tax effects, applicable to the Convertible Senior Notes. The number of shares is adjusted by adding the number of dilutive shares, assuming they are issued, during the same reporting period. The treasury stock method is used to calculate the dilutive number of shares related to the Company’s stock option plan.
For the three and six months ended June 30, 2012 and 2011, the Company did not have any dilutive shares under the treasury stock method mentioned above since the exercise prices of the options were greater than the weighted-average market value of the shares, which excludes them from the diluted earnings calculation.
The calculation of the diluted earnings per share using the if-converted method is as follows:
- 10 -
For the Three Months
Ended June 30, For the Six Months
Ended June 30, 2012 2011 2012 2011 ($000 omitted)
Numerator:
Net earnings (loss) attributable to Stewart 24,911 5,940 12,754 (4,353) Interest expense, net of tax effects 785 785 1,569 —
If-converted net earnings (loss) attributable to Stewart 25,696 6,725 14,323 (4,353)
Denominator (000):
Basic average shares outstanding 19,299 19,216 19,277 19,024 Dilutive average number of shares relating to convertible senior
notes 5,047 5,047 5,047 — Dilutive average number of shares relating to restricted shares grant 42 63 43 —
Dilutive average shares outstanding 24,388 24,326 24,367 19,024
Diluted earnings (loss) per share attributable to Stewart 1.05 0.28 0.59 (0.23)

NOTE 7 Contingent liabilities and commitments. In the ordinary course of business, the Company guarantees the third-party indebtedness of certain of its consolidated subsidiaries. As of June 30, 2012, the maximum potential future payments on the guarantees are not more than the related notes payable recorded in the consolidated balance sheets. The Company also guarantees the indebtedness related to lease obligations of certain of its consolidated subsidiaries. The maximum future obligations arising from these lease-related guarantees are not more than the Company’s future minimum lease payments. As of June 30, 2012, the Company had guarantees of indebtedness owed by certain third parties related to business expansion and unused letters of credit aggregating to $4.1 million, primarily related to workers’ compensation coverage.
NOTE 8 Segment information. The Company’s two reportable segments are title insurance-related services (Title), which includes all corporate-level costs, including interest related to convertible senior notes, and real estate information (REI). Selected statement of operations information related to these segments follows:
Selected balance sheet information as of June 30 and December 31, respectively, related to these segments follows:
- 11 -
For the Three Months
Ended June 30, For the Six Months
Ended June 30, 2012 2011 2012 2011 ($000 omitted)
Revenues:
Title 443,210 382,319 795,737 717,349 REI 40,502 22,564 72,961 53,949
483,712 404,883 868,698 771,298
Intersegment revenues:
Title 9 69 28 103 REI 826 692 1,753 1,351
835 761 1,781 1,454
Depreciation and amortization:
Title 3,659 4,023 7,296 8,244 REI 904 739 1,792 1,348
4,563 4,762 9,088 9,592
Earnings (loss) before taxes and noncontrolling interests:
Title 17,743 (4,320) 919 (27,630) REI 13,474 10,026 22,366 26,943
31,217 5,706 23,285 (687)
2012 2011 ($000 omitted) Identifiable assets:
Title 1,099,615 1,090,419 REI 81,333 65,722
1,180,948 1,156,141

Revenues generated in the United States and all international operations follows:
NOTE 9 Regulatory and legal developments. Stewart Title Guaranty Company (STGC) and Stewart Title Guaranty de Mexico, S.A. de C.V. (STGM) were defendants in a lawsuit in the State District Court of Harris County, Texas, Citigroup Global Markets Realty Corp. v. Stewart Title Guaranty Company. The lawsuit was filed in 2008 and concerns 16 owners’ and 16 lenders’ title insurance policies on 16 parcels of land in Mexico issued by STGM and reinsurance agreements by STGC. Citigroup Global Markets Realty Corp. asserted claims against STGC under reinsurance of the lenders’ policies as well as extra-contractual claims under Texas law. K.R. Playa VI, S de R.L. de C.V., the owner of the parcels, asserted claims against STGC and separate claims against STGM under the owners’ policies as well as extra-contractual claims under Texas law. The State District Court dismissed the extra-contractual claims against STGC and STGM based on application of Mexican law.
The jury returned a verdict of no damages, favorable to STGC and STGM, on April 29, 2011. Judgment was entered on June 30, 2011. Both Citigroup Global Markets Realty Corp. and K.R. Playa VI, S de R.L. de C.V. subsequently filed motions for new trial and motions for judgment notwithstanding the verdict, which the State District Court denied by orders dated September 12, 2011. Citigroup Global Markets Realty Corp. and K.R. Playa VI, S de R.L. de C.V. filed notices of appeal on September 28, 2011. The Company does not believe that the ultimate outcome will materially affect its consolidated financial condition or results of operations.
***********
- 12 -
For the Three Months
Ended June 30, For the Six Months
Ended June 30, 2012 2011 2012 2011 ($000 omitted)
United States 451,165 372,482 812,844 719,160 International 32,547 32,401 55,854 52,138
483,712 404,883 868,698 771,298

In January 2009, an action was filed by individuals against STGC, Stewart Title of California, Inc., Cuesta Title Company and others in the Superior Court of California for the County of San Luis Obispo alleging that the plaintiffs have suffered damages relating to loans they made through Hurst Financial Corporation to an individual named Kelly Gearhart and entities controlled by Gearhart. Thereafter, several other lawsuits making similar allegations, including a lawsuit filed by several hundred individuals, were filed in San Luis Obispo Superior Court, and one such lawsuit was removed to the United States District Court for the Central District of California. The defendants vary from case to case, but Stewart Information Services Corporation, Stewart Title Company and Stewart Title Insurance Company have also each been sued in at least one of the cases. Each of the complaints alleges some combination of the following purported causes of action: breach of contract, negligence, fraud, aiding and abetting fraud, constructive fraud, breach of fiduciary duty, breach of implied covenant of good faith and fair dealing, financial elder abuse, violation of California Business and Professions Code Section 17200, negligent misrepresentation, conversion, conspiracy, alter ego and declaratory relief. The San Luis Obispo Superior Court has sustained demurrers by the Company with regard to certain causes of action and certain individuals and entities and dismissed Stewart Information Services Corporation from one case without leave to amend. Plaintiffs in one case have dismissed Stewart Title Insurance Company following the Court’s sustaining of Stewart Title Insurance Company’s demurrer. On the other hand, the Court has overruled the demurrers as to some causes of action. The United States District Court for the Central District of California granted the Company’s motion to dismiss the First Amended Complaint as to the claim for violation of the Racketeer Influenced and Corrupt Organizations Act, with prejudice, and remanded the remainder of the case to the San Luis Obispo Superior Court. The Company filed a motion to coordinate the cases for pretrial purposes, and the Court issued (i) an order assigning all the cases to a single judge, (ii) an Order Coordinating Related Cases for Pre-Trial Purposes, and (iii) a First Case Management Order for the Related Cases. Discovery is ongoing. The Company has filed a motion for summary judgment and summary adjudication seeking the dismissal of certain plaintiffs’ claims. That motion is currently scheduled for hearing on September 27, 2012. No trial dates have been set. Although the Company cannot predict the outcome of these actions, it is vigorously defending itself against the allegations and does not believe that the ultimate outcome will materially affect its consolidated financial condition or results of operations.
***********
In February 2008, an antitrust class action was filed in the United States District Court for the Eastern District of New York against Stewart Title Insurance Company, Monroe Title Insurance Corporation, Stewart Information Services Corporation, several other unaffiliated title insurance companies and the Title Insurance Rate Service Association, Inc. (TIRSA). The complaint alleges that the defendants violated Section 1 of the Sherman Antitrust Act by collectively filing proposed rates for title insurance in New York through TIRSA, a state-authorized and licensed rate service organization.
Complaints were subsequently filed in the United States District Courts for the Eastern and Southern Districts of New York and in the United States District Courts in Pennsylvania, New Jersey, Ohio, Florida, Massachusetts, Arkansas, California, Washington, West Virginia, Texas and Delaware. All of the complaints make similar class action allegations, except that certain of the complaints also allege violations of the Real Estate Settlement Procedures Act (RESPA) and various state antitrust and consumer protection laws. The complaints generally request treble damages in unspecified amounts, declaratory and injunctive relief and attorneys’ fees. To date, 78 such complaints have been filed, each of which names the Company and/or one or more of its affiliates as a defendant (and have been consolidated in the aforementioned states), of which seven have been voluntarily dismissed.
- 13 -

As of July 25, 2012, the Company has obtained dismissals of the claims in Arkansas, California, Delaware, Florida, Massachusetts, New Jersey, New York, Ohio, Pennsylvania (where the court dismissed the damages claims and granted defendants summary judgment on the injunctive claims), Texas and Washington. The Company filed a motion to dismiss in West Virginia (where all proceedings have been stayed and the docket closed). The dismissals in New York and Texas have been affirmed by the United States Courts of Appeals for the Second and Fifth Circuits, respectively, and on October 4, 2010, the United States Supreme Court denied the plaintiffs’ petitions for review of those decisions. The United States Court of Appeals for Sixth Circuit has affirmed the dismissal of the Ohio complaints, the Court of Appeals for the Third Circuit has affirmed the dismissals of the Delaware and New Jersey complaints, and the Court of Appeals for the Second Circuit has affirmed the dismissal of the RESPA claims in New York. Although the Company cannot predict the outcome of these actions, it is vigorously defending itself against the allegations and does not believe that the outcome will materially affect its consolidated financial condition or results of operations.
***********
Van Buren Estates, LLC, Van Buren Estates LLC II, and Van Buren Estates, LP commenced an action in the Superior Court of California, County of Riverside on or about March 26, 2010 against Stewart Title of California, Inc. and STGC alleging among other things, negligence, breach of contract, breach of the implied covenant of good faith and fair dealing, specific performance, promissory estoppel and punitive damages. Stewart Title of California, Inc. settled prior to trial. STGC filed a motion for summary judgment which was granted in part. Subsequent to the summary judgment motion, Van Buren Estates, LP was the sole remaining plaintiff. A jury trial commenced on January 30, 2012. Among the issues involved was STGC’s position that no title policy had been issued in favor of the remaining plaintiff. The trial concluded on March 5, 2012 with a jury verdict in favor of the plaintiff on the issues of liability and damages in the aggregate amount of approximately $6.5 million. The parties had stipulated at trial that the cost to cure the title defect at issue in the case was $0.4 million, less than the amount previously paid by Stewart Title of California, Inc. Judgment was entered on April 10, 2012. STGC filed motions for new trial and for judgment notwithstanding the verdict. The court granted the motion for judgment notwithstanding the verdict in part and reduced the judgment to approximately $4.2 million. An amended judgment was entered on July 10, 2012. STGC filed its notice of appeal of the $4.2 million amended judgment on July 19, 2012. Although the Company cannot predict the outcome of the appeal, it will continue to vigorously defend itself and does not believe that the ultimate outcome will materially affect its consolidated financial condition or results of operations.
***********
The Company is also subject to other claims and lawsuits arising in the ordinary course of its business, most of which involve disputed policy claims. In some of these lawsuits, the plaintiff seeks exemplary or treble damages in excess of policy limits. The Company does not expect that any of these proceedings will have a material adverse effect on its consolidated financial condition or results of operations. Along with the other major title insurance companies, the Company is party to a number of class action lawsuits concerning the title insurance industry. The Company believes that it has adequate reserves for the various litigation matters and contingencies discussed above and that the likely resolution of these matters will not materially affect its consolidated financial condition or results of operations.
The Company is subject to administrative actions and litigation relating to the basis on which premium taxes are paid in certain states. Additionally, the Company has received various other inquiries from governmental regulators concerning practices in the insurance industry. Many of these practices do not concern title insurance. The Company believes that it has adequately reserved for these matters and does not anticipate that the outcome of these inquiries will materially affect its consolidated financial condition or results of operations.
The Company is also subject to various other administrative actions and inquiries into its business conduct in certain of the states in which it operates. While the Company cannot predict the outcome of the various regulatory and administrative matters, it believes that it has adequately reserved for these matters and does not anticipate that the outcome of any of these matters will materially affect its consolidated financial condition or results of operations.
- 14 -

MANAGEMENT’S OVERVIEW We reported net earnings attributable to Stewart of $12.8 million for the six months ended June 30, 2012 compared with a net loss attributable to Stewart of $4.4 million for the same period in 2011. On a diluted per share basis, our net earnings attributable to Stewart was $0.59 for the first six months of 2012 compared with a net loss attributable to Stewart of $0.23 for the same period in 2011. Revenues were $868.7 million for the six months ended June 30, 2012 compared with $771.3 million for the six months ended June 30, 2011.
Overall results for the second quarter 2012 improved to a pretax profit of $31.2 million from a pretax profit of $5.7 million in the second quarter 2011. In the first half of 2012, we achieved a pretax profit of $23.3 million compared to a pretax loss of $0.7 million for the same period in 2011.
Total title revenues in the second quarter 2012 increased 15.9% and 25.7% compared to the same quarter last year and sequentially from the first quarter 2012, respectively. Revenues from direct operations for the second quarter 2012 increased 13.1% and 23.7% compared to the same quarter last year and sequentially from the first quarter 2012, respectively. Revenues from commercial transactions, which are included in direct operations, increased 3.7% in the second quarter 2012 compared to the same quarter last year and increased 34.1% sequentially from the first quarter 2012. International revenues, which are also included in direct operations, increased 4.7% in the second quarter 2012 compared to the same quarter last year and increased 45.9% sequentially from the first quarter 2012.
We are encouraged by the results of our strategic initiatives and believe that we are now beginning to reap the benefits of more scalable operations. While strong order counts drove our 15.6% increase in title operating revenues, our much stronger 510% increase in title pretax results demonstrates improved operating leverage. For 2012 year-to-date, the $78.4 million increase in total title revenues resulted in an increase in title pretax earnings of $28.5 million. We are encouraged by sustained order counts through July which should yield satisfactory results in the third quarter, although we are mindful of industry projections that call for a decline in mortgage originations in the fourth quarter, and we continue to simplify and align our operations to better adapt to market fluctuations.
We continue to experience solid growth in revenues from services provided by our REI segment. As anticipated, the revenue mix generated in the REI segment has shifted over the last twelve months from higher-margin loan modification services to more sustainable servicing support and REO-related services. Nonetheless, pretax margins in this segment improved to 33.3% from the 27.4% achieved in the first quarter 2012 when we were increasing staff to service new contracts.
As a percentage of title revenues, title losses were 8.7%, 9.0% and 9.2% in the second quarter 2012, first quarter 2012 and second quarter 2011, respectively. Title losses increased 8.9% on the 15.6% increase in title operating revenues, when compared to the second quarter 2011, including adjustments to certain large claims. Although we continue to experience a higher than normal provisioning rate, the overall loss provision continues to decline on a sequential quarterly basis. Cash claim payments in the second quarter 2012 decreased 6.3% from the second quarter 2011. Losses incurred on known claims decreased 2.1% compared to the second quarter 2011. The decline in cash claim payments and losses incurred on known claims continues a trend noted for several quarters.
CRITICAL ACCOUNTING ESTIMATES Actual results can differ from our accounting estimates. While we do not anticipate significant changes in our estimates, there is a risk that such changes could have a material impact on our consolidated financial condition or results of operations for future periods.
- 15 -
Item 2. Management’s Discussion and Analysis of Financial Condition and Results of Operations

Title loss reserves Our most critical accounting estimate is providing for title losses associated with issued title insurance policies. Our liability for estimated title losses as of June 30, 2012 comprises both known claims ($132.6 million) and our estimate of claims that may be reported in the future ($378.1 million). The amount of the reserve represents the aggregate future payments (net of recoveries recognized) that we expect to incur on policy and escrow losses and in costs to settle claims.
Provisions for title losses, as a percentage of title operating revenues, were 8.8% and 9.3% for the six months ended June 30, 2012 and 2011, respectively. Actual loss payment experience, including the impact of payments on large losses as well as changes in estimates for large losses, is the primary reason for increases or decreases in our loss provision. A change of 100 basis points in this percentage, a reasonably likely scenario based on our historical loss experience, would have increased or decreased our provision for title losses and pretax operating results approximately $7.9 million for the six months ended June 30, 2012.
Our method for recording the reserves for title losses on both an interim and annual basis begins with the calculation of our current loss provision rate, which is applied to our current premiums resulting in a title loss expense for the period. This loss provision rate is set to provide for losses on current year policies, including the costs of administering, investigating, and/or defending claims, and is determined using moving average ratios of recent actual policy loss payment experience (net of recoveries recognized) to premium revenues.
At each quarter end, our recorded reserve for title losses begins with the prior period’s reserve balance for claim losses, adds the current period provision to that balance and subtracts actual paid claims, resulting in an amount that our management compares to its actuarially-based calculation of the ending reserve balance to provide for future title losses. The actuarially-based calculation is a paid loss development calculation where loss development factors are selected based on company data and input from our third-party actuaries. We also obtain input from third-party actuaries in the form of a reserve analysis utilizing generally accepted actuarial methods. While we are responsible for determining our loss reserves, we utilize this actuarial input to assess the overall reasonableness of our reserve estimation. If our recorded reserve amount is within a reasonable range (+/- 4.0%) of our actuarially-based reserve calculation and the actuary’s point estimate, but not at the point estimate, our management assesses the major factors contributing to the different reserve estimates in order to determine the overall reasonableness of our recorded reserve, as well as the position of the recorded reserves relative to the point estimate and the estimated range of reserves. The major factors considered can change from period to period and include items such as current trends in the real estate industry (which management can assess, although there is a time lag in the development of this data for use by the actuary), the size and types of claims reported and changes in our claims management process. If the recorded amount is not within a reasonable range of our third-party actuary’s point estimate, we will adjust the recorded reserves in the current period and reassess the provision rate on a prospective basis. Once our reserve for title losses is recorded, it is reduced in future periods as a result of claims payments and may be increased or reduced by revisions to our estimate of the overall level of required reserves.
- 16 -

Large claims (those exceeding $1.0 million on a single claim), including large title losses due to independent agency defalcations, are analyzed and reserved for separately due to the higher dollar amount of loss, lower volume of claims reported and sporadic reporting of such claims. Large title losses due to independent agency defalcations typically occur when the independent agency misappropriates funds from escrow accounts under its control. Such losses are usually discovered when the independent agency fails to pay off an outstanding mortgage loan at closing (or immediately thereafter) from the proceeds of the new loan. Once the previous lender determines that its loan has not been paid off timely, it will file a claim against the title insurer. It is at this point that the title insurance underwriter is alerted to the potential theft and begins its investigation. As is industry practice, these claims are considered a claim on the newly issued title insurance policy since such policy insures the holder (in this case, the new lender) that all previous liens on the property have been satisfied. Accordingly, these claim payments are charged to policy loss expense. These incurred losses are typically more severe in terms of dollar value compared with traditional title policy claims because the independent agency is often able over time to conceal misappropriation of escrow funds relating to more than one transaction through the constant volume of funds moving through its escrow accounts. As long as new funds continue to flow into escrow accounts, an independent agent can mask one or more defalcations. In declining real estate markets, lower transaction volumes result in a lower incoming volume of funds, making it more difficult to cover up the misappropriation with incoming funds. Thus, when the defalcation is discovered, it often relates to several transactions. In addition, the overall decline in an independent agency’s revenues, profits and cash flows increases the agency’s incentive to improperly utilize the escrow funds from real estate transactions.
Internal controls relating to independent agencies include, but are not limited to, pre-signing and periodic audits, site visits and reconciliations of policy inventories and premiums. The audits and site visits cover examination of the escrow account bank reconciliations and an examination of a sample of closed transactions. In some instances, we are limited in our scope by attorney agents who cite client confidentiality. Certain states have mandated a requirement for annual reviews of all agents by their underwriter. We also determine whether our independent agencies have appropriate internal controls as defined by the American Land Title Association and us. However, even with adequate internal controls in place, their effectiveness can be circumvented by collusion or improper management override at the independent agencies. To aid in the selection of agencies to review, we have developed an agency risk model that aggregates data from different areas to identify possible problems. This is not a guarantee that all agencies with deficiencies will be identified. In addition, we are typically not the only underwriter for which an independent agency issues policies and agencies may not always provide complete financial records for our review.
Due to the inherent uncertainty in predicting future title policy losses, significant judgment is required by both our management and our third party actuaries in estimating reserves. As a consequence, our ultimate liability may be materially greater or less than current reserves and/or our third party actuary’s calculated estimate.
Agency revenues We recognize revenues on title insurance policies written by independent agencies (agencies) when the policies are reported to us. In addition, where reasonable estimates can be made, we accrue for revenues on policies issued but not reported until after period end. We believe that reasonable estimates can be made when recent and consistent policy issuance information is available. Our estimates are based on historical reporting patterns and other information about our agencies. We also consider current trends in our direct operations and in the title industry. In this accrual, we are not estimating future transactions. We are estimating revenues on policies that have already been issued by agencies but not yet reported to or received by us. We have consistently followed the same basic method of estimating unreported policy revenues for more than 10 years.
- 17 -

Our accruals for revenues on unreported policies from agencies were not material to our consolidated assets or stockholders’ equity as of June 30, 2012 and December 31, 2011. The differences between the amounts our agencies have subsequently reported to us compared to our estimated accruals are substantially offset by any differences arising from prior years’ accruals and have been immaterial to consolidated assets and stockholders’ equity during each of the three prior years. We believe our process provides the most reliable estimate of the unreported revenues on policies and appropriately reflects the trends in agency policy activity.
Goodwill and other long-lived assets Our evaluation of goodwill is normally completed annually in the third quarter using June 30 balances (our current annual review has been completed), but an evaluation may also be made whenever events may indicate impairment. This evaluation is based on a combination of a discounted cash flow analysis (DCF) and market approaches that incorporate market multiples of comparable companies and our own market capitalization. The DCF model utilizes historical and projected operating results and cash flows, initially driven by estimates of changes in future revenue levels, and risk-adjusted discount rates. Our projected operating results are primarily driven by anticipated mortgage originations, which we obtain from projections by industry experts. Fluctuations in revenues, followed by our ability to appropriately adjust our employee count and other operating expenses, are the primary reasons for increases or decreases in our projected operating results. Our market-based valuation methodologies utilize (i) market multiples of earnings and/or other operating metrics of comparable companies and (ii) our market capitalization and a control premium based on market data and factors specific to our ownership and corporate governance structure (such as our Class B Common Stock). To the extent that our future operating results are below our projections, or in the event of continued adverse market conditions, an interim review for impairment may be required, which may result in an impairment of goodwill.
We evaluate goodwill separately for our two reporting units (Title and REI). Goodwill is assigned to these reporting units at the time the goodwill is initially recorded. Once assigned to a reporting unit, the goodwill is pooled and no longer attributable to a specific acquisition. All activities within a reporting unit are available to support the carrying value of the goodwill.
We also evaluate the carrying values of title plants and other long-lived assets when events occur that may indicate impairment. The process of determining impairment for our goodwill and other long-lived assets relies on projections of future cash flows, operating results, discount rates and overall market conditions, including our market capitalization. Uncertainties exist in these projections and they are subject to changes relating to factors such as interest rates and overall real estate and financial market conditions, our market capitalization and overall stock market performance. Actual market conditions and operating results may vary materially from our projections.
Based on these evaluations, we estimate and expense to current operations any loss in value of these assets. As part of our process, we have an option to assess qualitative factors to determine whether it is more likely than not that the fair value of a reporting unit is less than its carrying amount. If we decide not to use a qualitative assessment or if we fail the qualitative assessment, then we obtain input from third-party appraisers regarding the fair value of our reporting units. While we are responsible for assessing whether an impairment of goodwill exists, we utilize the input from third-party appraisers to assess the overall reasonableness of our conclusions. We utilized a qualitative assessment for our annual goodwill impairment test and, based on our analysis, determined it was not more-likely-than-not that the fair value of our two reporting units were less than their carrying amounts as of June 30, 2012. There were no impairment write-offs of goodwill or other long-lived assets during the six months ended June 30, 2012 or 2011.
- 18 -

Operations. Our business has two main operating segments: title insurance-related services and real estate information (REI). These segments are closely related due to the nature of their operations and common customers.
Our primary business is title insurance and settlement-related services. We close transactions and issue title policies on homes and commercial and other real properties located in all 50 states, the District of Columbia and international markets through policy-issuing offices and agencies. We also provide loan origination and servicing support; loan review services; loss mitigation; REO asset management; home and personal insurance services; tax-deferred exchanges; and technology to streamline the real estate process.
Factors affecting revenues. The principal factors that contribute to changes in operating revenues for our title and REI segments include:
Premiums are determined in part by the insured values of the transactions we handle. To the extent inflation causes increases in the prices of homes and other real estate, premium revenues are also increased. Conversely, falling home prices cause premium revenues to decline. These factors may override the seasonal nature of the title insurance business.
RESULTS OF OPERATIONS Comparisons of our results of operations for the three and six months ended June 30, 2012 with the three and six months ended June 30, 2011 follow. Factors contributing to fluctuations in our results of operations are presented in the order of their monetary significance and we have quantified, when necessary, significant changes. Results from our REI segment are included in our discussions regarding the three and six months ended June 30, 2012 and 2011, and when relevant, we have discussed REI segment’s results separately.
Our statements on home sales and loan activity are based on published industry data from sources including Fannie Mae, the National Association of Realtors , the Mortgage Bankers Association and Freddie Mac. We also use information from our direct operations.
- 19 -
• mortgage interest rates; • availability of mortgage loans;
• ability of potential purchasers to qualify for loans;
• ratio of purchase transactions compared with refinance transactions;
• ratio of closed orders to open orders; • home prices; • volume of distressed property transactions; • consumer confidence; • demand by buyers; • number of households; • premium rates; • market share; • opening of new offices and acquisitions; • number of commercial transactions, which typically yield higher premiums;
• government or regulatory initiatives, including tax incentives; and
• number of REO and foreclosed properties and related debt.
®

Operating environment. Data as of June 2012 compared with the same period in 2011 indicates annualized sales of new homes, seasonally adjusted, increased 19.3%, and annualized sales of existing homes, seasonally adjusted, increased 4.5%. June 2012 existing home sales were at a seasonally adjusted annual rate of 4.4 million versus 4.2 million a year earlier. Even though interest rates continue to be low by historical standards, general economic conditions conducive to the housing market such as low unemployment and increasing household formation are not present. One-to-four family residential lending increased from an estimated $282 billion in the second quarter 2011 to $383 billion in the first quarter 2012 (most recent actual data available), primarily driven by an estimated $137 billion increase in refinance originations from the second quarter 2011 to the first quarter 2012 (most recent data available). Commercial lending activity industry-wide improved by 36% in the first quarter 2012 (most recent data available) compared with the same period of 2011.
Three months ended June 30, 2012 compared with three months ended June 30, 2011 Title revenues. Revenues from direct title operations increased $21.7 million, or 13.1%, in the second quarter 2012 compared to the second quarter 2011 primarily due to the increased number of closings, along with an increase in commercial and large transactions. The largest revenue increases were in Texas, Canada and California. Revenues from commercial and other large transactions increased $1.0 million, or 3.7%, in the second quarter 2012 compared to the second quarter 2011.
Direct orders closed increased 18.5%, while the average revenue per file closed decreased 4.8%, in the second quarter 2012 compared to the second quarter 2011 due to an increase in residential refinancing closings in the same periods. Direct operating revenues, excluding large commercial policies, increased 14.5% in the second quarter 2012 compared to the second quarter 2011. The average revenue per closing, excluding large commercial policies, decreased 3.4% in the second quarter 2012 compared to the second quarter 2011. On average, refinance premium rates are 60% of the title premium revenue of a similarly priced sale transaction.
Revenues from independent agencies increased $37.3 million, or 17.4%, in the second quarter 2012 compared to the second quarter 2011. The largest increases in revenues from independent agencies were in California, New York, Utah, New Jersey and Florida, partially offset by decreases in Ohio. Revenues from independent agencies net of amounts retained by those agencies increased 20.8%.
REI revenues. Operating revenues from services provided by the real estate information segment increased $17.9 million, or 79.5%, in the second quarter 2012 compared to the second quarter 2011. The increase was primarily due to an increase in lower margin servicing support and REO related services partially offset by a decline in revenues from higher margin loan modification services. We expect REI revenues to increase in 2012 as recently awarded contracts continue to mature. However, demand for REI services will continue to be dependent on the number and scale of governmental programs and lender projects and can fluctuate significantly on a quarterly and annual basis.
Investment income. Investment income decreased $0.5 million, or 12.2%, in the second quarter 2012 compared to the second quarter 2011, primarily due to decreases in average yield. Certain investment gains and losses, which are included in our results of operations in investment and other gains (losses) – net, were realized as part of the ongoing management of our investment portfolio for the purpose of improving performance.
For the second quarter 2011, investment and other gains (losses) – net included a $3.9 million charge representing the payoff value on a defaulted third party loan on which we served as guarantor.
- 20 -
Retention by agencies. Amounts retained by title agencies are based on agreements between agencies and our title underwriters. On average, amounts retained by independent agencies, as a percentage of revenues generated by them, were 82.4% and 82.9% in the second quarters of 2012 and 2011, respectively. The average retention percentage may vary from year-to-year or quarter-over-quarter due to the geographical mix of agency operations, the volume of title revenues and, in some states, laws or regulations. Due to the variety of such laws or regulations, as well as competitive factors, the average retention rate can differ significantly from state to state. Although, general conditions in the real estate industry are improving nationwide, the recovery in specific markets has varied considerably. In addition, a high proportion of our independent agencies are in states with retention rates greater than 80% and the markets in those states have recovered relatively faster than the nation as a whole, which has resulted in our average retention percentage remaining in the 82% – 83% range. We expect our average retention rate to remain in this range over the near to medium term. However, we continue to adjust independent agency contracts in an economically sound manner, and we expect the mix of agency business to normalize as real estate markets continue to stabilize nationally resulting in lower average retention percentages in the aggregate.
We continue to focus on improving the quality of our network of independent agencies in order to achieve an increase in the average revenue per agency and reduce our risk of future loss. Since we began the process of rationalizing our network of independent agencies in 2008, our average annual remittance per independent agency has increased approximately 75%, while the number of independent agencies in our network has fallen by half. In addition, the policy loss ratio of our current agency base for the trailing twelve months as of June 30, 2012 is approximately one-third of its level in the comparable period in 2008.
Employee costs. Our employee costs and certain other operating expenses are sensitive to inflation. Employee costs in the second quarter 2012 increased 12.4% from the same period in 2011 and 2.2% sequentially from the first quarter 2012. The increase in employee costs compared to last year is primarily related to increases in our REI operations and was expected as a result of staffing requirements to provide services under new contracts awarded in the fourth quarter 2011. As a percentage of total operating revenues, however, employee costs declined to 27.4% in the second quarter 2012 from 29.0% in the second quarter 2011 and 33.7% in the first quarter 2012. Employee costs in the title segment increased 3.1% over the second quarter 2011 to support the 15.6% increase in title operating revenues.
Other operating expenses. Other operating expenses include costs that are fixed in nature, costs that follow, to varying degrees, changes in transaction volumes and revenues and costs that fluctuate independently of revenues. Costs that are fixed in nature include attorney fees, equipment rental, insurance, professional fees, rent and other occupancy expenses, repairs and maintenance, technology costs, telephone and title plant rent. Costs that follow, to varying degrees, changes in transaction volumes and revenues include fee attorney splits, bad debt expenses, certain REI expenses, copy supplies, delivery fees, outside search fees, postage, premium taxes and title plant expenses. Costs that fluctuate independently of revenues include auto expenses, general supplies, litigation defense and settlement costs, promotion costs and travel.
In the second quarter 2012 compared with the same period in 2011, other operating expenses for the combined business segments increased $6.2 million, or 9.6%. Costs fixed in nature increased $3.3 million, or 11.7%, in the second quarter 2012, primarily due to increases in technology costs and professional fees, as a result of outsourcing the internal audit function. Costs that follow, to varying degrees, changes in transaction volumes and revenues increased $4.2 million, or 17.4%, in the second quarter 2012, primarily related to increases in outside search fees and bad debt expense. Costs that fluctuate independently of revenues decreased $1.3 million, or 10.6%, in the second quarter 2012.
Title losses. While trending favorably, losses from title policy claims continue to remain higher than historical levels. Provisions for title losses, as a percentage of title revenues, were 8.7%, 9.2% and 9.0% in the second quarter 2012, the second quarter 2011 and the first quarter 2012, respectively, including adjustments to certain large claims.
- 21 -

Cash claim payments in the second quarter 2012 decreased 6.3% from the second quarter 2011. Losses incurred on known claims decreased 2.1% compared to the second quarter 2011. The decline in cash claim payments and losses incurred on known claims continues a trend noted for several quarters.
Income taxes. Our effective tax rates were 11.3% and (48.6%) for the second quarter 2012 and 2011, respectively, based on income before taxes and after deducting noncontrolling interests, which when aggregated are $28.1 million and $4.0 million for the second quarter 2012 and 2011, respectively. Income tax expense for the three months ended June 30, 2012 and 2011 consists principally of taxes in foreign jurisdictions for our profitable international operations and of U.S. federal tax on entities not included in our U.S. consolidated return. For both periods presented, income tax expense was partially offset by favorable tax adjustments in our foreign operations. For the second quarter 2012, no U.S. federal consolidated current income tax expense has been reflected for the Company’s U.S. tax-consolidated subsidiaries due to expected utilization of net operating loss carryforwards. Remaining valuation allowances will be evaluated for reversal as we return to profitability.
Six months ended June 30, 2012 compared with six months ended June 30, 2011 Title revenues. Revenues from direct title operations increased $34.1 million, or 11.2%, in the first six months of 2012 compared to the first six months of 2011 primarily due an increase in the number of closings. The largest revenue increases were in Texas, Canada and California. Commercial revenues, included in direct title operations, decreased 6.3%, or $3.3 million.
Direct orders closed, including large commercial policies, increased 16.4% in the first six months of 2012 compared to the first six months of 2011, although the average revenue per closing, including large commercial policies, decreased 4.7% during the same periods. Direct operating revenues, excluding large commercial policies, decreased 14.4% in the first six months of 2012 compared to the first six months of 2011, while the average revenue per closing decreased 1.7% over the same periods. The increase in direct orders closed and contrasting decrease in average revenue per closing were driven by an increase in residential refinancing closings in the first six months of 2012 compared to the first six months of 2011. On average, refinance premium rates are 60% of the title premium revenue of a similarly priced sale transaction.
Revenues from independent agencies increased $41.8 million, or 10.3%, in the first six months of 2012 compared to the first six months of 2011 due to an increase in refinancing transaction volumes. The largest increases in revenues from independent agencies during the first six months of 2012 were in California, New York and Texas, partially offset by decreases in Ohio. Revenues from independent agencies net of agent retention increased 11.5%, comparable to the increase in direct title operating revenues.
REI revenues. Operating revenues from services provided by the real estate information segment increased $19.0 million, or 35.2%, in the first six months of 2012 compared to the first six months of 2011. The increase was primarily due to an increase in lower margin servicing support and REO related services partially offset by a decline in revenues from higher margin loan modification services. We expect REI revenues to increase in 2012 as recently awarded contracts continue to mature. However, demand for REI services will continue to be dependent on the number and scale of governmental programs and lender projects and can fluctuate significantly on a quarterly and annual basis.
Investment income. Investment income decreased $1.2 million, or 15.6%, in the first six months of 2012 compared to the first six months of 2011, primarily due to decreases in average yield. Certain investment gains and losses, which are included in our results of operations in investment and other gains (losses) – net, were realized as part of the ongoing management of our investment portfolio for the purpose of improving performance.
For the six months ended June 30, 2011, investment and other gains (losses) – net included a $3.9 million charge representing the payoff value on a defaulted third party loan on which we served as guarantor.
- 22 -
Retention by agencies. Amounts retained by title agencies are based on agreements between agencies and our title underwriters. On average, amounts retained by independent agencies, as a percentage of revenues generated by them, were 82.6% and 82.8% in the first six months of 2012 and 2011, respectively. The average retention percentage may vary from year-to-year or quarter-over-quarter due to the geographical mix of agency operations, the volume of title revenues and, in some states, laws or regulations. Due to the variety of such laws or regulations, as well as competitive factors, the average retention rate can differ significantly from state to state. Although general conditions in the real estate industry are improving nationwide, the recovery in specific markets has varied considerably. In addition, a high proportion of our independent agencies are in states with retention rates greater than 80% and the markets in those states have recovered relatively faster than the nation as a whole, which has resulted in our average retention percentage remaining in the 82%-83% range. We expect our average retention rate to remain in this range over the near to medium term. However, we continue to adjust independent agency contracts in an economically sound manner, and we expect the mix of agency business to normalize as real estate markets continue to stabilize nationally resulting in lower average retention percentages in the aggregate.
We continue to focus on improving the quality of our network of independent agencies in order to achieve an increase in the average revenue per agency and reduce our risk of future loss. Since we began the process of rationalizing our network of independent agencies in 2008, our average annual remittance per independent agency has increased approximately 75%, while the number of independent agencies in our network has fallen by half. In addition, the policy loss ratio of our current agency base for the trailing twelve months as of June 30, 2012 is approximately one-third of its level in the comparable period in 2008.
Employee costs. Our employee costs and certain other operating expenses are sensitive to inflation. Employee costs in the first six months of 2012 increased 10.6% from the first six months of 2011. The increase in employee costs compared to last year is primarily related to increases in our REI operations and was expected as a result of staffing requirements to provide services under new contracts awarded in the fourth quarter 2011. In the first six months of 2012, employee costs in the title segment increased 2.5% from the first six months of 2011 to support the 10.7% increase in title operating revenues.
Other operating expenses. Other operating expenses include costs that are fixed in nature, costs that follow, to varying degrees, changes in transaction volumes and revenues and costs that fluctuate independently of revenues. Costs that are fixed in nature include attorney fees, equipment rental, insurance, professional fees, rent and other occupancy expenses, repairs and maintenance, technology costs, telephone and title plant rent. Costs that follow, to varying degrees, changes in transaction volumes and revenues include fee attorney splits, bad debt expenses, certain REI expenses, copy supplies, delivery fees, outside search fees, postage, premium taxes and title plant expenses. Costs that fluctuate independently of revenues include auto expenses, general supplies, litigation defense and settlement costs, promotion costs and travel.
In the first six months of 2012 compared with the same period in 2011, other operating expenses for the combined business segments increased $11.9 million, or 9.7%. Costs fixed in nature increased $6.2 million, or 11.4%, in the first six months of 2012, primarily due to increases in technology costs and professional fees, as a result of outsourcing the internal audit function. Costs that follow, to varying degrees, changes in transaction volumes and revenues increased $5.3 million, or 11.5%, in the first six months of 2012, primarily related to increases in outside search fees. Costs that fluctuate independently of revenues in the first six months of 2012 were comparable to the same period in 2011.
Title losses. While trending favorably, losses from title policy claims continue to remain higher than historical levels. Provisions for title losses, as a percentage of title operating revenues, were 8.8% and 9.3% for the first six months of 2012 and 2011, respectively, including adjustments to certain large claims.
Cash claim payments in the first six months of 2012 decreased 6.5% from the same period in 2011. Losses incurred on known claims decreased 14.8% for the first six months of 2012 as compared to 2011. The decline in cash claim payments and losses incurred on known claims continues a trend noted for several quarters.
- 23 -

Income taxes. Our effective tax rates were 32.0% and (37.6%) for the first six months of 2012 and 2011, respectively, based on income and (losses) before taxes and after deducting noncontrolling interests, which when aggregated are 18.8 million and ($3.2) million for the first six months of 2012 and 2011, respectively. Income tax expense for the six months ended June 30, 2012 and 2011 consists principally of taxes in foreign jurisdictions for our profitable international operations and of U.S. federal tax on entities not included in our U.S. consolidated return. Income tax expense was partially offset by favorable tax adjustments in our foreign operations. For the first six months of 2012, no U.S. federal consolidated current income tax expense has been reflected for the Company’s tax-consolidated subsidiaries due to expected utilization of the net operating loss carryforwards. Remaining valuation allowances will be evaluated for reasonableness as we return to profitability.
LIQUIDITY AND CAPITAL RESOURCES Our liquidity and capital resources represent our ability to generate cash flow to meet our obligations to our shareholders, customers (payments to satisfy claims on title policies), vendors, employees, lenders and others. As of June 30, 2012, our cash and investments, including amounts reserved pursuant to statutory requirements, aggregated $649.9 million.
A substantial majority of our consolidated cash and investments as of June 30, 2012 was held by Stewart Title Guaranty Company (Guaranty) and its subsidiaries. The use and investment of these funds, dividends to the holding company, and cash transfers between Guaranty and its subsidiaries and the holding company are subject to certain legal and regulatory restrictions. In general, Guaranty may use its cash and investments in excess of its legally-mandated statutory premium reserve (established in accordance with requirements under Texas law) to fund its insurance operations, including claims payments. Guaranty may also, subject to certain limitations, provide funds to its subsidiaries (whose operations consist principally of field title offices) for their operating and debt service needs.
Guaranty cannot pay a dividend to its parent in excess of certain limits without the approval of the Texas Insurance Commissioner. As of December 31, 2011, the maximum dividend that could be paid in 2012 after such approval in 2012 is $74.4 million. Guaranty did not pay a dividend in the six months ended June 30, 2012 or 2011. However, the maximum dividend permitted by law is not necessarily indicative of Guaranty’s actual ability to pay dividends, which may be constrained by business and regulatory considerations, such as the impact of dividends on surplus, which could affect its ratings or competitive position, the amount of insurance it can write and its ability to pay future dividends. Further, depending on business and regulatory conditions, we may in the future need to retain cash in Guaranty or even raise cash in the capital markets to contribute to it in order to maintain its ratings or statutory capital position. Such a requirement could be the result of investment losses, reserve charges, adverse operating conditions in the current economic environment or changes in interpretation of statutory accounting requirements by regulators.
Cash held at the parent company totaled $8.7 million at June 30, 2012. As noted above, as a holding company, the parent is funded principally by cash from its subsidiaries in the form of dividends and for operating and other administrative expense reimbursements. The expense reimbursements are paid in accordance with the management agreements among us and our subsidiaries. As the parent company conducts no operations apart from its wholly-owned subsidiaries, the discussion below focuses on consolidated cash flows.
- 24 -
For the Six Months
Ended June 30, 2012 2011 (dollars in millions)
Net cash provided (used) by operating activities 19.4 (6.5) Net cash provided (used) by investing activities 6.7 (22.4) Net cash used by financing activities (8.9) (3.8)

Operating activities Our principal sources of cash from operations are premiums on title policies and revenue from title service-related transactions, mortgage service support and REO related services. Our independent agencies remit cash to us net of their contractual retention. Our principal cash expenditures for operations are employee costs, operating costs and title claims payments.
Cash provided by operations for the first six months of 2012 was $19.4 million, an improvement of $25.9 million from the $6.5 million used by operations during the same period in 2011. This improvement is primarily related to a combined $19.2 million increase in pretax earnings from both our Title segment and REI segment during the first six months of 2012 compared to the same period in 2011, along with a $16.8 million reduction in payables and accrued liabilities for the same periods. This improvement is partially offset by a $17.9 million increase in receivables during the first six months of 2012 compared to the same period in 2011, which we anticipate collecting in the third quarter as it relates to increased revenues from our REI servicing support and REO related services.
Our business is labor intensive, although we continue to make progress in automating our services, which allows us to more easily adjust staffing levels as order volumes fluctuate. There are typically delays between changes in market conditions and changes in staffing levels; therefore, employee costs do not change at the same rate as revenues change.
The insurance regulators of the states in which our underwriters are domiciled require our statutory premium reserves to be fully funded, segregated and invested in high-quality securities and short-term investments. As of June 30, 2012, cash and investments funding the statutory premium reserve aggregated $430.0 million and our statutory estimate of claims that may be reported in the future totaled $378.1 million. In addition to this restricted cash and investments, we had unrestricted cash and investments (excluding equity method investments) of $110.3 million, which are available for underwriter operations, including claims payments.
Investing activities Cash from investing activities was generated principally by proceeds from investments matured and sold in the amounts of $81.9 million and $140.6 million for the first six months of 2012 and 2011, respectively. We used cash for the purchases of investments in the amounts of $71.3 million and $148.4 million for the first six months of 2012 and 2011, respectively. The cash from sales and maturities not reinvested was used principally to fund operations.
Capital expenditures were $9.1 million and $11.1 million for the first six months of 2012 and 2011, respectively. We maintain investment in capital expenditures at a level that enables us to implement technologies for increasing our operational and back-office efficiencies. Notwithstanding this, we also continue to aggressively manage cash flow and, therefore, overall capital spending will continue to be at relatively reduced levels. During the first six months of 2012, we sold assets and subsidiaries resulting in cash receipts of $4.4 million.
In June 2011, we paid $3.9 million in satisfaction of a loan guaranty obligation on a defaulted third-party loan.
Financing activities and capital resources Total debt and stockholders’ equity were $71.5 million and $481.9 million, respectively, as of June 30, 2012. Included in total debt are $64.6 million principal amount of convertible senior notes, which mature October 2014, if not converted into shares of common stock. We repaid $4.8 million and $1.6 million of debt in accordance with the underlying terms of the debt instruments in the first six months of 2012 and 2011, respectively. We also have available a $10.0 million bank line of credit commitment, which expires in June 2013, under which no borrowings were outstanding at June 30, 2012.
- 25 -

Effect of changes in foreign currency rates
The effect of changes in foreign currency rates on the consolidated statements of cash flows was a net decrease in cash and cash equivalents of $0.4 million for the first six months of 2012 compared to an increase of $0.9 million for the first six months of 2011. Our principal foreign operating unit is in Canada, and, on average, the value of the U.S. dollar relative to the Canadian dollar decreased during the first quarter 2012 but increased to the December 2011 level during the second quarter 2012.
***********
We believe we have sufficient liquidity and capital resources to meet the cash needs of our ongoing operations. However, if we determine that supplemental debt, including additional convertible debentures, or equity funding is warranted to provide additional liquidity for unforeseen circumstances or strategic acquisitions, we may pursue those sources of cash. Other than scheduled maturities of debt, operating lease payments, purchase agreements and anticipated claims payments in 2012, we have no material commitments. We expect that cash flows from operations and cash available from our underwriters, subject to regulatory restrictions, will be sufficient to fund our operations, including claims payments. However, to the extent that these funds are not sufficient, we may be required to borrow funds on terms less favorable than we currently have, or seek funding from the equity market, which may not be successful or may be on terms that are dilutive to existing shareholders.
Contingent liabilities and commitments. In the ordinary course of business, we guarantee the third-party indebtedness of certain of our consolidated subsidiaries. As of June 30, 2012, the maximum potential future payments on the guarantees are not more than the related notes payable recorded in the consolidated balance sheets. We also guarantee the indebtedness related to lease obligations of certain of our consolidated subsidiaries. The maximum future obligations arising from these lease-related guarantees are not more than our future minimum lease payments. As of June 30, 2012, we had guarantees of indebtedness owed by certain third parties related to business expansion and unused letters of credit aggregating to $4.1 million, primarily related to workers’ compensation.
Other comprehensive earnings. Unrealized gains and losses on investments and changes in foreign currency exchange rates are reported net of deferred taxes in accumulated other comprehensive earnings, a component of stockholders’ equity, until realized. For the first six months of 2012, net unrealized investment gains of $4.7 million, which increased our other comprehensive earnings, were primarily related to temporary increases in fair market values of corporate bond investments. For the first six months of 2011, net unrealized investment gains of $1.1 million, which increased our other comprehensive earnings, were primarily related to temporary increases in fair market values of corporate and government bond investments. Changes in foreign currency exchange rates, primarily related to our Canadian operations, were relatively unchanged for the first six months of 2012 and increased other comprehensive earnings by $0.9 million, net of taxes, for the first six months of 2011.
Off-balance sheet arrangements. We do not have any material source of liquidity or financing that involves off-balance sheet arrangements, other than our contractual obligations under operating leases. We also routinely hold funds in segregated escrow accounts pending the closing of real estate transactions and have qualified intermediaries in tax-deferred property exchanges for customers pursuant to Section 1031 of the Internal Revenue Code. The Company holds the proceeds from these transactions until a qualifying exchange can occur. See Note 18 in our Annual Report on Form 10-K for the year ended December 31, 2011.
- 26 -

Forward-looking statements. Certain statements in this report are “forward-looking statements” within the meaning of the Private Securities Litigation Reform Act of 1995. Such forward-looking statements relate to future, not past, events and often address our expected future business and financial performance. These statements often contain words such as “expect,” “anticipate,” “intend,” “plan,” “believe,” “seek,” “will,” “foresee” or other similar words. Forward-looking statements by their nature are subject to various risks and uncertainties that could cause our actual results to be materially different than those expressed in the forward-looking statements. These risks and uncertainties include, among other things, the severity and duration of current financial and economic conditions; changes in the level of real estate activity; changes in mortgage interest rates, existing and new home sales, and availability of mortgage financing; our ability to respond to and implement technology changes, including the completion of the implementation of our enterprise systems; the impact of unanticipated title losses on the need to further strengthen our policy loss reserves; any effect of title losses on our cash flows and financial condition; the impact of our increased diligence and inspections in our agency operations; changes to the participants in the secondary mortgage market and the rate of refinancings that affect the demand for title insurance products; regulatory non-compliance, fraud or defalcations by our title insurance agencies or employees; our ability to timely and cost-effectively respond to significant industry changes and introduce new products and services; the outcome of pending litigation; the impact of changes in governmental and insurance regulations, including any future reductions in the pricing of title insurance products and services; our dependence on our operating subsidiaries as a source of cash flow; the continued realization of expected expense savings resulting from our expense reduction steps; our ability to access the equity and debt financing markets when and if needed; our ability to grow our international operations; and our ability to respond to the actions of our competitors; These risks and uncertainties, as well as others, are discussed in more detail documents filed with the Securities and Exchange Commission, including our Annual Report on Form 10-K for the year ended December 31, 2011, our quarterly reports on Form 10-Q, and our Current Reports on Form 8-K. We expressly disclaim any obligation to update any forward-looking statements contained in this report to reflect events or circumstances that may arise after the date hereof, except as may be required by applicable law.
There have been no material changes during the quarter ended June 30, 2012 in our investment strategies, types of financial instruments held or the risks associated with such instruments that would materially alter the market risk disclosures made in our Annual Report on Form 10-K for the year ended December 31, 2011.
Our principal executive officer and principal financial officer are responsible for establishing and maintaining disclosure controls and procedures. They evaluated the effectiveness of our disclosure controls and procedures (as defined in Exchange Act Rules 13a-15(e) and 15d-15(e)) as of June 30, 2012, and have concluded that, as of such date, our disclosure controls and procedures are adequate and effective to ensure that information we are required to disclose in the reports that we file or submit under the Exchange Act is (i) recorded, processed, summarized and reported within the time periods specified in the SEC’s rules and forms, and (ii) accumulated and communicated to our management, including our principal executive officer and principal financial officer, as appropriate to allow timely decisions regarding required disclosure.
Our management is responsible for establishing and maintaining adequate internal control over financial reporting (as defined in Exchange Act Rule 13a-15(f)). Our internal control over financial reporting is a process, under the supervision of our principal executive officer and principal financial officer, designed to provide reasonable assurance regarding the reliability of financial reporting and the preparation of financial statements for external purposes in accordance with generally accepted accounting principles. Our management, with the participation of our principal executive officer and principal financial officer, assessed the effectiveness of our internal control over financial reporting as of June 30, 2012. In making this assessment, our management used the criteria set forth by the Committee of Sponsoring Organizations of the Treadway Commission (COSO) in Internal Control – Integrated Framework. Based on this assessment, management believes that, as of June 30, 2012, our internal control over financial reporting is effective based on those criteria.
- 27 -
Item 3. Quantitative and Qualitative Disclosures About Market Risk
Item 4. Controls and Procedures

All internal control systems, no matter how well designed, have inherent limitations. Therefore, even those systems determined to be effective can provide only reasonable assurance with respect to financial statement preparation and presentation. Internal control over financial reporting is a process that involves human diligence and compliance and is subject to lapses in judgment and breakdowns resulting from human failures. Internal control over financial reporting also can be circumvented by collusion or improper management override. Due to such limitations, there is a risk that material misstatements may not be prevented or detected on a timely basis by internal control over financial reporting. However, these inherent limitations are known features of the financial reporting process. Therefore, it is possible to design into the process safeguards to reduce, though not eliminate, this risk.
There has been no change in our internal control over financial reporting during the quarter ended June 30, 2012 that has materially affected, or is reasonably likely to materially affect, our internal control over financial reporting. As a result, no corrective actions were required or undertaken.
PART II – OTHER INFORMATION
See discussion of legal proceedings in NOTE 9 to the Condensed Consolidated Financial Statements included in Item 1 of Part I of this Report, which is incorporated by reference into this Part II, Item 1, as well as Item 3. Legal Proceedings, in our Annual Report on Form 10-K for the year ended December 31, 2011.
There have been no changes during the quarter ended June 30, 2012 to our risk factors as listed in our Annual Report on Form 10-K for the fiscal year ended December 31, 2011.
We had a book value per share of $24.90 and $24.01 as of June 30, 2012 and December 31, 2011, respectively. As of June 30, 2012, our book value per share was based on approximately $481.9 million in stockholders’ equity and 19,351,985 shares of Common and Class B Common Stock outstanding. As of December 31, 2011, our book value per share was based on approximately $463.5 million in stockholders’ equity and 19,303,844 shares of Common and Class B Common Stock outstanding.
Those exhibits required to be filed by Item 601 of Regulation S-K are listed in the Index to Exhibits immediately preceding the exhibits filed herewith and such listing is incorporated herein by reference.
- 28 -
Item 1. Legal Proceedings
Item 1A. Risk Factors
Item 5. Other Information
Item 6. Exhibits

SIGNATURE
Pursuant to the requirements of the Securities and Exchange Act of 1934, I have duly caused this report to be signed on our behalf by the undersigned thereunto duly authorized.
August 3, 2012 Date
- 29 -
Stewart Information Services Corporation Registrant
By: /s/ J. Allen Berryman
J. Allen Berryman, Chief Financial Officer, Secretary, Treasurer and Principal Financial Officer

INDEX TO EXHIBITS
Exhibit
3.1
-
Amended and Restated Certificate of Incorporation of the Registrant, dated May 1, 2009 (incorporated by reference in this report from Exhibit 3.1 of the Current Report on Form 8-K filed May 5, 2009)
3.2
-
Certificate of Amendment to Amended and Restated Certificate of Incorporation of the Registrant, dated April 30, 2010 (incorporated by reference in this report from Exhibit 3.2 of the Quarterly Report on Form 10-Q for the quarterly period ended March 31, 2010)
3.3
-
Amended and Restated By-Laws of the Registrant, as of January 17, 2012 (incorporated by reference in this report from Exhibit 3.1 of the Current Report on Form 8-K filed January 20, 2012)
4.1 - Rights of Common and Class B Common Stockholders (incorporated by reference to Exhibits 3.1 and 3.2 hereto)
4.2
-
Indenture related to 6.0% Convertible Senior Notes due 2014, dated as of October 15, 2009, by and between the Registrant, the Guarantors party thereto, and Wells Fargo Bank, N.A., as trustee (incorporated by reference from Exhibit 4.1 to the Current Report on Form 8-K filed October 15, 2009)
4.3
-
Form of 6.0% Convertible Senior Note due 2014 (incorporated by reference from Exhibit 4.2 to the Current Report on Form 8-K filed October 15, 2009)
31.1 * - Certification of Chief Executive Officer pursuant to Section 302 of the Sarbanes-Oxley Act of 2002
31.2 * - Certification of Chief Financial Officer pursuant to Section 302 of the Sarbanes-Oxley Act of 2002
32.1 * - Certification of Chief Executive Officer pursuant to Section 906 of the Sarbanes-Oxley Act of 2002
32.2 * - Certification of Chief Financial Officer pursuant to Section 906 of the Sarbanes-Oxley Act of 2002
101.INS ** - XBRL Instance Document
101.SCH ** - XBRL Taxonomy Extension Schema Document
101.CAL ** - XBRL Taxonomy Extension Calculation Linkbase Document
101.DEF ** - XBRL Taxonomy Extension Definition Linkbase Document
101.LAB ** - XBRL Taxonomy Extension Label Linkbase Document
101.PRE ** - XBRL Taxonomy Extension Presentation Linkbase Document
* Filed herewith ** Pursuant to Rule 406T of Regulation S-T, these interactive data files are deemed not filed or part of a registration statement or
prospectus for purposes of Sections 11 and 12 of the Securities Act of 1933, are deemed not filed for purposes of Section 18 of the securities Exchange Act of 1934 and otherwise are not subject to liability under those sections.

EXHIBIT 31.1
CERTIFICATION
Pursuant to Section 302 of the Sarbanes-Oxley Act of 2002
I, Matthew W. Morris, certify that:
1. I have reviewed this quarterly report on Form 10-Q of Stewart Information Services Corporation (registrant);
2. Based on my knowledge, this report does not contain any untrue statement of a material fact or omit to state a material fact necessary to make the statements made, in light of the circumstances under which such statements were made, not misleading with respect to the period covered by this report;
3. Based on my knowledge, the financial statements, and other financial information included in this report, fairly present in all material respects the financial condition, results of operations and cash flows of the registrant as of, and for, the periods presented in this report;
4. The registrant’s other certifying officers and I are responsible for establishing and maintaining disclosure controls and procedures (as defined in Exchange Act Rules 13a-15(e) and 15d-15(e)) and internal control over financial reporting (as defined in Exchange Act Rules 13a-15(f) and 15d-15(f)) for the registrant and have:
5. The registrant’s other certifying officers and I have disclosed, based on our most recent evaluation of internal control over financial reporting, to the registrant’s auditors and the audit committee of the registrant’s board of directors (or persons performing the equivalent functions):
Dated: August 3, 2012
(a) designed such disclosure controls and procedures, or caused such disclosure controls and procedures to be designed under our supervision, to ensure that material information relating to the registrant, including its consolidated subsidiaries, is made known to us by others within those entities, particularly during the period in which this report is being prepared;
(b) designed such internal control over financial reporting, or caused such internal control over financial reporting to be designed under our supervision, to provide reasonable assurance regarding the reliability of financial reporting and the preparation of financial statements for external purposes in accordance with generally accepted accounting principles;
(c) evaluated the effectiveness of the registrant’s disclosure controls and procedures and presented in this report our conclusions about the effectiveness of the disclosure controls and procedures, as of the end of the period covered by this report based on suchevaluation; and
(d) disclosed in this report any change in the registrant’s internal control over financial reporting that occurred during the registrant’s most recent fiscal quarter (the registrant’s fourth fiscal quarter in the case of an annual report) that has materially affected, or is reasonably likely to materially affect, the registrant’s internal control over financial reporting; and
(a) all significant deficiencies and material weaknesses in the design or operation of internal control over financial reporting which are reasonably likely to adversely affect the registrant’s ability to record, process, summarize and report financial information; and
(b) any fraud, whether or not material, that involves management or other employees who have a significant role in the registrant’s internal control over financial reporting.
/s/ Matthew W. Morris Title: Chief Executive Officer

EXHIBIT 31.2
CERTIFICATION
Pursuant to Section 302 of the Sarbanes-Oxley Act of 2002
I, J. Allen Berryman, certify that:
1. I have reviewed this quarterly report on Form 10-Q of Stewart Information Services Corporation (registrant);
2. Based on my knowledge, this report does not contain any untrue statement of a material fact or omit to state a material fact necessary to make the statements made, in light of the circumstances under which such statements were made, not misleading with respect to the period covered by this report;
3. Based on my knowledge, the financial statements, and other financial information included in this report, fairly present in all material respects the financial condition, results of operations and cash flows of the registrant as of, and for, the periods presented in this report;
4. The registrant’s other certifying officers and I are responsible for establishing and maintaining disclosure controls and procedures (as defined in Exchange Act Rules 13a-15(e) and 15d-15(e)) and internal control over financial reporting (as defined in Exchange Act Rules 13a-15(f) and 15d-15(f)) for the registrant and have:
5. The registrant’s other certifying officers and I have disclosed, based on our most recent evaluation of internal control over financial reporting, to the registrant’s auditors and the audit committee of the registrant’s board of directors (or persons performing the equivalent functions):
Dated: August 3, 2012
(a) designed such disclosure controls and procedures, or caused such disclosure controls and procedures to be designed under our supervision, to ensure that material information relating to the registrant, including its consolidated subsidiaries, is made known to us by others within those entities, particularly during the period in which this report is being prepared;
(b) designed such internal control over financial reporting, or caused such internal control over financial reporting to be designed under our supervision, to provide reasonable assurance regarding the reliability of financial reporting and the preparation of financial statements for external purposes in accordance with generally accepted accounting principles;
(c) evaluated the effectiveness of the registrant’s disclosure controls and procedures and presented in this report our conclusions about the effectiveness of the disclosure controls and procedures, as of the end of the period covered by this report based on suchevaluation; and
(d) disclosed in this report any change in the registrant’s internal control over financial reporting that occurred during the registrant’s most recent fiscal quarter (the registrant’s fourth fiscal quarter in the case of an annual report) that has materially affected, or is reasonably likely to materially affect, the registrant’s internal control over financial reporting; and
(a) all significant deficiencies and material weaknesses in the design or operation of internal control over financial reporting which are reasonably likely to adversely affect the registrant’s ability to record, process, summarize and report financial information; and
(b) any fraud, whether or not material, that involves management or other employees who have a significant role in the registrant’s internal control over financial reporting.
/s/ J. Allen Berryman Title: Chief Financial Officer, Secretary, Treasurer, and Principal Financial Officer

EXHIBIT 32.1
CERTIFICATION
PURSUANT TO SECTION 906 OF THE SARBANES-OXLEY ACT OF 2002
In connection with the Quarterly Report of Stewart Information Services Corporation (the “Company”) on Form 10-Q for the period ending June 30, 2012, as filed with the Securities and Exchange Commission on the date hereof (the “Report”), I, Matthew W. Morris, Chief Executive Officer of the Company, certify, pursuant to 18 U.S.C. § 1350, as adopted pursuant to Section 906 of the Sarbanes-Oxley Act of 2002, that to my knowledge:
(1) the Report fully complies with the requirements of Section 13(a) or 15(d) of the Securities Exchange Act of 1934; and
(2) the information contained in the Report fairly presents, in all material respects, the financial condition and results of operations of the Company.
Dated: August 3, 2012
A signed original of this written statement required by Section 906 has been provided to Stewart Information Services Corporation and will be retained by Stewart Information Services Corporation and furnished to the Securities and Exchange Commission or its staff upon request.
/s/ Matthew W. Morris
Name: Matthew W. MorrisTitle: Chief Executive Officer

EXHIBIT 32.2
CERTIFICATION
PURSUANT TO SECTION 906 OF THE SARBANES-OXLEY ACT OF 2002
In connection with the Quarterly Report of Stewart Information Services Corporation (the “Company”) on Form 10-Q for the period ending June 30, 2012, as filed with the Securities and Exchange Commission on the date hereof (the “Report”), I, J. Allen Berryman, Chief Financial Officer of the Company, certify, pursuant to 18 U.S.C. § 1350, as adopted pursuant to Section 906 of the Sarbanes-Oxley Act of 2002, that to my knowledge:
(1) the Report fully complies with the requirements of Section 13(a) or 15(d) of the Securities Exchange Act of 1934; and
(2) the information contained in the Report fairly presents, in all material respects, the financial condition and results of operations of the Company.
Dated: August 3, 2012
A signed original of this written statement required by Section 906 has been provided to Stewart Information Services Corporation and will be retained by Stewart Information Services Corporation and furnished to the Securities and Exchange Commission or its staff upon request.
/s/ J. Allen Berryman
Name: J. Allen BerrymanTitle: Chief Financial Officer, Secretary, Treasurer and Principal Financial Officer