Embed Size (px)
Citation preview
Forestry in Georgia: Industry and Resources
1
Impacts of the Growing Wood Pellet Sector on Forestry Nathan McClure Georgia Forestry Commission 1-800-GA-TREES www.gatrees.org
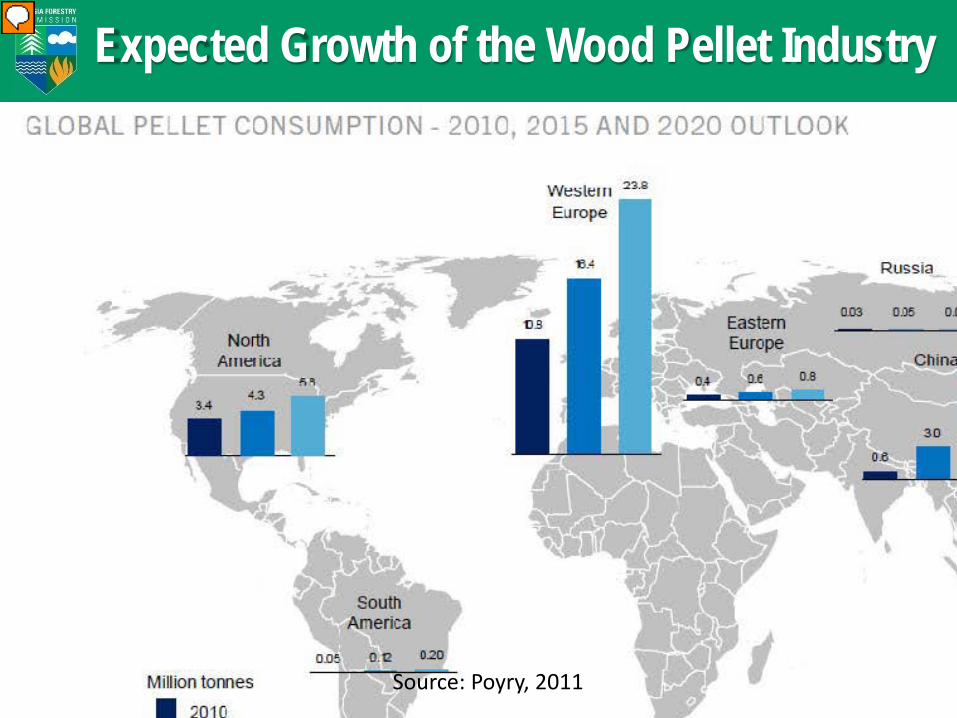
Expected Growth of the Wood Pellet Industry
Source: Poyry, 2011

0
10
20
30
40
50
60
2011 USCapacity
2011 SE USCapacity
2015 USExports to
EU -NA WoodFiber Review
2020 PoyryEU Demand
2020 IEAInternational
TradeConservative
2020 PoyryGlobal
Demand
2020 AEBIOMGlobal
Demand
2025 NewEnergyFinanceGlobal
Demand
Mill
ion
Met
ric T
onne
s Expected Growth of the Wood Pellet Industry
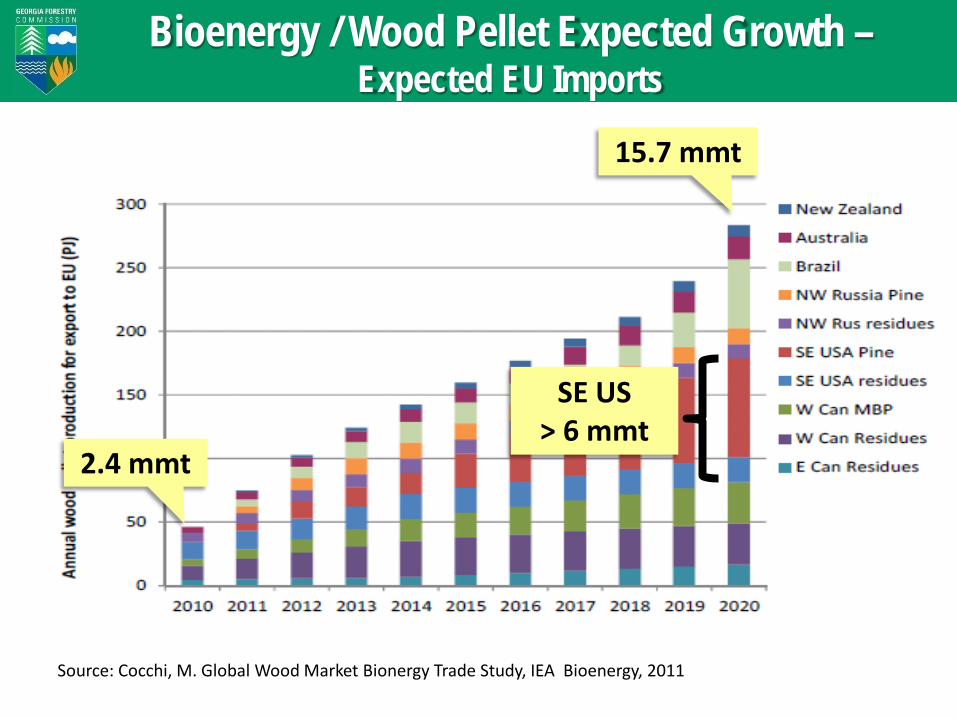
Bioenergy / Wood Pellet Expected Growth – Expected EU Imports
Source: Cocchi, M. Global Wood Market Bionergy Trade Study, IEA Bioenergy, 2011
2.4 mmt
15.7 mmt
SE US > 6 mmt
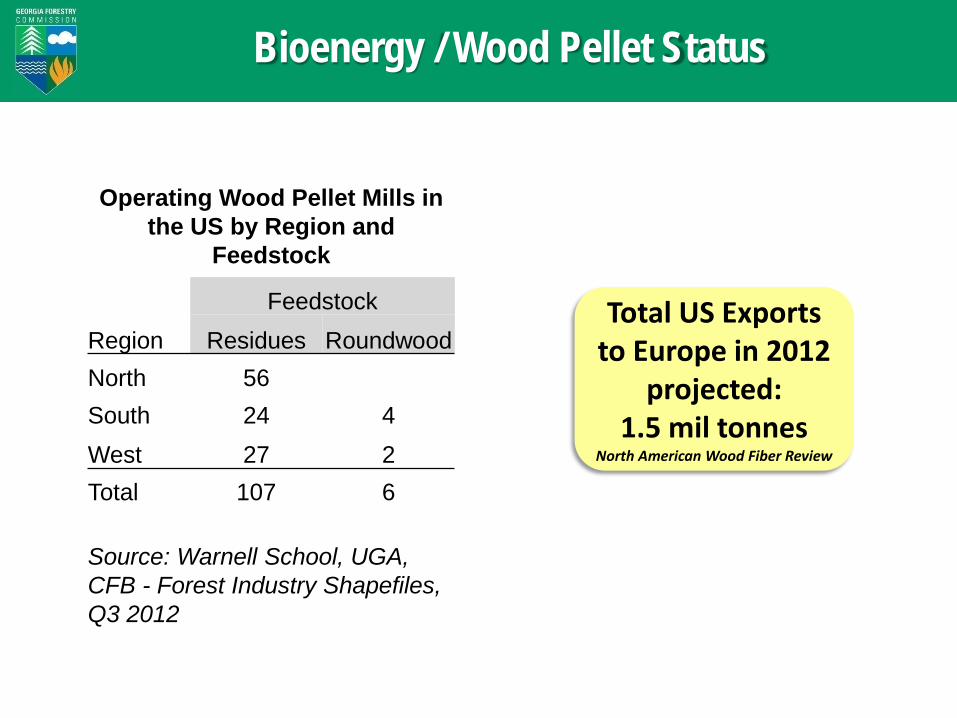
Bioenergy / Wood Pellet Status
Operating Wood Pellet Mills in the US by Region and
Feedstock
Feedstock Region Residues Roundwood North 56 South 24 4 West 27 2 Total 107 6
Source: Warnell School, UGA, CFB - Forest Industry Shapefiles, Q3 2012
Total US Exports to Europe in 2012
projected: 1.5 mil tonnes
North American Wood Fiber Review
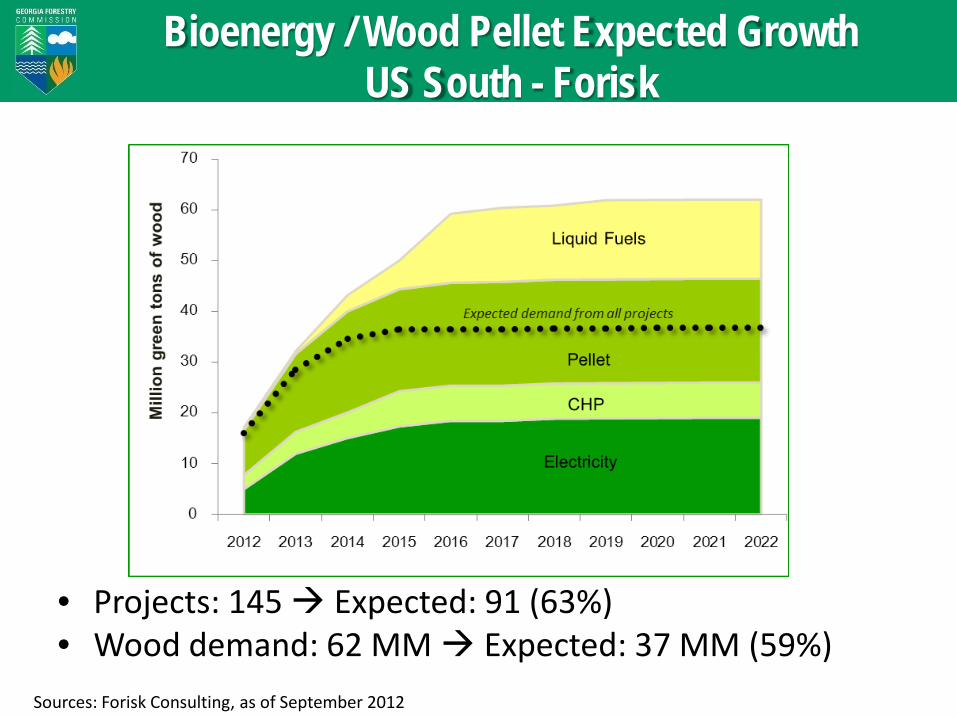
Bioenergy / Wood Pellet Expected Growth US South - Forisk
• Projects: 145 Expected: 91 (63%) • Wood demand: 62 MM Expected: 37 MM (59%)
Sources: Forisk Consulting, as of September 2012
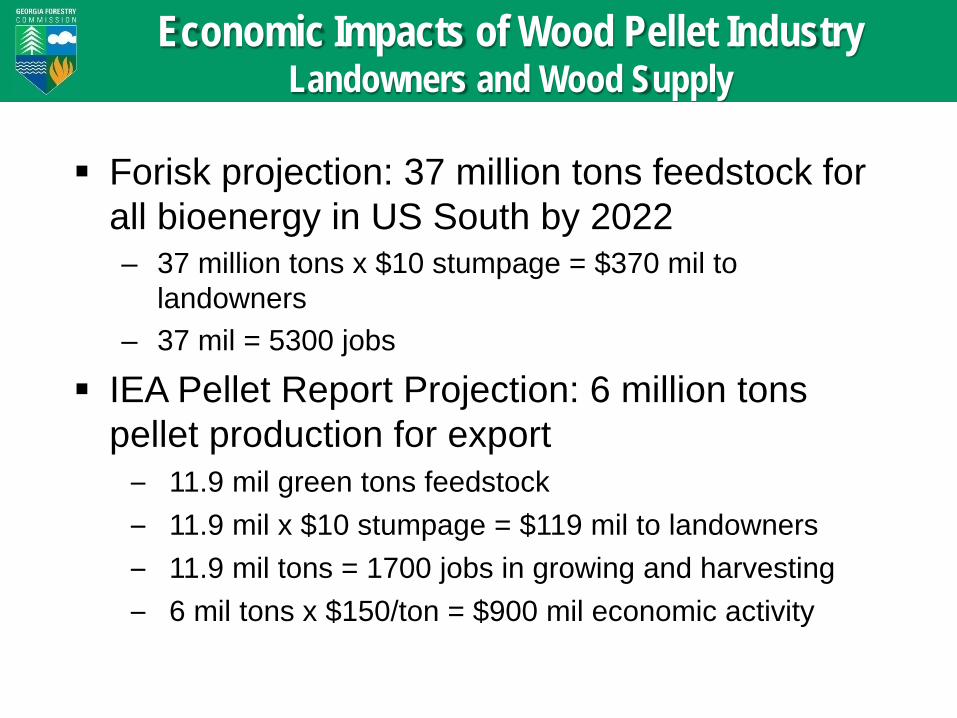
Economic Impacts of Wood Pellet Industry Landowners and Wood Supply
Forisk projection: 37 million tons feedstock for all bioenergy in US South by 2022 – 37 million tons x $10 stumpage = $370 mil to
landowners – 37 mil = 5300 jobs
IEA Pellet Report Projection: 6 million tons pellet production for export
– 11.9 mil green tons feedstock – 11.9 mil x $10 stumpage = $119 mil to landowners – 11.9 mil tons = 1700 jobs in growing and harvesting – 6 mil tons x $150/ton = $900 mil economic activity
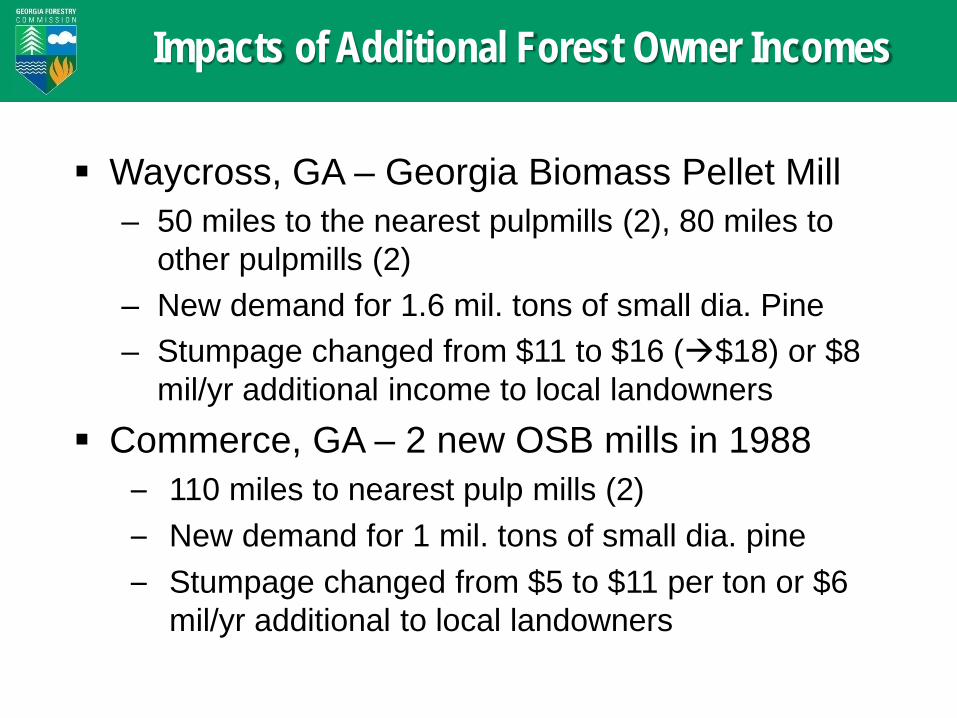
Waycross, GA – Georgia Biomass Pellet Mill – 50 miles to the nearest pulpmills (2), 80 miles to
other pulpmills (2) – New demand for 1.6 mil. tons of small dia. Pine – Stumpage changed from $11 to $16 ($18) or $8
mil/yr additional income to local landowners Commerce, GA – 2 new OSB mills in 1988
– 110 miles to nearest pulp mills (2) – New demand for 1 mil. tons of small dia. pine – Stumpage changed from $5 to $11 per ton or $6
mil/yr additional to local landowners
Impacts of Additional Forest Owner Incomes
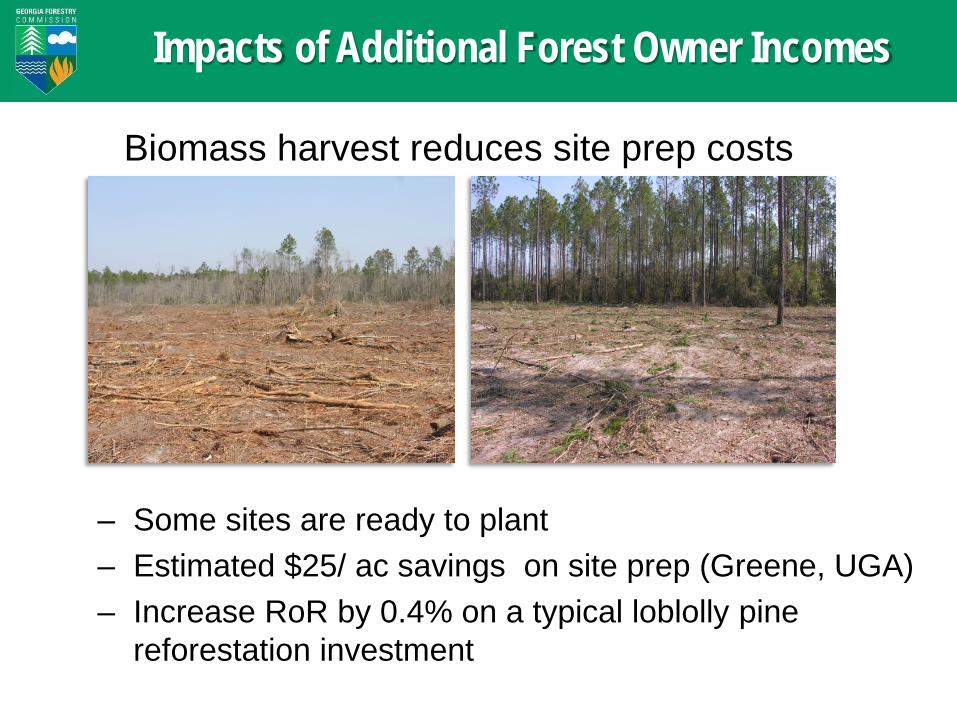
Biomass harvest reduces site prep costs
Impacts of Additional Forest Owner Incomes
– Some sites are ready to plant – Estimated $25/ ac savings on site prep (Greene, UGA) – Increase RoR by 0.4% on a typical loblolly pine
reforestation investment
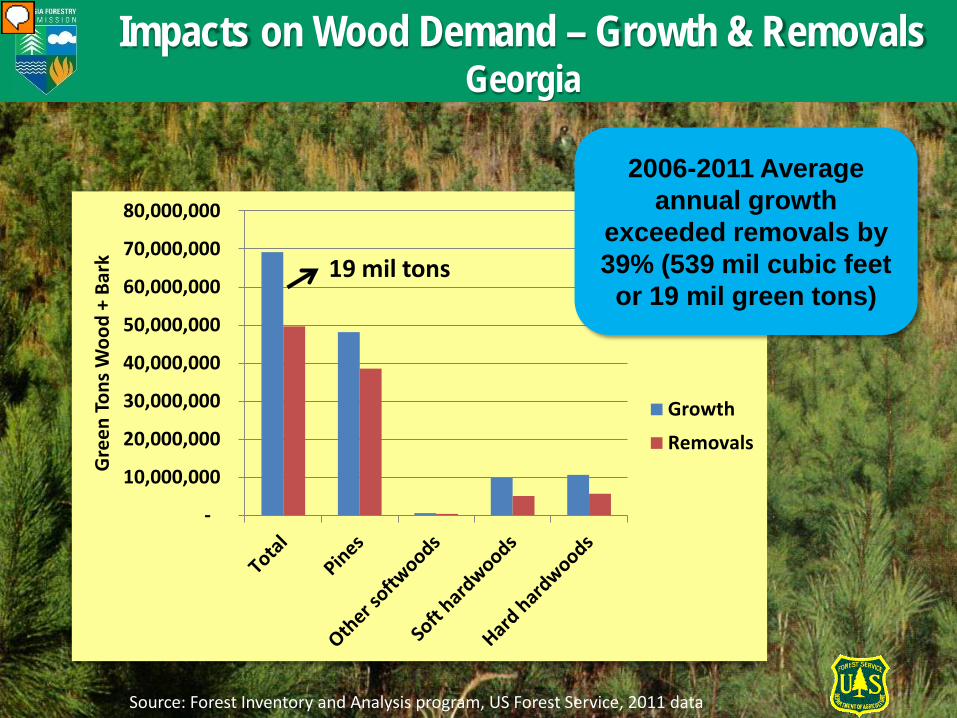
Impacts on Wood Demand – Growth & Removals Georgia
-
10,000,000
20,000,000
30,000,000
40,000,000
50,000,000
60,000,000
70,000,000
80,000,000
Gre
en T
ons W
ood
+ Ba
rk
Growth
Removals
2006-2011 Average annual growth
exceeded removals by 39% (539 mil cubic feet
or 19 mil green tons) 19 mil tons
Source: Forest Inventory and Analysis program, US Forest Service, 2011 data
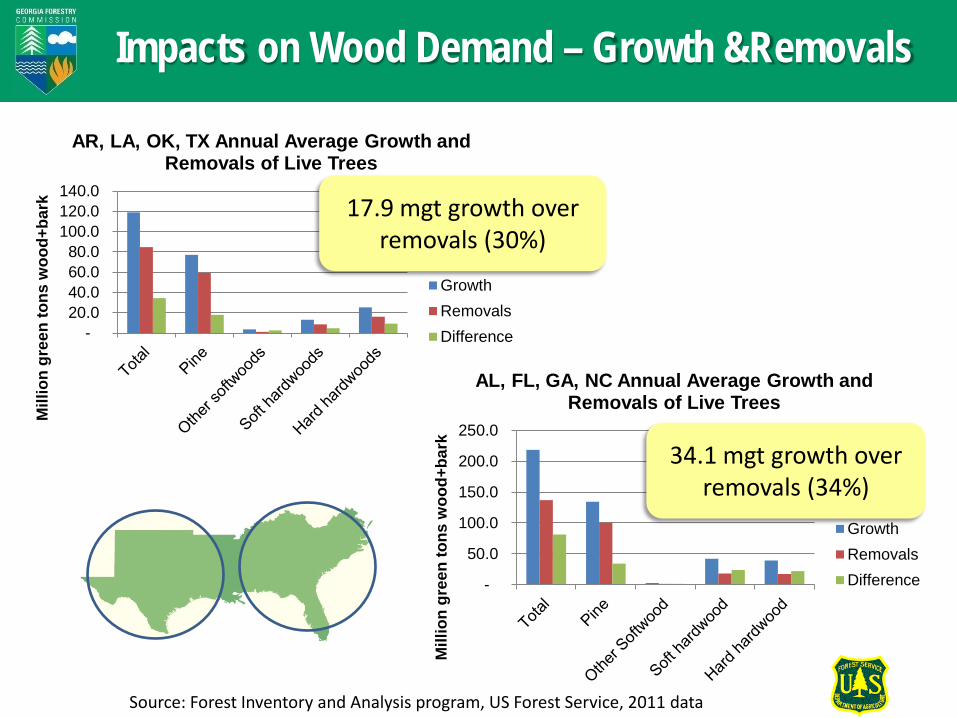
Impacts on Wood Demand – Growth &Removals
-
50.0
100.0
150.0
200.0
250.0M
illio
n gr
een
tons
woo
d+ba
rk
AL, FL, GA, NC Annual Average Growth and Removals of Live Trees
GrowthRemovalsDifference
- 20.0 40.0 60.0 80.0
100.0 120.0 140.0
Mill
ion
gree
n to
ns w
ood+
bark
AR, LA, OK, TX Annual Average Growth and Removals of Live Trees
GrowthRemovalsDifference
17.9 mgt growth over removals (30%)
34.1 mgt growth over removals (34%)
Source: Forest Inventory and Analysis program, US Forest Service, 2011 data
Source: Forest Inventory and Analysis program, US Forest Service, 2011 data
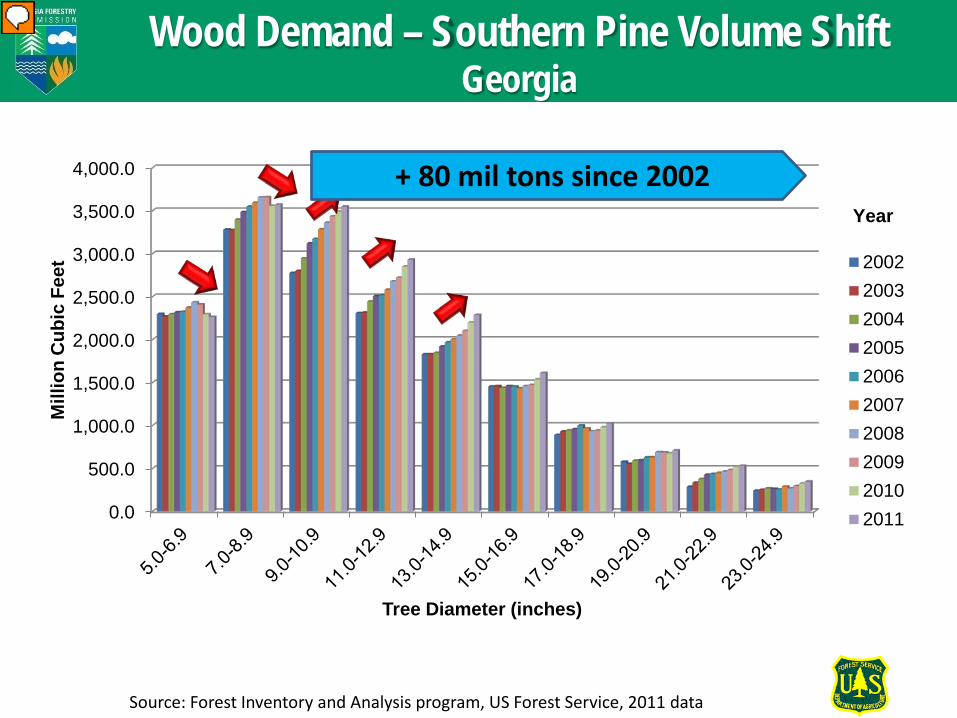
0.0
500.0
1,000.0
1,500.0
2,000.0
2,500.0
3,000.0
3,500.0
4,000.0
Mill
ion
Cub
ic F
eet
Tree Diameter (inches)
2002200320042005200620072008200920102011
Year
Wood Demand – Southern Pine Volume Shift Georgia
+ 80 mil tons since 2002
Source: R. Harper, Forest Inventory and Analysis program, US Forest Service, 2011 data
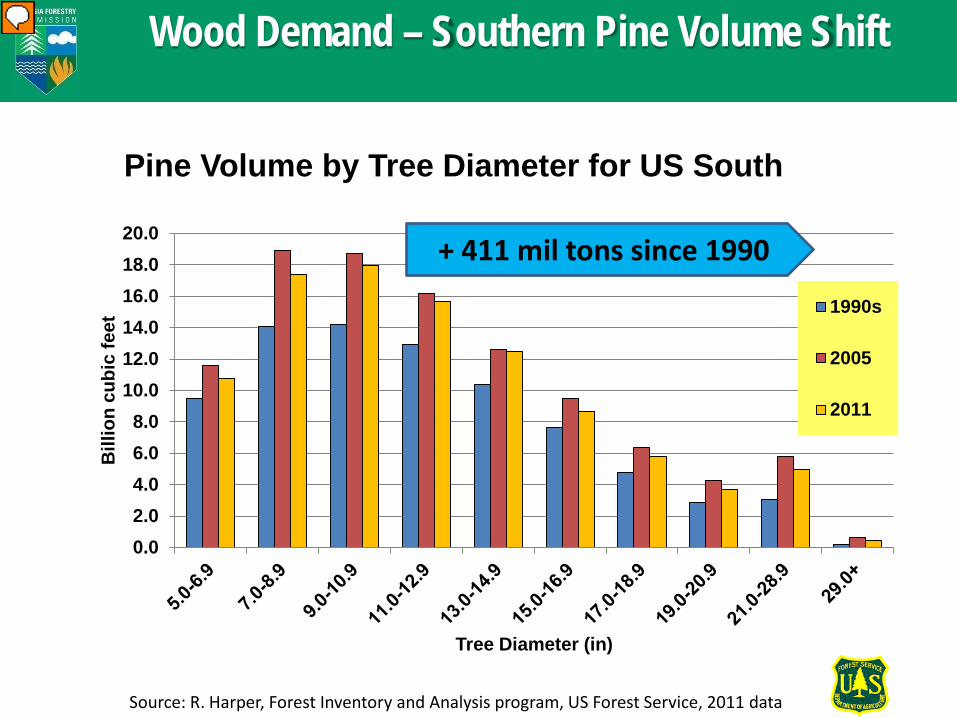
Wood Demand – Southern Pine Volume Shift
0.02.04.06.08.0
10.012.014.016.018.020.0
Bill
ion
cubi
c fe
et
Tree Diameter (in)
Pine Volume by Tree Diameter for US South
1990s
2005
2011
+ 411 mil tons since 1990

Impacts on Wood Products – Pulp & Paper
Source: TPO reports, Southern Research Station, US Forest Service, 2009 and Forisk
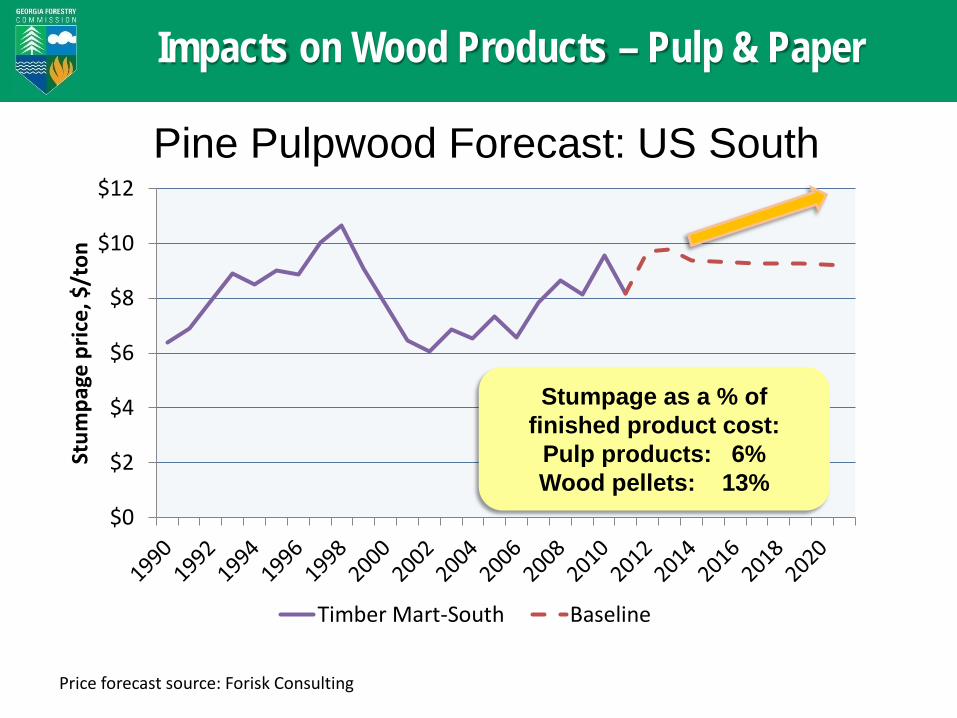
Impacts on Wood Products – Pulp & Paper
$0
$2
$4
$6
$8
$10
$12
Stum
page
pric
e, $
/ton
Timber Mart-South Baseline
Price forecast source: Forisk Consulting
Pine Pulpwood Forecast: US South
Stumpage as a % of finished product cost:
Pulp products: 6% Wood pellets: 13%
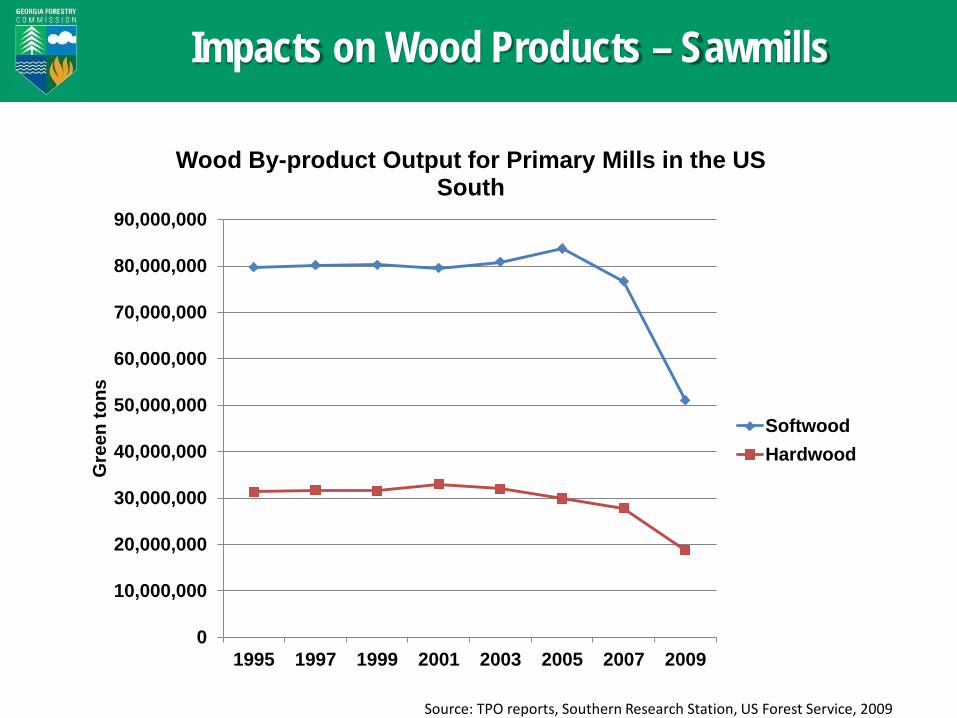
Impacts on Wood Products – Sawmills
0
10,000,000
20,000,000
30,000,000
40,000,000
50,000,000
60,000,000
70,000,000
80,000,000
90,000,000
1995 1997 1999 2001 2003 2005 2007 2009
Gre
en to
ns
Wood By-product Output for Primary Mills in the US South
SoftwoodHardwood
Source: TPO reports, Southern Research Station, US Forest Service, 2009
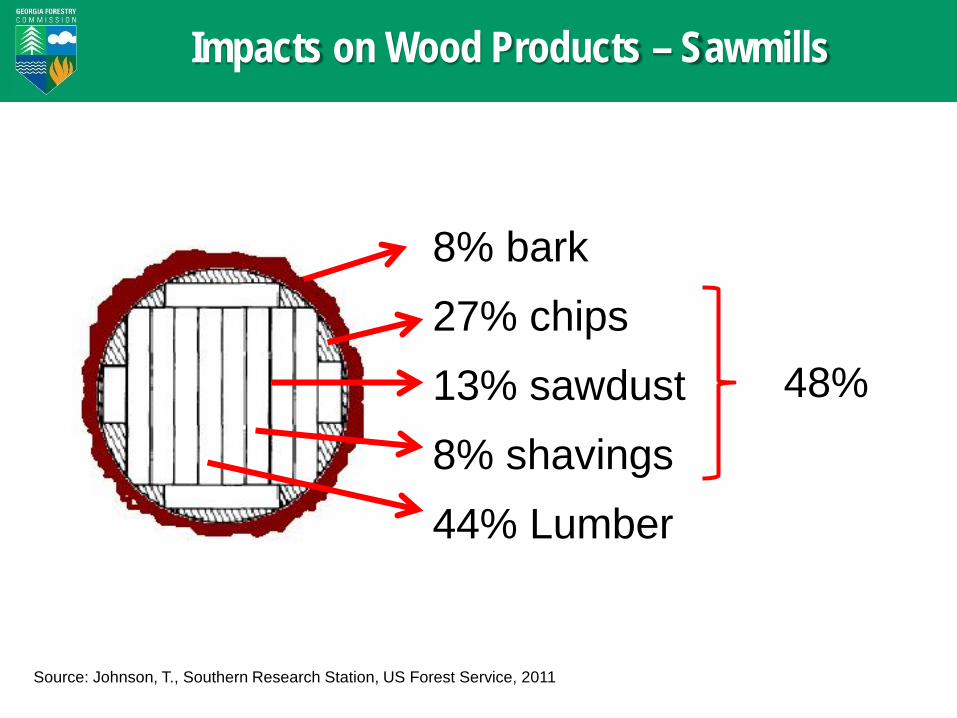
Impacts on Wood Products – Sawmills
8% bark 27% chips 13% sawdust 8% shavings 44% Lumber
48%
Source: Johnson, T., Southern Research Station, US Forest Service, 2011
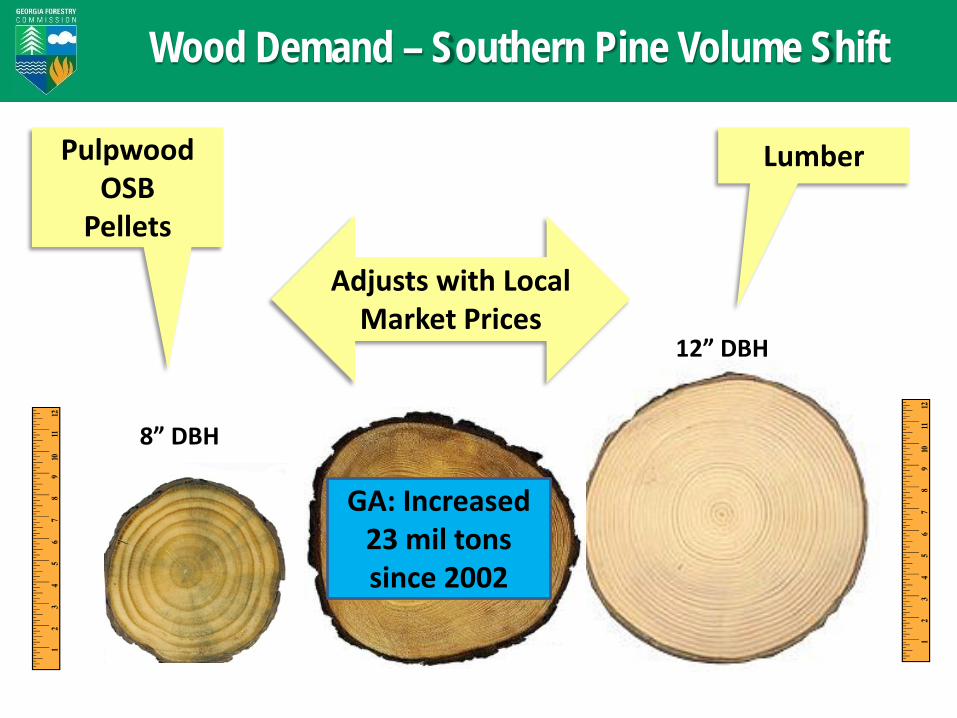
Wood Demand – Southern Pine Volume Shift
Pulpwood OSB
Pellets
Lumber
Adjusts with Local Market Prices
8” DBH
12” DBH
GA: Increased 23 mil tons since 2002
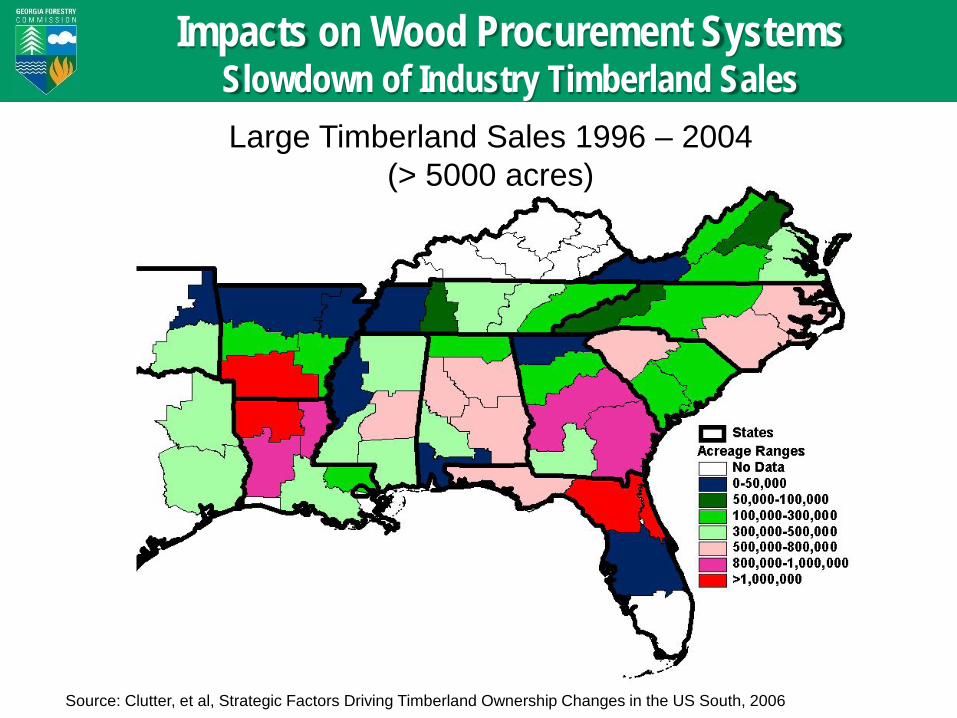
Impacts on Wood Procurement Systems Slowdown of Industry Timberland Sales Large Timberland Sales 1996 – 2004
(> 5000 acres)
Source: Clutter, et al, Strategic Factors Driving Timberland Ownership Changes in the US South, 2006
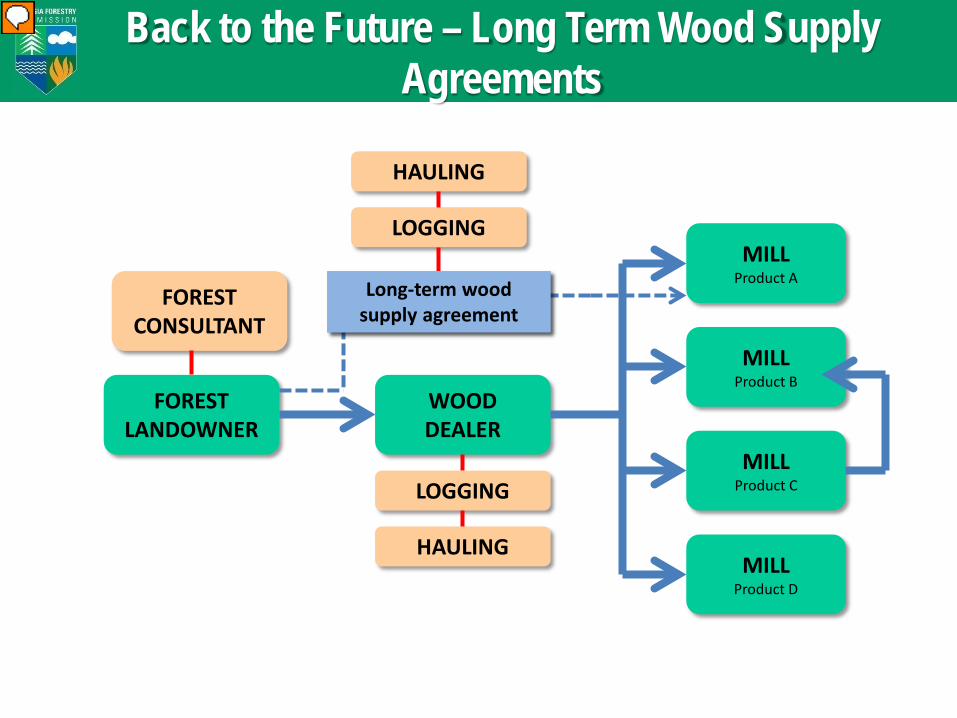
Back to the Future – Long Term Wood Supply Agreements
MILL Product A
MILL Product B
MILL Product C
MILL Product D
FOREST LANDOWNER
FOREST CONSULTANT
WOOD DEALER
LOGGING
HAULING
LOGGING
HAULING
Long-term wood supply agreement Long-term wood
supply agreement
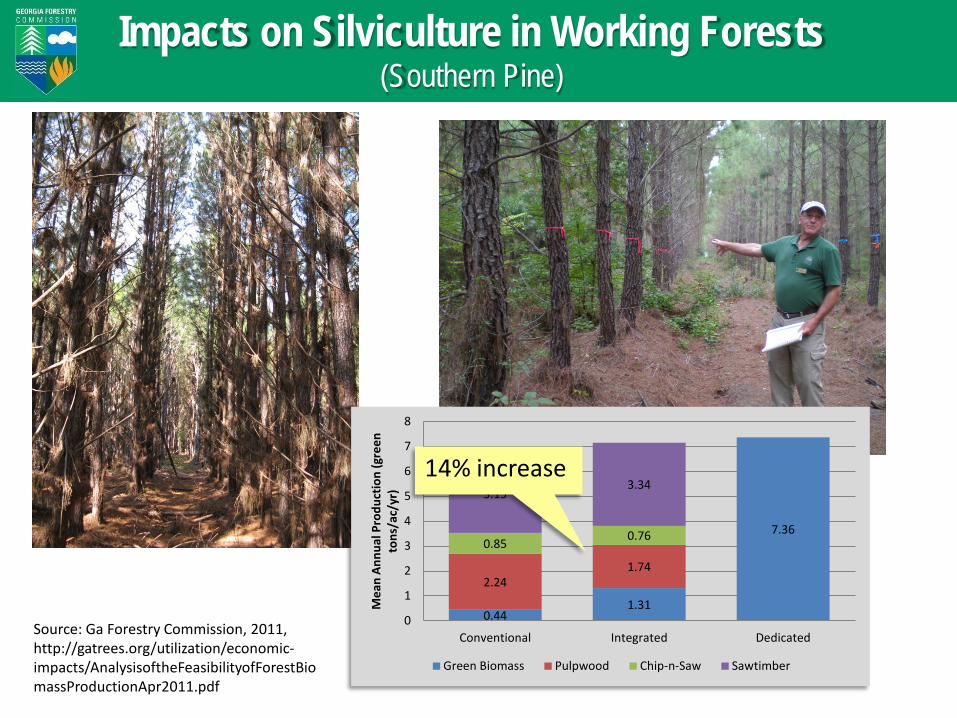
Impacts on Silviculture in Working Forests (Southern Pine)
0.44 1.31
7.36
2.24 1.74
0.85 0.76
3.15 3.34
0
1
2
3
4
5
6
7
8
Conventional Integrated Dedicated
Mea
n An
nual
Pro
duct
ion
(gre
en
tons
/ac/
yr)
Green Biomass Pulpwood Chip-n-Saw Sawtimber
14% increase
Source: Ga Forestry Commission, 2011, http://gatrees.org/utilization/economic-impacts/AnalysisoftheFeasibilityofForestBiomassProductionApr2011.pdf
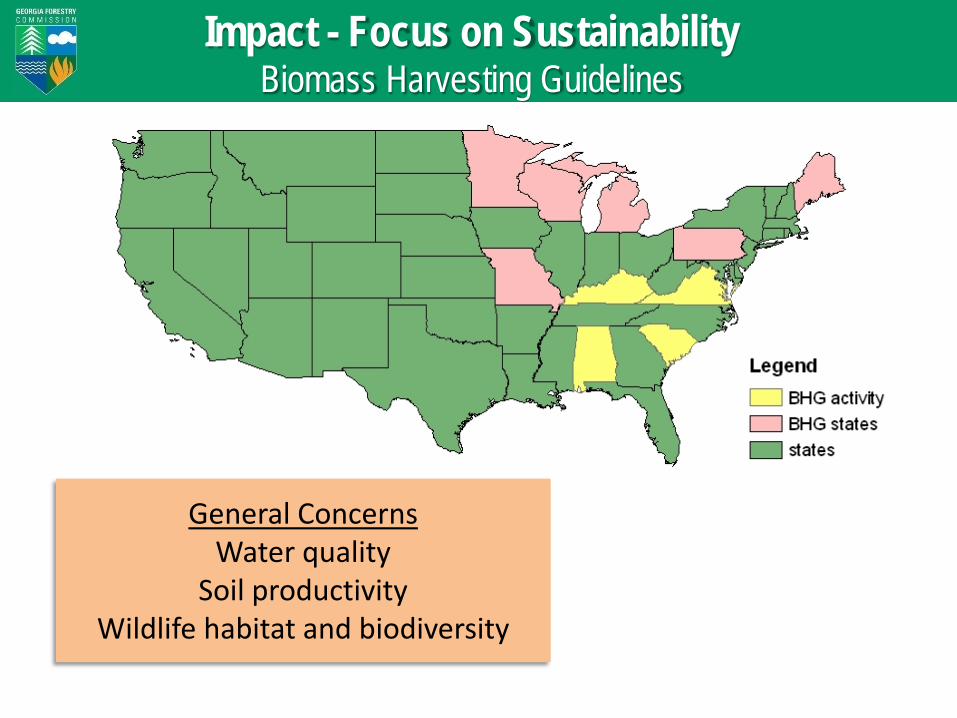
General Concerns Water quality
Soil productivity Wildlife habitat and biodiversity
Impact - Focus on Sustainability Biomass Harvesting Guidelines
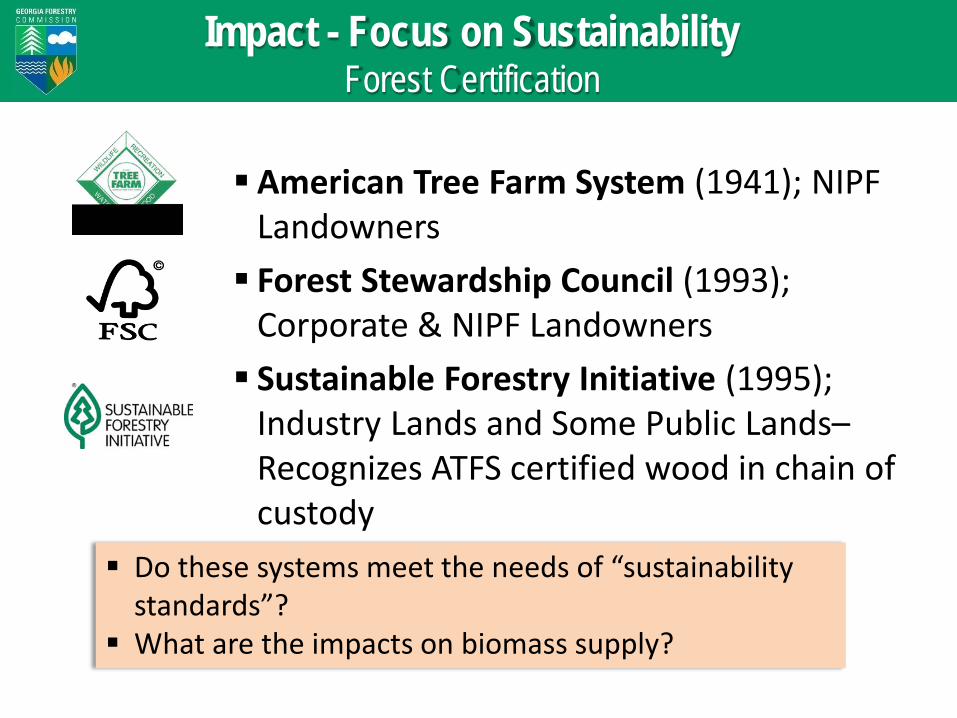
American Tree Farm System (1941); NIPF Landowners Forest Stewardship Council (1993);
Corporate & NIPF Landowners Sustainable Forestry Initiative (1995);
Industry Lands and Some Public Lands– Recognizes ATFS certified wood in chain of custody
Do these systems meet the needs of “sustainability standards”?
What are the impacts on biomass supply?
Impact - Focus on Sustainability Forest Certification
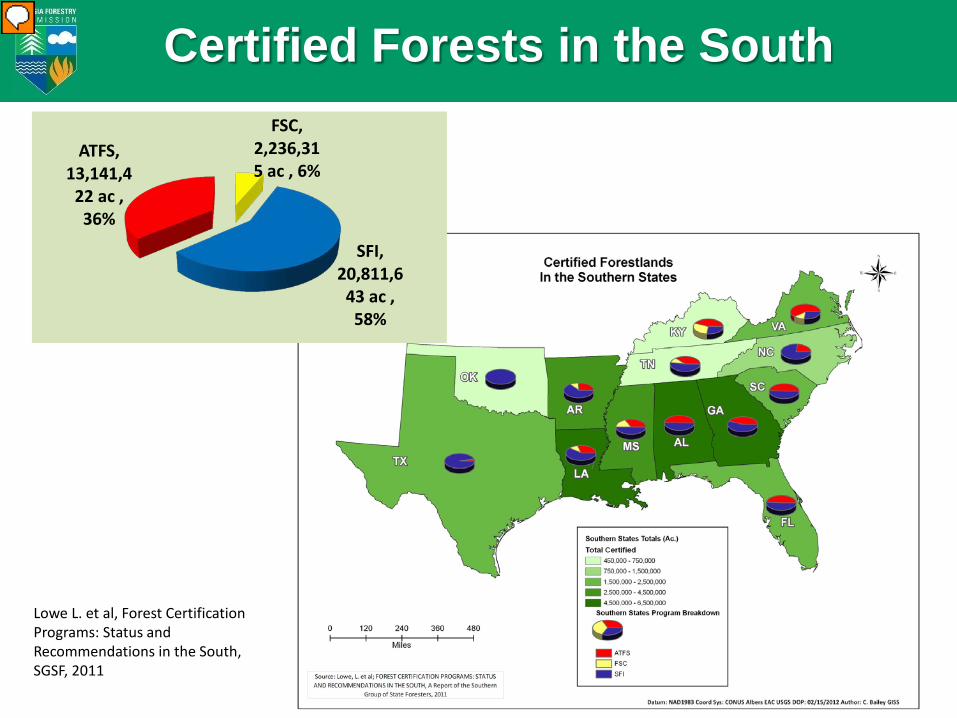
Certified Forests in the South
Lowe L. et al, Forest Certification Programs: Status and Recommendations in the South, SGSF, 2011
FSC, 2,236,315 ac , 6%
SFI, 20,811,6
43 ac , 58%
ATFS, 13,141,4
22 ac , 36%
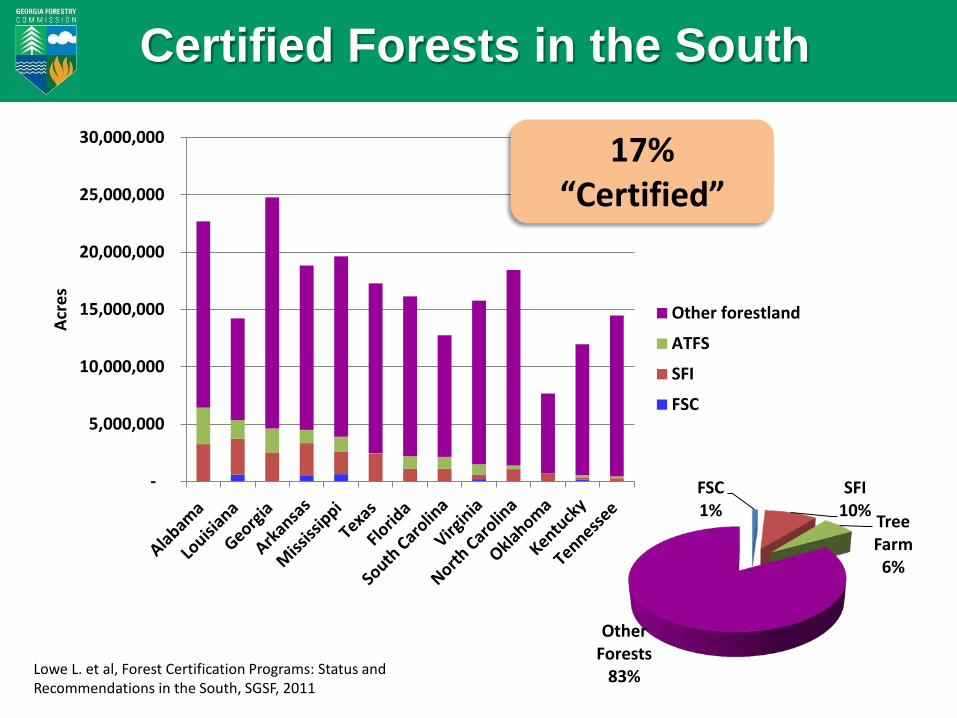
Certified Forests in the South
-
5,000,000
10,000,000
15,000,000
20,000,000
25,000,000
30,000,000
Acre
s
Other forestland
ATFS
SFI
FSC
17% “Certified”
FSC 1%
SFI 10% Tree
Farm 6%
Other Forests
83% Lowe L. et al, Forest Certification Programs: Status and Recommendations in the South, SGSF, 2011
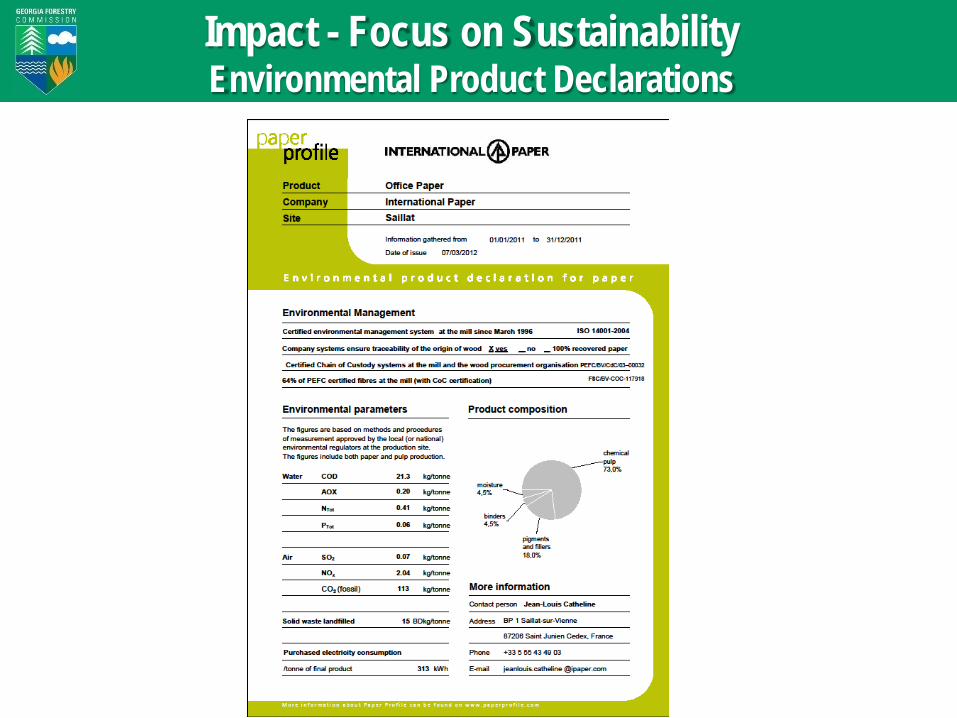
Impact - Focus on Sustainability Environmental Product Declarations

Land Prep- Rake & Pile 0.71 gl Diesel
Land Prep- Bedding 0.86 gl Diesel
Land Prep- Herbicide .149 gl Diesel
Harvest - Final 0.4- 0.6 gl Diesel
Harvest - Thinning 0.6-0.9 gl Diesel
Hand Planting 0 gl Diesel
Chipping 0.4 – 0.6 gl Diesel
Mechanical Tree Planting 0.46 gl Diesel
Transport to Mill – 50 mi. 0.73 gl Diesel
Drying – fossil supplement 319,000 btu
Drying – bark fuel 1,032,000 btu
Mill Processing 242,000 btu
Land Prep- Rake & Pile Mech. Tree Planting, Firebreaks
1.2 gl Diesel (156,600 btu)
Harvest, Chipping & Transport 1.9 gl Diesel (247,950 btu)
Drying & Mill Processing (1,593,000 btu)
1 green ton of small diameter wood
(8,600,000 btu)
0.49 ton wood pellets (6,602,450 btu)
1
4
3
3
3
Pre-suppression Firebreaks 0.01 gl Diesel
2
Energy Balance of Wood Pellets from Small Pine
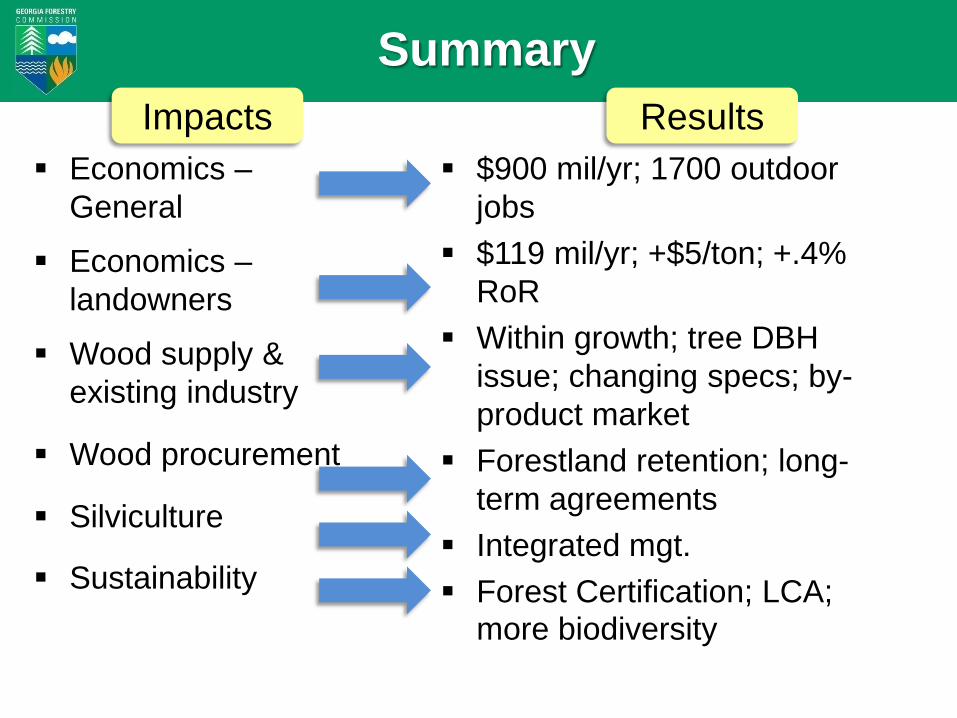
Summary
Economics – General
Economics – landowners
Wood supply & existing industry
Wood procurement
Silviculture
Sustainability
$900 mil/yr; 1700 outdoor jobs
$119 mil/yr; +$5/ton; +.4% RoR
Within growth; tree DBH issue; changing specs; by-product market
Forestland retention; long-term agreements
Integrated mgt. Forest Certification; LCA;
more biodiversity
Impacts Results