Embed Size (px)
Citation preview
1
Foreign Direct Investment
in Sri Lanka: Determinants and Impact
Konara Mudiyanselage Palitha Senarath Bandara Konara
Thesis submitted for the degree of
Doctor of Philosophy
University of York
Management
September 2013
2
Abstract
Sri Lanka is a relatively small sized island economy possessing significant resource and
location advantages and demonstrating impressive human capital indicators, which only
few countries are fortunate to have. At the same time, the country is recovering from
nearly three decades of civil war, which ended in 2009. However, Sri Lanka has
performed poorly in terms of attracting FDI.
Research in FDI in the context of Sri Lanka is limited. Only a handful of studies
(Wijeweera & Mounter, 2008; Athukorala & Jayasuriya, 2004; Athukorala, 2003;
Athukorala, 1995) have looked at FDI in the context of Sri Lanka. To fill the research
gap, this thesis attempts to formulate systematic and in-depth studies of FDI in Sri Lanka,
investigating the determinants, impact and policy issues. First, efforts are made to provide
an analytical piece that set out the environmental context of Sri Lanka before providing
details focusing on FDI. This is followed by three empirical chapters on the determinants
and impact of FDI in Sri Lanka. With regard to determinants of FDI, special attention is
given to civil war, human capital and stock market price level. For the impact, the focus is
on the impact of FDI on productivity.
Civil war is a major source of political instability and is likely to discourage FDI. Based
on the nearly three decades of civil war in Sri Lanka during the period of 1983-2009, the
first empirical study demonstrates that presence of war can have a negative effect on
incoming FDI. Though this is unsurprising, this study demonstrates different levels of
impact of war on FDI in manufacturing and services. The negative effects are much
higher in manufacturing than in services. Investigating the impact of war by market-
orientation of manufacturing FDI, this study further finds that there is a higher negative
impact on FDI in export intensive manufacturing than in market-seeking manufacturing.
Human capital is often considered to be a determining factor for FDI. Recent studies also
emphasise the importance of stock market in attracting FDI. Given Sri Lanka‘s
impressive human capital indicators and recent development of stock market, the second
research study explores these two determinants by conducting a panel study based on
annual FDI inflows to a sample of countries in Asia. It shows that the relationship
between human capital and FDI flows was significantly negative for Sri Lanka while, in
3
general, human capital has been a positive determinant of FDI flows to the rest of the
countries in the sample. Further analysis shows that Sri Lanka is constrained to capitalise
on its human capital due to linguistic limitations of human capital and qualitative
weaknesses in the education system. Although the importance of human capital in
attracting FDI is widely recognised in the theoretical consideration, empirical evidence is
inconclusive, particularly for developing countries. In this context, findings of this study
highlight the importance of recognising country specific limitations in human capital in
understanding the relationship between human capital and FDI. This study also revealed a
significant negative relationship between host country stock market valuations and
FDI in the context of Sri Lanka and other countries with under-developed stock
markets. These results indicate that cheap assets hypothesis (and expensive assets
hypothesis) is likely to be applicable in the context of countries with under-developed
stock markets, and therefore, in the context of Sri Lanka.
Based on the firm level data for Sri Lanka, the third empirical study revealed that foreign
firms are quite distinctive from local firms. Compared to domestic firms, foreign firms are
larger, more productive and more profitable. Foreign firms also tend to hire high
proportion of skilled workers, pay higher wages and undertake more in-house training
programmes. They are more active in R&D and more innovative. They are more export
oriented but rely more on inputs of foreign origin. A cross sectional econometric study
estimating direct and indirect effects of FDI on firm level labour productivity indicated a
positive own firm effects of FDI and negative spillover effects of foreign firms on local
firms and other foreign firms in the same sector.
In summary, Sri Lanka‗s economy is characterised by a lower level of industrialisation
and is narrowly concentrated in a few sectors with little participation in technical
intensive sectors. Foreign firms, through their distinctive characteristics identified in this
thesis, are likely to bring in much needed expertise and skills that could help to overcome
these structural deficiencies. However, Sri Lanka‘s mediocre performance in attracting
FDI, poor performance in attracting FDI into technology intensive sectors, and absence of
positive spillovers from foreign firms to local firms may all have resulted in poor
performance of local firms in terms of upgrading their firm specific capabilities. The goal
of the national FDI policies are twofold. First a country should attract the right type of
FDI. Second, the country should devise appropriate policies to extract benefits from it. It

4
appears that Sri Lanka has performed poorly in both of these aspects, and this has in turn,
deprived the country the much needed skills and technologies, and decelerated the
development of the country. End of the civil war has given renewed hopes for Sri Lanka.
Sri Lanka‘s impressive human capital indicators appear as a key strength. However, due
to issues with quality of education and linguistic limitations of human capital, the extent
to which Sri Lanka can exploit its impressive human capital indicators to lure FDI is
rather limited. Weak institutional environment, poorly managed exchange rate policy and
poor infrastructure appear to be major issues in terms of boosting future FDI inflows to
Sri Lanka.
5
Table of Contents
Abstract ............................................................................................................................... 2
Table of Contents ............................................................................................................... 5
List of Tables ...................................................................................................................... 9
List of Figures ................................................................................................................... 11
Acknowledgement ............................................................................................................ 12
Author’s Declaration ....................................................................................................... 13
Chapter 1 : Introduction ................................................................................................. 14
1.1 Introduction .............................................................................................................. 14
1.2 Motivation for the Study .......................................................................................... 16
1.3 Chapter Framework .................................................................................................. 19
Chapter 2 : Literature Review ........................................................................................ 21
2.1. Introduction ............................................................................................................. 21
2.2. Theories and Hypotheseson FDI ............................................................................. 23
2.2.1 Typology of FDI ................................................................................................ 23
2.2.2 Differential Rate of Return Hypothesis ............................................................. 24
2.2.3 Portfolio Hypothesis ......................................................................................... 25
2.2.4 Output and Market Size Hypotheses ................................................................. 26
2.2.5 International Division of Labour ...................................................................... 26
2.2.6 Dunning’s Eclectic Paradigm ........................................................................... 27
2.2.7 Investment Development Path ........................................................................... 29
2.2.8 Concluding Remarks ......................................................................................... 31
2.3. Determinants of FDI ............................................................................................... 34
2.3.1. Introduction ...................................................................................................... 34
2.3.2 Size and Growth of Host Country’s Economy .................................................. 34
2.3.3. Trade Openness ................................................................................................ 36
2.3.4. Political Instability ........................................................................................... 37
2.3.5. Human Capital ................................................................................................. 38
2.3.6. Institutional Environment................................................................................. 40
2.3.7. Domestic Stock Market Development .............................................................. 43
2.3.8. Exchange Rate .................................................................................................. 45
6
2.3.9. Infrastructure ................................................................................................... 46
2.3.10. Regional Integration ...................................................................................... 47
2.3.11. Labour Costs .................................................................................................. 51
2.4. Impact of FDI on the Host Country ........................................................................ 52
2.4.1 Introduction ....................................................................................................... 52
2.4.2 FDI and Productivity ........................................................................................ 55
2.4.3 Other Potential Effects of FDI .......................................................................... 58
2.4.4 Concluding remarks .......................................................................................... 67
Chapter 3 : Geographic, Demographic, Policy and Economic Environment in Sri
Lanka ................................................................................................................................. 69
3.1. Introduction ............................................................................................................. 69
3.2 Geography, Resource Endowments and Demography............................................. 70
3.3 Post-Colonial Context and Policy Environment ...................................................... 71
3.4 FDI Policy Framework ............................................................................................. 74
3.5 Economic and Financial Indicators .......................................................................... 76
3.5.1 Economic growth and composition of GDP...................................................... 76
3.5.2 Savings and Investments ................................................................................... 78
3.5.3 Human Development Indicators ....................................................................... 80
3.5.4 External Trade .................................................................................................. 82
3.5.5 Fiscal and Monetary sectors ............................................................................. 86
3.6 Civil War and Internal Conflicts .............................................................................. 88
3.7 Concluding Remarks ................................................................................................ 91
Chapter 4 : FDI in Sri Lanka .......................................................................................... 92
4.1. Introduction ............................................................................................................. 92
4.2 FDI in Sri Lanka: an Overview ................................................................................ 93
4.3 Dimensions of FDI: Distribution by Sector and Origin ........................................... 95
4.4 FDI Potential in Sri Lanka ..................................................................................... 101
4.4.1 Resource-seeking FDI ..................................................................................... 101
4.4.2 Market-seeking FDI ........................................................................................ 102
4.4.3 Efficiency-seeking FDI .................................................................................... 103
4.5. Factors that can Influence FDI in Sri Lanka: a Preliminary Overview................. 105
4.5.1. Introduction .................................................................................................... 105
4.5.2 Size and growth of the economy ...................................................................... 105
7
4.5.3. Trade regimes and degree of trade openness ................................................ 105
4.5.4. Political instability ......................................................................................... 106
4.5.5. Human capital ................................................................................................ 108
4.5.6. Institutional Environment............................................................................... 109
4.5.7. Domestic stock market development .............................................................. 113
4.5.8. Exchange rate................................................................................................. 114
4.5.9. Infrastructure ................................................................................................. 118
4.5.10. Labour cost and productivity ....................................................................... 123
4.5.11. Regional context and the degree of regional integration............................. 124
4.6. Concluding Remarks ............................................................................................. 130
Chapter 5 : Civil war and FDI –A time series and a panel data study ..................... 132
5.1 Introduction ............................................................................................................ 132
5.2 Effect of War on FDI ............................................................................................. 133
5.3. Impact of Civil War on FDI by Sector .................................................................. 138
5.4 Time Series Study Based on Aggregate FDI Inflows and FDI in Manufacturing and
Services ........................................................................................................................ 140
5.4.1 Methodology .................................................................................................... 140
5.4.2 Results and Discussions .................................................................................. 148
5.5. Panel Study Based on Annual Industry-wise Manufacturing FDI Inflows........... 155
5.5.1 Methodology .................................................................................................... 155
5.5.2 Results of the baseline model .......................................................................... 161
5.5.3 Effect of Civil War on FDI by Industry ........................................................... 161
5.5.4 Effect of Civil War on FDI in Export-Oriented/Local-Market-Oriented
Manufacturing Industries ......................................................................................... 163
5.6 Concluding Remarks .............................................................................................. 166
Chapter 6 : Determinants of FDI – A Country Level Study ...................................... 169
6.1 Introduction ............................................................................................................ 169
6.2 Human Capital and FDI ......................................................................................... 170
6.3 Stock Market Valuations and FDI inflows............................................................. 173
6.3.1. Stock market valuations and FDI inflows: Sri Lanka’s experience ............... 174
6.4 Methodology and Results ....................................................................................... 178
6.5 Analysis and Discussion of Results ....................................................................... 190
6.5.1 Human capital as a determinant of FDI ......................................................... 190
8
6.5.2. Stock market valuations as a determinant of FDI .......................................... 198
6.5.3. Other FDI determinants ................................................................................. 199
6.6 Concluding Remarks .............................................................................................. 202
Chapter 7 : FDI Spillover Effects: Evidence from Sri Lanka .................................... 203
7.1. Introduction ........................................................................................................... 203
7.2. FDI and Firm Productivity .................................................................................... 203
7.3. Data, Descriptive Statistics and Preliminary Investigation at Own Firm Effects of
Foreign Firms ............................................................................................................... 209
7.4. Direct and Indirect Effects of FDI on Firm Level Productivity: a Cross Sectional
Econometric Study ....................................................................................................... 215
7.5. Concluding Remarks ............................................................................................. 229
Chapter 8 : Conclusion .................................................................................................. 233
8.1. Research Findings ................................................................................................. 234
8.2. Key Contribution ................................................................................................... 236
8.3. Policy Implications ............................................................................................... 239
8.4. Research Limitations and Future Research ........................................................... 244
List of Abbreviations ..................................................................................................... 247
References ....................................................................................................................... 249

9
List of Tables
Table 3-1: Economic growth rates under distinctive periods ............................................ 76
Table 3-2: Composition of economic sectors (as a share of GDP) .................................... 77
Table 3-3: Growth in GDP by economic sector ................................................................. 77
Table 3-4: Key economic indicators of selected Asian countries ...................................... 79
Table 3-5: Human Development Indicators in selected Asian countries ........................... 81
Table 3-6: Composition of Exports .................................................................................... 83
Table 3-7: Composition of Imports .................................................................................... 85
Table 3-8: Annual Inflation, annual % increase in consumer prices index ....................... 87
Table 4-1: Privatisation programme and FDI .................................................................... 94
Table 4-2: Comparative FDI performance of Sri Lanka, 2010 .......................................... 94
Table 4-3: Realised FDI in Sri Lanka: Sectoral distribution ............................................. 97
Table 4-4: Sector-wise FDI inflows to Sri Lanka .............................................................. 98
Table 4-5: Home country distribution of FDI in Sri Lanka, cumulative, 1979-2000
(percentages) ...................................................................................................................... 99
Table 4-6: FDI inflows by country (% of total), 2005-2010 ............................................ 100
Table 4-7: Human capital indicators of selected countries in Asia .................................. 109
Table 4-8: Control for corruption for selected countries for the year 2010 ..................... 110
Table 4-9: Rule of law for selected countries for the year 2010 ...................................... 111
Table 4-10: Regulatory quality for selected countries for the year 2010 ......................... 111
Table 4-11: Real exchange rate appreciation (against US$) in selected countries in Asia
during 1990-2010 ............................................................................................................. 116
Table 4-12: Average annual growth rates (%) in exports and imports during 2000-2010 in
south Asian countries ....................................................................................................... 117
Table 4-13: Comparison of transport Infrastructure in selected countries in Asia .......... 119
Table 4-14: Power, telecommunication and information infrastructure .......................... 120
Table 4-15: Score for ―Compensation costs‖ in the Global Services Location Index by AT
Kearney ............................................................................................................................ 123
Table 5-1: Description of variables used in the Time series Study for Sri Lanka ........... 142
Table 5-2: Descriptive statistics for variables used in time series study.......................... 143
Table 5-3: Results of the Unit root tests (Augmented Dickey-Fuller tests) ..................... 144
Table 5-4: Results of the Johansen co-integration test..................................................... 146
Table 5-5: Results of the augmented Dickey-Fuller tests for unit root in the residuals ... 147
10
Table 5-6: Results of the time series estimations ............................................................. 150
Table 5-7: Sector classification ........................................................................................ 155
Table 5-8: Description of variables used in the study ...................................................... 156
Table 5-9: Descriptive statistics for variables used in the study ...................................... 157
Table 5-10: Results of the unit-root tests ......................................................................... 158
Table 5-11: Test results .................................................................................................... 159
Table 5-12: Results of panel data estimations.................................................................. 160
Table 5-13: Results of panel data estimations with dummy variables for each industry . 162
Table 5-14: Marginal effects of WAR on FDI in each manufacturing sector ................. 163
Table 5-15: Results of the specification with interaction term between WAR and Export
Intensity ............................................................................................................................ 165
Table 6-1: Net foreign inflows to the stock exchange, FDI inflows and stock market
valuations ......................................................................................................................... 175
Table 6-2: Selected countries for the cross country study ............................................... 178
Table 6-3: Description of variables used in the panel study ............................................ 180
Table 6-4: Results of the Fisher-type unit-root tests ........................................................ 181
Table 6-5: Results of Pedroni co-integration test ............................................................. 182
Table 6-6: Estimated results of specification 6.1 ............................................................. 184
Table 6-7: Estimated results of specification 6.2 ............................................................. 187
Table 6-8: Degree of development of stock markets in selected countries ...................... 188
Table 6-9: Estimated results of specification 6.3 ............................................................. 189
Table 6-10: Education expenditure as a share of national income and government
expenditures for Sri Lanka and selected other countries. ................................................ 191
Table 6-11: language of instruction and medium of study in primary and secondary
education in Sri Lanka ..................................................................................................... 196
Table 6-12: Institutional factors for South Asia, East Asia and OECD ........................... 200
Table 7-1: Local and foreign firms‘ share of activity in each sector ............................... 210
Table 7-2: Descriptive statistics by foreign and domestic ownership.............................. 211
Table 7-3: Differences between foreign owned firms and domestic firms ...................... 214
Table 7-4: Description of variables used in the study ...................................................... 222
Table 7-5: Descriptive statistics and correlation matrix .................................................. 223
Table 7-6: results of the probit estimation of the selection model ................................... 223
Table 7-7: Results of OLS estimations of the outcome model ........................................ 225
Table 7-8: Results of the quantile regressions ................................................................. 228
11
List of Figures
Figure 1-1: FDI inflows to Sri Lanka (from 1990 to 2011) ............................................... 15
Figure 3-1: Free Trade zones in Sri Lanka......................................................................... 75
Figure 3-2: Composition of value added by industry in 2011 ........................................... 78
Figure 3-3: Exports by destination in 2011 (as a percentage of total exports) .................. 84
Figure 3-4: Imports by destination in 2011 (as a percentage of total exports) .................. 85
Figure 3-5: Timeline of the conflicts in Sri Lanka ............................................................. 90
Figure 3-6: Number of total confirmed fatalities (killed) in conflict related incidents ...... 90
Figure 4-2: Composition of FDI (realised FDI) in industrial production – 2011 .............. 99
Figure 4-3: Variation of the political stability variable in Sri Lanka ............................... 107
Figure 4-4: Exchange rate (against US$) in South Asian countries during 1990-2010 ... 116
Figure 4-5: Exports and imports performance in Sri Lanka ............................................ 117
Figure 4-6: Fixed Access Telephone Growth 1990-2012 March..................................... 122
Figure 4-7: Mobile Telephones Growth 1992-2012 March ............................................. 122
Figure 4-8: Imports by commodities for the year 2009 ................................................... 127
Figure 5-1: FDI, exports and imports in manufacturing .................................................. 154
Figure 5-2: FDI, exports and imports in services ............................................................. 154
Figure 6-1: Net foreign inflows to the stock exchange, FDI inflows and stock market
valuations ......................................................................................................................... 175
Figure 6-2: Undergraduate admissions by Broad fields ................................................... 194
Figure 6-3: Education Gini Coefficient for selected countries, 1990 .............................. 198

12
Acknowledgement
I would like to acknowledge, with great gratitude, all those who supported me in bringing
this thesis to a successful conclusion.
I would like to express my sincere gratitude to Professor Yingqi Wei, my first supervisor,
for providing guidance and supervision, and for the inspiration and support extended
throughout the course of my study. Under her guidance, I not only acquired a range of
academic knowledge and skills, but also enjoyed this process of scholarship.
I am also grateful to Dr. Moshfique Uddin and Dr. Ignazio Cabras for their advice and
valuable feedback provided throughout my course of study. I would like to express my
gratitude to my fellow PhD students and all administrative staff of the York Management
School for all their help and encouragement extended during this period.
I owe a special gratitude to Mr. Upali Basnayake of Central Bank of Sri Lanka for helping
me to gather data for this research. My appreciation also goes to my Father for helping me
with data collection from the Board of Investment of Sri Lanka.
I am also indebted to my parents and my two sisters for their love and encouragement.
This journey would have been difficult if not for my wife‘s continuous support, patience
and sacrifices. I also want to thank my daughter, who was born in the month that I started
my PhD, for stimulating my mind by her enchantment.
Although not mentioned by their names there were many others who contributed to the
success of this thesis. I would like to sincerely appreciate all of them here for their
support and encouragement.

13
Author’s Declaration
I hereby declare that all the work presented in this thesis represents my own work except
where specified in the thesis by referencing.
14
Chapter 1 : Introduction
1.1 Introduction
When Sri Lanka gained political independence from Britain in 1948, the country had the
third highest per capita income in Asia, after Japan and Malaysia (Rajapatirana, 1988).
Post-independent Sri Lanka was widely considered as a country with excellent prospects
for economic development and was regarded as one of Asia‘s most promising new
nations (Snodgrass, 1998; Kelegama, 2000). Until 1965, Sri Lanka's economic
performance was still well above that of today's dynamic economies of East Asia,
including South Korea, China and Thailand (UNCTAD, 2004). However, since then the
country has lagged behind. It has encountered severe economic and political
complications and ended up with a reputation for weak economic growth indicators but
strong human development indicators (Snodgrass, 1998). One of the noticeable political
events is the nearly three-decades of civil war which ended in 2009. This has brought new
hope to the country‘s development.
Sri Lanka has great potential to become an international business hub. It possesses rich
natural resources and offers an abundant supply of highly trainable workers (Pradhan,
2001). As it will be shown in details in chapters 3 and 4, Sri Lanka‘s adult literacy rate of
92 per cent is the highest in South Asia, higher than Malaysia‘s and comparable to that in
Vietnam1
(UNCTAD, 2004). Sri Lanka‘s geographical location in the Indian Ocean,
intersecting with the major shipping routes connecting South Asia, Far East and the
Pacific with Europe and the Americas, provides the country a strategic advantage in terms
of facilitating international logistics. Furthermore, the rapid growth of neighbouring
countries including India and China could create ample opportunities for Sri Lanka. It is
worthy of note that International Finance Corporation has categorised Sri Lanka as a
frontier market - a country that is less developed but has immense untapped potential for
growth (Religare Enterprise Limited, 2011).
Despite these conditions, Sri Lanka has not performed well in attracting foreign direct
investment (FDI). It is generally recognised that FDI provides host developing countries
with much needed technologies and management skills in additional to financial capital,
therefore is an important source of economic growth and development (Moran, 2005;
1 Both Malaysia and Vietnam are popular destinations of foreign investors.
15
United Nations, 1992). For example, FDI has played a key role in the growth of most of
the East Asian economies (Hsiao & Hsiao, 2006; Zhang, 2001; Akyuz & Chang, 1998;
The World Bank, 1993). Not being able to attract FDI could deprive a country the much
needed skills and technologies, and decelerated the development of the country. As will
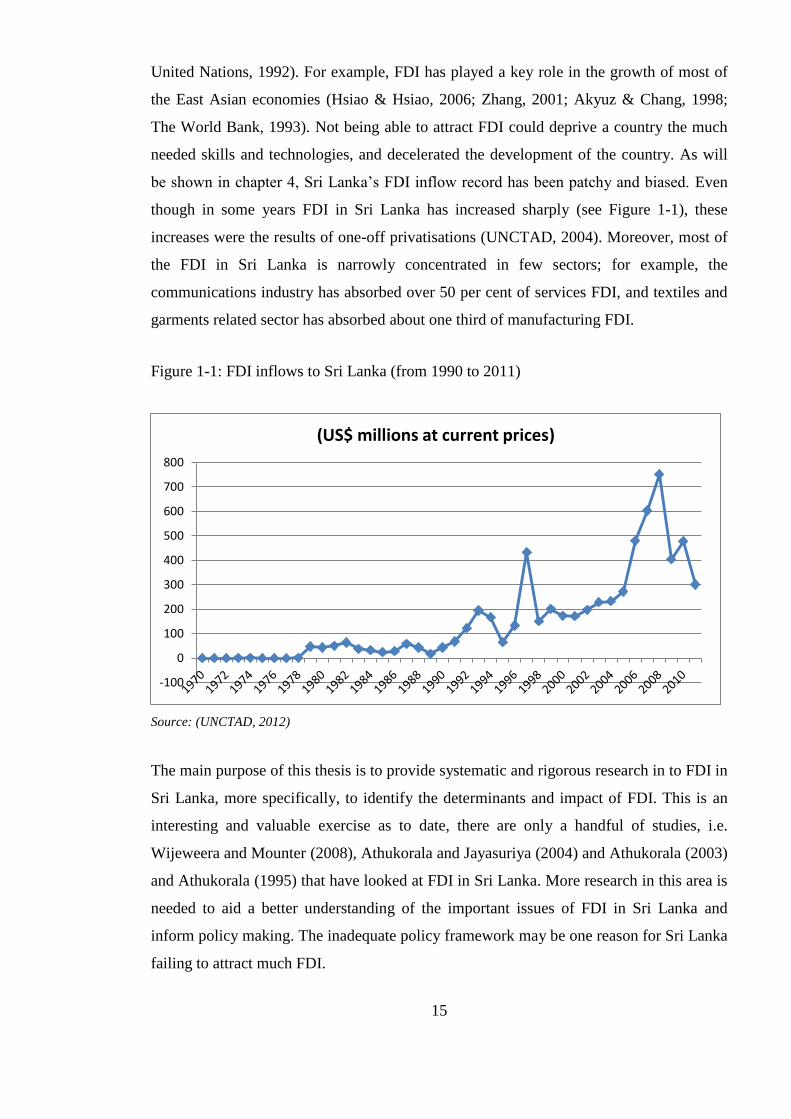
be shown in chapter 4, Sri Lanka‘s FDI inflow record has been patchy and biased. Even
though in some years FDI in Sri Lanka has increased sharply (see Figure 1-1), these
increases were the results of one-off privatisations (UNCTAD, 2004). Moreover, most of
the FDI in Sri Lanka is narrowly concentrated in few sectors; for example, the
communications industry has absorbed over 50 per cent of services FDI, and textiles and
garments related sector has absorbed about one third of manufacturing FDI.
Figure 1-1: FDI inflows to Sri Lanka (from 1990 to 2011)
Source: (UNCTAD, 2012)
The main purpose of this thesis is to provide systematic and rigorous research in to FDI in
Sri Lanka, more specifically, to identify the determinants and impact of FDI. This is an
interesting and valuable exercise as to date, there are only a handful of studies, i.e.
Wijeweera and Mounter (2008), Athukorala and Jayasuriya (2004) and Athukorala (2003)
and Athukorala (1995) that have looked at FDI in Sri Lanka. More research in this area is
needed to aid a better understanding of the important issues of FDI in Sri Lanka and
inform policy making. The inadequate policy framework may be one reason for Sri Lanka
failing to attract much FDI.
-100
0
100
200
300
400
500
600
700
800
(US$ millions at current prices)
16
1.2 Motivation for the Study
Sri Lanka possesses significant resource and location advantages and impressive human
capital indicators, which only few countries are fortunate to have. Despite having these,
Sri Lanka has performed poorly in terms of attracting FDI. This puzzle motivated me to
study FDI in the context of Sri Lanka. What are the determinants of FDI in Sri Lanka?
What is the impact of FDI in Sri Lanka?
Since independence, Sri Lanka has suffered from a long drawn out internecine conflict
between the two main ethnic communities in Sri Lanka, Tamils and the Singhalese. It has
long speculated that this is the main variable responsible for the country‘s weak
performance as FDI recipient. However, to date there is little systematic econometric
work being conducted on the link between war and FDI. Sri Lanka as a case study
provides an excellent opportunity to analyse the implications of war on FDI inflows
because Sri Lanka has undergone varying degrees of conflict intensity over time,
consisting of periods with war, without war, and with ceasefire arrangements. War is
likely to not only be a major impediment to FDI inflows, but also the conflagration could
have resulted in the divestment of their investment by a number of firms. For instance, as
per the list of current FDI projects in 2011 (Board of Investment Sri Lanka, 2011), it was
noted that out of the top 20 FDIs in 2002 (UNCTAD, 2004), seven have subsequently
been divested during the period from 2002 to 2010. This rate of divestments is very
alarming. It is said that war devastated countries bounce back to high levels of growth and
development rapidly, often referred in the literature as the Phoenix effect (Murdoch &
Sandler, 2002). This is supposed to have occurred in Germany soon after the Second
World War and in Vietnam in recent years. Is this likely to happen in Sri Lanka that has
recently emerged from a long drawn out internal conflict? If so, what role can FDI play in
the process? Answering these questions could not only help Sri Lanka in proper policy
making but also benefit the broad literature on the effects of war on FDI.
Another important FDI determinant is human capital. This is widely recognised in the
literature, however existing empirical evidence is inconclusive, particularly for
developing countries. Many studies have found little or no effect of human capital on FDI
flows (Hanson, 1996; Root & Ahmed, 1979; Schneider & Frey, 1985; Kinoshita &
Campos, 2004; Nunnenkamp & Spatz, 2002; Cheng & Kwan, 2000; Jinyoung & Jungsoo,
17
2012). Given this context, Sri Lanka with impressive human capital indicators but poor
performance in attracting FDI provides a valuable context to analyse the country specific
limitations that can affect the relationship between human capital and FDI. Sri Lanka is
widely known for its high rating in human capital index in terms of literacy rate and
schooling rates (The World Bank, 2011). Available evidence shows that the Sri Lanka‘s
Gini coefficient of education is low while its population enjoys relatively long years of
education (Thomas et al., 2000). However, Sri Lankan economic performance, and
performance in FDI inflows in particular, are far behind that of East Asian countries,
which have similar educational achievements (Ganegodage & Rambaldi, 2011;
UNCTAD, 2004). This raises questions about the quality of education in Sri Lanka. It can
be the case that whilst the country enjoys widespread literacy it does not possess a pocket
of skilled labour or a rich endowment of human capital. This fact could also have
implications for the utilisation of FDI in the development process. Is it likely that a low
GINI on education, though most admirable from a social and politico economic point of
view, might not be attractive to MNCs. They may seek highly educated skilled labour as
Sri Lanka is a largely service based economy. Whilst FDI may promote growth, it may
not promote development because low GINI on education without a segment of highly
skilled labour would not necessarily assist in promoting technology and know-how and
activities associated with technology. Therefore, it will be informative to understand how
this widespread literacy and secondary education levels affect the attractiveness of the
country to MNCs and the impact of FDI.
After the end of three decades of civil conflict in 2009, CSE went through a tremendous
growth. While the market was going through a growth of over 200% in the share price
index and almost fivefold increase in the market PER, net foreign inflows to the stock
market was negative and FDI inflows were unusually low. A possible explanation for
these strange observations in net foreign inflows (portfolio and FDI) is that the foreign
investors could be reluctant to invest and/or could be selling their stocks because the
stocks are overpriced. Although the theoretical considerations suspect an inverse
relationship between asset prices and FDI inflows, available empirical evidence does not
support this supposition. However, previous empirical evidence is based on US based FDI
data, which can limit the generalisability of these findings to other countries, in particular,
to developing countries. Given this context, Sri Lanka‘s recent experience in stock market
18
and FDI inflows provides a window of opportunity to analyse the relationship between
asset prices and FDI inflows.
A relatively small sized island economy such as Sri Lanka, however, is compelled to be
an export economy. The role of FDI in export economies has always been controversial;
the issue is whether FDI would relegate these small economies to the role of peripheries
supplying raw materials and plantation crops to the home countries with little
interlinkages with the domestic economy. This view, however, may be out-dated as most
small-island economies are diversifying to the extent possible and seeking FDI to aid such
diversification. Singapore, Hong Kong and to a lesser extent Mauritius provide examples
of small economies that have successfully utilized FDI in the development process.
Therefore, it is necessary to understand what benefits FDI can bring in to Sri Lanka.
Extant literature on the impact of FDI remains inconclusive, particularly for the case of
FDI spillovers and it is widely believed that different methodologies and different country
contexts contribute to these inconsistencies in empirical findings. Due to these reasons, it
would be informative to investigate the impact of FDI in the context of Sri Lanka.
It is widely recognised that FDI determinants relevant for developing countries are
considerably different from that relevant to developed countries. Also, factors that
encourage and discourage FDI can vary with different country settings, and therefore,
country specific studies are warranted for each country to identify its own FDI
determinants. Furthermore, Sri Lanka differs considerably from the norm by having high
development indicators, particularly in human development, while having low growth
indicators. This fact, along with other distinguishing features discussed in this chapter,
has given Sri Lanka a character of its own, which would further merit a separate study.
19
1.3 Chapter Framework
This thesis comprises eight chapters. The first chapter introduces the reader to the theme
and context of the research study and gives an overview of the main research topic.
Chapter starts with an initial introduction to the research topic, then details what
motivated the writer to embark on this research study and concludes with providing a
concise chapter framework for the thesis.
Chapter two presents the literature review relevant to this study. It starts with a review of
theories and hypotheses in FDI and proceeds with literature review on determinants of
FDI. Chapter then continues with a literature review on impact of FDI, while focusing on
the impact of FDI on firm level productivity.
Chapter three provides a context analysis of the economy and the internal environment of
Sri Lanka while giving special attention to recognise salient features of Sri Lanka and its
internal environment that are relevant for FDI.
Chapter four provide a context analysis of FDI and related aspects of FDI in the context
of Sri Lanka. Chapter starts with an overview of current status of FDI and then explore
the dimensions of FDI in terms of distribution by sector and origin. Thereafter,
opportunities that Sri Lanka can offer to potential foreign investors are investigated.
Chapter ends with a preliminary overview of factors that can influence FDI flows to Sri
Lanka.
Chapter five presents two econometric studies conducted to determine the effect of the
civil war on FDI inflows to Sri Lanka, by employing time series and panel data
econometric analysis. These econometric studies investigate the degrees of impact of war
on FDI, as a whole, FDI in manufacturing and FDI in services, and manufacturing FDI by
market-orientation.
Chapter six presents an empirical study conducted to examine the determinants of FDI.
Study employs a panel study based on annual FDI inflows to a selected group of
countries, one of which is Sri Lanka. This chapter focus on the role of human capital and
stock market price level in the host country as determinants of FDI inflows.

20
Chapter seven presents an empirical study conducted to examine the impact of FDI on
firm level productivity in the context of Sri Lanka. This study examines the direct effects
(own firm effects of foreign owned firms) and spillover effects (effects of foreign owned
firms on other firms) of FDI on firm level labour productivity.
Final chapter provides a conclusion for this thesis by summarising key empirical findings
and highlighting key contributions of this research study. This chapter also emphasise
policy implications of the research findings and discuss the limitations of this study and
finally suggest potential research topics that could extend this study further.
21
Chapter 2 : Literature Review
2.1. Introduction
Foreign Direct Investment (FDI) is one of the main forms of international equity flows, in
addition to foreign portfolio investment (FPI). FDI can be defined as cross border
investment made by a company with the intention of exerting a considerable degree of
influence on the operations of the enterprise outside of the home country (Benito, 1997).
One important feature of FDI therefore is to exercise management control; while on the
contrary, investors of FPI gain equity but without management control (Dunning &
Lundan, 2008). FDI involves a transfer of package of resources including knowledge,
information, know-how and other intangible assets. On the other hand, FPI involves only
a transfer of finance capital. FDI therefore is considered more efficient and less volatile
relative to FPI (Mata & Portugal, 1999; Goldstein & Razin, 2006). For classification
purposes, foreign investments made by a firm with a stake of 10% or more in a foreign
firm are often considered as FDI (World Trade Organisation, 1996; The World Bank,
2011).
FDI is one of the three common alternatives for exploiting long term profit opportunities
in a foreign market. The other two are exporting and licensing. Exporting involves
producing goods at home and then shipping them to foreign markets. Licensing involves
granting a firm (the licensee) the right to produce and sell the firm‘s products in return for
a royalty fee (Hill, 2011). Compared to exporting and licensing entry modes, FDI is
considered more expensive2 and risky
3 (Hill, 2011).
Various FDI theories have been developed to differentiate FDI and FPI and answer the
question why firms favour FDI over the alternative entry mode of exporting and
licensing. Books by Caves (2007), Dunning and Lundan (2008) and Forsgren (2008) have
all provided comprehensive synthesis and evaluation of the existing theories on FDI and
its agent, multinational enterprises (MNEs). Literature on FDI in general and FDI in
developing countries in particular poses several issues of relevance to the analysis of FDI
in an economy such as Sri Lanka. It is not the intention of this thesis to cover all grounds.
2 Firm undertaking FDI must bear the costs of establishing or acquiring foreign ventures.
3 Firms undertaking FDI face additional risk because of problems associated with conducting business in
foreign territories.
22
The objective here is to focus on the review of theoretical and empirical studies related to
the empirical research in chapters 4-7. Section 2.2 presents a synopsis of mainstream
theories and hypotheses on FDI that are relevant to this thesis. To organise ideas, I first
provide the typology of FDI. This account helps place the ensuing discussion in context.
FDI is not a homogenous phenomenon. Different types of FDI are attracted by different
locational advantages of the host country (Mottaleb & Kalirajan, 2010; Athukorala,
2009), as a result, have different impact on the host country (Deborah, 2013). In chapter
4, I will investigate Sri Lanka‘s potential in attracting different types of FDI and in
chapter 5, I will examine the effects of civil war on different types of FDI. It is therefore
important to show in this literature review chapter the categorisation of FDI. This will be
followed by a description of a few main theoretical strands: Differential Rate of Return
Hypothesis, Portfolio Hypothesis, Output and Market Size Hypotheses, International
Division of Labour Theory, Eclectic Paradigm and Investment Development Path Theory.
These theories provide enlightening ideas for the study of the determinants and impact of
FDI in Sri Lanka. The first four theories largely focus on one or a few individual factors
of the host country, therefore, are complementary to each other. The Eclectic Paradigm,
then, offers an envelope of these theories. It is the most commonly adopted analytical
framework in the analysis of FDI issues. Before making concluding remarks, I will also
discuss the Investment Development Path theory which helps with the understanding of
the dynamic relationship between FDI and economic development of a country, a key
issue for understanding the developmental implications of FDI in Sri Lanka. After
establishing the context of typology and general theories, the following two sections focus
on the review of empirical studies. Section 2.3 provides a literature review on various
determinants of FDI and section 2.4 provides a literature review on various impact of
FDI.
23
2.2. Theories and Hypotheses on FDI
2.2.1 Typology of FDI
Behrman typology of FDI identifies four objectives of FDI: Resource- Seeking, Market-
Seeking, Efficiency-Seeking, and Strategic Asset-Seeking (Dunning & Lundan, 2008).
This typology is very useful for understanding the kinds of investments that MNCs
undertake.
The resource seekers invest abroad to acquire particular resources at a lower real cost than
they are in their home country. These resources could either be physical resources; human
resources; or tacit resources such as technological capabilities, management or marketing
expertise, and organisational skills (Dunning & Lundan, 2008).
Market seekers invest abroad to exploit or promote new markets or to sustain or protect
existing markets. Main drivers that encourage firms to engage in market-seeking
investments are market share and market growth of the target market (Dunning &
Lundan, 2008). Generally, market seekers invest in a particular location in the intention of
supplying goods or services to the host country or to adjacent countries/regions. Apart
from market share and market growth of the target market, Dunning & Lundan (2008)
identified four additional motivations for market seeking activities. First, if the main
suppliers or customers of a firm set up foreign facilities, then the firm might have to
follow them overseas. Second, firms might have to establish their operations close to
markets in order to adapt their products and services to local tastes or needs, to cultural
attitudes and to indigenous resources and capabilities. Third motivation for locating
operations close to markets is to minimise production and transaction costs; if products
are relatively costly to transport and can be produced economically in small quantities
then such products are more likely to be produced close to the market than products that
are otherwise. Firms tend to undertake market-seeking investments in order to bypass
transaction costs resulting from import restrictions such as, tariffs and import controls
imposed by host governments. Finally, MNCs might undertake market-seeking
investment to have a physical presence in the leading markets served by its competitors.
This type of strategic market seeking investment might be undertaken for both defensive
and aggressive reasons (Dunning & Lundan, 2008).
24
The motivation of efficiency seekers is to rationalize the structure of established resource-
based or market seeking FDI in order to achieve efficiencies through economies of scale
and scope and economies of risk diversification (Dunning & Lundan, 2008). Efficiency
seekers also attempt to gain access to more efficient labour or technology in order to
improve their efficiency (Blonigen, 2005).
Strategic asset seekers undertake FDI to acquire or link into valuable assets, such as,
physical assets, human competencies, and technological and organisational capabilities, in
order to sustain or advance their international competitiveness (Dunning & Lundan,
2008).
2.2.2 Differential Rate of Return Hypothesis
The differential rate of return hypothesis is one of the earliest attempts to explain
international capital flows, which is based on neoclassical theories of economics
(Agarwal, 1980). This hypothesis attempts to explain international flows of capital in
terms of the relative scarcity of capital in different countries and differences in rates of
return among these countries. It assumes that investors will try to maximise their profits
by investing where returns are highest, and therefore, capital would flow from countries
that have low rates of return to countries that have high rates of return, equalising these
rates of return. According to this hypothesis, FDI will occur as a result of MNCs trying to
maximise their returns by exploiting differentials in marginal productivities of capital
(MPK) in home and host countries; MNCs would arbitrage capital by using capital
obtained from its home country to invest in other host countries.
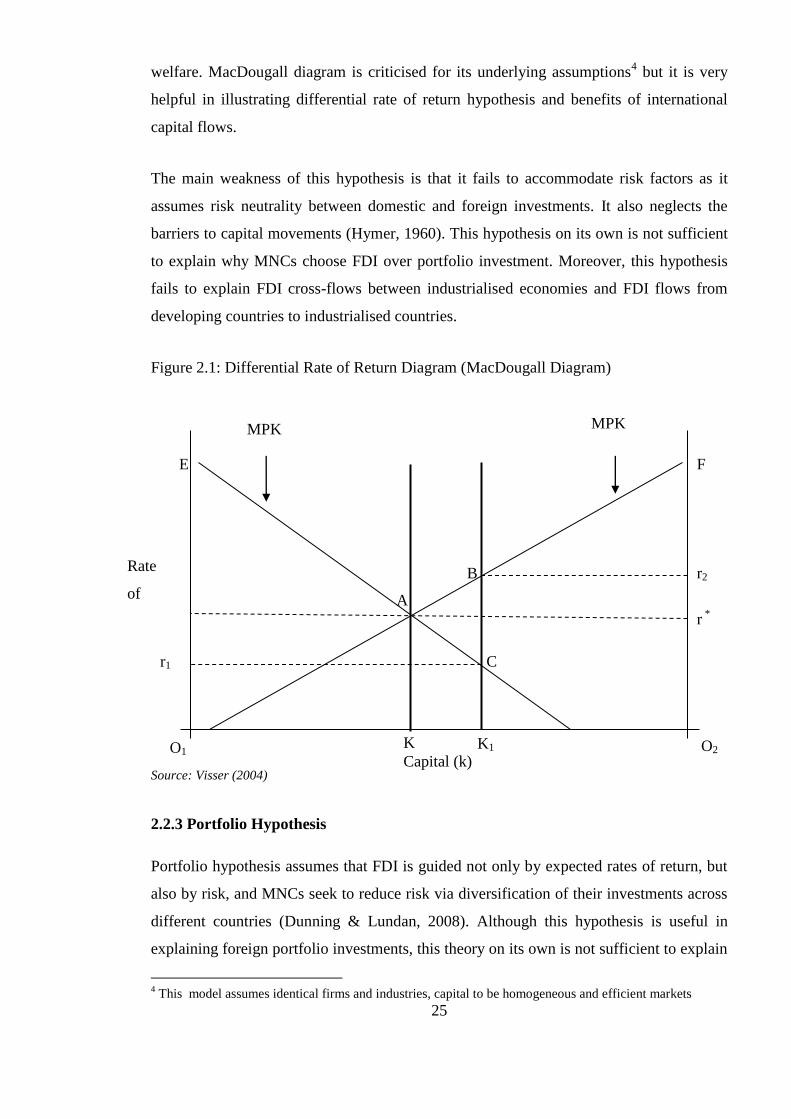
Differential rate of return hypothesis can be illustrated using the MacDougall diagram
(Figure 2.1). Capital stocks of first and second country are represented by O1K1 and O2K1
respectively. Prevailing interest rates, without any capital flows between the two
countries, are r1 for the first country and r2 for the second country. When capital flows are
allowed between the two countries, capital will move from the first country to the second
country (because r2 is higher than r1). Therefore, line k would shift to the left until each
country‘s respective marginal productivities of capital become equal; two rates of return
(r1 and r2) will equate (to r*). This leads to improved efficiency, higher output (increase in
total output represented by the area ABC), and therefore, greater global economic
25
welfare. MacDougall diagram is criticised for its underlying assumptions4 but it is very
helpful in illustrating differential rate of return hypothesis and benefits of international
capital flows.
The main weakness of this hypothesis is that it fails to accommodate risk factors as it
assumes risk neutrality between domestic and foreign investments. It also neglects the
barriers to capital movements (Hymer, 1960). This hypothesis on its own is not sufficient
to explain why MNCs choose FDI over portfolio investment. Moreover, this hypothesis
fails to explain FDI cross-flows between industrialised economies and FDI flows from
developing countries to industrialised countries.
Figure 2.1: Differential Rate of Return Diagram (MacDougall Diagram)
Source: Visser (2004)
2.2.3 Portfolio Hypothesis
Portfolio hypothesis assumes that FDI is guided not only by expected rates of return, but
also by risk, and MNCs seek to reduce risk via diversification of their investments across
different countries (Dunning & Lundan, 2008). Although this hypothesis is useful in
explaining foreign portfolio investments, this theory on its own is not sufficient to explain
4 This model assumes identical firms and industries, capital to be homogeneous and efficient markets
MPK
MPK
B
F
O2 K1 O1
E
C
K
r2
r *
r1
Capital (k)
Rate
of
return
A
26
why MNCs prefer FDI over portfolio investment. Hymer (1960) argues that capital
movements are not only induced by differences in return rates but also due to differences
in risk preferences of the investors. He also elaborates the roles of barriers to movement
of capital and imperfections in the capital markets on portfolio diversification, which
would affect capital flows among countries. These barriers and imperfections can arise
due to reasons such as government controls on capital flows, future exchange rate
uncertainties, information asymmetries and imperfect information, and taxation and
controls on profit repatriation.
2.2.4 Output and Market Size Hypotheses
Output hypothesis assumes that the volume of FDI of a firm in a host country depends on
that firm‘s sales (output) in that host country. Market size hypothesis assumes that the
volume of FDI in a host country depends on the market size of the host country. Both
hypotheses are similar except that the first hypothesis relates to micro level aspects of
output and the second hypothesis relates to the macro level aspects of output (Agarwal,
1980).
2.2.5 International Division of Labour
International division of labour plays a major role in the choice of location of FDI and
understanding its role in FDI is useful to understand MNCs locational choice of FDI.
International division of labour refers to the spatial division of various productive
activities around the globe according to the comparative advantage of labour.
Multinationals can capitalise on these comparative advantages by locating their activities
in different locations. Developments in transportation and communications technology
have enhanced MNCs ability of locating their activities in different locations (Frobel,
Heinrichs, & Kreye, 1980). International division of labour have enabled different
countries to specialise in different activities - both sectoral specialisation and functional
(different stages of production) specialisation - according to their respective endowments.
International division of labour is practically evident in international activities of MNCs.
MNCs need highly skilled and educated workers for research and development activities,
and therefore, MNCS locate such activities in countries that have a very high quality
human capital, for example, most of the research and development activities in the

27
electronic industries are located in countries such as Japan and USA. Capital-intensive
processes require semi-skilled labour, and therefore, such activities are located in
countries that has relatively skilled and moderately cost labour, for example,
manufacturing of standard electronic components in the electronic industry is located in
countries such as Taiwan, Malaysia, and South Korea. Labour intensive processes are
located in countries that have low skilled and low cost labour, and therefore MNCs prefer
countries such as China and Mexico for such activities (Hill, 2011).
2.2.6 Dunning’s Eclectic Paradigm
The OLI framework, which is also referred as eclectic theory was developed by John
Dunning as an approach to explain FDI. According to this framework, firms engage in
international operations to realize three types of advantages: ownership advantages,
location advantages, and internalisation advantages (Dunning & Lundan, 2008).
Ownership advantages
Ownership advantages include tangible and intangible sources of advantage which arises
from firm-specific capabilities, competencies, or resources that give a foreign firm a
competitive edge over domestic rivals. These advantages are largely derived from a
possession of or having access to unique assets such as patents, trademarks, brands, and
management skills (Dunning & Lundan, 2008; Brakman et al., 2007).
Early attempts to explain FDI using neoclassical theories were later criticised by several
authors and they introduced the concept of ownership advantage to explain FDI. Among
them, Hymer and Kindleberger were the forerunners of identifying limitations of
neoclassical theories in explaining FDI. They used market imperfections and
monopolistic advantages of firms to understand FDI flows. Hymer recognised that when a
firm moves into a foreign territory, it faces several disadvantages in competing with
indigenous firms in the host country. For example, foreign firms may have limited
knowledge of local business practices, limited access to information, and will have to deal
with physical and psychic distance. Therefore, foreign firms must possess ownership
advantages - such as innovatory, cost, financial or marketing advantages - which should
be sufficient to outweigh these disadvantages. Without such advantages, overseas firms
will not be able to successfully compete with domestic counterparts because of the
inconveniences that foreign firms face when doing business abroad such as
28
communication and transport problems, cultural and language barriers, limited knowledge
about the domestic market and local business acumen and other barriers including host
country government interventions (Hymer, 1960). FDI occur when it is difficult for firms
to sell or lease these ownership advantages due to market failures (Dunning & Lundan,
2008). Kindleberger (1969) also had a similar view and suggested that firms need firm
specific advantages that are powerful enough to overcome the disadvantages of locating
business overseas. Related arguments were put forwarded by Caves (1971). He observed
that horizontal FDI takes place in oligopoly industries where product differentiation
normally prevail, and indicate the importance of product differentiation as a monopolistic
advantage for undertaking horizontal FDI.
Location advantages
Location advantages originate from specific host country characteristics which provide an
incentive for MNCs to locate operations in a foreign country. These location advantages,
such as proximity to large markets, availability of skilled labour and natural resources,
low factor prices, quality infrastructure, and trade and non-trade barriers favouring FDI,
make foreign production profitable than exporting from home (Dunning & Lundan, 2008;
Brakman et al., 2007).
Internalisation advantages
Transaction cost theory highlights that, due to market imperfections, firms incur
transaction costs when undertaking arm‘s length transactions. When firms make
economic exchanges they face issues such as bounded rationality/information asymmetry,
asset specificity and opportunism, and therefore, incur transaction costs such as search
and negotiation costs, contracting costs and policing costs (Williamson, 1979;
Williamson, 1981; Govindan, 1997). In order to minimise these transaction costs, firms
may opt to internalise these transaction rather than carrying out market base transactions.
Along similar lines, firms can face significant transaction costs when undertaking
operations across borders. For example, foreign firms may face larger degree of bounded
rationality due to unfamiliarity with local cultural/business contexts. FDI can be
associated with higher degree of assets specificity due to MNCs‘ unique
assets/capabilities. Foreign firms can also be exposed to high risk of opportunism due to
difficulty in monitoring distant operations. Moreover, MNCs could face serious costs and

29
risks when contracting and transferring its ownership advantages in foreign territories.
Therefore, when MNCs engage in international business in order to exploit their firm
specific advantages and location advantages, the extent of transactions costs determines
whether MNCs externalise (by contracting or licensing) or internalise (by FDI) its
international operations (Teece, 1986).
Internalisation advantages make it more profitable for a firm to internalise its capital,
technology, and management skills to produce goods/services rather than externalizing
their use by engaging in portfolio investment, licensing, and management contracts
(Dunning & Lundan, 2008). These advantages arise due to market imperfections; market
imperfections make the cost of carrying out arm‘s length transactions excessive and
therefore firms are better off carrying out activities within the firm. Internalisation
advantages explain why firms prefer FDI over importing, exporting, and licensing or
franchising (Dunning & Lundan, 2008).
2.2.7 Investment Development Path
The concept of Investment development path (IDP) was first put forwarded by Dunning
(1981, 1986). Thereafter, this concept has been refined and extended further in several
instances (Dunning & Narula, 1996). This model attempts to explain the progression of a
country‘s direct investment position as the country advances through different stages of
economic development. IDP theory advocates for a strong association between a
country‘s direct investment position and its level of development. As per the IDP theory,
a country‘s direct investment position is systematically related to its level and structure of
economic development (United Nations, 2006).
According to Dunning, a country‘s direct investment position is determined by three sets
of factors; (1) extent of ownership specific advantages of the indigenous firms relative to
firms in other countries, (2) indigenous firms‘ tendency to internalise (rather than
externalise) these ownership specific advantages across borders, and (3) country‘s relative
location advantages against other countries (Dunning, 1981).
The IDP theory recognises five stages of development and each stage is classified
according to the country‘s propensity to import/export direct investment capital (Dunning
& Narula, 1996). During the first stage of the development (least developed), a country is
30
unlikely to attract much inward FDI (IFDI) because of poor location specific advantages,
mainly due to issues such as smaller domestic markets, poor infrastructure, weaker
institutions, and lack of human capital (Dunning, 1981). In this stage, outward FDI
(OFDI) will be very low due to lack of ownership specific advantages among indigenous
firms. In stage two, FDI inflows will start to increase due to growth in income levels and
improvements in location specific advantages. Later on when the domestic firms start to
gain their own ownership advantages, OFDI will start to increase, but will remain low.
Stage three is characterised by gradual decrease in the growth rate of IFDI and an increase
in the growth rate of OFDI, therefore, resulting in an increasing net outward FDI (NFDI)
position. As the domestic firms compete with foreign firms and gain their own ownership
advantages, ownership advantages of foreign firms will become less significant. Also, as
domestic wages surge, the country will start losing some of the initial location
advantages, particularly relevant to attracting labour intensive operations. These will in
turn result in an increase in NFDI position. Although the country will lose comparative
advantage in labour intensive operations, the country will gain different set of location
advantages, for example, enlarged domestic market and improved domestic innovatory
capacity, and these changes are likely to shift the motive of IFDI towards efficiency
seeking production. A country reaches stage four when OFDI stocks surpass (or equal)
the IFDI stock, while the growth rates of OFDI remains higher than growth rates of IFDI.
Most of the domestic firms are now capable of competing with foreign firms in both local
and international markets (United Nations, 2006). In the fifth stage, OFDI and IFDI flows
get equally significant, and NFDI position tend to fluctuate around zero.
IDP theory has recently been used in conjunction with Trade Development Path (TDP) to
explain how the structure of trade, industry and FDI of a country evolves with the
development of the country (Dunning, Kim, & Lin, 2001; Dunning, 2003). Countries in
stage 1 have low resources and capability base with underdeveloped domestic markets
and engage in trade in low and medium created asset-intensive sectors. Their exports are
mainly in resource and/or labour intensive sectors and imports are mainly in medium
technology intensive and consumer goods sectors. In this stage, countries will only be
able to attract low to modest FDI, mainly in labour or resource intensive sectors with very
limited OFDI. Intra-industry FDI will be negligible.
31
When they progress into stage two, with improving resource and capability base and
rising domestic markets, their exports, although still mainly in resource and/or labour
intensive sectors, will expand to medium technology sectors and services. Imports will
remain as stage one but with some participation in more advanced technology sectors. In
this stage, countries will witness increasing IFDI flows mainly into medium technology
and consumer goods sectors and into some services and OFDI flows kicking off, mainly
taking place in labour or resource intensive sectors. Intra-industry FDI will remain
insignificant.
When the countries move into stage three with further growth in domestic markets and
increasing significance of human capital and indigenous innovatory base, their resource
intensive exports will diminish in significance and exports will largely consist of medium
technology goods and services. Imports in this stage will mainly consist of higher income
consumer goods and technology intensive intermediate products. IFDI flows will largely
take place in more skill intensive goods and services and OFDI flows will increasingly
take place in medium technology and some asset-seeking investments and technology
intensive sectors. Intra-industry trade will now start to become significant while
increasing intra-industry FDI flows.
In the fourth stage, when countries approach mature industrialisation with relatively rich
and sophisticated markets, exports will largely consist of higher income and medium to
high technology goods and services. Composition of imports will now become mixed
with increasing import in more sophisticated consumer goods. IFDI flows will be
increasingly drawn to more technological intensive goods sectors and information
intensive service sectors. OFDI flows will grow at a faster rate, sometimes exceeding
IFDI flows. OFDI flows become increasingly concentrated in medium and high
technology goods and services while asset-seeking OFDI continuing to grow. Both intra-
industry trade and intra-industry FDI flows will become increasingly significant in this
stage.
2.2.8 Concluding Remarks
Theories of FDI attempt to answer a range of questions such as what kind of firms
undertake FDI, why such firms undertake FDI, what kind of investments do they
undertake, and how do they enter (entry mode), when do they undertake FDI (timing) and
32
where do they invest. Theories that attempt to answer the last two questions are of
particular relevance to the context of this study. First, it is important to understand
different types of FDI; different types of FDI are attracted by different locational
advantages of the host country, as a result, have different impact on the host country.
Behrman typology of FDI is very useful in this respect. These theories provide
enlightening ideas to understand the determinants of FDI in the context of Sri Lanka. To
this end, differential rate of return theory and portfolio hypothesis are useful for
understanding financial determinants and output & market hypothesis, concept of
international division of labour and Investment development path theory are useful for
understanding economic determinants of FDI. Dunning‘s Eclectic paradigm is a relatively
comprehensive model. Eclectic model answers several important questions related to FDI
concerning ‗who‘, ‗why‘, ‗where‘ and ‗how‘. Dunning‘s OLI paradigm provides a
comprehensive model to analyse FDI determinants by looking from the host country‘s
perspective as well as the foreign investor‘s perspective. Although this thesis primarily
looks at the FDI determinants from the host country‘s perspective, it is difficult to
disentangle MNCs motives/actions from the location determinants because a location‘s
attractiveness for a certain type of FDI will be, ultimately, determined by MNCs actions.
IDP theory advocates for a strong association between a country‘s direct investment
position and its level of development. Therefore, this theory is not only useful in
explaining the FDI flows but also useful for understanding the potential impact that
inward FDI could bring in to a host country.
It is important to understand that most of the conventional FDI theories were developed in
an era that is very different from the current context of international business. The
majority of the theories were developed in a time where bulk of the FDI was flowing
among the developed countries and developing countries started receiving considerable
amounts of FDI. Contrastingly, current context is characterised by increasing FDI flows
to developing countries as well as increasing FDI flows from developing countries. Also,
in the past, most of the MNCs were either from U.S.A or from a small number of
countries and in the current context there is a wider participation of countries both as
recipients and suppliers of FDI. Furthermore, in the past, most of the FDI was fresh FDI,
but in the current context, a significant proportion of FDI is substitute/replacement to
existing investments (FDI relocations and FDI diversions) rather than supplement to
existing ones. Therefore, the dynamics of FDI in the present context can be different from

33
that of the past. With this changing context, some of the conventional FDI theories may
have limitations in explaining present FDI flows. Furthermore, there is rising concerns
that conventional FDI theories are not capable of capturing all dynamics of the behaviour
of multinational firms. Another salient shortcoming of these theories is that they have
failed to incorporate the implications of risks and risk preferences of MNCs. Hymer
(1960) emphasised the importance of risks and risk preferences but subsequent
theories/models have not given adequate attention to the importance of risk and risk
preferences.
These theories are useful in providing a foundation for analysing FDI when used in the
right context while understanding their limitations. Each FDI theory and hypothesis
concentrates on a particular set of variables, and therefore, each theory/hypothesis has its
own limitations. For example, Although Hymer‘s theory is useful in explaining why firms
go abroad it fails to explain why a firm prefer one country over another. Therefore, it is
sensible to use the concepts of these theories and hypotheses holistically rather than
considering each theory in isolation. Thus, this study will take a holistic approach. Having
looked at theoretical literature that is relevant to this study, next two sections will looked
at the literature on FDI determinants and impact of FDI in an empirical point of view.
34
2.3. Determinants of FDI
2.3.1. Introduction
The literature on FDI suggests that the reasons for FDI are numerous. Many theories have
been put forwarded to explain the actions of multinationals and their locational
preferences. These theories have been tested by large number of empirical studies using
different country settings. These studies have progressed in two different streams. Some
researchers have concentrated on the micro-level factors by looking deeply into MNCs to
identify the reasons behind their actions. Others have concentrated on macro-level factors
to identify which factors attract MNCs to specific countries or regions. Factors such as
size and growth of host market, quality of human capital and wages, political stability,
institutional environment, degree of trade openness, quality of infrastructure, and
exchange rate valuations have repeatedly appear as determinants of FDI in previous
studies (Wheeler & Moody, 1992; Root & Ahmed, 1979; Quazi & Mahmud, 2004;
Chakrabarti, 2001). Proceeding section provides a review of these FDI determinants.
2.3.2 Size and Growth of Host Country’s Economy
Market size and market growth are major sources of location advantage, particularly for
market seeking FDI that target local or regional markets. Market seekers invest in a
particular location in the intention of supplying goods or services to the host country or to
adjacent countries/regions. Such FDI, which is also referred as horizontal FDI, replicates
production in the host country in order to serve the host country market, and therefore,
market size and market growth of the host country play a crucial role (Kinoshita &
Campos, 2004; Brada, Kutan, & Yigit, 2006). Host market can be a magnet to FDI for
several reasons. Foreign firms that want to cater to the local market by directly supplying
goods and services may want to locate operation close to the market in order to minimize
production and transaction costs; to bypass trade barriers; and to adapt their products and
services to local tastes or needs, cultural attitudes and indigenous resources and
capabilities (Dunning & Lundan 2008). Also, firms may have to follow its suppliers and
customers who set up facilities in the host country (Dunning & Lundan 2008). Market
size can also have a positive effect on export oriented FDI, to the extent that export
35
performance can benefit from economies of scale of a large host market5 (Kravis &
Lipsey, 1982).
Many empirical studies have found that market size (GDP, GNP) have a positive effect on
inward FDI (Nonnemberg & Mendonça, 2004; Root & Ahmed, 1979; Schneider & Frey,
1985; Wheeler & Mody, 1992; Billington, 1999; Nigh, 1985; Suliman & Mollick, 2009).
As per Chakrabarti (2001)‘s synopsis, almost all studies have found a consistent positive
effect of market size on FDI inflows.
The prospect of growth has a positive impact on FDI inflows and countries with high and
sustained growth rates receive more FDI flows than volatile or low growth economies
(Hoang, 2006). Past rate of economic growth is considered as a predictor of future market
size (The World Bank, 1998). Also, it has been found that the recent growth rates of a
host country are much more significant for FDI inflows than the growth rates for past
periods (The World Bank, 1998). Economic growth can be a powerful stimulant for FDI
inflows, and at the same time, an increase in foreign investment could also stimulate
economic growth (Nonnemberg & Mendonça, 2004; Agrawal, 2000). Therefore, the
direction of causality, whether FDI causes growth in GDP or growth in GDP creates more
FDI, is a much debated issue, and may depend on various factors such as factor
endowment, geographical location, level of infrastructure, quality of human capital,
market size and trade regime of the country (Faeth, 2005).
Majority of empirical studies have found that market growth rate (GDP growth, GNP
growth) have a positive effect on inward FDI (Schneider & Frey, 1985; Billington, 1999;
Suliman & Mollick, 2009; Noorbakhsh, Paloni, & Youssef, 1999) while handful of
studies have found the growth rate to be insignificant as a FDI determinant (Nigh, 1985).
Empirical studies have produced mix results on the direction of causality, equally
supporting both premises, and therefore, supports the existence of the endogeneity
problem.
Using time series data from 1959 to 2002 and employing an econometric framework of
co-integration and error correction mechanism, Athukorala (2003) examined the two-way
5 Large host country market can contribute to economies of scale which can be conductive to export
production. Kravis & Lipsey (1982) show that U.S. majority owned affiliates tend to export from countries
with large internal markets.
36
relationship between FDI and GDP in the context of Sri Lanka. His econometric results
indicate that GDP growth rate and FDI is positively related. He shows that GDP growth
rate influence FDI directly but the direct influence of FDI inflows on GDP growth is
weak. Using Engle-Granger method to see the direction of causality, he shows that the
direction of causation is from GDP growth to FDI but not from FDI to GDP growth.
2.3.3. Trade Openness
Countries can increase their trade openness through liberalising their trade policies
through reducing tariff and other barriers to trade. Trade openness, the degree to which a
host country is open to trade, can have implications on FDI inflows, mainly in two
opposing directions. High trade barriers can create significant transaction costs to firms
exporting to host country. Therefore, on one hand, with low degree of trade openness,
more horizontal FDI (import substituting) can be expected due to MNCs trying to avoid
trade barriers. On the other hand, high degree of trade barriers can increase transaction
costs to multinationals engaged in vertical FDI (Busse & Hefeker, 2007). Therefore,
lower trade barriers can augment more vertical FDI or export oriented FDI, especially if
such FDI is associated with high proportion of imports of intermediate and capital goods
(Walsh & Yu, 2010). In the former case, FDI is generated as a substitute for trade, and
therefore, would imply a negative correlation between trade and FDI. In the latter case,
FDI is complementary with trade, and therefore, would imply a positive correlation
between trade and FDI. Trade restrictions are likely to be linked with other forms of
policy imperfections such as exchange rate controls and restrictions on foreign
investments, particularly in developing countries. These policy restrictions can also
discourage FDI inflows (Busse & Hefeker, 2007).
Import substituting FDI will be limited by the size of the host-country
(Balasubramanyam, Salisu, & Sapsford, 1996), and therefore, for countries with smaller
internal markets, potential of generating FDI would be larger with pursuing Export
Promotion (EP) induced FDI than pursuing Import Substituting (IS) induced FDI.
Many studies on FDI determinants use trade openness as an explanatory variable, usually
represented by the trade intensity, i.e. total trade as a proportion of GDP. Majority of
these empirical studies have found a positive relationship between trade openness and
FDI, see, for example (Erdal & Tatoglu, 2002; Suliman & Mollick, 2009; Noorbakhsh,
37
Paloni, & Youssef, 1999; Abbott, Cushman, & De Vita, 2012; Asiedu, 2002), while a
handful of studies have found a negative (Wheeler & Mody, 1992) or insignificant
(Nunnenkamp & Spatz, 2002) relationship between them.
2.3.4. Political Instability
FDI is subject to host country risk factors, which can be classified into economic and
political risk factors (Moosa, 2002). Political risk stems from various political factors in
the host country that can affect entry and performance of foreign owned firms. These
factors can include various forms of violence such as wars, riots, disorders, and labour
unrests; stability of the host government; attitude of the host government; and changes in
the rules and regulations governing FDI (Moosa, 2002). There are different types of
classifications of political risk factors. For example, political risk insurance industry
categorizes political risk into three broad categories: (1) war and political violence
(includes civil war, uprisings and terrorist attacks), (2) expropriation and breach of
contracts, and (3) transfer risk encompassing government restrictions on capital flows
(Jensen, 2008). Political instability, i.e. high degree of political risks, of a host country is
considered as one of the key concerns of potential foreign investors (Walsh & Yu, 2010),
and therefore, is likely to discourage inflows of FDI.
Although it is widely believed that political instability of country will impede FDI
inflows, not many empirical studies have looked at the relationship between political
instability and incoming FDI. Moreover, relatively few studies have empirically
investigated the relationship between war/conflict and FDI (Czinkota, Knight, Liesch, &
Steen, 2010). These empirical studies, both surveys and cross-country studies, have
produced mix results (Walsh & Yu, 2010; Agarwal, 1980).
Several researchers have empirically established the negative relationship between
political instability and FDI inflows (Root & Ahmed, 1979; Schneider & Frey, 1985;
Suliman & Mollick, 2009; Brada, Kutan, & Yigit, 2006). Nevertheless, some studies
have found that there is little or no relationship between political instability and FDI
inflows (The World Bank, 1998; Wheeler & Mody, 1992; Bennett & Green, 1972;
Kobrin, 1976; Asiedu, 2002). Bennett & Green (1972) investigating the effect of
political instability on direct investments by US firms in marketing activities in forty-
six countries, found that political instability do not discourage such FDI flows. They
38
use a 7-point scale, which was constructed by Feierabend & Feierabend (1966) by
assigning weights (from 0 to 6) to 30 types of politically destabilizing events. Kobrin
(1976), investigating the effect of economic, social, and political aspects of the host
country environment on investments of 187 major US manufacturing firms, found a
strong relationship between market related variables and FDI but failed to find any
relationship between FDI and variables based on political event data.
2.3.5. Human Capital
Human capital is widely considered as a key determinant of FDI inflows whilst both FDI
and human capital are recognised as key drivers of economic growth (Noorbakhsh, Paloni
& Youseff, 2001; United Nations, 1992; Abbas, 2001). However, high quality human
capital and FDI are complementary, in the sense, that high quality human capital tend to
attract FDI, and on the other hand, presence of MNCs is likely to improve the quality of
human capital in the host country since MNCs provide education and training to local
staff (Miyamoto, 2003).
Although the importance of human capital in attracting FDI is widely recognised in the
literature, existing empirical evidence is not consistent, particularly for developing
countries. Based on different sets of developing countries, some have shown that there is
a significant positive relationship between human capital and FDI inflows (Noorbakhsh,
Paloni & Youseff, 2001; Nonnemberg & Mendonca, 2004; Suliman & Mollick, 2009;
Suliman & Mollick, 2009), while others have found little or no relationship between these
two (Hanson, 1996; Root & Ahmed, 1979; Schneider & Frey, 1985; Kinoshita &
Campos, 2004; Nunnenkamp & Spatz, 2002; Cheng & Kwan, 2000).
There can be numerous reasons for these incongruities. It is important to understand
whether these incongruities arise due to a deficiency in the methodology of the previous
research studies rather than due to lack of causality. Miyamoto (2003) observes that most
of the studies that have found little or no relationship between FDI and human capital
have been conducted for the periods prior to 1980. He argues that prior to 1980 most of
the FDI in the developing countries were concentrated in market and resource seeking
and/or lower-end manufacturing types, and therefore, cheap labour and/or abundant
natural resources were more important than high level of human capital, and for this
reason studies conducted prior to 1980 have produced weak relationship between FDI and
39
human capital. Despite the fact that human capital can be less crucial for natural resources
and/or market-seeking FDI than efficiency seeking and/or higher-end manufacturing type
FDI, it should be comprehended that human capital can still be important for any type of
FDI because increased human capital contributes to civil liberties, political stability, good
health and reduced crime/corruption, all of which that positively influence the investment
climate of a country (Miyamoto, 2003).
Another possible reason for the deviations in the research outputs is that the proxies that
have been selected by researchers may not correctly relate to the quality of human capital.
The difficulty in finding suitable explanatory variables as an indicator of human capital
and also the difficulty in gathering consistent cross-country variables are frequently
recognised in the literature (Miyamoto, 2003). Most widely used measures are adult
literacy rate and secondary/primary school enrolment ratios. All these variables have
serious limitations when used as a proxy for the level of human capital. Adult literacy rate
is widely used because it‘s availability in most countries and it can be easily compared
across different countries and regions. However, it is a very crude measure. Literacy rate
does not encompass the quality of the education of a country, does not reflect any
educational attainments on top of the acquisition of basic literacy and fails to capture
many intricate features implied in worker skills and productivity (Miyamoto, 2003,
WoBmaan, 2003). Secondary and primary school enrolment ratios may not relate to the
quality of education, and therefore, these quantitative measures neglect the quality of
human capital (Bhaumik & Dimova, 2012). Also, current school enrolment rate, which is
a flow variable6, may not necessarily represent the current stock of human capital
employed in a country (WoBmaan, 2003). On the other hand, mix results may have
resulted because different researchers have employed different proxies to gauge the level
of human capital of their selected countries. Furthermore, different educational
parameters can have different impact on FDI inflows as well as on other macroeconomic
variables that can affect FDI inflows. For example, in his study examining the effects of
educational performance on the economic growth of Sri Lanka and Pakistan during the
period 1970–1994, Abbas (2001) has found that education at the primary level has a
negative relationship, secondary level has a significant positive relationship and higher
6 Moreover, enrolment rate is a poor proxy for current flows itself since enrolment rates represent entry of
students into education system rather than entry of graduates into the labour force.
40
education has a positive but insignificant relationship to the economic growth of Sri
Lanka and Pakistan.
2.3.6. Institutional Environment
North (1991) defined institutions as the humanly devised formal rules (eg, constitutions,
laws, regulations, and property rights) and informal constraints (eg, norms and values,
conventions/customs and codes of conduct) that structure political, economic and social
interactions. Institutional environment is considered as a crucial factor determining FDI
inflows, particularly important for developing countries than developed-countries (The
World Bank, 1998). Institutional environment can not only create numerous pressures on
firms (Francis, Zheng, & Mukherji, 2009), but also shape the risks and uncertainties faced
by the firms. Countries associated with good governance usually perform well in terms of
economic growth and also in attracting FDI, and countries with weak institutional
environment have generally performed poor in terms of both economic growth and
attracting FDI.
MNCs might prefer countries with better institutional environment due to several reasons.
Poor institutions that enable corruption, bureaucratic hurdles and red tape are likely to
reduce the efficiencies of the business operations and increase the cost of business
operations, and thereby, reduce multination‘s profits (Walsh & Yu, 2010). MNCs will
have to set aside large resources for unproductive rent seeking activities in highly
corrupted countries, for example, paying bribes to government officials to obtain permits,
licenses, loans, or other government services necessary to conduct business (Wei, 2000).
Strong institutional environments increase the predictability of the environment and also
give little room for state agents to behave in an unpredictable manner. Contrastingly,
weak institutional environments can increase the arbitrariness of state agents, thereby,
creating extra uncertainties to MNCs. Even when MNCs expend resources on politicians
to compete for the economic rents that are granted by the government, the payback from
these political connections are uncertain (Chen, Ding, & Kimand, 2010). The impact of
uncertainties created by arbitrariness of state agents on FDI inflows can be high, and
research has found that MNCs prefer joint ventures to minimise risk when ethical
uncertainties and arbitrariness are high (Demirbag, McGuinness, & Altay, 2010). There
are many aspects of institutional environment and detail investigation of all these aspects
are beyond the scope of this study. Therefore, my focus is on formal institutions that have
41
been repeatedly highlighted in the extant literature; following sections focus on how
corruption, rule of law, regulatory quality and democracy can influence FDI inflows.
Existing studies recognise corruption as a major obstruction for attracting FDI inflows
(Zhou, 2007). Since state and politicians can influence the entry and the economic
performance of firms through various means, such as, tax and subsidy policies, regulation
of entry and operations of firms, controls on products and pricing, equity ownership
restrictions, performance requirements, and nationalisation (Chen, Ding, & Kimand,
2010), MNCs entry and operations can become much difficult and risky with a corrupt
regime (Dhanaraj and Beamish, 2009). Also, when corruption is present, productive firms
could be discriminated because political connectedness becomes much more important
determinant of business success than business fundamentals such as productiveness
(Chen, Ding, & Kimand, 2010).
However, there is a point of view that corruption can benefit MNC operations in some
situations (Zhou, 2007). Some writers have shown a better side of corruption arguing that
corruption is the much needed grease for the squeaking wheel of a rigid administration
(Bardhan, 1997; Jensen, Li & Rahman, 2010). Also, corruption leads to market
imperfections, and therefore, in some cases corruption can provide incentives for MNCs
to internalise their operations. Moreover, in some cases, the corrupt governments might
favour MNCs over domestic firms in order to receive more private benefits through secret
arrangements with international firms. Furthermore, in some cases, corrupt MNCs might
use political connections to promote their unethical practices and private agendas in the
host countries.
MNCs can react to corruption with different strategies. They might avoid investing in
highly corrupt countries, and consequently, host country will lose potential FDI inflows.
Alternatively, they might partner with domestic firms in order to guard against corrupt
politicians (Jensen, Li & Rahman, 2010). Exceptionally, some MNCs might accept the
risk and venture into the country hoping that they could manage the politicians and the
corruption.
On the empirical side, many empirical studies have found a negative relationship between
corruption and FDI inflows (Busse & Hefeker, 2007; Zhou, 2007; Wei, 2000). Some
42
studies, for example, Egger & Winner (2005) and Adam & Filippaios (2007) have found
a positive relationship between corruption and FDI, thus they pose corruption as a
stimulus for FDI inflow.
Lack of transparency and imperfect regulatory and legal systems can increase the risks
and uncertainties of operating businesses. The more complex and less explicit the
regulatory requirements are, the more difficult it will be for a foreign firm to adjust to
these requirements (Demirbag, McGuinness, & Altay, 2010). MNCs might prefer a more
independent judiciary in order to receive fair treatment. Credibility of the host country
government is likely to be augmented with an independent judiciary. Poor enforcement of
contract and law can increase the costs and risks to foreign firms; contracting parties may
neglect contractual obligations towards foreign firms and, in extreme situations,
government may even expropriate assets of foreign firms either partially or completely
(Kinoshita & Campos, 2004). Therefore, MNCs may prefer to invest in countries where
political rights and civil liberties are protected7. Since democracy is likely to improve the
rule of law, property right protection and other aspects of institutional environment which
can have a favourable effect on attracting FDI, some researchers have suggested that
democratic regimes are better than autocratic regimes in terms of attracting FDI (Busse &
Hefeker, 2007; Demirbag, McGuinness, & Altay, 2010). The premise that democratic
regimes are better for attracting FDI has been contested by some researchers, and also the
fact that some countries, such as China and Singapore, which are not considered as
democratic, being highly successful in attracting large volumes of FDI have made this
premise highly controversial.
The greater the institutional distance between home and host countries, the greater the
level of complexity faced by the MNC (Demirbag, McGuinness, & Altay, 2010). MNCs
from countries associated with good governance might not know how to approach and
survive in a country that has a set of values and practices different from their home
countries‘. Moreover, MNCs may be accountable to their home country governments if
they or their joint venture partners undertake any unethical or corrupt practises in order to
survive in the host country (Demirbag, McGuinness, & Altay, 2010). Also, available
evidence shows that when there is a large degree of institutional distance between host
7 Interestingly, Adam & Filippaios (2007) show that while repression of political liberties can deter FDI,
slight repression of civil liberties may entice certain types of direct investments.
43
and home countries, MNCs prefer lower level of equity investments (Xu & Shenkar,
2002).
In his empirical studies, Wei has statistically proved that corruption has a significant
negative relationship with FDI inflows and ascertains that the significance of corruption
on FDI inflows is even higher than the significance of increases in tax rates on FDI
inflows (Wei, 2000; Wei, 1997). Busse & Hefeker (2007), exploring the linkages among
political risk, institutions, and FDI using a sample of 83 developing countries, find that
government stability, internal and external conflict, corruption, law and order, ethnic
tensions, democratic accountability of government, and quality of bureaucracy are highly
significant determinants of FDI inflows. Additionally, many studies have provided
evidence that there is a strong relationship between host country‘s institutional
environment and inward FDI (The World Bank, 1998). Contrastingly, Wheeler & Mody
(1992) found that corruption, bureaucracy and red tape, and quality of legal system are
insignificant as determinants for FDI inflows.
The difficulty in measuring institutional factors is widely recognised in the literature, and
probably for that reason, empirical studies have produced mix results (Walsh & Yu,
2010). Also, different studies have employed different types of institutional factors and
different types of scores/measures published by various organisations. However, countries
with strong institutional environments tend to have better scores in almost all of the
institutional variables and vice versa. This is because, institutional factors are
interconnected and dependent on each other, and therefore, weaknesses in one
institutional factor can lead into deterioration in other institutional variables: for example,
economic, political and social structures that are poorly differentiated and lack
independency can facilitate and propagate corruption.
2.3.7. Domestic Stock Market Development
There is considerable attention given to explore the link between local financial markets
and capital flows, however, the link between the local stock market and FDI has not been
adequately researched. Moreover, local stock market is generally associated with foreign
portfolio investment rather than with FDI. However, for several reasons, the domestic
stock market is likely to play an important role in determining FDI inflows. Foreign
investors may want to finance part of their investments through external capital and the
44
stock market plays an important role in providing avenues to find equity and credit in the
host country (Claessens, Klingebiel & Schmukler, 2001). Also, a much developed stock
market provides an exit route to FDI investors, and provides a relatively easy means of
finding a potential buyer. Therefore, potential FDI investors might be reluctant to make
large investments in countries with less developed stock markets.
Majority of FDI take place as acquisitions rather than Greenfield investments. Stock
markets provide a mechanism for foreign investors to acquire local businesses (Claessens,
Klingebiel & Schmukler, 2001), and therefore, the breadth of the stock market is likely to
be crucial for FDI. Some MNCs would want to test the ground before committing the full
amount of capital funds (Noorbakhsh, Paloni & Youssef, 1999), and therefore, would
prefer to acquire a small stake before totally committing to an investment. A well-
developed stock market can facilitate these requirements conveniently.
The above points suggest that FDI and stock market developments are complementary,
however, there are arguments favouring the opposite premise: the premise of FDI being a
substitute for stock market development. The main argument supporting this premise is
that FDI takes place to overcome the difficulties of investing through capital markets, and
therefore, the countries that are riskier, financially underdeveloped, and institutionally
weak are supposed to attract more FDI as a proportion of portfolio investment than
countries that are otherwise (Claessens, Klingebiel & Schmukler, 2001). However, high
political risks may encourage foreign investors to prefer assets with high liquidity, and
therefore, to prefer portfolio investment over direct investment (Liljeblom & Löflund,
2005). Also, investors‘ preference between FDI and FPI may vary according to their risk
apatite, capital availability and liquidity constraints, and therefore, FDI and FPI would act
as alternative investment opportunities (or substitutes).
FDI is made by a company with the intention of exerting a considerable degree of
influence on the operations of the enterprise (Benito, 1997). In contrast, investors of FPI
gain ownership without control, and therefore, mainly due to the agency problem between
managers and owners, FPI is considered less efficient and more volatile relative to FDI
(Mata & Portugal, 1999; Goldstein & Razin, 2006). However, high transparency in
developed economies makes portfolio investment in these countries more efficient than in
developing countries, and therefore, larger ratio of FDI to FPI inflows is expected for
45
developing countries relative to developed countries (Goldstein & Razin, 2006). Thus, the
extent to which FDI can be substituted by FPI is rather limited in the context of
developing countries.
Having looked at these contentions, it appears that complementary effect between stock
market development and FDI inflows is predominant over their substitute effect, and
therefore, stock market development is likely to be positively related to FDI inflows.
2.3.8. Exchange Rate
FDI inflows to a particular country can be influenced by its level of exchange rate,
expected changes in the level of the exchange rate, volatility of exchange rate, and the
exchange rate regime (Blonigen, 2005). Both theory and empirical studies mostly favour
a negative relationship between a country‘s exchange rate level and inward FDI;
depreciation of host country‘s currency can augment FDI inflows and appreciation of host
country‘s currency can deter FDI inflows (Abbott, Cushman, & De Vita, 2012). Froot &
Stein (1991) forwards the imperfect capital market theory to explain why a depreciation
of host country‘s currency can lead to increased investments by foreign firms. According
to this theory, a relative appreciation of the home country‘s currency will increase the
relative wealth of the home country firms. In an imperfect capital market, the internal cost
of capital is lower than the cost of capital of external borrowing, and therefore, as a result
of relative appreciation of the home country‘s currency, home country firms will be
provided with large low-cost funds to invest in the host country (Froot & Stein, 1991;
Blonigen, 2005). Froot & Stein (1991) have provided empirical support to their
theoretical reasoning with the use of US based data.
Blonigen (1997) explains the negative relationship between host country‘s exchange rate
level and inward FDI with the use of cheap asset (fire sale) hypothesis. Under cheap asset
hypothesis, it is assumed that FDI flows reflect undervalued host country assets (Baker,
Foley, & Wurgler, 2009). A relative depreciation of the host country‘s currency can make
host country assets cheap. However, the main opposition against this premise comes
from the fact that the relative depreciation of the host country‘s currency will also lower
the expected nominal returns of the purchased assets in terms of home currency
(Blonigen, 2005; Blonigen, 1997). Blonigen (1997) counters this opposition by proposing
that if the acquired assets are firm specific assets that are transferrable across many
46
markets (in addition to host country‘s market) to generate benefits in these markets, then
the effect of host country‘s currency depreciation on the nominal returns will be
proportionately less than its effect on the asset price. Blonigen (1997) have provided
empirical support to his theoretical reasoning using data on Japanese acquisitions in the
United States from 1975 to1992.
Currency depreciation in a particular country can also lower its relative production costs
in terms of foreign currency. When the local currency depreciates, the cost of production
inputs that are sourced locally such as labour, material, land, and machines will become
cheaper relative to the export price of the final product. Therefore, a currency
depreciation in a country could encourage export oriented FDI inflows to that country
(Cushman, 1985; Kohlhagen, 1977; Xing & Wan, 2006). Contrastingly, currency
appreciation in a particular country can increase production costs relative to export prices,
and therefore, could bring down the competitiveness of export-oriented industries.
Many studies (Bénassy-Quéré, Fontagné, & LahrÈche-Révil, 2001; Blonigen, 1997; Froot
& Stein, 1991) have empirically established the negative relationship between host
country‘s exchange rate level and inward FDI. However, the effect of exchange rate on
FDI is likely to depend on firm characteristics, type of FDI, motive of investing firms and
characteristics of the industry in which FDI takes place (Blonigen, 2005; Chen, Rau, &
Lin, 2006). Chen, Rau & Lin (2006) propose that depreciation of a host country‘s
currency tends to stimulate cost-oriented FDI and to deter market-oriented FDI and has
found evidence for this premise by conducting a panel study using data on Taiwan‘s
outward FDI into China over the period 1991–2002.
2.3.9. Infrastructure
The presence of physical infrastructure is considered as a key determinant of FDI (Loree
& Guisinger, 1995). Infrastructure helps to increase the productivity of both domestic and
foreign investments, and therefore, can stimulate FDI inflows. Some studies have
highlighted that infrastructure is much more crucial for developing countries than
developed countries for attracting FDI (Wheeler & Mody, 1992; Kumar, 2001).
Importance of infrastructure is increasingly recognised by developing countries, and
therefore, infrastructure development has become a main agenda in developing countries.
47
Although not many empirical studies have given considerable attention to the effect of
infrastructure on FDI flows, it has been a common practice to include variable(s)
representing the level of infrastructure as an explanatory variable in studies investigating
determinants of FDI. Empirical studies that have included infrastructure as an explanatory
variable have relied on an array of measures to represent the level of infrastructure in a
country. Most frequently used measure is the telephone lines per capita (see, for example,
Loree & Guisinger, 1995; Kinoshita & Campos, 2004; Asiedu, 2002; Suliman & Mollick,
2009). Alternatively, some studies have relied on transportation infrastructure measures
such as road density or railway density (see for example, Cheng & Kwan, 2000; Loree &
Guisinger, 1995) while others have used the share of transportation, energy and
communication expenditures in GDP (Erdal & Tatoglu, 2002). The level of infrastructure
in the host country has been a significant determinant of FDI inflows in majority of these
studies (Loree & Guisinger, 1995; Erdal & Tatoglu, 2002; Asiedu, 2002; Suliman &
Mollick, 2009; Wheeler & Mody, 1992) while it has been insignificant in some of the
studies (Kinoshita & Campos, 2004).
It is important to understand the dynamics of infrastructure-FDI relationship in order to
reconcile these conflicting empirical results. To this end, it is important to understand,
under what conditions, infrastructure is important and not important to FDI. Investors‘
sensitivity to infrastructure will depend on the type of industry; some industries depend
more on infrastructure than others (Loree & Guisinger, 1995). There are many categories
of infrastructure (The World Bank, 1994), out of which four categories are fundamental
when it comes to FDI. They are transport infrastructure, telecommunication
infrastructure, information infrastructure, and energy availability. Importance of each
category will vary among different industries/sectors. For example, transport
infrastructure is likely to be more crucial for manufacturing industries than services sector
and information and telecommunication infrastructure is likely to be more crucial for
services sector than manufacturing industries.
2.3.10. Regional Integration
Regional integration has become a global trend and many countries have resorted to
regional integration as a means of achieving their economic objectives. As a result of
proliferation of regional trade agreements (RTAs), more than 50 per cent of global trade
is now conducted through RTAs (Aggarwal, 2008). In the past, the main intention of
48
RTAs was to augment trade through liberalisation of trade barriers, though the objective
of attracting FDI was also in mind. However, in recent years regional agreements have
been extended beyond reducing trade barriers, giving more emphasise to the investment
aspect. This has given birth to a new generation of RTAs, often referred as
comprehensive preferential trade and investment agreements (Aggarwal, 2008).
RTAs can affect both quantity and productivity of FDI in numerous ways, and as a result
it is often difficult to determine the impact of RTAs on FDI due to their complex
interrelationships (Aggarwal, 2008). Also, the effects of RTA on FDI are determined by
the type of FDI, the nature of a particular RTA, and the characteristics of regional
countries. Aggarwal (2008) identifies that the impact of RTA on FDI is moderated by
factors such as the degree of integration, the nature of capital flows, the patterns of trade
and FDI, and the structural composition and the level of development of partner countries.
These intricate relationships and channels through which RTAs affect FDI are discussed
in the following sections.
Effects of RTAs on FDI would largely depend on whether FDI is horizontal or vertical
type, and whether FDI has originated from inside the trading block or outside the trading
block. Horizontal FDI refers to a MNC establishing a foreign firm in order to serve the
foreign market, mostly taking place due to exports being too costly as a means of serving
the foreign market due to trade barriers and transportation costs (Protsenko, 2003).
Vertical FDI refers to a MNC establishing a foreign firm in order to source lower cost
inputs. Vertical FDI take place as a result of MNCs fragmenting production process
vertically and geographically dispersing them according to relative factor advantages of
different geographical locations (Protsenko, 2003).
Internalisation opportunities primarily arise from market imperfections. After a firm
seizes such an opportunity through undertaking FDI, any subsequent improvements in
these imperfections might weaken the initial internalisation advantages, and thereafter, a
MNC might consider shifting away from FDI. High trade barriers create market
imperfections which encourages firms to establish foreign affiliates in order to bypass
these imperfections. A formation of an RTA that eliminate or reduce trade barriers among
members would weaken or eliminate the market imperfections created by trade barriers,
and therefore, some of the tariff-jumping FDI originating from member countries might
49
become no longer necessary, and might be replaced by exports. Also, with the lowered
trade barriers, companies with high fixed costs will have the opportunity to concentrate
their activities in one country within the regional trading block and to serve partner
markets through exports (Aggarwal, 2008). Therefore, trade liberalisation within the
regional block would have a negative effect on market-seeking and tariff-jumping FDI
that originate from member countries as a result of FDI being substituted by trade.
However, a formation of an RTA would have different implications on market seeking/
horizontal FDI originating from firms outside the regional trading block. Without an
RTA, a firm external to the regional block might prefer to supply individual countries
through trade rather than establishing firms in each country. But after the trade
liberalisation within the region, it would be more worthwhile for such an external firm to
jump the common external tariff rather than supplying each individual country through
trade. Also, firms external to the regional trading block may undertake defensive
investments inside the region in order to bypass the external trade barriers to compete
with firms within the region which have the tariff advantage over such external firms
(Feils & Rahman, 2011). Moreover, external firms would want to become insiders due to
the fear of future protection measure that might be undertaken by the region against
external investors (Blomström & Kokko, 1997). Therefore, more market seeking FDI can
be expected from firms external to the regional block due to the extended market effect
(Yeyati, Stein, & Daude, 2002).
On the other hand, trade liberalisation within the regional block would have completely
different implications on efficiency seeking/ vertical FDI. Elimination or reduction of
trade barriers within the region would encourage efficiency seeking FDI inside the region
because freer trade of goods and services will allow MNCs, from both inside and outside
the region, to locate its operations in most efficient/beneficial location; thus trade and
investments would complement each other (Aggarwal, 2008). Additionally, harmonised
regional trade policies could lower transaction costs, which could help both MNCs from
inside and outside the region to develop and exploit scale economies (Banalieva, Gregg,
& Sarathy, 2010).
RTA could also have dynamic effects on regional firms as well as on member countries.
RTA could stimulate competition among member countries; each member country trying

50
to improve their investment climate to the best available in the region would result in
improvements in individual host country environments. Also, creation of a larger regional
market can provide opportunities to regional firms to develop into larger and more
competitive global players (Aggarwal, 2008).
New generation of RTAs, with their investment related provisions, can have further
effects on FDI. These investment provisions liberalise rules and regulations governing
FDI flows and foreign ownership, and therefore, enhance the investment climate of
member countries (Aggarwal, 2008). In addition, these investment provisions might
provide protection for FDI (including protection from expropriation), establish dispute
settlement mechanisms, and include common rules on how foreign investors are treated
(Aggarwal, 2008). Such provisions would boost investor perception and confidence, and
in turn would positively affect FDI flows.
Regional integration leads to market enhancement, and it is believed that such a market
enhancement will attract more FDI; several studies have supported this proposition (Feils
& Rahman, 2011; Velde and Bezemer, 2004). Although market enhancement can have
added positive influence on FDI inflows, market enhancement itself is not a sufficient
condition to generate more FDI. In order to attract additional FDI, the region as a whole
should be capable of generating effective demand for goods and services and the host
countries in the region should possess considerable location advantages
(Balasubramanyam, Sapsford, & Griffiths, 2002). As illustrated before, low trade barriers
decrease regional firms‘ cost of serving regional members through trade, and therefore,
RTAs discourage horizontal FDI originating from within the region. Contrastingly, low
trade barriers will allow the firms to locate their operations in most suitable locations, and
therefore, RTAs encourage vertical FDI (Yeyati, Stein & Daude, 2002). Therefore, an
RTA would change the composition of vertical and horizontal FDI in member countries,
possibly vertical FDI being increased at the expense of horizontal FDI (Aggarwal, 2008).
Therefore, even if the region as a whole generate more FDI subsequent to an RTA, some
countries may gain and some countries may lose depending on each member‘s location
advantages, such as its position within the region, its strength of human capital and labour
costs, its cultural/geographical distance with home country and its institutional efficiency
relative to other members (Feils & Rahman, 2011; Velde and Bezemer, 2004). Also, an
introduction of RTA will change the dynamics of FDI within the region, some locational
51
factors becoming more important and others becoming less important, and therefore,
some countries can benefit more while others may even loose from the RTA (Feils &
Rahman, 2011; Velde & Bezemer, 2004; Yeyati, Stein & Daude, 2002). Due to these
complexities it is difficult to ascertain the net impact of an RTA on FDI inflows to the
region as well as its impact on FDI inflows to individual countries.
2.3.11. Labour Costs
Not only the quality and availability of labour (human capital), but cost of labour is also
considered as an important determinant of FDI. Particularly, labour costs are crucial for
attracting vertical FDI, which is stimulated mainly by low factor costs. Some studies have
advocated for a negative relationship between wage level and FDI inflows (Schneider &
Frey, 1985; Saunders, 1982). However, labour costs per se cannot be considered as a
determinant of FDI because what matters is cost of labour adjusted for skill level of
labour. Usually lower wages are associated with lower skills and lower productivity and
vice versa. This is why some countries with very low wages have failed to attract FDI due
to their deficiencies in skills and productivities of labour.
Empirical studies have produced mixed results on the effect of labour costs on FDI
location choice. Cushman (1987), in a study using FDI flows between USA and five other
industrialized countries, has shown that lower host country wages and higher
productivity are positively related to FDI inflows. Woodward & Rolfe (1993), analysing
location decisions of export-oriented manufacturing FDI in the Caribbean Basin, found a
negative relationship between wage rate and plant location. Schneider & Frey (1985) also
found that higher wages discourage FDI. In contrast, Agodo (1978) investigating the
determinants of US manufacturing FDI in Africa, find that low relative overseas wages
have a non-significant influence on FDI location choice. Kravis & Lipsey (1982), did not
find labour cost to have a major influence on U.S. firms‘ decision on their location of
export production.

52
2.4. Impact of FDI on the Host Country
2.4.1 Introduction
FDI plays an important role in facilitating international transfer of resources, technology,
management know-how, products and services from a home country to a host country
(Bang Nam & Se Young, 2004). Through facilitating these international transfers, FDI
can bring an array of benefits to the host country. Literature on economic growth
identifies the importance of expanding the quantity of the basic factors of production
(United Nations, 1992). FDI contributes additional resources, such as capital and
technology to the host country. These additional inputs can have an incremental effect on
host country‘s output and growth.
Literature on economic growth also recognises the importance of improving the
efficiency within an economy and therefore the advancement of technical knowledge in a
country and the qualitative improvements in the labour force are also recognised as
important contributory factors for economic growth (United Nations, 1992). Foreign
investors can bring in new/advance product and process technologies; and managerial
knowledge and skills, all of which can help in improving the efficiency of existing
operations or enabling completely new operations within the host country (Moran, 2005).
These new/advance technologies and techniques can facilitate creation of new
products/services and making existing products/services better or cheaper (Lipsey &
Sjöholm, 2004c). When FDI take place in the form of take-overs (M&As), contribution to
the output/capital stock may be less pronounced as compared to a Greenfield investment;
however, FDI in the form of M&As can indirectly contribute by facilitating more efficient
utilisation of existing resources (Moosa, 2002). FDI is likely to promote economic growth
of the host country by way of generating employment, exports, and tax revenue; and by
improving host country productivity (Blomström & Kokko, 2003a).
FDI can facilitate products/processes/services that are either new or with better value
proposition in terms of cost and quality. Depending on whether such
products/processes/services are final or intermediate, they can improve consumer welfare
or improve value proposition of other downstream operations. This can also improve the
competitiveness of products and services of the host country in export markets.
53
It is a well-known fact that MNCs, through their active role in R&D, produce, own and
control majority of world‘s advanced technology (Blomström & Kokko, 2003b).
Therefore, FDI is considered as the major channel in which technology transfer from
advance countries to developing countries takes place. FDI is also considered as the
fastest and most efficient way of gaining access to the cutting-edge technology (Moosa,
2002). There is no doubt that FDI is the best vehicle for channelling tacit forms of
technology from home to host country. Also, FDI can bring in explicit forms of
technology more efficiently, for example, MNCs are capable of importing new capital
goods at lower cost. However, MNCs superior negotiating powers and information
asymmetry between MNC and host country in terms of underlying technology may allow
MNCs to extort higher rents, particularly in the case of weaker host countries (Moosa,
2002).
Effects of FDI can materialise as direct effects (own firm effects) or spillover effects
(effects on other firms and on host country environment). Direct effects of FDI can take
place through foreign owned firms‘ own operations (own firm effects). Foreign owned
firms are likely to contribute through employing and training employees, achieving higher
factor productivity; undertaking R&D; and introducing new products/processes,
organisational innovations and superior management practices (United Nations, 1992).
Indirect effects can take place when foreign firms affect local firms‘ performance, for
example, through technology transfer of foreign firms to local firms and competition
effect of foreign firms on local firms (United Nations, 1992).
FDI carries certain advantages over other forms of financial flows. Since FDI represent a
long term commitment than other forms of financial flows, such as portfolio equity flows
and debt flows, FDI is considered relatively stable (Moosa, 2002). In the past, FDI has
proven to be resilient during periods of financial calamities whereas portfolio equity
flows and debt flows were subject to large reversals during such periods (Loungani &
Razin, 2001). Also, due to profits of FDI being pro-cyclical to the performance of the host
country, FDI is easy to be serviced than debt capital (Moosa, 2002).
Whether FDI benefits a host country is a much debated argument because there are
concerns about negative effects that MNCs may cause the host country (Bang Nam & Se
Young, 2004). These concerns have created negative sentiments about MNC‘s
54
participation in the host country‘s economy. MNCs presence in the host country could
affect competition negatively. Powerful MNCs can sometimes hinder the growth of
indigenous firms and could also lead to monopolisation of the markets (Mencinger, 2008).
MNCs undertaking import substituting FDI, which take place due to tariff and non-tariff
barriers, may increase their lobbying efforts to maintain such barriers for their own
advantage/survival (Loungani & Razin, 2001).
Although initial effects of FDI on host country‘s balance of payment is likely to be
positive, host country‘s balance of payment can be adversely affected in the long run
through subsequent outflow of earnings and divestments and also due to increased
imports of intermediate goods and services. To counter this, some countries restrict/limit
profit repatriation by imposing sanctions or through taxation. The net effect of FDI
inflows and subsequent profit repatriations is difficult to comprehend because of their
timing differences and particularly because of the transfer pricing. Net capital inflows can
be lower than the reported statistics because MNCs could use transfer pricing to
artificially inflate inward investment and deflate subsequent profit repatriations. Another
criticism comes from the fact that a significant proportion of capital contribution of FDI
comes in the form of imported machinery or capitalised intangibles rather than cash (Lall
& Streeten, 1997). Although FDI can contribute to the tax revenue of the host country,
this can sometimes be limited due to tax benefits offered by host country government to
FDI projects in order to attract FDI (Loungani & Razin, 2001).
Empirical evidence shows that foreign affiliates tend to source their inputs from foreign
suppliers, particularly higher value added intermediate products (Faeth, 2005). This can
have a negative effect on the development of the local producers and may restrict them to
low value adding activities (Faeth, 2005) and can also have a negative effect on the
import bill of the host country.
Benefits of FDI may also be reduced by the extent of foreign-owned firms‘ borrowing
from the domestic market (Lall & Streeten, 1997; Loungani & Razin, 2001). Borrowing
from the domestic credit market can not only crowd out local domestic investments (due
to increase in interest rates) but also increase the risk of funds borrowed in the domestic
market being repatriated (Loungani & Razin, 2001). Also, excessive local borrowing can
not only make the venture more risky but also end up host country, rather than MNC,
55
bearing the risk of the venture. Excessive local borrowing can also make the exit of MNC
easy in difficult times, therefore making FDI more footloose. Some critics consider
resources, assets and practices that FDI bring in to host country are inappropriate to the
host country. MNCs are frequently associated with industrial relations issues, and
therefore, presence of MNCs could affect host country industrial relations adversely
(Moosa, 2002). Host countries also worry that MNC‘s participation in the host countries‘
economy would undermine the sovereignty of the host country.
Although FDI can create both positive and negative effects on the host country, current
literature favours the proposition that FDI, in general, benefits host countries. Believing
on this proposition of potential positive effects of FDI, many host countries have
encouraged inward FDI by providing array of special incentives (Vahter, 2004). Given
the focus of the study, the following section discuss the effects of FDI on productivity
and, in order to comprehend other related research issues, the next section discuss other
potential effects that FDI can bring into the host country.
2.4.2 FDI and Productivity
The presence of foreign firms in host economies as producers of goods and services is
likely to have an impact upon the efficiency of investment within the host country (United
Nations, 1992). If foreign ownership leads to increase in productivity in the firm (own
firm effects), then such an increase is beneficial to the host country. Presence of foreign
firms can also affect the productivity of local firms (spillover effects). Local firms can
improve their productivity by observing and adopting/imitating advance technologies, and
managerial and organizational skills that foreign firms possess. Employees trained in
foreign firms may move to local firms or start their own firms, and such employees are
likely to contribute to local firms‘ productivity. Local firms may be forced to improve
their efficiencies in order to compete with foreign owned firms. Alternatively, foreign
firms can adversely affect local firms‘ productivities by grabbing market share from local
firms and compelling local firms to operate in less-efficient scales of production. Also,
new product and process technologies brought in by MNCs can change the industries‘
cost structures; such changes can alter the market structure and competition within
industries, which would affect efficiency of investments (United Nations, 1992).
Spillovers of FDI are typically categorised into two types: horizontal and vertical
spillovers. Externalities of a foreign firm on the domestic firms in its own industry are
56
categorized as horizontal spillovers and externalities of a foreign firm on the firms in
upstream industries (backward spillovers) and downstream industries (forward spillovers)
are categorised as vertical spillovers (Hanousek, Kočenda, & Maurel, 2011; Havranek &
Irsova, 2012).
Empirical evidence, except handful of exceptions (for example, Blomström, 1988; Aitken
& Harrison, 1999; Globerman, Ries, & Vertinsky, 1994), provide strong evidence for
positive own firm effects of foreign ownership (Vahter, 2004; Lipsey, 2004). There is
large number of studies that have examined the productivity spillover of FDI on domestic
firms, and these studies have produced mixed results (Lipsey, 2004). Several researchers
have found positive spillovers from foreign firms on productivity of local firms (for
example, Blomström & Persson, 1983; Kokko, 1994; Chuang & Lin, 1999). Some have
found either negetive or insignificant spillovers (for example, Aitken & Harrison, 1999;
Smarzynska, 2002; Javorcik, 2004). Conducting a meta-analysis of 32 empirical studies
on technology spillovers from FDI in developing countries, Wooster & Diebel (2010)
shows that past empirical evidence, collectively, provide weak support for the presence of
horizontal spillovers in developing countries.
Recent empirical studies on productivity spillovers recognise supply side and demand
side factors that can moderate productivity spillovers of foreign firms. They emphasise
that the extent of spillovers will not only depend on the degree to which foeign affiliates
are technologically active in the host country and the extent to which they expose these
technologies (technology leakage) but also on the level of absorptive capacity of the
domestic firms (Marin & Bell, 2006). Also, different types of FDI, for example, whether
FDI is export oriented or market oriented or whether FDI takes place as M&A or
Greenfield projects can have different implications for spillovers (Vahter, 2004; Javorcik,
2004). Many empirical studies have investigated the importance of these moderating
factors, particularly the demand side factors, i,e. the absorptive capacity of domestic
firms. Based on Indonesian manufacturing data from 1988 to 1996, Blalock & Gertler
(2009) demonstrate that firms with investments in research and development and firms
with highly educated employees benefit more than other firms. Interestingly, Kokko,
Zejan, & Tansini (2001), based on data from Uruguay, find evidence of positive spillovers
associated with foreign firms established during inward-oriented trade regimes but do not
find evidence of spillovers associated with foreign firms established during more outward
57
oriented trade regimes. They explain this observation by suggesting that foreign firms
focusing on local market (established during inward-oriented trade regimes) are more
likely to import technology in order to compete with domestic firms, which provide
opportunities for spillovers. In contrast, foreign firms established during outward oriented
trade regimes rely more on their skills in international marketing and distribution than
new production technologies, and therefore, provides less opportunities for productivity
spillovers. Takii (2005) provide evidence for positive productivity spillovers in his study
exploring the extent of productivity spillovers in manufacturing firms in Indonesia for the
period 1990-1995. He also investigated the characteristics of foreign owned firms and
locally owned plants that influence the extent of spillovers and found that spillovers were
generally smaller in industries where greater presence of majority or wholly owned
foreign firms was observed. He reckons this is plausible because majority owned foreign
plants can control/limit the diffusion of their proprietary technologies more than other
foreign owned plant.
Among the moderating factors of technology spillovers, technology gap is the most
controversial factor, some arguing it as a positive moderator of spillovers and some
arguing it as an obstacle for spillovers. Takii (2005) found relatively smaller or negative
spillovers associated with industries where technological gap between foreign plants and
locally owned plants were relatively large implying that domestic firms in these industries
were not technically proficient to absorb spillovers. In contrast, Blalock & Gertler (2009),
also based on Indonesian manufacturing data, finds that firms with lower prior technical
competency, i.e. firms with higher technical gap with foreign firms benefit more from
productivity spillovers. Furthermore, there are many other studies that probed the
relationship between the extent of productivity spillovers and the size of the technology
gap and some have found it positive and others negative (Kokko, 1994; Lipsey &
Sjöholm, 2004c). When the technology gap is large, there is more room for domestic firm
to catch up, and therefore, such firms can benefit more than firms that have less
technology gap with foreign firms (Blalock & Gertler, 2009). These contradictory results
can also be attributed to a possible non-linear relationship between technology gap and
spillovers; it is likely that while some level of a technology gap is required for spillovers
to take place, a larger technology cap can make foreign firms‘ technology incompatible
for domestic firms‘ use (Lipsey & Sjöholm, 2004c). Using firm level data from Lithuania
for the period 1996-2000, Smarzynska (2002) shows that spillovers through backward
58
linkages occur only when the technological gap between local and foreign firm is
moderate but not when the technology gap is large or negligible.
In their meta-analysis of the empirical literature on spillovers, (Meyer & Sinani, 2009)
find a curvilinear relationship between spillovers of FDI and the host country‘s level of
development in terms of income, institutional framework and human capital. They find
that spillovers are related in a U shaped form to the host country‘s per capita income,
level of human capital, and level of institutional development.
2.4.3 Other Potential Effects of FDI
FDI and host country capital formation
Total capital formation, which comprises domestic capital formation and foreign capital
formation, is considered as a key determinant of economic growth of a country (United
Nations, 1992; Moosa, 2002). Inward FDI can directly contribute to the host country
capital formation, and thereby, increase the output level (Lipsey & Sjöholm, 2004c).
Contribution of FDI to capital formation is higher when it takes the form of Greenfield
investment compared to mergers and acquisitions (M&A), where existing assets are
simply transferred from domestic to foreign owners. Contribution of an M&A to capital
formation will be limited to the extent that the proceeds of the sale of the assets are not
consumed (Herzer, 2012).
FDI can also affect domestic capital formation either positively or negatively (United
Nations, 1992). FDI can compliment domestic investment through encouraging and
facilitating investment in upstream and downstream industries, particularly due to
increased demand for MNCs inputs and price/quality benefits of MNCs outputs (Faeth,
2005). FDI can negatively affect domestic capital formation when MNCs drives out
domestic firm through competition, undertake projects that would otherwise be
undertaken by domestic firms or compete with local firms for scarce resources such as
skilled labour and local finance (Herzer, 2012; Faeth, 2005).
Since FDI can either compliment or substitute domestic investment, the net effect of FDI
on overall capital formation of a host country is difficult to comprehend. Many empirical
studies have dedicated their effort to answer this inquiry, and most studies have found
59
FDI to have a crowding in effect on domestic investment (Agosin & Mayer, 2000;
Bosworth, Collins, & Reinhart, 1999; Konings, 2000; Borensztein, De Gregorio, & Lee,
1998) while some have found FDI to have a crowding out effect on domestic capital
formation.
Bosworth, Collins, & Reinhart (1999), investigating the effects of capital inflows on
domestic investment in developing countries, conclude that FDI have a highly positive
effect (nearly a one to one effect) on domestic capital formation, superior to the effects of
portfolio capital and bank loans on domestic capital formation. With a sample of 64
developing countries, Razin (2002) arrived at a similar conclusion by finding that FDI
contributes to domestic investment positively and the effect of FDI is much larger than
that of portfolio equity and international loans inflows. Agosin & Mayer (2000), by
conducting econometric tests on panel data for countries in Africa, Asia and Latin
America for 1970-1996, shows that there has been a strong crowding in effect of FDI on
domestic investment in Asia and to a lesser extent in Africa but a strong crowding out
effect of FDI on domestic investment in Latin America. Authors conclude that the
positive effects of FDI on domestic investment are not certain and therefore a complete
open policy towards incoming FDI can be sub-optimal.
FDI and host country employment
FDI can affect employment in host country, quantitatively, through direct provision of
employment within foreign firms and indirect effects on employment level of local firms,
and qualitatively, through improving the skill level of human capital in the host country
and influencing employment policies and practices in the host country (United Nations,
1992). FDI in labour intensive operations, which are less advanced in technology, can
have a larger contribution to the host country‘s employment while their contribution to
the capability development in human capital would be marginal. In contrast, FDI in
capital intensive operations, which use advance technologies, can have a positive impact
on the skill level of human capital while having a marginal effect on the quantity of
employment (United Nations, 1992).
Most of the empirical studies indicate that the effects of FDI on the level of employment
in the host country is small or insignificant for most of the host countries largely due to
60
high capital intensity and import dependency of foreign firms (Moosa, 2002). In contrast,
MNCs‘ potential contribution in improving the skill level of human capital in the host
country is widely recognized in the literature. A number of studies have observed that
foreign firms undertake more on-the-job training than domestic firms (see Aitken &
Harrison, 1999 and Blomström & Kokko, 1998 for an outline of these studies). However,
the number of local workers who are likely to undergo training might not be very large
because of the capital intensive nature of most FDI (Moosa, 2002).
FDI and wages
Foreign firms are generally expected to pay higher wages than domestic firms due to
several reasons. First, due to superior technology of foreign firms, they are inclined to
hire skilled workers, and therefore, they need to pay higher wages to attract better
workers. Also, due to higher productivity of foreign firms, not only foreign firms are
expected to pay higher wages but they could also afford to pay higher wages. But there
can be many other reasons why a foreign firm may be inclined to pay a higher wage even
above that should be paid for a given skill level. MNCs may be encouraged to pay higher
wages because of host and home country pressures or for better public relations (Lipsey,
2004). Furthermore, local workers may prefer local firms, thus foreign firms will have to
pay a wage premium to overcome this preference (Lipsey, 2004). Most importantly,
foreign firms may want to pay a wage premium to reduce worker turnover in order to
slow down the phase of leakage of their superior technology to local firms (Urban, 2010).
It may be the case that since local firms are more knowledgeable in terms of identifying
and attracting better workers they can source workers at the optimum wage, but foreign
firms may have to pay a extra premium because of their imperfect knowledge about local
firms (Lipsey, 2004). Higher wages can also be associated with foreign firms because of
their inclination to take over high-wage domestic firms or highly productive domestic
firms or because foreign firms tend to invest in relatively high-wage sectors (Lipsey &
Sjöholm, 2004b; Lipsey & Sjöholm, 2004c).
In addition to the direct effects on wage level of foreign owned firms (own firm effects),
FDI can also have a spillover effect on wage level of domestic firms. Foreign firms could
have both positive and negative effects on wage level of domestic firms, and therefore,
the net effect of foreign firms‘ effect on wage level of domestic firms is unclear. Wage
61
spillovers can be negative if foreign firms cream-skim high-waged workers from
domestic firms or MNCs acquire higher paying domestic plants (Lipsey, 2004). In
contrast, local firms wage level can be positively affected if competition in the labour
market compels local firms to increase their wage levels to match foreign firms‘ wage
level (Lipsey, 2004).
Overall effect of foreign firms on host country wages depend on the net effect of direct
and indirect effects. If foreign firm poach high wage workers or MNCs acquire firms
with high wage levels, then foreign firms‘ wage premium will be at the expense of wage
level of local firms, and therefore, average industry wage level will be largely unaffected.
If foreign firms pay higher wages without poaching skilled workers from domestic firms
or if foreign firms pay higher wages while influencing domestic firms to pay higher
wages (wage spillovers), then average industry wage level is likely to be raised.
Empirical studies provide strong consistent evidence for a wage premium in foreign firms
(Lipsey, 2004; Moller, Markusen, & Schjerning, 2007) and this wage premium persists in
both developed and developing countries and in different industries (Lipsey & Sjöholm,
2004b; Lipsey & Sjöholm, 2004c; Lipsey, 2004). Some of these studies have attributed
this wage premium to one or many of foreign firms‘ superior characteristics such as their
larger size, higher capital intensiveness, higher productivity and higher skill intensity of
labour (Globerman, Ries, & Vertinsky, 1994; Conyon et al., 1999) while some have found
a wage premium in foreign firms even after controlling for some of these variables
(Moller, Markusen, & Schjerning, 2007; Lipsey & Sjöholm, 2004b; Haddad & Harrison,
1993; Feliciano & Lipsey, 1999).
Compared to empirical studies on foreign firms‘ own firm wage effects, only a handful of
studies have looked into the foreign firms‘ spillover effect on domestic firms‘ wages
(Görg & Greenaway, 2001). These studies have produced mix results, some observing
positive wage spillovers (Lipsey & Sjoholm, 2001) and others observing negative or
insignificant wage spillovers (Feliciano & Lipsey, 1999). Moreover, Aitken, Harrison, &
Lipsey (1996), exploring the relationship between wages and foreign investment in
United States, Mexico and Venezuela, find wage spillovers in United States but not in
Mexico and Venezuela. However, their estimates show that the effect of foreign
62
investment on aggregate wages (for foreign and domestic combined) is positive for all
three countries.
FDI and host country economic growth
Economic growth is an outcome of the interrelationship between many economic,
political and social factors (United Nations, 1992). Literature on economic growth
identifies the importance of expanding the quantity of the basic factors of production,
expanding markets and improving the efficiency within an economy (United Nations,
1992). Advancement of technical knowledge in a country and the qualitative
improvements in the labour force are also recognised as important contributory factors for
economic growth (United Nations, 1992). Factors those contribute to growth are
themselves interdependent; therefore, progress in one can facilitate advancement in
another and poor performance in one can hinder progress in another (United Nations,
1992). FDI can affect these growth determinants. For example, FDI can affect host
country‘s capital stock, technology infrastructure, productivity, human capital and trade.
Therefore, FDI is likely to have an impact on host country‘s economic growth.
Technological progress of a country is now considered as the most important determinant
of growth (Moosa, 2002; Blomström & Kokko, 2003b). Moreover, it is recognised in
recent growth literature that growth rate of a developing country is largely dependent on
its ability to adopt and implement new technologies from more advance countries
(Moosa, 2002). Also, it is more cost effective for a developing country to use existing
technology rather than to generate new technology through investment in R&D
(Blomström & Kokko, 2003b). Developing countries can potentially be exposed to
foreign technology through different channels, such as through imports of high
technology products, licensing arrangements with MNCs, FDI projects and employing
human capital that were foreign educated/experienced. Technology advancement can not
only promote host country‘s growth through the production of new/advance products but
also enables the host country to obtain a greater output from any given combination of
input through increase in factor productivity (United Nations, 1992). Also, for small
countries that rely heavily on their export performance, technology is critical in order to
improve their export composition; strength of export performance will largely depend on
the technology content of the exports (United Nations, 1992).
63
Although FDI is considered as a positive moderator for most of the determinants of
growth such as capital stock, technology infrastructure, and productivity; as it was
highlighted before, these positive effects are not assured. Also, its effects on some areas
are vague. For example, its effect on trade and balance of payment is not clear due to
higher import propensity of foreign firms and remittances of foreign firms.
An increase in foreign investment could stimulate economic growth, and at the same time,
economic growth can also be a powerful stimulant for FDI inflows (Nonnemberg &
Mendonca, 2004; Agrawal, 2000). Therefore, the direction of causality, whether FDI
causes growth in GDP or growth in GDP creates more FDI, is a much debated issue, and
may depend on various factors such as factor endowment, geographical location, level of
infrastructure, quality of human capital, market size and trade regime of the country
(Faeth, 2005). Furthermore, empirical studies have produced mix results on the direction
of causality, equally supporting both premises, and therefore, proved the existence of the
endogeneity problem in empirical investigations.
Many studies have being conducted to empirically investigate the effect of FDI on
economic growth and their results are not unanimous. Studies concentrating on developed
countries generally show positive effects but studies concentrating on developing
countries present inconsistent results, finding positive effects, negative effects or no
effects (Beugelsdijk, Smeets, & Zwinkels, 2008).
Complicating this further, there is expanding literature that indicates the impact of FDI on
the host country‘s growth is moderated by various host country factors such as level of
human capital, trade policy and trade openness, level of financial development, level of
economic development, the level of institutional quality, and the technology gap between
host country and home (Solomon, 2011).
Using a sample of 46 developing countries and considering the period 1970-1985,
Balasubramanyam, Salisu, & Sapsford (1996) shows that growth enhancing effects of
FDI is stronger in countries that pursue an outward oriented trade policy (EP policy) than
countries pursue an inward oriented trade policy (IS policy).
Host country‘s capacity to absorb advance technology and other skills that MNCs bring in
depend on the quality of human capital in the host country (United Nations, 1992; Moosa,

64
2002). Based on FDI flows from industrial countries to 69 developing countries during
1970-1989 and proxing human capital by level of schooling, Borensztein, De Gregorio, &
Lee (1998) show that FDI contributes to economic growth only when the host country has
a minimum threshold level of human capital.
Using time series data from 1959 to 2002 and employing an econometric framework of
co-integration and error correction mechanism, Athukorala (2003) has examined the two-
way relationship between FDI and GDP in the context of Sri Lanka. His econometric
results indicate that GDP growth rate and FDI is positively related. However, his results
shows that GDP growth rate influence FDI directly but the direct influence of FDI
inflows on GDP growth is weak. Further, using Engle-Granger method to see the
direction of causality, he shows that the direction of causation is from GDP growth to FDI
but not from FDI to GDP growth. In sum, he finds no evidence of a direct growth impact
of FDI on the Sri Lankan economy.
FDI and host country trade
Foreign firms present in a host country can affect both exports and imports of that country
through their own trade performance (direct effects) and by influencing the trade
performance of the local firms (indirect effects). FDI can affect the terms of trade of the
host country positively if FDI increases exports more than imports. On the other hand,
FDI can affect the terms of trade of the host country negatively if FDI increase imports
more than exports. The effect of FDI on trade largely depends on whether FDI and trade
are complements or substitutes, and this largely depends on whether FDI is horizontal or
vertical.
Due to MNCs‘ knowledge of the markets, consumer preferences, and business practices in
their home countries and their wider international reach, MNCs are better able to compete
in export markets. Exporting involves international marketing, distribution, and servicing
of products, all of which are associated with high fixed costs, and therefore, due to their
larger size and greater resources, MNCs are better equipped to meet these requirements
than resource constraint local firms, particularly those in developing countries
(Blomström & Kokko, 1998; Kokko, Zejan, & Tansini, 2001). Also, through their
marketing skills and ability to specialize across international borders, MNCs could aid the

65
host country to capitalize on its comparative advantages (Blomström & Kokko, 1998). It
is a well established fact that foreign firms are more export oriented than domestic firms
(Faeth, 2005). Contribution of FDI to the host country‘s exports will depend on whether
FDI is export oriented or market oriented. Many countries have relied on export oriented
FDI to improve their export performance.
Foreign firms can also affect export performance of local firms (export spillovers)
through various channels. Local firms can benefit from technology/knowledge spillovers
from foreign firms to improve the value propositions of their exports. Local firms could
gain valuable knowledge about foreign markets, international marketing and distribution
networks through foreign firms (Kokko, Zejan, & Tansini, 2001). Moreover, through their
vertical linkages, foreign firms can affect export performance of local firms in upstream
and downstream industries (Anwar & Nguyen, 2011).
Foreign firms can affect host country imports through their own import activities. Foreign
firms are notoriously popular for relying more on inputs of foreign origin, and therefore,
foreign firms are likely to import more than their domestic counterparts. On the other
hand, import substituting FDI is likely to bring down hosts imports. Foreign firms could
also affect imports of downstream sectors; local firms could source from foreign firms in
upstream sectors instead of importing.
Several studies have provided evidence for export spillovers by showing that local firms‘
exports can benefit from the presence of foreign firms. Buckley, Clegg, & Wang (2002),
based on Chinese manufacturing industries in 1995, show that both local firms‘ export
intensities and local firms‘ propensity to develop new and high-tech products is positively
related to the degree of foreign presence in the industry. Kokko, Zejan, & Tansini (2001)
show that export propensity of local firms in Uruguay is positively related to the presence
of outward oriented foreign firms but not related to the presence of import substituting
foreign firms. Based on firm level data from Vietnam‘s manufacturing sector, Anwar &
Nguyen (2011) investigated spillovers taking place through local firms‘ horizontal and
vertical linkages with foreign firms. They found that the presence of foreign firms has a
significantly positive effect on both the decision of domestic firms to export and on the
export share of domestic firms, but only through horizontal and forward linkages. In
contrast, they found that presence of foreign firms has a negative effect on export
66
activities of local firms in upstream industries. Except few country studies that have
compared firm level import intensities of foreign firms and local firms, empirical studies
on the effect of FDI on host country imports are scarce.
FDI and balance of payment of the host country
Through its associated foreign exchange flows, FDI can affect balance of payment (BOP)
of the host country both directly and indirectly. Since foreign exchange is considered as a
scarce resource in most of the developing countries, the BOP effect of FDI is much more
crucial for developing countries (Moosa, 2002).
FDI can have both direct and indirect effects on host country‘s balance of payment
account. Direct effects results from inflows and outflows of foreign exchange associated
with the foreign investment. Inflows results from equity capital and loans inflows
associated with FDI and export income generated from activities of foreign firms.
Outflows result from profit repatriation, loan repatriation, interest payments paid to
service foreign loans, divestments, royalties and technical fees paid abroad and payment
for imports of capital goods, raw material and intermediary goods.
The net effect of FDI on balance of payment is difficult to comprehend, mainly due to
difficulty in observing the indirect effects and because it is difficult to assess the
opportunity cost of FDI, i.e. to answer the counterfactual question: what would have been
the situation if the foreign investment had not occurred (Dunning & Lundan, 2008;
Moosa, 2002). Indirect effects can have many forms. Flows associated with FDI can
affect the exchange rate and the changes in the exchange rate can affect host country‘s
export and import competitiveness. Foreign firms can replace some of the imports via its
domestic sales and use of local content. FDI can also affect domestic firms‘ exports and
imports. Complicating further, foreign firms can affect BOP by affecting and influencing
income and consumption patterns of the residents of the host country (Moosa, 2002).
Another complication in assessing the effect of FDI on BOP is the timing differences of
associated flows. The initial investment (net of any imported machinery) is likely to
improve the capital account. Continuing effects from subsequent flows can either improve
or weaken the capital account and current account, depending on the extent of subsequent
equity and loan flows, repatriation of profits and other payments to parent companies,
67
divestments and imports. The continuing effect of FDI on the current account will depend
on the type of FDI. Resource based and export processing investments as well as Import
substituting FDI are likely to affect the current account positively (Dunning & Lundan,
2008; Moosa, 2002). Market seeking investment can either replace or increase host
country‘s imports, and therefore, the effect on the current account can either be positive or
negative.
Empirical evidence on the BOP effects of FDI is scarce, particularly for developing
countries. Available evidence indicate that although developing countries benefit from
FDI in extraction, they do not benefit from FDI in manufacturing, largely due to high
import content of foreign firms‘ output and transfer pricing mechanisms of MNCs
(Moosa, 2002). In his empirical study using a sample of 159 firms distributed in Jamaica,
Kenya, India, Iran, Colombia and Malaysia, Lall & Streeten (1997) concluded that
overall direct effects of these firms on the balance of payment of the respective countries
are negative, except for Kenya. Studying the relationship between FDI and the current
account balance in EU new member states, Mencinger (2008) conclude that FDI improves
the current account balance through the trade account but deteriorates current account
balance through the investment account.
2.4.4 Concluding remarks
Technological progress of a country is now considered as the most important determinant
of growth (Moosa, 2002; Blomström & Kokko, 2003b). It is more cost effective for a
developing country, such as Sri Lanka, to use existing technology in the developed world
rather than to generate new technology through its own R&D investment (Blomström &
Kokko, 2003b). Developing countries can potentially be exposed to foreign technology
through different channels, such as through imports of high technology products,
licensing arrangements with MNCs, FDI projects and employing human capital that were
foreign educated/experienced. Out of these channels, FDI is considered the most effective
channel in which technology transfer from advance countries to developing countries
takes place. Technology advancement can not only promote host country‘s growth
through the production of new/advance products but also enables the host country to
obtain a greater output from any given combination of input through increase in factor
productivity (United Nations, 1992). Also, for a small country such as Sri Lanka that rely
heavily on its export performance, technology is critical in order to improve their export
68
composition since the strength of export performance will largely depend on the
technology content of the exports (United Nations, 1992). As per the IDP theory, inward
FDI plays a major role in upgrading local firms‘ competencies, which will enable the
indigenous firms to later on undertake outward FDI (Dunning, 1981; United Nations,
2006; Dunning, Kim, & Lin, 2001; Dunning, 2003). IDP theory advocates for a strong
association between a country‘s direct investment position and its level of development.
Preceding sections identified many other benefits that FDI can bring in to the host
country. Although there are concerns about few negative effects that MNCs may cause to
the host country, in general, FDI can benefit host countries enormously. Hence, it is
important to examine the impact of FDI in the context of Sri Lanka. Therefore, Chapter
seven presents an empirical study conducted to examine the impact of FDI on firm level
productivity in the context of Sri Lanka. Given the scope of this study, this thesis does not
attempt to examine the other potential effects of FDI discussed in the section 2.4.3, which
could be a potential topic for future research.
69
Chapter 3 : Geographic, Demographic, Policy and Economic
Environment in Sri Lanka
3.1. Introduction
This chapter provides a context analysis of the economy of Sri Lanka. Special attention is
given to recognise salient features in Sri Lanka that are relevant for FDI before detailed
descriptive analysis of FDI in Sri Lanka is provided in the following chapter. Both
chapters intend to offer the background information for the rigorous empirical studies to
be reported in chapter 5-7. Section 3.2 reviews geography and resource endowments,
followed by the summary of Sri Lanka‘s demographic characteristics. Sections 3.3 and
3.4 outline the general policy environment and the FDI policy framework, respectively.
The chapter then moves on to examine the individual economic and financial indicators
including economic growth and composition of GDP, savings and investments, human
development indicators, external trade, fiscal and monetary sectors in section 3.5. Section
3.6 gives attention to political factors, i.e. civil war and internal conflicts. Finally, section
3.7 offers concluding remarks.
During 1505-1948, Sri Lanka was under the rule of several colonial European powers;
namely the Portuguese, the Dutch and, then finally, the British (Foreign and
Commonwealth Office, 2012). Post independent Sri Lanka was widely considered as a
country with excellent prospects for economic development and was regarded as one of
Asia‘s most promising new nations (Snodgrass, 1998; Kelegama, 2000). For example,
when Sri Lanka received its political independence from UK in 1948, Sri Lanka had the
third highest per capita income in Asia, after Japan and Malaysia (Rajapatirana, 1988).
Even by 1965, Sri Lanka‘s per capita income was higher than that of South Korea, China
and Thailand (The World Bank, 2012b). However, Sri Lanka encountered severe
economic and political complications in its post independent progress and ended up with
a reputation for weak economic growth indicators but strong development indicators
(Snodgrass, 1998).
70
3.2 Geography, Resource Endowments and Demography
Sri Lanka is a relatively small sized island economy with a geographical area of 65,610
square kilometres and a population of 20.8 million in 2010 (Foreign and Commonwealth
Office, 2012). It is located south of India in the Southern Asia in the Indian Ocean. Sri
Lanka is situated at the crossroads of major shipping routes connecting South Asia, Far
East and the Pacific with Europe and the Americas (Board of Investment Sri Lanka,
2011).
Sri Lanka has a tropical climate with average monthly temperature ranging from 25.1 to
28.1 degrees Celsius (The World Bank, 2012b) with only marginal seasonal and regional
variations (Wenzlhuemer, 2008). The country is endowed with a rich natural resource
base. Its resource base includes forests covering about 23% of the country; a rich
biodiversity8; productive coastal and inland fisheries; fertile soils; diverse gem and
mineral resources; and an intricate system of rivers, reservoirs, and groundwater aquifers
that captures annual rainfall three times that of the world‘s mean (Asian Development
Bank, 2008). Hydro power is a main source of power generation and contributes 46% of
the total electricity generation in the country (Central Bank of Sri Lanka, 2010). Sri
Lanka is home to numerous unique tourist attractions and is considered as one of the best
tourist attractions in the world. For example, NEW YORK TIMES ranked Sri Lanka as
the number one travel destination for 2010 (The New York Times, 2010) and the Lonely
Planet, the world's largest travel guide publisher, ranked Sri Lanka as the number one
travel destination for 2013 (Lonely Planet, 2013).
The Sinhalese, Tamils and Muslims are the three largest ethnic groups in the country
accounting for 73.8%, 8.5%, and 7.2% of the population, respectively (Central
Intelligence Agency, 2012). Sinhala and Tamil are the most widely spoken languages
with about 74% and 17% of speakers in 1993, respectively (Gordon, 2005). Buddhism,
Hinduism, Islam, and Christianity are the most prevalent religions in Sri Lanka
accounting for 69.1%, 7.1%, 7.6%, and 6.2% respectively (Central Intelligence Agency,
2012). Only 14% of the population is urban and the rate of urbanization is low at 1.1%
annual rate (Central Intelligence Agency, 2012).
8 Sri Lanka is considered as one of the 25 biodiversity ―hot spots‖ in the world
71
3.3 Post-Colonial Context and Policy Environment
Sri Lanka, which was previously known as Ceylon, had been considered as the model
crown colony of the nineteenth-century British Empire (Wenzlhuemer, 2008). When Sri
Lanka gained independence from Britain in 1948, Sri Lanka‘s economy was an open
economy and was largely a plantation-based economy dependent on the export of three
primary commodities: tea rubber and coconut (Rajapatirana, 1988). Because these
commodities were highly demanded in the world market during this time, Sri Lanka had a
smoothly functioning export economy (Snodgrass, 1998). Agricultural sector accounted
for more than 40% of national income, out of which plantation sector alone accounted for
one-third of national income and 90% of foreign exchange earnings (UNCTAD, 2004;
Kelegama, 2000). Sri Lanka had the third highest per capita income in Asia, after Japan
and Malaysia (Rajapatirana, 1988). Moreover, Sri Lanka had high human development
indicators, which was far higher than that of most of the Asian countries (Abeyratne,
2008). It also inherited a well-developed infrastructure, an efficient administrative
mechanism and a democratic political system from the British colonial rule (Abeyratne,
2008). Sri Lanka‘s external assets at the end of 1950 were equivalent to almost an entire
year of imports, a figure that was well above that of other small countries that were also
highly dependent upon international trade (Central Bank of Sri Lanka, 1950). All these
favourable aspects positioned Sri Lanka in a very promising state, and therefore, Sri
Lanka was considered as the most prospective development success in Asia (Abeyratne,
2008).
Sri Lanka‘s continuous reliance on these relatively price inelastic primary commodities
(tea, rubber and coconut) and expending bulk of the export income on subsidised food
imports weakened the terms of trade in subsequent years and resulted in negative trade
balances and balance of payment deficits after 1960s. This tempted to a shift towards
protectionist import-substituting policies (Kelegama, 2000; Athukorala and
Rajapathirana, 2000). From early 1960s, Sri Lanka started introducing inward oriented
development strategies coupled with import substitution policies, and Sri Lankan
economy ended up being one of the most inward-oriented and regulated economies
outside the communist bloc by mid-1970s (Athukorala & Jayasuriya, 2004). Moreover,
policy environment was largely concerned about achieving equality and was largely
driven by wealth redistribution strategies (through extensive welfare programmes) while
72
giving less attention to wealth creation (Abeyratne, 2008). Expanding the social welfare
system was seen as a convenient means to achieve political popularity among masses
(Abeyratne, 2008). Due to a change in political power from left-wing to right-wing in
1965, Sri Lanka gasped some limited liberalisation during 1965-1970 (Snodgrass, 1998).
However, the left-wing regained political power in 1970, and thereafter, Sri Lanka
resumed its inward oriented controlled economy (Snodgrass, 1998). During these
periods, state intervention in the economic activities became commonplace, and the Sri
Lanka‘s economy was dominated by state-owned enterprises (SOEs) while private sector
receiving less attention by the state (Athukorala & Jayasuriya, 2004). Most sectors
including manufacturing, trade, transport, telecommunications and financial services were
under state monopolies and were subject to state controls (The World bank, 2007). Due to
these inward looking and short-sighted policies, Sri Lanka experienced slow growth rates
with rising unemployment in this era, and instead of relieving the balance of payment
problem, these policies aggravated it by discouraging export expansion (Abeyratne,
2008). Dismal outcomes of these inward oriented policies led to a major shift in political
power from left-wing to right-wing in 1997 with the elected party, United National Party,
securing majority of the votes (Snodgrass, 1998).
The new government, with the strong mandate, initiated extensive economic liberalisation
process in 1977 by liberalising trade, price and investment controls (Athukorala &
Jayasuriya, 2004; Rajapatirana, 1988). Previously imposed quantitative restrictions on
imports were removed and a more uniform tariff structure was introduced. Also,
exchange rate was realigned in 1978 which had been overvalued due to pre-existed trade
suppression (The World Bank, 2007). In addition to relaxing several impediments to FDI,
the new government established the Greater Colombo Economic Commission (GCEC) in
1978 to promote export oriented foreign investment (The World Bank, 2007). GCEC is
the forerunner to the Board of Investment, which is the incumbent establishment
responsible for FDI. GCEC was responsible in establishing several export-processing
zones (EPZ‘s) and formulating and implementing an incentives package for foreign
investments (The World Bank, 2007).
However, as a result of delays and inconsistencies in the implementation of the 1977
reform process, mostly caused by the internal civil conflict, the 1977 reform process lost
its momentum in early 1980s. Thereafter, a second wave of liberalisation was initiated in
73
1990s (Athukorala & Jayasuriya, 2004). The 1990s reform process focused more on
export expansion and included further tariff cuts, simplification of tariff structure,
opening up of the current account, and privatization of large state-owned enterprises
(Athukorala & Jayasuriya, 2004; The World bank, 2007). Since 1989, privatisation has
been pursued aggressively and 92 enterprises, largely in the plantation, industry,
insurance, telecom, hotel, and airline sectors, were privatised during 1989-2005 (Central
Bank of Sri Lanka, 2007, table 116). In addition to these, 92 bus depots in the public
transport sector were also privatised (Salih, 2000). Since 1994, political power changed
back and forth between the two major political parties in several occasions; however,
these changes did not lead to radical changes in economic policy (Snodgrass, 1998).
However, the privatisation trend was halted, if not reversed, after 2005. Incumbent
government advocates state control of what it believes to be strategic enterprises, and
have halted some of the privatisations that were in the process and have reversed several
previous privatisations (Bureau of Economic, 2011). Furthermore, in 2011, 37 privately
owned companies, some of which were foreign-invested firms, were expropriated by the
Sri Lankan government through passing a controversial law in the parliament. The bill
was termed as The Revival of Under-Performing Enterprises and Under-Utilised Assets
Act, and targeted 37 private enterprises that had previously received land or aid from the
government (The Economist, 2011; Brown, 2011). In addition to these, Sri Lankan
military is also gradually increasing its involvement in some of the activities that were
earlier reserved for the private sector such as air and sea transport and tourism (Bureau of
Economic, 2012).
74
3.4 FDI Policy Framework
BOI, which was established in 1992 as the successor to GCEC, is the principal
government authority responsible for investment in the country, with a focus on foreign
investment (Bureau of Economic, 2011). BOI has extensive authority of tax relief and
administrative discretion in all matters related to FDI (Pravakar, 2006). BOI grants these
concessions to firms fulfilling stipulated eligibility criteria on minimum investment,
exports and employment (Bureau of Economic, 2011). However, major investments in Sri
Lanka, such as infrastructure projects, require cabinet approval (Bureau of Economic,
2011).
Majority of sectors are open to foreign investment; however, Sri Lanka maintains a long
list of sectors in which FDI is completely restricted9 or only allowed with minority
stakes10
(Pravakar, 2006; Bureau of Economic, 2012). Furthermore, foreign investments
in several strategic sectors11
are regulated and subject to approval by the BOI and various
government agencies (Bureau of Economic, 2012). Nevertheless, Sri Lanka is relatively
more open to FDI than other south Asian countries (Pravakar, 2006; Bureau of Economic,
2011).
Until February 2013, foreign investors could purchase land from private sellers subject to
a 100% tax12
although the government, which owns about 80% of the land in Sri Lanka,
usually leased land on 50 year-term or on 99 year-term on case by case basis. (Bureau of
Economic, 2012). In February 2013, Sri Lankan government brought in new regulations
prohibiting sale of state owned and private owned land to foreigners (Reuters, 2013).
Foreign investors are allowed to access credit on the local market and to raise foreign
currency loans (Bureau of Economic, 2011).
9 Areas of non-bank money lending, pawn-brokering, retail trade with a capital investment of less than $1
million, and coastal fishing are completely restricted for foreign investments. 10
Foreign investment in growing and processing of primary commodities, production for export of goods
subject to international quotas, timber based industries using local timber, deep sea fishing, mass
communications, education, freight forwarding, and travel agency and shipping agency business are
partially restricted, i.e. foreign investors are allowed to invest up to 40% or a higher percentage if approval
of BOI is granted. 11
Air transportation; coastal shipping; large scale mechanized mining of gems; lotteries and manufacture of
military hardware, military vehicles and aircraft, dangerous drugs, alcohol, toxic, hazardous or carcinogenic
materials, currency and security documents 12
This tax is applicable if the foreign stake of a venture is not less than 25%

75
Sri Lanka has bilateral Investment Protection Agreements with 27 countries and bilateral
double tax avoidance agreements with 38 countries (Board of Investment Sri Lanka,
2012). The repatriation of capital and profits is guaranteed (Pravakar, 2006). Sri Lanka
has 12 free trade zones, 11 of which are export processing zones and one of which is an
industrial park (Figure 3-1).
Figure 3-1: Free Trade zones in Sri Lanka
Source: Board of Investment Sri Lanka, 2012
Free Trade
Zones in Sri
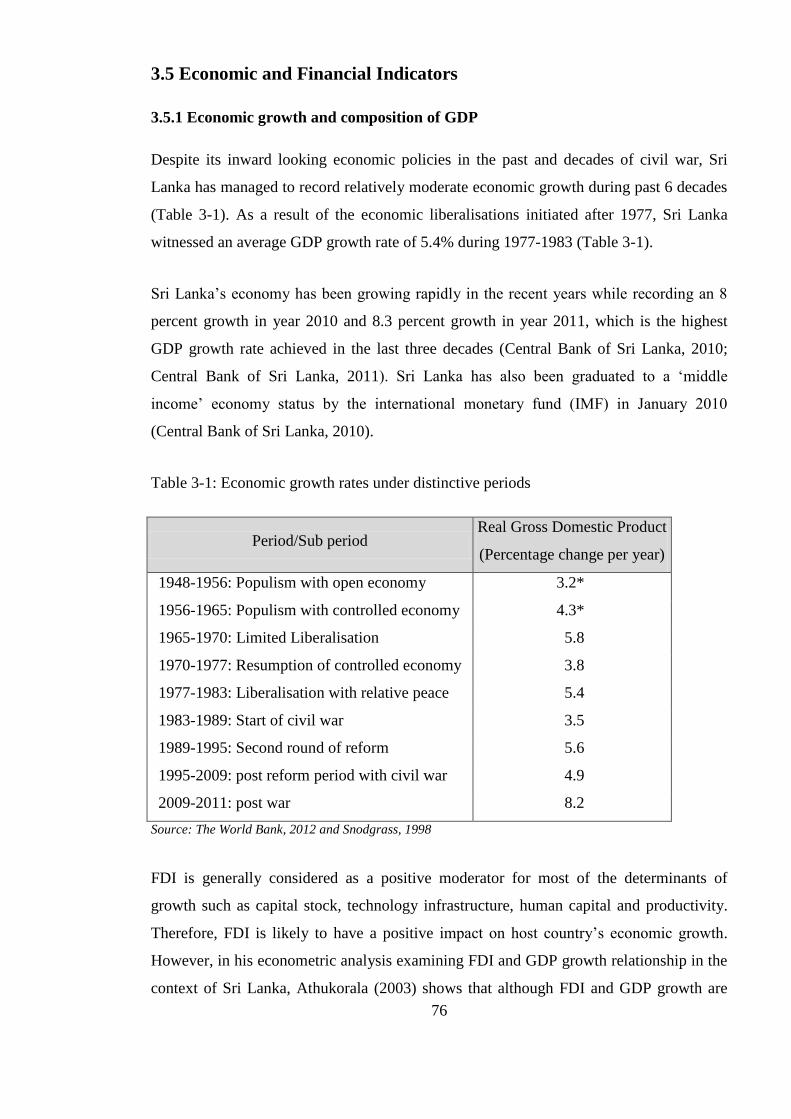
76
3.5 Economic and Financial Indicators
3.5.1 Economic growth and composition of GDP
Despite its inward looking economic policies in the past and decades of civil war, Sri
Lanka has managed to record relatively moderate economic growth during past 6 decades
(Table 3-1). As a result of the economic liberalisations initiated after 1977, Sri Lanka
witnessed an average GDP growth rate of 5.4% during 1977-1983 (Table 3-1).
Sri Lanka‘s economy has been growing rapidly in the recent years while recording an 8
percent growth in year 2010 and 8.3 percent growth in year 2011, which is the highest
GDP growth rate achieved in the last three decades (Central Bank of Sri Lanka, 2010;
Central Bank of Sri Lanka, 2011). Sri Lanka has also been graduated to a ‗middle
income‘ economy status by the international monetary fund (IMF) in January 2010
(Central Bank of Sri Lanka, 2010).
Table 3-1: Economic growth rates under distinctive periods
Period/Sub period Real Gross Domestic Product
(Percentage change per year)
1948-1956: Populism with open economy 3.2*
1956-1965: Populism with controlled economy 4.3*
1965-1970: Limited Liberalisation 5.8
1970-1977: Resumption of controlled economy 3.8
1977-1983: Liberalisation with relative peace 5.4
1983-1989: Start of civil war 3.5
1989-1995: Second round of reform 5.6
1995-2009: post reform period with civil war 4.9
2009-2011: post war 8.2
Source: The World Bank, 2012 and Snodgrass, 1998
FDI is generally considered as a positive moderator for most of the determinants of
growth such as capital stock, technology infrastructure, human capital and productivity.
Therefore, FDI is likely to have a positive impact on host country‘s economic growth.
However, in his econometric analysis examining FDI and GDP growth relationship in the
context of Sri Lanka, Athukorala (2003) shows that although FDI and GDP growth are
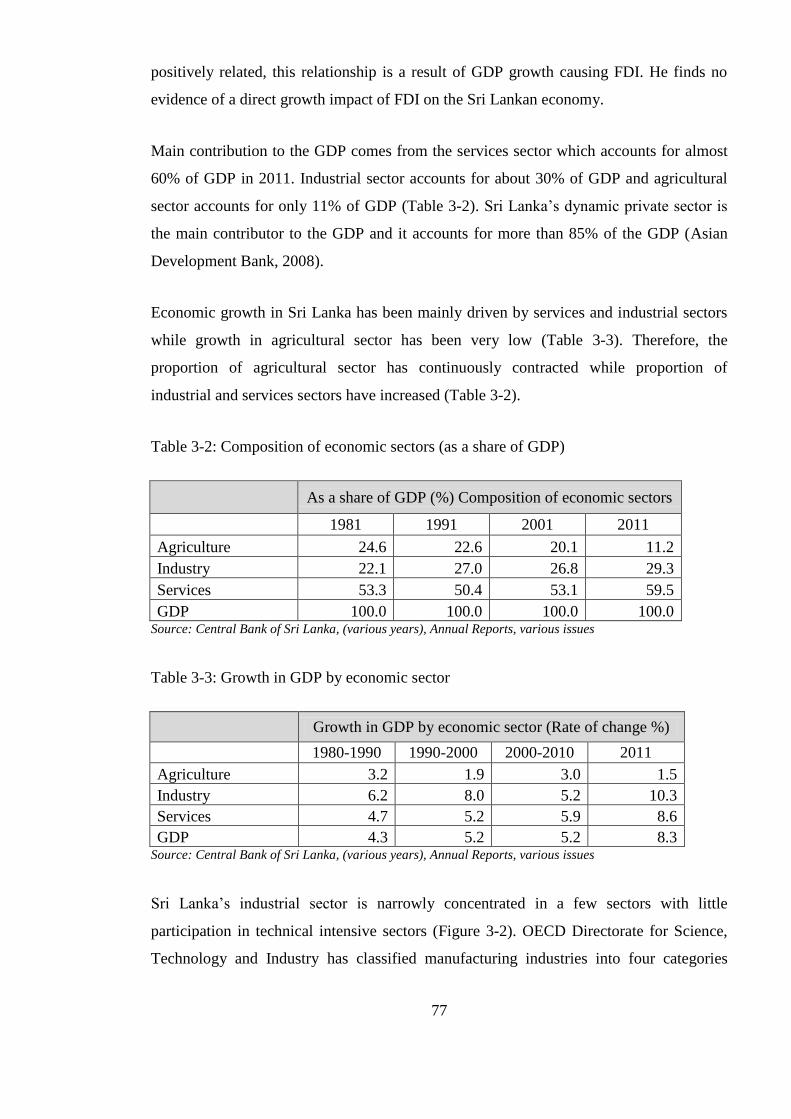
77
positively related, this relationship is a result of GDP growth causing FDI. He finds no
evidence of a direct growth impact of FDI on the Sri Lankan economy.
Main contribution to the GDP comes from the services sector which accounts for almost
60% of GDP in 2011. Industrial sector accounts for about 30% of GDP and agricultural
sector accounts for only 11% of GDP (Table 3-2). Sri Lanka‘s dynamic private sector is
the main contributor to the GDP and it accounts for more than 85% of the GDP (Asian
Development Bank, 2008).
Economic growth in Sri Lanka has been mainly driven by services and industrial sectors
while growth in agricultural sector has been very low (Table 3-3). Therefore, the
proportion of agricultural sector has continuously contracted while proportion of
industrial and services sectors have increased (Table 3-2).
Table 3-2: Composition of economic sectors (as a share of GDP)
As a share of GDP (%) Composition of economic sectors
1981 1991 2001 2011
Agriculture 24.6 22.6 20.1 11.2
Industry 22.1 27.0 26.8 29.3
Services 53.3 50.4 53.1 59.5
GDP 100.0 100.0 100.0 100.0 Source: Central Bank of Sri Lanka, (various years), Annual Reports, various issues
Table 3-3: Growth in GDP by economic sector
Growth in GDP by economic sector (Rate of change %)
1980-1990 1990-2000 2000-2010 2011
Agriculture 3.2 1.9 3.0 1.5
Industry 6.2 8.0 5.2 10.3
Services 4.7 5.2 5.9 8.6
GDP 4.3 5.2 5.2 8.3 Source: Central Bank of Sri Lanka, (various years), Annual Reports, various issues
Sri Lanka‘s industrial sector is narrowly concentrated in a few sectors with little
participation in technical intensive sectors (Figure 3-2). OECD Directorate for Science,
Technology and Industry has classified manufacturing industries into four categories
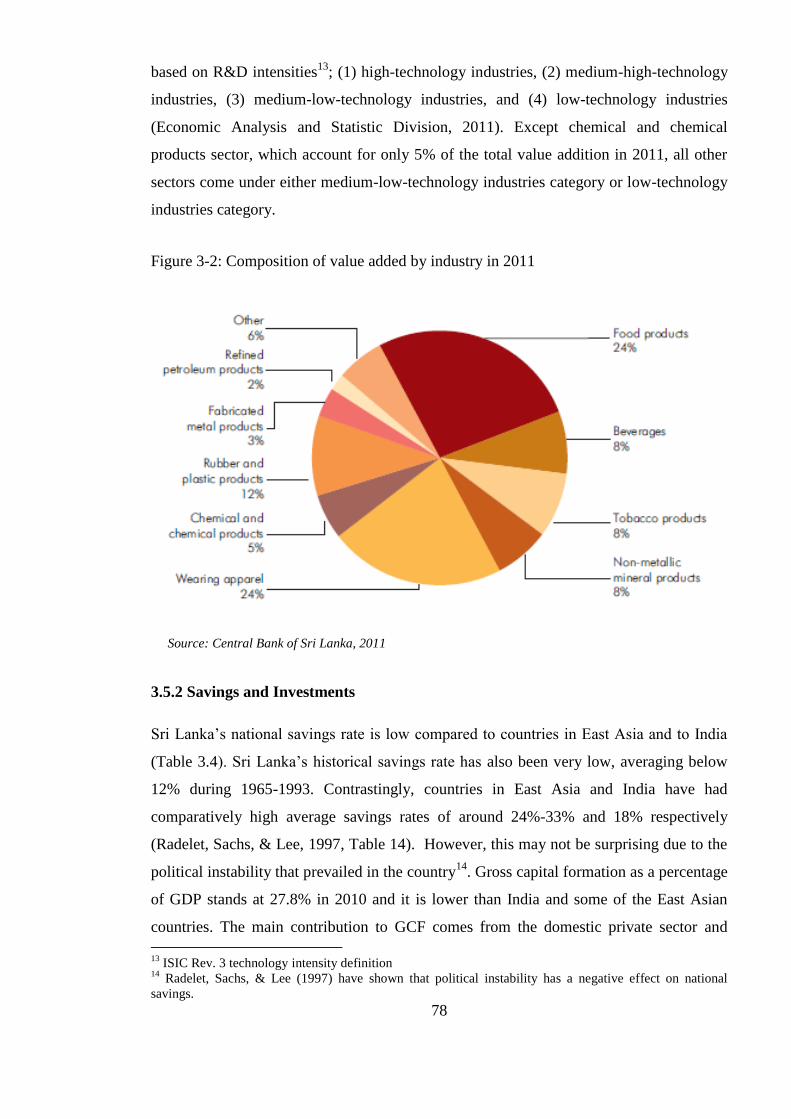
78
based on R&D intensities13
; (1) high-technology industries, (2) medium-high-technology
industries, (3) medium-low-technology industries, and (4) low-technology industries
(Economic Analysis and Statistic Division, 2011). Except chemical and chemical
products sector, which account for only 5% of the total value addition in 2011, all other
sectors come under either medium-low-technology industries category or low-technology
industries category.
Figure 3-2: Composition of value added by industry in 2011
Source: Central Bank of Sri Lanka, 2011
3.5.2 Savings and Investments
Sri Lanka‘s national savings rate is low compared to countries in East Asia and to India
(Table 3.4). Sri Lanka‘s historical savings rate has also been very low, averaging below
12% during 1965-1993. Contrastingly, countries in East Asia and India have had
comparatively high average savings rates of around 24%-33% and 18% respectively
(Radelet, Sachs, & Lee, 1997, Table 14). However, this may not be surprising due to the
political instability that prevailed in the country14
. Gross capital formation as a percentage
of GDP stands at 27.8% in 2010 and it is lower than India and some of the East Asian
countries. The main contribution to GCF comes from the domestic private sector and
13
ISIC Rev. 3 technology intensity definition 14
Radelet, Sachs, & Lee (1997) have shown that political instability has a negative effect on national
savings.
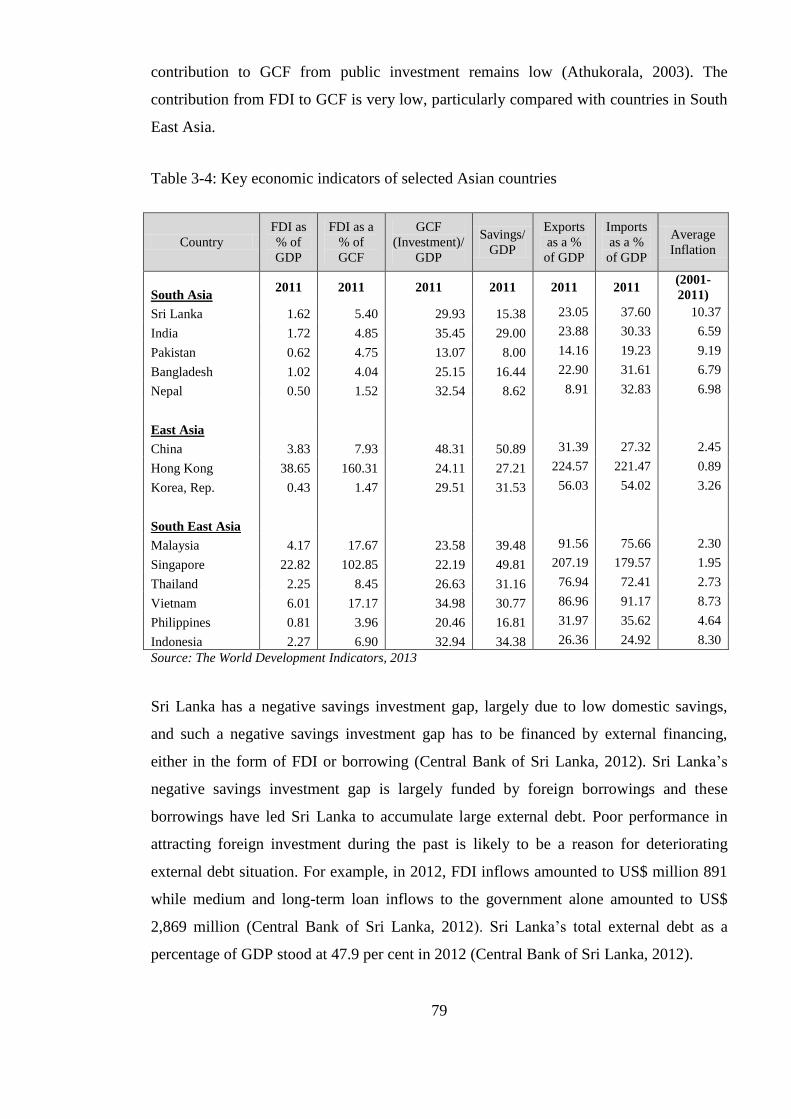
79
contribution to GCF from public investment remains low (Athukorala, 2003). The
contribution from FDI to GCF is very low, particularly compared with countries in South
East Asia.
Table 3-4: Key economic indicators of selected Asian countries
Country
FDI as
% of
GDP
FDI as a
% of
GCF
GCF
(Investment)/
GDP
Savings/
GDP
Exports
as a %
of GDP
Imports
as a %
of GDP
Average
Inflation
South Asia 2011 2011 2011 2011 2011 2011
(2001-
2011)
Sri Lanka 1.62 5.40 29.93 15.38 23.05 37.60 10.37
India 1.72 4.85 35.45 29.00 23.88 30.33 6.59
Pakistan 0.62 4.75 13.07 8.00 14.16 19.23 9.19
Bangladesh 1.02 4.04 25.15 16.44 22.90 31.61 6.79
Nepal 0.50 1.52 32.54 8.62 8.91 32.83 6.98
East Asia
China 3.83 7.93 48.31 50.89 31.39 27.32 2.45
Hong Kong 38.65 160.31 24.11 27.21 224.57 221.47 0.89
Korea, Rep. 0.43 1.47 29.51 31.53 56.03 54.02 3.26
South East Asia
Malaysia 4.17 17.67 23.58 39.48 91.56 75.66 2.30
Singapore 22.82 102.85 22.19 49.81 207.19 179.57 1.95
Thailand 2.25 8.45 26.63 31.16 76.94 72.41 2.73
Vietnam 6.01 17.17 34.98 30.77 86.96 91.17 8.73
Philippines 0.81 3.96 20.46 16.81 31.97 35.62 4.64
Indonesia 2.27 6.90 32.94 34.38 26.36 24.92 8.30
Source: The World Development Indicators, 2013
Sri Lanka has a negative savings investment gap, largely due to low domestic savings,
and such a negative savings investment gap has to be financed by external financing,
either in the form of FDI or borrowing (Central Bank of Sri Lanka, 2012). Sri Lanka‘s
negative savings investment gap is largely funded by foreign borrowings and these
borrowings have led Sri Lanka to accumulate large external debt. Poor performance in
attracting foreign investment during the past is likely to be a reason for deteriorating
external debt situation. For example, in 2012, FDI inflows amounted to US$ million 891
while medium and long-term loan inflows to the government alone amounted to US$
2,869 million (Central Bank of Sri Lanka, 2012). Sri Lanka‘s total external debt as a
percentage of GDP stood at 47.9 per cent in 2012 (Central Bank of Sri Lanka, 2012).
80
Inward FDI can directly contribute to the host country capital formation (Lipsey &
Sjöholm, 2004c). Contribution of FDI to capital formation is higher when it takes the
form of Greenfield investments compared to mergers and acquisitions (M&A), where
existing assets are simply transferred from domestic to foreign owners. Contribution of
M&A to capital formation will be limited to the extent that the proceeds of the sale of the
assets are not consumed (Herzer, 2012). FDI can also affect domestic capital formation
either positively or negatively (United Nations, 1992). FDI can complement domestic
investment through encouraging and facilitating investment in upstream and downstream
industries, particularly due to increased demand for MNCs inputs and price/quality
benefits of MNCs outputs (Faeth, 2005). FDI can negatively affect domestic capital
formation when MNCs drives out domestic firm through competition, undertake projects
that would otherwise be undertaken by domestic firms or compete with local firms for
scarce resources such as skilled labour and local finance (Herzer, 2012; Faeth, 2005).
Since FDI can either compliment or substitute domestic investment, the net effect of FDI
on overall capital formation in the host country is difficult to comprehend. Many
empirical studies have dedicated their effort to answer this inquiry. Although few studies
have found FDI to have a crowding out effect on domestic capital formation in some
countries (Agosin & Mayer, 2000), most studies have found FDI to have a crowding in
effect on domestic investment (Agosin & Mayer, 2000; Bosworth, Collins, & Reinhart,
1999; Konings, 2000; Borensztein, De Gregorio, & Lee, 1998). Due to these beneficial
effects of FDI, instead of relying on foreign borrowings, Sri Lanka needs to put more
attention on bringing in larger volumes of FDI in order to bridge its inherent savings
investments gap.
3.5.3 Human Development Indicators
Although Sri Lanka‘s economic performance indicators are not admirable, Sri Lanka is
well known for its impressive development indicators (Pradhan, 2001). Expanding the
social welfare system was seen as a convenient means to achieve political popularity
among masses, and possibly, for this reason, Sri Lanka‘s post-colonial governments had a
strong commitment to social development, often policy environment driven mainly by
wealth redistribution strategies (Abeyratne, 2008). Prior to economic reforms introduced
in 1977, Sri Lanka maintained extensive social welfare strategies, for example, providing
free education and health services, food rationing, subsidising agriculture, carrying out
land reforms and controlling the prices of essential food items (Semasinghe, 2011).
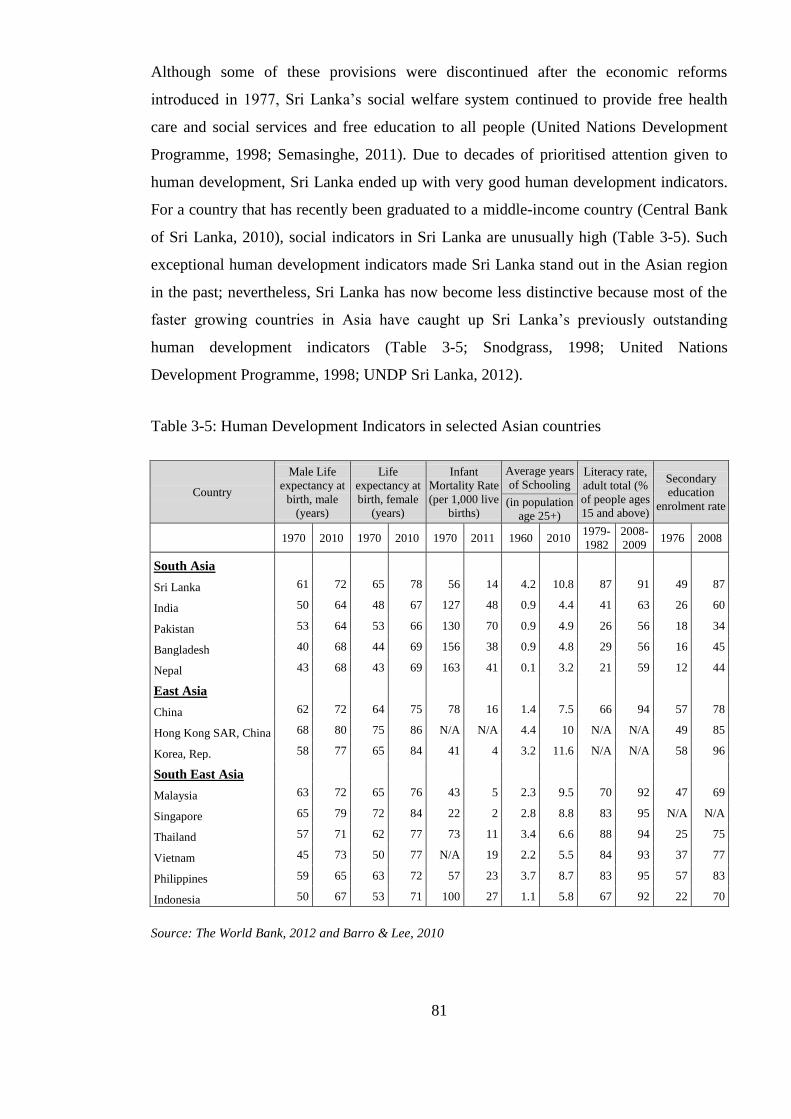
81
Although some of these provisions were discontinued after the economic reforms
introduced in 1977, Sri Lanka‘s social welfare system continued to provide free health
care and social services and free education to all people (United Nations Development
Programme, 1998; Semasinghe, 2011). Due to decades of prioritised attention given to
human development, Sri Lanka ended up with very good human development indicators.
For a country that has recently been graduated to a middle-income country (Central Bank
of Sri Lanka, 2010), social indicators in Sri Lanka are unusually high (Table 3-5). Such
exceptional human development indicators made Sri Lanka stand out in the Asian region
in the past; nevertheless, Sri Lanka has now become less distinctive because most of the
faster growing countries in Asia have caught up Sri Lanka‘s previously outstanding
human development indicators (Table 3-5; Snodgrass, 1998; United Nations
Development Programme, 1998; UNDP Sri Lanka, 2012).
Table 3-5: Human Development Indicators in selected Asian countries
Country
Male Life
expectancy at
birth, male
(years)
Life
expectancy at
birth, female
(years)
Infant
Mortality Rate
(per 1,000 live
births)
Average years
of Schooling Literacy rate,
adult total (%
of people ages
15 and above)
Secondary
education
enrolment rate (in population
age 25+)
1970 2010 1970 2010 1970 2011 1960 2010
1979-
1982
2008-
2009 1976 2008
South Asia
Sri Lanka 61 72 65 78 56 14 4.2 10.8 87 91 49 87
India 50 64 48 67 127 48 0.9 4.4 41 63 26 60
Pakistan 53 64 53 66 130 70 0.9 4.9 26 56 18 34
Bangladesh 40 68 44 69 156 38 0.9 4.8 29 56 16 45
Nepal 43 68 43 69 163 41 0.1 3.2 21 59 12 44
East Asia
China 62 72 64 75 78 16 1.4 7.5 66 94 57 78
Hong Kong SAR, China 68 80 75 86 N/A N/A 4.4 10 N/A N/A 49 85
Korea, Rep. 58 77 65 84 41 4 3.2 11.6 N/A N/A 58 96
South East Asia
Malaysia 63 72 65 76 43 5 2.3 9.5 70 92 47 69
Singapore 65 79 72 84 22 2 2.8 8.8 83 95 N/A N/A
Thailand 57 71 62 77 73 11 3.4 6.6 88 94 25 75
Vietnam 45 73 50 77 N/A 19 2.2 5.5 84 93 37 77
Philippines 59 65 63 72 57 23 3.7 8.7 83 95 57 83
Indonesia 50 67 53 71 100 27 1.1 5.8 67 92 22 70
Source: The World Bank, 2012 and Barro & Lee, 2010
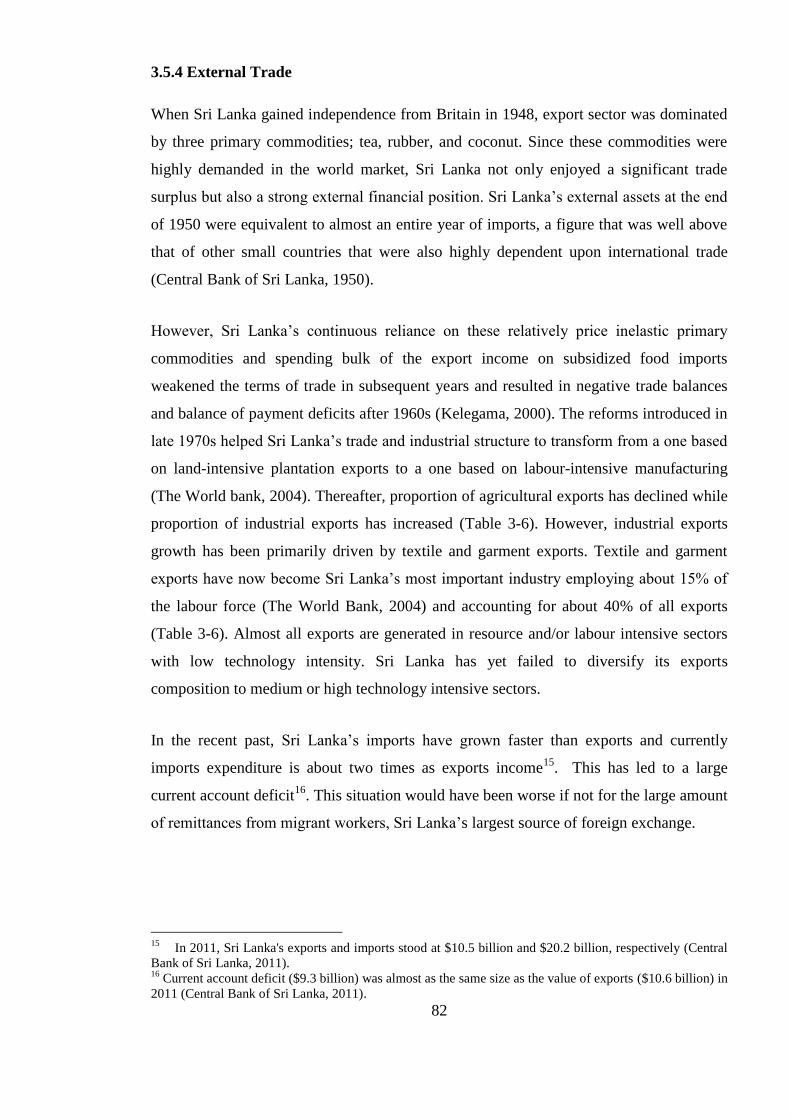
82
3.5.4 External Trade
When Sri Lanka gained independence from Britain in 1948, export sector was dominated
by three primary commodities; tea, rubber, and coconut. Since these commodities were
highly demanded in the world market, Sri Lanka not only enjoyed a significant trade
surplus but also a strong external financial position. Sri Lanka‘s external assets at the end
of 1950 were equivalent to almost an entire year of imports, a figure that was well above
that of other small countries that were also highly dependent upon international trade
(Central Bank of Sri Lanka, 1950).
However, Sri Lanka‘s continuous reliance on these relatively price inelastic primary
commodities and spending bulk of the export income on subsidized food imports
weakened the terms of trade in subsequent years and resulted in negative trade balances
and balance of payment deficits after 1960s (Kelegama, 2000). The reforms introduced in
late 1970s helped Sri Lanka‘s trade and industrial structure to transform from a one based
on land-intensive plantation exports to a one based on labour-intensive manufacturing
(The World bank, 2004). Thereafter, proportion of agricultural exports has declined while
proportion of industrial exports has increased (Table 3-6). However, industrial exports
growth has been primarily driven by textile and garment exports. Textile and garment
exports have now become Sri Lanka‘s most important industry employing about 15% of
the labour force (The World Bank, 2004) and accounting for about 40% of all exports
(Table 3-6). Almost all exports are generated in resource and/or labour intensive sectors
with low technology intensity. Sri Lanka has yet failed to diversify its exports
composition to medium or high technology intensive sectors.
In the recent past, Sri Lanka‘s imports have grown faster than exports and currently
imports expenditure is about two times as exports income15
. This has led to a large
current account deficit16
. This situation would have been worse if not for the large amount
of remittances from migrant workers, Sri Lanka‘s largest source of foreign exchange.
15
In 2011, Sri Lanka's exports and imports stood at $10.5 billion and $20.2 billion, respectively (Central
Bank of Sri Lanka, 2011). 16
Current account deficit ($9.3 billion) was almost as the same size as the value of exports ($10.6 billion) in
2011 (Central Bank of Sri Lanka, 2011).
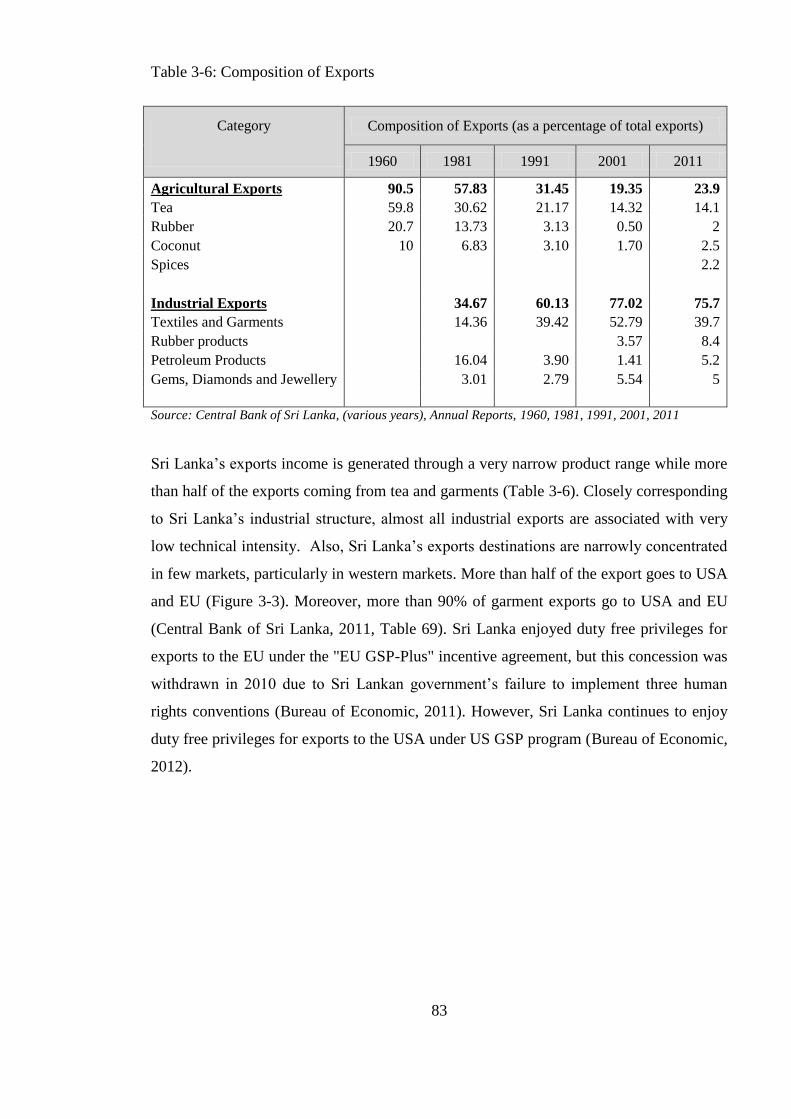
83
Table 3-6: Composition of Exports
Category Composition of Exports (as a percentage of total exports)
1960 1981 1991 2001 2011
Agricultural Exports 90.5 57.83 31.45 19.35 23.9
Tea 59.8 30.62 21.17 14.32 14.1
Rubber 20.7 13.73 3.13 0.50 2
Coconut 10 6.83 3.10 1.70 2.5
Spices
2.2
Industrial Exports
34.67 60.13 77.02 75.7
Textiles and Garments
14.36 39.42 52.79 39.7
Rubber products
3.57 8.4
Petroleum Products
16.04 3.90 1.41 5.2
Gems, Diamonds and Jewellery
3.01 2.79 5.54 5
Source: Central Bank of Sri Lanka, (various years), Annual Reports, 1960, 1981, 1991, 2001, 2011
Sri Lanka‘s exports income is generated through a very narrow product range while more
than half of the exports coming from tea and garments (Table 3-6). Closely corresponding
to Sri Lanka‘s industrial structure, almost all industrial exports are associated with very
low technical intensity. Also, Sri Lanka‘s exports destinations are narrowly concentrated
in few markets, particularly in western markets. More than half of the export goes to USA
and EU (Figure 3-3). Moreover, more than 90% of garment exports go to USA and EU
(Central Bank of Sri Lanka, 2011, Table 69). Sri Lanka enjoyed duty free privileges for
exports to the EU under the "EU GSP-Plus" incentive agreement, but this concession was
withdrawn in 2010 due to Sri Lankan government‘s failure to implement three human
rights conventions (Bureau of Economic, 2011). However, Sri Lanka continues to enjoy
duty free privileges for exports to the USA under US GSP program (Bureau of Economic,
2012).
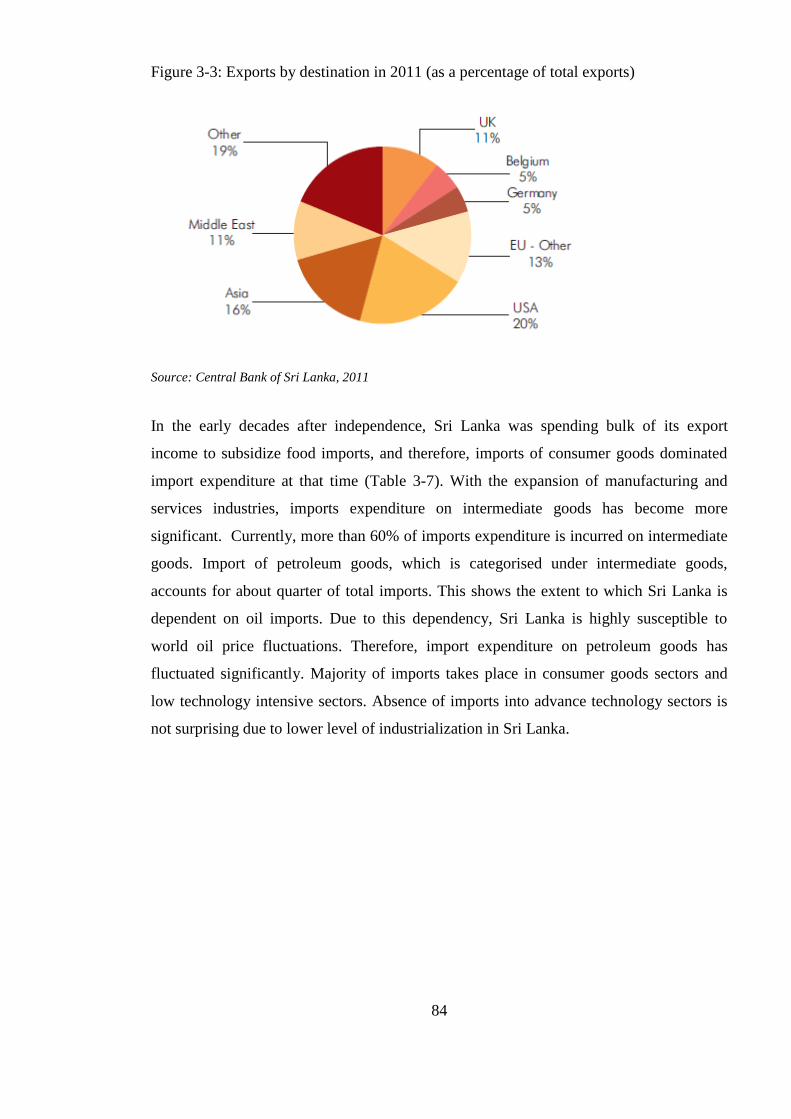
84
Figure 3-3: Exports by destination in 2011 (as a percentage of total exports)
Source: Central Bank of Sri Lanka, 2011
In the early decades after independence, Sri Lanka was spending bulk of its export
income to subsidize food imports, and therefore, imports of consumer goods dominated
import expenditure at that time (Table 3-7). With the expansion of manufacturing and
services industries, imports expenditure on intermediate goods has become more
significant. Currently, more than 60% of imports expenditure is incurred on intermediate
goods. Import of petroleum goods, which is categorised under intermediate goods,
accounts for about quarter of total imports. This shows the extent to which Sri Lanka is
dependent on oil imports. Due to this dependency, Sri Lanka is highly susceptible to
world oil price fluctuations. Therefore, import expenditure on petroleum goods has
fluctuated significantly. Majority of imports takes place in consumer goods sectors and
low technology intensive sectors. Absence of imports into advance technology sectors is
not surprising due to lower level of industrialization in Sri Lanka.
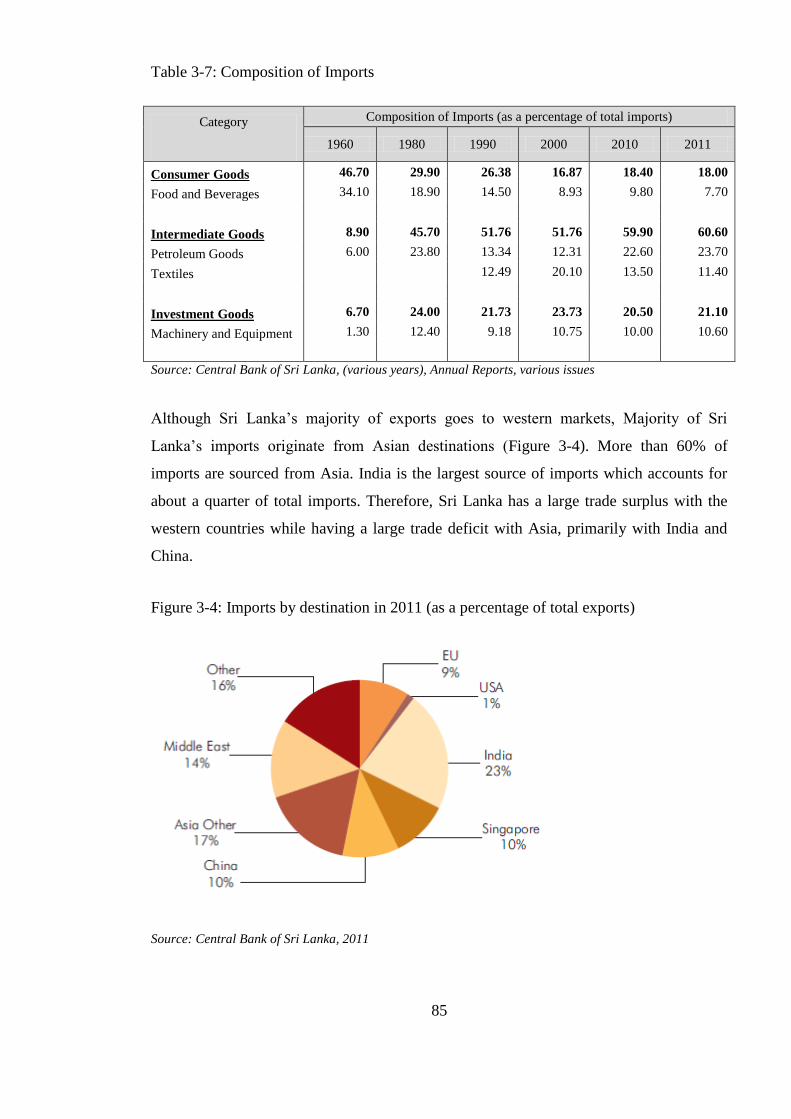
85
Table 3-7: Composition of Imports
Category Composition of Imports (as a percentage of total imports)
1960 1980 1990 2000 2010 2011
Consumer Goods 46.70 29.90 26.38 16.87 18.40 18.00
Food and Beverages 34.10 18.90 14.50 8.93 9.80 7.70
Intermediate Goods 8.90 45.70 51.76 51.76 59.90 60.60
Petroleum Goods 6.00 23.80 13.34 12.31 22.60 23.70
Textiles 12.49 20.10 13.50 11.40
Investment Goods 6.70 24.00 21.73 23.73 20.50 21.10
Machinery and Equipment 1.30 12.40 9.18 10.75 10.00 10.60
Source: Central Bank of Sri Lanka, (various years), Annual Reports, various issues
Although Sri Lanka‘s majority of exports goes to western markets, Majority of Sri
Lanka‘s imports originate from Asian destinations (Figure 3-4). More than 60% of
imports are sourced from Asia. India is the largest source of imports which accounts for
about a quarter of total imports. Therefore, Sri Lanka has a large trade surplus with the
western countries while having a large trade deficit with Asia, primarily with India and
China.
Figure 3-4: Imports by destination in 2011 (as a percentage of total exports)
Source: Central Bank of Sri Lanka, 2011
86
3.5.5 Fiscal and Monetary sectors
Sri Lanka‘s government faces budget constraints largely due to high public sector
expenditure, large interest payments on public debt and military expenditure17
. Sri
Lanka‘s bureaucracy is one of the largest in the Asian region, which employs 3.9% of the
total population as civil servants (The World Bank, 2004). Sri Lanka‘s large bureaucracy
is highly inefficient, and therefore, largely subsidised (Pradhan, 2001; The World Bank,
2004). State owned enterprises (SOEs) are active in many sectors including transport
(bus, railway, and aviation), utilities (electricity, water supply, petroleum imports and
retail, and telecommunications), TV and Radio broadcasting, newspaper publishing,
banking and insurance (Bureau of Economic, 2011). Most of the SOEs are inefficient,
overstaffed and loss making enterprises (The World Bank, 2004). More than 30% of
government‘s current expenditure is spent on salaries and wages for public sector
employees (Central Bank of Sri Lanka, 2011, table 6.3). Although Sri Lanka‘s
Government debt as a percentage of GDP is declining primarily because of fast economic
growth, it remains high at 78.5% (Central Bank of Sri Lanka, 2011). This has imposed a
severe interest burden on the government budget. Interest payment on government debt is
the single largest recurrent expenditure and currently consumes 35.4% of current
expenditure. Even though civil war ended in May 2009, military expenditure has not
declined after 2009. Currently defence expenditure consumes about 16% of current
expenditure (Central Bank of Sri Lanka, 2011). Interest payments, public sector wages
and defence expenditure taken together consume almost all of the tax revenues. As a
result, capital expenditure of Sri Lankan government is largely constraint, the primary
reason why Sri Lanka remains with a large infrastructure deficit.
Sri Lanka is notorious for high inflation rates in the past; however, inflation pressures
were relatively lower since the end of war (Table 3-8). Sri Lanka is also associated with
high interest rates, and as a result, businesses face high borrowing costs, and this has been
a main barrier for entrepreneurship in the country (Bureau of Economic, 2011). Low level
of domestic investment is also partly attributed to higher interest rates (Pradhan, 2001).
17
Fiscal deficit stood at 6.9% of GDP in 2011(Central Bank of Sri Lanka, 2011)
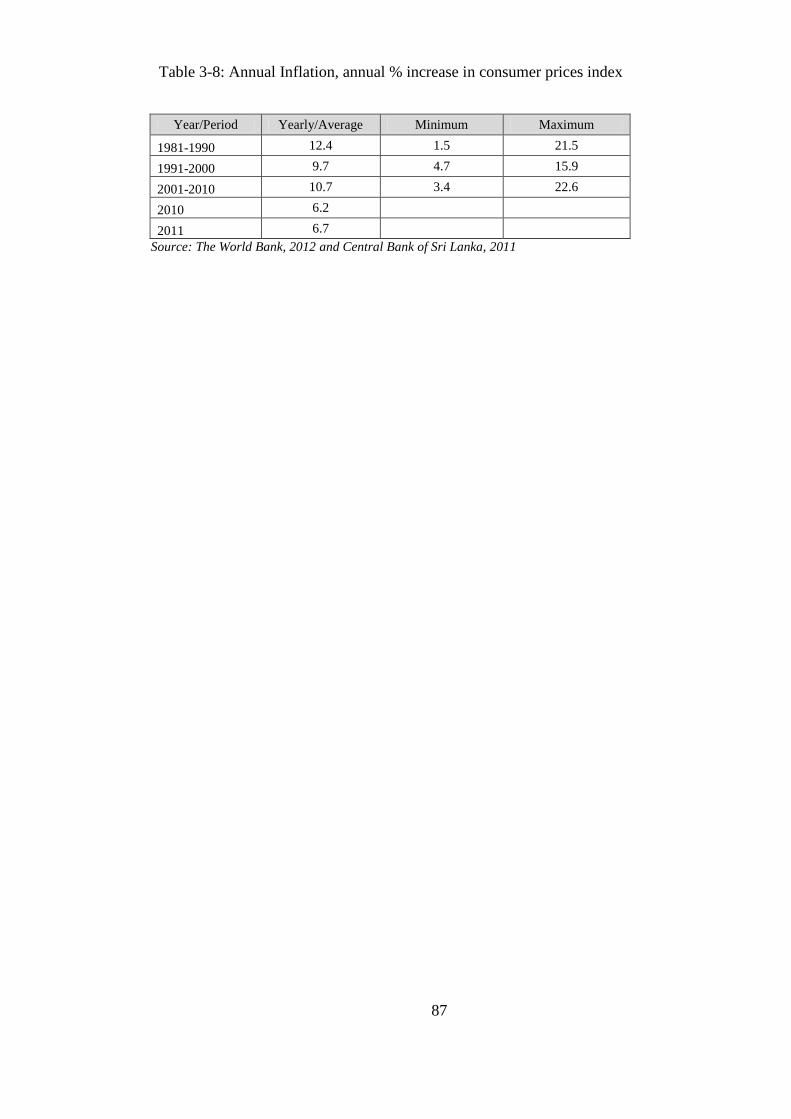
87
Table 3-8: Annual Inflation, annual % increase in consumer prices index
Year/Period Yearly/Average Minimum Maximum
1981-1990 12.4 1.5 21.5
1991-2000 9.7 4.7 15.9
2001-2010 10.7 3.4 22.6
2010 6.2
2011 6.7
Source: The World Bank, 2012 and Central Bank of Sri Lanka, 2011
88
3.6 Civil War and Internal Conflicts
Sri Lanka much like Singapore is home to two distinct ethnic communities - the Tamils
and Sinhalese. Unlike in Singapore, the two groups have not been able to forge unity in
promoting the interests of one and all. Sri Lanka has recently emerged from a long drawn
out internecine conflict between these two main ethnic communities in Sri Lanka.
Sri Lanka has faced several phases of violent internal conflict and each phase has
adversely affected the growth prospects of the country. Two major types of conflicts were
evident in the past. First is the civil war which was waged between the government of Sri
Lanka and a separatist guerrilla group representing Tamil minority (LTTE) who sought to
break off the north and east regions of the country as a separate sovereign state
(Abeysekera, 2011). Second is an armed revolution led by the radical Sinhalese youth-
based movement, the JVP, against the Sri Lankan government (Arunathilaka, Jayasuriya
& Kelegama, 2000).
After Sri Lanka gained independence from Britain in 1948, Sri Lankan politicians opt to
pro-Sinhalese nationalism in order to gain political gains by posturing and pandering the
majority Sinhalese (Petesch & Thalayasingam, 2010). This led to several legislative
changes that marginalised and discriminated the Tamil minority. In 1956, Sri Lankan
parliament passed the Sinhala only bill making the Sinhala language the only official
language (DeVotta, 2010; DeVotta, 2000). In addition to this, introduction of language-
based quota system for allocating university admissions in 197218
and the change in the
constitutional definition of Sri Lanka to a SinhalaBuddhist country are the major
legislative changes that increasingly marginalised the Tamil minority (Abeyratne, 2008;
Petesch & Thalayasingam, 2010). These ethnic discriminations led to a rise in Tamil
militarism in the mid-seventies, and these Tamil separatist movements developed to a
fully-fledged civil war between the Sri Lankan government and the LTTE (DeVotta,
2004; Abeyratne, 2008).
The civil war took place in four phases with cease fire arrangements in between these
phases; phase one during 1983-1988, phase two during 1990-1994, phase three during
1995-2002, and phase four during 2004-2009 (Arunatilake, Jayasuriya, & Kelegama,
18
Although this language based quota system was changed to a district- base quota system in 1974, there
has been a significant decrease in the share of Tamil students in Universities (Abeyratne, 2008).
89
2001; Duma, 2007; Various issues of Central Bank annual reports). In May 2009, Sri
Lanka‘s government declared victory over LTTE, bringing to an end to the 26 years of
brutal war, which was the bloodiest conflict in Asia (DeVotta, 2010). The JVP based
armed uprising took place in two occasions, in 1971 and in 1989-1990, and in both
occasions the uprisings were violently crushed by the incumbent government with the use
of armed forces (Arunatilake, Jayasuriya, & Kelegama, 2001). The on and off nature of
these conflicts can be represented in the timeline shown in Figure 3-5. Extent of variation
in conflict intensity can be comprehended by observing the number of total confirmed
fatalities (Figure 3-6).
Even though the civil war was largely confined to north and east (Asian Development
Bank, 2008), LTTE occasionally attacked other regions, particularly Colombo, the capital
of Sri Lanka. They targeted some of the key places, for example, Colombo International
Airport and Central Bank, and bombed Colombo‘s financial and business districts causing
extensive damage in terms of both casualties and property damage (Bureau of Economic,
2011).
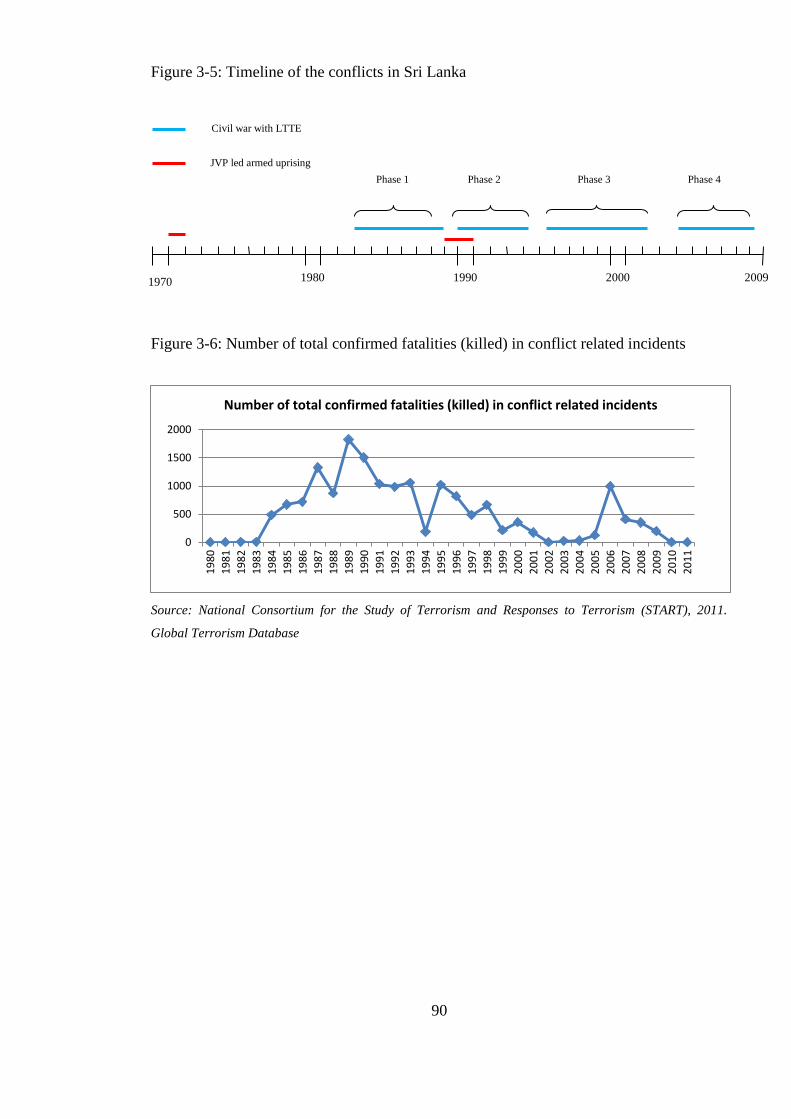
90
Figure 3-5: Timeline of the conflicts in Sri Lanka
Figure 3-6: Number of total confirmed fatalities (killed) in conflict related incidents
Source: National Consortium for the Study of Terrorism and Responses to Terrorism (START), 2011.
Global Terrorism Database
0
500
1000
1500
2000
19
80
19
81
19
82
19
83
19
84
19
85
19
86
19
87
19
88
19
89
19
90
19
91
19
92
19
93
19
94
19
95
19
96
19
97
19
98
19
99
20
00
20
01
20
02
20
03
20
04
20
05
20
06
20
07
20
08
20
09
20
10
20
11
Number of total confirmed fatalities (killed) in conflict related incidents
Civil war with LTTE
JVP led armed uprising Phase 4 Phase 3 Phase 2 Phase 1
2009 2000 1990 1980 1970
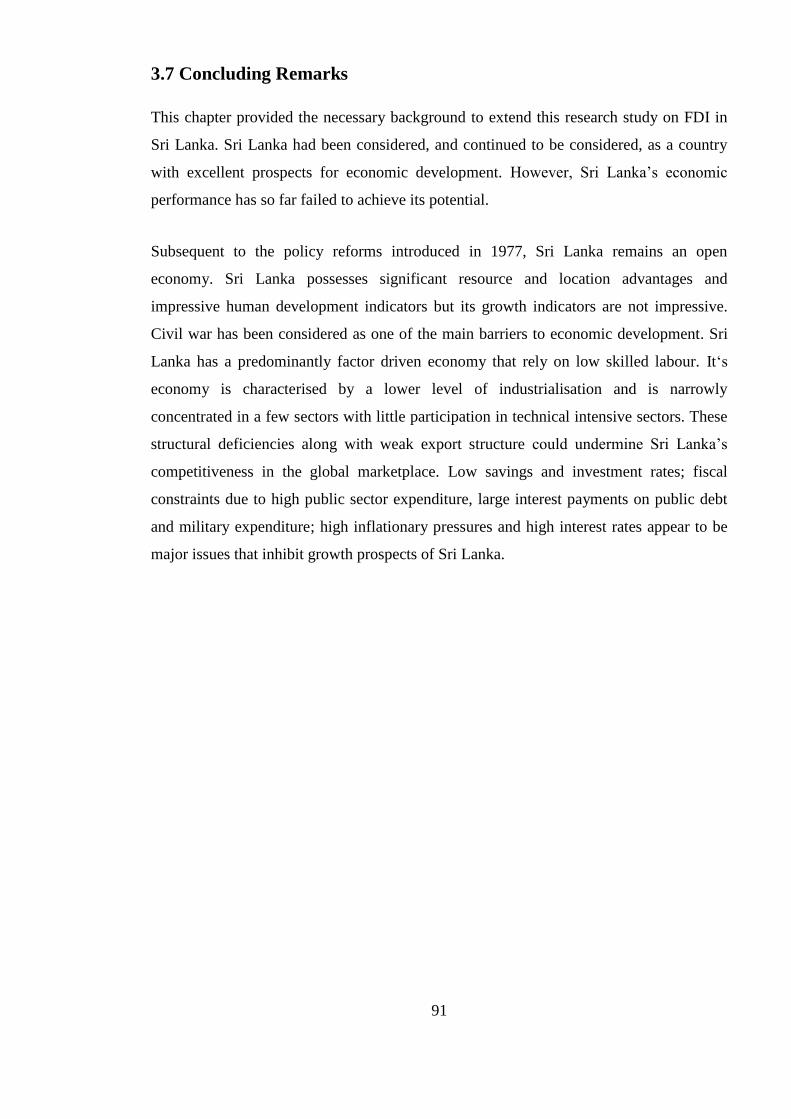
91
3.7 Concluding Remarks
This chapter provided the necessary background to extend this research study on FDI in
Sri Lanka. Sri Lanka had been considered, and continued to be considered, as a country
with excellent prospects for economic development. However, Sri Lanka‘s economic
performance has so far failed to achieve its potential.
Subsequent to the policy reforms introduced in 1977, Sri Lanka remains an open
economy. Sri Lanka possesses significant resource and location advantages and
impressive human development indicators but its growth indicators are not impressive.
Civil war has been considered as one of the main barriers to economic development. Sri
Lanka has a predominantly factor driven economy that rely on low skilled labour. It‗s
economy is characterised by a lower level of industrialisation and is narrowly
concentrated in a few sectors with little participation in technical intensive sectors. These
structural deficiencies along with weak export structure could undermine Sri Lanka‘s
competitiveness in the global marketplace. Low savings and investment rates; fiscal
constraints due to high public sector expenditure, large interest payments on public debt
and military expenditure; high inflationary pressures and high interest rates appear to be
major issues that inhibit growth prospects of Sri Lanka.

92
Chapter 4 : FDI in Sri Lanka
4.1. Introduction
The purpose of this chapter is to provide a context analysis of FDI and related aspects of
FDI in the context of Sri Lanka. Section 4.1 provides an overview of current status of FDI
in Sri Lanka. Dimensions of FDI in terms of distribution by sector and origin is explored
in section 4.2. Section 4.3 investigates the opportunities that Sri Lanka can offer to
potential foreign investors. Finally, section 4.4 presents a preliminary overview of factors
that can influence FDI flows to Sri Lanka.
93
4.2 FDI in Sri Lanka: an Overview
When Sri Lanka gained independence from Britain in 1948, Sri Lanka‘s economy was an
agricultural economy, largely based on plantation crops, tea, rubber, and coconut. The
plantation sector, much of which was owned by foreign investors, was nationalized in the
early 1970s (UNCTAD, 2004). Thereafter, foreign involvement in direct investment was
very limited until 1977s liberalisation initiatives. Although 1977s reforms and the
establishment of GCEC improved FDI inflows in 1980s, FDI did not surge until the
1990s. FDI inflows jumped in the 1990s mainly due to the ambitious privatisation
programme (Table 4 1). Out of the total privatisation proceeds realised during 1989-2005,
59% was financed by foreign investors (Central Bank of Sri Lanka, 2007, table 116).
With the relaxation of several impediments to FDI and establishment of the Greater
Colombo Economic Commission (GCEC) in 1978, FDI started picking up after 1978.
GCEC was responsible for establishing several export processing zones (EPZ‘s) and
formulating and implementing an incentives package for foreign investments (The World
bank, 2007). However, GCEC‘s mandate was confined to the outskirts of Colombo. In
1992, the GCEC was reconstituted as the Board of Investment of Sri Lanka (BOI) with its
mandate extended to the entire island (Board of Investment of Sri Lanka, 2012).
Although FDI inflows have considerably increased in the last two decades relative to pre-
liberalisation era, Sri Lanka‘s performance in generating FDI has been low by the
standards of the best performers in Asia (Table 4-2). For example, Malaysia, a country
with a population comparable to that of Sri Lanka, has attracted 20 times as much FDI as
Sri Lanka (Table 4-2).
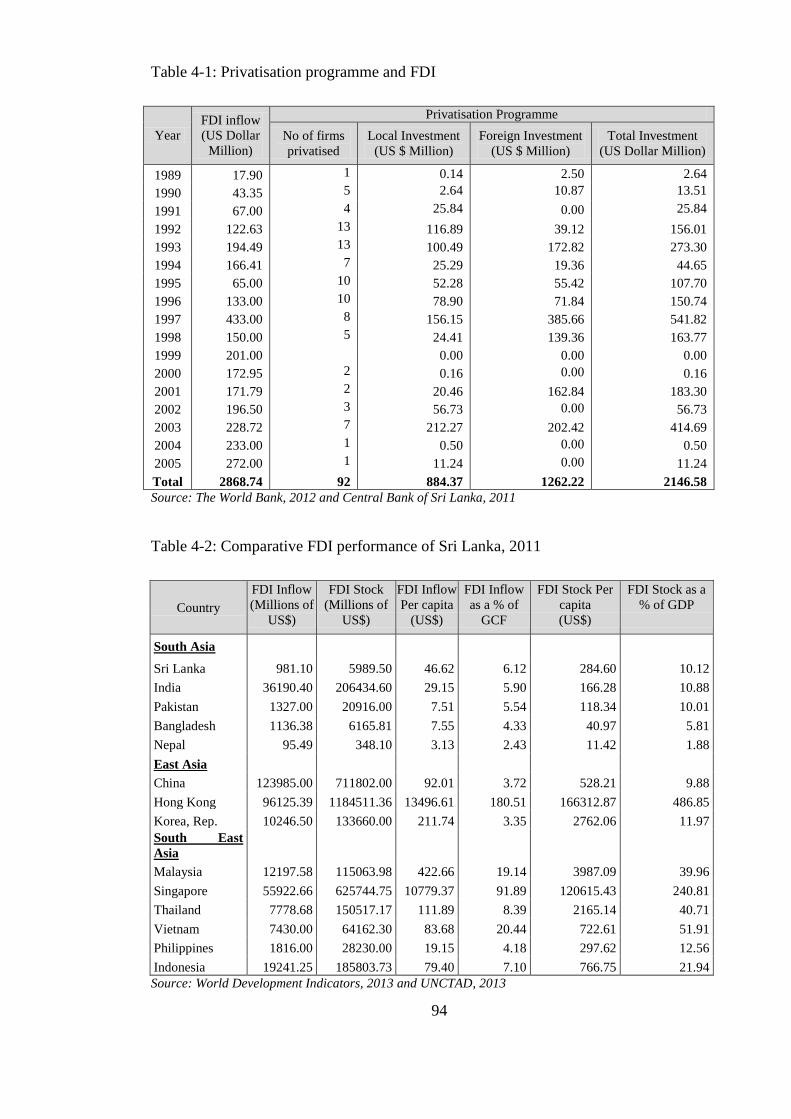
94
Table 4-1: Privatisation programme and FDI
Year
FDI inflow
(US Dollar
Million)
Privatisation Programme
No of firms
privatised
Local Investment
(US $ Million)
Foreign Investment
(US $ Million)
Total Investment
(US Dollar Million)
1989 17.90 1 0.14 2.50 2.64
1990 43.35 5 2.64 10.87 13.51
1991 67.00 4 25.84 0.00 25.84
1992 122.63 13 116.89 39.12 156.01
1993 194.49 13 100.49 172.82 273.30
1994 166.41 7 25.29 19.36 44.65
1995 65.00 10 52.28 55.42 107.70
1996 133.00 10 78.90 71.84 150.74
1997 433.00 8 156.15 385.66 541.82
1998 150.00 5 24.41 139.36 163.77
1999 201.00
0.00 0.00 0.00
2000 172.95 2 0.16 0.00 0.16
2001 171.79 2 20.46 162.84 183.30
2002 196.50 3 56.73 0.00 56.73
2003 228.72 7 212.27 202.42 414.69
2004 233.00 1 0.50 0.00 0.50
2005 272.00 1 11.24 0.00 11.24
Total 2868.74 92 884.37 1262.22 2146.58
Source: The World Bank, 2012 and Central Bank of Sri Lanka, 2011
Table 4-2: Comparative FDI performance of Sri Lanka, 2011
Country
FDI Inflow
(Millions of
US$)
FDI Stock
(Millions of
US$)
FDI Inflow
Per capita
(US$)
FDI Inflow
as a % of
GCF
FDI Stock Per
capita
(US$)
FDI Stock as a
% of GDP
South Asia
Sri Lanka 981.10 5989.50 46.62 6.12 284.60 10.12
India 36190.40 206434.60 29.15 5.90 166.28 10.88
Pakistan 1327.00 20916.00 7.51 5.54 118.34 10.01
Bangladesh 1136.38 6165.81 7.55 4.33 40.97 5.81
Nepal 95.49 348.10 3.13 2.43 11.42 1.88
East Asia
China 123985.00 711802.00 92.01 3.72 528.21 9.88
Hong Kong 96125.39 1184511.36 13496.61 180.51 166312.87 486.85
Korea, Rep. 10246.50 133660.00 211.74 3.35 2762.06 11.97
South East
Asia
Malaysia 12197.58 115063.98 422.66 19.14 3987.09 39.96
Singapore 55922.66 625744.75 10779.37 91.89 120615.43 240.81
Thailand 7778.68 150517.17 111.89 8.39 2165.14 40.71
Vietnam 7430.00 64162.30 83.68 20.44 722.61 51.91
Philippines 1816.00 28230.00 19.15 4.18 297.62 12.56
Indonesia 19241.25 185803.73 79.40 7.10 766.75 21.94
Source: World Development Indicators, 2013 and UNCTAD, 2013
95
4.3 Dimensions of FDI: Distribution by Sector and Origin
Until plantation sector was nationalised in early 1970s, a significant proportion of the
plantation sector was owned by foreign investors. Thereafter, foreign involvement in
direct investment was very limited until 1977s liberalisation initiatives. The reforms
introduced in late 1970s helped Sri Lanka‘s trade and industrial structure to transform
from a one based on land-intensive plantation exports to a one based on labour-intensive
manufacturing (The World bank, 2004). Also, post-reform trade and investment policies
strongly promoted export oriented industries. As a result, FDI inflows started flowing to
manufacturing industries and by 1983 more than 90% of FDI stocks were concentrated in
manufacturing industries (Table 4-3). Up to 1980s, services sector did not attract much
FDI. FDI in service sector started picking up in 1990s largely due to privatisation
programme. Thereafter, FDI in services became more prominent than FDI in
manufacturing. Currently FDI in services accounts for more than 70% of total FDI stocks
while FDI in manufacturing has shrunk to less than 30% of total FDI stocks (Table 4-3).
Majority of manufacturing FDI has taken place in textile and garments related sector,
which accounts for about one third of total realised manufacturing FDI stocks. However,
this sector‘s prominence in attracting FDI has shrunk from its dominant position in 1980s
and 1990s (Table 4-3). Communication sector had attracted over 50% of service FDI by
early 2000s (UNCTAD, 2004) and have continued to dominate service FDI to date by
attracting over 50% of service FDI during 2005-2010 (Table 4-4). However, tourism
sector has recently started attracting considerable attention from foreign investors, largely
due to the end of war. Hotels and tourism sector, surpassing the conventionally dominant
telecommunication sector, attracted the largest share of service FDI in 2011 (Central
Bank of Sri Lanka, 2011). Since nationalisation of plantation sector in early 1970s,
agricultural sector has failed to attract attention from foreign investors.
Similar to Sri Lanka‘s industrial structure, FDI in Sri Lanka is also narrowly concentrated
in a few sectors with little participation in technical intensive sectors (Figure 4-2). Almost
96
all the FDI19
has taken place in either medium-low-technology industries or low-
technology industries20
.
19
Only exception is the chemical sector, which is categorised as a medium-high-technology industry.
However, FDI in Chemical sector is not reported separately and it is reported with FDI in Petroleum, Coal,
Rubber and Plastic Products, and therefore, FDI in chemical sector is unlikely to be substantial. 20
As per the ISIC Rev. 3 technology intensity definition (Economic Analysis and Statistic Division, 2011)
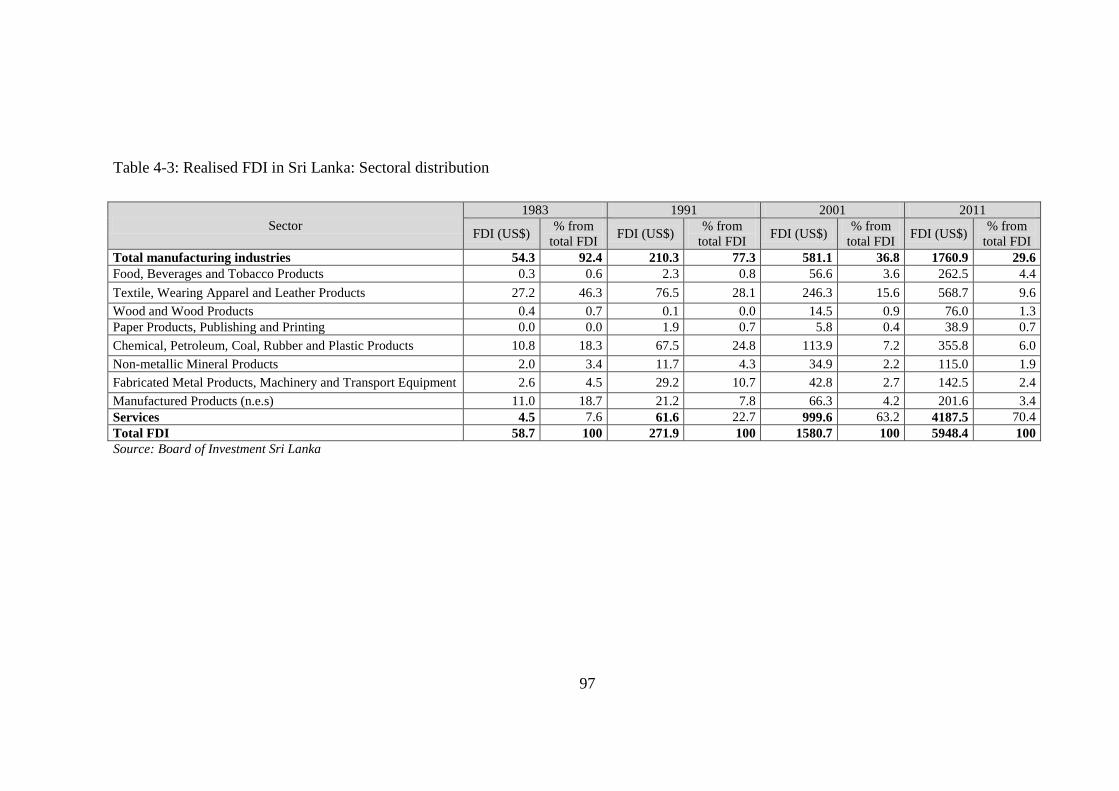
97
Table 4-3: Realised FDI in Sri Lanka: Sectoral distribution
Sector
1983 1991 2001 2011
FDI (US$) % from
total FDI FDI (US$)
% from
total FDI FDI (US$)
% from
total FDI FDI (US$)
% from
total FDI
Total manufacturing industries 54.3 92.4 210.3 77.3 581.1 36.8 1760.9 29.6
Food, Beverages and Tobacco Products 0.3 0.6 2.3 0.8 56.6 3.6 262.5 4.4
Textile, Wearing Apparel and Leather Products 27.2 46.3 76.5 28.1 246.3 15.6 568.7 9.6
Wood and Wood Products 0.4 0.7 0.1 0.0 14.5 0.9 76.0 1.3
Paper Products, Publishing and Printing 0.0 0.0 1.9 0.7 5.8 0.4 38.9 0.7
Chemical, Petroleum, Coal, Rubber and Plastic Products 10.8 18.3 67.5 24.8 113.9 7.2 355.8 6.0
Non-metallic Mineral Products 2.0 3.4 11.7 4.3 34.9 2.2 115.0 1.9
Fabricated Metal Products, Machinery and Transport Equipment 2.6 4.5 29.2 10.7 42.8 2.7 142.5 2.4
Manufactured Products (n.e.s) 11.0 18.7 21.2 7.8 66.3 4.2 201.6 3.4
Services 4.5 7.6 61.6 22.7 999.6 63.2 4187.5 70.4
Total FDI 58.7 100 271.9 100 1580.7 100 5948.4 100
Source: Board of Investment Sri Lanka
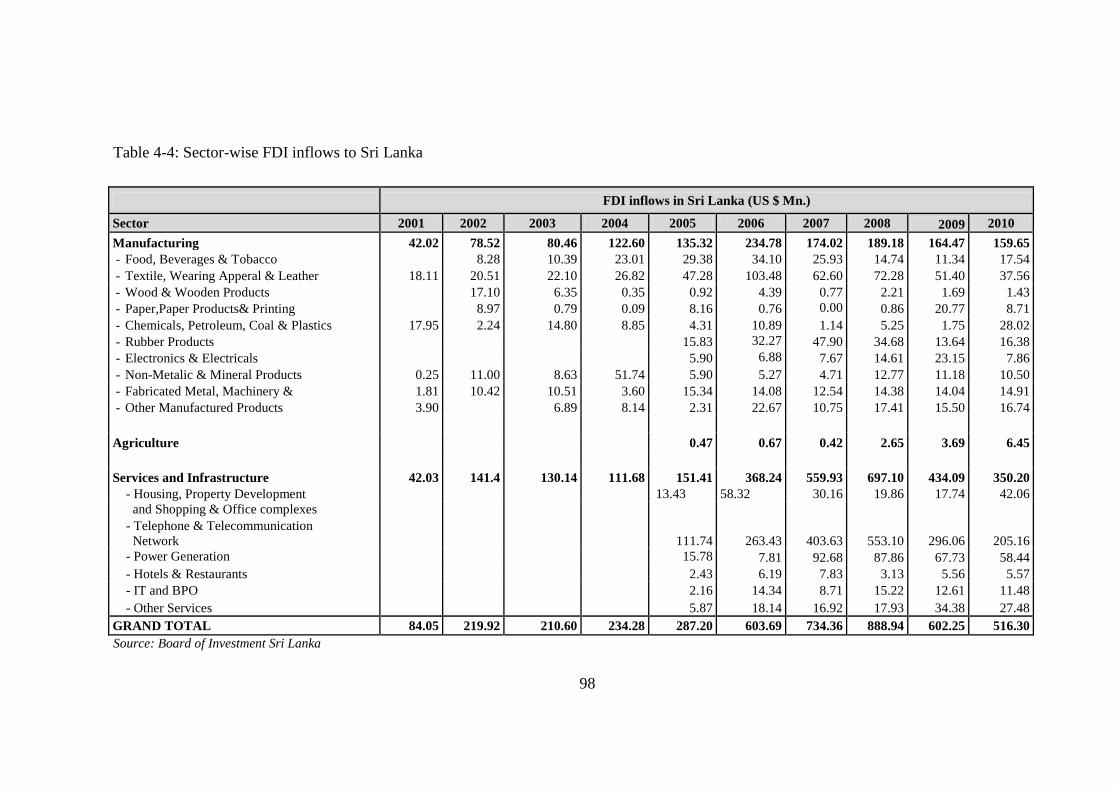
98
Table 4-4: Sector-wise FDI inflows to Sri Lanka
FDI inflows in Sri Lanka (US $ Mn.)
Sector 2001 2002 2003 2004 2005 2006 2007 2008 2009 2010
Manufacturing 42.02 78.52 80.46 122.60 135.32 234.78 174.02 189.18 164.47 159.65
- Food, Beverages & Tobacco 8.28 10.39 23.01 29.38 34.10 25.93 14.74 11.34 17.54
- Textile, Wearing Apperal & Leather 18.11 20.51 22.10 26.82 47.28 103.48 62.60 72.28 51.40 37.56
- Wood & Wooden Products 17.10 6.35 0.35 0.92 4.39 0.77 2.21 1.69 1.43
- Paper,Paper Products& Printing 8.97 0.79 0.09 8.16 0.76 0.00 0.86 20.77 8.71
- Chemicals, Petroleum, Coal & Plastics 17.95 2.24 14.80 8.85 4.31 10.89 1.14 5.25 1.75 28.02
- Rubber Products 15.83 32.27 47.90 34.68 13.64 16.38
- Electronics & Electricals 5.90 6.88 7.67 14.61 23.15 7.86
- Non-Metalic & Mineral Products 0.25 11.00 8.63 51.74 5.90 5.27 4.71 12.77 11.18 10.50
- Fabricated Metal, Machinery & 1.81 10.42 10.51 3.60 15.34 14.08 12.54 14.38 14.04 14.91
- Other Manufactured Products 3.90 6.89 8.14 2.31 22.67 10.75 17.41 15.50 16.74
Agriculture 0.47 0.67 0.42 2.65 3.69 6.45
Services and Infrastructure 42.03 141.4 130.14 111.68 151.41 368.24 559.93 697.10 434.09 350.20
- Housing, Property Development 13.43 58.32 30.16 19.86 17.74 42.06
and Shopping & Office complexes
- Telephone & Telecommunication
Network 111.74 263.43 403.63 553.10 296.06 205.16
- Power Generation 15.78 7.81 92.68 87.86 67.73 58.44
- Hotels & Restaurants 2.43 6.19 7.83 3.13 5.56 5.57
- IT and BPO 2.16 14.34 8.71 15.22 12.61 11.48
- Other Services 5.87 18.14 16.92 17.93 34.38 27.48
GRAND TOTAL 84.05 219.92 210.60 234.28 287.20 603.69 734.36 888.94 602.25 516.30
Source: Board of Investment Sri Lanka
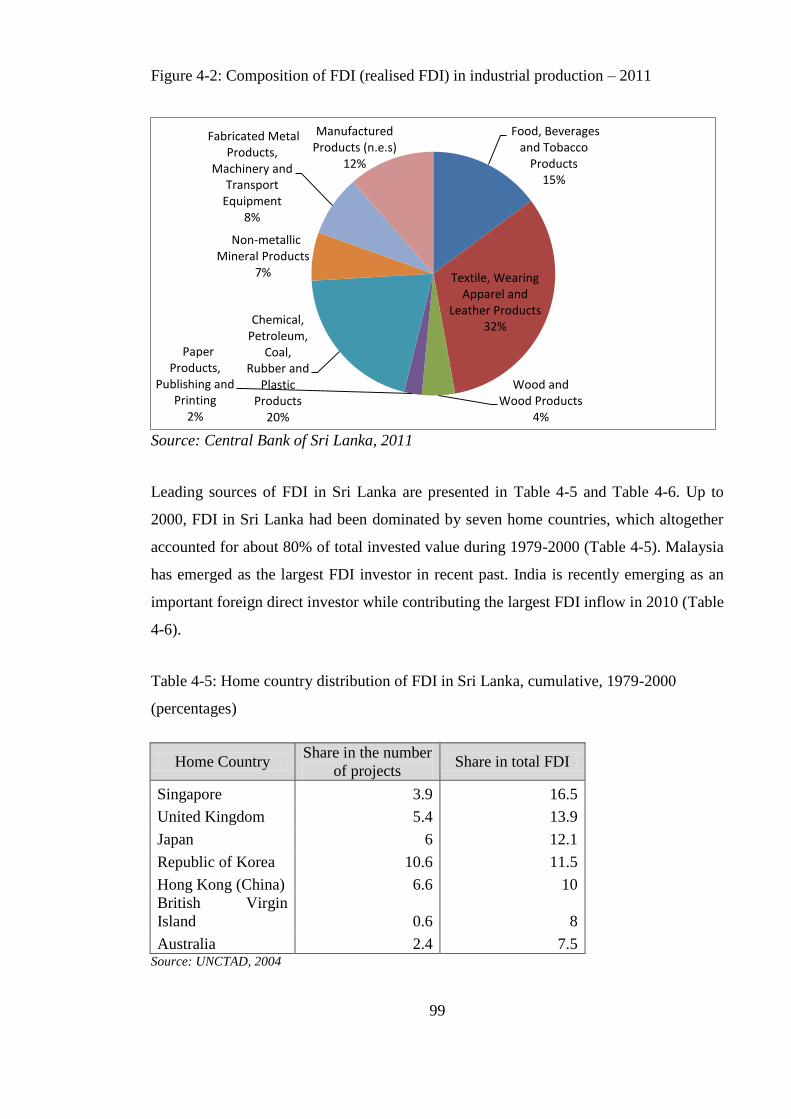
99
Figure 4-2: Composition of FDI (realised FDI) in industrial production – 2011
Source: Central Bank of Sri Lanka, 2011
Leading sources of FDI in Sri Lanka are presented in Table 4-5 and Table 4-6. Up to
2000, FDI in Sri Lanka had been dominated by seven home countries, which altogether
accounted for about 80% of total invested value during 1979-2000 (Table 4-5). Malaysia
has emerged as the largest FDI investor in recent past. India is recently emerging as an
important foreign direct investor while contributing the largest FDI inflow in 2010 (Table
4-6).
Table 4-5: Home country distribution of FDI in Sri Lanka, cumulative, 1979-2000
(percentages)
Home Country Share in the number
of projects Share in total FDI
Singapore 3.9 16.5
United Kingdom 5.4 13.9
Japan 6 12.1
Republic of Korea 10.6 11.5
Hong Kong (China) 6.6 10
British Virgin
Island 0.6 8
Australia 2.4 7.5 Source: UNCTAD, 2004
Food, Beverages and Tobacco
Products 15%
Textile, Wearing Apparel and
Leather Products 32%
Wood and Wood Products
4%
Paper Products,
Publishing and Printing
2%
Chemical, Petroleum,
Coal, Rubber and
Plastic Products
20%
Non-metallic Mineral Products
7%
Fabricated Metal Products,
Machinery and Transport
Equipment 8%
Manufactured Products (n.e.s)
12%
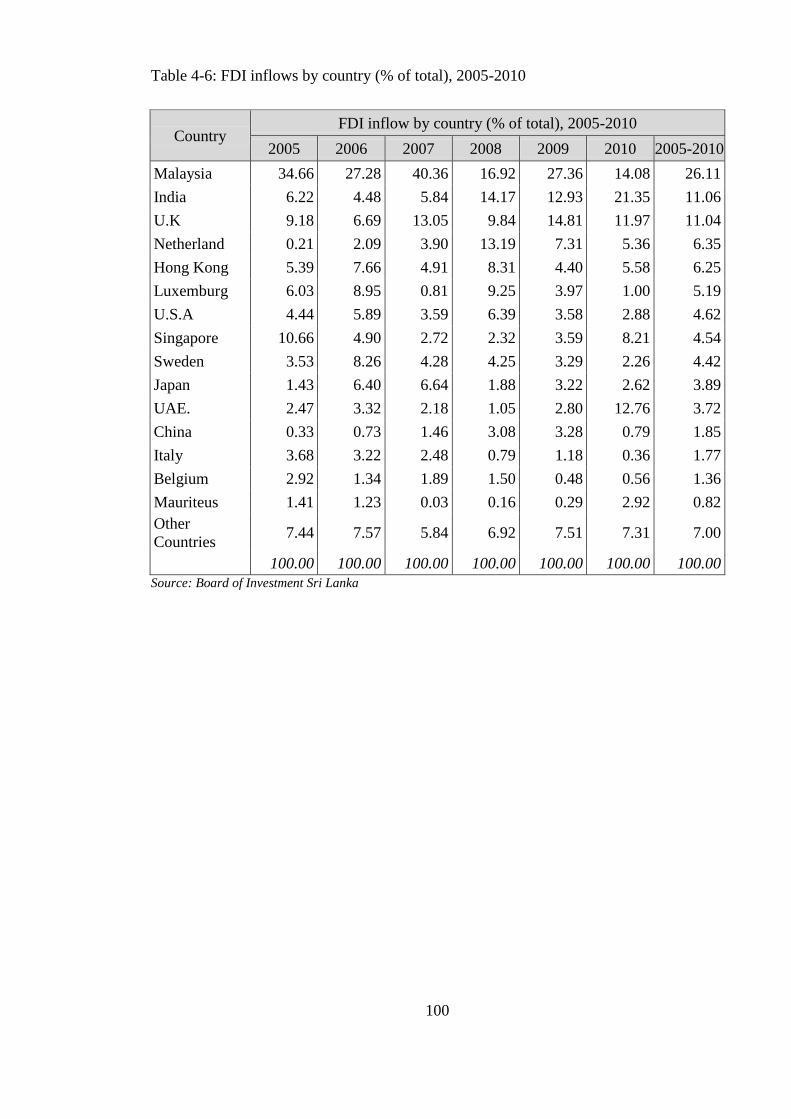
100
Table 4-6: FDI inflows by country (% of total), 2005-2010
Country FDI inflow by country (% of total), 2005-2010
2005 2006 2007 2008 2009 2010 2005-2010
Malaysia 34.66 27.28 40.36 16.92 27.36 14.08 26.11
India 6.22 4.48 5.84 14.17 12.93 21.35 11.06
U.K 9.18 6.69 13.05 9.84 14.81 11.97 11.04
Netherland 0.21 2.09 3.90 13.19 7.31 5.36 6.35
Hong Kong 5.39 7.66 4.91 8.31 4.40 5.58 6.25
Luxemburg 6.03 8.95 0.81 9.25 3.97 1.00 5.19
U.S.A 4.44 5.89 3.59 6.39 3.58 2.88 4.62
Singapore 10.66 4.90 2.72 2.32 3.59 8.21 4.54
Sweden 3.53 8.26 4.28 4.25 3.29 2.26 4.42
Japan 1.43 6.40 6.64 1.88 3.22 2.62 3.89
UAE. 2.47 3.32 2.18 1.05 2.80 12.76 3.72
China 0.33 0.73 1.46 3.08 3.28 0.79 1.85
Italy 3.68 3.22 2.48 0.79 1.18 0.36 1.77
Belgium 2.92 1.34 1.89 1.50 0.48 0.56 1.36
Mauriteus 1.41 1.23 0.03 0.16 0.29 2.92 0.82
Other
Countries 7.44 7.57 5.84 6.92 7.51 7.31 7.00
100.00 100.00 100.00 100.00 100.00 100.00 100.00
Source: Board of Investment Sri Lanka
101
4.4 FDI Potential in Sri Lanka
This section will provide an analysis of Sri Lanka‘s potential in attracting various FDI,
may it be resource-seeking, market-seeking or efficiency seeking. As reviewed in the
previous chapter, Sri Lanka is a country with abundant resources in the form of national
resource endowments and human capital and a strategic geographical location. However,
it is also weak in terms of level of industrialisation and the extent of participation in
technical intensive sectors. These salient features have significant impact on what type of
FDI the country can attract, subsequently, the impact of FDI on the economy.
4.4.1 Resource-seeking FDI
Global FDI in the early 19th
century was dominated by resource seeking investments in
the primary sector and this trend was reversed in the latter part of the century where
primary sector played a minor role in inward FDI. But, recently the importance of
resource seeking investment in the primary sector has increased considerably in the
global context, partly contributed by resource seeking investments from emerging
economies such as China and India (Dunning & Lundan, 2008).
Sri Lanka‘s rich natural resource base offers ample resource seeking opportunities to
MNCs; Sri Lanka‘s export performance in agricultural and mineral products (Central
Bank of Sri Lanka, 2010) and recent discovery of oil drilling prospects demonstrates the
degree of resource abundance in Sri Lanka. The large extent of physical resource seeking
investments that have been recently undertaken by Chinese and Indian MNCs in Africa
(Dunning & Lundan, 2008) should be of great interest to Sri Lanka as Sri Lanka might
have an opportunity to attract physical resource seeking investments from its
neighbouring giants. Some FDI in services can also depend on location bound resources,
for example, performance of tourism industry in a particular country depends on the
availability of numerous attractions in that country (Dunning & Lundan, 2008). Sri
Lanka is home to numerous unique tourist attractions and is considered as one of the best
tourist attractions in the world21
.
21
Lonely Planet, the world's largest travel guide publisher, ranked Sri Lanka as the number one
travel destination for 2013 (Lonely Planet, 2013)
102
The second type of resource that is sought by multinationals is human resources; MNCs,
usually manufacturing and service MNCs from countries with high real labour costs,
seek supplies of cheap unskilled, semi-skilled, and skilled labour (Dunning & Lundan,
2008). Sri Lanka has a relatively cheap but highly trainable labour supply as indicated by
Sri Lanka‘s impressive human capital indicators. Sri Lanka faces two major challenges in
terms of materialising this benefit. Although Sri Lanka has the highest literacy rate in
South Asia, Sri Lanka might not have a significant comparative advantage in terms of
labour costs against most of its neighbouring countries, such as India and China. Thus,
Sri Lanka could face a home region disadvantage (Banalieva, Gregg, & Sarathy, 2010)
because it is surrounded by countries with comparable traits. Therefore, the better option
would be to look out for countries with high real labour costs, but for this, Sri Lanka will
have to attract MNCs from countries that are in distant waters and unfamiliar cultures.
The second challenge comes from the fact that most of this type of human resource
seeking investments has been taken place in the more advanced industrialising
developing countries such as Mexico, Taiwan and Malaysia (Dunning & Lundan, 2008).
Sri Lanka has undergone a very little structural transformation; the shift from agriculture
to higher value added manufacturing and services is not very significant (UNCTAD,
2004). Therefore, this underdevelopment will become a major obstacle in attracting
MNCs that seek cheap labour.
The third type of resource seeking FDI arises from the MNC‘s aspiration to acquire
technological capabilities, management or marketing expertise, and organisational skills.
It is doubtful whether Sri Lanka possesses considerable amounts of such tacit skills since
Sri Lanka is lagging far behind its developed counterparts in terms of technology and
other business related skills and expertise.
4.4.2 Market-seeking FDI
With 20 million population and low per capita income (The World Bank, 2011), Sri
Lanka would not be able to offer considerable market seeking opportunities, relying
solely on the internal market. Although the internal market size of the country is not
significantly large, the proximity to India and Sri Lanka‘s favourable geographical
location have provided Sri Lanka with a lucrative opportunity to attract MNCs that want
103
to target Indian and other regional markets. However, Sri Lanka faces a home region
disadvantage because most of the adjacent countries are developing nations with low per
capita income (The World Bank, 2011), which might to some extent make the
opportunity of targeting the regional markets not so lucrative.
Since Sri Lanka has a limited internal market, Sri Lanka might want to attract market
seeking FDI that target nearby regional markets. Therefore, higher level of regional
integration will be advantageous in terms of attracting such FDI. Literature on FDI and
regional integration advocate that following accession to a regionally integrated area
(RIA), the individual member‘s market size will no longer be a limiting factor in
attracting FDI (Buckley et al., 2001). Also, Feils & Rahman (2011) have empirically
proven that, subsequent to regional integration, market size of an individual member
country becomes less important as a determinant of FDI inflows. MNCs would prefer to
serve a market from an adjacent facility when the production and transaction cost of
doing so is less than serving the market from a distance (Dunning & Lundan, 2008).
Therefore, it is crucial for Sri Lanka to have lower trade costs and lower transport costs
with its regional partners in order to attract such facilities. It is important that Sri Lanka
accommodates correct policies and incentives in order to attract market seeking MNCs.
Due to the limited market size of Sri Lanka, export promotion policies are likely to be
suitable over import substituting policies for attracting larger volumes of FDI.
4.4.3 Efficiency-seeking FDI
Some authors have argued that MNCs now gives less importance to the size of the
domestic market due to the effects of globalisation (Nunnenkamp, 2002; Miyamoto,
2003; Blomström & Kokko, 2003a). Furthermore, some studies have shown that the
motivation for FDI is shifting from ―market-seeking‖ to ―efficiency-seeking‖ (Ruane,
2008). Sri Lanka‘s sufficiently skilled labour market and low labour costs could
complement efficiency seeking investments of MNCs.
Dunning & Lundan (2008) has highlighted two types of efficiency seeking FDI. First
type takes place as a result of MNCs trying to benefit from factor price differences
among different countries. The most prominent factor price differential that is exploited
by MNCs is the relative costs of labour in different skill levels. Developing countries, by
104
and large, contribute low cost unskilled or semi-skilled labour while developed countries,
generally, contribute skilled labour. Sri Lanka‘s low labour costs and highly admired
human capital level indicate Sri Lanka is in a better position to attract MNCs that seek
low cost unskilled or semi-skilled labour. Since Sri Lanka‘s lower level of
industrialisation, it is unlikely that Sri Lanka could supply skilled labour, at least in the
near future. However, Sri Lanka will have to compete with its regional counterparts to
attract efficiency seeking investments because most of the Asian countries and
particularly the South Asian countries possess comparable labour costs, and therefore,
further improvements in the skills and quality of labour is crucial for Sri Lanka in order
to attract efficiency seeking FDI.
The second type of efficiency seeking FDI take place as a result of MNCs trying to
benefit from scale and scope economies, and differences in consumer tastes and supply
capabilities (Dunning & Lundan, 2008). Sri Lanka, as a standalone country cannot offer
considerable scale or scope economies to MNCs due to its relatively small and not so
affluent internal market. Although income levels are not so high, South Asia is a highly
populated region with rising income levels. This fact can provide both opportunities and
treats to Sri Lanka in terms of attracting MNCs seeking scale and scope economies. Such
MNCs is likely to give their attention to countries with large populations, and therefore,
may overlook Sri Lanka. On the other hand, if Sri Lanka can provide a better
environment and comparatively low cost inputs than those of highly populated countries,
and also maintain very low levels of trade and logistic costs with these countries, then Sri
Lanka could provide a better proposition for MNCs seeking scale and scope economies.

105
4.5. Factors that can Influence FDI in Sri Lanka: a Preliminary
Overview
4.5.1. Introduction
There are numerous factors that can encourage and discourage FDI in a country. These
factors and their significance vary with different country settings. Detail analysis of these
factors is essential for formulating correct policies in order to increase FDI inflows as
well as to improve the benefits of the FDI. However, studies based on Sri Lanka are
scarce. The most relevant study is Wijeweera & Mounter (2008); an econometric
analysis that uses vector autoregressive model (VAR) to regress FDI against GDP, total
trade, wage rate, exchange rate, and interest rate. Proceeding sections provides a
preliminary investigation of various factors that can influence FDI inflows to Sri Lanka.
Priority is given to identify salient features of Sri Lanka that could encourage or
discourage FDI inflows.
4.5.2 Size and growth of the economy
The market potential of a country will depend on the size of the population and income
levels of the country (Hoang, 2006). Sri Lanka‘s internal market size is small, with a
population of 20 million only, which could constrain the market seeking FDI potential of
Sri Lanka. Therefore, the significance of the GDP to FDI inflows is unlikely to be strong.
However, Wijeweera & Mounter (2008) have found that Sri Lanka‘s GDP has a positive
impact on its FDI inflows in the long run, while having a negative impact in the short
run.
4.5.3. Trade regimes and degree of trade openness
Sri Lanka has gone through three phases of trade regimes. When Sri Lanka gained
political independence from Great Britain in 1948, Sri Lanka‘s economy was an open
economy and specialized in export of three crops; tea, rubber and coconuts. Sri Lanka
continued to remain an open trading nation until 1960, (Rajapatirana, 1988; Athukorala
& Jayasuriya, 2004) in which the incumbent government at that time introduced inward
oriented development strategies and started relying on import substituting policies
(Rajapatirana, 1988; Wijeweera & Mounter, 2008). This closed economy; which
embraced strict trade and exchange controls, strict regulation, and state intervention;

106
continued until 1977 (Wijeweera & Mounter, 2008). Also, in this period Sri Lanka‘s
economy was dominated by SOEs while private sector receiving less attention by the
state. As a result, Sri Lankan economy became one of the most inward-oriented and
regulated economies outside the communist bloc by mid-1970s (Athukorala &
Jayasuriya, 2004).
Responding to the fruitless outcomes of these inward-oriented policies, Sri Lankan
government initiated an extensive economic liberalization process in 1977 by liberalising
trade, price and investment controls (Athukorala & Jayasuriya, 2004; Rajapatirana,
1988). This reform introduced a significant trade reform by replacing quantitative
restrictions on imports with tariffs, and also revising the tariff structure to achieve greater
uniformity (Athukorala & Jayasuriya, 2004).
As a result of delays and inconsistencies in the implementation of the 1977 reform
process, mostly caused by the internal civil conflict, the 1977 reform process lost its
momentum in early 1980s, and a second wave of liberalisation was initiated in 1990s.
The 1990s reform process focused more on export expansion and employed further tariff
cuts and simplified tariff structure (Athukorala & Jayasuriya, 2004). Since 1990‘s trade
liberalisation, Sri Lanka has maintained its trade openness and continued bringing down
its tariffs further. However, some believe a pressure for protectionism is gradually
building up in recent years (Pursell & Ahsan, 2011), a development which is unlikely to
be favourable for future FDI inflows.
4.5.4. Political instability
Both Sri Lanka and the South Asian region are renowned for their internal political
instability (Javorcik, 2004; Kumaraswamy, 2007). Quazi & Mahmud (2004) has pointed
out that political instability in South Asian region has been a major deterrent in attracting
FDI to South Asian region.
Many writers and international institutions attribute the reason for Sri Lanka not been
able to perform well in both FDI and economic growth to the political instability that
prevailed in the country, mainly due to the civil war (Pradhan, 2001, Zita & Kapur,
2004). However, to the best of my knowledge, the impact of the civil war on FDI in Sri
Lanka has not been investigated in any empirical study.
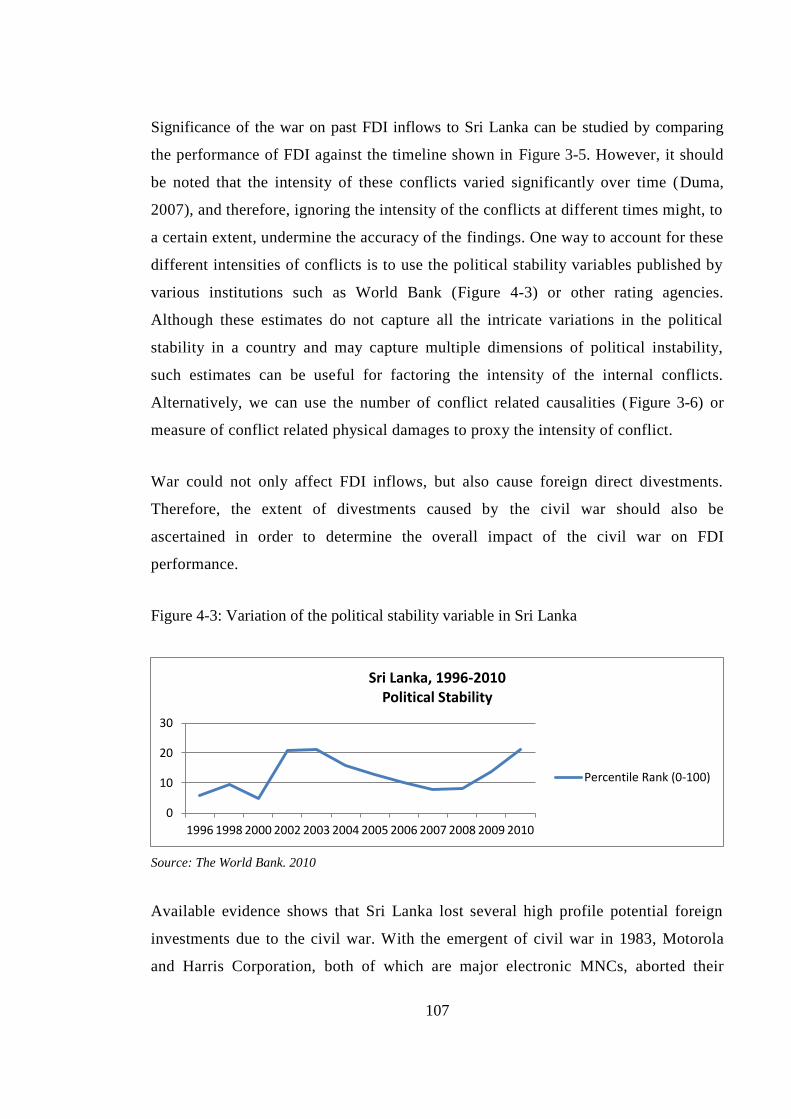
107
Significance of the war on past FDI inflows to Sri Lanka can be studied by comparing
the performance of FDI against the timeline shown in Figure 3-5. However, it should
be noted that the intensity of these conflicts varied significantly over time (Duma,
2007), and therefore, ignoring the intensity of the conflicts at different times might, to
a certain extent, undermine the accuracy of the findings. One way to account for these
different intensities of conflicts is to use the political stability variables published by
various institutions such as World Bank (Figure 4-3) or other rating agencies.
Although these estimates do not capture all the intricate variations in the political
stability in a country and may capture multiple dimensions of political instability,
such estimates can be useful for factoring the intensity of the internal conflicts.
Alternatively, we can use the number of conflict related causalities (Figure 3-6) or
measure of conflict related physical damages to proxy the intensity of conflict.
War could not only affect FDI inflows, but also cause foreign direct divestments.
Therefore, the extent of divestments caused by the civil war should also be
ascertained in order to determine the overall impact of the civil war on FDI
performance.
Figure 4-3: Variation of the political stability variable in Sri Lanka
Source: The World Bank. 2010
Available evidence shows that Sri Lanka lost several high profile potential foreign
investments due to the civil war. With the emergent of civil war in 1983, Motorola
and Harris Corporation, both of which are major electronic MNCs, aborted their
0
10
20
30
1996 1998 2000 2002 2003 2004 2005 2006 2007 2008 2009 2010
Sri Lanka, 1996-2010 Political Stability
Percentile Rank (0-100)
108
investment plans and withdrew from Sri Lanka22
(Kelegama, 2000). In addition to
these MNCs, Sony, Marubeni, Sanyo, Bank of Tokyo and Chase Manhattan Bank, all
of which were in the pipeline to invest in Sri Lanka, decided against investing in Sri
Lanka when the civil war erupted in 1983 (Kelegama, 2000).
4.5.5. Human capital
Sri Lanka is widely known for its high rating in human capital index in terms of literacy
rate and schooling rates (Table 4-7). Sri Lanka is a country with free education from
kindergarten to university (Ganegodage & Rambaldi, 2011; Ranasinghe & Hartog, 2002)
and its educational achievements are highly praised by researchers (Ganegodage &
Rambaldi, 2011; Duma, 2007) as well as international bodies such as World Bank
(UNDP Sri Lanka, 1998; UNDP Sri Lanka, 2012; Duma, 2007). Also, some research
studies suggest that Sri Lanka has a low wage rate but a high relative labour productivity
(Wijeweera & Mounter, 2008; Athukorala & Jayasuriya, 2004).
It is true that Sri Lanka‘s education system is a success story compared to other
developing countries in terms of providing universal access to general education,
achieving high literacy rates and school enrolment rates, and achieving gender parity in
education attainment (Aturupane, 2009). However, Sri Lanka‘s economic performance,
and performance in FDI inflows in particular, are far behind that of East Asian countries
which have similar educational achievements (Ganegodage & Rambaldi, 2011;
UNCTAD, 2004). To add to this, Ganegodage & Rambaldi (2011) has found that the
returns of education investment in Sri Lanka is lower than those found for other
developing economies.
Host country‘s capacity to absorb advance technology and other skills that MNCs bring
in depend on the quality of human capital in the host country (United Nations, 1992;
Moosa, 2002). Based on FDI flows from industrial countries to 69 developing countries
during 1970-1989 and proxing human capital by level of schooling, (Borensztein, De
Gregorio, & Lee, 1998) shows that FDI contributes to economic growth only when the
host country has a minimum threshold level of human capital. Therefore, Sri Lanka‘s
human capital indicators can have implications on realising the benefits of FDI.
22
Harris Corporation left a half-built plant with an initial employment capacity of 1,850.
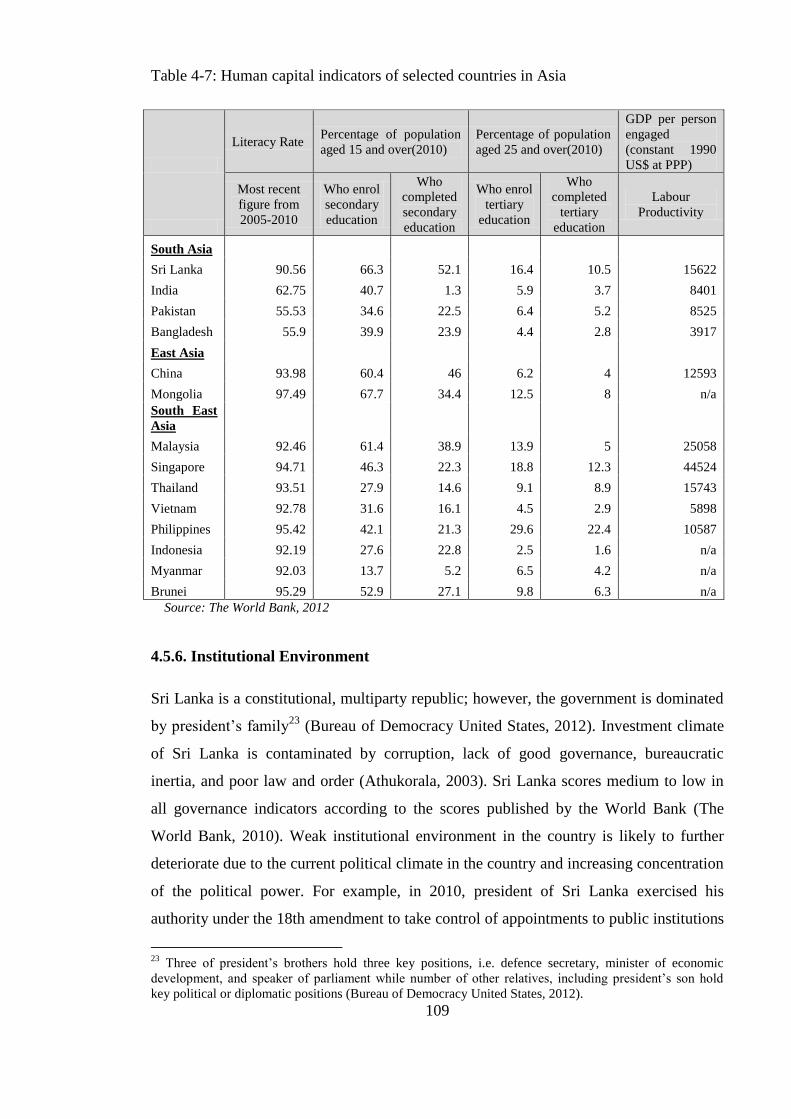
109
Table 4-7: Human capital indicators of selected countries in Asia
Literacy Rate Percentage of population
aged 15 and over(2010)
Percentage of population
aged 25 and over(2010)
GDP per person
engaged
(constant 1990
US$ at PPP)
Most recent
figure from
2005-2010
Who enrol
secondary
education
Who
completed
secondary
education
Who enrol
tertiary
education
Who
completed
tertiary
education
Labour
Productivity
South Asia
Sri Lanka 90.56 66.3 52.1 16.4 10.5 15622
India 62.75 40.7 1.3 5.9 3.7 8401
Pakistan 55.53 34.6 22.5 6.4 5.2 8525
Bangladesh 55.9 39.9 23.9 4.4 2.8 3917
East Asia China 93.98 60.4 46 6.2 4 12593
Mongolia 97.49 67.7 34.4 12.5 8 n/a
South East
Asia Malaysia 92.46 61.4 38.9 13.9 5 25058
Singapore 94.71 46.3 22.3 18.8 12.3 44524
Thailand 93.51 27.9 14.6 9.1 8.9 15743
Vietnam 92.78 31.6 16.1 4.5 2.9 5898
Philippines 95.42 42.1 21.3 29.6 22.4 10587
Indonesia 92.19 27.6 22.8 2.5 1.6 n/a
Myanmar 92.03 13.7 5.2 6.5 4.2 n/a
Brunei 95.29 52.9 27.1 9.8 6.3 n/a
Source: The World Bank, 2012
4.5.6. Institutional Environment
Sri Lanka is a constitutional, multiparty republic; however, the government is dominated
by president‘s family23
(Bureau of Democracy United States, 2012). Investment climate
of Sri Lanka is contaminated by corruption, lack of good governance, bureaucratic
inertia, and poor law and order (Athukorala, 2003). Sri Lanka scores medium to low in
all governance indicators according to the scores published by the World Bank (The
World Bank, 2010). Weak institutional environment in the country is likely to further
deteriorate due to the current political climate in the country and increasing concentration
of the political power. For example, in 2010, president of Sri Lanka exercised his
authority under the 18th amendment to take control of appointments to public institutions
23
Three of president‘s brothers hold three key positions, i.e. defence secretary, minister of economic
development, and speaker of parliament while number of other relatives, including president‘s son hold
key political or diplomatic positions (Bureau of Democracy United States, 2012).
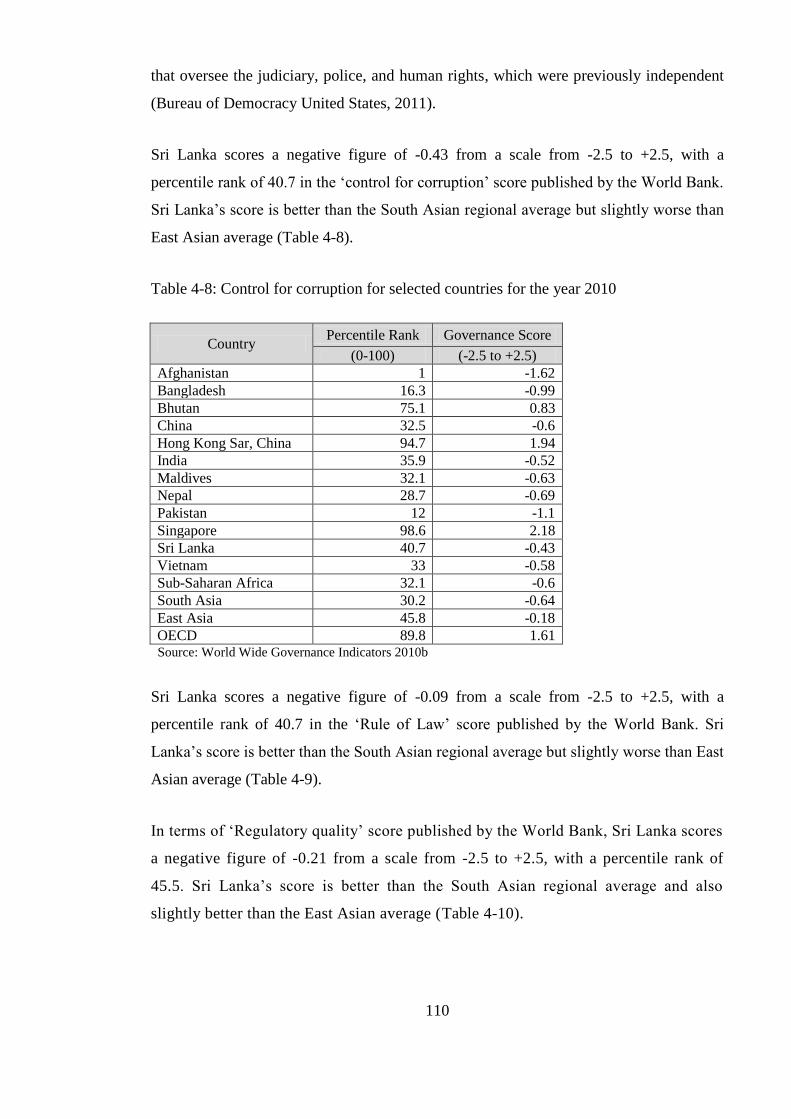
110
that oversee the judiciary, police, and human rights, which were previously independent
(Bureau of Democracy United States, 2011).
Sri Lanka scores a negative figure of -0.43 from a scale from -2.5 to +2.5, with a
percentile rank of 40.7 in the ‗control for corruption‘ score published by the World Bank.
Sri Lanka‘s score is better than the South Asian regional average but slightly worse than
East Asian average (Table 4-8).
Table 4-8: Control for corruption for selected countries for the year 2010
Country Percentile Rank Governance Score
(0-100) (-2.5 to +2.5)
Afghanistan 1 -1.62
Bangladesh 16.3 -0.99
Bhutan 75.1 0.83
China 32.5 -0.6
Hong Kong Sar, China 94.7 1.94
India 35.9 -0.52
Maldives 32.1 -0.63
Nepal 28.7 -0.69
Pakistan 12 -1.1
Singapore 98.6 2.18
Sri Lanka 40.7 -0.43
Vietnam 33 -0.58
Sub-Saharan Africa 32.1 -0.6
South Asia 30.2 -0.64
East Asia 45.8 -0.18
OECD 89.8 1.61 Source: World Wide Governance Indicators 2010b
Sri Lanka scores a negative figure of -0.09 from a scale from -2.5 to +2.5, with a
percentile rank of 40.7 in the ‗Rule of Law‘ score published by the World Bank. Sri
Lanka‘s score is better than the South Asian regional average but slightly worse than East
Asian average (Table 4-9).
In terms of ‗Regulatory quality‘ score published by the World Bank, Sri Lanka scores
a negative figure of -0.21 from a scale from -2.5 to +2.5, with a percentile rank of
45.5. Sri Lanka‘s score is better than the South Asian regional average and also
slightly better than the East Asian average (Table 4-10).
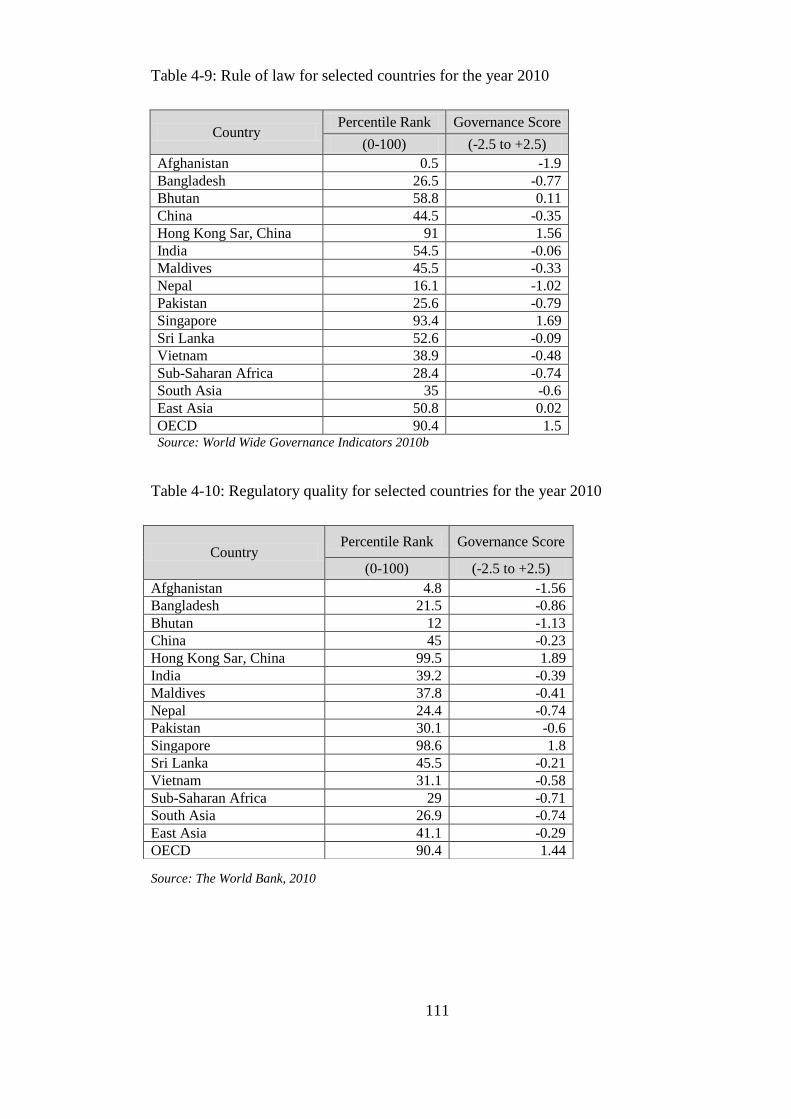
111
Table 4-9: Rule of law for selected countries for the year 2010
Country Percentile Rank Governance Score
(0-100) (-2.5 to +2.5)
Afghanistan 0.5 -1.9
Bangladesh 26.5 -0.77
Bhutan 58.8 0.11
China 44.5 -0.35
Hong Kong Sar, China 91 1.56
India 54.5 -0.06
Maldives 45.5 -0.33
Nepal 16.1 -1.02
Pakistan 25.6 -0.79
Singapore 93.4 1.69
Sri Lanka 52.6 -0.09
Vietnam 38.9 -0.48
Sub-Saharan Africa 28.4 -0.74
South Asia 35 -0.6
East Asia 50.8 0.02
OECD 90.4 1.5 Source: World Wide Governance Indicators 2010b
Table 4-10: Regulatory quality for selected countries for the year 2010
Source: The World Bank, 2010
Country Percentile Rank Governance Score
(0-100) (-2.5 to +2.5)
Afghanistan 4.8 -1.56
Bangladesh 21.5 -0.86
Bhutan 12 -1.13
China 45 -0.23
Hong Kong Sar, China 99.5 1.89
India 39.2 -0.39
Maldives 37.8 -0.41
Nepal 24.4 -0.74
Pakistan 30.1 -0.6
Singapore 98.6 1.8
Sri Lanka 45.5 -0.21
Vietnam 31.1 -0.58
Sub-Saharan Africa 29 -0.71
South Asia 26.9 -0.74
East Asia 41.1 -0.29
OECD 90.4 1.44
112
Although Sri Lanka‘s governance indicators are weak compared to developed nations
and some FDI success stories such as Singapore and Hong Kong, they are better than the
South Asian regional average and more or less in par with East Asian regional average.
However, a possible downward revision in these scores can be expected due to some
recent events that have undermined the democracy of the country (DeVotta, 2010).
The ultimate risk a foreign firm faces due to a poor institutional environment is the risk
of expropriation. The threat of partial or total nationalisation is a major institutional and
political risk factor that affects FDI inflows. The likeliness of such an action is perceived
to be dependent on the intentions of the host government, and the possibility of the
government to enact such an intention is largely dependent on institutional factors. For
example, if there is a strong constitution which protects property rights and provides
freedom from expropriation, then even if the government desires to expropriate assets,
such an action would be difficult to implement.
Prior to the introduction of economic reform in 1977, Sri Lanka had a history of
nationalisation of private enterprises; local subsidiaries of several international oil
companies were nationalised in 1961, and tea and rubber plantations were nationalised
under the Land Reform Act in 1972 (The Economist, 2011). Realising the negative
impacts of previous nationalist/socialist actions, the Sri Lankan government guaranteed
freedom from expropriation under the new constitution adopted in 1978. Thereafter, as
per available evidence, except a one expropriation in cement manufacturing industry in
1990 (Hajzler, 2006), foreign investments have been safe until 2011. In 2011, 37
privately owned companies, some of which were foreign-invested firms, were
expropriated by the Sri Lankan government through passing a controversial law in the
parliament. The bill was termed as The Revival of Under-Performing Enterprises and
Under-Utilised Assets Act, and targeted 37 private enterprises that had previously
received land or aid from the government. Although the expropriation was justified by
the government stating that the firms were either under-utilised or being used for
purposes other than those originally envisaged, the criteria and the process of selecting
these firms were not explicit. Ironically, some of the expropriated firms were performing
well in terms of profitability and growth. Despite widespread opposition from opposition
political parties, the island‘s bar association, trade chambers, Buddhist religious leaders,

113
and rights activists; the bill was passed as an urgent bill preventing public scrutiny and
pre-enactment review (The Economist, 2011; Brown, 2011).
The likelihood of expropriation is perceived to be dependent on the ideologies of the host
government - more likely with a left-wing orientation and less likely with a right-wing
orientation (Schneider & Frey, 1985). Since Sri Lanka became an independent nation in
1948, the political power in Sri Lanka has swing between two major parties: UNP
(United National Party) and SLFP (Sri Lanka Freedom Party), former having a more
right-wing orientation than the latter. It would be interesting to know under which
regimes these expropriations have taken place, in order to identify the relationship
between ideologies of the host government and the likeliness of expropriation.
4.5.7. Domestic stock market development
Sri Lanka‘s stock market is a relatively small sized market with severe liquidity
constraints (Elyasiani, Perera, & Puri, 1998). There are only 267 companies listed in the
Colombo Stock Exchange (CSE) (by end of 2011) and the market suffers from a high
concentration of market capitalisation in blue chip stocks (Various issues of Colombo
Stock Exchange annual reports; Elyasiani, Perera, & Puri, 1998). Therefore, Sri Lanka‘s
less developed stock market can hinder FDI in Sri Lanka.
Sri Lanka‘s stock market is considered to be highly manipulated (Daily Mirror, 2012)
and financial reporting has issues of transparency. Although, insider trading is prohibited
on paper (Jaleel & Samarakoon, 2009), insider dealing is explicitly entertained
(Jayasinghe, 2012; Perera, 2011). Countries with better legal systems and shareholder
protection attract more attention from foreign investors (Claessens, Klingebiel &
Schmukler, 2001). Therefore, Sri Lanka needs to improve in these factors in order to
attract both portfolio investment as well as FDI inflows.
Moreover, CSE is dominated by local investors and foreign holdings of the CSE at end
the end of year 2011 was only Rs. 437 billion (US$ 3.9 billion), representing 20% of the
market (CSE). The degree of internationalisation of the stock market is positively
correlated with FDI inflows (Claessens, Klingebiel & Schmukler, 2001), and therefore,
level of internationalisation in the Sri Lanka‘s stock market is likely to affect FDI
inflows.
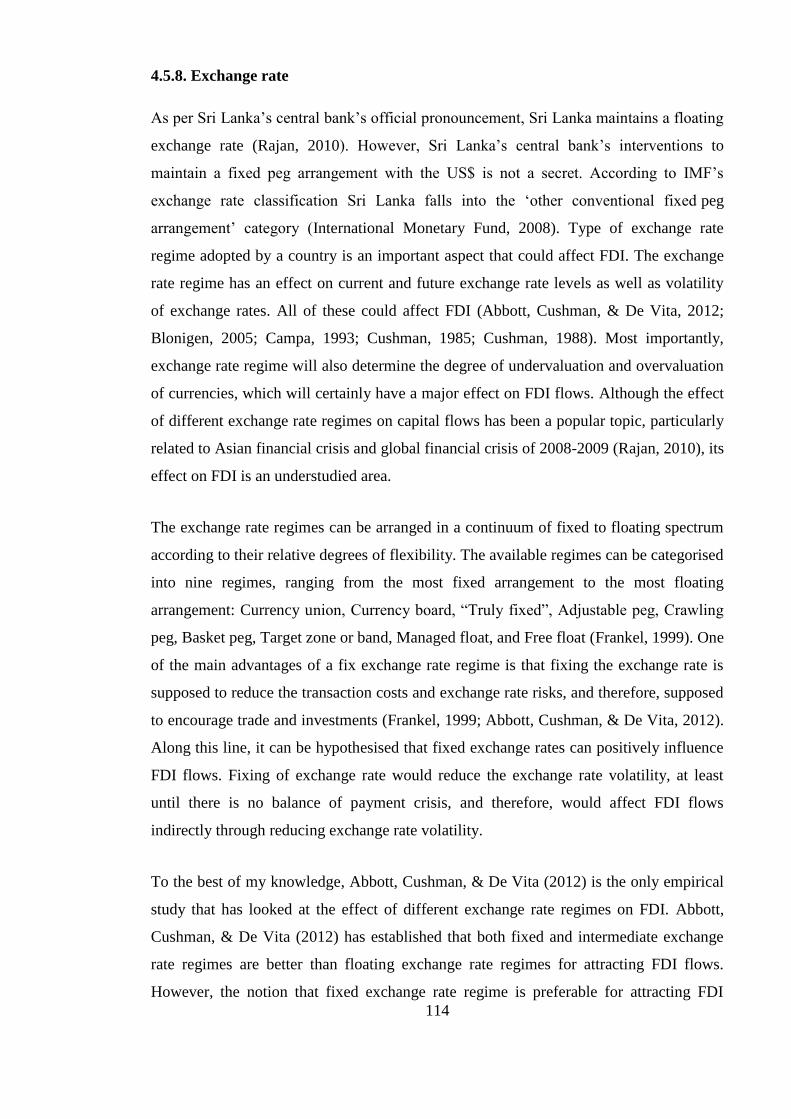
114
4.5.8. Exchange rate
As per Sri Lanka‘s central bank‘s official pronouncement, Sri Lanka maintains a floating
exchange rate (Rajan, 2010). However, Sri Lanka‘s central bank‘s interventions to
maintain a fixed peg arrangement with the US$ is not a secret. According to IMF‘s
exchange rate classification Sri Lanka falls into the ‗other conventional fixed peg
arrangement‘ category (International Monetary Fund, 2008). Type of exchange rate
regime adopted by a country is an important aspect that could affect FDI. The exchange
rate regime has an effect on current and future exchange rate levels as well as volatility
of exchange rates. All of these could affect FDI (Abbott, Cushman, & De Vita, 2012;
Blonigen, 2005; Campa, 1993; Cushman, 1985; Cushman, 1988). Most importantly,
exchange rate regime will also determine the degree of undervaluation and overvaluation
of currencies, which will certainly have a major effect on FDI flows. Although the effect
of different exchange rate regimes on capital flows has been a popular topic, particularly
related to Asian financial crisis and global financial crisis of 2008-2009 (Rajan, 2010), its
effect on FDI is an understudied area.
The exchange rate regimes can be arranged in a continuum of fixed to floating spectrum
according to their relative degrees of flexibility. The available regimes can be categorised
into nine regimes, ranging from the most fixed arrangement to the most floating
arrangement: Currency union, Currency board, ―Truly fixed‖, Adjustable peg, Crawling
peg, Basket peg, Target zone or band, Managed float, and Free float (Frankel, 1999). One
of the main advantages of a fix exchange rate regime is that fixing the exchange rate is
supposed to reduce the transaction costs and exchange rate risks, and therefore, supposed
to encourage trade and investments (Frankel, 1999; Abbott, Cushman, & De Vita, 2012).
Along this line, it can be hypothesised that fixed exchange rates can positively influence
FDI flows. Fixing of exchange rate would reduce the exchange rate volatility, at least
until there is no balance of payment crisis, and therefore, would affect FDI flows
indirectly through reducing exchange rate volatility.
To the best of my knowledge, Abbott, Cushman, & De Vita (2012) is the only empirical
study that has looked at the effect of different exchange rate regimes on FDI. Abbott,
Cushman, & De Vita (2012) has established that both fixed and intermediate exchange
rate regimes are better than floating exchange rate regimes for attracting FDI flows.
However, the notion that fixed exchange rate regime is preferable for attracting FDI

115
inflows may not be a universal truth. This is because if the currency is not freely floated,
then the currency can either be undervalued or overvalued. The degree of over/under
valuation and how long the country would be capable of maintaining this artificial
valuation is likely to have an effect on FDI inflows. For example, if a particular country
maintains its currency at a high value through intervention while its currency goes
through real depreciation due to high relative inflation, then such a currency is
overvalued. If the country is also facing severe balance of payment problems due to
excessive balance of payment deficits then the credibility of the fixing of the currency
will also be low, and therefore, investors might anticipate a currency devaluation in
future. This might deter and delay FDI inflows as investors would abstain in investing
just before currency devaluation. Moreover, due to the positive inflation differential,
local currency will be increasingly overvalued, and this in turn will make the
competitiveness of export goods to fall while competitiveness of imports to rise. This
will make the foreign production attractive compared to domestic production, and
therefore, FDI inflows will be discouraged while FDI outflows are being encouraged.
Along with the soft-pegged exchange rate, Sri Lanka‘s large current account deficit and
high inflation rates (Central Bank of Sri Lanka, 2010) places an enormous pressure on its
exchange rate. Due to this Sri Lanka‘s real exchange rate has appreciated significantly
during the past (Figure 4-4 and Table 4-11), and therefore, Sri Lanka‘s currency is
deemed to be overvalued and this fact will have implications on FDI inflows. It‘s quite
extraordinary that being a developing country, Sri Lanka‘s real exchange rate has
appreciated relative to most of the countries in Asia, even against the developed countries
in Asia.
Such an overvalued exchange rate is likely to have devastating impact on exports and
thereby export oriented FDI. This negative impact on export oriented FDI can be quite
severe given that real exchange rates of South Asian countries have depreciated during
the same period.
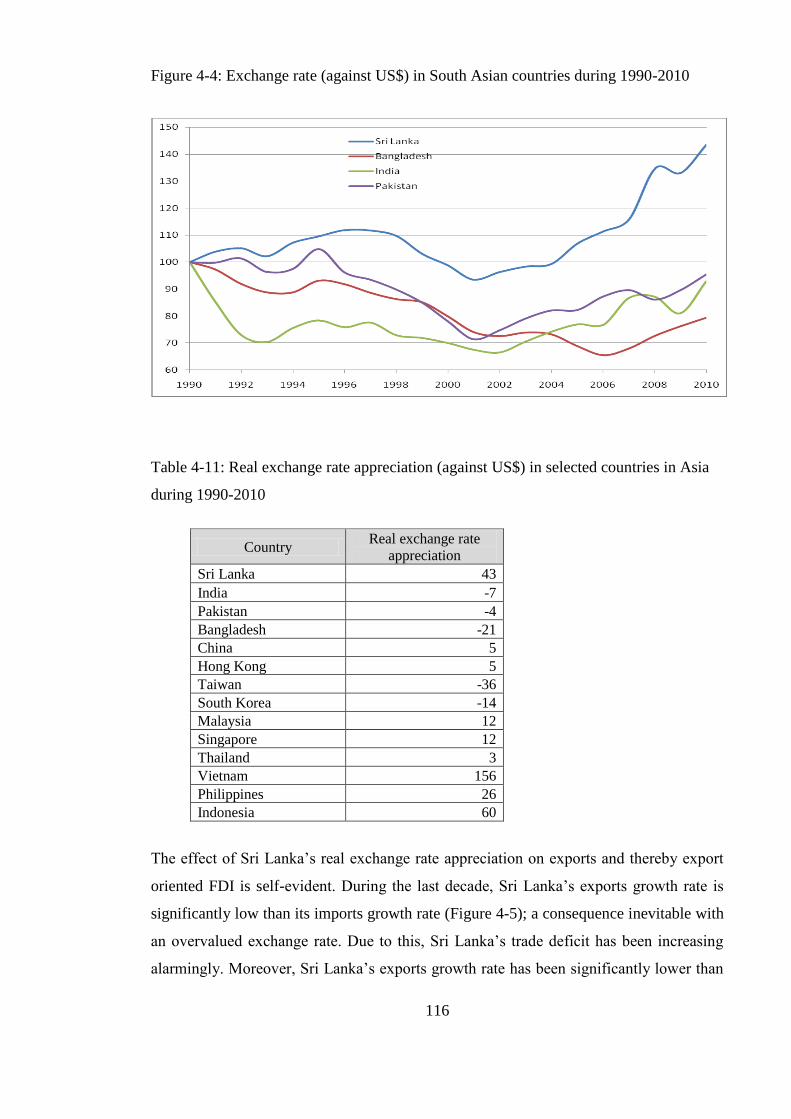
116
Figure 4-4: Exchange rate (against US$) in South Asian countries during 1990-2010
Table 4-11: Real exchange rate appreciation (against US$) in selected countries in Asia
during 1990-2010
Country Real exchange rate
appreciation
Sri Lanka 43
India -7
Pakistan -4
Bangladesh -21
China 5
Hong Kong 5
Taiwan -36
South Korea -14
Malaysia 12
Singapore 12
Thailand 3
Vietnam 156
Philippines 26
Indonesia 60
The effect of Sri Lanka‘s real exchange rate appreciation on exports and thereby export
oriented FDI is self-evident. During the last decade, Sri Lanka‘s exports growth rate is
significantly low than its imports growth rate (Figure 4-5); a consequence inevitable with
an overvalued exchange rate. Due to this, Sri Lanka‘s trade deficit has been increasing
alarmingly. Moreover, Sri Lanka‘s exports growth rate has been significantly lower than
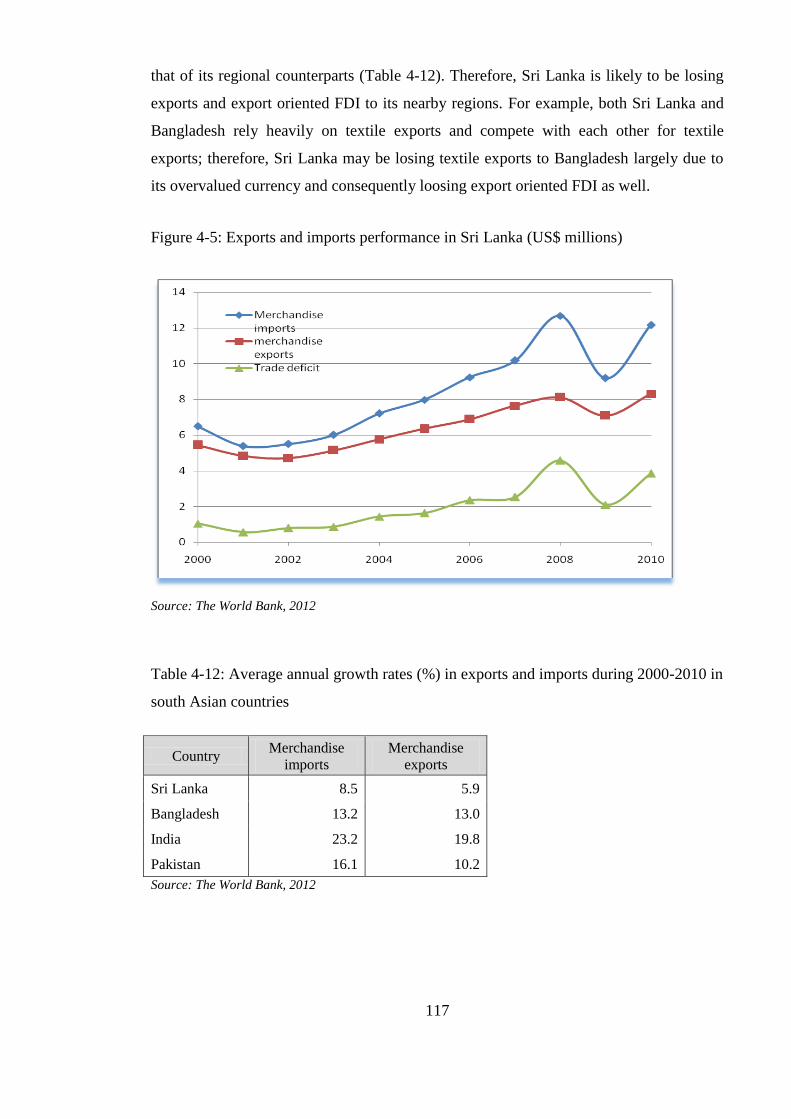
117
that of its regional counterparts (Table 4-12). Therefore, Sri Lanka is likely to be losing
exports and export oriented FDI to its nearby regions. For example, both Sri Lanka and
Bangladesh rely heavily on textile exports and compete with each other for textile
exports; therefore, Sri Lanka may be losing textile exports to Bangladesh largely due to
its overvalued currency and consequently loosing export oriented FDI as well.
Figure 4-5: Exports and imports performance in Sri Lanka (US$ millions)
Source: The World Bank, 2012
Table 4-12: Average annual growth rates (%) in exports and imports during 2000-2010 in
south Asian countries
Country Merchandise
imports
Merchandise
exports
Sri Lanka 8.5 5.9
Bangladesh 13.2 13.0
India 23.2 19.8
Pakistan 16.1 10.2
Source: The World Bank, 2012
118
Overvalued exchange rate can also have implications on the timing of FDI. Kohlhagen
(1977) points out that the timing of FDI will certainly be affected by expected future
exchange rate. A foreign investor who is expecting a devaluation of host country‘s
currency would prefer to invest after the devaluation rather than before the devaluation
which would enable him to make the investment for a lesser amount of foreign exchange
(Kohlhagen, 1977). Therefore, an overvalued exchange rate may signal future
devaluations, and therefore, the expected devaluation of the currency could deter, or at
least delay, FDI inflows.
4.5.9. Infrastructure
Sri Lanka has serious infrastructure bottlenecks that could discourage FDI into the
country. A comparison of the most common infrastructure indicators for Sri Lanka and
for its regional counterparts is presented in Table 4-13 and Table 4-14. Sri Lanka‘s
transport infrastructure is very poor. Although Sri Lanka‘s road density is relatively high
compared to regional and international standards (Table 4-13), roads are poorly
maintained, and therefore, not in a good condition and roads do not connect remote areas
to main markets (The World Bank, 2007). Due to congestion and poor quality of the
roads, average travel speed is low at 39 km/h. It is estimated that poor quality roads
reduce corporate productivity by as much as 44% (Asian Development Bank, 2008).
Moreover, many studies conducted by the Sri Lankan government, ADB and World
Bank have found that transport is a major obstacle to start and operate a business,
particularly in rural areas (Asian Development Bank, 2008). Sri Lanka‘s railway system
is no better than the road infrastructure and suffers from similar issues due to decades of
neglect (Asian Development Bank, 2008).
Sri Lanka has only one international airport, which has capacity and efficiency issues.
However, Sri Lanka is currently in the process of constructing a new international airport
in Mattala. Direct comparison of Sri Lanka‘s aviation standards with the standards of
other regional airports is not possible due to Sri Lanka‘s airport not being assessed or
ranked by international rating agencies. On the other hand, world airport awards, an
entity that assesses airport quality, has ranked several Indian airports, and also ranked
Delhi International Airport as the world‘s most improved airport in 2012. Therefore, it is
obvious that India‘s airports have become superior to Sri Lanka‘s airport, which would
further aggravate Sri Lanka‘s aviation infrastructure weaknesses.
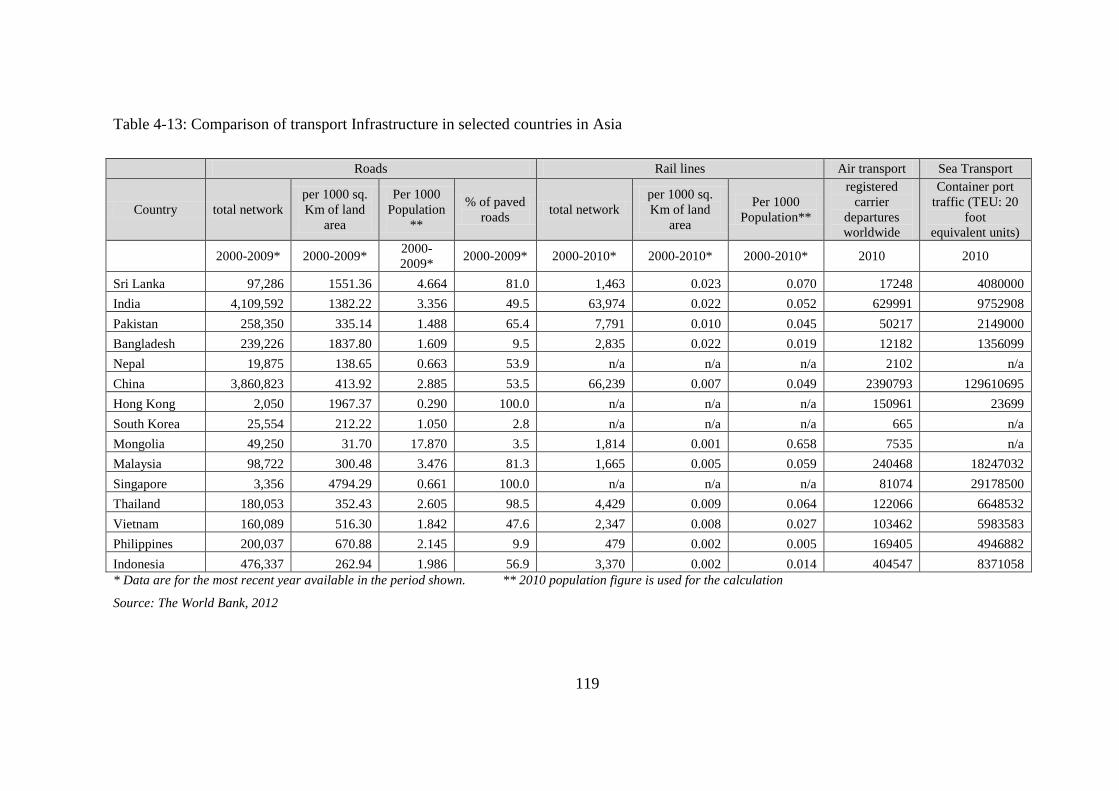
119
Table 4-13: Comparison of transport Infrastructure in selected countries in Asia
Roads Rail lines Air transport Sea Transport
Country total network
per 1000 sq.
Km of land
area
Per 1000
Population
**
% of paved
roads total network
per 1000 sq.
Km of land
area
Per 1000
Population**
registered
carrier
departures
worldwide
Container port
traffic (TEU: 20
foot
equivalent units)
2000-2009* 2000-2009*
2000-
2009* 2000-2009* 2000-2010* 2000-2010* 2000-2010* 2010 2010
Sri Lanka 97,286 1551.36 4.664 81.0 1,463 0.023 0.070 17248 4080000
India 4,109,592 1382.22 3.356 49.5 63,974 0.022 0.052 629991 9752908
Pakistan 258,350 335.14 1.488 65.4 7,791 0.010 0.045 50217 2149000
Bangladesh 239,226 1837.80 1.609 9.5 2,835 0.022 0.019 12182 1356099
Nepal 19,875 138.65 0.663 53.9 n/a n/a n/a 2102 n/a
China 3,860,823 413.92 2.885 53.5 66,239 0.007 0.049 2390793 129610695
Hong Kong 2,050 1967.37 0.290 100.0 n/a n/a n/a 150961 23699
South Korea 25,554 212.22 1.050 2.8 n/a n/a n/a 665 n/a
Mongolia 49,250 31.70 17.870 3.5 1,814 0.001 0.658 7535 n/a
Malaysia 98,722 300.48 3.476 81.3 1,665 0.005 0.059 240468 18247032
Singapore 3,356 4794.29 0.661 100.0 n/a n/a n/a 81074 29178500
Thailand 180,053 352.43 2.605 98.5 4,429 0.009 0.064 122066 6648532
Vietnam 160,089 516.30 1.842 47.6 2,347 0.008 0.027 103462 5983583
Philippines 200,037 670.88 2.145 9.9 479 0.002 0.005 169405 4946882
Indonesia 476,337 262.94 1.986 56.9 3,370 0.002 0.014 404547 8371058
* Data are for the most recent year available in the period shown. ** 2010 population figure is used for the calculation
Source: The World Bank, 2012
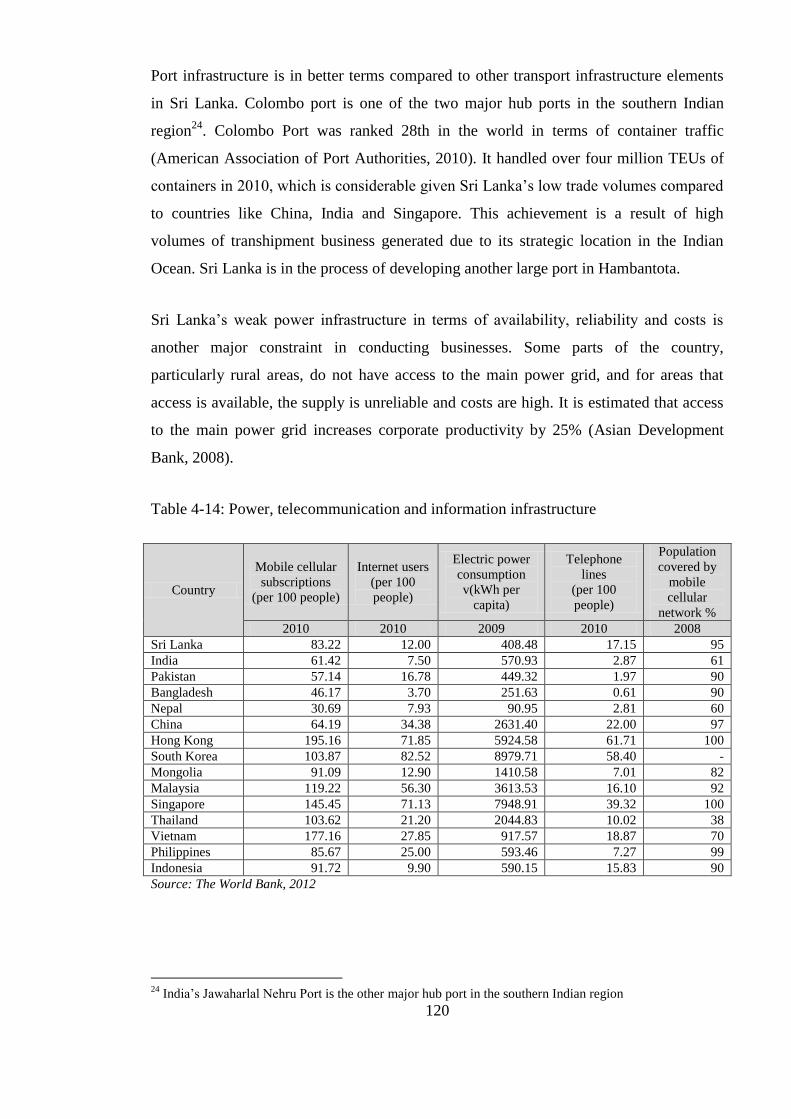
120
Port infrastructure is in better terms compared to other transport infrastructure elements
in Sri Lanka. Colombo port is one of the two major hub ports in the southern Indian
region24
. Colombo Port was ranked 28th in the world in terms of container traffic
(American Association of Port Authorities, 2010). It handled over four million TEUs of
containers in 2010, which is considerable given Sri Lanka‘s low trade volumes compared
to countries like China, India and Singapore. This achievement is a result of high
volumes of transhipment business generated due to its strategic location in the Indian
Ocean. Sri Lanka is in the process of developing another large port in Hambantota.
Sri Lanka‘s weak power infrastructure in terms of availability, reliability and costs is
another major constraint in conducting businesses. Some parts of the country,
particularly rural areas, do not have access to the main power grid, and for areas that
access is available, the supply is unreliable and costs are high. It is estimated that access
to the main power grid increases corporate productivity by 25% (Asian Development
Bank, 2008).
Table 4-14: Power, telecommunication and information infrastructure
Country
Mobile cellular
subscriptions
(per 100 people)
Internet users
(per 100
people)
Electric power
consumption
v(kWh per
capita)
Telephone
lines
(per 100
people)
Population
covered by
mobile
cellular
network %
2010 2010 2009 2010 2008
Sri Lanka 83.22 12.00 408.48 17.15 95
India 61.42 7.50 570.93 2.87 61
Pakistan 57.14 16.78 449.32 1.97 90
Bangladesh 46.17 3.70 251.63 0.61 90
Nepal 30.69 7.93 90.95 2.81 60
China 64.19 34.38 2631.40 22.00 97
Hong Kong 195.16 71.85 5924.58 61.71 100
South Korea 103.87 82.52 8979.71 58.40 -
Mongolia 91.09 12.90 1410.58 7.01 82
Malaysia 119.22 56.30 3613.53 16.10 92
Singapore 145.45 71.13 7948.91 39.32 100
Thailand 103.62 21.20 2044.83 10.02 38
Vietnam 177.16 27.85 917.57 18.87 70
Philippines 85.67 25.00 593.46 7.27 99
Indonesia 91.72 9.90 590.15 15.83 90
Source: The World Bank, 2012
24
India‘s Jawaharlal Nehru Port is the other major hub port in the southern Indian region
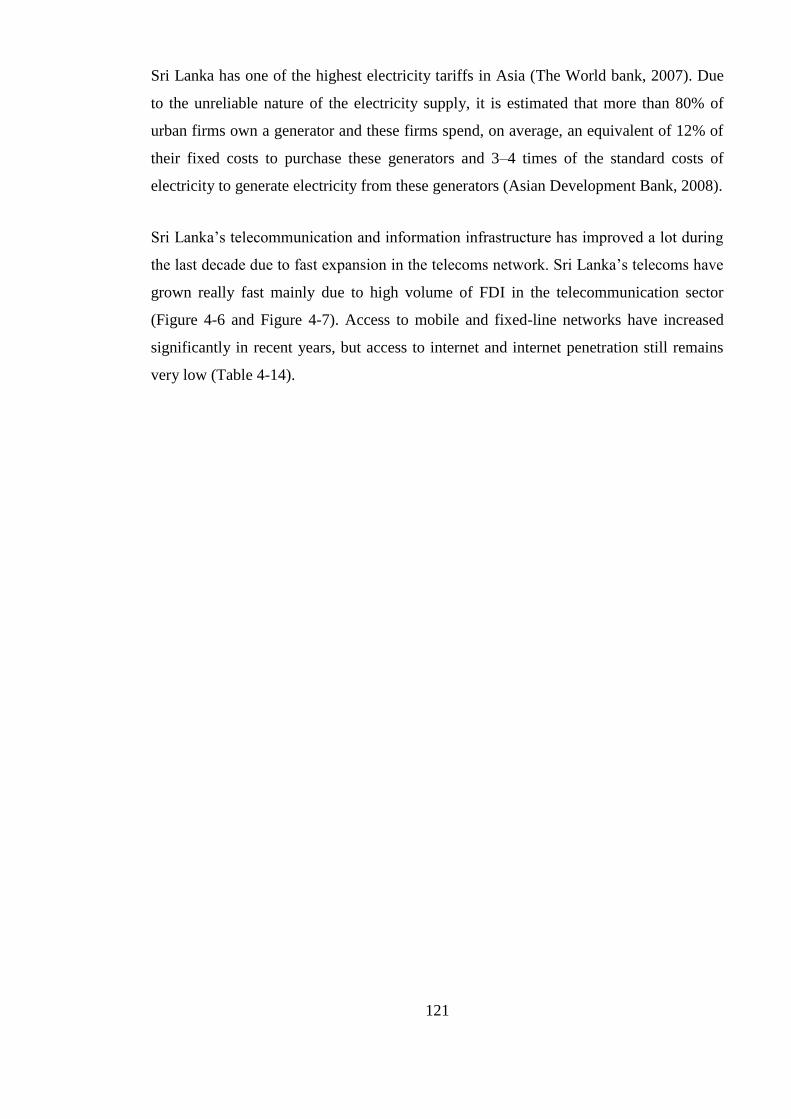
121
Sri Lanka has one of the highest electricity tariffs in Asia (The World bank, 2007). Due
to the unreliable nature of the electricity supply, it is estimated that more than 80% of
urban firms own a generator and these firms spend, on average, an equivalent of 12% of
their fixed costs to purchase these generators and 3–4 times of the standard costs of
electricity to generate electricity from these generators (Asian Development Bank, 2008).
Sri Lanka‘s telecommunication and information infrastructure has improved a lot during
the last decade due to fast expansion in the telecoms network. Sri Lanka‘s telecoms have
grown really fast mainly due to high volume of FDI in the telecommunication sector
(Figure 4-6 and Figure 4-7). Access to mobile and fixed-line networks have increased
significantly in recent years, but access to internet and internet penetration still remains
very low (Table 4-14).
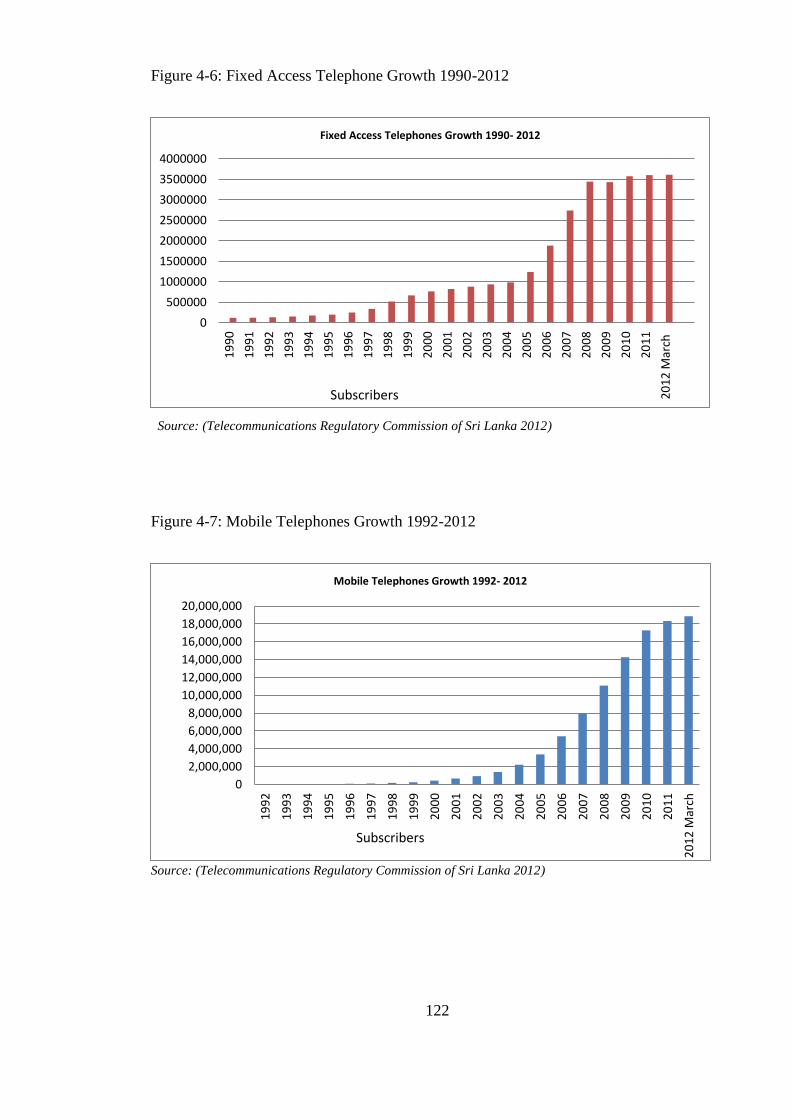
122
Figure 4-6: Fixed Access Telephone Growth 1990-2012
Source: (Telecommunications Regulatory Commission of Sri Lanka 2012)
Figure 4-7: Mobile Telephones Growth 1992-2012
Source: (Telecommunications Regulatory Commission of Sri Lanka 2012)
0
500000
1000000
1500000
2000000
2500000
3000000
3500000
4000000
19
90
19
91
19
92
19
93
19
94
19
95
19
96
19
97
19
98
19
99
20
00
20
01
20
02
20
03
20
04
20
05
20
06
20
07
20
08
20
09
20
10
20
11
20
12
Mar
ch
Fixed Access Telephones Growth 1990- 2012
Subscribers
0
2,000,000
4,000,000
6,000,000
8,000,000
10,000,000
12,000,000
14,000,000
16,000,000
18,000,000
20,000,000
19
92
19
93
19
94
19
95
19
96
19
97
19
98
19
99
20
00
20
01
20
02
20
03
20
04
20
05
20
06
20
07
20
08
20
09
20
10
20
11
20
12
Mar
ch
Mobile Telephones Growth 1992- 2012
Subscribers

123
4.5.10. Labour cost and productivity
In 1970s, Sri Lanka was ranked above most of Asian countries such as Philippines,
Taiwan, Korea and India in terms of relative labour productivity (Athukorala &
Jayasuriya, 2004). Since then Sri Lanka‘s real wage has declined and this real wage
decline has been accompanied by strong labour productivity growths (Athukorala &
Jayasuriya, 2004). Therefore, it can be assumed that Sri Lanka has a high relative labour
productivity; however, a detailed comparison of relative labour productivities in the
region is necessary to validate this assumption.
Even though Sri Lanka is considered to be having low wages (Wijeweera & Mounter,
2008; Athukorala & Jayasuriya, 2004, Table 4-15), low wages itself will not provide a
comparative advantage in attracting FDI. This is because countries in Asia and South
Asian region in particular have comparable labour costs. Due to data limitations, direct
comparison of wage rates in these countries is not possible, however, available evidence
point out that labour costs in these countries are comparable (Table 4-15).
Table 4-15: Score for ―Compensation costs‖ in the Global Services Location Index by
AT Kearney
Source: Kearney, 2011
However, the advantage of having low wages is somewhat eroded by strict labour
regulations present in the country; Sri Lanka has some of the most restrictive labour
regulations in Asia and one of the most generous severance pay clauses in the world (The
Score for ―Compensation costs‖
Sri Lanka 7.12
India 6.86
Pakistan 7.08
China 5.74
Malaysia 5.77
Singapore 1.41
Thailand 6.54
Vietnam 7.07
Phillipines 6.87
Indonesia 6.95
United States 0.54
United Kingdom 1.12
124
World bank, 2007). Also, Sri Lanka‘s industrial sector frequently experience labour
unrest mainly due to the presence of strong labour unions often attached to political
parties (Central Bank of Sri Lanka, 2002, Teitelbaum, 2007). Workers employed extreme
and violent measures in some labour protests and scared off prospective foreign investors
and in some situations chased away existing foreign investors (Teitelbaum, 2007).
4.5.11. Regional context and the degree of regional integration
South Asian countries, in total, have a market size of $4.5 trillion (in PPP terms); which
ranks the South Asian region fourth in the world after the US, EU and China. South
Asian region has a population of 1.5 billion, which accounts for 23 per cent of the total
world population (Aggarwal, 2008). Also, South Asian countries have recorded high
economic growth rates in the recent past with average growth rates of above 6%
(Pravakar, 2006; Aggarwal, 2008; The World Bank, 2011). This massive size and rapid
growth of SAARC region can provide high prospects for attracting downstream FDI to
the region. However, the low per capita income and high levels of poverty (Guha-
Khasnobis & Bari, 2000) associated with this region will to a certain extent undermine
the prospects created by size and growth attributes of the region.
In the past, South Asia has only being able to attract a very small amount of FDI, less
than 2% of global FDI inflows (Aggarwal, 2008), a performance that is not worthy for a
region of its size. South Asia not only has underperformed in terms of attracting FDI
from outside countries, but also has performed extremely poor in terms of generating
intra-regional FDI (Aggarwal, 2008). Except Sri Lanka and Nepal, which have received
considerable amount of FDI from India, none of the South Asian countries have attracted
a noteworthy amount of FDI from the regional partners (Aggarwal, 2008).
Majority of intra-regional FDI have flown from India to Sri Lanka; Sri Lanka has
received more than 50% of India‘s outward FDI in the SAARC region (Aggarwal, 2008).
India-Sri Lanka FTA has been instrumental for bilateral investment flows between Sri
Lanka and India. When the India-Sri Lanka FTA came into effect in 2000 (Aggarwal,
2008), India accounted for just about two per cent of Sri Lanka‘s FDI stocks (Jayasuriya
and Weerakoon 2001 cited in Aggarwal, 2008). Within five years India became the
fourth-largest investor (Aggarwal, 2008) and by 2010 India has become the main
contributor of the Sri Lanka‘s FDI inflows (Central Bank of Sri Lanka, 2010). FDI flows
125
from Sri Lanka to India have also increased significantly. Although this volume of FDI is
insignificant relative to India‘s volume of inward FDI, Sri Lanka has emerged as the
largest investor in India from the South Asian region (Aggarwal, 2008).
Apart from generating little intra-regional FDI, South Asia has also not been able to
generate considerable amount of intra-regional trade: Intra-SAARC trade (4.5%) has
been very small compared to Intra-EU trade (55%), intra-NAFTA trade (61%) and intra-
ASEAN trade (25%) (Aggarwal, 2008). Most of South Asian countries are comparable
in terms of their resources, skills and capabilities, income levels, and quality and cost of
labour (The World Bank, 2011), and therefore, there is little opportunity for these
countries to develop comparative advantage among themselves. This in turn will result in
low levels of intra-regional trade and investment in the South Asian region (Aggarwal,
2008). Also, vertical FDI is likely to take place between countries with considerable
differences in factor endowments (Yeyati, Stein, & Daude, 2002). Furthermore, countries
in South Asia are said to have broadly similar production structures and competing
exports, a fact which further undermines the potential of generating trade and FDI among
the SAARC countries. However, a comprehensive study is warranted to analyse
similarities and dissimilarities among South Asian nations in order to investigate whether
there are any opportunities to develop comparative advantages among themselves. Such
an exercise will be of great value in terms of improving intra-regional trade and
investments in the South Asian region.
Sri Lanka is included in several multilateral and bilateral trading agreements which can
be utilised to promote export oriented FDI. Sri Lanka is linked to South Asian nations
through three multilateral agreements: South Asian Free Trade Agreement (SAFTA),
South Asian Preferential Trade Agreement (SAPTA) and South Asian Association for
Regional Co-operation (SAARC) Framework Agreement on Trade in Services. Asia-
Pacific Trade Agreement (APTA) is the only regional trade agreement that links Sri
Lanka to East Asia (Central Bank of Sri Lanka, 2010). Sri Lanka also has bilateral trade
agreements with India and Pakistan: India-Sri Lanka Free Trade Agreement (ISFTA) and
Pakistan-Sri Lanka Free Trade Agreement (PSFTA) (Central Bank of Sri Lanka, 2010).
Despite being included in several regional trade agreements, Sri Lanka‘s exports
performance to nearby regions has not been significant. In 2010, USA and EU in
126
combine have accounted for 56% of total exports and Asia has only accounted for 16%
of total exports (Central Bank of Sri Lanka, 2010). The only positive export performance
in terms of regional trade partners is that India has been the third largest export
destination, behind USA and UK (Central Bank of Sri Lanka, 2010). Even though Sri
Lanka has not been able to achieve significant exports to its neighbouring countries, Sri
Lanka‘s imports have come mainly from Asian destinations. In 2010, Asian destinations
in combine have accounted for 60% of total imports; while India, Singapore, and China
contributing 21%, 8% and 7% respectively (Central Bank of Sri Lanka, 2010). In light of
these facts, it is apparent that Sri Lanka has not been able to benefit much from its
proximity to regional counterparts and regional trade agreements in terms of generating
exports while some of its regional partners have clearly benefitted from the proximity
and regional ties.
With the possible use of export promotion (EP) strategies, Sri Lanka could capitalise on
its regional trade agreements and attract export oriented FDI that target nearby regions.
Alternatively, with the use of import substitution (IS) policies, and understandably with
lesser trade liberalisation with its nearby regions, Sri Lanka could attempt to attract
import substitution FDI from its regional counterparts. Pursuing import substitution FDI
from its regional counterparts looks appealing over pursuing export oriented FDI that
target regional markets due to Sri Lanka‘s very low level of exports to regional partners
and high level of imports from regional partners. But such a strategy has many negative
aspects. First, it is recognised in the literature that, generally, EP strategy is likely to both
attract a higher volume of FDI and promote more efficient utilisation thereof compared
to IS strategy (Balasubramanyam, Salisu, & Sapsford, 1996). Furthermore, potential EP
oriented FDI is considered to be larger than potential IS-induced FDI because IS-induced
FDI is limited by the constraints of host-country market (Balasubramanyam, Salisu, &
Sapsford, 1996). Therefore, due to the limited market size of Sri Lanka compared to
some of its outsized trading partners, opportunity costs of import substitution policy/
trade restrictions is very high; Sri Lanka will lose the prospect of grabbing slices of
larger export markets of its regional partners by trying to generate import substitution
FDI from its regional imports which cater to a comparatively small internal market.
Export promotion policies are useful in providing incentives to MNCs to locate facilities
in the country and to export to larger regional markets. Contrastingly, import substitution
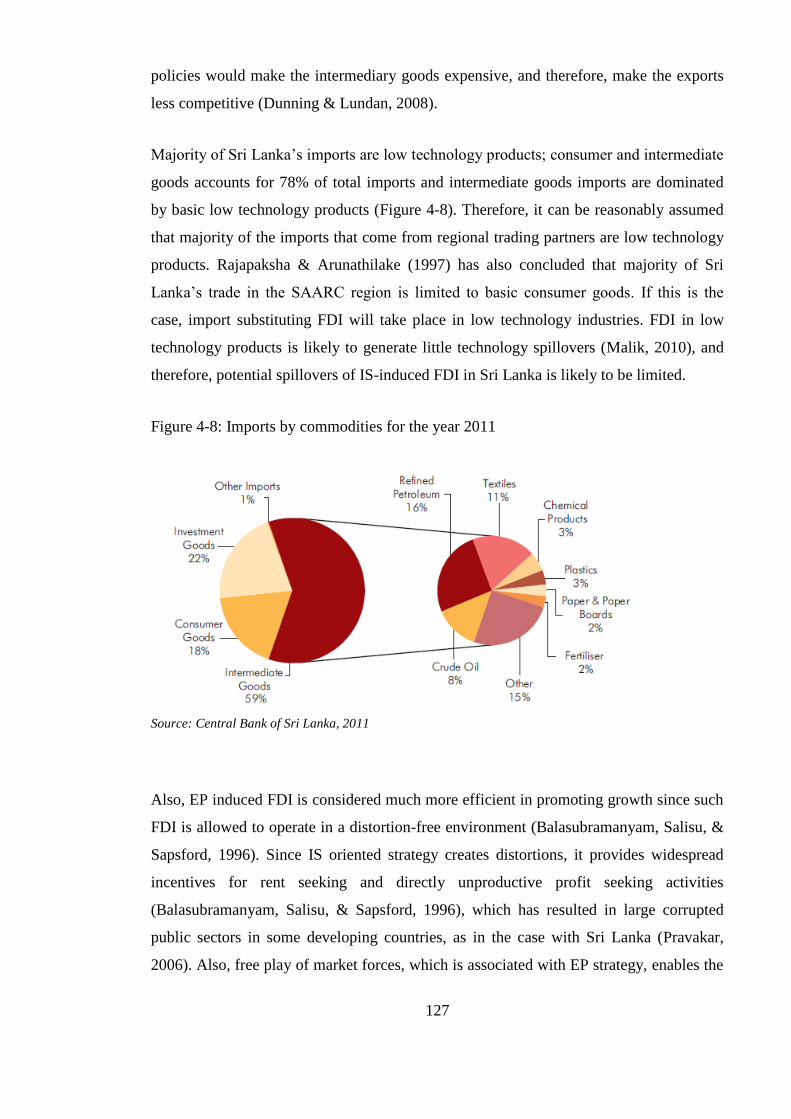
127
policies would make the intermediary goods expensive, and therefore, make the exports
less competitive (Dunning & Lundan, 2008).
Majority of Sri Lanka‘s imports are low technology products; consumer and intermediate
goods accounts for 78% of total imports and intermediate goods imports are dominated
by basic low technology products (Figure 4-8). Therefore, it can be reasonably assumed
that majority of the imports that come from regional trading partners are low technology
products. Rajapaksha & Arunathilake (1997) has also concluded that majority of Sri
Lanka‘s trade in the SAARC region is limited to basic consumer goods. If this is the
case, import substituting FDI will take place in low technology industries. FDI in low
technology products is likely to generate little technology spillovers (Malik, 2010), and
therefore, potential spillovers of IS-induced FDI in Sri Lanka is likely to be limited.
Figure 4-8: Imports by commodities for the year 2011
Source: Central Bank of Sri Lanka, 2011
Also, EP induced FDI is considered much more efficient in promoting growth since such
FDI is allowed to operate in a distortion-free environment (Balasubramanyam, Salisu, &
Sapsford, 1996). Since IS oriented strategy creates distortions, it provides widespread
incentives for rent seeking and directly unproductive profit seeking activities
(Balasubramanyam, Salisu, & Sapsford, 1996), which has resulted in large corrupted
public sectors in some developing countries, as in the case with Sri Lanka (Pravakar,
2006). Also, free play of market forces, which is associated with EP strategy, enables the

128
country to develop long term sustainable competencies through the allocation of
resources on the basis of comparative advantage.
Due to above reasons, pursuing EP-oriented FDI rather than import- oriented FDI in the
region is likely to be more beneficial for Sri Lanka. Along these lines, more trade
liberalisation within the region can be advocated. However, whether such a trade
liberalisation would promote FDI in Sri Lanka will largely depend on Sri Lanka‘s
location advantages and comparative advantages relative to other member countries as
well as the potential of the region as a whole to generate market seeking FDI
opportunities.
Sri Lanka is situated at the crossroads of major shipping routes connecting South Asia,
Far East and the Pacific with Europe and the Americas (Board of Investment Sri Lanka,
2011). Sri Lanka also has the advantages of being adjacent to India, close to Southeast
Asia and the Middle East, and not too distant from China. Therefore, MNCs that target
these markets have the option of locating their operations in Sri Lanka. Moreover, such
MNCs could also gain preferential trade access to Asian markets via regional and
bilateral trading agreements such as SAFTA, SAPTA, APTA, ISFTA, and PSFTA. The
only downside of Sri Lanka‘s geographical location is that Sri Lanka has India as the
only adjoining country while other countries in South Asia have contiguous neighbours
besides India (Dash, 1996). Undeniably, this fact would make Sri Lanka a bit
uncompetitive in terms of attracting MNCs that target other South Asian markets.
Empirical evidence suggests that, following accession to an RIA, geographic distance
between the home and the host country and the geographical location of the host country
within the region becomes more important determinants for attracting inward FDI (Feils
& Rahman, 2011; Velde & Bezemer, 2004). Moreover, Velde & Bezemer (2004) have
shown that countries located close to the largest country or close to the core of the region
benefit more from being part of a region. Therefore, being included in regional RIAs is
likely to boost the strength of Sri Lanka‘s favourable geographical location.
FDI can be categorised into two types according to the motives of MNCs: downstream
FDI and upstream FDI. FDI in search for increased sales is defined as downstream FDI
and FDI in search of increased production/sourcing efficiency is defined as upstream
129
FDI. In general, downstream FDI is attracted by the regions that have largest market
potential and upstream FDI is attracted by countries with low-cost labour, greater labour
productivity and better institutional efficiency (Feils & Rahman, 2011). Sri Lanka‘s
small internal market may limit the potential of downstream FDI. However, both the
literature and empirical studies suggest, subsequent to regional integration, market size of
an individual member becomes less important as a determinant of FDI inflows (Buckley
et al., 2001; Feils & Rahman, 2011). Following accession to an RIA, a country‘s labour
cost becomes more important in attracting FDI (Buckley et al., 2001)25
. Therefore,
regional integration would provide an opportunity for Sri Lanka to attract MNCs that
want to serve other regional markets. The imperative question is whether MNCs would
want to locate their operations in Sri Lanka instead of locating their operations inside the
country where their target market is. For example, why would a MNC that target Indian
market want to locate their operation in Sri Lanka instead of locating in India itself? This
question cannot be answered without a comprehensive comparison of location
characteristics, and comparative advantages of Sri Lanka with those of other countries in
the region.
Therefore, Sri Lanka might have a good opportunity to attract upstream FDI due to its
cheap but productive labour capital. However, since most of the South Asian countries
have comparably low wage rates, Sri Lanka will have to have a considerable advantage
in labour productivities over other countries in the region in order to become the prime
candidate for upstream FDI. However, as it was highlighted earlier, Sri Lanka has a poor
institutional infrastructure, which would be a constraint in attracting upstream FDI.
Nevertheless, other countries in the region are at least not better than Sri Lanka in terms
of institutional infrastructure. Therefore, improvements in institutional efficiency are
crucial for Sri Lanka, in order to stay ahead among other South Asian countries and to
reach standards of other Asian countries.
25
However, rather ironically, Feils and Rahman (2011) have shown that, following accession to an RIA,
labour cost efficiency becomes less important in attracting intra-regional FDI.

130
4.6. Concluding Remarks
This chapter provided a preliminary analysis of FDI in the context of Sri Lanka. Sri
Lanka had been considered, and continued to be considered, as a country with excellent
prospects for economic development. However, Sri Lanka‘s economic performance and
performance in FDI have so far failed to achieve their potential. FDI inflows have been
recently dominated by FDI into services. Manufacturing sector continues to attract
diminishing attention from foreign investors while agriculture sector remains largely
unexplored by foreign investors. Manufacturing FDI in Sri Lanka is narrowly
concentrated in a few sectors with little participation in technical intensive sectors.
Furthermore, export oriented manufacturing FDI has largely taken place in low-end
export oriented industries that are largely labour intensive. Although FDI in labour
intensive operations with less advanced technology can have a larger contribution to the
host country‘s employment, these operations do not attract advance technologies to the
host country and make limited contribution to the capability development in human
capital (United Nations, 1992).
After observing the industrial structure, composition of trade and composition of FDI in
third and fourth chapters, it can be comprehended that Sri Lanka is still in the stage one
of the investment development path (IDP). While almost all exports are generated in
resource and/or labour intensive sectors (with low technology intensity), majority of
imports takes place in consumer goods sectors and low technology intensive sectors.
Inward FDI flows have been modest and have gone into labour or resource intensive
manufacturing sectors and market oriented services sectors. Annual outward FDI flows
have been negligible, if not zero.
Civil war, which was considered as one of the main barriers to economic development
and to attract FDI, ended in 2009. This has given renewed hopes for Sri Lanka. Sri
Lanka‘s impressive human capital indicators remain as one of the key strengths but Sri
Lanka has yet failed to capitalise on this strength. Past political instability, poor
infrastructure, weak institutional factors, lower level of industrialisation and weaknesses
in export structure, ineffective and weak policy environment, and poorly managed
exchange rate policies appear to be major issues in terms of boosting future FDI inflows.
Regional context within which Sri Lanka operates pose both opportunities and

131
challenges. However, it appears that regional integration within the South Asian region
has yet failed to generate any tangible benefits to Sri Lanka, in general, and in terms of
boosting FDI flows.
132
Chapter 5 : Civil War and FDI –A Time Series and a Panel
Data Study
5.1 Introduction
FDI is subject to host country political risk in addition to economic factors, e.g. market
size, trade and trade-related factors, labor costs, tax and exchange rates, commonly
identified in the literature (Chakrabarti, 2001; Moosa, 2002). Political risk stems from
various political dynamics in the host country, including violence such as wars, riots,
disorders, labor unrests; stability of the host government; attitude of the host government;
and changes in the rules and regulations governing FDI.
Civil war is a major source of political instability of a country and, is likely to discourage
FDI. Due to a war that prevailed for three decades, Sri Lanka has gone through a
considerable degree of variation in conflict intensity, periods with war, without war, and
with ceasefire arrangements. It as a case study provides an excellent opportunity to
analyze the implications of war on FDI inflows.
This chapter presents two econometric studies conducted to determine the effect of the
civil war on FDI inflows to Sri Lanka. By employing time series and panel data
econometric analysis, these two econometric studies investigate the degrees of impact of
war on FDI, as a whole, FDI in manufacturing and FDI in services and manufacturing
FDI by market-orientation. First study employs time series econometric analysis based
on three series of FDI inflows: annual gross FDI inflows to Sri Lanka during the period
from 1980 to 2012, and annual net FDI inflow (increase in realised FDI stock) to
manufacturing sector and service sector during the period from 1984 to 2012. Second
study employs a panel study based on annual sector wise net FDI inflows (increase in
realised FDI stock) to manufacturing industries during the period from 1984 to 2012.
133
5.2 Effect of War on FDI
Politically instability, i.e. high degree of political risks, of a host country is considered as
one of the key concerns of potential foreign investors (Walsh & Yu, 2010). War and
political violence (including civil war, uprisings and terrorist attacks) is a major source of
political instability of a country. War and political violence in a country is likely to
discourage inflows of FDI, and therefore, should have a negative relationship with FDI
inflows. Some countries and regions that are associated with high level of political
conflict have performed very badly in terms of attracting FDI. For example, despite
having rich natural resources, competitive labour and large population (markets), Muslim
countries in the developing world are among the most unpopular destinations for FDI
mainly due to their political instability26
(Rahman, 2010).
Civil war can degrade the investment climate of the host country and increase the risk
to foreign investors. It can affect FDI both directly and indirectly. Direct effects
capture the possibility of destruction and damage to physical and human assets of FDI
due to violence. In addition to the loss of value to the assets, these damages can lead
to time delays, revenue losses due to stock outs, missed opportunities, reputation
damage and even complete close down of production lines, plants or firms (Jain &
Grosse, 2009).
Indirect effects can take many forms and be more widely spread than direct effects
(Czinkota, Knight , Liesch, & Steen, 2010). From the perspective of business,
profitability of MNCs can be adversely affected by war due to potential damages,
uncertainty and extra costs, such as costly insurance covers, extra security measures,
and business continuity plans. Conflicts can negatively affect the efficiency of
operations and efficiency of resource use and allocation in businesses; for example,
logistic issues due to extra security measures and travel restrictions, interruptions to
operations due to curfew and emergency situations. Moreover, host government can
bring in new regulations, policies and procedures to counter potential threats, which
could obstruct smooth business operations and increase transaction costs (Czinkota et
al., 2010). For example, many governments have increased their scrutiny of shipping
containers and have implemented new security programmes to safeguard ports and
26
57 Muslim countries received only 2.0 per cent of the world's total FDI in 2003
134
airports from terrorism, all of which have lower the efficiency of international
shipping and logistics (Czinkota et al., 2010). Firms may also have to incur additional
costs in complying with enhanced compliance and reporting requirements.
Disruptions in local operations can cause shortages or delays of critical inputs and
lead to interruptions in international supply chains (Czinkota et al., 2010).
From the perspective of demand, civil war can cause decline in buyer demand which
can have an adverse effect on market seeking FDI that cater to host country market.
Conflict related acts can create fear, panic and uncertainties which can negatively
affect demand for both consumer and industrial goods/services (Czinkota et al.,
2010).
War can also have a significant negative effect on the business environment in which
MNCs operate. There is a general consensus in the literature that war is the reason
why some countries fail to sustain adequate economic growth (Abadie &
Gardeazabal, 2003; Arunatilake, Jayasuriya, & Kelegama, 2001; Barro, 1991;
Blomberg, Hess, & Orphanides, 2004). For example, in their attempt to assess the
economic costs of War in Sri Lanka for the period 1984-1996, Arunatilake,
Jayasuriya, & Kelegama (2001) shows that WAR has contracted GDP growth rates in
Sri Lanka significantly. Also, extra military expenditure by the government can
crowd out expenditure in infrastructure which will have a negative impact on FDI
inflows. In the context of Sri Lanka, Arunatilake, Jayasuriya, & Kelegama (2001)
have shown that military expenditure has crowded out government investment
significantly. Quality of labour force can be affected due to displacements, disability,
death and emigration caused by internal conflicts (Arunatilake, Jayasuriya, &
Kelegama, 2001). Complicating this further, MNCs may be hesitant or find it difficult
to post their staff to conflict prone areas (Czinkota et al., 2010). MNCs will have to
duly compensate employees when they are posted in conflict prone areas, which can
increase labour costs considerably. Furthermore, host government may carry out extra
scrutiny on people entering the country and even tight immigration policies for
security reasons (Jain & Grosse, 2009; Enderwick, 2001). This can lead to delays in
issuing visas to foreigners and sometimes intimidate visiting foreign business people.
These HR related issues are likely to have an effect on operations of foreign
businesses and also on potential FDI. War may also weaken other institutional
135
dimensions. Presence of internal conflict can indirectly contribute to higher levels of
corruption (Arunatilake, Jayasuriya, & Kelegama, 2001), deterioration of rule of law,
fall in transparency and governance, and curtailment of civil liberties (Pradhan,
2001), all of which could have a negative impact on FDI inflows (Busse & Hefeker,
2007).
Empirical studies that give explicit attention to the effect of war/conflict on FDI
flows are in short supply (Czinkota et al., 2010), possibly due to researchers taking
the negative effect of war/conflict as granted. On the other hand, there exist a handful
of studies exploring the effects of broad political instability which normally
encapsulates war/conflict as a sub-component. These studies have largely relied on
composite measures of political instability published by various risk reporting
agencies. These empirical studies, both surveys and cross-country studies, have
produced mix results (Walsh & Yu, 2010; Agarwal, 1980). Some have found a
negative relationship between political instability and FDI inflows (Root & Ahmed,
1979; Schneider & Frey, 1985; Suliman & Mollick, 2009; Brada, Kutan, & Yigit,
2006) while some have found that there is little or no relationship between these two
variables (The World Bank, 1998; Wheeler & Mody, 1992; Bennett & Green, 1972;
Green and Cunningham, 1975; Kobrin, 1976; Asiedu, 2002).
Bennett & Green (1972), investigating the effect of political instability on direct
investments by US firms in marketing activities in forty-six countries, found that
political instability do not discourage such FDI flows27
. Kobrin (1976), investigating
the effect of economic, social, and political aspects of the host country environment on
investments of 187 major US manufacturing firms, found a strong relationship between
market-related variables and FDI but failed to find any relationship between FDI and
variables based on political event data. (Suliman & Mollick, 2009), investigating the
determinants of FDI in 29 sub-Saharan African countries from 1980 to 2003, find that the
incidence of war exerts strong negative effects on FDI inflows. Brada, Kutan, & Yigit
(2006), examining FDI flows to the transition economies of Central Europe, the Baltics
and the Balkans, report that while transition economies unaffected by conflict and
political instability received more FDI flows than comparable west European countries,
27
Bennett & Green (1972) use a 7-point scale, which was constructed by Feierabend & Feierabend (1966)
by assigning weights (from 0 to 6) to 30 types of politically destabilising events.
136
Balken countries, due to conflict and instability, received less FDI than comparable west
European countries.
Inconsistencies in these research outputs can be due to various reasons. These studies
have employed different kinds of data and methodologies and also have used different
definitions for political instability (Agarwal, 1980). Also, the risk faced by MNCs in
different industries and also from different home countries will vary according to the
context of the political instability (Agarwal, 1980). Furthermore, some countries offer
various incentives and guarantees for the investments in order to mitigate the effect of
political risk, and effects of such schemes are usually not incorporated in these research
studies (Agarwal, 1980).
Moreover, most of these studies have looked at the impact of broad political instability
variable which encapsulates many dimensions of political instability and many studies
rely on composite measures of political instability published by various risk reporting
agencies. Use of broad measures of political instability can bias results due to various
reasons. First, each dimension of political instability can have different effects on FDI.
For example, risk of changing policy environment and risk of potential damages from a
civil war are likely to have completely different implications on incoming FDI. Most of
the policy environmental factors usually change slowly, and therefore, may have a
limited explanatory power to explain inter-temporal variations of FDI flows; in contrast,
civil war can vary fast, and therefore, are likely to be more important in explaining inter-
temporal variations of FDI flows (Fielding, 2004). Also, cross section studies that look
into the relationship between a composite measure of different dimensions of political
instability and FDI flows are likely to generate bias results. Moreover, slope coefficients
of political instability variable in cross country studies are the average effect of political
instability on FDI flows across all the countries in the sample, and therefore, the effect of
various types of political instability on various countries/contexts become ambiguous
(Fielding, 2004).
One way to overcome these issues and to understand the true effect of civil war on FDI is
to conduct time series studies and panel data studies on a country that have gone through
a considerable degree of variation in conflict intensity. To this end Sri Lanka becomes a
valuable case study to analyse the impact of political conflict on FDI flows.

137
Sri Lanka as a case study provides an excellent opportunity to analyse the implications of
war on FDI inflows because intensity of war in Sri Lanka has varied significantly during
different timeframes, consisting of periods with war, without war, and with ceasefire
arrangements. As guided by the literature and past empirical studies, it is hypothesised
that civil war negatively affects FDI inflows.
138
5.3. Impact of Civil War on FDI by Sector
War can increase the risks to investments and undermine the host country location
advantages. Therefore, MNCs might opt for alternative forms of serving the host market
such as exporting or licensing over FDI or completely avoid serving the host country.
However, are manufacturing and services FDI affected differently by civil war? Do both
export-oriented FDI and market-seeking FDI react to civil war in the same way? Studies
investigating the relationship of civil war to different sorts of FDI or FDI in different
sectors is almost non-existent (Czinkota et al., 2010; Driffield, Jones, & Crotty, 2013).
But there are reasons to believe that the determinants of services FDI might differ from
those of manufacturing FDI and determinants may also vary by the market-orientation of
manufacturing FDI.
The degree to which FDI being substituted or avoided can largely depend on type of FDI
(whether horizontal or vertical), characteristics of the investment (size and degree of sunk
cost) and characteristics of products/services. Foreign firms may be less inclined to
undertake FDI in conflict zones in sectors that need large investments and the degree of
sunk costs associated with the investments is high, and may substitute FDI with
alternative forms or may completely avoid it. Therefore, FDI in different sectors can have
different sensitivities to conflict.
As is established in the literature, firms may prefer undertaking FDI over exporting when
marginal costs of exporting are high compared to fixed costs of FDI (Greenway &
Kneller, 2007) but the threshold required to shift from exports to FDI may vary by sector
in the presence of war. Due to distinctive characteristics of services, mainly simultaneity,
inseparability and perishability28
, most services are usually non-tradable or very costly to
trade and are location bound (Brouthers & Brouthers, 2003; Dunning, 1989). These
characteristics and shorter life cycle of services therefore imply that service FDI is not
easily substituted by other forms. If service firms intend to service countries in conflicts,
they have to undertake FDI. Service FDI also tend to require substantially lower levels of
28
Simultaneity means that services tend to be produced, delivered and consumed simultaneously.
Inseparability refers to the impossibility of separating service production from service consumption and
difficulty of separating service from the service provider. Perishability signifies that service cannot be
inventoried like products. These characteristics tend services to be normally geographically linked, i.e. the
service firm needs to be present at the time of production and consumption.
139
financial resource commitments than manufacturing (Brouthers & Brouthers, 2003).
Therefore, I posit that service FDI is less sensitive to conflict than manufacturing.
Conflict may also affect manufacturing FDI differently by market-orientation. For
market-seeking FDI, i.e. when FDI is undertaken to cater to local market, both the FDI
operation and target market are prone to conflict; however, the potential damage is
completely localized. In contrast, when export-oriented FDI is undertaken in a conflict
zone, the FDI operation and the target market are in different locations. Disruption in the
conflict zone can have a wider impact on other markets. With shortening of lead times
particularly due to practices such as just-in-time manufacturing, lean manufacturing, and
made to order strategies, locating part of global supply chain in a conflict zone increase
vulnerability to the potential disruptions to the entire global operations, something which
manufacturing MNCs cannot afford (Czinkota et al., 2010; Enderwick, 2001; Jain &
Grosse, 2009). Conflict can increase uncertainty and amplify inherent risk that
entrepreneurs face, and therefore, can divert economic resources from productive use,
and thus, can decrease factor demands (Colino, 2012). These demand uncertainties can
have a major impact on export-oriented manufacturing FDI while having a limited
impact on market-seeking manufacturing FDI. Furthermore, a firm undertaking offshore
export-oriented manufacturing may have several location options that provide similar
locational benefits, and therefore, may be relatively convenient in locating the
manufacturing operations in a conflict free alternative location. In contrast, when market-
seeking manufacturing FDI is substituted by exports, a firm may have to incur additional
marginal costs (tariff/transportation costs). Therefore, export-oriented FDI is likely to be
more sensitive to war than market-seeking FDI.
Following from the above discussion, the following hypotheses are derived. These
hypotheses will be tested using Sri Lanka‘s experience:
1) Civil war has higher level of impact on manufacturing FDI than service FDI
2) Civil war has higher level of impact on export-oriented manufacturing FDI
than market-seeking FDI.
140
5.4 Time Series Study Based on Aggregate FDI Inflows and FDI in
Manufacturing and Services
5.4.1 Methodology
This econometric study employs three sets of time series analysis based on annual gross
FDI inflows to Sri Lanka during 1980-2012, and annual net FDI inflows to
manufacturing sector and service sector during 1984-201229
. Each FDI series will be
regressed against civil war variables and an appropriate set of control variables. Three
different proxies are used to represent civil war: WAR, CONFLICT and NKILL. WAR is
a binary variable identifying whether an internal conflict was present in Sri Lanka.
Suliaman & Mollick (2009) and Kravis & Lipsey (1982) have also used such dummy
variable to capture the presence and absence of war. CONFLICT includes two sets of
dummy variables, C1 and C2, which are constructed from the conflict intensity variable
published by Uppsala Conflict Data Program (UCDP) and Centre for the Study of Civil
Wars, International Peace Research Institute, Oslo (PRIO). C1 indicates the presence of
minor war and C2 indicates the presence of major war. NKILL is also a measure of
conflict intensity and is the number of conflict related deaths reported by National
Consortium for the Study of Terrorism and Responses to Terrorism (START). In the
extant empirical literature, ‗deaths per year‘ is widely used and is considered as an
appropriate measure to gauge the civil war severity (Murdoch & Sandler, 2002; Drakos,
2011 and Hicks & Jeff, 2009).
Guided by the existing literature on FDI determinants and on the availability of time
series data for Sri Lanka, four measures of control variables are selected: market growth,
interest rate, trade openness and infrastructure. Market size is expected to positively
affect FDI. Many studies use real GDP growth rate to control for market demand of the
host country (Chakrabarti, 2001; Suliman & Mollick, 2009). Three different growth rates
are used in this study in order to relate to different types of FDI: GDP growth rate (GR),
growth rate in value added in manufacturing (GRM) and growth rate in value added in
services (GRS) are used for total FDI, FDI in manufacturing and FDI in services,
respectively.
29
Annual gross FDI inflows are realized FDI reported at the end of each year. Since sector-wise FDI
inflows are not reported, sector-wise FDI for each year were taken as the difference between cumulative
realized FDI figure for that year and previous year. Therefore, the FDI figure for manufacturing and
services considered here is the net FDI (net of any divestments or any capital erosions due to negative
profits) rather than gross FDI.
141
Lower real interest rates (RIR) can augment investment and increase the profitability,
therefore, could augment FDI. Real interest rates can also be used as an ancillary variable
to measure overall macroeconomic stability (Erdal & Tatoglu, 2002). Macroeconomic
stability can lead to higher sustainable growth rates, smaller fiscal and trade deficits, all
of which again can have a positive effect on incoming FDI (Busse & Hefeker, 2007).
Therefore, real interest rate is included as a control variable. I expect a negative
relationship between real interest rate and FDI (Erdal & Tatoglu, 2002).
Trade openness (TO) is another widely used control variable (Chakrabarti, 2001;
Suliman & Mollick, 2009) and is expected to have a positive or negative relationship
with FDI depending on whether FDI and trade substitute or complement each other. It is
often measured by trade intensity. Since majority of empirical studies supports for a
positive relationship between trade openness and FDI (see, for example Erdal & Tatoglu,
2002; Suliman & Mollick, 2009; Noorbakhsh, Paloni, & Youssef, 1999; Abbott,
Cushman, & De Vita, 2012), I expect to see a positive relationship between FDI and TO.
Finally, telephone density (TP) measured by telephone lines per 100 people is included
as a measure of the level of infrastructure. Previous studies on FDI determinants have
highlighted the importance of level of infrastructure for incoming FDI, and majority of
studies have used telephone density as a proxy for the level of infrastructure in the host
country (Suliman & Mollick, 2009). Description and sources of variables used in this
time series study is given in Table 5-1. Table 5-2 presents descriptive statistics.
The following three initial specifications will be estimated with suitable estimation
methods.
FDI = ƒ (X, GR, RIR, TO, TP) 5.1
FDIS = ƒ (X, GRS, RIR, TO, TP) 5.2
FDIM = ƒ (X, GRM, RIR, TO, TP) 5.3
Where, X is the conflict related variable which is either WAR, CONFLICT or NKILL.
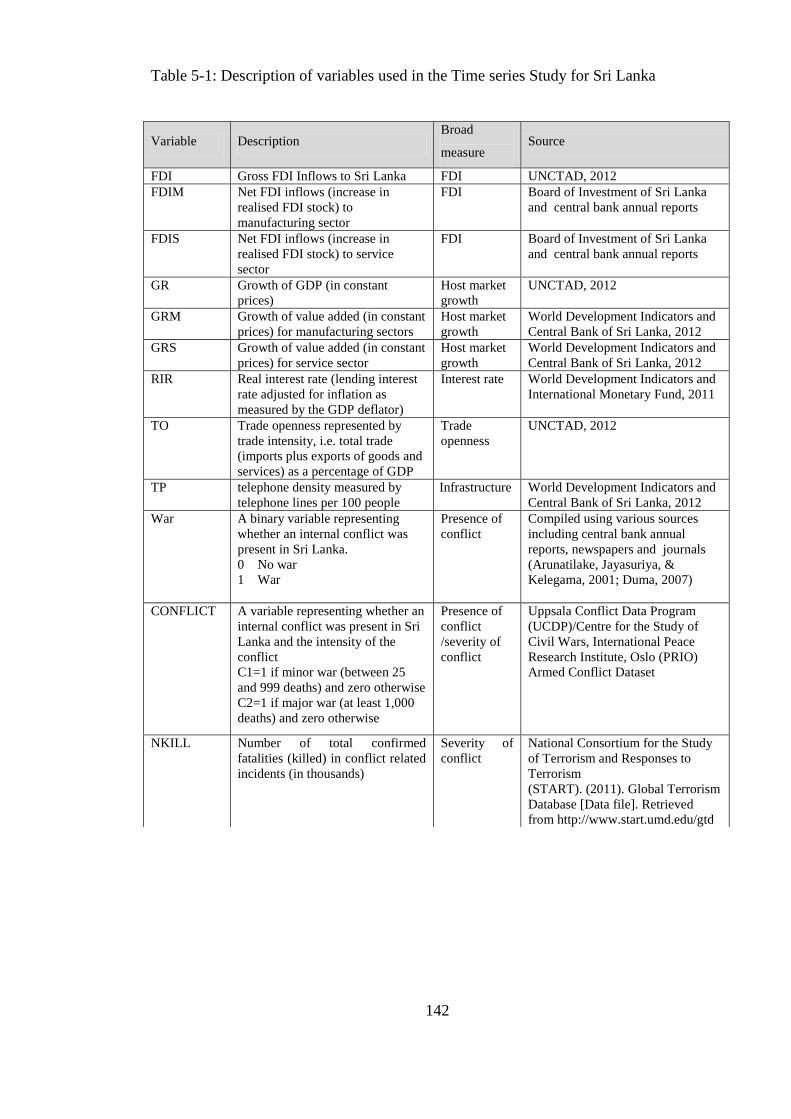
142
Table 5-1: Description of variables used in the Time series Study for Sri Lanka
Variable Description Broad
measure Source
FDI Gross FDI Inflows to Sri Lanka FDI UNCTAD, 2012
FDIM Net FDI inflows (increase in
realised FDI stock) to
manufacturing sector
FDI Board of Investment of Sri Lanka
and central bank annual reports
FDIS Net FDI inflows (increase in
realised FDI stock) to service
sector
FDI Board of Investment of Sri Lanka
and central bank annual reports
GR Growth of GDP (in constant
prices)
Host market
growth
UNCTAD, 2012
GRM Growth of value added (in constant
prices) for manufacturing sectors
Host market
growth
World Development Indicators and
Central Bank of Sri Lanka, 2012
GRS Growth of value added (in constant
prices) for service sector
Host market
growth
World Development Indicators and
Central Bank of Sri Lanka, 2012
RIR Real interest rate (lending interest
rate adjusted for inflation as
measured by the GDP deflator)
Interest rate World Development Indicators and
International Monetary Fund, 2011
TO Trade openness represented by
trade intensity, i.e. total trade
(imports plus exports of goods and
services) as a percentage of GDP
Trade
openness
UNCTAD, 2012
TP telephone density measured by
telephone lines per 100 people
Infrastructure World Development Indicators and
Central Bank of Sri Lanka, 2012
War A binary variable representing
whether an internal conflict was
present in Sri Lanka.
0 No war
1 War
Presence of
conflict
Compiled using various sources
including central bank annual
reports, newspapers and journals
(Arunatilake, Jayasuriya, &
Kelegama, 2001; Duma, 2007)
CONFLICT A variable representing whether an
internal conflict was present in Sri
Lanka and the intensity of the
conflict
C1=1 if minor war (between 25
and 999 deaths) and zero otherwise
C2=1 if major war (at least 1,000
deaths) and zero otherwise
Presence of
conflict
/severity of
conflict
Uppsala Conflict Data Program
(UCDP)/Centre for the Study of
Civil Wars, International Peace
Research Institute, Oslo (PRIO)
Armed Conflict Dataset
NKILL Number of total confirmed
fatalities (killed) in conflict related
incidents (in thousands)
Severity of
conflict
National Consortium for the Study
of Terrorism and Responses to
Terrorism
(START). (2011). Global Terrorism
Database [Data file]. Retrieved
from http://www.start.umd.edu/gtd
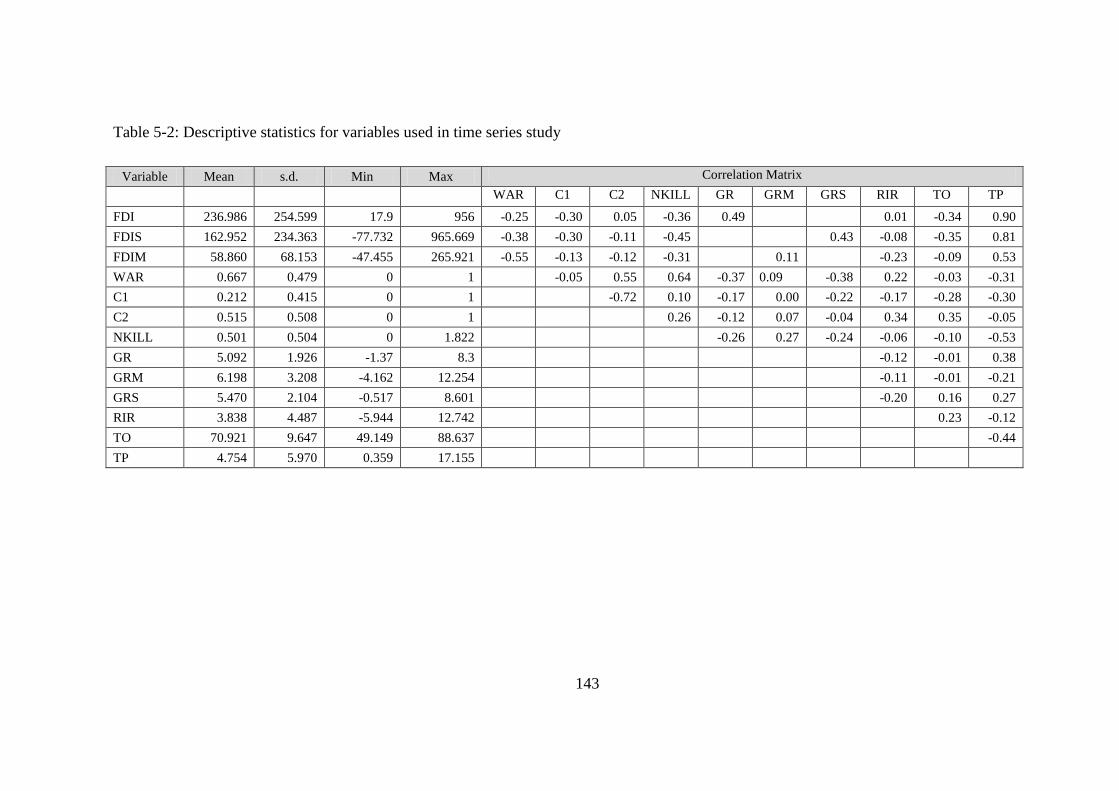
143
Table 5-2: Descriptive statistics for variables used in time series study
Variable Mean s.d. Min Max Correlation Matrix
WAR C1 C2 NKILL GR GRM GRS RIR TO TP
FDI 236.986 254.599 17.9 956 -0.25 -0.30 0.05 -0.36 0.49 0.01 -0.34 0.90
FDIS 162.952 234.363 -77.732 965.669 -0.38 -0.30 -0.11 -0.45 0.43 -0.08 -0.35 0.81
FDIM 58.860 68.153 -47.455 265.921 -0.55 -0.13 -0.12 -0.31 0.11 -0.23 -0.09 0.53
WAR 0.667 0.479 0 1 -0.05 0.55 0.64 -0.37 0.09 -0.38 0.22 -0.03 -0.31
C1 0.212 0.415 0 1 -0.72 0.10 -0.17 0.00 -0.22 -0.17 -0.28 -0.30
C2 0.515 0.508 0 1 0.26 -0.12 0.07 -0.04 0.34 0.35 -0.05
NKILL 0.501 0.504 0 1.822 -0.26 0.27 -0.24 -0.06 -0.10 -0.53
GR 5.092 1.926 -1.37 8.3 -0.12 -0.01 0.38
GRM 6.198 3.208 -4.162 12.254 -0.11 -0.01 -0.21
GRS 5.470 2.104 -0.517 8.601 -0.20 0.16 0.27
RIR 3.838 4.487 -5.944 12.742 0.23 -0.12
TO 70.921 9.647 49.149 88.637 -0.44
TP 4.754 5.970 0.359 17.155
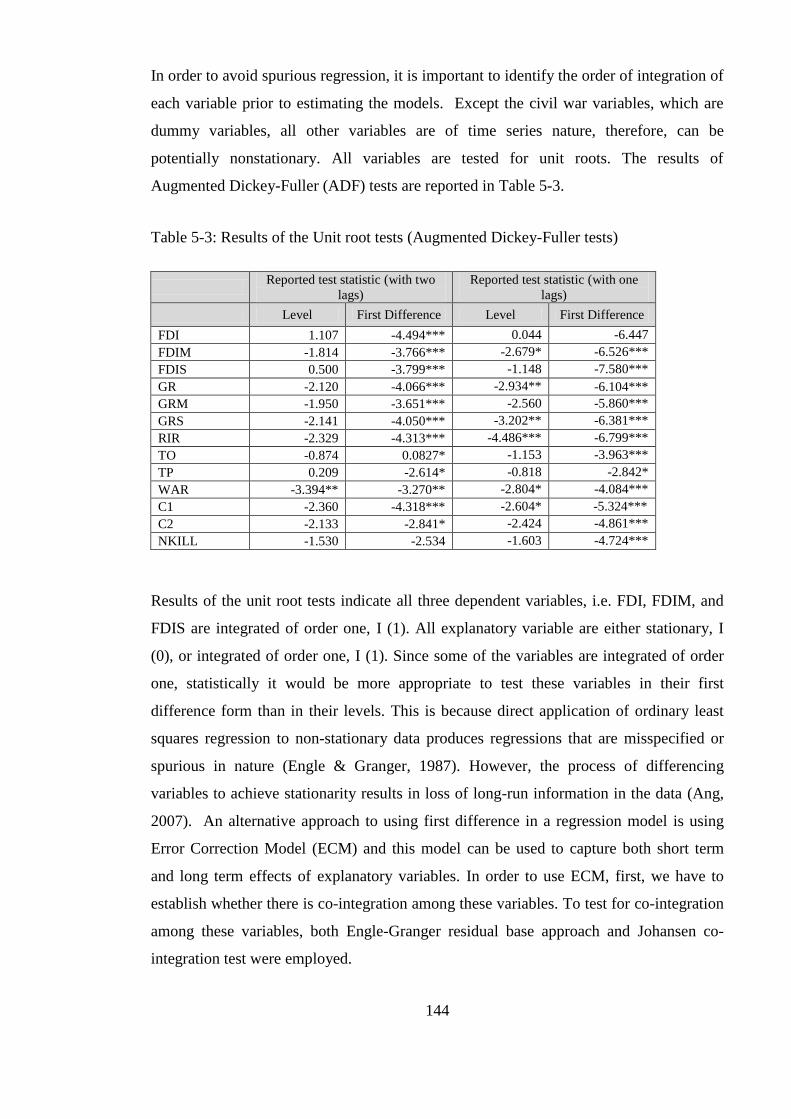
144
In order to avoid spurious regression, it is important to identify the order of integration of
each variable prior to estimating the models. Except the civil war variables, which are
dummy variables, all other variables are of time series nature, therefore, can be
potentially nonstationary. All variables are tested for unit roots. The results of
Augmented Dickey-Fuller (ADF) tests are reported in Table 5-3.
Table 5-3: Results of the Unit root tests (Augmented Dickey-Fuller tests)
Reported test statistic (with two
lags)
Reported test statistic (with one
lags)
Level First Difference Level First Difference
FDI 1.107 -4.494*** 0.044 -6.447
FDIM -1.814 -3.766*** -2.679* -6.526***
FDIS 0.500 -3.799*** -1.148 -7.580***
GR -2.120 -4.066*** -2.934** -6.104***
GRM -1.950 -3.651*** -2.560 -5.860***
GRS -2.141 -4.050*** -3.202** -6.381***
RIR -2.329 -4.313*** -4.486*** -6.799***
TO -0.874 0.0827* -1.153 -3.963***
TP 0.209 -2.614* -0.818 -2.842*
WAR -3.394** -3.270** -2.804* -4.084***
C1 -2.360 -4.318*** -2.604* -5.324***
C2 -2.133 -2.841* -2.424 -4.861***
NKILL -1.530 -2.534 -1.603 -4.724***
Results of the unit root tests indicate all three dependent variables, i.e. FDI, FDIM, and
FDIS are integrated of order one, I (1). All explanatory variable are either stationary, I
(0), or integrated of order one, I (1). Since some of the variables are integrated of order
one, statistically it would be more appropriate to test these variables in their first
difference form than in their levels. This is because direct application of ordinary least
squares regression to non-stationary data produces regressions that are misspecified or
spurious in nature (Engle & Granger, 1987). However, the process of differencing
variables to achieve stationarity results in loss of long-run information in the data (Ang,
2007). An alternative approach to using first difference in a regression model is using
Error Correction Model (ECM) and this model can be used to capture both short term
and long term effects of explanatory variables. In order to use ECM, first, we have to
establish whether there is co-integration among these variables. To test for co-integration
among these variables, both Engle-Granger residual base approach and Johansen co-
integration test were employed.

145
Since WAR is a dummy variable, inclusion of the variables in the Johansen co-
integration test was not possible due to collinearity between error and the dummy
variables. However, we can carry out the co-integration test for non stationary time series
to detect co-integration relationship, and then safely plug in other I (0) variables into the
model and still expect the identified co-integration relationship to persist (Charemza &
Deadman, 1997). Therefore, the Johansen co-integration test was conducted for the rest
of the variables except WAR, for example, co-integration test for specification 5.1 was
carried out for variables FDI, GR, RIR, TO and TP. For all specifications, Johansen co-
integration test was carried out using a lag level of one, which was suggested by Schwarz
Bayesian Criterion (SBC).
Results of the Johansen co-integration tests are presented in Table 5-4. For all three
specifications, as per the Trace test, null hypothesis of no co-integration (r=0) can be
rejected at 5% significant levels but null hypothesis of at most 1 co-integration
relationship (r ≤ 1) cannot be rejected30
. Therefore, test results indicate that there is one
co-integration relationship in all three specifications.
Alternatively, Engle-Granger residual based approach was also used to test co-integration
between these variables. For co-integration to be present, there should be a linear
combination of FDI, GR, RIR, TO, and TP that is stationary. According to Engle-
Granger residual based approach, the residuals from the regression of FDI on GR, RIR,
TO, and TP were tested for stationarity using ADF test. Student-t ratio depends on the
number of coefficients estimated and there are four coefficients to be estimated in this
co-integration test. Therefore, we cannot use critical values from the standard DF/ADF
tables where the number of coefficients estimated is assumed to be zero; instead we have
to use critical values from the tables for positive number of estimated coefficients
(Charemza & Deadman, 1997). Similarly, this co-integration test was repeated for
specification 5.2 and specification 5.3.
30
Max-eigenvalue test also produce similar results for specification 5.1 and 5.2. For specification 5.3, null
hypothesis of at most 1 co-integration relationship (r ≤ 1) can be rejected, but very marginally (Max-
eigenvalue statistic is almost equal to 5% critical value). Therefore, Max-eigenvalue test result can be fairly
approximated to indicate a 1 co-integration relationship for specification 5.3.

146
Table 5-4: Results of the Johansen co-integration test
Null Hypothesis: hypothesised number of co-integrating equations
None At most 1 At most 2
For specification 4.1: co-integrating
equations among FDI, GR, RIR, TO, and
TP
Eigenvalue
0.784983 0.604817 0.379852
Trace test Trace Statistic 87.82164 44.78458 18.78919
5% critical value 69.81889 47.85613 29.79707
Max-eigenvalue test Max-Eigen statistic 43.03706 25.99539 13.37833
5% critical value 33.87687 27.58434 21.13162
For specification 4.2: co-integrating
equations among FDIS, GRS, RIR, TO,
and TP
Eigenvalue
0.720882 0.563293 0.428364
Trace test Trace Statistic 77.05946 42.60417 20.23488
5% critical value 69.81889 47.85613 29.79707
Max-eigenvalue test Max-Eigen statistic 34.45529 22.36929 15.09984
5% critical value 33.87687 27.58434 21.13162
For specification 4.3: co-integrating
equations among FDIM, GRM, RIR, TO,
and TP
Eigenvalue 0.723821 0.644272 0.243963
Trace test Trace Statistic 73.65603 38.91494 11.00801
5% critical value 69.81889 47.85613 29.79707
Max-eigenvalue test Max-Eigen statistic 34.74109 27.90693 7.550969
5% critical value 33.87687 27.58434 21.13162
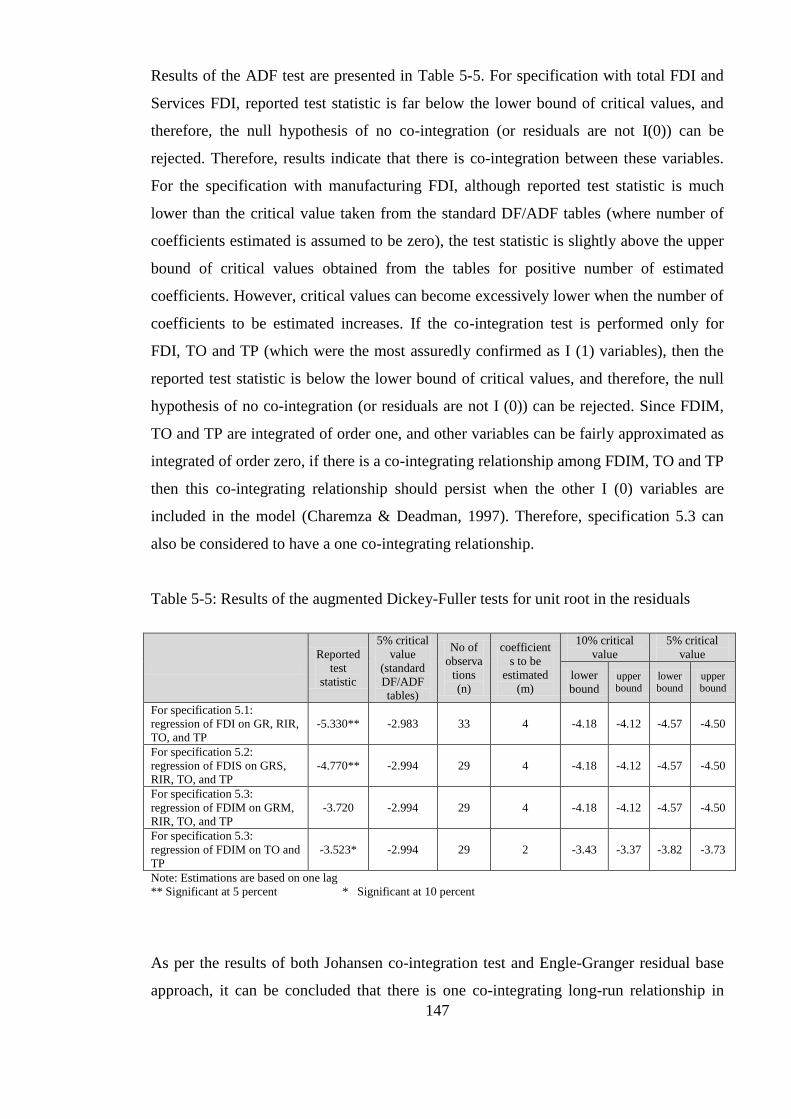
147
Results of the ADF test are presented in Table 5-5. For specification with total FDI and
Services FDI, reported test statistic is far below the lower bound of critical values, and
therefore, the null hypothesis of no co-integration (or residuals are not I(0)) can be
rejected. Therefore, results indicate that there is co-integration between these variables.
For the specification with manufacturing FDI, although reported test statistic is much
lower than the critical value taken from the standard DF/ADF tables (where number of
coefficients estimated is assumed to be zero), the test statistic is slightly above the upper
bound of critical values obtained from the tables for positive number of estimated
coefficients. However, critical values can become excessively lower when the number of
coefficients to be estimated increases. If the co-integration test is performed only for
FDI, TO and TP (which were the most assuredly confirmed as I (1) variables), then the
reported test statistic is below the lower bound of critical values, and therefore, the null
hypothesis of no co-integration (or residuals are not I (0)) can be rejected. Since FDIM,
TO and TP are integrated of order one, and other variables can be fairly approximated as
integrated of order zero, if there is a co-integrating relationship among FDIM, TO and TP
then this co-integrating relationship should persist when the other I (0) variables are
included in the model (Charemza & Deadman, 1997). Therefore, specification 5.3 can
also be considered to have a one co-integrating relationship.
Table 5-5: Results of the augmented Dickey-Fuller tests for unit root in the residuals
Reported
test
statistic
5% critical
value
(standard
DF/ADF
tables)
No of
observa
tions
(n)
coefficient
s to be
estimated
(m)
10% critical
value
5% critical
value
lower
bound upper bound
lower bound
upper bound
For specification 5.1:
regression of FDI on GR, RIR,
TO, and TP
-5.330** -2.983 33 4 -4.18 -4.12 -4.57 -4.50
For specification 5.2:
regression of FDIS on GRS,
RIR, TO, and TP
-4.770** -2.994 29 4 -4.18 -4.12 -4.57 -4.50
For specification 5.3:
regression of FDIM on GRM,
RIR, TO, and TP
-3.720 -2.994 29 4 -4.18 -4.12 -4.57 -4.50
For specification 5.3:
regression of FDIM on TO and
TP
-3.523* -2.994 29 2 -3.43 -3.37 -3.82 -3.73
Note: Estimations are based on one lag
** Significant at 5 percent * Significant at 10 percent
As per the results of both Johansen co-integration test and Engle-Granger residual base
approach, it can be concluded that there is one co-integrating long-run relationship in
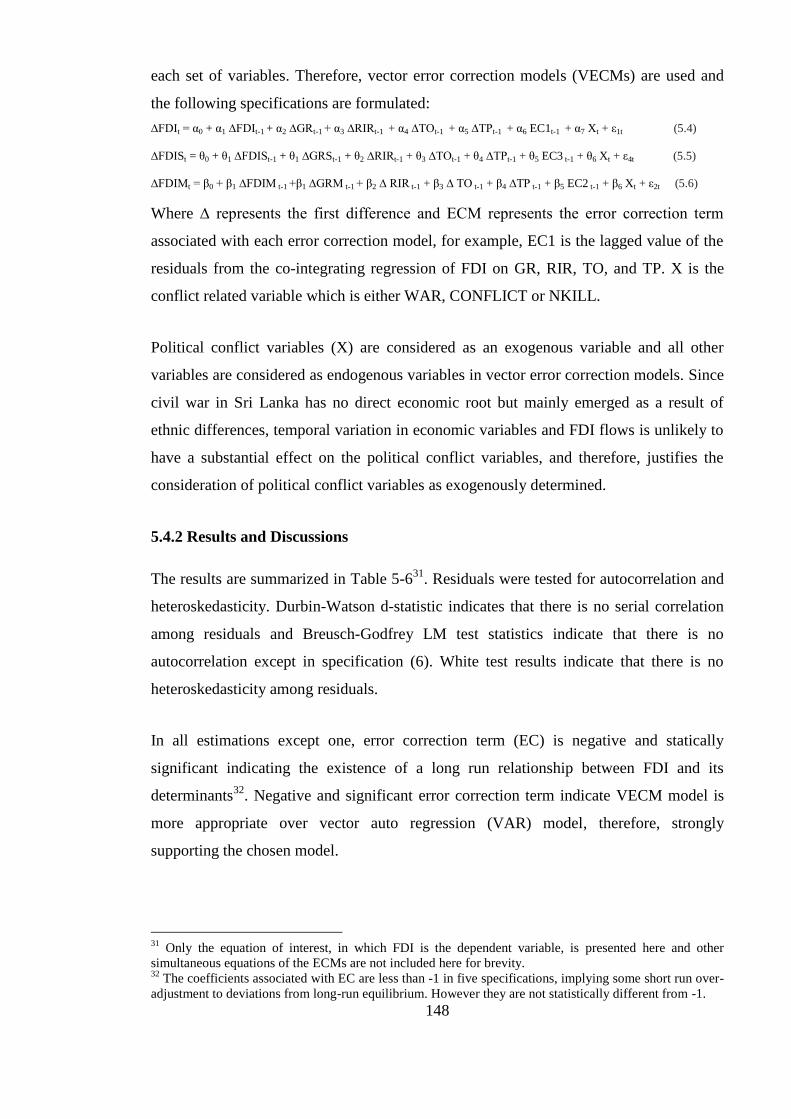
148
each set of variables. Therefore, vector error correction models (VECMs) are used and
the following specifications are formulated:
∆FDIt = α0 + α1 ∆FDIt-1 + α2 ∆GRt-1 + α3 ∆RIRt-1 + α4 ∆TOt-1 + α5 ∆TPt-1 + α6 EC1t-1 + α7 Xt + ε1t (5.4)
∆FDISt = θ0 + θ1 ∆FDISt-1 + θ1 ∆GRSt-1 + θ2 ∆RIRt-1 + θ3 ∆TOt-1 + θ4 ∆TPt-1 + θ5 EC3 t-1 + θ6 Xt + ε4t (5.5)
∆FDIMt = β0 + β1 ∆FDIM t-1 +β1 ∆GRM t-1 + β2 ∆ RIR t-1 + β3 ∆ TO t-1 + β4 ∆TP t-1 + β5 EC2 t-1 + β6 Xt + ε2t (5.6)
Where ∆ represents the first difference and ECM represents the error correction term
associated with each error correction model, for example, EC1 is the lagged value of the
residuals from the co-integrating regression of FDI on GR, RIR, TO, and TP. X is the
conflict related variable which is either WAR, CONFLICT or NKILL.
Political conflict variables (X) are considered as an exogenous variable and all other
variables are considered as endogenous variables in vector error correction models. Since
civil war in Sri Lanka has no direct economic root but mainly emerged as a result of
ethnic differences, temporal variation in economic variables and FDI flows is unlikely to
have a substantial effect on the political conflict variables, and therefore, justifies the
consideration of political conflict variables as exogenously determined.
5.4.2 Results and Discussions
The results are summarized in Table 5-631
. Residuals were tested for autocorrelation and
heteroskedasticity. Durbin-Watson d-statistic indicates that there is no serial correlation
among residuals and Breusch-Godfrey LM test statistics indicate that there is no
autocorrelation except in specification (6). White test results indicate that there is no
heteroskedasticity among residuals.
In all estimations except one, error correction term (EC) is negative and statically
significant indicating the existence of a long run relationship between FDI and its
determinants32
. Negative and significant error correction term indicate VECM model is
more appropriate over vector auto regression (VAR) model, therefore, strongly
supporting the chosen model.
31
Only the equation of interest, in which FDI is the dependent variable, is presented here and other
simultaneous equations of the ECMs are not included here for brevity. 32
The coefficients associated with EC are less than -1 in five specifications, implying some short run over-
adjustment to deviations from long-run equilibrium. However they are not statistically different from -1.
149
Lagged FDI (∆FDIt-1) is statistically insignificant, indicating current FDI flows is not
influenced by past FDI flows. Different from established consensus of the importance of
market size to FDI inflows (Chakrabarti, 2001), GDP growth is found to have no effect
on FDI inflows in Sri Lanka, either for aggregate FDI or for FDI in manufacturing and
FDI in services. Real interest rate (RIR) has the expected sign of being negative and is
statistically significant in most of the estimations. Trade openness (TO) is highly
insignificant. Finally telephone density (TP) are positive as expected and significant in
some estimations. Although coefficients of some of the explanatory variables are
individually not significant, as suggested by a significant F statistics, explanatory
variables are jointly significant.
Now turning to the variables of interest, i.e. WAR, CONFLICT and NKILL, all three
variables have the expected negative sign. The negative coefficient of WAR is
statistically insignificant for total FDI and services FDI but is highly significant for
manufacturing FDI, clearly demonstrating that WAR has a significant negative impact on
FDI in manufacturing compared to services. The estimated coefficient of WAR in
column 4 signifies that average value of FDI in manufacturing is US$ 92 million less
during war than that in absence of war. Given the average FDI flows to manufacturing
was only around US$ 59 million (Table 5-2), the magnitude of the estimated coefficient
appears to be considerably large. In order to compare the effects of war on FDI in
manufacturing and FDI in services, beta coefficients were estimated for the estimated
coefficients of WAR33
. Estimated beta coefficient of WAR for manufacturing FDI (-
0.65) is significantly higher than the estimated beta coefficient of WAR for services FDI
(-0.25). This differential impact of WAR explains why the relationship between WAR
and aggregate gross FDI flows is insignificant. WAR could instigate FDI, and the impact
can be much larger for net FDI (increase in realised FDI) inflows than gross FDI inflows.
This divestment phenomenon might have also caused the impact to be larger for net FDI
inflows compared to that of gross FDI inflows.
33
Beta coefficient of explanatory variable (WAR) is equal to the product of the estimated coefficient of the
explanatory variable (WAR) and the ratio of the standard deviation of the explanatory variable (WAR) to
the standard deviation of the dependent variables (FDIS and FDIM)
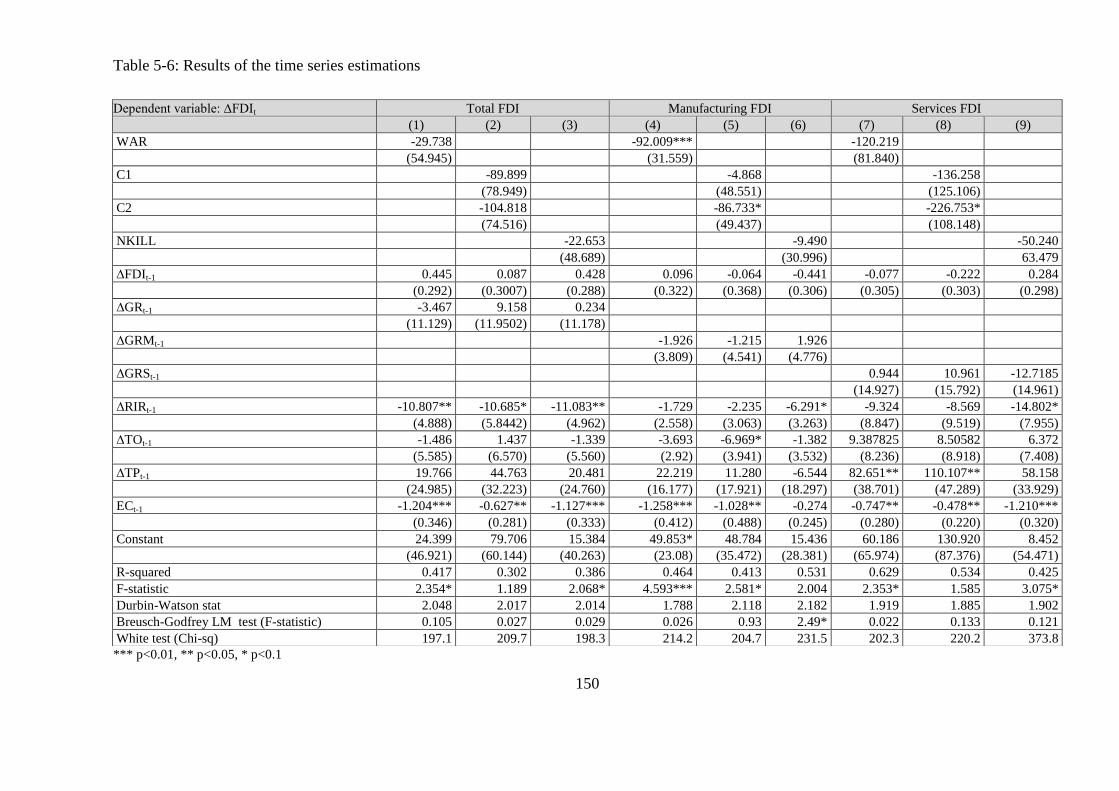
150
Table 5-6: Results of the time series estimations
*** p<0.01, ** p<0.05, * p<0.1
Dependent variable: ∆FDIt Total FDI Manufacturing FDI Services FDI
(1) (2) (3) (4) (5) (6) (7) (8) (9)
WAR -29.738 -92.009*** -120.219
(54.945) (31.559) (81.840)
C1
-89.899 -4.868 -136.258
(78.949) (48.551) (125.106)
C2
-104.818 -86.733* -226.753*
(74.516) (49.437) (108.148)
NKILL
-22.653 -9.490 -50.240
(48.689) (30.996) 63.479
∆FDIt-1 0.445 0.087 0.428 0.096 -0.064 -0.441 -0.077 -0.222 0.284
(0.292) (0.3007) (0.288) (0.322) (0.368) (0.306) (0.305) (0.303) (0.298)
∆GRt-1 -3.467 9.158 0.234
(11.129) (11.9502) (11.178)
∆GRMt-1 -1.926 -1.215 1.926
(3.809) (4.541) (4.776)
∆GRSt-1 0.944 10.961 -12.7185
(14.927) (15.792) (14.961)
∆RIRt-1 -10.807** -10.685* -11.083** -1.729 -2.235 -6.291* -9.324 -8.569 -14.802*
(4.888) (5.8442) (4.962) (2.558) (3.063) (3.263) (8.847) (9.519) (7.955)
∆TOt-1 -1.486 1.437 -1.339 -3.693 -6.969* -1.382 9.387825 8.50582 6.372
(5.585) (6.570) (5.560) (2.92) (3.941) (3.532) (8.236) (8.918) (7.408)
∆TPt-1 19.766 44.763 20.481 22.219 11.280 -6.544 82.651** 110.107** 58.158
(24.985) (32.223) (24.760) (16.177) (17.921) (18.297) (38.701) (47.289) (33.929)
ECt-1 -1.204*** -0.627** -1.127*** -1.258*** -1.028** -0.274 -0.747** -0.478** -1.210***
(0.346) (0.281) (0.333) (0.412) (0.488) (0.245) (0.280) (0.220) (0.320)
Constant 24.399 79.706 15.384 49.853* 48.784 15.436 60.186 130.920 8.452
(46.921) (60.144) (40.263) (23.08) (35.472) (28.381) (65.974) (87.376) (54.471)
R-squared 0.417 0.302 0.386 0.464 0.413 0.531 0.629 0.534 0.425
F-statistic 2.354* 1.189 2.068* 4.593*** 2.581* 2.004 2.353* 1.585 3.075*
Durbin-Watson stat 2.048 2.017 2.014 1.788 2.118 2.182 1.919 1.885 1.902
Breusch-Godfrey LM test (F-statistic) 0.105 0.027 0.029 0.026 0.93 2.49* 0.022 0.133 0.121
White test (Chi-sq) 197.1 209.7 198.3 214.2 204.7 231.5 202.3 220.2 373.8
151
Coefficients of C1 are statistically insignificant for all three FDI variables but those of
C2 are significant for manufacturing and services FDI in their respective regressions,
indicating that FDI is more responsive to major wars than minor wars. Coefficient of
NKILL is statistically insignificant for all FDI variables. R squared, adjusted R squared
and F statistics are significantly low for the estimations that include C1 and C2 compared
to estimations that include WAR. Most importantly, estimations with C1 and C2 have
insignificant F-statistic indicating weak explanatory power associated with C1 and C2.
Therefore, we can see that out of all civil war variables, WAR has a much higher
explanatory power compared to CONFLICT (C1 and C2) and NKILL. These results
indicate that FDI is largely dependent on whether or not there is a war and it is the major
wars which have the most detrimental effects on FDI. This is plausible due to two
reasons. First, presence of war carries a reputational damage which will scare off foreign
investors. However, major wars can cause serious damage to MNCs in terms of physical
and human assets. Second, due to relatively long term nature of FDI compared to other
forms of financial flows, FDI flows may not be able to react to swift changes in conflict
intensity. Having observed this, it would be informative to compare the effect of
presence/absence of conflict vs effect of conflict intensity on short term and long term
financial flows, a potential project for future research.
Until 1977‘s liberalization initiatives, FDI remained very low in Sri Lanka. As a result of
trade and investment liberalization and introduction of export-oriented policies in late
1970s, FDI started flowing to manufacturing and by 1983 more than 90% of FDI stocks
were concentrated in manufacturing (Table 4-3). However, with the emergent of war in
1983, the momentum of FDI inflows to manufacturing subsided, instead services FDI
started to dominate FDI inflows. Currently FDI in services accounts for more than 70%
of total FDI stocks while FDI in manufacturing has shrunk to less than 30% of total FDI
stocks (Table 4-3). Consistent with this observation, time series econometric study
showed that war has had a significant negative effect on manufacturing FDI while having
a negative but insignificant effect on service FDI. So the important question is why
service FDI is less sensitive to war than manufacturing FDI.
Even though Sri Lanka has received a significant proportion of its FDI in services, they
largely consist of domestic market-oriented FDI. Majority of services FDI has ended up
in domestic service industries (Table 4-3). Inactivity of foreign firms in export-oriented
152
service industries is also evident from very low level of service exports (Figure 5-2). In
contrast, FDI in manufacturing has taken place both in market-seeking and export-
oriented categories. Therefore, Sri Lanka‘s experience shows that FDI inflows to
domestic market oriented service FDI is less sensitive to conflict than FDI inflows to
manufacturing.
A manufacturing MNC has couple of options available to serve a host country market,
e.g. exporting, licensing and FDI, depending on the ownership, location and
internalization advantages relevant to the specific context. Presence of conflicts can
increase the risks to investments and undermine the host country location advantages,
therefore, MNCs might opt out of FDI. Moreover, literature on choice of market entry
mode suggests that under environmental uncertainty, manufacturing firms prefer lower
control governance modes (Brouthers & Brouthers, 2003). MNCs may delay undertaking
any FDI until the hostilities in the host country improve. In a similar vein, (Saggi, 1998)
advocates that the firm's choice between exporting and FDI can be tilted towards the
former in the face of uncertainty and theoretically proves that exporting is more favorable
over FDI under demand uncertainty. Since serving the host market by exporting allows
the operations to be located outside the host country, MNCs can minimize/avoid
operational disruptions caused by conflict.
In contrast, options for serving foreign markets are generally limited for service MNCs.
Due to distinctive characteristics of services, the option of exporting may not be available
for firms involved in majority of service categories and they need to be present in the
host country in order to serve the host market (Dunning, 1989). It is well recognized in
the literature that in order to establish physical facilities abroad, service firms are more
likely to internalize via FDI compared to manufacturing counterparts (Czinkota et al.,
2010). Therefore, if a service firm wants to serve a conflict zone, FDI is likely to be the
only available option, hence these MNCs are less responsive to the presence of war than
manufacturing MNCs.
In summary, it is likely that the amount of FDI that can take place in a conflict zone is
dependent on how easily FDI can be substitutable by an alternative means. A host
country associated with conflict is likely to lose market-seeking manufacturing FDI that
are easily substitutable by imports. In contrast, since substitutability of service FDI by an

153
alternative form is very low compared to substitutability of manufacturing FDI by an
alternative form, it is conceivable that market-seeking service FDI is less sensitive to
conflict.
The above discussion is also in line with casual observations of FDI flows and imports in
tandem. We can distinguish two different trends in manufacturing and services (Figure
5-1 and Figure 5-2). In manufacturing, while FDI stock has almost been stagnant,
merchandise imports have grown impeccably, suggesting MNCs being more inclined to
export to Sri Lanka than undertaking FDI. In contrast, service FDI has outperformed
service imports both by volume and growth rates, indicating MNCs might find it difficult
to substitute market oriented service FDI with service exports due to idiosyncratic
characteristics of services as discussed before.
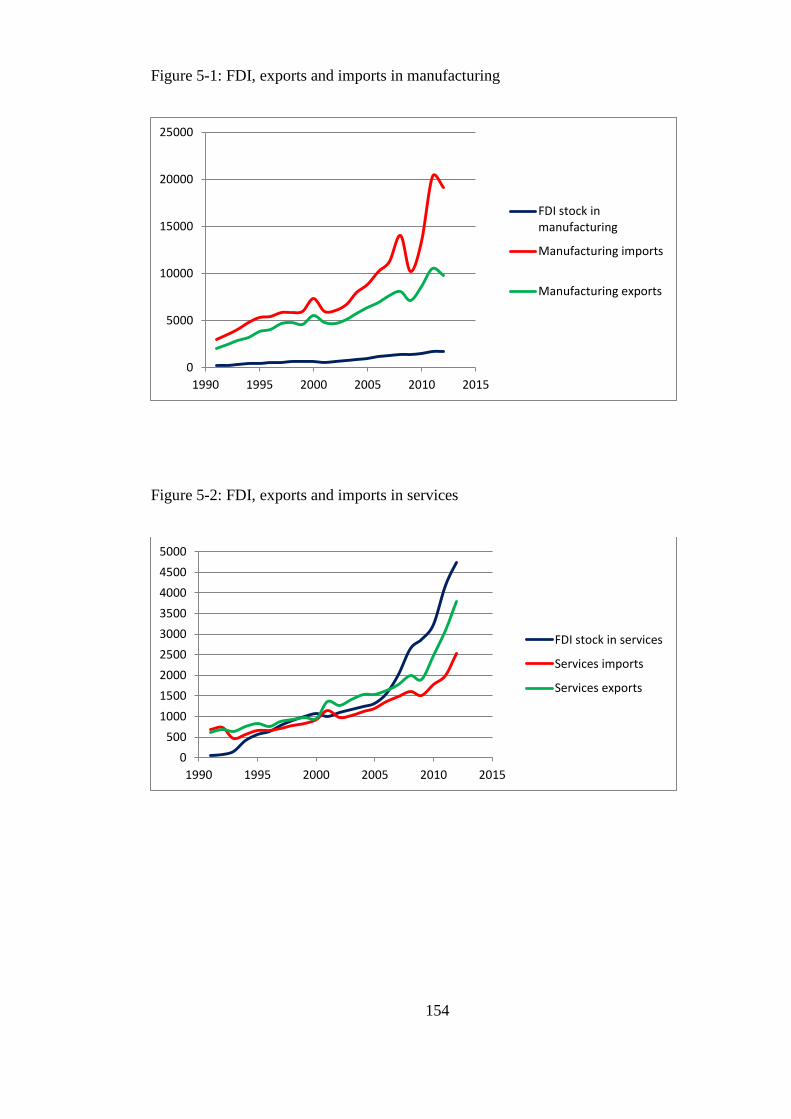
154
Figure 5-1: FDI, exports and imports in manufacturing
Figure 5-2: FDI, exports and imports in services
0
5000
10000
15000
20000
25000
1990 1995 2000 2005 2010 2015
FDI stock inmanufacturing
Manufacturing imports
Manufacturing exports
0
500
1000
1500
2000
2500
3000
3500
4000
4500
5000
1990 1995 2000 2005 2010 2015
FDI stock in services
Services imports
Services exports
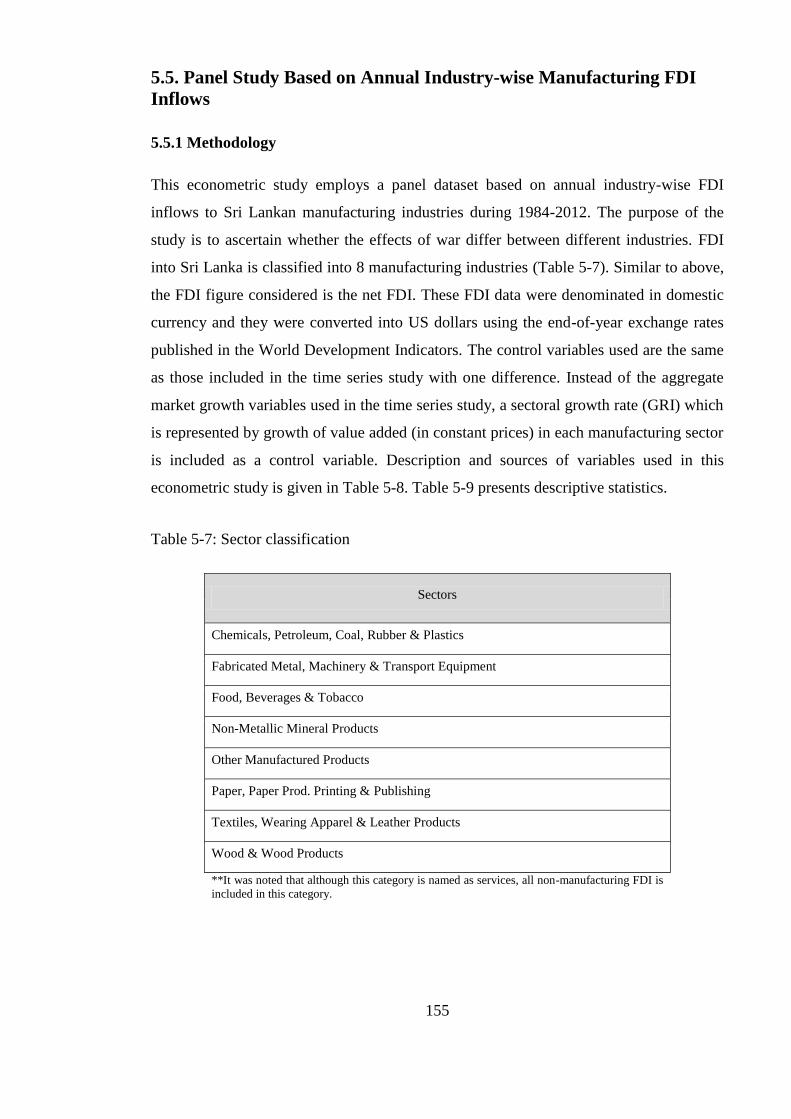
155
5.5. Panel Study Based on Annual Industry-wise Manufacturing FDI
Inflows
5.5.1 Methodology
This econometric study employs a panel dataset based on annual industry-wise FDI
inflows to Sri Lankan manufacturing industries during 1984-2012. The purpose of the
study is to ascertain whether the effects of war differ between different industries. FDI
into Sri Lanka is classified into 8 manufacturing industries (Table 5-7). Similar to above,
the FDI figure considered is the net FDI. These FDI data were denominated in domestic
currency and they were converted into US dollars using the end-of-year exchange rates
published in the World Development Indicators. The control variables used are the same
as those included in the time series study with one difference. Instead of the aggregate
market growth variables used in the time series study, a sectoral growth rate (GRI) which
is represented by growth of value added (in constant prices) in each manufacturing sector
is included as a control variable. Description and sources of variables used in this
econometric study is given in Table 5-8. Table 5-9 presents descriptive statistics.
Table 5-7: Sector classification
Sectors
Chemicals, Petroleum, Coal, Rubber & Plastics
Fabricated Metal, Machinery & Transport Equipment
Food, Beverages & Tobacco
Non-Metallic Mineral Products
Other Manufactured Products
Paper, Paper Prod. Printing & Publishing
Textiles, Wearing Apparel & Leather Products
Wood & Wood Products
**It was noted that although this category is named as services, all non-manufacturing FDI is
included in this category.
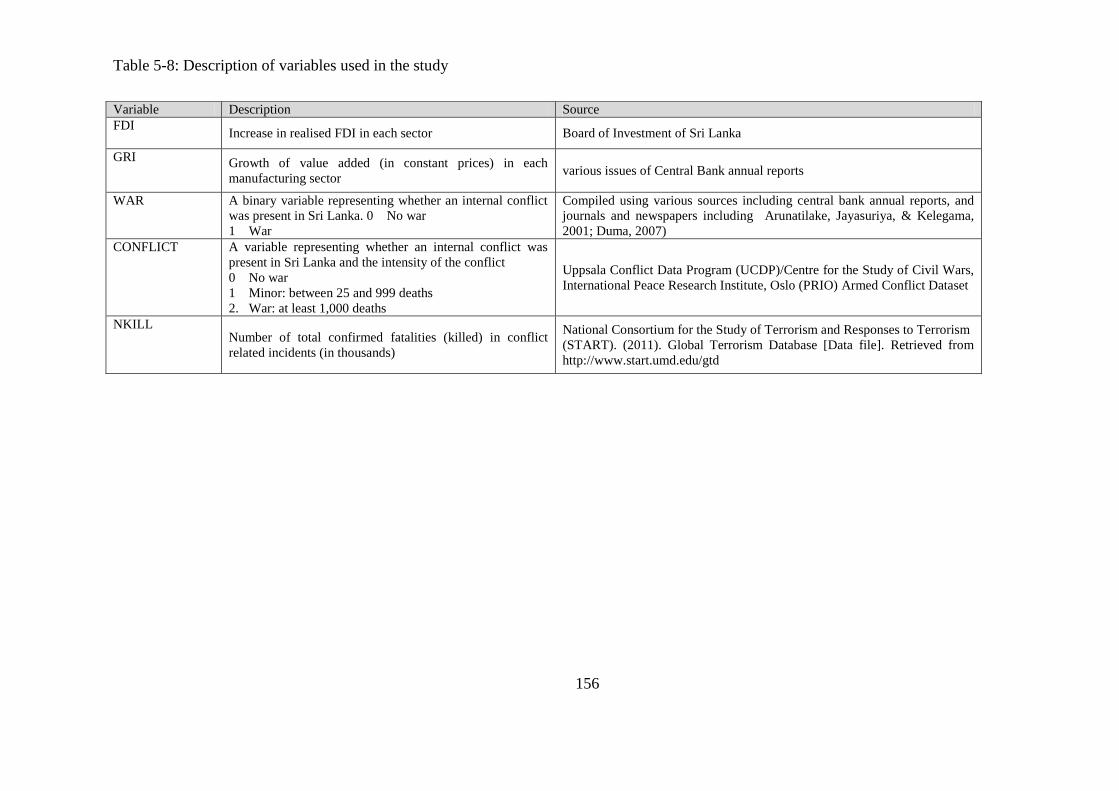
156
Table 5-8: Description of variables used in the study
Variable Description Source
FDI Increase in realised FDI in each sector Board of Investment of Sri Lanka
GRI Growth of value added (in constant prices) in each
manufacturing sector various issues of Central Bank annual reports
WAR A binary variable representing whether an internal conflict
was present in Sri Lanka. 0 No war
1 War
Compiled using various sources including central bank annual reports, and
journals and newspapers including Arunatilake, Jayasuriya, & Kelegama,
2001; Duma, 2007)
CONFLICT A variable representing whether an internal conflict was
present in Sri Lanka and the intensity of the conflict
0 No war
1 Minor: between 25 and 999 deaths
2. War: at least 1,000 deaths
Uppsala Conflict Data Program (UCDP)/Centre for the Study of Civil Wars,
International Peace Research Institute, Oslo (PRIO) Armed Conflict Dataset
NKILL Number of total confirmed fatalities (killed) in conflict
related incidents (in thousands)
National Consortium for the Study of Terrorism and Responses to Terrorism
(START). (2011). Global Terrorism Database [Data file]. Retrieved from
http://www.start.umd.edu/gtd
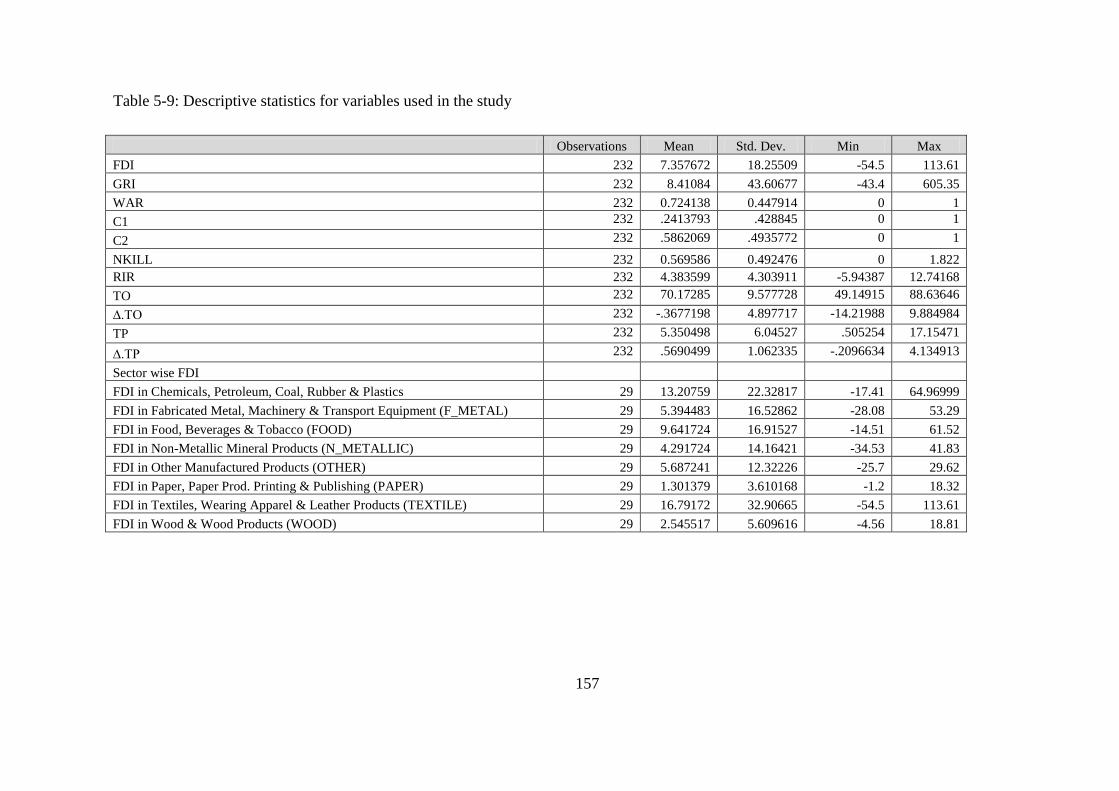
157
Table 5-9: Descriptive statistics for variables used in the study
Observations Mean Std. Dev. Min Max
FDI 232 7.357672 18.25509 -54.5 113.61
GRI 232 8.41084 43.60677 -43.4 605.35
WAR 232 0.724138 0.447914 0 1
C1 232 .2413793 .428845 0 1
C2 232 .5862069 .4935772 0 1
NKILL 232 0.569586 0.492476 0 1.822
RIR 232 4.383599 4.303911 -5.94387 12.74168
TO 232 70.17285 9.577728 49.14915 88.63646
∆.TO 232 -.3677198 4.897717 -14.21988 9.884984
TP 232 5.350498 6.04527 .505254 17.15471
∆.TP 232 .5690499 1.062335 -.2096634 4.134913
Sector wise FDI
FDI in Chemicals, Petroleum, Coal, Rubber & Plastics 29 13.20759 22.32817 -17.41 64.96999
FDI in Fabricated Metal, Machinery & Transport Equipment (F_METAL) 29 5.394483 16.52862 -28.08 53.29
FDI in Food, Beverages & Tobacco (FOOD) 29 9.641724 16.91527 -14.51 61.52
FDI in Non-Metallic Mineral Products (N_METALLIC) 29 4.291724 14.16421 -34.53 41.83
FDI in Other Manufactured Products (OTHER) 29 5.687241 12.32226 -25.7 29.62
FDI in Paper, Paper Prod. Printing & Publishing (PAPER) 29 1.301379 3.610168 -1.2 18.32
FDI in Textiles, Wearing Apparel & Leather Products (TEXTILE) 29 16.79172 32.90665 -54.5 113.61
FDI in Wood & Wood Products (WOOD) 29 2.545517 5.609616 -4.56 18.81
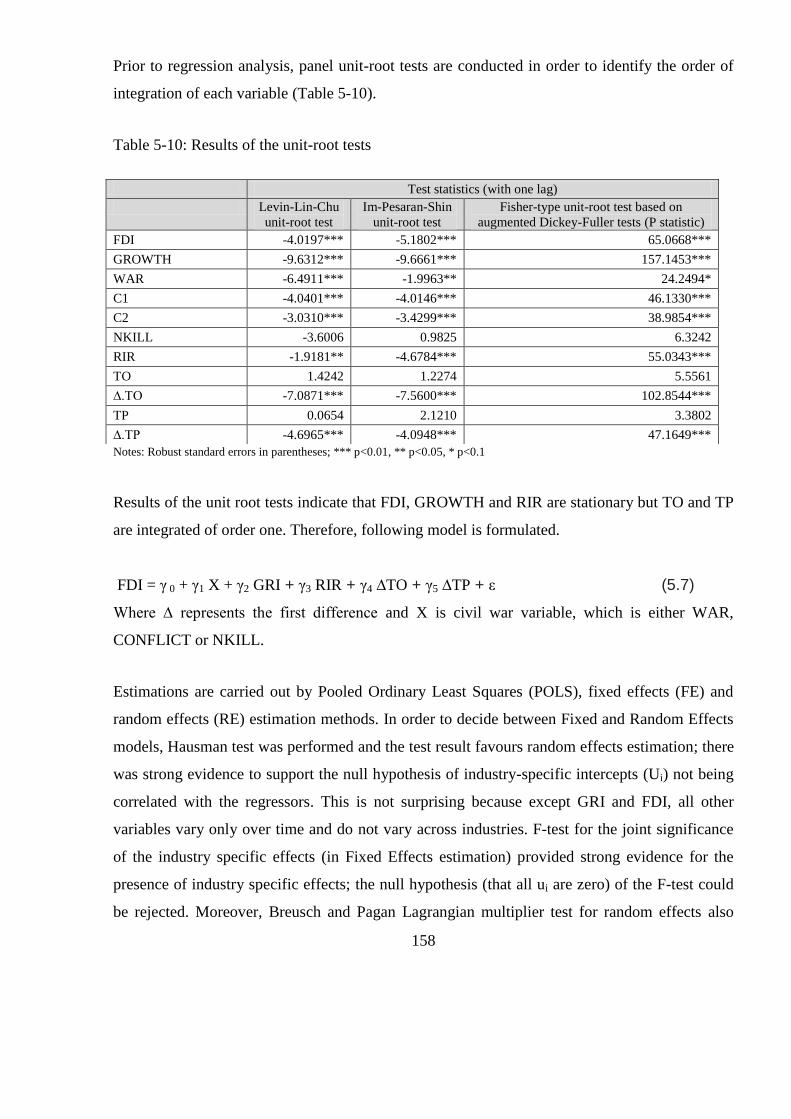
158
Prior to regression analysis, panel unit-root tests are conducted in order to identify the order of
integration of each variable (Table 5-10).
Table 5-10: Results of the unit-root tests
Notes: Robust standard errors in parentheses; *** p<0.01, ** p<0.05, * p<0.1
Results of the unit root tests indicate that FDI, GROWTH and RIR are stationary but TO and TP
are integrated of order one. Therefore, following model is formulated.
FDI = γ 0 + γ1 X + γ2 GRI + γ3 RIR + γ4 ∆TO + γ5 ∆TP + ε (5.7)
Where ∆ represents the first difference and X is civil war variable, which is either WAR,
CONFLICT or NKILL.
Estimations are carried out by Pooled Ordinary Least Squares (POLS), fixed effects (FE) and
random effects (RE) estimation methods. In order to decide between Fixed and Random Effects
models, Hausman test was performed and the test result favours random effects estimation; there
was strong evidence to support the null hypothesis of industry-specific intercepts (Ui) not being
correlated with the regressors. This is not surprising because except GRI and FDI, all other
variables vary only over time and do not vary across industries. F-test for the joint significance
of the industry specific effects (in Fixed Effects estimation) provided strong evidence for the
presence of industry specific effects; the null hypothesis (that all ui are zero) of the F-test could
be rejected. Moreover, Breusch and Pagan Lagrangian multiplier test for random effects also
Test statistics (with one lag)
Levin-Lin-Chu
unit-root test
Im-Pesaran-Shin
unit-root test
Fisher-type unit-root test based on
augmented Dickey-Fuller tests (P statistic)
FDI -4.0197*** -5.1802*** 65.0668***
GROWTH -9.6312*** -9.6661*** 157.1453***
WAR -6.4911*** -1.9963** 24.2494*
C1 -4.0401*** -4.0146*** 46.1330***
C2 -3.0310*** -3.4299*** 38.9854***
NKILL -3.6006 0.9825 6.3242
RIR -1.9181** -4.6784*** 55.0343***
TO 1.4242 1.2274 5.5561
∆.TO -7.0871*** -7.5600*** 102.8544***
TP 0.0654 2.1210 3.3802
∆.TP -4.6965*** -4.0948*** 47.1649***
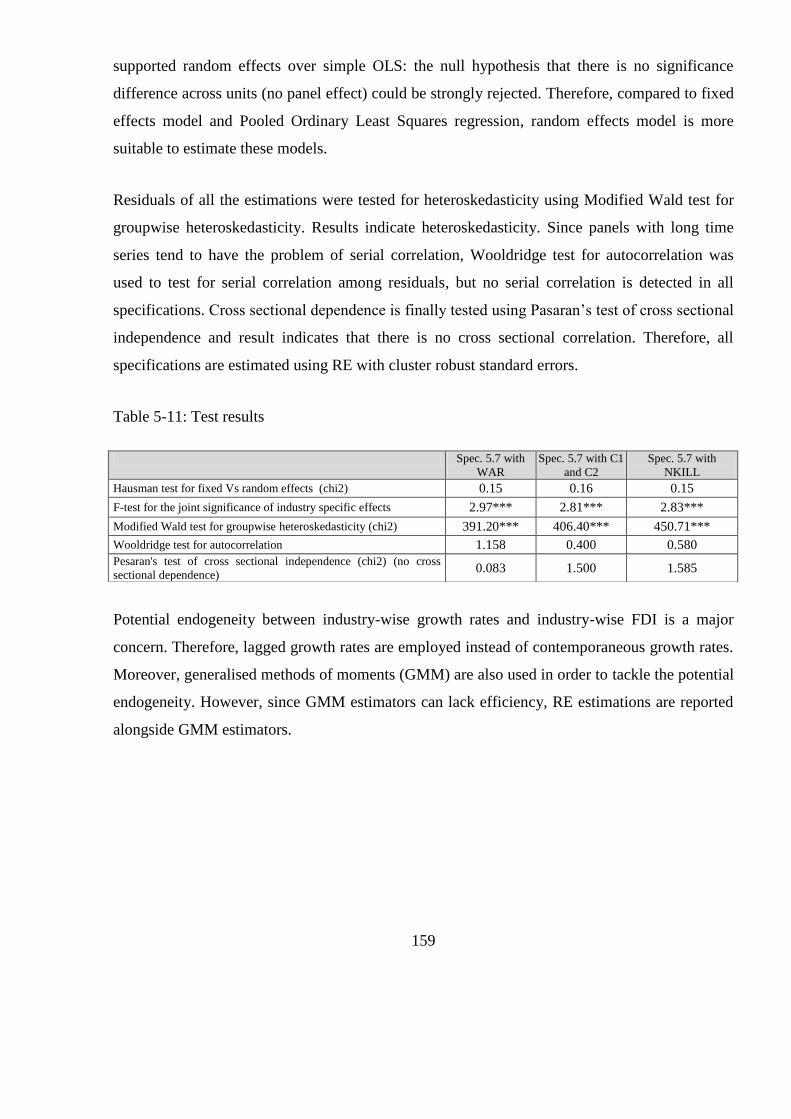
159
supported random effects over simple OLS: the null hypothesis that there is no significance
difference across units (no panel effect) could be strongly rejected. Therefore, compared to fixed
effects model and Pooled Ordinary Least Squares regression, random effects model is more
suitable to estimate these models.
Residuals of all the estimations were tested for heteroskedasticity using Modified Wald test for
groupwise heteroskedasticity. Results indicate heteroskedasticity. Since panels with long time
series tend to have the problem of serial correlation, Wooldridge test for autocorrelation was
used to test for serial correlation among residuals, but no serial correlation is detected in all
specifications. Cross sectional dependence is finally tested using Pasaran‘s test of cross sectional
independence and result indicates that there is no cross sectional correlation. Therefore, all
specifications are estimated using RE with cluster robust standard errors.
Table 5-11: Test results
Potential endogeneity between industry-wise growth rates and industry-wise FDI is a major
concern. Therefore, lagged growth rates are employed instead of contemporaneous growth rates.
Moreover, generalised methods of moments (GMM) are also used in order to tackle the potential
endogeneity. However, since GMM estimators can lack efficiency, RE estimations are reported
alongside GMM estimators.
Spec. 5.7 with
WAR Spec. 5.7 with C1
and C2 Spec. 5.7 with
NKILL
Hausman test for fixed Vs random effects (chi2) 0.15 0.16 0.15
F-test for the joint significance of industry specific effects 2.97*** 2.81*** 2.83***
Modified Wald test for groupwise heteroskedasticity (chi2) 391.20*** 406.40*** 450.71***
Wooldridge test for autocorrelation 1.158 0.400 0.580
Pesaran's test of cross sectional independence (chi2) (no cross
sectional dependence) 0.083 1.500 1.585
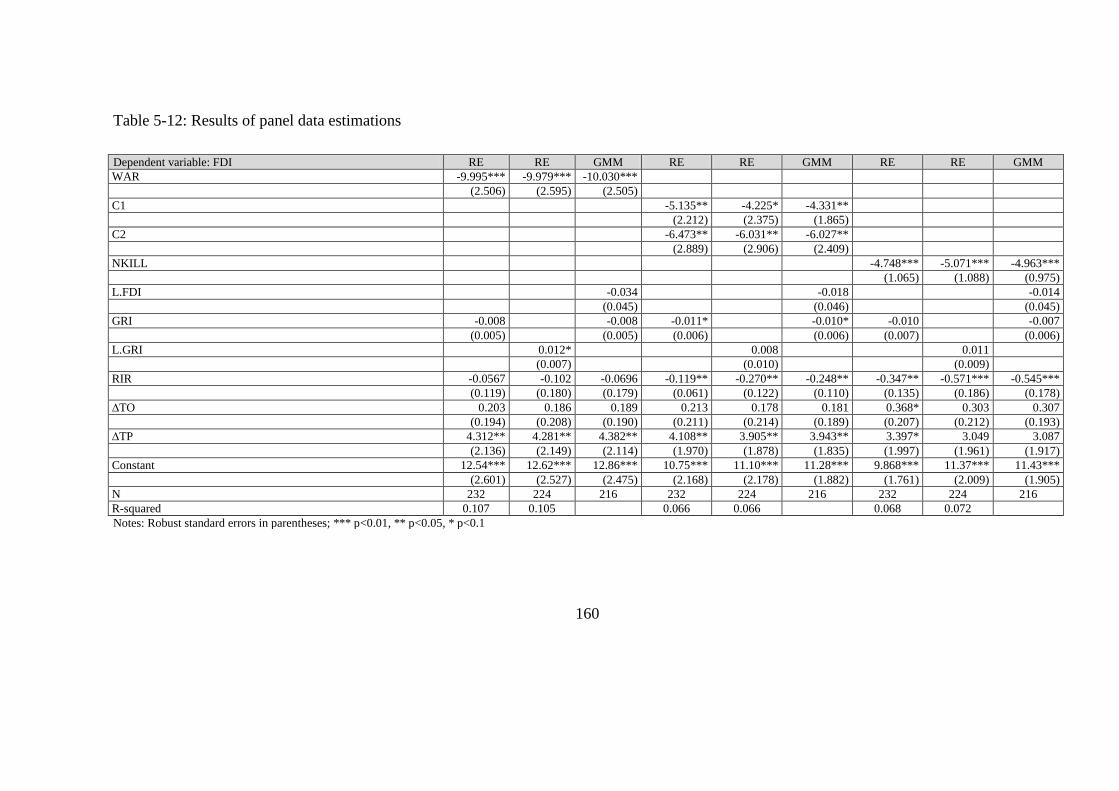
160
Table 5-12: Results of panel data estimations
Dependent variable: FDI RE RE GMM RE RE GMM RE RE GMM
WAR -9.995*** -9.979*** -10.030***
(2.506) (2.595) (2.505)
C1 -5.135** -4.225* -4.331**
(2.212) (2.375) (1.865)
C2 -6.473** -6.031** -6.027**
(2.889) (2.906) (2.409)
NKILL -4.748*** -5.071*** -4.963***
(1.065) (1.088) (0.975)
L.FDI -0.034 -0.018 -0.014
(0.045) (0.046) (0.045)
GRI -0.008 -0.008 -0.011* -0.010* -0.010 -0.007
(0.005) (0.005) (0.006) (0.006) (0.007) (0.006)
L.GRI 0.012* 0.008 0.011
(0.007) (0.010) (0.009)
RIR -0.0567 -0.102 -0.0696 -0.119** -0.270** -0.248** -0.347** -0.571*** -0.545***
(0.119) (0.180) (0.179) (0.061) (0.122) (0.110) (0.135) (0.186) (0.178)
∆TO 0.203 0.186 0.189 0.213 0.178 0.181 0.368* 0.303 0.307
(0.194) (0.208) (0.190) (0.211) (0.214) (0.189) (0.207) (0.212) (0.193)
∆TP 4.312** 4.281** 4.382** 4.108** 3.905** 3.943** 3.397* 3.049 3.087
(2.136) (2.149) (2.114) (1.970) (1.878) (1.835) (1.997) (1.961) (1.917)
Constant 12.54*** 12.62*** 12.86*** 10.75*** 11.10*** 11.28*** 9.868*** 11.37*** 11.43***
(2.601) (2.527) (2.475) (2.168) (2.178) (1.882) (1.761) (2.009) (1.905)
N 232 224 216 232 224 216 232 224 216
R-squared 0.107 0.105 0.066 0.066 0.068 0.072
Notes: Robust standard errors in parentheses; *** p<0.01, ** p<0.05, * p<0.1
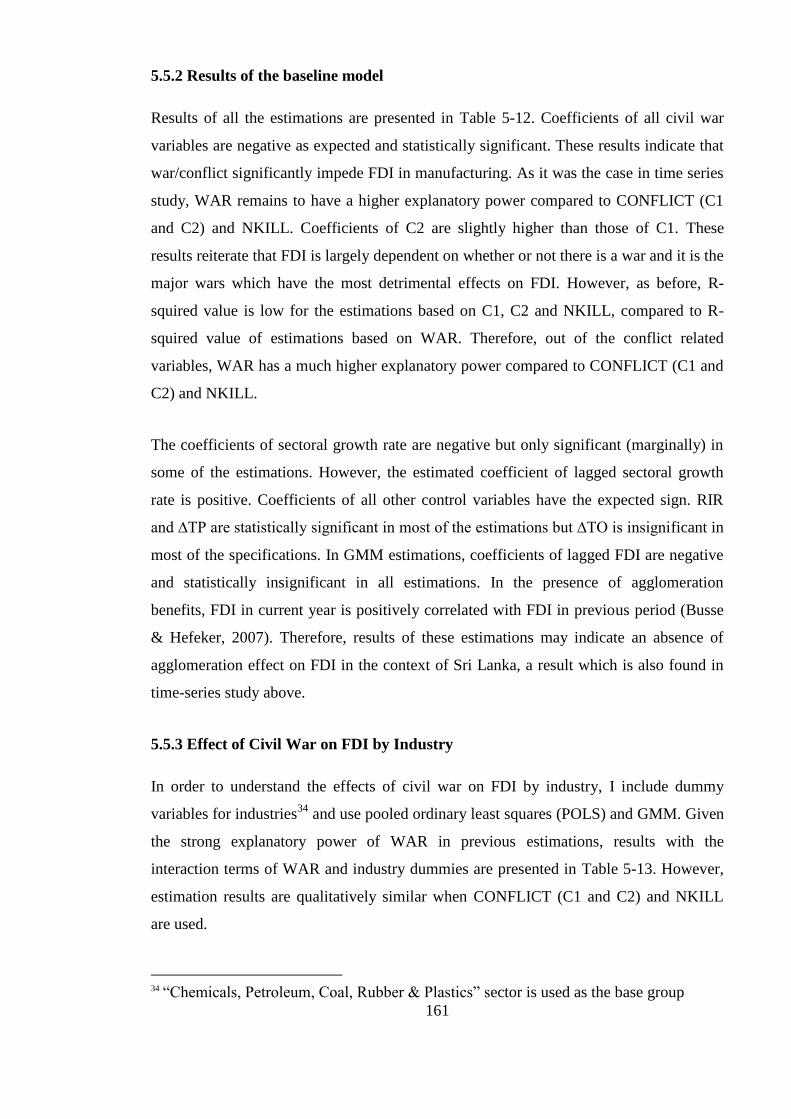
161
5.5.2 Results of the baseline model
Results of all the estimations are presented in Table 5-12. Coefficients of all civil war
variables are negative as expected and statistically significant. These results indicate that
war/conflict significantly impede FDI in manufacturing. As it was the case in time series
study, WAR remains to have a higher explanatory power compared to CONFLICT (C1
and C2) and NKILL. Coefficients of C2 are slightly higher than those of C1. These
results reiterate that FDI is largely dependent on whether or not there is a war and it is the
major wars which have the most detrimental effects on FDI. However, as before, R-
squired value is low for the estimations based on C1, C2 and NKILL, compared to R-
squired value of estimations based on WAR. Therefore, out of the conflict related
variables, WAR has a much higher explanatory power compared to CONFLICT (C1 and
C2) and NKILL.
The coefficients of sectoral growth rate are negative but only significant (marginally) in
some of the estimations. However, the estimated coefficient of lagged sectoral growth
rate is positive. Coefficients of all other control variables have the expected sign. RIR
and ∆TP are statistically significant in most of the estimations but ∆TO is insignificant in
most of the specifications. In GMM estimations, coefficients of lagged FDI are negative
and statistically insignificant in all estimations. In the presence of agglomeration
benefits, FDI in current year is positively correlated with FDI in previous period (Busse
& Hefeker, 2007). Therefore, results of these estimations may indicate an absence of
agglomeration effect on FDI in the context of Sri Lanka, a result which is also found in
time-series study above.
5.5.3 Effect of Civil War on FDI by Industry
In order to understand the effects of civil war on FDI by industry, I include dummy
variables for industries34
and use pooled ordinary least squares (POLS) and GMM. Given
the strong explanatory power of WAR in previous estimations, results with the
interaction terms of WAR and industry dummies are presented in Table 5-13. However,
estimation results are qualitatively similar when CONFLICT (C1 and C2) and NKILL
are used.
34
―Chemicals, Petroleum, Coal, Rubber & Plastics‖ sector is used as the base group

162
Table 5-13: Results of panel data estimations with dummy variables for each industry
Dependent variable: FDI POLS POLS GMM
WAR -12.31*** -11.83*** -11.48***
(0.813) (0.978) (0.798)
WAR* F_METAL 5.063*** 4.562*** 4.316***
(0.00870) (0.0117) (0.520)
WAR * FOOD -0.979*** -1.257*** -1.500**
(0.0208) (0.00115) (0.649)
WAR * N_METALLIC -3.529*** -4.346*** -5.393***
(0.037) (0.0553) (0.901)
WAR * OTHER 9.392*** 8.403*** 8.455***
(0.176) (0.226) (0.708)
WAR * PAPER 11.60*** 11.15*** 10.91***
(0.013) (0.0200) (0.531)
WAR * TEXTILE -5.110*** -5.351*** -5.575***
(0.083) (0.0724) (0.150)
WAR * WOOD 2.229*** 1.766*** 0.291
(0.009) (0.0221) (0.861)
L.FDI -0.037
(0.043)
GRI -0.011* -0.009***
(0.006) (0.003)
L.GROWTH 0.010
(0.008)
RIR -0.057 -0.100 -0.089
(0.124) (0.187) (0.162)
∆TO 0.204 0.187
(0.201) (0.216)
∆TP 4.308* 4.279* 4.188**
(2.206) (2.220) (2.036)
Constant 20.06*** 20.08*** 13.06***
(0.871) (0.988) (2.586)
F_METAL -11.49*** -11.44***
(0.0137) (0.0187)
FOOD -2.865*** -2.821***
(0.0193) (0.00491)
N_METALLIC -6.321*** -6.29 ***
(0.00628) (0.0113)
OTHER -14.10*** -14.07***
(0.0156) (0.00318)
PAPER -20.34*** -20.27***
(0.0285) (0.0124)
TEXTILE 7.345*** 7.411***
(0.0292) (0.00756)
WOOD -12.32*** -12.27***
(0.0172) (0.0175)
N 232 224 216
R-squared 0.203 0.202
Wald chi2 18413.38*** Notes: Robust standard errors in parentheses; *** p<0.01, ** p<0.05, * p<0.1
Refer Table 5-9 for representations of sector specific dummy variables
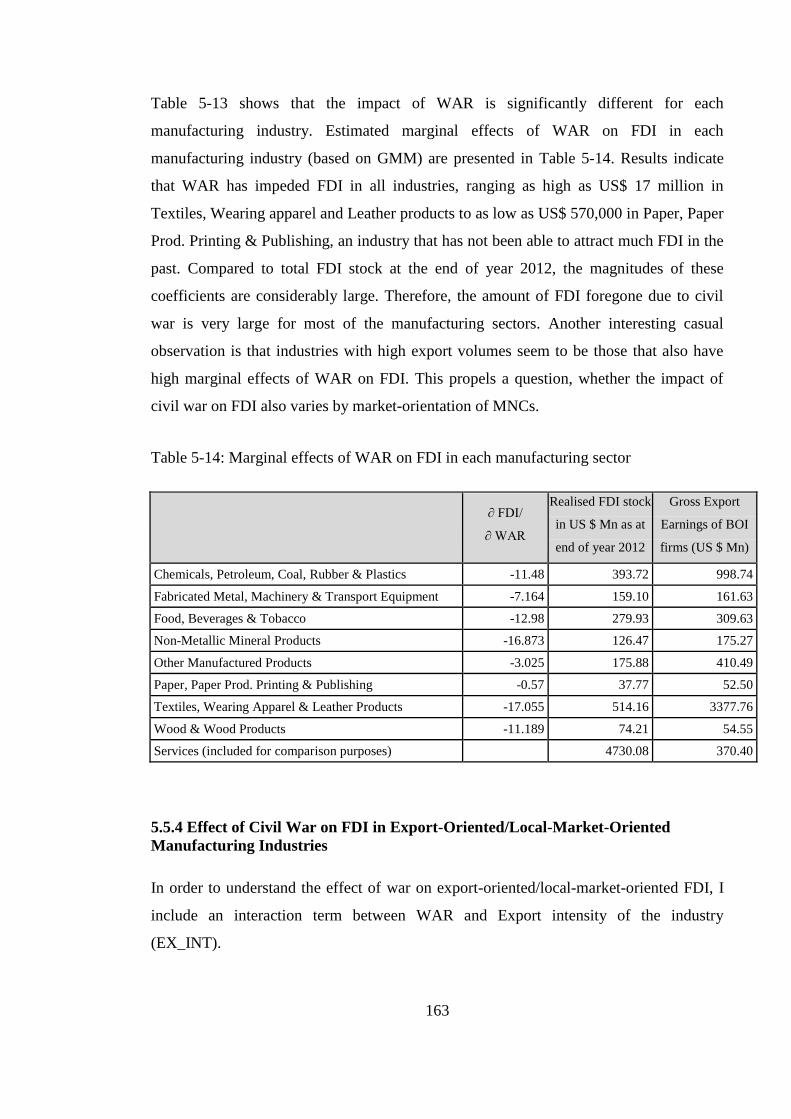
163
Table 5-13 shows that the impact of WAR is significantly different for each
manufacturing industry. Estimated marginal effects of WAR on FDI in each
manufacturing industry (based on GMM) are presented in Table 5-14. Results indicate
that WAR has impeded FDI in all industries, ranging as high as US$ 17 million in
Textiles, Wearing apparel and Leather products to as low as US$ 570,000 in Paper, Paper
Prod. Printing & Publishing, an industry that has not been able to attract much FDI in the
past. Compared to total FDI stock at the end of year 2012, the magnitudes of these
coefficients are considerably large. Therefore, the amount of FDI foregone due to civil
war is very large for most of the manufacturing sectors. Another interesting casual
observation is that industries with high export volumes seem to be those that also have
high marginal effects of WAR on FDI. This propels a question, whether the impact of
civil war on FDI also varies by market-orientation of MNCs.
Table 5-14: Marginal effects of WAR on FDI in each manufacturing sector
∂ FDI/
∂ WAR
Realised FDI stock
in US $ Mn as at
end of year 2012
Gross Export
Earnings of BOI
firms (US $ Mn)
Chemicals, Petroleum, Coal, Rubber & Plastics -11.48 393.72 998.74
Fabricated Metal, Machinery & Transport Equipment -7.164 159.10 161.63
Food, Beverages & Tobacco -12.98 279.93 309.63
Non-Metallic Mineral Products -16.873 126.47 175.27
Other Manufactured Products -3.025 175.88 410.49
Paper, Paper Prod. Printing & Publishing -0.57 37.77 52.50
Textiles, Wearing Apparel & Leather Products -17.055 514.16 3377.76
Wood & Wood Products -11.189 74.21 54.55
Services (included for comparison purposes) 4730.08 370.40
5.5.4 Effect of Civil War on FDI in Export-Oriented/Local-Market-Oriented
Manufacturing Industries
In order to understand the effect of war on export-oriented/local-market-oriented FDI, I
include an interaction term between WAR and Export intensity of the industry
(EX_INT).
164
FDI = β0 + β1 WAR + β2 GROWTH + β3 EX_INT*WAR + β4 EX_INT + u1t (5.8)
Export intensity is measured by the ratio of gross export earnings of BOI firms in year
2011 to the total realized FDI in BOI firms in year 201135
. Following from the discussion
in section 5.3, I expect the negative effect of WAR to be higher for the sectors associated
with higher export intensity in FDI, therefore, a negative estimate for the interaction
term.
All else constant, marginal impact of WAR on FDI will be given by:
Therefore, I expect a negative estimate for coefficient β3 if the negative effect of WAR is
higher for the sectors associated with higher export intensity in FDI.
Estimated results are reported in Table 5-15. Coefficients of WAR are negative and
statistically significant, indicating the negative impact of WAR on FDI. Coefficients of
EXP_INT are positive and statistically significant indicating the industries with higher
export intensity are associated with higher FDI. The coefficients of the interaction term
between EXP_INT and WAR are negative and highly significant in all three
specifications, indicating that the negative impact of WAR increase with export
intensiveness of the FDI in the sector, a result in line with theoretical expectation.
35
BOI firms also include non FDI projects but majority of BOI investments are foreign investments, and
therefore, this ratio is used as an approximation for export intensity.
∂ FDI = β1+ β3* EX_INT
∂ WAR
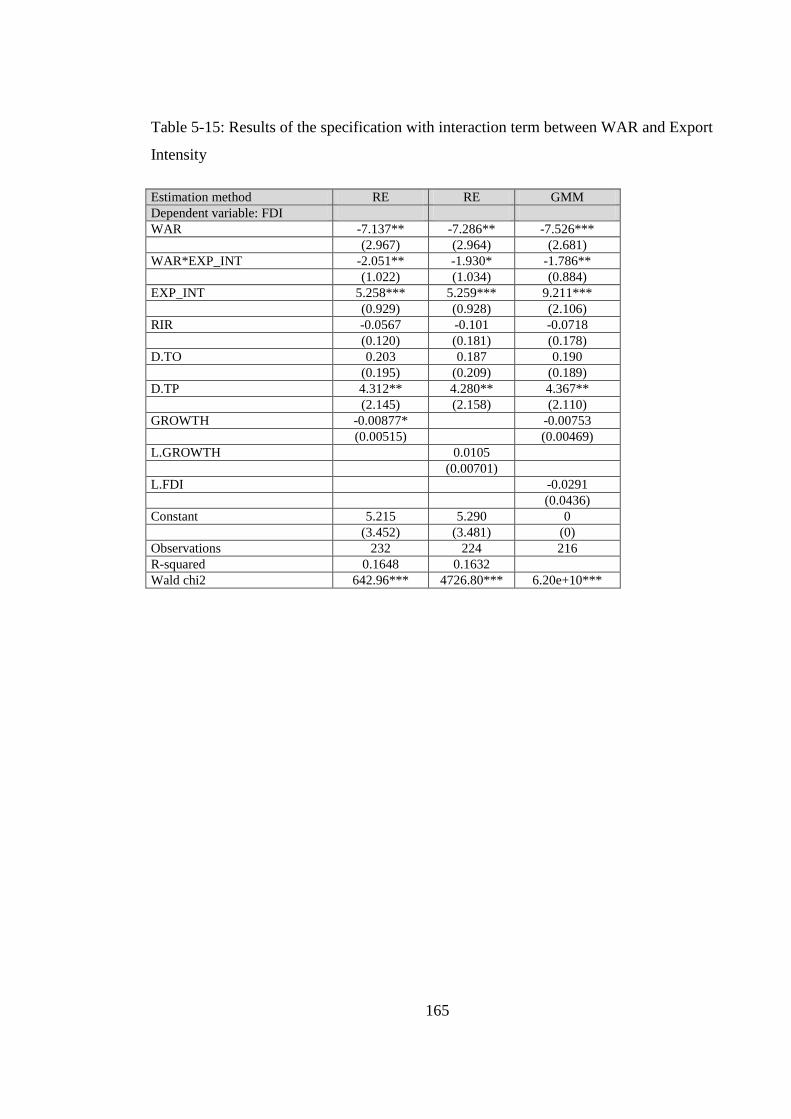
165
Table 5-15: Results of the specification with interaction term between WAR and Export
Intensity
Estimation method RE RE GMM
Dependent variable: FDI
WAR -7.137** -7.286** -7.526***
(2.967) (2.964) (2.681)
WAR*EXP_INT -2.051** -1.930* -1.786**
(1.022) (1.034) (0.884)
EXP_INT 5.258*** 5.259*** 9.211***
(0.929) (0.928) (2.106)
RIR -0.0567 -0.101 -0.0718
(0.120) (0.181) (0.178)
D.TO 0.203 0.187 0.190
(0.195) (0.209) (0.189)
D.TP 4.312** 4.280** 4.367**
(2.145) (2.158) (2.110)
GROWTH -0.00877* -0.00753
(0.00515) (0.00469)
L.GROWTH 0.0105
(0.00701)
L.FDI -0.0291
(0.0436)
Constant 5.215 5.290 0
(3.452) (3.481) (0)
Observations 232 224 216
R-squared 0.1648 0.1632
Wald chi2 642.96*** 4726.80*** 6.20e+10***
166
5.6 Concluding Remarks
Civil war/conflict in a country is likely to discourage inflows of FDI. However, few
studies explicitly investigate how civil war affects FDI (Czinkota et al., 2010). As
highlighted in this paper, most of the existing studies that look at the impact of broad
political instability variable which encapsulates civil war as one dimension show mixed
findings. These studies contribute limited understanding of war-FDI relationship. Use of
broad measures of political instability is unlikely to identify the true effect of war on
FDI. This study attempts to address these limitations by investigating the effects of Sri
Lanka‘s three decade of civil war, which has gone through considerable variation in
conflict intensity, on FDI in Sri Lanka.
Time series study clearly demonstrate that civil war has a significant negative impact on
FDI in manufacturing sectors compared to FDI in services sectors. This differential
impact explains why the relationship between civil war and gross FDI flows is
insignificant. Civil war could also instigate foreign direct divestments, and therefore, the
impact can be much larger for net FDI inflows than gross FDI inflows.
The panel study based on annual industry-wise net FDI inflows to Sri Lanka reconfirms
the strong negative relationship between civil war and FDI inflows to manufacturing
sectors. Moreover, in contrast to time series study, all three war related variables were
highly significant in the panel study. Superior performance of the panel study over the
time series study is not surprising due to several reasons. FDI into different sectors could
be affected to different degrees by political instability, but the aggregate FDI data does
not capture these differences. Moreover, panel study accounts for sectoral differences
which were mainly captured by sector level dummies and sectoral growth rates.
Furthermore, superiority of panel study over time series study in terms of more degrees
of freedom and more variability may have also helped the panel study to perform well
than the time series study. Results of the panel study also points out that the magnitude of
the negative impact of war varies by industry. Finally, panel study also provided strong
evidence for a higher negative impact of WAR on FDI in export-intensive industries than
in local-market-oriented industries.
The above results highlight the importance of using disaggregated FDI data when
investigating determinants of FDI. FDI data aggregated over sectors can suppress the
167
variation, and therefore, make it difficult to identify the precise relationship of
explanatory variables to FDI flows.
Findings of this study contribute to the literature on political instability and FDI by
providing empirical evidence. These economic estimations are useful not only to assess
the harmful effects of civil war on FDI, but also to assess the peace dividend, or the
economic benefits (in terms of the increase in potential international investment) of
avoiding or concluding conflict or at least achieving a reduction in political conflict.
Moreover, this study also contributes to the literature on FDI in Sri Lanka and can also
influence future policymaking with regard to handling conflicts and attracting FDI.
Results of this study indicate that high real interest rate can affect FDI flows negatively,
and trade openness and level of infrastructure (telephone density) can affect FDI flows
positively. The relationship between market growth and FDI is a bit controversial; some
of the negative coefficients are statistically significant. This could be due to several
reasons. First, in Sri Lanka, services FDI are largely market-oriented while
manufacturing FDI takes both market-seeking and export-oriented forms. Second, MNCs
have a notorious reputation for having a larger import content in their inputs, and
therefore, this fact is likely to affect the growth of value added negatively. Moreover, it is
well documented that Sri Lanka‘s failure to develop backward linkages to foreign firms
which could have also contributed to this negative relationship (Kelegama & Foley,
1999). Furthermore, a significant proportion of manufacturing FDI has taken place in
‗Textiles, Wearing Apparel & Leather Products‘ category, a sector which is reputed to
have a very low value addition due to higher import content of the inputs to this sector
and weak backward linkages in this sector (Kelegama & Foley, 1999). Finally, due to Sri
Lanka‘s smaller internal market, the significance of the GDP to FDI inflows cannot be
strong as it is for countries with larger markets.
Findings of this study extends IB theory by helping to answer an enquiry that remains
largely unaddressed: ―what sort of investment is particularly sensitive to conflict?‖
(Driffield, Jones, & Crotty, 2013). In Sri Lanka, manufacturing FDI has taken place in
export-oriented forms as well as market-oriented forms. In contrast, majority of services
FDI is directed towards servicing the domestic market. Therefore, Sri Lanka‘s experience
shows that war can have a much larger negative impact on manufacturing FDI over
168
market oriented services FDI. However, since services FDI in Sri Lanka has been
primarily market-seeking, this study does not suggest that effect of war on non-market
oriented services FDI is also low. In fact non market-seeking (vertical) service FDI is
likely to be more sensitive to conflict even more than export-oriented manufacturing
FDI. Due to simultaneity of production/delivery and consumption in services, potential
damage of local disruptions to the global operations will be significantly higher for
services than for manufacturing. For example, if manufacturing operation of a garment
exporter in a conflict zone is disrupted, then the global operation will not come to
standstill if the damaged product line is re-established in the same plant or somewhere
else before stocks are exhausted. In contrast, if an offshore call centre operation is
disrupted, then the entire operation will come to standstill instantaneously. Therefore, the
potential damage of disruptions should be higher for non-market-seeking service FDI
than for export-oriented manufacturing FDI. This might be the reason for Sri Lanka to
perform very poorly in attracting export-oriented service FDI as well as generating very
low volumes of service exports.
Despite its merits, this study is not without limitations. One limitation of the time series
study is the reliance on a limited number of observations. Number of observations were
33 for the total FDI and 29 for the FDI in manufacturing and FDI in services. Given that
there are five explanatory variables in the model and VECM model uses lag values of
explanatory variables and the dependent variable to estimate the model, the degrees of
freedom of the time series regressions is likely to be compromised, which could to some
extent undermine the reliability and generalizability of the results. However, it should be
noted that, although a larger sample size is desirable for good performance of a time
series econometric model, in practical applications we seldom get longer time series,
particularly when less frequent annual data is used. Given that the time series
econometric model performed well (with reasonably high R-squared value and F
statistics), results of the time series study can be fairly approximated to determine the
effect of war on FDI. Another limitation of this study was the reliance on country
specific explanatory variables in absence of an exhaustive set of sector specific
explanatory variables. Except sector specific growth variable and industry dummies, all
other explanatory variables were country specific. An exhaustive set of sector specific
explanatory variables could not be included because of the unavailability of sector
specific information.
169
Chapter 6 : Determinants of FDI – A Country Level Study
6.1 Introduction
This chapter presents an empirical study conducted to examine the determinants of FDI.
Study employs a panel study based on annual FDI inflows to a selected group of
countries, one of which is Sri Lanka. The dataset spans 13 countries selected from South
Asia, East Asia, and South East Asia and a period from 1995 to 2010. A special attention
is given to detach relationships specific to Sri Lanka from the relationships general to rest
of the countries.
This chapter is organised as follows. Sections 6.2 and 6.3 provide a theoretical discussion
on the key FDI determinants explored in this study. Section 6.4 details the methodology
and reports the results and section 6.5 provides a detailed analysis and discussion on the
reported results. Finally, section 6.6 concludes the chapter by highlighting the
conclusions and contribution of this study.
170
6.2 Human Capital and FDI
Presence of a larger human capital base in the host country will increase the
attractiveness of local investment climate through the direct effects of upgrading skill
level of the workforce and the indirect effects of improved socio-political stability and
health (Miyamoto, 2003). Furthermore, presence of infrastructure (physical capital) is
also considered as a key determinant of FDI inflows. Effective use of physical capital
largely depends on the quality of human capital since technical, professional, and
administrative skills are needed for effective use of physical capital (Abbas, 2001).
Success of offshore subsidiaries largely depends on how effectively the parent firms can
transfer their ownership advantages to the subsidiaries. If local workers are educated,
then local workforce can learn and adapt new technologies faster and easily, providing
time and cost advantages to investing firms (Kinoshita & Campos, 2004). Moreover, a
majority of present FDI takes place in capital-, knowledge- and skill-intensive industries.
Therefore, the presence of high quality human capital is likely to be an important
determinant in the modern FDI (Noorbakhsh, Paloni and Youseff, 2001).
Only few studies have given a considerable and systematic attention to empirically
investigate the effect of host country human capital on incoming FDI (Kapstein, 2002)
however, many studies have included proxies for human capital i.e. as an explanatory
variable or as a control variable when the FDI is used as the dependent variable.
Although the importance of human capital in attracting FDI is widely recognised in the
literature, empirical evidence provided by these studies is inconclusive, particularly for
developing countries.
Noorbakhsh, Paloni and Youseff (2001), using FDI flows to 36 developing countries in
Africa, Asia and Latin America during 1980-94, investigated to what extent the level of
human capital in host countries can affect FDI inflows to developing countries. They find
that human capital is not only one of the most important determinants of FDI but also its
importance is increasing over time. Nonnemberg and Mendonca (2004), investigating
determinants of FDI into 38 developing countries, during 1975-2000, find that level of
secondary schooling is positively related to FDI flows. Suliman & Mollick (2009),
investigating determinants of FDI in 29 sub-Saharan countries during 1980-2003, find
that adult literacy rate is a significant determinant of FDI flows to sub-Saharan Africa.
171
Yet, there are many studies that have found little or no effect of human capital on FDI
flows. Root and Ahmed (1979), investigating the determinants of manufacturing FDI in
58 developing countries, find that none of their proxies for human capital, i.e. literacy
rate, primary and secondary school enrolment rate, and the availability of technical and
professional workers represented by size of the middle class, are statistically significant
determinants of inward FDI. Schneider and Frey (1985), using FDI flows to 54
developing countries, finds that share of an age group with secondary education is not a
significant determinant in the presence of other political and economic determinants in
the model. Hanson (1996) shows that adult literacy rate was not a significant determinant
of FDI for a sample of 105 developing countries. Kinoshita & Campos, (2004),
investigating the determinants of FDI inflows to 25 transition countries in Central Europe
and in the former Soviet Union, find that secondary education enrolment rate is not
significant. Nunnenkamp and Spatz (2002), using FDI stocks and FDI flows for a sample
of 28 developing countries, find that average years of schooling is not significant for
explaining both FDI stocks and flows in their multivariate regression analysis. In a study
investigating determinants of the location of FDI in 29 Chinese regions, Cheng & Kwan
(2000) find that none of their proxies for labour quality of the region, i.e. the percentages
of the population whose education was at least primary school, junior high school, and
senior high school, were significant determinants of FDI flows to Chinese regions.
Interestingly, in a subsequent study conducted by Gao (2005), where bilateral FDI flows
from 14 source countries to Chinese provinces are considered and bilateral specific
effects are accounted for, proxies for labour quality of the region is positive and
significant for most of their estimations. Jinyoung & Jungsoo (2012), investigating the
relationship between FDI and foreign educated labour in an FDI host country, find that
number of students in the host country who studied in an FDI source country has a
significant positive effect on bilateral FDI flows, while the effect of secondary and
tertiary school enrolment rates of the host country on FDI flows being insignificant.
Various explanations have been proposed by Miyamoto (2003) for these mixed findings
including different motives of FDI and the employment of different proxies for human
capital in the previous empirical studies. However, there can be reasons that are country
specific which can bias estimated slope coefficients of human capital. To this end it is
important to identify outliers –if there are any- and then to investigate country specific
issues that affect the relationship between human capital and FDI.
172
Sri Lanka is widely known for its high rating in human capital index in terms of literacy
rate and schooling rates, however, Sri Lanka‘s performance in FDI inflows is far behind
that of East Asian countries that have similar educational achievements. Nevertheless, it
cannot be concluded that Sri Lanka‘s educational achievements have not been
instrumental in attracting FDI just by comparing FDI and educational achievements
without controlling for other FDI determinants. To this end, one of the main purposes of
this study is to systematically investigate FDI performance against human capital and
other FDI determinant, while giving special attention to detach FDI-human capital
relationship that is specific to Sri Lanka from the relationship that is general to rest of the
countries.
173
6.3 Stock Market Valuations and FDI inflows
Arbitrage actions are generally associated with portfolio investments, however, both
empirical and theoretical considerations suggest that FDI flows may reflect arbitrage
activity by multinationals (Baker, Foley, & Wurgler, 2009). Extant literature recognises
two types of misprice driven FDI: cheap financial capital hypothesis and cheap asset (fire
sale) hypothesis. Under cheap financial capital hypothesis, it is assumed that FDI flows
take place as a result of an opportunistic use of the relatively low-cost financial capital
available to overvalued source-country firms. Under cheap asset hypothesis, it is
assumed that FDI flows reflect undervalued host country assets (Baker, Foley, &
Wurgler, 2009).
Empirical evidence testing cheap financial capital hypothesis and cheap asset (fire sale)
hypothesis in the context of FDI is scarce. Baker, Foley & Wurgler (2009), regressing
FDI flows on source and host country stock market valuations for US based FDI data,
found that FDI flows are strongly positively related to the average market price to book
value ratio of publicly traded firms in the source country, supporting the cheap financial
capital hypothesis. However, Baker, Foley & Wurgler (2009) have not found a
relationship between FDI flows and the market-to-book ratios of host countries, disputing
cheap asset hypothesis.
However, it should be noted that this study used market price to book value ratio rather
than market price to earnings ratio to proxy the host-country valuations. Since,
investments are taken place considering their earning potential rather than their asset
value, market price to earnings ratio is more appropriate than market price to book value
ratio as a proxy for market valuations. Moreover, this study is based on US based FDI
data, which can limit the generalisability of these findings to other countries, in
particular, to developing countries.
Countries that are riskier, financially underdeveloped, institutionally weak and less
transparent are supposed to have larger ratio of FDI to FPI inflows relative to countries
that are otherwise (Claessens, Klingebiel & Schmukler, 2001; Goldstein & Razin, 2006).
Thus, MNCs might prefer to engage in FDI in developing countries. Therefore, they
might have a higher tendency to arbitrage (or buy cheap assets) through FDI rather than
portfolio investments. More importantly, underdeveloped stock markets are often

174
manipulated and inefficient compared to developed stock markets (Khwaja & Mian,
2005). Due to these reasons, the degree of mispricing can be higher in developing
country stock markets, and therefore, cheap asset hypothesis is likely to be more
applicable to developing countries than developed countries. In some situations the stock
markets could be pegged at artificial levels (as it is for currency pegs) by the host country
governments with the use of its public funds and through manipulation of credit
availability. Sri Lanka stock market experience provides a good example on how a stock
market could be artificially pegged at a higher price level; during 2010 and 2011, in the
midst of heavy foreign selling, the Sri Lankan government played a prominent role for
sustaining high levels of prices (Daily Mirror, 2012). Therefore, an equally applicable
situation in the context of developing countries is the opposite of cheap asset hypothesis,
which is defined here as expensive asset hypothesis.
Expensive asset hypothesis: It is assumed that when the stock market is at an artificially
high valuation (artificially high price to earnings ratio), FDI flows are discouraged
because host country assets are overpriced.
6.3.1. Stock market valuations and FDI inflows: Sri Lanka’s experience
After the end of three decades of civil conflict in 2009, CSE went through a tremendous
but rather a magical growth. All share price index of Sri Lanka‘s Stock Exchange
recorded an inconceivable growth of 125.7% in year 2009 and 96% in year 2010. Sri
Lanka‘s Stock Exchange was the second best performing stock exchange in the world in
the year 2009 (Colombo Stock Exchange, 2009; Central Bank of Sri Lanka, 2010). As a
result of this magical growth, price to earnings ratio (PER) increased considerably after
the end of civil conflict; market PER went up from 5.4 (at the end of 2008) to 25.2 (at the
end of 2010). This growth of over 200% in the share price index and almost fivefold
increase in the market PER during 2009 and 2010 was fuelled by local buying interests
created mainly through credit support and from institutional buying from government
through its various funds. The government played a prominent role for sustaining high
levels of prices amidst heavy foreign selling. Therefore, the situation of Sri Lanka‘s stock
market in this period can be considered as a kind of pegged market, and therefore, one
could argue the share prices were artificially maintained at an upper level.
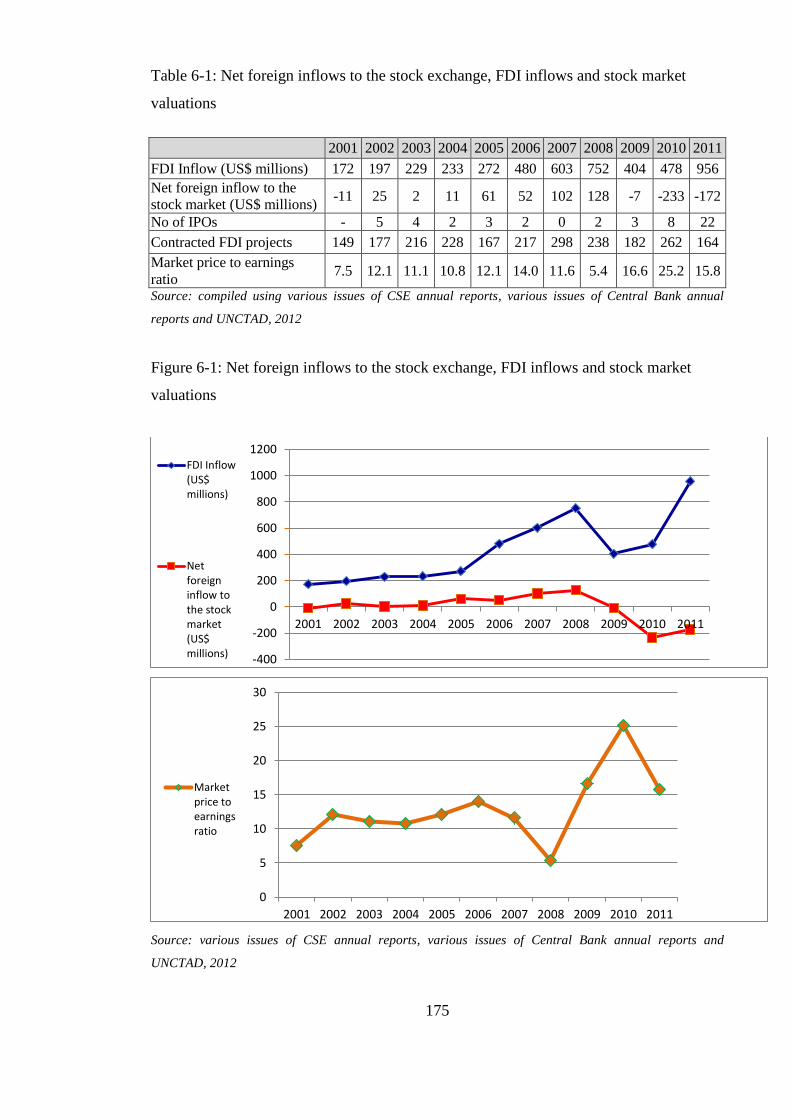
175
Table 6-1: Net foreign inflows to the stock exchange, FDI inflows and stock market
valuations
2001 2002 2003 2004 2005 2006 2007 2008 2009 2010 2011
FDI Inflow (US$ millions) 172 197 229 233 272 480 603 752 404 478 956
Net foreign inflow to the
stock market (US$ millions) -11 25 2 11 61 52 102 128 -7 -233 -172
No of IPOs - 5 4 2 3 2 0 2 3 8 22
Contracted FDI projects 149 177 216 228 167 217 298 238 182 262 164
Market price to earnings
ratio 7.5 12.1 11.1 10.8 12.1 14.0 11.6 5.4 16.6 25.2 15.8
Source: compiled using various issues of CSE annual reports, various issues of Central Bank annual
reports and UNCTAD, 2012
Figure 6-1: Net foreign inflows to the stock exchange, FDI inflows and stock market
valuations
Source: various issues of CSE annual reports, various issues of Central Bank annual reports and
UNCTAD, 2012
-400
-200
0
200
400
600
800
1000
1200
2001 2002 2003 2004 2005 2006 2007 2008 2009 2010 2011
FDI Inflow(US$millions)
Netforeigninflow tothe stockmarket(US$millions)
0
5
10
15
20
25
30
2001 2002 2003 2004 2005 2006 2007 2008 2009 2010 2011
Marketprice toearningsratio
176
Even though CSE recorded a sharp growth after the war, CSE has consecutively
recorded net foreign outflows since the end of civil war, possibly due to the higher price
levels in the stock market (Table 6-1 and Figure 6-1). CSE experienced net foreign
outflows of Rs.789 million, Rs. 26.3 billion, and Rs.19 billion in 2009, 2010 and 2011,
respectively, adding to a total net outflow of over Rs. 46 billion for the three years
(Central Bank Annual Report 2010). Also, even though FDI flows into Sri Lanka
increased considerably during the last decade, rather paradoxically, while the stock
market was going through a spectacular growth, FDI flows were unusually low in
2009 and 2010 despite the absence of war. A possible explanation for these strange
observations in net foreign inflows (portfolio and FDI) is that the foreign investors could
be reluctant to invest and/or could be selling their stocks because the stocks are
overpriced.
High PER could discourage potential foreign acquisitions because they have to pay high
prices if they acquire companies through the stock market. It is also possible that the PER
in the stock market to be used as a proxy for privately negotiated deals, and therefore,
higher PER can have a wider effect on foreign acquisitions. Higher PER can also make
investors of local businesses who wants to sell their assets or raise capital to prefer initial
public offerings (IPOs) through stock market over finding foreign investors. This will
increase the opportunity cost of selling to foreign investors through a privately negotiated
deal. This preference for IPOs over foreign investors can be observed by comparing FDI
inflows, IPOs and contracted projects (Table 6-1).
To summarise, even though FDI flows into Sri Lanka increased considerably during the
last decade, rather paradoxically, despite the absence of war, FDI flows were unusually
low in 2009 and 2010 when the stock market was going through a dramatic growth. This
recent performance in stock market and FDI provide an opportunity to test cheap asset
hypothesis (and expensive asset hypothesis). Also, due to various reasons mentioned
previously, cheap asset hypothesis (and expensive asset hypothesis) should be more
applicable for a country that has less developed stock market, and therefore, should be
more applicable to Sri Lanka.
Therefore, in light of these considerations, I hypothesise that cheap asset hypothesis (and
expensive asset hypothesis) is valid in the context of less developed stock markets, and

177
therefore, in the context of Sri Lank. Put it differently, it is hypothesised that price levels
in the stock market are inversely related to FDI inflows in the context of countries with
underdeveloped stock markets, and therefore, in the context of Sri Lanka.
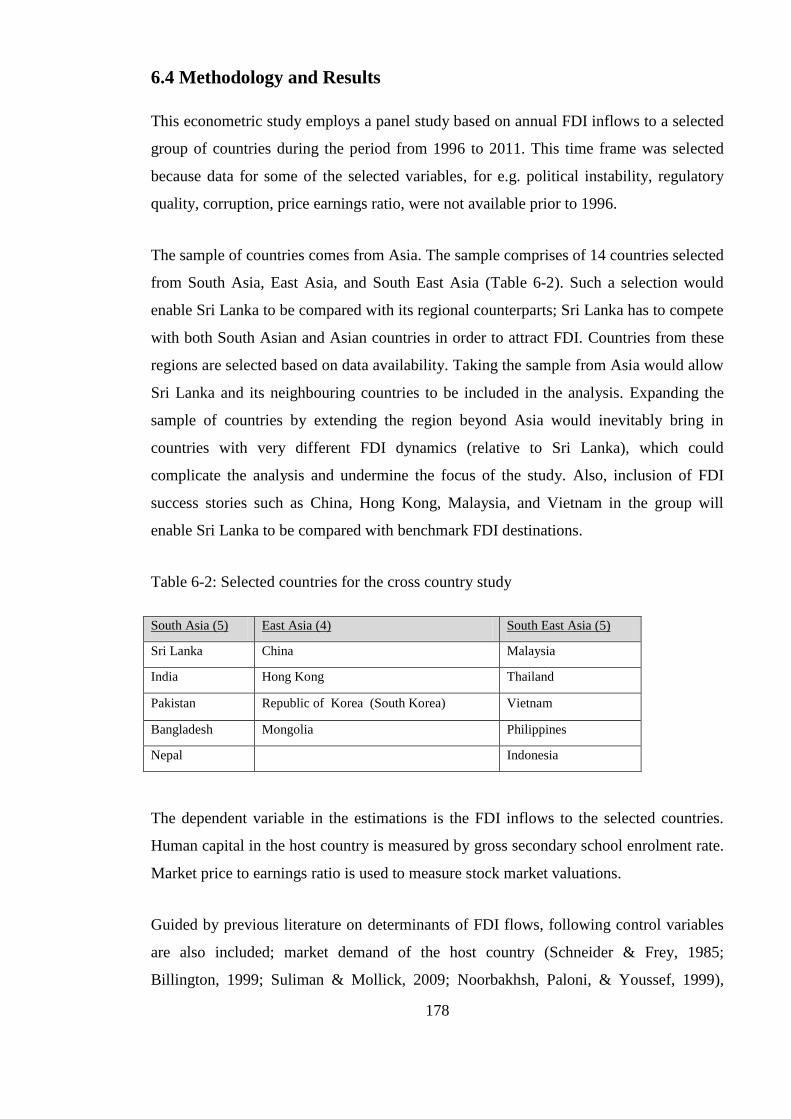
178
6.4 Methodology and Results
This econometric study employs a panel study based on annual FDI inflows to a selected
group of countries during the period from 1996 to 2011. This time frame was selected
because data for some of the selected variables, for e.g. political instability, regulatory
quality, corruption, price earnings ratio, were not available prior to 1996.
The sample of countries comes from Asia. The sample comprises of 14 countries selected
from South Asia, East Asia, and South East Asia (Table 6-2). Such a selection would
enable Sri Lanka to be compared with its regional counterparts; Sri Lanka has to compete
with both South Asian and Asian countries in order to attract FDI. Countries from these
regions are selected based on data availability. Taking the sample from Asia would allow
Sri Lanka and its neighbouring countries to be included in the analysis. Expanding the
sample of countries by extending the region beyond Asia would inevitably bring in
countries with very different FDI dynamics (relative to Sri Lanka), which could
complicate the analysis and undermine the focus of the study. Also, inclusion of FDI
success stories such as China, Hong Kong, Malaysia, and Vietnam in the group will
enable Sri Lanka to be compared with benchmark FDI destinations.
Table 6-2: Selected countries for the cross country study
The dependent variable in the estimations is the FDI inflows to the selected countries.
Human capital in the host country is measured by gross secondary school enrolment rate.
Market price to earnings ratio is used to measure stock market valuations.
Guided by previous literature on determinants of FDI flows, following control variables
are also included; market demand of the host country (Schneider & Frey, 1985;
Billington, 1999; Suliman & Mollick, 2009; Noorbakhsh, Paloni, & Youssef, 1999),
South Asia (5) East Asia (4) South East Asia (5)
Sri Lanka China Malaysia
India Hong Kong Thailand
Pakistan Republic of Korea (South Korea) Vietnam
Bangladesh Mongolia Philippines
Nepal Indonesia
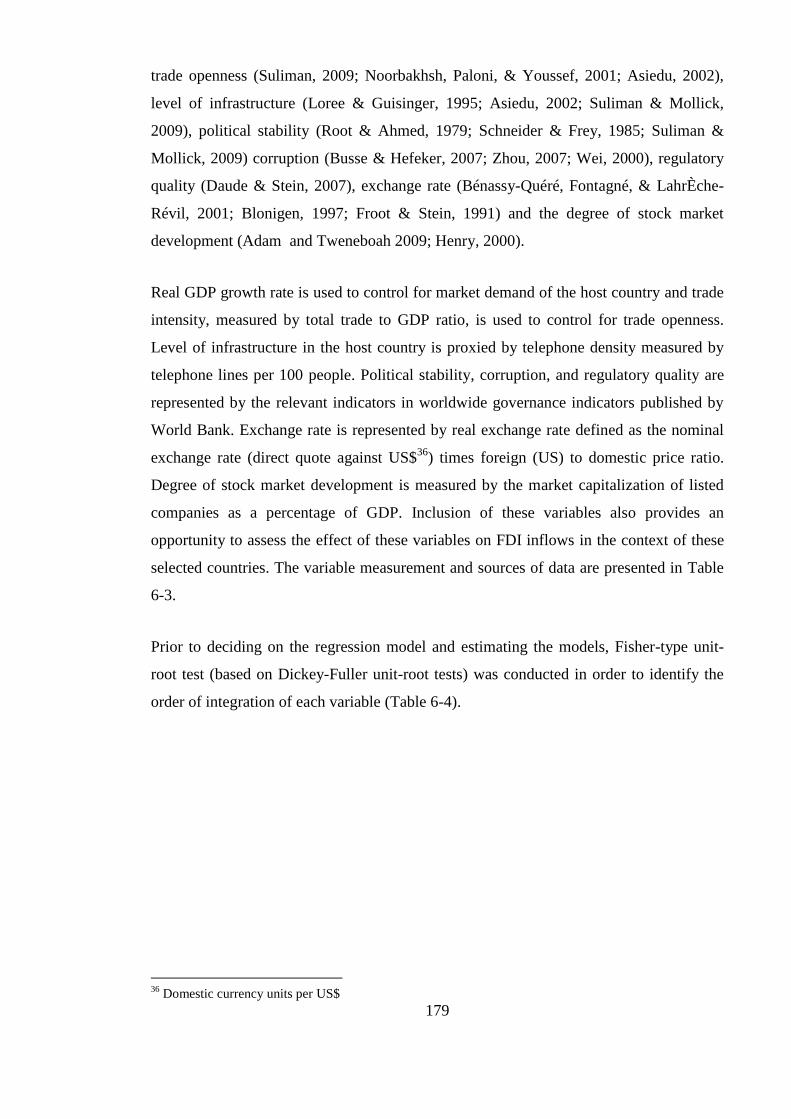
179
trade openness (Suliman, 2009; Noorbakhsh, Paloni, & Youssef, 2001; Asiedu, 2002),
level of infrastructure (Loree & Guisinger, 1995; Asiedu, 2002; Suliman & Mollick,
2009), political stability (Root & Ahmed, 1979; Schneider & Frey, 1985; Suliman &
Mollick, 2009) corruption (Busse & Hefeker, 2007; Zhou, 2007; Wei, 2000), regulatory
quality (Daude & Stein, 2007), exchange rate (Bénassy-Quéré, Fontagné, & LahrÈche-
Révil, 2001; Blonigen, 1997; Froot & Stein, 1991) and the degree of stock market
development (Adam and Tweneboah 2009; Henry, 2000).
Real GDP growth rate is used to control for market demand of the host country and trade
intensity, measured by total trade to GDP ratio, is used to control for trade openness.
Level of infrastructure in the host country is proxied by telephone density measured by
telephone lines per 100 people. Political stability, corruption, and regulatory quality are
represented by the relevant indicators in worldwide governance indicators published by
World Bank. Exchange rate is represented by real exchange rate defined as the nominal
exchange rate (direct quote against US$36
) times foreign (US) to domestic price ratio.
Degree of stock market development is measured by the market capitalization of listed
companies as a percentage of GDP. Inclusion of these variables also provides an
opportunity to assess the effect of these variables on FDI inflows in the context of these
selected countries. The variable measurement and sources of data are presented in Table
6-3.
Prior to deciding on the regression model and estimating the models, Fisher-type unit-
root test (based on Dickey-Fuller unit-root tests) was conducted in order to identify the
order of integration of each variable (Table 6-4).
36
Domestic currency units per US$
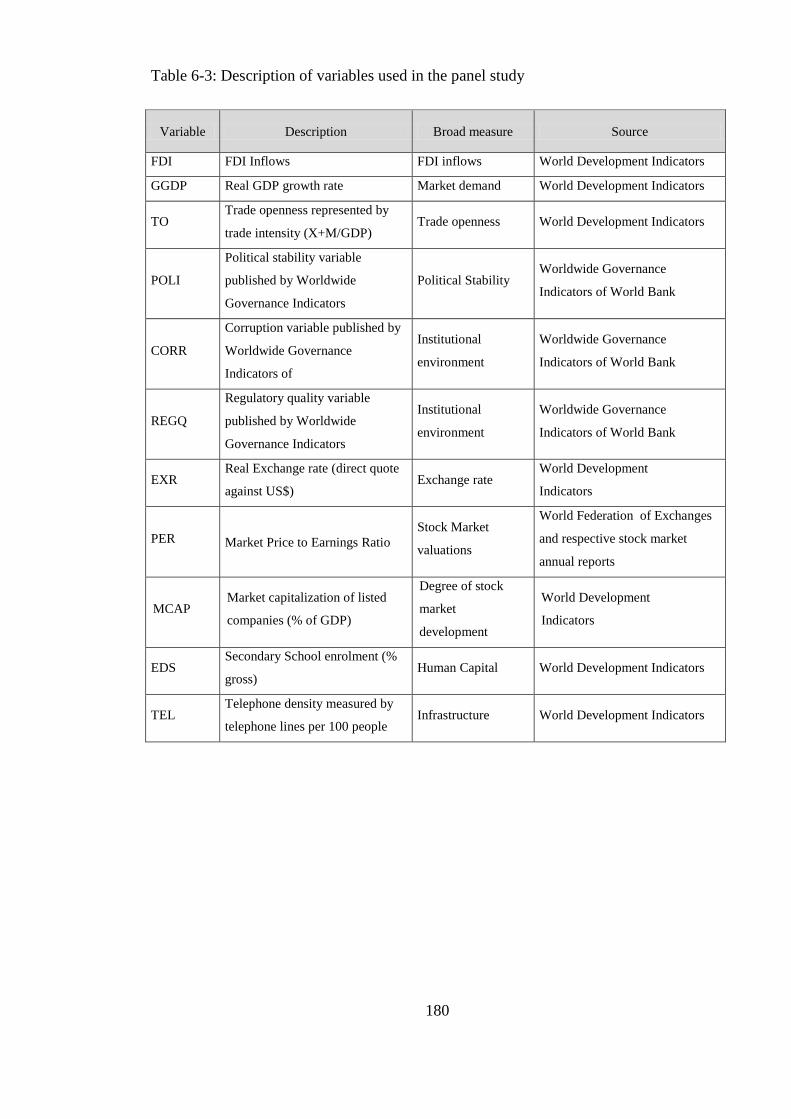
180
Table 6-3: Description of variables used in the panel study
Variable Description Broad measure Source
FDI FDI Inflows FDI inflows World Development Indicators
GGDP Real GDP growth rate Market demand World Development Indicators
TO Trade openness represented by
trade intensity (X+M/GDP) Trade openness World Development Indicators
POLI
Political stability variable
published by Worldwide
Governance Indicators
Political Stability Worldwide Governance
Indicators of World Bank
CORR
Corruption variable published by
Worldwide Governance
Indicators of
Institutional
environment
Worldwide Governance
Indicators of World Bank
REGQ
Regulatory quality variable
published by Worldwide
Governance Indicators
Institutional
environment
Worldwide Governance
Indicators of World Bank
EXR Real Exchange rate (direct quote
against US$) Exchange rate
World Development
Indicators
PER Market Price to Earnings Ratio
Stock Market
valuations
World Federation of Exchanges
and respective stock market
annual reports
MCAP Market capitalization of listed
companies (% of GDP)
Degree of stock
market
development
World Development
Indicators
EDS Secondary School enrolment (%
gross) Human Capital World Development Indicators
TEL Telephone density measured by
telephone lines per 100 people Infrastructure World Development Indicators
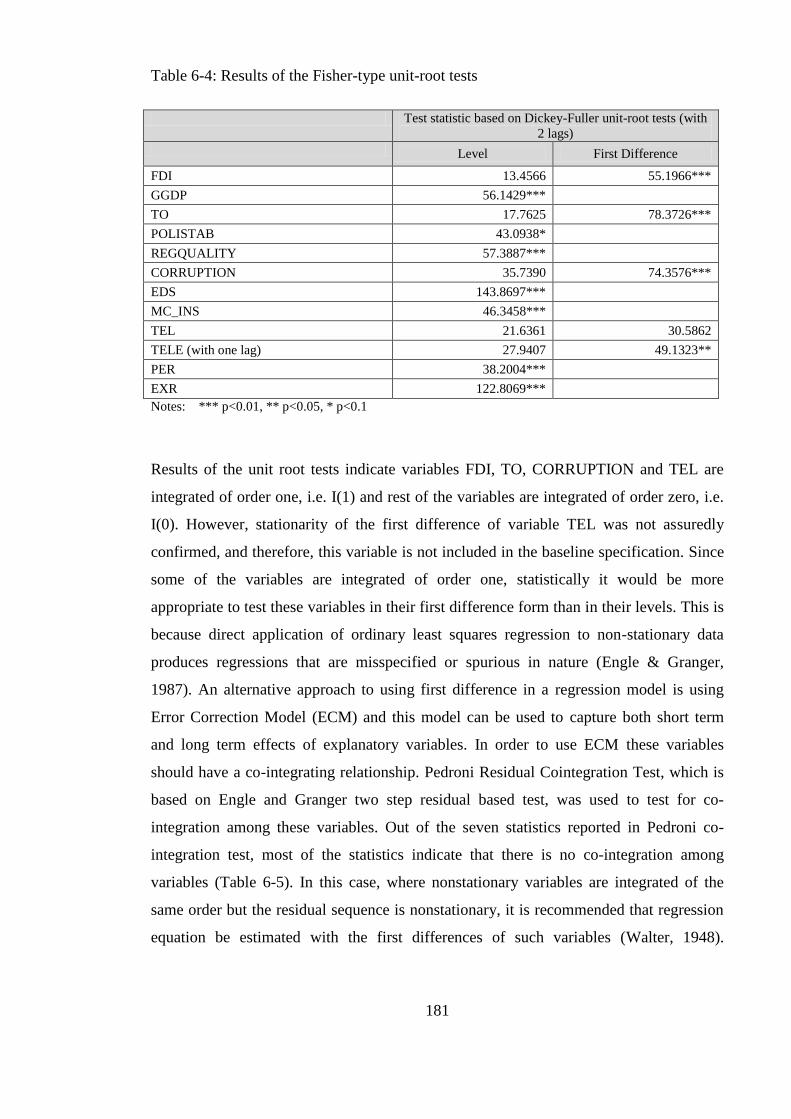
181
Table 6-4: Results of the Fisher-type unit-root tests
Test statistic based on Dickey-Fuller unit-root tests (with
2 lags)
Level First Difference
FDI 13.4566 55.1966***
GGDP 56.1429***
TO 17.7625 78.3726***
POLISTAB 43.0938*
REGQUALITY 57.3887***
CORRUPTION 35.7390 74.3576***
EDS 143.8697***
MC_INS 46.3458***
TEL 21.6361 30.5862
TELE (with one lag) 27.9407 49.1323**
PER 38.2004***
EXR 122.8069***
Notes: *** p<0.01, ** p<0.05, * p<0.1
Results of the unit root tests indicate variables FDI, TO, CORRUPTION and TEL are
integrated of order one, i.e. I(1) and rest of the variables are integrated of order zero, i.e.
I(0). However, stationarity of the first difference of variable TEL was not assuredly
confirmed, and therefore, this variable is not included in the baseline specification. Since
some of the variables are integrated of order one, statistically it would be more
appropriate to test these variables in their first difference form than in their levels. This is
because direct application of ordinary least squares regression to non-stationary data
produces regressions that are misspecified or spurious in nature (Engle & Granger,
1987). An alternative approach to using first difference in a regression model is using
Error Correction Model (ECM) and this model can be used to capture both short term
and long term effects of explanatory variables. In order to use ECM these variables
should have a co-integrating relationship. Pedroni Residual Cointegration Test, which is
based on Engle and Granger two step residual based test, was used to test for co-
integration among these variables. Out of the seven statistics reported in Pedroni co-
integration test, most of the statistics indicate that there is no co-integration among
variables (Table 6-5). In this case, where nonstationary variables are integrated of the
same order but the residual sequence is nonstationary, it is recommended that regression
equation be estimated with the first differences of such variables (Walter, 1948).
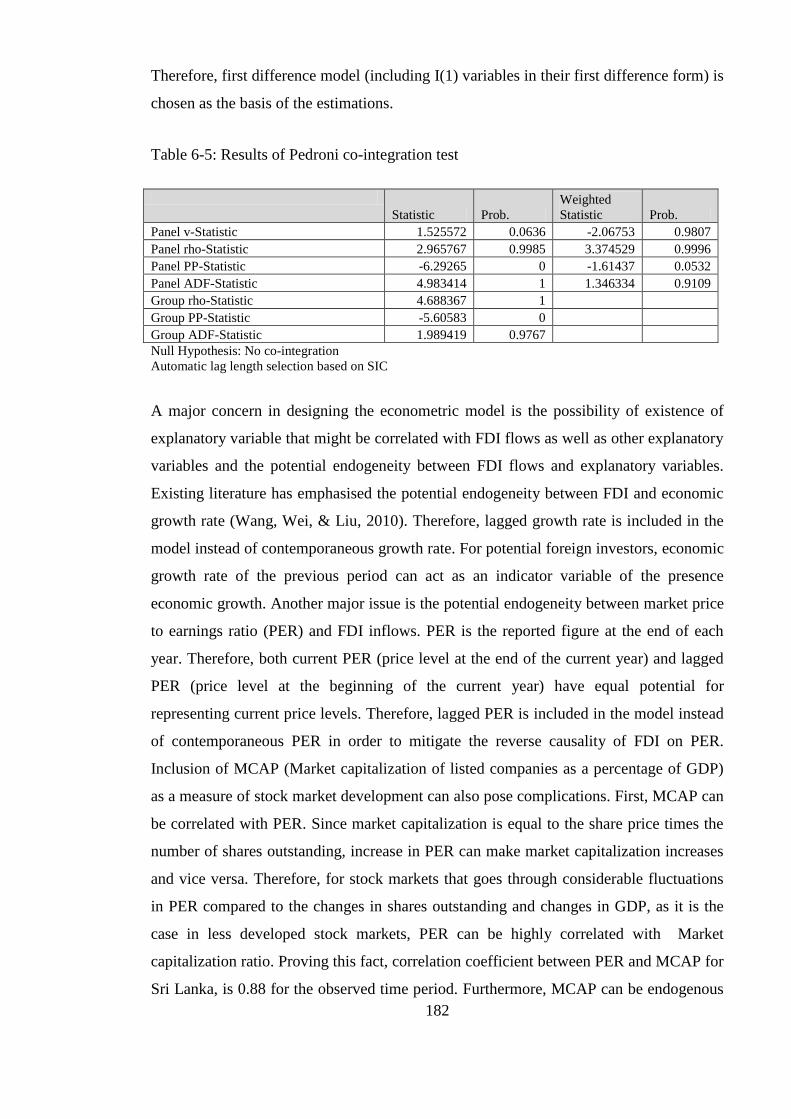
182
Therefore, first difference model (including I(1) variables in their first difference form) is
chosen as the basis of the estimations.
Table 6-5: Results of Pedroni co-integration test
Statistic Prob.
Weighted
Statistic Prob.
Panel v-Statistic 1.525572 0.0636 -2.06753 0.9807
Panel rho-Statistic 2.965767 0.9985 3.374529 0.9996
Panel PP-Statistic -6.29265 0 -1.61437 0.0532
Panel ADF-Statistic 4.983414 1 1.346334 0.9109
Group rho-Statistic 4.688367 1
Group PP-Statistic -5.60583 0
Group ADF-Statistic 1.989419 0.9767
Null Hypothesis: No co-integration
Automatic lag length selection based on SIC
A major concern in designing the econometric model is the possibility of existence of
explanatory variable that might be correlated with FDI flows as well as other explanatory
variables and the potential endogeneity between FDI flows and explanatory variables.
Existing literature has emphasised the potential endogeneity between FDI and economic
growth rate (Wang, Wei, & Liu, 2010). Therefore, lagged growth rate is included in the
model instead of contemporaneous growth rate. For potential foreign investors, economic
growth rate of the previous period can act as an indicator variable of the presence
economic growth. Another major issue is the potential endogeneity between market price
to earnings ratio (PER) and FDI inflows. PER is the reported figure at the end of each
year. Therefore, both current PER (price level at the end of the current year) and lagged
PER (price level at the beginning of the current year) have equal potential for
representing current price levels. Therefore, lagged PER is included in the model instead
of contemporaneous PER in order to mitigate the reverse causality of FDI on PER.
Inclusion of MCAP (Market capitalization of listed companies as a percentage of GDP)
as a measure of stock market development can also pose complications. First, MCAP can
be correlated with PER. Since market capitalization is equal to the share price times the
number of shares outstanding, increase in PER can make market capitalization increases
and vice versa. Therefore, for stock markets that goes through considerable fluctuations
in PER compared to the changes in shares outstanding and changes in GDP, as it is the
case in less developed stock markets, PER can be highly correlated with Market
capitalization ratio. Proving this fact, correlation coefficient between PER and MCAP for
Sri Lanka, is 0.88 for the observed time period. Furthermore, MCAP can be endogenous
183
with FDI as well as economic growth rate. In order to address these concerns, the
following instrumental variable is used to represent the level of stock market
development.
MC_INS = ( L2.MCAP + L3.MCAP + L4.MCAP ) / 3
Where Li is the ith
lag of the variable
All the endogeneity concerns are mitigated by not including both current measures as
well as lagged measures of MCAP. In order to MC_INS to be a good instrumental
variable, first, MC_INS should be highly correlated with MCAP and, second, MC_INS
should be exogenous from FDI, GDP and PER. MC_INS is highly correlated with
MCAP with a correlation coefficient of 0.92. By construct, MC_INS is exogenous from
FDI, GDP and PER; because both current measures and lagged measures of MCAP are
not used to construct MC_INS. Supporting this further, the correlation coefficient
between PER and MC_INS for Sri Lanka, is 0.22 which is far lower than the correlation
coefficient between PER and MCAP for Sri Lanka, which is 0.88.
Considering the results of unit root tests and above concerns, following two baseline
specifications are formulated.
∆FDI = α0 + α 1 EDS + α2 Ds*EDS + α3 GGDP + α4 ∆TO + α5 POLI + α6 MC_INS + + α6 EXR + ε1
(6.1)
∆FDI = β0 + β1 PER + β2 Ds*PER + β3 GGDP + β4 ∆TO + β6 POLI + β7 MC_INS + β8 EXR + ε2
(6.2)
Ds-Dummy variable for Sri Lanka
Estimated results of specification 6.1 are reported in Table 6-6. Variables FDI, TO,
TELE, and CORR were plugged into the specifications in their first differences since
they were not stationary. First the specification was estimated without the variable TELE
since the stationarity of ∆TELE was not assuredly confirmed. Institutional factors are
interconnected and dependent on each other, and therefore, weaknesses in one
institutional factor can lead into deterioration in other institutional variables: for example,
economic, political and social structures that are poorly differentiated and lack
independency can facilitate and propagate corruption. Confirming this, the correlation
coefficients among institutional variables were very high, particularly between variables
REGQUALITY and CORRUPTION, for which correlation coefficient was 0.932.
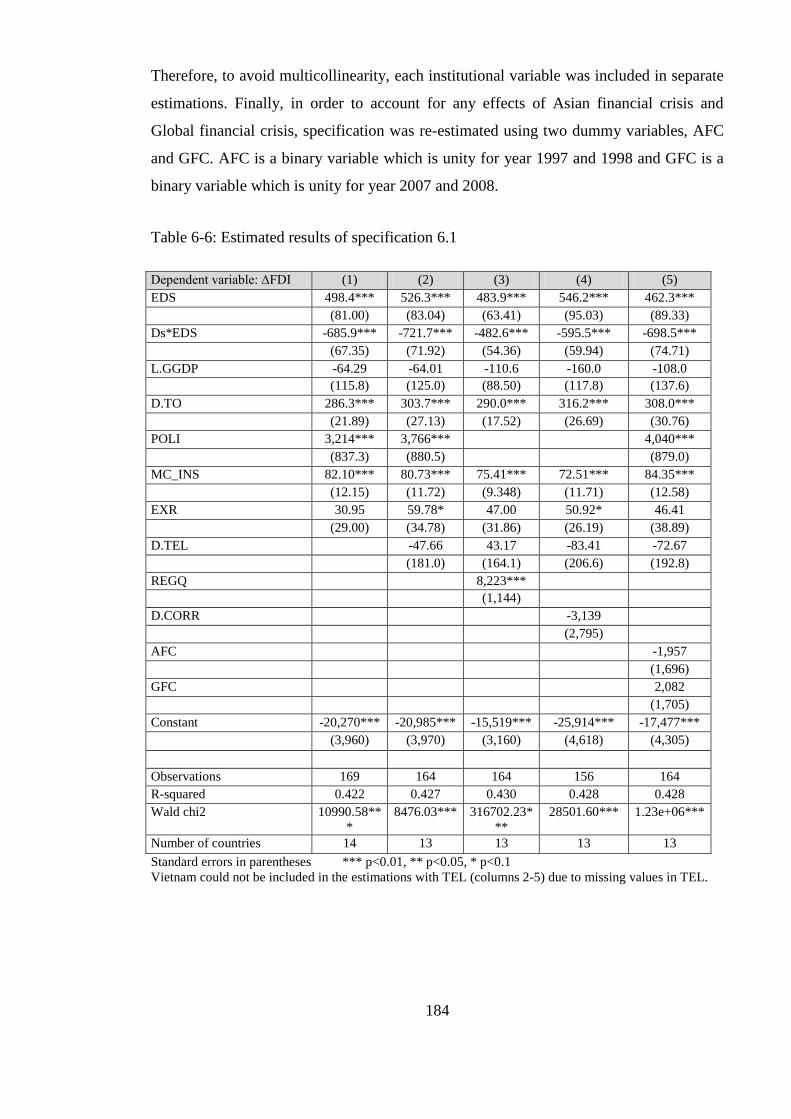
184
Therefore, to avoid multicollinearity, each institutional variable was included in separate
estimations. Finally, in order to account for any effects of Asian financial crisis and
Global financial crisis, specification was re-estimated using two dummy variables, AFC
and GFC. AFC is a binary variable which is unity for year 1997 and 1998 and GFC is a
binary variable which is unity for year 2007 and 2008.
Table 6-6: Estimated results of specification 6.1
Dependent variable: ∆FDI (1) (2) (3) (4) (5)
EDS 498.4*** 526.3*** 483.9*** 546.2*** 462.3***
(81.00) (83.04) (63.41) (95.03) (89.33)
Ds*EDS -685.9*** -721.7*** -482.6*** -595.5*** -698.5***
(67.35) (71.92) (54.36) (59.94) (74.71)
L.GGDP -64.29 -64.01 -110.6 -160.0 -108.0
(115.8) (125.0) (88.50) (117.8) (137.6)
D.TO 286.3*** 303.7*** 290.0*** 316.2*** 308.0***
(21.89) (27.13) (17.52) (26.69) (30.76)
POLI 3,214*** 3,766*** 4,040***
(837.3) (880.5) (879.0)
MC_INS 82.10*** 80.73*** 75.41*** 72.51*** 84.35***
(12.15) (11.72) (9.348) (11.71) (12.58)
EXR 30.95 59.78* 47.00 50.92* 46.41
(29.00) (34.78) (31.86) (26.19) (38.89)
D.TEL -47.66 43.17 -83.41 -72.67
(181.0) (164.1) (206.6) (192.8)
REGQ 8,223***
(1,144)
D.CORR -3,139
(2,795)
AFC -1,957
(1,696)
GFC 2,082
(1,705)
Constant -20,270*** -20,985*** -15,519*** -25,914*** -17,477***
(3,960) (3,970) (3,160) (4,618) (4,305)
Observations 169 164 164 156 164
R-squared 0.422 0.427 0.430 0.428 0.428
Wald chi2 10990.58**
*
8476.03*** 316702.23*
**
28501.60*** 1.23e+06***
Number of countries 14 13 13 13 13
Standard errors in parentheses *** p<0.01, ** p<0.05, * p<0.1
Vietnam could not be included in the estimations with TEL (columns 2-5) due to missing values in TEL.
185
Specifications 6.1 was initially estimated using fixed effects estimation (employing
country fixed effects). According to the test results, residuals of the estimations displayed
heteroskedasticity in all the specifications. Wooldridge test for autocorrelation was used
to test for serial correlation among residuals in the estimations, and the test results
indicate that there is serial correlation among residuals in all specifications. In the
presence of autocorrelation, although OLS estimates are unbiased and consistent, they
are inefficient and standard errors tend to be underestimated/overestimated. Presence of
missing data in some panels did not allow testing for cross sectional dependence for the
whole sample. Therefore, cross sectional dependence were tested for a smaller sample
(11 countries) where complete data were available, and the test indicated presence of
cross sectional correlation. Therefore, specifications were estimated using fixed effects
estimation with heteroskedastic, cross sectional dependent and panel-specific AR1
autocorrelation error structure37
.
In all specifications, human capital (EDS) have the expected positive sign and significant
at a one per cent significance level. Coefficient of the interaction term between Sri Lanka
dummy and human capital variable (Ds*EDS), which corresponds to the additional effect
of human capital for Sri Lanka, is negative and significant at a one per cent significance
level. Its absolute value is numerically larger than the coefficient of EDS. Coefficient of
human capital for Sri Lanka is given by the sum of coefficients of EDS and Ds*EDS,
which add up to a negative value in all specifications. Therefore, the coefficient of
human capital for Sri Lanka is negative in all specifications. This supports the point of
view that although Sri Lanka scores well in human capital measurements, Sri Lanka has
not been able to capitalise on these high scores to attract FDI.
With respect to control variables, most of the results are consistent with expectations,
except GDP growth rate. Trade openness (TO), the level of development of stock market
(MC_INS), political stability (POLI) and regulatory quality (REGQ) have the expected
positive sign and significant in all specifications. Coefficient estimate of exchange rate is
positive and significant in some of the estimations. This positive coefficient indicates that
depreciation of exchange rate is associated with higher FDI flows, which is consistent
with the mainstream of the extant literature. GDP growth rate (GGDP) has a negative
37
Estimations were carried out based on xtpcse estimator. xtpcse calculates panel-corrected standard error
(PCSE) estimates for panel data models.
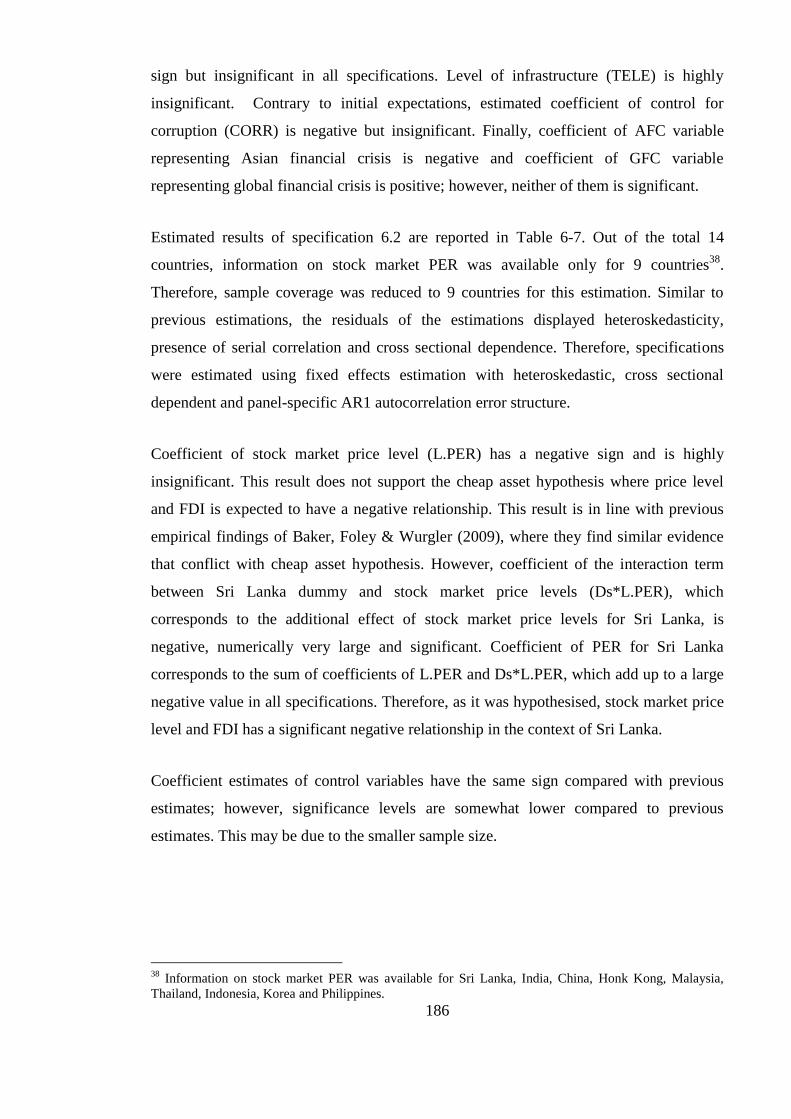
186
sign but insignificant in all specifications. Level of infrastructure (TELE) is highly
insignificant. Contrary to initial expectations, estimated coefficient of control for
corruption (CORR) is negative but insignificant. Finally, coefficient of AFC variable
representing Asian financial crisis is negative and coefficient of GFC variable
representing global financial crisis is positive; however, neither of them is significant.
Estimated results of specification 6.2 are reported in Table 6-7. Out of the total 14
countries, information on stock market PER was available only for 9 countries38
.
Therefore, sample coverage was reduced to 9 countries for this estimation. Similar to
previous estimations, the residuals of the estimations displayed heteroskedasticity,
presence of serial correlation and cross sectional dependence. Therefore, specifications
were estimated using fixed effects estimation with heteroskedastic, cross sectional
dependent and panel-specific AR1 autocorrelation error structure.
Coefficient of stock market price level (L.PER) has a negative sign and is highly
insignificant. This result does not support the cheap asset hypothesis where price level
and FDI is expected to have a negative relationship. This result is in line with previous
empirical findings of Baker, Foley & Wurgler (2009), where they find similar evidence
that conflict with cheap asset hypothesis. However, coefficient of the interaction term
between Sri Lanka dummy and stock market price levels (Ds*L.PER), which
corresponds to the additional effect of stock market price levels for Sri Lanka, is
negative, numerically very large and significant. Coefficient of PER for Sri Lanka
corresponds to the sum of coefficients of L.PER and Ds*L.PER, which add up to a large
negative value in all specifications. Therefore, as it was hypothesised, stock market price
level and FDI has a significant negative relationship in the context of Sri Lanka.
Coefficient estimates of control variables have the same sign compared with previous
estimates; however, significance levels are somewhat lower compared to previous
estimates. This may be due to the smaller sample size.
38
Information on stock market PER was available for Sri Lanka, India, China, Honk Kong, Malaysia,
Thailand, Indonesia, Korea and Philippines.
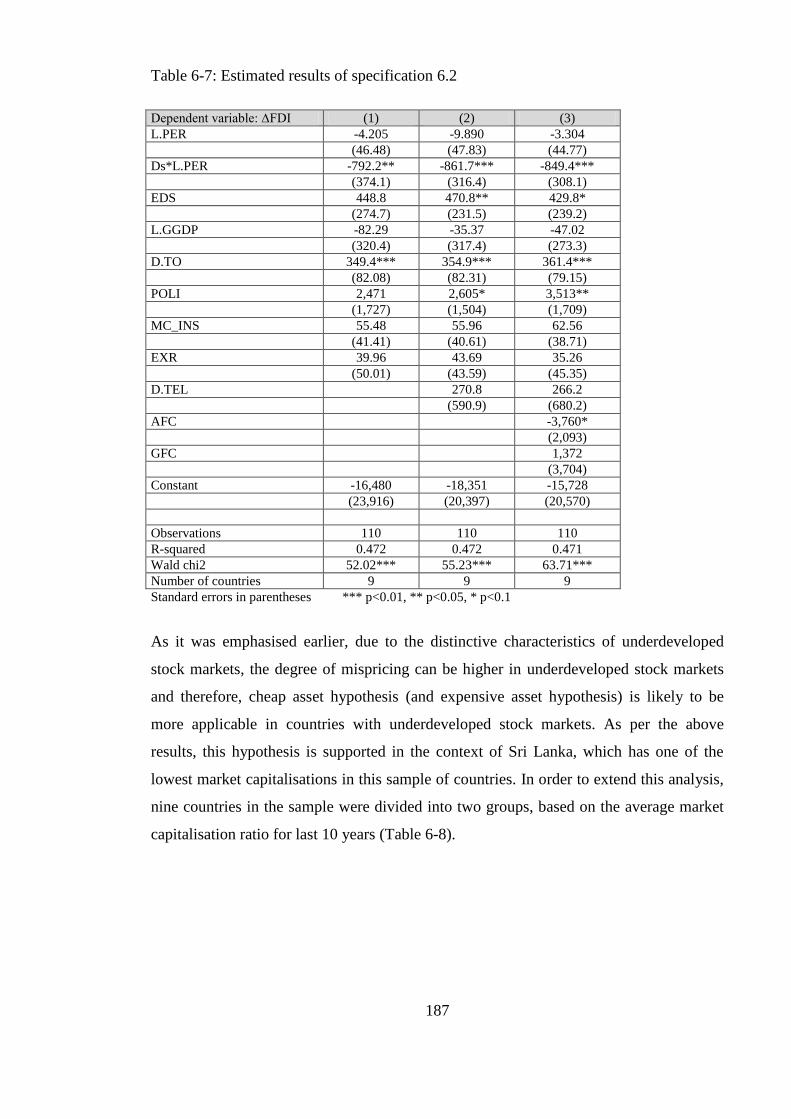
187
Table 6-7: Estimated results of specification 6.2
Dependent variable: ∆FDI (1) (2) (3)
L.PER -4.205 -9.890 -3.304
(46.48) (47.83) (44.77)
Ds*L.PER -792.2** -861.7*** -849.4***
(374.1) (316.4) (308.1)
EDS 448.8 470.8** 429.8*
(274.7) (231.5) (239.2)
L.GGDP -82.29 -35.37 -47.02
(320.4) (317.4) (273.3)
D.TO 349.4*** 354.9*** 361.4***
(82.08) (82.31) (79.15)
POLI 2,471 2,605* 3,513**
(1,727) (1,504) (1,709)
MC_INS 55.48 55.96 62.56
(41.41) (40.61) (38.71)
EXR 39.96 43.69 35.26
(50.01) (43.59) (45.35)
D.TEL 270.8 266.2
(590.9) (680.2)
AFC -3,760*
(2,093)
GFC 1,372
(3,704)
Constant -16,480 -18,351 -15,728
(23,916) (20,397) (20,570)
Observations 110 110 110
R-squared 0.472 0.472 0.471
Wald chi2 52.02*** 55.23*** 63.71***
Number of countries 9 9 9
Standard errors in parentheses *** p<0.01, ** p<0.05, * p<0.1
As it was emphasised earlier, due to the distinctive characteristics of underdeveloped
stock markets, the degree of mispricing can be higher in underdeveloped stock markets
and therefore, cheap asset hypothesis (and expensive asset hypothesis) is likely to be
more applicable in countries with underdeveloped stock markets. As per the above
results, this hypothesis is supported in the context of Sri Lanka, which has one of the
lowest market capitalisations in this sample of countries. In order to extend this analysis,
nine countries in the sample were divided into two groups, based on the average market
capitalisation ratio for last 10 years (Table 6-8).
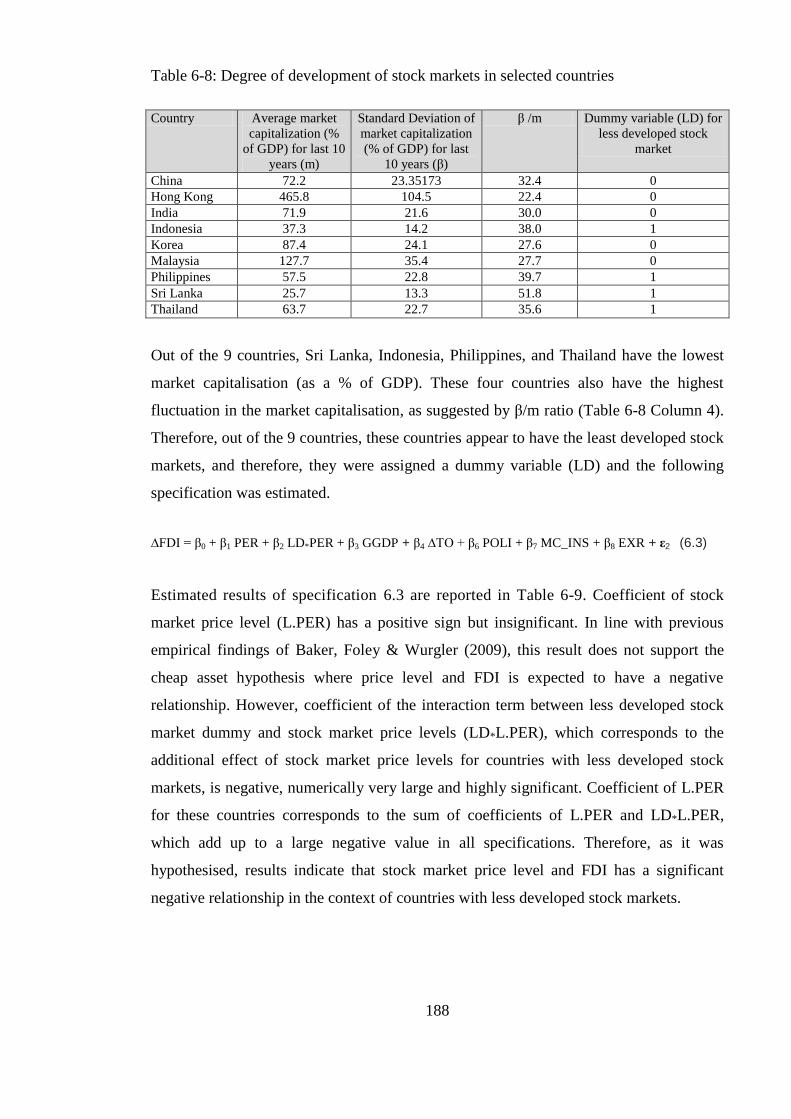
188
Table 6-8: Degree of development of stock markets in selected countries
Country Average market
capitalization (%
of GDP) for last 10
years (m)
Standard Deviation of
market capitalization
(% of GDP) for last
10 years (β)
β /m Dummy variable (LD) for
less developed stock
market
China 72.2 23.35173 32.4 0
Hong Kong 465.8 104.5 22.4 0
India 71.9 21.6 30.0 0
Indonesia 37.3 14.2 38.0 1
Korea 87.4 24.1 27.6 0
Malaysia 127.7 35.4 27.7 0
Philippines 57.5 22.8 39.7 1
Sri Lanka 25.7 13.3 51.8 1
Thailand 63.7 22.7 35.6 1
Out of the 9 countries, Sri Lanka, Indonesia, Philippines, and Thailand have the lowest
market capitalisation (as a % of GDP). These four countries also have the highest
fluctuation in the market capitalisation, as suggested by β/m ratio (Table 6-8 Column 4).
Therefore, out of the 9 countries, these countries appear to have the least developed stock
markets, and therefore, they were assigned a dummy variable (LD) and the following
specification was estimated.
∆FDI = β0 + β1 PER + β2 LD*PER + β3 GGDP + β4 ∆TO + β6 POLI + β7 MC_INS + β8 EXR + ε2 (6.3)
Estimated results of specification 6.3 are reported in Table 6-9. Coefficient of stock
market price level (L.PER) has a positive sign but insignificant. In line with previous
empirical findings of Baker, Foley & Wurgler (2009), this result does not support the
cheap asset hypothesis where price level and FDI is expected to have a negative
relationship. However, coefficient of the interaction term between less developed stock
market dummy and stock market price levels (LD*L.PER), which corresponds to the
additional effect of stock market price levels for countries with less developed stock
markets, is negative, numerically very large and highly significant. Coefficient of L.PER
for these countries corresponds to the sum of coefficients of L.PER and LD*L.PER,
which add up to a large negative value in all specifications. Therefore, as it was
hypothesised, results indicate that stock market price level and FDI has a significant
negative relationship in the context of countries with less developed stock markets.
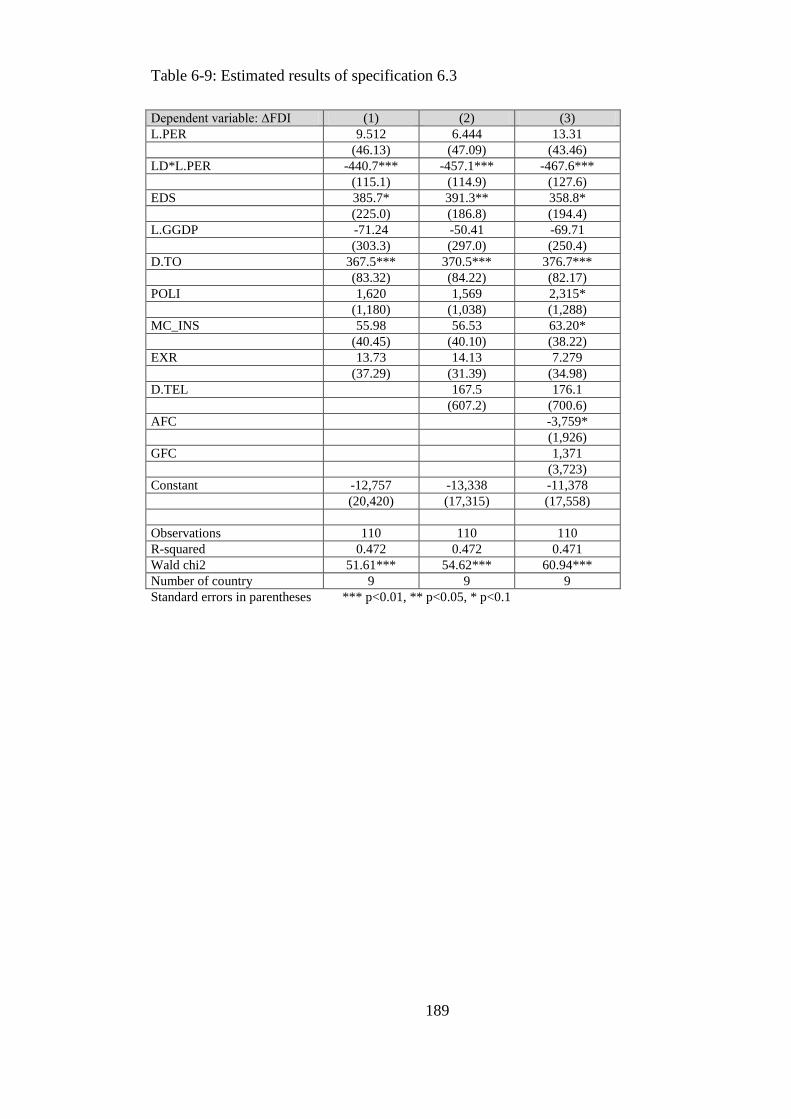
189
Table 6-9: Estimated results of specification 6.3
Dependent variable: ∆FDI (1) (2) (3)
L.PER 9.512 6.444 13.31
(46.13) (47.09) (43.46)
LD*L.PER -440.7*** -457.1*** -467.6***
(115.1) (114.9) (127.6)
EDS 385.7* 391.3** 358.8*
(225.0) (186.8) (194.4)
L.GGDP -71.24 -50.41 -69.71
(303.3) (297.0) (250.4)
D.TO 367.5*** 370.5*** 376.7***
(83.32) (84.22) (82.17)
POLI 1,620 1,569 2,315*
(1,180) (1,038) (1,288)
MC_INS 55.98 56.53 63.20*
(40.45) (40.10) (38.22)
EXR 13.73 14.13 7.279
(37.29) (31.39) (34.98)
D.TEL 167.5 176.1
(607.2) (700.6)
AFC -3,759*
(1,926)
GFC 1,371
(3,723)
Constant -12,757 -13,338 -11,378
(20,420) (17,315) (17,558)
Observations 110 110 110
R-squared 0.472 0.472 0.471
Wald chi2 51.61*** 54.62*** 60.94***
Number of country 9 9 9
Standard errors in parentheses *** p<0.01, ** p<0.05, * p<0.1
190
6.5 Analysis and Discussion of Results
6.5.1 Human capital as a determinant of FDI
It was revealed that human capital has a significant positive relationship with FDI
inflows to the selected Asian countries. However, this was not the case for Sri Lanka; the
relationship between human capital and FDI flows was significantly negative for Sri
Lanka. Does this mean increase in human capital has negatively affected FDI flows to Sri
Lanka? This is unlikely to be the case. We have to interpret the result cautiously, without
establishing a naive causality of human capital affecting FDI negatively.
The negative relationship between human capital and FDI inflows in Sri Lanka may not
be surprising due to few reasons. First, Sri Lanka‘s human capital indicators are more
than exceptional, particularly for a developing country with less achievement in other
facets. Since these other facets such as level of development, infrastructure, and income
levels also affect FDI inflows, performance of FDI does not commensurate with the level
of human capital. Therefore, further improvements in human capital cannot positively
affect FDI inflows due to constraints in these other facets. Moreover, since Sri Lanka‘s
secondary education enrolment rate was already very high in 1995, which is the starting
period for this regression study, further increase in human capital after 1995 may be
contributing diminishing marginal effects.
Even though we cannot conclude any causality of human capital negatively affecting FDI
in Sri Lanka, we can clearly understand that Sri Lanka has not been able to capitalise on
its impressive human capital indicators to attract FDI, formally from the results of the
panel study, and casually from comparing Sri Lanka‘s performances in FDI and Human
Capital indicators. Therefore, the important question is why Sri Lanka has not been able
to capitalise on its impressive human capital indicators to attract FDI.
Quality of education and FDI inflows
If the quality of education differs between two countries, then there literacy rates and
particularly the secondary/primary school enrolment ratios are difficult to be compared;
A country with a less attractive literacy rates and schooling rates might have a more
effective education system than a country that has a better profile in terms of literacy
rates and secondary/primary school enrolment ratios, and therefore, the former might be

191
able to offer a better package of skills to foreign investors than the latter. This aspect is
neglected in previous research studies, and therefore, may have also been a reason for
some studies to produce weak relationships between Human capital and FDI inflows.
Even though Sri Lanka has a high rating in human capital index in terms of literacy rate
and schooling rates (UNDP Sri Lanka, 1998; UNDP Sri Lanka, 2012; Duma, 2007; The
World Bank, 2011), it might be the case that Sri Lanka has concentrated only on the
quantity while neglecting the aspect of quality in education. It is noteworthy that Sri
Lanka, being classified as a middle-level income group country, spends only a 3% of its
national income on education, while average spending on education by countries in the
low and lower-middle income groups are around 3.2% and 4.1% respectively
(Ganegodage & Rambaldi, 2011). Education expenditure as a share of national income
and as a share of government expenditure in Sri Lanka and selected other countries are
given in Table 6-10. It can be clearly seen that Sri Lanka‘s spending on education does
not commensurate with its achievement in education. Also, Sri Lanka‘s education system
is highly criticised for being inefficient, and for having a low level of interaction between
academic world and industry, which have resulted in high level of graduate
unemployment (Aturupane, 2009; Country Summary of Higher Education, 2007;
Ganegodage & Rambaldi, 2011).
Table 6-10: Education expenditure as a share of national income and government
expenditures for Sri Lanka and selected other countries.
Source: (Aturupane, 2009)

192
Countries where education system is dominated by the public sector are well known for
their associated inefficiencies that bring about negative impact on the quality of
education (Bukowska & Siwińska-Gorzelak, 2011). Wößmann (2007) finds that student
performance is better in countries with large share of privately managed schools. In Sri
Lanka, private sector is largely excluded from the provision of education (Aturupane,
2009, Ganegoda & Rambaldi, 2011). Several efforts in the past to establish private
universities in Sri Lanka were also blocked, mainly due to pressures of students, political
parties, and various interest groups. Higher education is mainly catered through the 17
public universities, which are sufficient to cater to only 3% of student enrolment rate
(Country Summary of Higher Education, 2007). Nevertheless, universities, other public
institutions and unregulated private institutions, collectively, cater for about 18% of
student enrolments (Country Summary of Higher Education, 2007). It is believed that a
significant proportion of students go abroad for higher education but the exact statistics
are not available (Silva, 2012). Limiting the private sector in participating in the
provision of education has several negative consequences. It puts an extra burden on the
government because the cost of providing education is largely borne by the government.
This also reduces the resources available for the education sector, and undermines the
efficiency of government education system due to lack of competition from private
players (Aturupane, 2009). Furthermore, Sri Lanka has restrictions on FDI in education
sector (UNCTAD, 2004). Such restrictions would further obstruct the flow of latest skills
and knowledge to the country‘s education sector.
In his study examining the effects of educational performance on the economic growth of
Sri Lanka and Pakistan during the period 1970–1994, Abbas (2001) has found that
education at the primary level has a negative relationship, secondary level has a
significant positive relationship and higher education has a positive but insignificant
relationship to the economic growth of Sri Lanka. This raises questions on the efficacy of
Sri Lanka‘s tertiary education investment because Sri Lanka spends more on tertiary
education at the expense of primary and secondary schooling (Ganegodage & Rambaldi,
2011). Several studies have exposed the lower quality of education in primary schools
and a mismatch between the skills and the needs of the job market and the education
provided by secondary school system and the public universities (Aturupane, 2009;
Country Summary of Higher Education, 2007; Ganegodage & Rambaldi, 2011).
193
Another interesting aspect that has not been taken account of in the previous research
studies on FDI and human capital is the differences in compositions of the output of
tertiary education systems in different countries. For example, some countries produce
more scientists and engineers than other countries. These different compositions of the
output of tertiary education system might have major implications on the level of FDI
inflows as well as the type of FDI inflows that a country pursues. This neglected issue
may have been a reason for some studies to produce weak relationships between Human
capital and FDI inflows.
Interestingly, output composition of the Sri Lankan tertiary education system looks
extraneous. The percentage of students studying subjects such as Engineering,
Information and communication technologies, Medicine and Dental are very low while a
large percentage of students are studying Arts and Law subjects (Figure 6-2). This might
have major implications on the level of FDI inflows as well as the type of FDI inflows
that Sri Lanka can pursue. Although, Sri Lanka is highly praised for its educational
achievements, majority of FDI inflows to Sri Lanka has taken place in standard labour-
intensive manufacturing sectors, out of which majority has concentrated in the garment
industry (Athukorala, 2006). It might be the case that Sri Lanka does not have the
required level of technical graduates to attract higher value added FDI. It would be
intriguing to look at the output composition of tertiary education systems of other
countries, especially of the countries that have been successful in attracting higher
volumes of FDI and higher value added FDI. Although the contribution of higher
technical education on FDI is not investigated, there exist studies where contribution of
higher technical education on productivity growth is empirically investigated. In the
McMahon (1984)‘s study attempting to assess the effects of education on productivity
growth, when their measure of schooling is augmented with higher science and technical
education39
, then the higher science and technical education variable had a significant
positive effect on labour productivity growth.
39
Higher science and technical education is measured as the number of newly trained physical scientists,
social scientists, engineers, management personnel and agricultural specialists as a percentage of the labour
force.

194
Figure 6-2: Undergraduate admissions by Broad fields
Source: University Grant Commission Sri Lanka, 2010
It appears that Sri Lanka‘s quality of education is not as good as its quantitative
achievements in education. Therefore, in terms of quality of education, Sri Lanka may be
far behind the countries which are successful in attracting FDI inflows. Therefore, these
qualitative weaknesses in education are likely to have made Sri Lanka‘s high human
capital indicators infertile in attracting foreign investors.
Linguistic capabilities/limitations of human capital and FDI inflows
Liability of foreignness (Hymer, 1960) and the associated administrative and transaction
costs that MNCs must overcome when undertaking FDI in a host country can be better
overcome if the home and host country share common language. On the empirical side,
one observation in the FDI literature is the country-bias effects, i.e. FDI source countries
tend to invest more in host countries that use the same language. For example, much of
Chinese FDI inflows originate from East Asian countries with similar ethnic
backgrounds and countries which have large Chinese Diaspora (Wei & Wang, 2009);
Indian FDI inflows mainly come from English speaking countries (Aggarwal, 2008); and
some of the major recipients of Turkish FDI are newly independent Turkish speaking

195
Central Asian Republics (Demirbag, McGuinness, & Altay, 2010). Lundan & Jones
(2001) suggest that the widespread use of the English language, along with other
similarities within the Commonwealth, have lowered the cost of foreignness, and
thereby, increase the bilateral trade and investment among the Commonwealth members.
Adding to these, there is a tendency for MNCs to confine their early expansion to regions
within their language groups (Welch, Welch, & Marschan-Piekkari, 2001). In many
MNCs, staff in different countries are often required to operate in a common corporate
language (Harzing, Köster, & Magner, 2011; Selmier Ii & Oh, 2012; Welch & Welch,
2008), and therefore, language skills are an important consideration of MNC strategy.
Moreover, several empirical studies have shown that language distance between host and
home countries plays a major role in determining bilateral FDI flows (Konara & Wei,
2013b; Goldberg, Heinkel, & Levi, 2005; Hejazi & Ma, 2011; Oh, Travis Selmier, &
Lien, 2011).
Previous studies that have explored the relationship between human capital and FDI
inflows have not considered the importance of language. Most of these studies rely on
education enrolment rates and literacy rates. If language is important in determining FDI
inflows, then overlooking linguistic capabilities of human capital i.e. not considering the
language element of education enrolment rates and literacy rates may have been a reason
for these studies to produce weak relationships between Human capital and FDI inflows.
Providing support to this hypothesis, Konara & Wei (2013a) have shown that linguistic
capabilities of human capital are important in determining bilateral FDI flows.
Considering the relationships between language, human capital and FDI in a single
framework, they show that human capital is a positive determinant of FDI flows.
However, this positive effect of human capital diminishes when the host country
becomes linguistically distant from the home country. Sri Lanka‘s high human capital
indicators are largely based on vernacular languages, and therefore, Sri Lanka is likely to
be at a disadvantage when attracting FDI.
Under the British colonial rule, Sri Lanka had two types of schools for aged from 5 to 18:
higher status schools (fee levying) where the teaching was done in English medium and
lower status primary schools (free education) where teaching was done in local languages
(Punchi, 2001). Those who received education in vernacular languages were
marginalised as they were not proficient in English, and most government employment
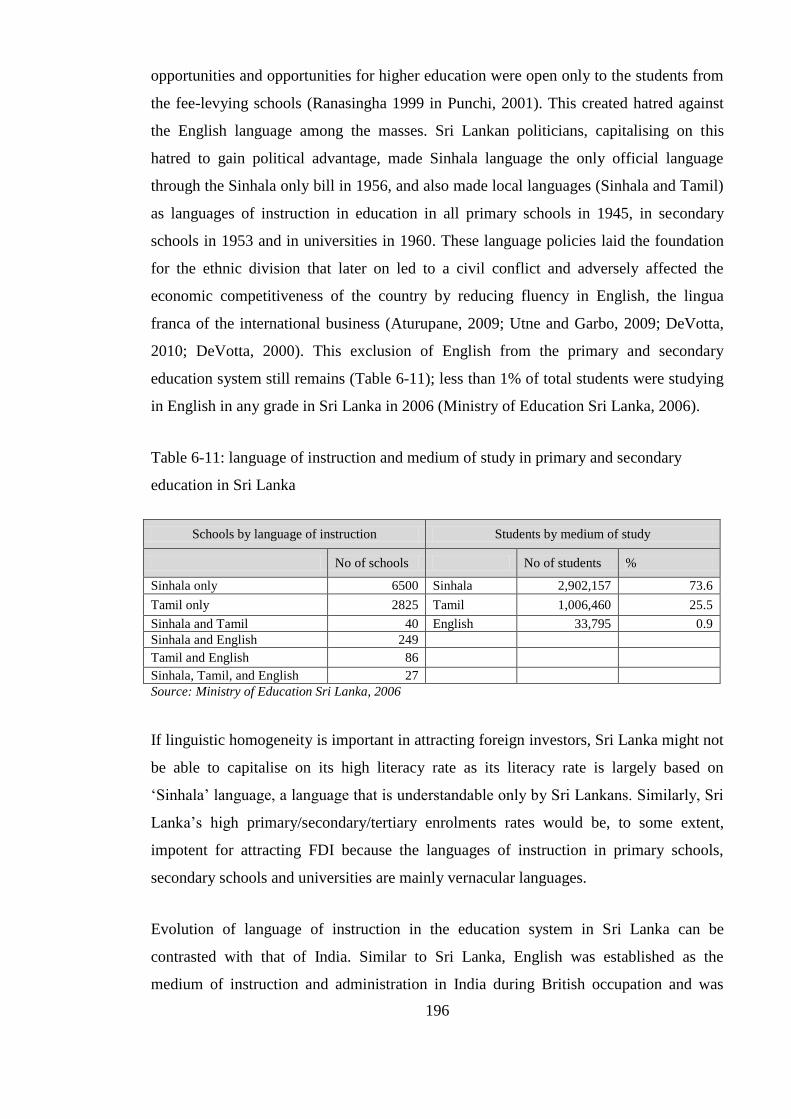
196
opportunities and opportunities for higher education were open only to the students from
the fee-levying schools (Ranasingha 1999 in Punchi, 2001). This created hatred against
the English language among the masses. Sri Lankan politicians, capitalising on this
hatred to gain political advantage, made Sinhala language the only official language
through the Sinhala only bill in 1956, and also made local languages (Sinhala and Tamil)
as languages of instruction in education in all primary schools in 1945, in secondary
schools in 1953 and in universities in 1960. These language policies laid the foundation
for the ethnic division that later on led to a civil conflict and adversely affected the
economic competitiveness of the country by reducing fluency in English, the lingua
franca of the international business (Aturupane, 2009; Utne and Garbo, 2009; DeVotta,
2010; DeVotta, 2000). This exclusion of English from the primary and secondary
education system still remains (Table 6-11); less than 1% of total students were studying
in English in any grade in Sri Lanka in 2006 (Ministry of Education Sri Lanka, 2006).
Table 6-11: language of instruction and medium of study in primary and secondary
education in Sri Lanka
Schools by language of instruction Students by medium of study
No of schools No of students %
Sinhala only 6500 Sinhala 2,902,157 73.6
Tamil only 2825 Tamil 1,006,460 25.5
Sinhala and Tamil 40 English 33,795 0.9
Sinhala and English 249
Tamil and English 86
Sinhala, Tamil, and English 27
Source: Ministry of Education Sri Lanka, 2006
If linguistic homogeneity is important in attracting foreign investors, Sri Lanka might not
be able to capitalise on its high literacy rate as its literacy rate is largely based on
‗Sinhala‘ language, a language that is understandable only by Sri Lankans. Similarly, Sri
Lanka‘s high primary/secondary/tertiary enrolments rates would be, to some extent,
impotent for attracting FDI because the languages of instruction in primary schools,
secondary schools and universities are mainly vernacular languages.
Evolution of language of instruction in the education system in Sri Lanka can be
contrasted with that of India. Similar to Sri Lanka, English was established as the
medium of instruction and administration in India during British occupation and was

197
replaced by Hindi after the independence due to nationalist movement that wanted an
indigenous Indian language to be adopted as the official language. Imposition of Hindi,
which is not evenly distributed throughout India, as the official language led to ethnic
conflicts as it was the case with Sri Lanka. However, in direct contrast to Sri Lanka,
central government of India made Hindi and English joint official languages in 1967
(Hohenthal, 2003). This change significantly increased English literacy in India,
particularly among speakers of languages linguistically distant to Hindi (Shastry, 2012).
Therefore, India‘s English literacy rate is far superior to that of Sri Lanka‘s. For this
reason, even though India‘s literacy rate and school enrolment rates are considerably low
compared to Sri Lanka, India‘s effective literacy rate and effective school enrolment rates
(effective in the sense applicable to international business) might be higher than that of
Sri Lanka‘s. Therefore, Sri Lanka‘s low level of English proficiency is likely to be a
major barrier for attracting FDI inflows.
Widespread education/literacy (lower GINI coefficient of education) and FDI
inflows
Sri Lanka enjoys a widespread literacy rate and its population enjoys relatively long
years of education. Literacy rates are evenly spread as it is depicted by a low GINI
coefficient (Figure 6-3). As a result of the deficiencies in the education system identified
previously, Sri Lanka might not possess a considerable proportion of highly skilled
labour or a rich endowment of human capital. Is it likely that such a high literacy rate and
a low GINI on education, though most admirable from a social and politico economic
point of view, might not be attractive to MNCs, especially those who seek high skilled
labour. Instead of widespread literacy, they may seek an oasis of highly educated skilled
labour as Sri Lanka is a largely service based economy. Contrastingly, India has a very
low level of average years of education and a very high GINI coefficient. Therefore,
while bulk of their population being illiterate, India might possess a small proportion of
highly skilled labour or a rich endowment of human capital. This might explain why
India, relative to Sri Lanka, has been successful in attracting large volumes of FDI in the
recent past, particularly in the services sector.
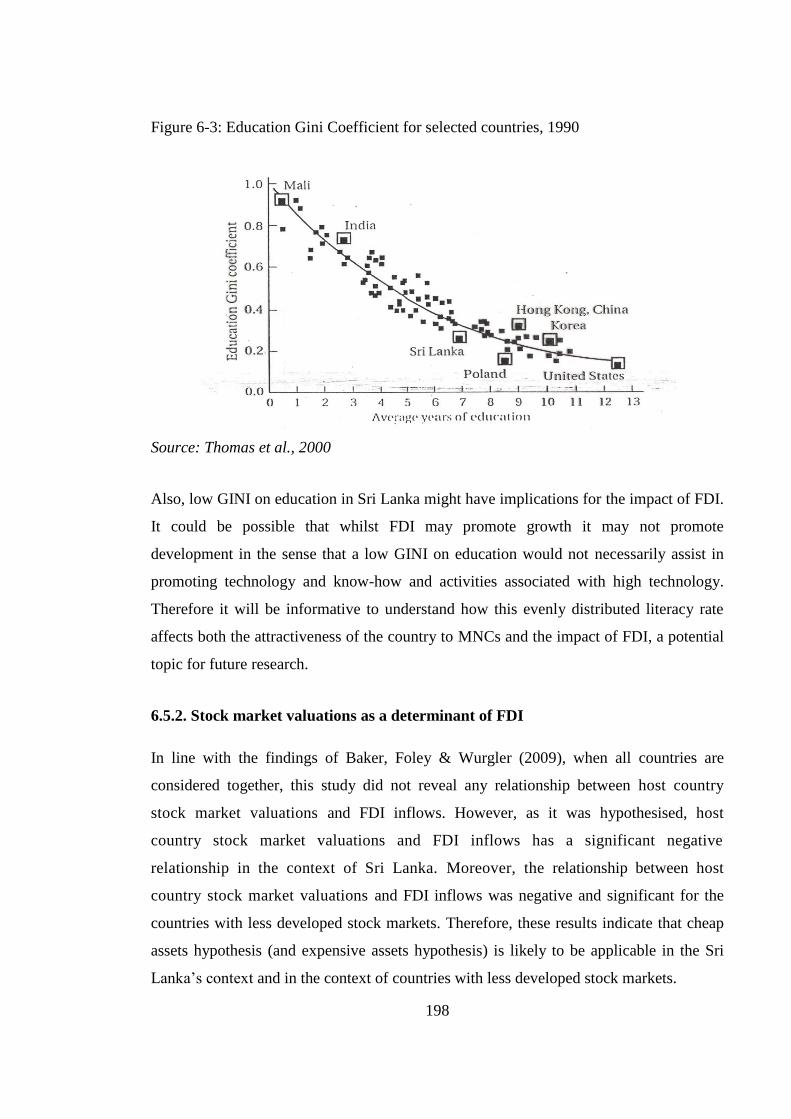
198
Figure 6-3: Education Gini Coefficient for selected countries, 1990
Source: Thomas et al., 2000
Also, low GINI on education in Sri Lanka might have implications for the impact of FDI.
It could be possible that whilst FDI may promote growth it may not promote
development in the sense that a low GINI on education would not necessarily assist in
promoting technology and know-how and activities associated with high technology.
Therefore it will be informative to understand how this evenly distributed literacy rate
affects both the attractiveness of the country to MNCs and the impact of FDI, a potential
topic for future research.
6.5.2. Stock market valuations as a determinant of FDI
In line with the findings of Baker, Foley & Wurgler (2009), when all countries are
considered together, this study did not reveal any relationship between host country
stock market valuations and FDI inflows. However, as it was hypothesised, host
country stock market valuations and FDI inflows has a significant negative
relationship in the context of Sri Lanka. Moreover, the relationship between host
country stock market valuations and FDI inflows was negative and significant for the
countries with less developed stock markets. Therefore, these results indicate that cheap
assets hypothesis (and expensive assets hypothesis) is likely to be applicable in the Sri
Lanka‘s context and in the context of countries with less developed stock markets.
199
Sri Lanka‘s recent performance in stock market and FDI provide evidence for cheap
assets hypothesis (and expensive assets hypothesis) in the context of FDI. This finding is
not only important to Sri Lanka, but also to other countries with underdeveloped stock
markets. As it was emphasised earlier, due to the distinctive characteristics of
underdeveloped stock markets, the degree of mispricing can be higher in developing
country stock markets and therefore, cheap asset hypothesis (and expensive asset
hypothesis) is likely to be more applicable to developing countries than developed
countries.
However, this finding is only based on a sample of nine countries, and therefore, it would
shed more light if we can use data on several countries with less developed stock
markets. However, this is practically difficult because of the difficulty of finding past
stock market valuation data on underdeveloped stock markets.
The above observations bring attention to another interesting question. Have these high
price levels in the stock market resulted in any foreign divestments, particularly through
the stock market? This should be the case because, during 2009-2011, CSE has
experience a net foreign outflow of US$ 412, a figure larger than 10% of total foreign
holdings of the CSE as at the end the end of year 2011. The magnitude of this figure
suggests that foreign stakes of some of the companies should have been considerably
decreased. However, a detail study on the extent of fall in foreign stake is not possible
due to data limitations.
6.5.3. Other FDI determinants
This study also provided a platform to verify other conventional FDI determinants as
they were used as control variables. Results of this study indicated that trade openness is
a significant positive determinant of FDI flows to selected countries.
This study provided evidence for positive association of good institutional factors and
FDI. Coefficients of both regulatory quality and political stability had the expected
positive sign and were significant. However, contrary to our expectations, control for
corruption had a negative coefficient but insignificant. Therefore, in line with some of
the previous empirical studies (Walsh & Yu, 2010), effect of corruption on FDI remained
largely inconclusive in our study. Countries in Asia and countries in South Asia in
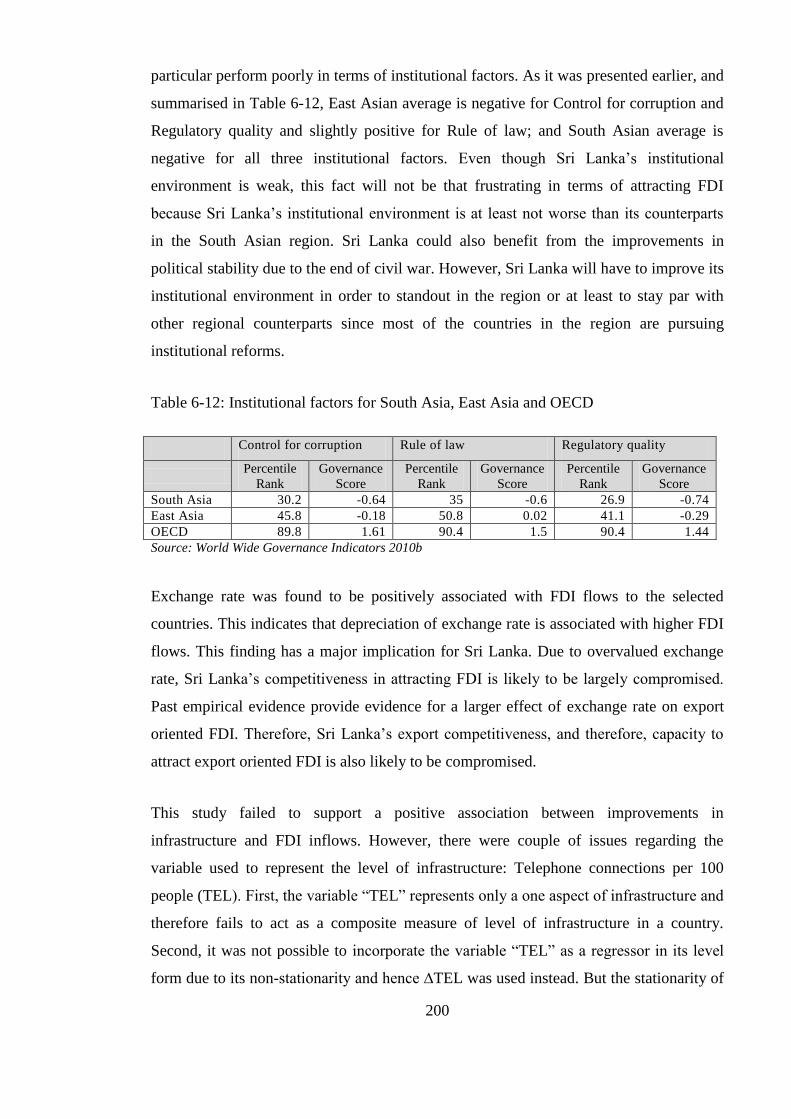
200
particular perform poorly in terms of institutional factors. As it was presented earlier, and
summarised in Table 6-12, East Asian average is negative for Control for corruption and
Regulatory quality and slightly positive for Rule of law; and South Asian average is
negative for all three institutional factors. Even though Sri Lanka‘s institutional
environment is weak, this fact will not be that frustrating in terms of attracting FDI
because Sri Lanka‘s institutional environment is at least not worse than its counterparts
in the South Asian region. Sri Lanka could also benefit from the improvements in
political stability due to the end of civil war. However, Sri Lanka will have to improve its
institutional environment in order to standout in the region or at least to stay par with
other regional counterparts since most of the countries in the region are pursuing
institutional reforms.
Table 6-12: Institutional factors for South Asia, East Asia and OECD
Control for corruption Rule of law Regulatory quality
Percentile
Rank
Governance
Score
Percentile
Rank
Governance
Score
Percentile
Rank
Governance
Score
South Asia 30.2 -0.64 35 -0.6 26.9 -0.74
East Asia 45.8 -0.18 50.8 0.02 41.1 -0.29
OECD 89.8 1.61 90.4 1.5 90.4 1.44
Source: World Wide Governance Indicators 2010b
Exchange rate was found to be positively associated with FDI flows to the selected
countries. This indicates that depreciation of exchange rate is associated with higher FDI
flows. This finding has a major implication for Sri Lanka. Due to overvalued exchange
rate, Sri Lanka‘s competitiveness in attracting FDI is likely to be largely compromised.
Past empirical evidence provide evidence for a larger effect of exchange rate on export
oriented FDI. Therefore, Sri Lanka‘s export competitiveness, and therefore, capacity to
attract export oriented FDI is also likely to be compromised.
This study failed to support a positive association between improvements in
infrastructure and FDI inflows. However, there were couple of issues regarding the
variable used to represent the level of infrastructure: Telephone connections per 100
people (TEL). First, the variable ―TEL‖ represents only a one aspect of infrastructure and
therefore fails to act as a composite measure of level of infrastructure in a country.
Second, it was not possible to incorporate the variable ―TEL‖ as a regressor in its level
form due to its non-stationarity and hence ∆TEL was used instead. But the stationarity of
201
∆TEL was not assuredly confirmed. Although this study is constrained from the above
mentioned limitations, results of this study combined with findings from previous
research studies point out that infrastructure is an important determinant of FDI.
Therefore, Sri Lanka‘s infrastructure deficits are likely to stifle FDI. As it was presented
earlier, Sri Lanka has severe infrastructure deficits in internal transport (road and
railroad) and power categories. These categories are likely to be more crucial for
manufacturing industries than services industries. Therefore, deficiencies in these
categories is likely to be a major reason for Sri Lanka to perform poorly in FDI in
manufacturing sectors compared to FDI in services. However, Sri Lanka‘s infrastructure
standards in telecommunication are irreprehensible. Infrastructure in telecommunication
is crucial for services, and this fact might have facilitated Sri Lanka‘s better performance
in FDI in services compared to FDI in manufacturing.
GDP growth rate was found to be insignificant as a determinant of FDI in the selected
countries in Asia. This might have been due to the larger proportion of vertical FDI in
FDI flows to the selected countries.
Although there are theoretical arguments favouring both complementary and substituting
relationships between local stock market development and FDI, arguments favouring a
complementary effect of stock market development on FDI inflows are much stronger.
Supporting this, results of this study indicate that the stock market development is
positively related to FDI inflows, and therefore, results of this study suggest that
complementary effect between stock market development and FDI inflows is
predominant over their substitute effect.

202
6.6 Concluding Remarks
This chapter examined the determinants of FDI by conducting a panel study based on
annual FDI inflows to a selected group of countries in Asia. It was evident that the
relationship between human capital and FDI flows was significantly negative for Sri
Lanka while, in general, human capital has been a positive determinant of FDI flows to
rest of the countries. Several reasons for this deviation were identified and examined in
this chapter. Therefore, it can be concluded that Sri Lanka‘s so called impressive human
capital indicators have not been able to augment FDI inflows possibly due to linguistic
limitations of the human capital and qualitative weaknesses in the education system.
Study also revealed a significant negative relationship between host country stock
market valuations and FDI inflows in the context of Sri Lanka, while not revealing
any relationship between host country stock market valuations and FDI inflows for rest
of the countries taken as a whole. When the sample is divided into two groups based
on the level of development on their stock markets, the effect of host country stock
market valuations on FDI inflows was negative for the countries with less developed
stock markets and was positive but insignificant for the other countries. Therefore,
these results indicate that cheap assets hypothesis and expensive assets hypothesis are
likely to be applicable in the Sri Lanka‘s context and in the context of countries with less
developed stock markets.
Finally, this study also confirmed the importance of trade openness, political stability,
regulatory quality and exchange rate for attracting FDI flows in the context of these
Asian countries.
203
Chapter 7 : FDI Spillover Effects: Evidence from Sri Lanka
7.1. Introduction
This chapter presents an empirical study conducted to examine the impact of FDI on firm
level productivity in the context of Sri Lanka. Using Sri Lanka 2011 Enterprise Survey
Data Set published by World Bank, this study examines the direct effects (own firm
effects of foreign owned firms) and spillover effects (effects of foreign owned firms on
other firms) of FDI on firm level labour productivity. This chapter is organised as
follows. Sections 7.2 provide a theoretical discussion on FDI and firm level productivity.
Section 7.3 provides a preliminary investigation of own firm effects of foreign firms.
Section 7.4 includes an empirical study focuses on estimating direct effects and spillover
effects of FDI on firm level labour productivity. Finally, section 7.5 concludes the
chapter by highlighting the conclusions and contribution of this study.
7.2. FDI and Firm Productivity
Theories of FDI demonstrate that foreign firms possess significant ownership advantages
over domestic firms, without which they would not be able to engage in FDI (United
Nations, 1992). This supposition leads to the inference that foreign firms are productive
than domestic firms. To put it differently, foreign firms that are not productive than
domestic firms cannot enter the host country due to entry costs (Moller, Markusen, &
Schjerning, 2007). Much of the foreign firms‘ higher productivity stems from their
advanced technological knowledge, improved marketing and management skills,
international contacts, and reputation (United Nations, 1992; Aitken & Harrison, 1999).
If foreign ownership leads to subsequent increase in productivity in the firm (own firm
effects), then such an increase is beneficial to the host country. However, foreign firms‘
superior productivity can also stem from the sample selection bias: It is believed that
MNCs tend to acquire or join up with local firms with higher than average productivity
(Vahter, 2004; Vahter & Masso, 2006).
Although most of the literature points to a positive own firm productivity effects, there
are few instances in the literature indicating the possibility of foreign firms to have lower
productivity than domestic firms (Vahter, 2004). Foreign owned firms may not be as
productive as domestic firms, particularly in the short run, due to liability of foreignness
204
and initial difficulties in assimilating the new venture into the MNC‘s network (Harris &
Robinson, 2003). Use of lower skilled workers and older technology due to MNCs
tendency to retain most of their higher value adding operations at home and locate lower
value-adding operations in the host country can also bring down foreign owned firms
productivity (Domes & Jensen, 1998).
Presence of foreign firms can also affect performance of domestic firms. Foreign firms‘
superior productivity can spillover to domestic firms, often in the form of technology
transfer (Hanousek, Kočenda, & Maurel, 2011). Such spillovers occur when MNC‘s
cannot completely internalise their ownership advantages due to public good
characteristics of firm specific assets (Vahter & Masso, 2006; Vahter, 2004). Literature
recognizes three main channels of productivity spillovers; demonstration effects, worker
turnover and competition effects (Blomström & Kokko, 1998; Havranek & Irsova, 2012;
Bwalya, 2006; Hanousek, Kočenda, & Maurel, 2011; Kugler, 2006). Under
demonstration effects, local firms can improve their productivity by observing and
adopting/imitating advance technologies, and managerial and organisational skills that
foreign firms possess. Through observing foreign firms, local firms can not only detect
existence of new/advance products and processes but also understand the benefits and
risks of adopting them; this will increase the chances of adopting/imitating these
technologies by local firms (Blomström & Kokko, 1998).
Local firms will also be exposed to foreign firms‘ expertise when local firms engage in
arm‘s length relationships with foreign firms, particularly in the form of upstream and
downstream relationships (Görg & Strobl, 2001). Additionally, foreign firms may provide
training and support, particularly in the form of technical assistance, to their suppliers
and customers, and this could benefit local firms in upstream and downstream sectors.
Foreign owned firms hire local employees and these employees will be exposed to
foreign firms‘ superior technologies. Moreover, foreign firms have a reputation for
training their staff (Aitken & Harrison, 1999; Blomström & Kokko, 1998). Spillovers
through worker turnover occur when these workers are subsequently hired by local firms
or when these employees start their own firms.
205
The competition effect can have both positive effects and negative effects on local firms.
Local firms may be forced to improve their efficiencies in order to compete with foreign
owned firms. The competition may also encourage local firms to innovate and find more
efficient technologies. Average productivity of local firms can also increase due to the
selection effect under which only the fittest firms will survive the foreign competition
(Kugler, 2006). Some industries are associated with high initial capital requirements,
advanced technology, and intensive advertising. Local firms may not have the necessary
capacity to enter/compete in such industries, particularly in less developed and/or small
countries, and this can lead to high concentration in such industries. Not only foreign
firms are likely to enter just those industries but they are also capable of
entering/competing in such industries due to their scale, resource and technological
superiorities. Therefore, foreign firms‘ entry into such monopolistic industries is likely to
increase the level of competition within such industries, and compel existing firms to
become more efficient (Blomström & Kokko, 1998). However, due to weaknesses of
local competition, MNCs could attain a higher degree of market dominance, which could
lead to higher concentration (Blomström & Kokko, 1998; Lall, 1978). Higher
competition can also adversely affect local firms‘ productivities. Increase competition
from foreign firms may compel local firms to operate in less-efficient scales of
production; when local firms lose market share amid competition by foreign firms, local
firms can experience lower productivities because their fixed costs are being spread over
a smaller output (Lipsey, 2004; Javorcik, 2004; Aitken & Harrison, 1999). This could
also hurt the technology progress of local firms because larger and profitable firms are in
a better position to undertake R&D and also to enjoy economies of scale in R&D
(Blomström & Kokko, 1998).
Spillovers of FDI are typically categorised into two types: horizontal and vertical
spillovers. Externalities of a foreign firm on the domestic firms in its own industry are
categorized as horizontal spillovers and externalities of a foreign firm on the firms in
upstream industries (backward spillovers) and downstream industries (forward
spillovers) are categorized as vertical spillovers (Hanousek, Kočenda, & Maurel, 2011;
Havranek & Irsova, 2012). There is a wide held expectation for vertical spillovers,
particularly backward spillovers, to be significant than horizontal spillovers (Kugler,
2006; Javorcik, 2004). The competition effects discussed above primarily take place
within industries rather than between industries (Kugler, 2006), and therefore they are
206
commonly associated with horizontal spillovers rather than vertical spillovers. Unlike
demonstration and worker turnover effects that are presumably positive, competition can
have both positive and negative externalities (Vahter, 2004). Moreover, MNCs may lose
competitiveness when their firm specific advantages are leaked to competitors, but
MNCs can benefit by transferring their knowledge to their suppliers. Therefore, MNCs
are encouraged to prevent spillovers to local firms in their own industry while
encouraged to facilitate spillovers to their local suppliers (Javorcik, 2004). Therefore,
vertical spillovers are more likely to be positive than horizontal spillovers. Forward
spillovers are also likely to exist because of MNCs‘ provision of product/service inputs
that are technologically more advanced, are less costly or previously did not exist
(Javorcik, 2004).
Empirical evidence, except handful of exceptions, provide strong evidence for positive
own firm effects of foreign ownership (Vahter, 2004; Lipsey, 2004; Chang, Chung, &
Moon, 2013). In most of the exceptions, some of which are included below, higher
productivity of foreign firms can be attributed to their larger size or higher capital
intensity (Lipsey, 2004). Controlling for differences in capital intensity, labor quality,
scale, and concentration, Blomström (1988), finds that foreign affiliates in Mexican
manufacturing industries are significantly more productive than local Mexican firms.
Looking at firms in manufacturing sectors in Hong Kong, Indonesia, Malaysia,
Singapore and Taiwan, Ramstetter (1999) finds that, except Malaysia, foreign firms in all
other countries have higher productivities than local firms. Using panel data on
Venezuelan plants between 1976 and 1989, Aitken & Harrison (1999) find that foreign
owned plants are more productive than domestic plants. However, this productive
advantage of foreign firms was robust only for smaller plants that employ less than 50
employees. Globerman, Ries, & Vertinsky (1994), comparing economic performance of
foreign-owned firm and local firms in Canada, found that although foreign owned firms
were relatively more productive in terms of value added per worker, this superior
productivity disappear when size and capital intensity are controlled for. Based on panel
data from Estonia for the period 1995–2002, Vahter & Masso (2006) shows that foreign
owned firms in Estonia have higher TFP than domestic firms. Recently, based on
Chinese firm level data, Chang, Chung, & Moon (2013) find superior performance
associated with foreign acquired local firms compared to comparable local firms,
207
particularly when foreign firms acquire local firms with higher absorptive capacity or
modernised ownership structure.
Although relatively few studies have looked at own firm effects of FDI, possibly because
authors have generally taken foreign owned firms‘ productivity superiority for granted,
plethora of studies have examined the productivity spillover of FDI on domestic firms,
and these studies have produced mixed results (Lipsey, 2004).
Blomström & Persson (1983) analysed spillovers of foreign firms on Mexican
manufacturing industries in 1970. Controlling for capital intensity, labour quality and
scale of production, they found that labour productivity in domestic owned plants are
positively associated with the extent of foreign owned plants in the industry. Kokko
(1994), analysing spillovers of foreign firms on domestic manufacturing industries in the
same country, found that, generally, presence of foreign firms increase labour
productivity of domestic firms. However, extent of spillovers differed across industries
and spillovers were less likely in industries where large technology gaps and high foreign
market shares coincide, which authors designated as industries with ―enclave‖
characteristics.
Using panel data on Venezuelan plants between 1976 and 1989, Aitken & Harrison
(1999) exposed that foreign owned plants has negatively affected the productivity of
domestic plants in Venezuela. However, own firm positive effects were slightly higher
than negative spillover effects of FDI, and therefore, the overall effect of FDI on
productivity in Venezuelan plants were marginally positive. Thereafter, trying to
replicate Aitken & Harrison (1999)‘s results for other countries, several studies found
insignificant or negative spillovers for Czech Republic, India, Lithuania, China, and
Mexico (Herzer, 2012, page 397).
Using Taiwanese firm-level data, Chuang & Lin (1999) found that FDI have positive
spillover effect on productivity of domestic firms. In contrast, they found weak evidence
for spillover effects on productivity of other foreign owned firms. Conducting a meta-
analysis of 32 empirical studies on technology spillovers from FDI in developing
countries, Wooster & Diebel (2010) shows that past empirical evidence, collectively,
provide weak support for the presence of horizontal spillovers in developing countries.
208
As is expected from theoretical considerations, between horizontal and vertical
spillovers, empirical findings favours for the existence of vertical spillovers, particularly
supporting vertical spillovers taking place through backward linkages. Using firm level
data from Lithuania for the period 1996-2000, Smarzynska (2002) provide evidence of
positive spillovers taking place through backward linkages but they do not find evidence
of horizontal spillovers. Havranek & Irsova (2012) conducted a meta-analysis of the
literature on horizontal and vertical spillovers40
. The average spillover estimates of their
sample were insignificant for horizontal spillovers, negligible for forward spillovers and
significant for backward spillovers. Based on firm-level data from Lithuania, Javorcik
(2004) finds evidence for presence of productivity spillovers taking place through
backward linkages while finding no evidence for the presence of horizontal spillovers or
spillovers taking place through forward linkages. Moreover, their results indicate that
spillovers are associated with partially owned foreign investments but not with fully
owned foreign investments.
A recent econometric study conducted by Jeon, Park, & Ghauri (2013) using Chinese
firm-level panel dataset provides some interesting findings. They investigate the extent of
horizontal and vertical spillover effects of foreign firms in different industries. With
respect to horizontal spillovers, they find mixed results (positive and negative spillovers)
associated with high and medium technology industries. However, they find consistent
negative spillovers associated with most of the low technology intensive industries. With
respect to vertical spillovers, they find positive spillovers associated with most of the
industries.
In sum, extant literature and empirical studies provides a strong support for the own firm
effects of foreign firms. Evidence on spillover effects of foreign firms on local firms is
mixed, particularly for horizontal spillovers. Moreover, past empirical evidence,
collectively, provide weak support for the presence of horizontal spillovers in developing
countries.
40
However, their sample included studies that focus on vertical spillovers, and therefore their sample is not
fully representative of studies on horizontal spillovers.
209
7.3. Data, Descriptive Statistics and Preliminary Investigation at Own
Firm Effects of Foreign Firms
Data used in this empirical study come from the Sri Lanka 2011 Enterprise Surveys Data
Set published by World Bank. This data set contains firm level data on 610 firms in both
manufacturing and services sectors41
. World Bank Enterprise Survey uses a uniform
sampling methodology and a common questionnaire for the participating countries. In the
Enterprise Survey, firms are randomly selected from the universe of registered
businesses42
based on a stratified random sampling with three levels of stratification:
industry, establishment size, and region. Thereafter, enumerators personally visit the
sampled firms and collect a range of quantitative and qualitative information through the
survey questionnaire.
Table 7-1 presents the breakdown of local and foreign firms in each sector and their share
of sales and workers in each sector. It can be seen that penetration of foreign investment
is low in most of the sectors. One salient limitation of this sample is that only a few
foreign firms are included in some sectors, particularly in Textile, Wearing Apparel and
Leather Products category. Available evidence shows that although the number of
foreign firms is low in this sector, they account for a larger share of output (Kelegama &
Foley, 1999).
41
Universe of this study is the non-agricultural economy, comprising all manufacturing sectors (group D),
construction sector (group F), services sector (groups G and H), and transport, storage, and
communications sector (group I) and IT (sub-sector 72 of group K). Group classification is based on ISIC
Revision 3.1. 42
Sample frame used for this survey is the database of firms obtained from the Department of Census and
Statistics of Sri Lanka.

210
Table 7-1: Local and foreign firms‘ share of activity in each sector
No of Firms Sales (%) Employment (%)
Sector Total
firms
Local
firms
Foreign
affiliates
Local
firms
Foreign
affiliates
Local
firms
Foreign
affiliates
Food, Beverages and Tobacco Products 130 124 6 82.1 17.9 85.8 14.2
Textile, Wearing Apparel and Leather Products 130 129 1 99.9 0.1 99 1
Wood and Wood Products 34 34 0 100 0 100 0
Paper Products, Publishing and Printing 6 5 1 9.5 90.5 41.4 58.6
Chemical, Petroleum, Coal, Rubber and Plastic Products 20 17 3 69.3 30.7 94.4 5.6
Non-metallic Mineral Products 30 28 2 94.2 5.8 80.1 19.9
Fabricated Metal Products, Machinery and Transport
Equipment 4 4 0 100 0 100 0
Manufactured Products (n.e.s) 2 2 0 100 0 100 0
Services 246 229 17 75.4 23.8 83.2 15.7
602 572 30
Source: Sri Lanka 2011 Enterprise Survey Data
Table 7-2 reports the descriptive statistics differentiated by foreign and domestic
ownership. Foreign firms are considerably larger than domestic firms in terms of both
sales and employment and enjoy a substantially higher productivity and profitability
relative to domestic firms. Foreign firms pay a higher nominal wage rate and employ a
higher percentage of educated employees compared to local firms. However, the
effective wage rate measured by skill adjusted wage rate is lower for foreign firms.
Therefore, even though foreign firms pay a higher wage rate, it is because they hire
higher proportion of skilled workforce. Put it differently, foreign firms does not pay a
higher wage rate for a given level of human capital. Capital intensity, measured as energy
consumption per employee43
, is considerably higher in foreign firms compared to local
firms.
43
Ideally, net assets per worker, which is the popular choice for representing capital intensity in previous
studies, would be a better proxy for capital intensity of a firm. Since majority of firms have not reported
their net assets value, energy consumption per worker is chosen to proxy the capital intensity. There is a
large literature indicating that capital and energy are complementary inputs in manufacturing (see
Globerman, Ries, & Vertinsky, 1994). This approach is used in several studies (for example, Lipsey &
Sjöholm, 2004a; Lipsey & Sjöholm, 2004b; Lipsey & Sjöholm, 2004c; Globerman, Ries, & Vertinsky,
1994). Energy consumption is taken as the total cost of fuel and electricity for the manufacturing sector and
cost of electricity for the services sector.
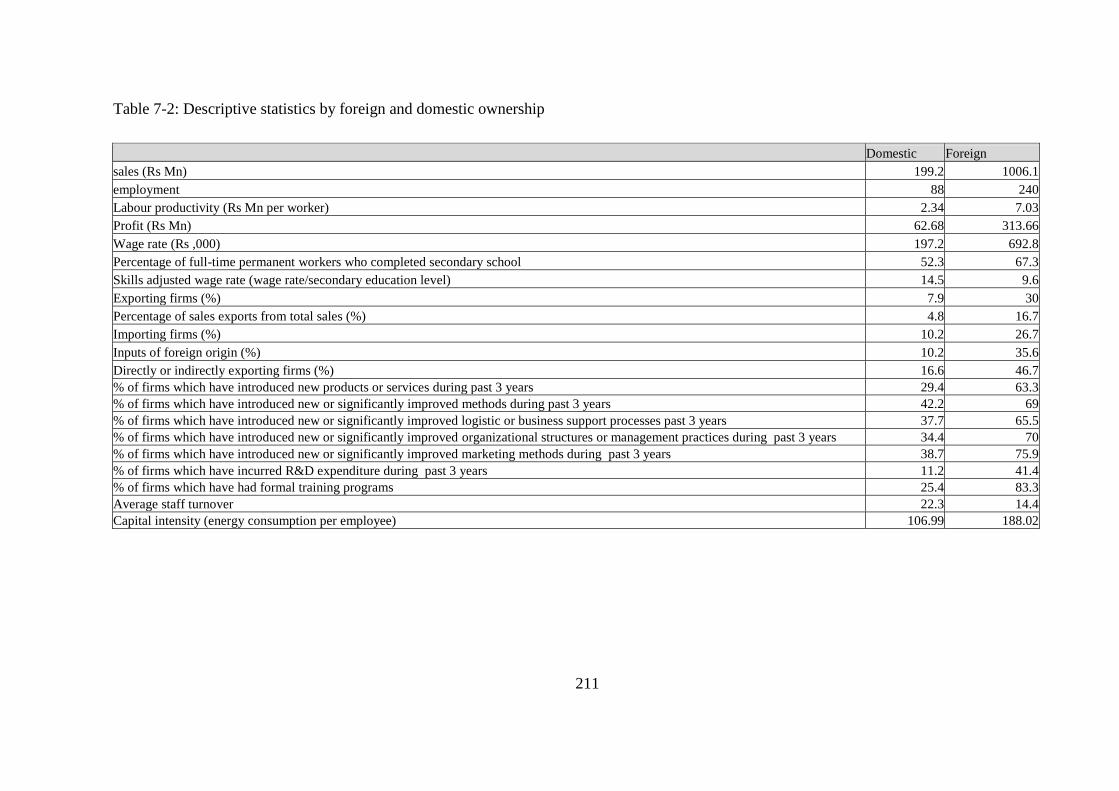
211
Table 7-2: Descriptive statistics by foreign and domestic ownership
Domestic Foreign
sales (Rs Mn) 199.2 1006.1
employment 88 240
Labour productivity (Rs Mn per worker) 2.34 7.03
Profit (Rs Mn) 62.68 313.66
Wage rate (Rs ,000) 197.2 692.8
Percentage of full-time permanent workers who completed secondary school 52.3 67.3
Skills adjusted wage rate (wage rate/secondary education level) 14.5 9.6
Exporting firms (%) 7.9 30
Percentage of sales exports from total sales (%) 4.8 16.7
Importing firms (%) 10.2 26.7
Inputs of foreign origin (%) 10.2 35.6
Directly or indirectly exporting firms (%) 16.6 46.7
% of firms which have introduced new products or services during past 3 years 29.4 63.3
% of firms which have introduced new or significantly improved methods during past 3 years 42.2 69
% of firms which have introduced new or significantly improved logistic or business support processes past 3 years 37.7 65.5
% of firms which have introduced new or significantly improved organizational structures or management practices during past 3 years 34.4 70
% of firms which have introduced new or significantly improved marketing methods during past 3 years 38.7 75.9
% of firms which have incurred R&D expenditure during past 3 years 11.2 41.4
% of firms which have had formal training programs 25.4 83.3
Average staff turnover 22.3 14.4
Capital intensity (energy consumption per employee) 106.99 188.02
212
Out of total foreign firms, 30% are engaged in exporting while only 7.9% of local firms
are engaged in exporting. On average, foreign firms‘ export intensity, measured as the
percentage of exports from total sales, is considerably higher than that of local firms.
Therefore, it seems foreign firms are more export oriented than local firms. Out of total
foreign firms, 26.7% are engaged in importing while only 10.2% of local firms are
engaged in importing. Foreign firms, on average, imports 35.6% of its inputs, while
domestic firms using only 10.2% of inputs of foreign origin. Therefore, it seems that
foreign firms are much more import oriented. Even when both direct and indirect
exporting are considered, foreign firms significantly outperform local firm; 47% of
foreign firms engaged in either exporting or indirectly exporting while only 16.6% of
local firms are engaged in either exporting or indirect exporting. Since foreign firms are
very active in both exporting and indirect exporting, it may be the case that foreign firm
are exporting via other foreign firms. This speculation coupled with higher import
propensity of foreign firms may suggest that foreign firms source larger proportion of
their inputs either from abroad or from foreign firms established in the host country.
However, this speculation cannot be confidently ascertained without observing the
dyadic sourcing relationships between sourcing and supplying firms.
Foreign firms tend to engage in research and development activities much more than
local counterparts; 41.4% of foreign firms have incurred research and development
expenditure during past three years compared to 11.2% of local firms. While only a
quarter of local firms have undertaken formal training programmes, more than 83% of
foreign firms have undertaken training programmes. Foreign firms experience much
lower staff turnover compared to domestic firms. Moreover, compared to domestic firms,
foreign firms display much higher propensity in introducing new products/services, new
or significantly improved methods, new or significantly improved logistic or business
support processes, new or significantly improved organisational structures or
management practices, and new or significantly improved marketing methods.
Table 7-2 shows that foreign firms are distinctive from domestic firms in each reported
characteristic. However, simple comparison of average of each characteristic for foreign
firms and domestic firms is not adequate. In order to check whether these differences are
significant Two-sample t test was employed and the results are reported in column one of
213
Table 7-3. Also, in order to account for sector specific differences, following model was
estimated for each characteristic:
Yi = β0 + β FDIi + Uj+ εi
Where Y is the each characteristic observed in Table 7-2 and FDI is a dummy variable
identifying whether or not a firm has FDI which adopts the value of 1 if the firm‘s
foreign ownership is more than 10% and zero otherwise. Uj is a vector of sector specific
dummies. Estimated regression coefficients of FDI (β) are reported in column two of
Table 7-344
.
Results presented in Table 7-3 show that compared to domestic firms, foreign firms are
larger, more productive and more profitable. They also tend to hire high proportion of
skilled workers and pay higher wages than their domestic counterparts. Furthermore,
foreign firms are more export oriented and rely more on inputs of foreign origin than
local firms. Foreign firms tend to be more active in R&D and undertake more in-house
training programmes than domestic counterparts. Foreign firms are much more
innovative than domestic firms; foreign firms display much higher propensity in
introducing new/improved products, services, methods, processes, management practice
and marketing methods. These results are largely consistent with empirical studies
conducted on other countries (Yasar & Paul, 2007; Chudnovsky, López, & Rossi, 2008;
Doms & Jensen, 1998) which have found similar superior characteristics associated with
foreign firms. Even though initial crude comparisons show that foreign firms have lower
skill adjusted wage rate, lower staff turnover and higher capital intensity, subsequent
analysis show that these differences are not statistically different from zero. Most
importantly, observed differences between foreign firms and local firms mostly persisted
when controlled for sector specific effects. However, it is important to highlight one
limitation of this methodology. Except for sector specific effects, I do not separately
account for other factors that might be relevant to explaining each type of characteristic
observed. For example, differences in labour productivity may be due to other factors
that can affect labour productivity such as capital intensity and skill intensity of the
workforce.
44
When the dependent variable is a binary variable, probit estimation was used instead of OLS.
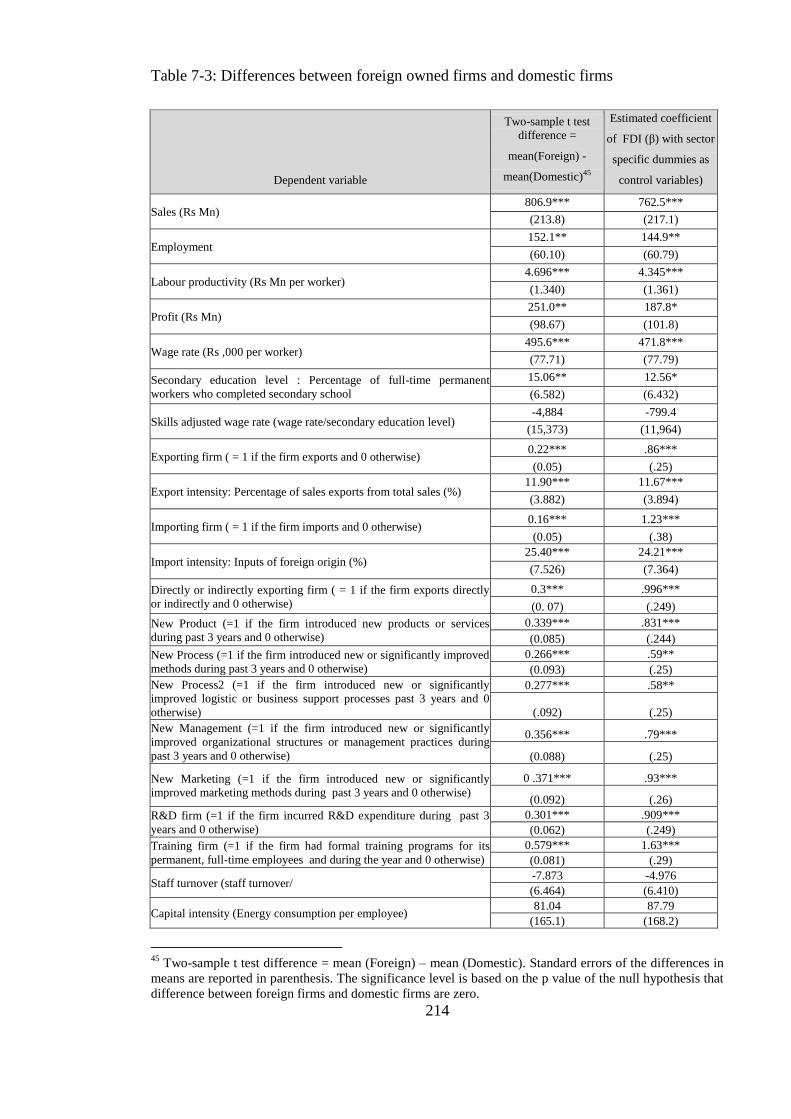
214
Table 7-3: Differences between foreign owned firms and domestic firms
Dependent variable
Two-sample t test
difference =
mean(Foreign) -
mean(Domestic)45
Estimated coefficient
of FDI (β) with sector
specific dummies as
control variables)
Sales (Rs Mn) 806.9*** 762.5***
(213.8) (217.1)
Employment 152.1** 144.9**
(60.10) (60.79)
Labour productivity (Rs Mn per worker) 4.696*** 4.345***
(1.340) (1.361)
Profit (Rs Mn) 251.0** 187.8*
(98.67) (101.8)
Wage rate (Rs ,000 per worker) 495.6*** 471.8***
(77.71) (77.79)
Secondary education level : Percentage of full-time permanent
workers who completed secondary school
15.06** 12.56*
(6.582) (6.432)
Skills adjusted wage rate (wage rate/secondary education level) -4,884 -799.4
(15,373) (11,964)
Exporting firm ( = 1 if the firm exports and 0 otherwise) 0.22*** .86***
(0.05) (.25)
Export intensity: Percentage of sales exports from total sales (%) 11.90*** 11.67***
(3.882) (3.894)
Importing firm ( = 1 if the firm imports and 0 otherwise) 0.16*** 1.23***
(0.05) (.38)
Import intensity: Inputs of foreign origin (%) 25.40*** 24.21***
(7.526) (7.364)
Directly or indirectly exporting firm ( = 1 if the firm exports directly
or indirectly and 0 otherwise)
0.3*** .996***
(0. 07) (.249)
New Product (=1 if the firm introduced new products or services
during past 3 years and 0 otherwise)
0.339*** .831***
(0.085) (.244)
New Process (=1 if the firm introduced new or significantly improved
methods during past 3 years and 0 otherwise)
0.266*** .59**
(0.093) (.25)
New Process2 (=1 if the firm introduced new or significantly
improved logistic or business support processes past 3 years and 0
otherwise)
0.277*** .58**
(.092) (.25)
New Management (=1 if the firm introduced new or significantly
improved organizational structures or management practices during
past 3 years and 0 otherwise)
0.356*** .79***
(0.088) (.25)
New Marketing (=1 if the firm introduced new or significantly
improved marketing methods during past 3 years and 0 otherwise)
0 .371*** .93***
(0.092) (.26)
R&D firm (=1 if the firm incurred R&D expenditure during past 3
years and 0 otherwise)
0.301*** .909***
(0.062) (.249)
Training firm (=1 if the firm had formal training programs for its
permanent, full-time employees and during the year and 0 otherwise)
0.579*** 1.63***
(0.081) (.29)
Staff turnover (staff turnover/ -7.873 -4.976
(6.464) (6.410)
Capital intensity (Energy consumption per employee) 81.04 87.79
(165.1) (168.2)
45
Two-sample t test difference = mean (Foreign) – mean (Domestic). Standard errors of the differences in
means are reported in parenthesis. The significance level is based on the p value of the null hypothesis that
difference between foreign firms and domestic firms are zero.
215
7.4. Direct and Indirect Effects of FDI on Firm Level Productivity: a
Cross Sectional Econometric Study
Direct and indirect effects of FDI on firm level productivity are usually estimated based
on the production function using econometric analysis regressing firm productivity,
either labour productivity or total factor productivity, on factors that can affect
productivity (Vahter, 2004; Hanousek, Kočenda, & Maurel, 2011). Among the
explanatory variables, a measure of foreign presence in the firm is included to assess the
direct effects and a measure of foreign presence in the sector in which the firm operates
is included to assess the indirect effects (Aitken & Harrison, 1999; Vahter, 2004). Along
these lines, this empirical study focuses on estimating direct effects of FDI on labour
productivity in foreign affiliates and spillover effects of FDI on labour productivity in
other firms46
.
This study investigates the spillover effects of foreign firms on other firms in the same
sector. The effect of foreign firms on downstream and upstream sectors could not be
investigated due to unavailability of recent input output table for Sri Lanka. However,
since this study uses a broad sectoral classification, i.e. a classification that is largely
based on two digit sectoral classification, some vertical relationships between 3-digit
level sectors or between more detailed level sectors will be included within each of the
two digit level sector (Vahter & Masso, 2006). Moreover, in the classification used in
this study, some of the two digit sectors are grouped into broader categories, and
therefore, even relationships between 2-digit level sectors are included within each
category. For example two digit sectors 17 to 19, i.e. Textiles (17), Garments (18) and
Leather (19) are considered as a one category, and therefore, vertical relationships among
these three categories are included within the considered category. Therefore, although
the measured spillover effects largely represent horizontal effects, they may capture a
considerable amount of the vertical effects within the categories considered in this study.
In line with previous literature on FDI spillovers, the following initial representation is
formulated:
46
Due to data limitations on input costs and capital employed, total factor productivity cannot be
accurately measured, and therefore, labour productivity was chosen as the measure of productivity for this
study.
216
LPi = β0 + β FDIi + βspillover FPj + βx Xi+ εi (7-1)
where LP is a measure of firm‘s labour productivity, FDI is a measure of foreign
presence at the firm level, FP is a measure of foreign presence in sectoral level and Xi is
a vector of control variables that explain labour productivity.
Non-random selection of FDI recipients is a major concern in estimating equation 7.1
(Vahter, 2004). It is commonly highlighted in the literature that foreign investors tend to
acquire stakes in domestic firms that have better performance or/and better
assets/capabilities (Smarzynska, 2002). Assuming foreign investor‘s entry decision is
dependent on certain characteristics of the firm, foreign investor‘s entry decision can be
represented by the following dichotomous choice model.
FDIi = 1 if FDI*i > 0
FDIi = 0 otherwise
Where FDI*i = α0 + α Wi + ei (7.2)
FDI*i is a latent variable measuring foreign investors‘ underline propensity to invest in
the firm which depends on firm characteristics and industry conditions that form the
vector Wi. FDIi is a dichotomous variable indicating whether the firm received FDI or
not, taking the value of one if the latent variable FDI*i is positive and taking the value of
zero otherwise. While the latent variable FDI*i is not directly measurable, the indicator
variable FDIi can be directly measured by observing whether the firm receives FDI or
not.
Disregarding the selection equation (equation 7.2) when the outcome equation (equation
7.1) is estimated can lead to bias estimates for direct effects (β) and spillover effects
(βspillover) due to following reasons. First, the relationship between FDI and firm
productivity can run in both ways; FDI may lead to higher labour productivity and firms
with higher labour productivity can attract FDI (Vahter, 2004). Many studies have
indicated the existence of this self selection bias (Vahter & Masso, 2006). If foreign
investors prefer domestic firms with higher labour productivity or be drawn towards
more productive industries, then firms with higher labour productivity or firms in high
productive sectors can be associated with higher foreign presence. Therefore, both β and
βspillover will be overestimated if multinationals are inclined to choose firms or industries
217
associated with higher labour productivity and this selection is not properly treated in the
estimation. Second, there can be unobserved factors that can affect labour productivity
that are not included in the vector Xi and unobservable factors that can affect foreign
investors preference to invest in a firm that are not included in the vector Wi. These
unobservable effects are captured in εi and ei, respectively. If εi and ei include same
unobservable effects, then εi and ei will be correlated (Shaver, 1998). For example, firm
specific intangible assets that are difficult to be measured can affect attractiveness of a
firm to foreign investors and can also contribute to higher labour productivity. Unless
such factors are measured and included in the vector Xi, εi and ei will be positively
correlated47
. It is reasonable to assume that unobservable factors that positively affect
labour productivity will improve the attractiveness of a firm to foreign investors.
Therefore, the two-stage Heckman selection model is used to account for this selection
issue. This treatment procedure involves two steps. First, the selection model (equation
7.2) is estimated using a probit estimation to obtain estimate of α and then inverse mills
ratio is computed for each observation. Thereafter, this ratio is included as an additional
regreessor in the outcome equation (equation 7.1) to control for possible selection bias
and obtain estimate for β and βspillover48
.
Guided by previous literature, outcome equation and selection equation is expanded by
including suitable explanatory variables in vector X and vector W, and the following
final representations are formulated:
Outcome equation:
LP = β0 + β1FDI + β2FDI*FP + β3DOM*FP + β4SIZE + β5SIZE2 + β6WAGE + β7TRADE + β5STATUS +
β6EC + β7RD + ε (7.1)
Selection equation:
FDIi = 1 if FDI*i > 0
FDIi = 1 otherwise
Where FDI*i = α0 + α1 L3.LP + α2 L3.SIZE + α3 EXP_FIRM + α4 SKILL + ei (7.2)
where LP is the firm‘s labour productivity. In this study, labour productivity is measured
as output per employee, which is the most common approach of measuring labour
47
Therefore, both β and βspillover will be overestimated 48
This procedure is referred as the Heckman selection model. See Heckman (1979) and Smarzynska
(2002) for further explanation on this procedure.
218
productivity. Alternatively, some studies use value added instead of output in calculating
labour productivity (Doms & Jensen, 1998). However, this measure cannot be used in
this study due to data limitations on input costs.
FDI is a dummy variable identifying whether or not a firm has FDI which adopts the
value of 1 if the firm‘s foreign ownership is more than 10% and zero otherwise. DOM is
the opposite of FDI, and takes the value of zero if the firm‘s foreign ownership is more
than 10% and one otherwise. Most common approach of measuring foreign presence in
the sector is to use the foreign firms‘ share of output in the sector, while some studies
have used foreign firms‘ share of employment and equity in the sector (Havranek &
Irsova, 2012; Yasar & Paul, 2007). Most cross sectional studies on productivity
spillovers use the same dataset to calculate the foreign firms‘ share of output in a sector49
and use this as a proxy for the degree of foreign presence in a sector (Havranek & Irsova,
2012). However, I couldn‘t rely on 2011 Enterprise Surveys Data Set to calculate foreign
presence variable (FP) because only few foreign firms are included in some sectors,
particularly in Textile, Wearing Apparel and Leather Products category, which is an
important sector for Sri Lanka (Table 7-1). As per this dataset, foreign share in this
category in terms of sales and employment is about 0.1% and 1%, respectively.
However, available evidence suggests that although large proportion of factories in the
Garment sector is owned by locals, foreign firms, which are considerably larger than
local firms, account for almost half of all garment export earnings (Kelegama & Foley,
1999). In order to rely on a foreign presence measure calculated based on sample data, it
is crucial for the sample to be representative in terms of MNC subsidiaries (Marin &
Bell, 2006). Also, since Sri Lanka is a small country, inclusion or exclusion of a one big
foreign firm can considerably change the average characteristics of firms and sectors
(Vahter, 2004). Due to these reasons, foreign penetration levels calculated based on this
data set is likely to be misleading. Therefore, in this study, degree of foreign presence
(FP) is represented by the cumulative realised FDI stock in each sector as at the end of
2010. Degree of foreign presence (FP) is interacted with both FDI and DOM dummies in
order to differentiate the spillover effects of foreign firms on domestic firms and on other
foreign firms. This approach is used in several previous studies: see for example,
(Smarzynska, 2002; Chudnovsky, López, & Rossi, 2008).
49
Some studies use the employment or equity share instead of sales share
219
Rest of the variables are control variables. Variable SIZE captures how large the firm is,
which categorises firm size into four levels, i.e. micro, small, medium and large, based
on the number of employees50
. SIZE2 is the square of SIZE. Economies of scale can
affect a firm‘s productivity positively, and therefore, size of a firm can have a positive
effect on productivity. However, relationship between size and productivity can be non-
linear; the effect of firm size on productivity can become negative above some optimum
size due to diseconomies of scale. Therefore, similar to previous studies (Ganotakis &
Love, 2012), both SIZE and SIZE2 is included as control variables.
WAGE is a proxy for the skill intensity of the firm‘s workforce and is represented by the
average wage rate per employee. Average wage rate is commonly used as a measure of
labour quality in productivity studies (Blomström, 1988). TRADE is a binary variable
representing whether the firm engages in international trade; TRADE adopts the value of
1 if the firm either export or import and zero otherwise. Firm‘s engagement in
international trade can have implications on its productivity. Technology transfer can
take place not only through FDI spillovers but also through spillovers from international
trade linkages (Smarzynska, 2002). These technology spillovers take place when firms
that export and import come into contact with new technologies via their imports and
import/export contacts. Firms that export will have to compete with world class practices
and therefore need to be more efficient. Firms that export may have a better opportunity
to achieve economies of scale and to better utilize internal capacity, which could lead to
increase in factor productivity (Makki & Somwaru, 2004). On the other hand, firms that
solely depend on domestic market may not be able to achieve optimum productive
efficiency because of the small market size of Sri Lanka.
STATUS is a binary variable that adopts the value of 1 if the firm is a shareholding
company and zero if the firm is a sole proprietorship or a partnership. Ownership
structure can have implications on firm productivity (Hill & Snell, 1989; Barth,
Gulbrandsen, & Schønea, 2005) and need to be controlled for. EC is a proxy for capital
intensity of a firm which is represented by the energy consumption per worker. As
capital available for each unit of labour (capital intensity) increases, labour productivity
increases (Hill & Snell, 1989), and therefore, it is a common practice in studies
50
A firm is a micro-firm if it has less than five employees, small if it employs between 5 and 19 workers,
medium if it has between 20 and 99 employees, and large firms if it employs more than 99 employees.

220
investigating labour productivity to control for capital intensity. RD is a binary variable
that identifies whether a firm is R&D active or not; RD adopts the value of one if the
firm has spent on formal research and development activities during the last three years
and zero otherwise. R&D activities contribute to the firm‘s existing stock of accumulated
knowledge and thus contribute to improvements in product/service quality and reduction
in production/operation cost of the firm, and thereby, improving the productivity of firms
(Wieser, 2005; Hill & Snell, 1989).
In line with previous studies (Vahter, 2004), four explanatory variables are included in
the selection equation: L3LP, L3SIZE, SKILL, and EXP_FIRM. Foreign firms are
inclined to invest in domestic firms that are more productive ex ante, which is commonly
referred in the literature as the cherry-picking phenomenon (Hanousek, Kočenda, &
Maurel, 2011). However, some previous studies tend to use the same variable that was
used as the dependent variable in the outcome equation as an explanatory variable in the
selection equation. For example, Vahter (2004), studying the effects of FDI on labour
productivity, uses the same labour productivity measure in both selection equation and
the outcome equation. This can create an endogeneity issue. Fortunately, ES
questionnaire includes two questions where respondent firms are asked for the amount of
sales generated and the number of workers employed in 2007/2008 (three fiscal years
before). Using these information, the variable L3LP, i.e. three year lagged labour
productivity, is constructed, and this measure is used in the selection equation, instead of
contemporaneous labour productivity. This approach can help to mitigate the above
mentioned endogeneity problem. Along similar considerations, instead of including the
variable SIZE in the selection equation, L3SIZE is included. L3SIZE is a categorical
variable constructed similar to SIZE variable, but based on the number of workers
employed in 2007/2008. SKILL is a variable capturing the percentage of full-time
permanent workers who completed secondary school, is used as a proxy for the skill
intensity of the firm‘s workforce. Many studies have shown that foreign firms can self-
select into firms with higher skill intensity (Doms & Jensen, 1998). EXP_FIRM is a
binary variable that identifies whether a firm exports or not and adopts the value of one if
the firm exports. Some studies point out that foreign firms can self-select into more
capital intensive firms or industries (For example, Doms & Jensen, 1998). Therefore,
energy consumption per worker (EC) was initially used in the selection equation. Since

221
coefficient of EC was insignificant and was not statistically different from zero, it was
dropped from the selection equation.
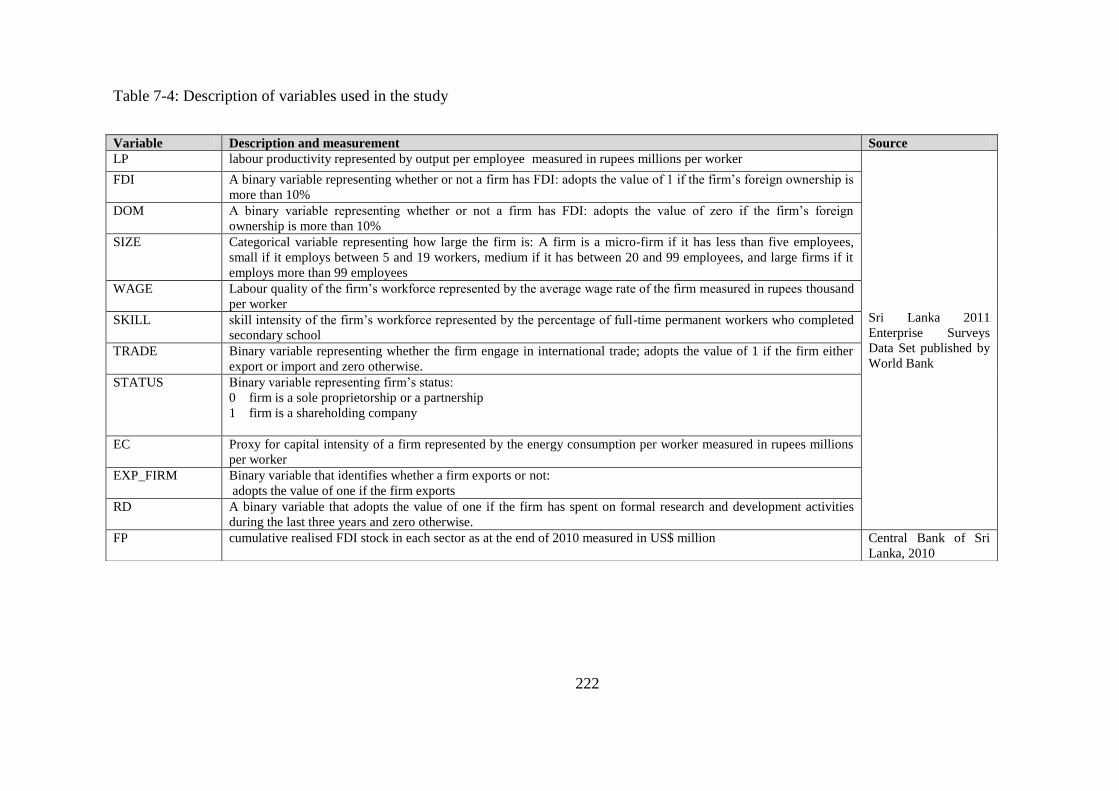
222
Table 7-4: Description of variables used in the study
Variable Description and measurement Source
LP labour productivity represented by output per employee measured in rupees millions per worker
Sri Lanka 2011
Enterprise Surveys
Data Set published by
World Bank
FDI A binary variable representing whether or not a firm has FDI: adopts the value of 1 if the firm‘s foreign ownership is
more than 10%
DOM A binary variable representing whether or not a firm has FDI: adopts the value of zero if the firm‘s foreign
ownership is more than 10%
SIZE Categorical variable representing how large the firm is: A firm is a micro-firm if it has less than five employees,
small if it employs between 5 and 19 workers, medium if it has between 20 and 99 employees, and large firms if it
employs more than 99 employees
WAGE Labour quality of the firm‘s workforce represented by the average wage rate of the firm measured in rupees thousand
per worker
SKILL skill intensity of the firm‘s workforce represented by the percentage of full-time permanent workers who completed
secondary school
TRADE Binary variable representing whether the firm engage in international trade; adopts the value of 1 if the firm either
export or import and zero otherwise.
STATUS Binary variable representing firm‘s status:
0 firm is a sole proprietorship or a partnership
1 firm is a shareholding company
EC Proxy for capital intensity of a firm represented by the energy consumption per worker measured in rupees millions
per worker
EXP_FIRM Binary variable that identifies whether a firm exports or not:
adopts the value of one if the firm exports
RD A binary variable that adopts the value of one if the firm has spent on formal research and development activities
during the last three years and zero otherwise.
FP cumulative realised FDI stock in each sector as at the end of 2010 measured in US$ million Central Bank of Sri
Lanka, 2010
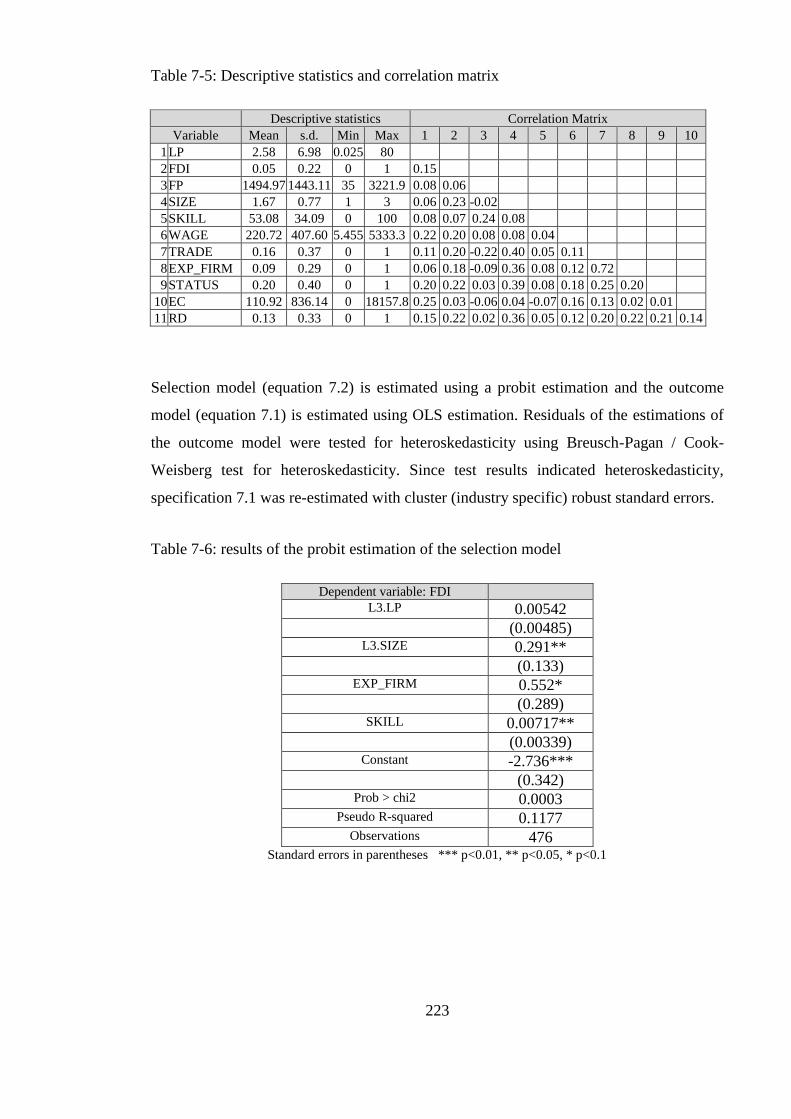
223
Table 7-5: Descriptive statistics and correlation matrix
Descriptive statistics Correlation Matrix
Variable Mean s.d. Min Max 1 2 3 4 5 6 7 8 9 10
1 LP 2.58 6.98 0.025 80
2 FDI 0.05 0.22 0 1 0.15
3 FP 1494.97 1443.11 35 3221.9 0.08 0.06
4 SIZE 1.67 0.77 1 3 0.06 0.23 -0.02
5 SKILL 53.08 34.09 0 100 0.08 0.07 0.24 0.08
6 WAGE 220.72 407.60 5.455 5333.3 0.22 0.20 0.08 0.08 0.04
7 TRADE 0.16 0.37 0 1 0.11 0.20 -0.22 0.40 0.05 0.11
8 EXP_FIRM 0.09 0.29 0 1 0.06 0.18 -0.09 0.36 0.08 0.12 0.72
9 STATUS 0.20 0.40 0 1 0.20 0.22 0.03 0.39 0.08 0.18 0.25 0.20
10 EC 110.92 836.14 0 18157.8 0.25 0.03 -0.06 0.04 -0.07 0.16 0.13 0.02 0.01
11 RD 0.13 0.33 0 1 0.15 0.22 0.02 0.36 0.05 0.12 0.20 0.22 0.21 0.14
Selection model (equation 7.2) is estimated using a probit estimation and the outcome
model (equation 7.1) is estimated using OLS estimation. Residuals of the estimations of
the outcome model were tested for heteroskedasticity using Breusch-Pagan / Cook-
Weisberg test for heteroskedasticity. Since test results indicated heteroskedasticity,
specification 7.1 was re-estimated with cluster (industry specific) robust standard errors.
Table 7-6: results of the probit estimation of the selection model
Dependent variable: FDI
L3.LP 0.00542 (0.00485)
L3.SIZE 0.291** (0.133)
EXP_FIRM 0.552* (0.289)
SKILL 0.00717** (0.00339)
Constant -2.736*** (0.342)
Prob > chi2 0.0003 Pseudo R-squared 0.1177
Observations 476 Standard errors in parentheses *** p<0.01, ** p<0.05, * p<0.1
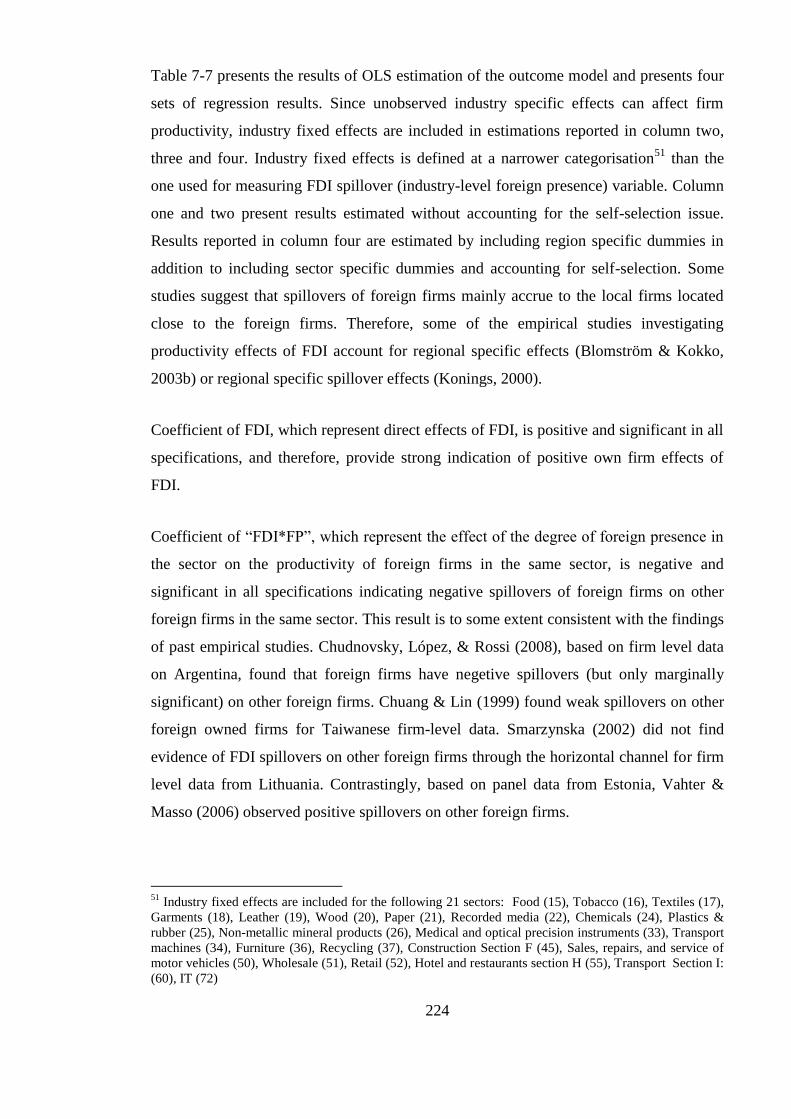
224
Table 7-7 presents the results of OLS estimation of the outcome model and presents four
sets of regression results. Since unobserved industry specific effects can affect firm
productivity, industry fixed effects are included in estimations reported in column two,
three and four. Industry fixed effects is defined at a narrower categorisation51
than the
one used for measuring FDI spillover (industry-level foreign presence) variable. Column
one and two present results estimated without accounting for the self-selection issue.
Results reported in column four are estimated by including region specific dummies in
addition to including sector specific dummies and accounting for self-selection. Some
studies suggest that spillovers of foreign firms mainly accrue to the local firms located
close to the foreign firms. Therefore, some of the empirical studies investigating
productivity effects of FDI account for regional specific effects (Blomström & Kokko,
2003b) or regional specific spillover effects (Konings, 2000).
Coefficient of FDI, which represent direct effects of FDI, is positive and significant in all
specifications, and therefore, provide strong indication of positive own firm effects of
FDI.
Coefficient of ―FDI*FP‖, which represent the effect of the degree of foreign presence in
the sector on the productivity of foreign firms in the same sector, is negative and
significant in all specifications indicating negative spillovers of foreign firms on other
foreign firms in the same sector. This result is to some extent consistent with the findings
of past empirical studies. Chudnovsky, López, & Rossi (2008), based on firm level data
on Argentina, found that foreign firms have negetive spillovers (but only marginally
significant) on other foreign firms. Chuang & Lin (1999) found weak spillovers on other
foreign owned firms for Taiwanese firm-level data. Smarzynska (2002) did not find
evidence of FDI spillovers on other foreign firms through the horizontal channel for firm
level data from Lithuania. Contrastingly, based on panel data from Estonia, Vahter &
Masso (2006) observed positive spillovers on other foreign firms.
51
Industry fixed effects are included for the following 21 sectors: Food (15), Tobacco (16), Textiles (17),
Garments (18), Leather (19), Wood (20), Paper (21), Recorded media (22), Chemicals (24), Plastics &
rubber (25), Non-metallic mineral products (26), Medical and optical precision instruments (33), Transport
machines (34), Furniture (36), Recycling (37), Construction Section F (45), Sales, repairs, and service of
motor vehicles (50), Wholesale (51), Retail (52), Hotel and restaurants section H (55), Transport Section I:
(60), IT (72)
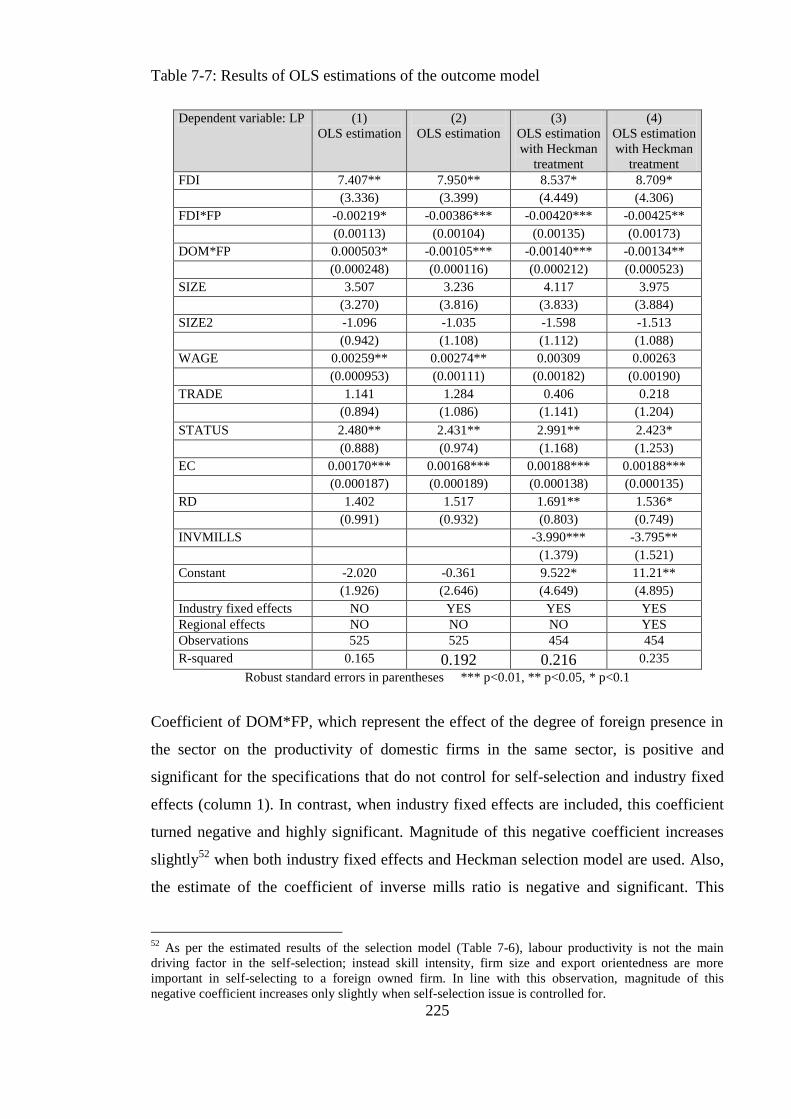
225
Table 7-7: Results of OLS estimations of the outcome model
Dependent variable: LP (1)
OLS estimation
(2)
OLS estimation
(3)
OLS estimation
with Heckman
treatment
(4)
OLS estimation
with Heckman
treatment
FDI 7.407** 7.950** 8.537* 8.709*
(3.336) (3.399) (4.449) (4.306)
FDI*FP -0.00219* -0.00386*** -0.00420*** -0.00425**
(0.00113) (0.00104) (0.00135) (0.00173)
DOM*FP 0.000503* -0.00105*** -0.00140*** -0.00134**
(0.000248) (0.000116) (0.000212) (0.000523)
SIZE 3.507 3.236 4.117 3.975
(3.270) (3.816) (3.833) (3.884)
SIZE2 -1.096 -1.035 -1.598 -1.513
(0.942) (1.108) (1.112) (1.088)
WAGE 0.00259** 0.00274** 0.00309 0.00263
(0.000953) (0.00111) (0.00182) (0.00190)
TRADE 1.141 1.284 0.406 0.218
(0.894) (1.086) (1.141) (1.204)
STATUS 2.480** 2.431** 2.991** 2.423*
(0.888) (0.974) (1.168) (1.253)
EC 0.00170*** 0.00168*** 0.00188*** 0.00188***
(0.000187) (0.000189) (0.000138) (0.000135)
RD 1.402 1.517 1.691** 1.536*
(0.991) (0.932) (0.803) (0.749)
INVMILLS -3.990*** -3.795**
(1.379) (1.521)
Constant -2.020 -0.361 9.522* 11.21**
(1.926) (2.646) (4.649) (4.895)
Industry fixed effects NO YES YES YES
Regional effects NO NO NO YES
Observations 525 525 454 454
R-squared 0.165 0.192 0.216 0.235
Robust standard errors in parentheses *** p<0.01, ** p<0.05, * p<0.1
Coefficient of DOM*FP, which represent the effect of the degree of foreign presence in
the sector on the productivity of domestic firms in the same sector, is positive and
significant for the specifications that do not control for self-selection and industry fixed
effects (column 1). In contrast, when industry fixed effects are included, this coefficient
turned negative and highly significant. Magnitude of this negative coefficient increases
slightly52
when both industry fixed effects and Heckman selection model are used. Also,
the estimate of the coefficient of inverse mills ratio is negative and significant. This
52
As per the estimated results of the selection model (Table 7-6), labour productivity is not the main
driving factor in the self-selection; instead skill intensity, firm size and export orientedness are more
important in self-selecting to a foreign owned firm. In line with this observation, magnitude of this
negative coefficient increases only slightly when self-selection issue is controlled for.

226
implies that self-selection is prevalent and highlights the importance of correcting for the
selection bias. Previous studies, for example, (Aitken & Harrison, 1999; Marin & Bell,
2006) have warned that when FDI takes place in highly productive sectors, there can be a
positive association between the degree of foreign presence in the sector and the
productivity of domestic firms in the same sector. In line with these studies, results of
this study reiterate the importance of controlling for industry specific effects and
addressing the self-selection issue. In sum, results of the estimations indicate foreign
firms have a negative spillover effect on domestic firms‘ productivity.
As expected, coefficient of SIZE is positive and the coefficient of SIZE2 is negative in
all specifications, however they are not significant at a 10% significance level. This
provides some evidence for the non-linear relationship between firm size and
productivity. Coefficient estimate of WAGE is positive and significant in some
specifications. This indicates the importance of firm level labour quality on firm level
labour productivity. As expected, coefficient estimate of TRADE is positive in all
specifications but not significant at a 10% significance level. The coefficient of EC,
which represents the effect of capital intensity of the firm on firm productivity, is
positive as expected and is highly significant in all specifications. In all specifications,
coefficient estimate of STATUS is positive as expected and significant. This indicates
that shareholding companies are more productive than sole proprietorships or
partnerships. Coefficient of RD is positive and significant in some specifications,
indicating the importance of R&D investment for higher labour productivity.
Results remain qualitatively similar when regional dummies are introduced. Most of the
coefficient estimates do not change in term of magnitude and significance. This is not
surprising because Sri Lanka is a relatively small country53
. Therefore, it would be
acceptable to ignore regional spillovers and consider entire Sri Lanka as one market for
this study.
Some of the recent studies on productivity spillovers have emphasised the importance of
accounting for the non-normal distribution of the labour productivity of the firms in the
sample (Dimelis & Louri, 2002; Girma & Görg, 2007). If the labour productivity of the
firms in the sample is not normally distribute, which is usually the case because there is
53
Konings (2000) found insignificant regional spillovers for Bulgaria, which is a small open economy.
227
large and persistent heterogeneity in labour productivity across firms even within
narrowly defines sectors (Girma & Görg, 2007), then OLS estimations of the coefficients
might not be representative of the entire firm distribution. Formal testing for normality
using Shapiro-Wilk normality test and Shapiro-Francia normality test leads to a rejection
of the null hypothesis of normality of the labour productivity distribution. Since OLS
regressions estimate the means of labour productivity conditional on the covariates for
the whole sample, quantile regression technique was employed in order to examine
whether there are any notable differences in labour productivity dynamics in different
quantiles of the distribution.
Table 7-8 reports the regression estimates for five different quantiles of the labour
productivity distribution. Results largely remain intact except for few minor differences
in some quantiles. Coefficient of FDI, which represent direct effects of FDI, remains
positive for all quantiles except for the 10th
quantile where the coefficient estimate is
negative but insignificant. This is not surprising because foreign firms might not have a
superior advantage in productivity in sectors associated with very low productivity. Also,
foreign firms‘ participation is likely to be lower in sectors associated with lower
productivity and this could make the coefficient estimate inefficient due to smaller
number of foreign firms in the sector. Compared to other quantiles, coefficient estimate
of FDI for the 90th
quantile is very large and highly significant. This shows that foreign
firms enjoy a very high labour productivity relative to domestic firms in the upper end of
the labour productivity distribution.
Coefficient of ―FDI*FP‖, which represent the effect of the degree of foreign presence in
the sector on the productivity of foreign firms in the same sector, remains negative for all
quantiles except for the 75th
quantile where the coefficient estimate is positive but
insignificant.
In line with OLS estimations, coefficient of DOM*FP, which represent the Spillover
effect of foreign firms on the domestic firms in the same sector, is negative in all quantile
estimations. However, interestingly, this negative coefficient estimate is significant in
median and higher quantiles but insignificant in lower quantiles. This clearly indicate
that negative spillovers are stronger in higher productivity quantiles.
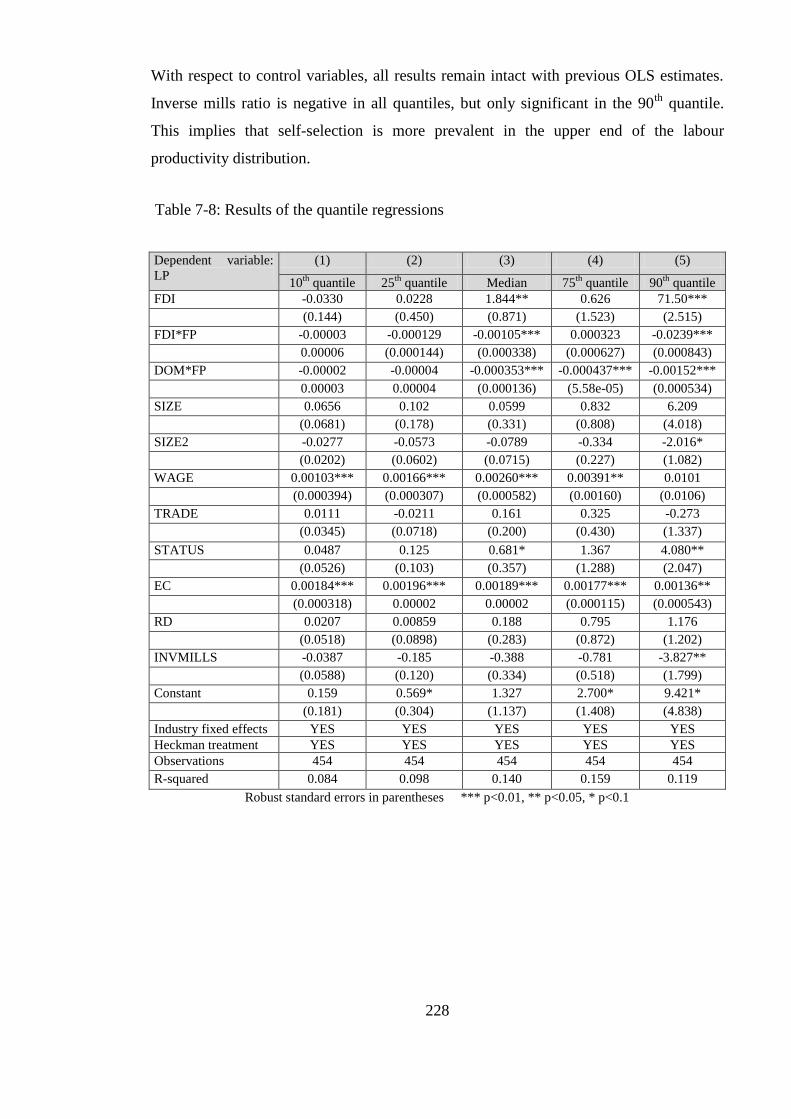
228
With respect to control variables, all results remain intact with previous OLS estimates.
Inverse mills ratio is negative in all quantiles, but only significant in the 90th
quantile.
This implies that self-selection is more prevalent in the upper end of the labour
productivity distribution.
Table 7-8: Results of the quantile regressions
Dependent variable:
LP
(1) (2) (3) (4) (5)
10th
quantile 25th
quantile Median 75th
quantile 90th
quantile
FDI -0.0330 0.0228 1.844** 0.626 71.50***
(0.144) (0.450) (0.871) (1.523) (2.515)
FDI*FP -0.00003 -0.000129 -0.00105*** 0.000323 -0.0239***
0.00006 (0.000144) (0.000338) (0.000627) (0.000843)
DOM*FP -0.00002 -0.00004 -0.000353*** -0.000437*** -0.00152***
0.00003 0.00004 (0.000136) (5.58e-05) (0.000534)
SIZE 0.0656 0.102 0.0599 0.832 6.209
(0.0681) (0.178) (0.331) (0.808) (4.018)
SIZE2 -0.0277 -0.0573 -0.0789 -0.334 -2.016*
(0.0202) (0.0602) (0.0715) (0.227) (1.082)
WAGE 0.00103*** 0.00166*** 0.00260*** 0.00391** 0.0101
(0.000394) (0.000307) (0.000582) (0.00160) (0.0106)
TRADE 0.0111 -0.0211 0.161 0.325 -0.273
(0.0345) (0.0718) (0.200) (0.430) (1.337)
STATUS 0.0487 0.125 0.681* 1.367 4.080**
(0.0526) (0.103) (0.357) (1.288) (2.047)
EC 0.00184*** 0.00196*** 0.00189*** 0.00177*** 0.00136**
(0.000318) 0.00002 0.00002 (0.000115) (0.000543)
RD 0.0207 0.00859 0.188 0.795 1.176
(0.0518) (0.0898) (0.283) (0.872) (1.202)
INVMILLS -0.0387 -0.185 -0.388 -0.781 -3.827**
(0.0588) (0.120) (0.334) (0.518) (1.799)
Constant 0.159 0.569* 1.327 2.700* 9.421*
(0.181) (0.304) (1.137) (1.408) (4.838)
Industry fixed effects YES YES YES YES YES
Heckman treatment YES YES YES YES YES
Observations 454 454 454 454 454
R-squared 0.084 0.098 0.140 0.159 0.119
Robust standard errors in parentheses *** p<0.01, ** p<0.05, * p<0.1
229
7.5. Concluding Remarks
FDI is considered as a major channel in facilitating international transfers of resources,
technology, management know-how, products and services from a home country to a
host country (Bang Nam & Se Young, 2004). It is expected that presence of foreign firms
in host economies to generate positive impact on the efficiency of investment within the
host country through own firm effects and spillover effects of foreign firms. However,
there are growing concerns of possible negative effects of FDI on the host country (Bang
Nam & Se Young, 2004). Aggravating these doubts, empirical studies examining
productivity spillovers of foreign firms have produced mix results, sometimes results
varying according to the sample (country) and methodology. This study examines the
direct effects and indirect effects of foreign firms on firm level labour productivity. To
the best of my knowledge, this is the first empirical study that attempt to shed some light
on the impact of FDI on firm level labour productivity, in the context of Sri Lanka.
In line with previous empirical studies conducted on other countries (Yasar & Paul,
2007; Chudnovsky, López, & Rossi, 2008; Doms & Jensen, 1998), comparison of
foreign and local firms in Sri Lanka revealed that foreign firms are quite distinctive from
local firms. Compared to domestic firms, foreign firms are larger, more productive and
more profitable. Foreign firms also tend to hire high proportion of skilled workers, pay
higher wages and undertake more in-house training programmes. They are more active in
R&D and more innovative. They are more export oriented but rely more on inputs of
foreign origin.
Results of the econometric study provided a strong indication of positive own firm
effects of FDI. This is in line with the majority of previous empirical evidence (Yasar &
Paul, 2007; Chudnovsky, López, & Rossi, 2008; Doms & Jensen, 1998; Lipsey, 2004).
As per the results of the econometric study, foreign firms have a negative Spillover effect
on local firms‘ productivity. Given the Sri Lankan context, this might not be surprising
due to several reasons. First, literature on productivity spillovers recognise that the extent
of spillovers will depend on the degree to which foreign affiliates are technologically
active in the host country (Marin & Bell, 2006; Deborah, 2013). Analysis of chapter four
demonstrates that FDI in Sri Lanka has primarily taken place in sectors with low
technical intensity. Therefore, potential for technology spillovers will be very limited.
230
Second, the extent of spillovers will also depend on the degree to which foreign affiliates
expose their technologies (technology leakage) to local firms (Marin & Bell, 2006).
Available evidence shows that backward linkages to foreign firms are weak in ‗Textiles,
Wearing Apparel & Leather Products‘ category, a sector which has attracted the largest
proportion of foreign investments (Kelegama & Foley, 1999). Moreover, higher import
propensity of foreign firms (from the results of section 7.3) and higher import content of
the inputs to ‗Textiles, Wearing Apparel & Leather Products‘ category (Kelegama &
Foley, 1999), would limit the opportunities for domestic firms to develop. Also, as per
the descriptive statistics reported in Table 7-2 foreign firms experience much lower staff
turnover compared to domestic firms (However, two-sample t test showed that this
difference is not statistically different from zero). All these indicate that the extent to
which foreign affiliates expose their technologies is low, which could limit the extent of
positive spillovers.
Third, literature on productivity spillovers also recognise that the extent of spillovers will
depend on the level of absorptive capacity of the domestic firms (Marin & Bell, 2006).
Industrial structure in Sri Lanka is narrowly concentrated in a few sectors with little
participation in technical intensive sectors, which indicate that overall technical
knowledge of the firms are low. As per the descriptive statistics reported in Table 7-2 and
the results of econometric study reported in Table 7-7, foreign firms‘ average labour
productivity is significantly higher than local firms‘ labour productivity. This indicate the
technology gap between the local firm and foreign firm is quite large. Many studies have
shown that when the technological gap between foreign firms and local firms are
relatively large, then local firms are not technically proficient to absorb spillovers. Also,
section 6.5.1 demonstrates that, although Sri Lanka has very good human capital
indicators (secondary education levels and literacy), Sri Lanka produces only few
technical graduates. Several studies have exposed that there is a mismatch between the
skills and the needs of the job market and the education provided by secondary school
system and the public universities (Aturupane, 2009; Country Summary of Higher
Education, 2007; Ganegodage & Rambaldi, 2011). Descriptive statistics reported in
section 7.3 revealed that compared to foreign firms, only a smaller percentage of local
firms are undertaking R&D or in-house training programmes. All these factors indicate a
low absorptive capacity of local firms. Given this context, it appears that out of the three
potential spillover channels of demonstration effects, worker turnover and competition
231
effects; competition effects might be dominating over other two. Unlike demonstration
and worker turnover effects that are presumably positive, competition can have both
positive and negative externalities (Vahter, 2004). Increase competition from foreign
firms may compel local firms to operate in less-efficient scales of production; when local
firms lose market share amid competition by foreign firms, local firms can experience
lower productivities because their fixed costs are being spread over a smaller output
(Lipsey, 2004; Javorcik, 2004; Aitken & Harrison, 1999). This could also hurt the
technology progress of local firms because larger and profitable firms are in a better
position to undertake R&D and to enjoy economies of scale in R&D (Blomström &
Kokko, 1998). Therefore, it seems that negative competition effects are predominant over
other positive Spillover effects.
Sri Lanka‘s industry structure is concentrated in low technology intensive industries,
while FDI has also taken place in low technology intensive industries. It appears that this
absence of participation in medium and higher technical intensive sectors have largely
facilitated the negative spillovers. This argument is supported by a recent econometric
study conducted by Jeon, Park, & Ghauri (2013) based on Chinese firm-level data.
Estimating the extent of horizontal and vertical spillover effects for different industries,
they find consistent negative spillovers associated with most of the low technology
intensive industries while finding mix results (positive and negative spillovers)
associated with high and medium technology industries.
Results indicate that higher foreign presence in a sector has a negative Spillover effect on
other foreign firms in the same sector. This is likely to occur due to competition effects.
Higher foreign presence in a sector is likely to intensify the competition and compel the
foreign firms to operate in less efficient scales of production. In contrast, lower foreign
presence can allow few firms to enjoy monopolistic powers and economies of scale.
Findings of this study has important implications on the development of local firms. As
per the IDP theory, inward FDI plays a major role in upgrading local firms‘
competencies, which will enable the indigenous firms to later on undertake outward FDI
(Dunning, 1981; United Nations, 2006; Dunning, Kim, & Lin, 2001; Dunning, 2003).
Also, according to this theory, the development of a country is closely linked to its local
232
firms‘ capacity to build up/upgrade firm specific advantages. Therefore, presence of
negative spillovers could further retard the progress of Sri Lanka.
Results of this study are robust. First, the econometric model accounts for the non-
random selection of FDI recipients. Moreover, measures were taken to minimise the
endogeneity between dependent variable and explanatory variables. These results are
also robust to the inclusion of sectoral fixed effects and regional fixed effect. Finally,
results remains largely intact when quantile regression technique was used in order to
account for the non-normal distribution of the labour productivity of the firms in the
sample.

233
Chapter 8 : Conclusion
Sri Lanka has performed poorly in terms of attracting FDI. The country has resource and
location advantages and impressive human capital indicators but had suffered from
nearly three-decades of civil war, which ended in 2009. Systematic research on the
determinants of FDI and FDI productivity spillovers in the context of Sri Lanka is almost
non-existence. Only a handful of studies (Wijeweera & Mounter, 2008; Athukorala &
Jayasuriya, 2004; Athukorala, 2003; Athukorala, 1995) have looked at FDI in the context
of Sri Lanka. Motivated by this background, this thesis aims to conduct an in-depth
research on FDI in the context of Sri Lanka.
This thesis consists an initial literature review covering theories in FDI, determinants of
FDI and impact of FDI (Chapter 2), a context analysis of FDI in Sri Lanka (Chapters 3
and 4), and three empirical chapters (Chapter 5, 6 and 7). Chapter five investigates the
effect of war on FDI, giving particular attention to the differential impact of war on FDI
in different sectors, by employing time series econometrics (vector error correction
model) and panel data econometrics. Chapter six explores the determinants of FDI for a
sample of countries in Asia by employing panel data econometrics, giving special
attention to detach relationships specific to Sri Lanka from the relationships general to
rest of the countries. Chapter seven investigates the impact of FDI in the context of Sri
Lanka with the use of firm level data by estimating the impact of foreign firms on labour
productivity of both foreign and local firms.
This concluding chapter summarise the key empirical findings of this thesis and then
highlight the key contributions of this research study. Thereafter, it emphasises policy
implications of the research findings and finally discusses the limitations of this study
and suggests potential research topics that could extend this study further.
234
8.1. Research Findings
Key findings of this thesis can be summarised as follows. Results of the econometric
analysis in chapter five indicate that war has had been a major impediment in attracting
FDI into the manufacturing sectors in Sri Lanka. Although, war also had a negative
association with FDI into services, this was not statistically significant and the magnitude
of the effect was also smaller than that for manufacturing FDI. Results also points out
that war has a significant negative impact across almost all manufacturing industries,
while the magnitude of this negative impact varying over industries. Also, the effect of
war was greater in export intensive sectors compared to sectors that are host market
oriented.
Panel study based on FDI into selected countries in Asia indicates that countries that
have better human capital indicators attract more FDI; however, this was not the case
with Sri Lanka. It was evident that the relationship between human capital and FDI flows
was significantly negative for Sri Lanka, while, in general, human capital is a positive
determinant of FDI flows to rest of the countries in the sample of countries. Two main
reasons for this discrepancy were identified. First reason is the linguistic limitations of
Sri Lanka‘s so called impressive human capital indicators. Sri Lanka‘s ability to
capitalise on its high human capital indicators to attract FDI is largely limited because Sri
Lanka‘s literacy rates and school enrolment rates are based on ‗Sinhala‘ language, a
language that is understandable only by Sri Lankans. Second reason is that although Sri
Lanka‘s human capital indicators are quantitatively outstanding, there are widespread
concerns on the quality of education system in Sri Lanka. Government expenditure on
education is very low and Sri Lanka‘s education system is highly criticised for being
inefficient, and for having a low level of interaction between academic world and
industry. Moreover, limited access to tertiary education system and extraneous output
composition of the tertiary education system is likely to waste the harvest of the
secondary education system.
Another new finding of this thesis is the reported evidence supporting cheap asset
hypothesis (and expensive asset hypothesis) in the context of FDI. This study revealed a
significant negative relationship between host country stock market valuations and
FDI inflows in the context of Sri Lanka, while this relationship was not evident for

235
rest of the countries taken as a whole. Moreover, the effect of host country stock
market valuations on FDI inflows was negative for the countries with less developed
stock markets while there was no such relationship for the other countries. Therefore,
these results indicate that cheap asset hypothesis (and expensive asset hypothesis) is
likely to be applicable in the Sri Lanka‘s context and in the context of countries with less
developed stock markets.
In addition to war, human capital and price levels, this thesis also provided support for
several FDI determinants. Findings of this thesis confirmed the importance of trade
openness, political stability, regulatory quality and exchange rate for attracting FDI flows
in the context of Asian region.
Empirical study based on firm level data in chapter seven also produced several
important findings. A preliminary investigation on the nature of foreign invested firms
relative to domestic firms revealed that foreign firms are quite distinctive from local
firms. Compared to domestic firms, foreign firms are larger, more productive and more
profitable. Foreign firms also tend to hire high proportion of skilled workers, pay higher
wages and undertake more in-house training programmes. They are more active in R&D
and more innovative. They are more export oriented but rely more on inputs of foreign
origin. Finally, the cross sectional econometric study estimated the direct and indirect
effects of FDI on firm level labour productivity. Results indicated a positive own firm
effects of FDI and negative spillover effects of foreign firms on local firms and on other
foreign firms in the same sector.
236
8.2. Key Contribution
This thesis comprises a detailed and systematic investigation of determinants, impact and
policy issues relating to FDI in the context of Sri Lanka. Only a handful of studies
(Wijeweera & Mounter, 2008; Athukorala & Jayasuriya, 2004; Athukorala, 2003;
Athukorala, 1995) have looked at FDI in the context of Sri Lanka. The need for this
thesis is largely justified by this dearth in research studies on FDI in Sri Lanka.
Chapters three and four provide a detailed overview of FDI in Sri Lanka while also
providing a general discussion on the related geographical, political, social and economic
background of Sri Lanka. Out of the existing studies on FDI in Sri Lanka, chapters three
and four provide not only the most extensive overview but also the most recent one.
To the best of my knowledge, Wijeweera & Mounter (2008) is the only study that has
examined the determinants of FDI in the context of Sri Lanka. However, their study is a
short econometric study that uses vector autoregressive model (VAR) to regress FDI
against GDP, total trade, wage rate, exchange rate, and interest rate. Therefore, this thesis
is the first study that has undertaken a detailed and systematic investigation of
determinants of FDI while covering an exhaustive set of FDI determinants. Moreover,
this is the first study that estimates the impact of the civil war on FDI in Sri Lanka. In
addition to these, this thesis has identified various factors that can influence FDI inflows
at the country level and at the sector level in the context of Sri Lanka.
This research study is the first to compare and contrast foreign owned firms and local
firms in the context of Sri Lanka and also the first to assess the direct and indirect effects
of FDI on firm level productivity in the context of Sri Lanka. Therefore, this thesis
contributes immensely to the FDI literature in the context of Sri Lanka.
This thesis not only contributes to the FDI literature in the context of Sri Lanka, but also
makes several contributions to the general literature on FDI. Previous studies have major
limitations in explaining the effect of war on FDI. These limitations were highlighted in
chapter 5 in detail. Sri Lanka as a case study provided a unique opportunity to address
these limitations due to the presence of a nearly three decade long civil war, which has
gone through considerable variation in conflict intensity. Moreover, this is the first study
that investigates the impact of war, or of any dimension of political instability, on FDI in
237
different sectors; previous studies investigating the effects of political instability on FDI
flows have relied on country level FDI flows. Results of this study indicate that the effect
of war on FDI inflows can be different for different sectors, and highlights the
importance of using sectoraly disaggregated FDI data when determinants of FDI are
investigated.
This thesis also contributes to the literature on human capital and FDI. Although the
importance of human capital in attracting FDI is widely recognised in the literature,
existing empirical evidence is inconclusive, particularly for developing countries. It was
evident that the relationship between human capital and FDI flows was significantly
negative for Sri Lanka while, in general, human capital has been a positive determinant
of FDI flows to rest of the countries. Two main reasons for this discrepancy were
identified: linguistic limitations and qualitative limitations of human capital in Sri Lanka.
This finding highlights the importance of recognizing country specific limitations in
human capital in understanding the relationship between human capital and FDI.
This study also contributes to the literature on the relationship between asset prices and
FDI. Although theoretical considerations suspect lower asset prices in the host country to
augment FDI (cheap asset hypothesis), this supposition is not supported by previous
empirical studies. Extending the theoretical considerations further, it was comprehended
that degree of mispricing is high in less developed markets due to market inefficiency
and manipulation, and therefore, misprice driven FDI is a possibility in less developed
markets. Empirical analysis strongly supported this supposition. This is a new finding
that is in contrast with the extant empirical evidence. Therefore, this empirical finding
and the associated theoretical justification makes an important contribution to revive a
hypothesis that is disputed mainly because the hypothesis has been tested in the wrong
context.
Extant literature on FDI spillovers remains inconclusive and it is widely believed that
different methodologies and different country contexts contribute to these inconsistencies
in empirical findings. This fact justifies the need for further studies on FDI spillovers in
different country contexts. Therefore, this thesis contributes to the FDI spillover
literature by providing evidence from a country that has never been empirically
investigated in previous spillover literature. Also, as it is discussed in section 7.5, it
238
appears that existence of negative spillovers is closely related to the lower technology
intensity in the industrial structure and FDI. This context provides an opportunity to
understand conditions under which spillovers are (not) likely to materialise - a research
gap that is identified in the literature (Deborah, 2013).
This study also makes methodological contribution by employing more recent data and
applying statistically robust empirical methodologies in new applications. Except in the
study investigating impact of FDI on labour productivity, all other studies use the most
appropriate methodologies in both time series and panel data econometrics. For the study
investigating impact of FDI on labour productivity, cross sectional econometrics were
used due to unavailability of panel data. However, using responses received from
respondents about past data, several tactical measures were taken to minimise the
endogeneity and self selection bias, and thereby, largely minimising the well-known
limitations of using cross sectional econometrics. Varity of estimation techniques were
used in this thesis, for example, Ordinary Least Squares, Generalised Least Squares,
fixed/random effects models, vector error correction model, GMM, Heckman selection
model, and quantile regression technique, and most of these estimation techniques were
applied in unique settings.
239
8.3. Policy Implications
Research findings of this study have important policy implications for scholars,
practitioners and policymakers. First, research findings of this study have important
policy implications for the Sri Lankan government and various institutions governing
FDI and related areas. This study uses Sri Lanka as a case study but the policy
implications can be generalised to other host countries that share similar characteristics
with Sri Lanka. To this end, policy implications of this study can be particularly relevant
to other countries with small, open and peripheral economies. However, Sri Lanka‘s
unique features, such as having impressive development indicators while having weak
growth indicators, could to a certain extent, limit the generalisability of the policy
implications of this study to other host countries. Findings of this study also provide
important insights to investing countries and multinational firms.
Results of this study show that the effect of war on FDI flows can be different for
different sectors. It was observed that war has had a greater impact on FDI in
manufacturing than FDI in services. Also its effect was greater in export intensive sectors
compared to sectors that are host market oriented. Therefore, it is necessary to design
sector specific FDI policies in order to revamp FDI in these affected industries. A
possible strategy could be to provide carefully designed incentives to foreign investors in
order to lure them into these affected industries. Service sector has attracted the majority
of the FDI flows, and FDI flows to manufacturing sectors is concentrated in few sectors,
mainly in industries that are associated with low technical intensity. Furthermore,
analysis in chapter three and four shows that, not only FDI, but also exports and the
overall economy are narrowly concentrated with little participation in technical intensive
sectors. Therefore, one of the main agendas of the government should be to formulate
appropriate strategic policies to diversify FDI flows, particularly to industries with high
technical intensity. Given Sri Lanka‘s low technical maturity, diversifying FDI flows
could be the best method to achieve economic and export diversifications. Findings of
this study would also inform foreign investors, particularly assisting decision making of
potential foreign investors who are considering investing in Sri Lanka or in a conflict
zone.
240
This study strongly emphasize that different factors have different levels of effect on FDI
inflows to different sectors. This has important implications for designing FDI policy
framework in order to achieve the desired sectoral distribution of FDI in a host country.
Although Sri Lanka is touted as a country with impressive human capital indicators, it
was revealed that Sri Lanka has not been able to capitalise on its quantitative
achievements in human capital to attract FDI. Two main limitations that undermine Sri
Lanka‘s human capital base were identified: linguistic limitations of its human capital
and issues with quality of education. Countries such as Sri Lanka that rely primarily on
vernacular languages might not be able to capitalise on their human capital to attract FDI
unless they improve the linguistic capabilities of their human capital. In other words,
having an educated workforce is necessary but not a sufficient condition to attract FDI;
they should also give due attention to improve the linguistic capabilities of their human
capital. One possible solution to mitigate this issue could be to train their workforce in a
most widely spoken lingua franca in international business. For example, for a country
like Sri Lanka, acquisition of English language proficiency can improve prospects of
attracting FDI from English speaking countries. Therefore, it is important to draft
suitable policies to improve linguistic capabilities of human capital. Improving the
literacy in English, which is the lingua franca in international business, should be a high
priority if the government intend to engage in international business. To this end,
government should reintroduce English as a medium of instruction in schools and
strengthen the English teaching infrastructure in schools. Also, following countries such
as India and Singapore, Sri Lanka should seriously consider re-introducing English as an
official language. These changes could not only help in attracting more FDI to the
country but also increase its integration with global markets. Equipping Sri Lanka‘s
large human capital base with linguistic capabilities in a lingua franca will improve the
competitiveness of Sri Lanka in the international terrain and enable Sri Lanka to achieve
its true potential. However, present nationalistic sentiments and policies that promote
linguistic nationalism are likely to further deteriorate the ability of its human capital to
engage in international business.
Sri Lanka‘s experience demonstrates the importance of the language competency of
human capital for attracting FDI inflows. This can also have many implications for other
host countries, investing countries and multinationals. Policy implications of this study
241
are equally valid for other countries that largely use their own vernacular languages.
Countries in which only vernacular languages are spoken or countries that are
linguistically distant from major FDI source countries are likely to be at a disadvantage
in attracting FDI. Also, such countries may not be able to capitalise on their human
capital to attract FDI unless they improve the linguistic capabilities of their human
capital. Findings of this study would also inform MNEs and investing countries about the
importance of language for undertaking FDI in a host country. MNEs could benefit by
improving their own language skills within the firms; MNEs with wider linguistic
capabilities can afford to be more flexible when their locational choices are made.
Sri Lankan policymakers should also concentrate on overhauling the current education
system in order to improve the quality of education. Since Sri Lanka‘s education system
is state managed, Sri Lanka needs to increase its government expenditure at least to a
level in par with countries that have the same level of development. Alternatively, more
private participation in the education system could be encouraged. Efficiency and
effectiveness of the public education system should be improved giving particular
attention to linking the education system to academic world and industry requirements.
Finally, the tertiary education system should be revamped by increasing the output of
technical graduates rather than producing excessive number of unemployable graduates
that have studied arts and law.
Empirical results of chapter six suggest that, in the context of Asia, exchange rate
depreciation in the host country positively affect FDI inflows. This finding has a major
implication for Sri Lanka. It‘s quite extraordinary that being a developing country, Sri
Lanka‘s real exchange rate has appreciated relative to most of the countries in Asia, even
against the developed countries in Asia. Sri Lanka‘s central bank‘s interventions to
maintain a fixed peg arrangement with the US$ and large foreign borrowing may have
largely caused this overvaluation. Such an overvalued exchange rate is likely to have
devastating impact on FDI and also on exports and thereby on export oriented FDI.
Therefore, overvalued exchange rate largely compromise Sri Lanka‘s competitiveness in
attracting FDI. However, in February 2012, central bank of Sri Lanka has limited its
intervention and allowed some flexibility in the determination of exchange rate, and as a
242
result, exchange rate depreciated significantly after that54
. It is important for Sri Lanka to
maintain a reasonably competitive exchange rate in order to promote exports and attract
more FDI into the country.
Research findings of chapter seven indicate that foreign firms have superior
characteristics that can benefit Sri Lanka. Econometric analysis also provided a strong
indication of positive own firm effects of FDI. However, results of the econometric
analysis indicate that foreign firms can have a negative spillover effect on productivity of
local firms in the same sector. These findings have several implications. First, since
foreign firms have superior characteristics that can benefit Sri Lanka, Sri Lanka should
be gravely concerned on the poor penetration of foreign firms in most of the sectors. Sri
Lanka should revisit its policies and encourage more FDI into the country, particularly
into the sectors that are associated with high technology intensities. Although, this study
shows that FDI could contribute positive own firm effects and negative spillover effects,
it cannot provide assured judgement on the net effect of FDI. Although this initiative
provides a much needed first step in this direction, due to limitations in the data used in
this study, it would be important to validate and extend these findings by employing
better data. However, limitation on data availability makes this difficult, at least for now,
but improving data availability in future, possibly by carrying out more comprehensive
surveys that collect firm level time series data could benefit immensely to ascertain firm
level benefits of FDI.
Sri Lanka‘s low national savings rate has led to a negative savings investment gap. In the
past, this gap has been largely funded through foreign borrowing, which has led to a
deteriorating external debt situation. Compared to foreign borrowing, FDI is a far better
alternative for funding Sri Lanka‘s inherent savings investments gap. FDI can contribute
to the host country capital formation directly and could also have an indirect crowding in
effect on domestic capital formation (Agosin & Mayer, 2000; Bosworth, Collins, &
Reinhart, 1999; Konings, 2000; Borensztein, De Gregorio, & Lee, 1998). Moreover,
reliance on excessive borrowing can increase external vulnerability, particularly if it is
financed by short term instruments such as bond investments. Therefore, Sri Lankan
government should be less reliant on external borrowings by focusing its attention on
attracting FDI.
54
During 2012 exchange rate depreciated about 10%
243
Lack of comprehensive data on FDI projects and scarcity of research studies on FDI in
Sri Lanka makes proper policy making difficult. Developed countries and even some
developing countries have organisations that collect and disseminate FDI related data and
these organisations play an active role in carrying out research on FDI. Board of
investment in Sri Lanka is the only organisation associated with FDI and it makes a very
limited contribution to these activities. Therefore, it is recommended that Sri Lanka
should either create suitable organisations or strengthen BOI to carry out these tasks.
Analysis of chapter three and four demonstrates that Sri Lanka has done a poor job in
terms of progressing along the investment development path. It can be comprehended
that Sri Lanka is still in stage one of the investment development path (IDP) with little
participation in technology intensive sectors. As per the IDP theory, inward FDI plays a
major role in upgrading local firms‘ competencies, which will enable the indigenous
firms to later on undertake outward FDI (Dunning, 1981; United Nations, 2006;
Dunning, Kim, & Lin, 2001; Dunning, 2003). Domestic firms build and upgrade their
firm specific advantages mainly through the spillovers arising from foreign firms and
competing with foreign firms. Sri Lanka‘s mediocre performance in attracting FDI, poor
performance in attracting FDI into technology intensive sectors, and absence of positive
spillovers from foreign firms to local firms may all have resulted in poor performance of
local firms in terms of upgrading their firm specific capabilities. The goal of the national
FDI policies are twofold. First a country should attract the right type of FDI. Second, the
country should devise appropriate policies to extract benefits from it. It appears that Sri
Lanka has performed poorly in both of these aspects, and this has in turn, deprived the
country the much needed skills and technologies, and decelerated the development of the
country.
244
8.4. Research Limitations and Future Research
Although this study extends the literature on FDI in Sri Lanka and also the literature on
FDI in general, there are a few limitations largely arising due to limited resources that
were available for this study, particularly because of poor data availability. One limitation
of the empirical study on the effect of war on FDI was the reliance on country specific
explanatory variables in absence of an exhaustive set of sector specific explanatory
variables. Except sector specific growth variable and industry dummies, all other
explanatory variables were country specific. An exhaustive set of sector specific
explanatory variables could not be included because of the unavailability of sector
specific information. Another limitation associated with the time series study is the
reliance on a limited number of observations. Number of observations were 33 for the
total FDI and 29 for the FDI in manufacturing and FDI in services. This could to some
extent undermine the reliability and generalizability of the results of the time series
study.
Panel data econometrics is usually considered superior to cross sectional econometrics.
However, unavailability of panel data constrained me to use cross sectional data for
assessing impact of FDI on firm level labour productivity. Although several tactical
measures were taken to minimise the well-known limitations of using cross sectional
econometrics, availability of panel data in future could help us to improve our
understanding on this subject in the context of Sri Lanka. Also, recent studies on
productivity spillovers use input-output tables to estimate vertical spillovers arising from
forward and backward linkages. In future, if input-output tables are made available for
Sri Lanka, then this could potentially be useful in estimating vertical spillovers of FDI in
the context of Sri Lanka.
Sri Lanka‘s unique features, such as having impressive development indicators while
having weak growth indicators, were helpful to extend the literature on FDI by providing
unique perspectives. However, these unique features could also limit the generalisability
of the findings to other host countries. Therefore, it is important to test the findings of
this thesis in other country settings, and if possible, to explore the propositions put
forwarded in this study in the context of larger set of countries with the use of large
cross-country datasets.
245
It is also important to analyse the post war FDI performance to understand how investors
react after the end of a long period of conflict. It would also be interesting to assess the
Phoenix effect, in which war devastated countries are expected to bounce back to high
levels of growth and development rapidly. At the time of writing this thesis, only three
years of post war data was available, and therefore, it is too early to explore any post war
effects. Another related extension of this research could be to understand different home
country experiences during war and post war periods. Some home countries, particularly
countries associated with conflict, may be more comfortable investing in conflict zones
than others. Therefore it would be interesting to analyze the effect of war on bilateral FDI
flows to understand different home country experiences during war and post war periods.
Another interesting potential future research theme is to analyze the effect of war on
foreign direct divestments. As it was noted earlier, extent of foreign direct divestment
that has occurred during the period of war is alarming. Moreover, our empirical analysis
indicated that the effect of war on net FDI flows is much larger than its effect on gross
FDI flows, probably indicating that war has resulted in divestments. Have these
divestment lowered the social rate of return to investment much more than the
elimination of the private rates of return to the firms that have divested? Future research
could attempt to answer these questions.
Contrast to previous findings, research findings of this thesis show that lower asset prices
in the host country can augment FDI and vice versa in the context of less developed stock
markets in which the degree of mispricing is high due to market inefficiency and higher
degree of manipulation. However, this finding is based on data for handful of countries.
This study could be extended to include large set of countries. However, this extension
would require time series P/E ratios for large number of less developed markets, which is
currently difficult to find because of lack of data for less developed markets. Future
studies could attempt to construct a different proxy for market price levels for
underdeveloped markets probably by using index movements or aggregating firm level
valuations.
This study carried out a preliminary investigation on how the regional context in which
Sri Lanka operates can affect FDI inflows. It appears that regional integration within the
South Asian region has yet failed to generate any tangible benefits to Sri Lanka, in
246
general, and in terms of boosting FDI flows. Given its geographical proximity to India -
Sri Lanka lies 31 kilometers (19 miles) south east of India - that has emerged as a leading
economy with growth rates of around 8% per annum; it is interesting to find out whether
Sri Lanka can benefit from closer ties with India? Can FDI from India forge these ties
given that the two countries share many attributes? Sri Lanka could largely benefit from
its proximity to India, just as Hong Kong profits from being a trade hub to China. It
would be important to find out whether Sri Lanka can benefit, particularly in terms of
attracting FDI, through high degree of regional integration.
Finally, this thesis relies completely on secondary data. There are couple of advantages
of using secondary data. Secondary data usually comes from reliable sources, and data
collection is often guided by experts, and therefore, such data is more reliable. Use of
secondary data is often more economical and less time consuming compared to using
primary data. However, secondary data is collected for a different purpose and therefore
may not contain all required information to answer all desired research questions. These
data limitations were highlighted in previous chapters and in this concluding chapter.
Future researchers can address these limitations by designing and collecting their own
data. Also, future research could also employ more qualitative research methodologies to
validate the findings of this study. For example, it would be informative to know how the
end of war has affected the mind set of foreign investors.
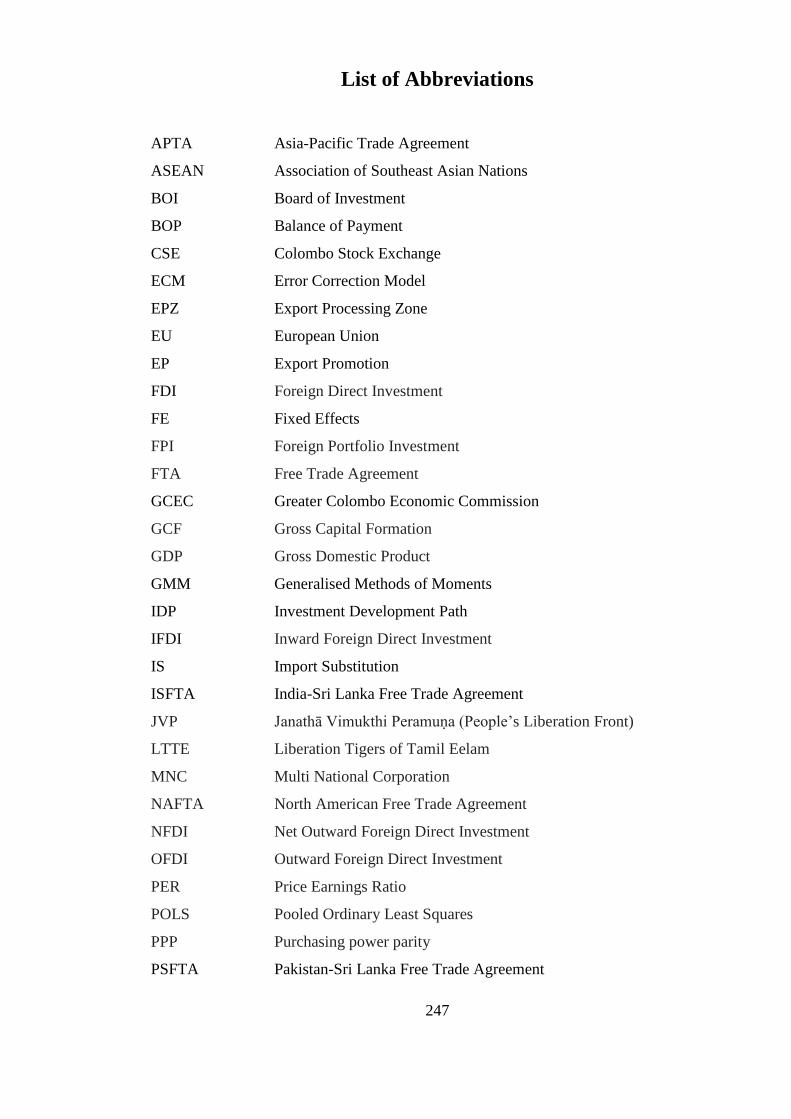
247
List of Abbreviations
APTA Asia-Pacific Trade Agreement
ASEAN Association of Southeast Asian Nations
BOI Board of Investment
BOP Balance of Payment
CSE Colombo Stock Exchange
ECM Error Correction Model
EPZ Export Processing Zone
EU European Union
EP Export Promotion
FDI Foreign Direct Investment
FE Fixed Effects
FPI Foreign Portfolio Investment
FTA Free Trade Agreement
GCEC Greater Colombo Economic Commission
GCF Gross Capital Formation
GDP Gross Domestic Product
GMM Generalised Methods of Moments
IDP Investment Development Path
IFDI Inward Foreign Direct Investment
IS Import Substitution
ISFTA India-Sri Lanka Free Trade Agreement
JVP Janathā Vimukthi Peramuṇa (People‘s Liberation Front)
LTTE Liberation Tigers of Tamil Eelam
MNC Multi National Corporation
NAFTA North American Free Trade Agreement
NFDI Net Outward Foreign Direct Investment
OFDI Outward Foreign Direct Investment
PER Price Earnings Ratio
POLS Pooled Ordinary Least Squares
PPP Purchasing power parity
PSFTA Pakistan-Sri Lanka Free Trade Agreement
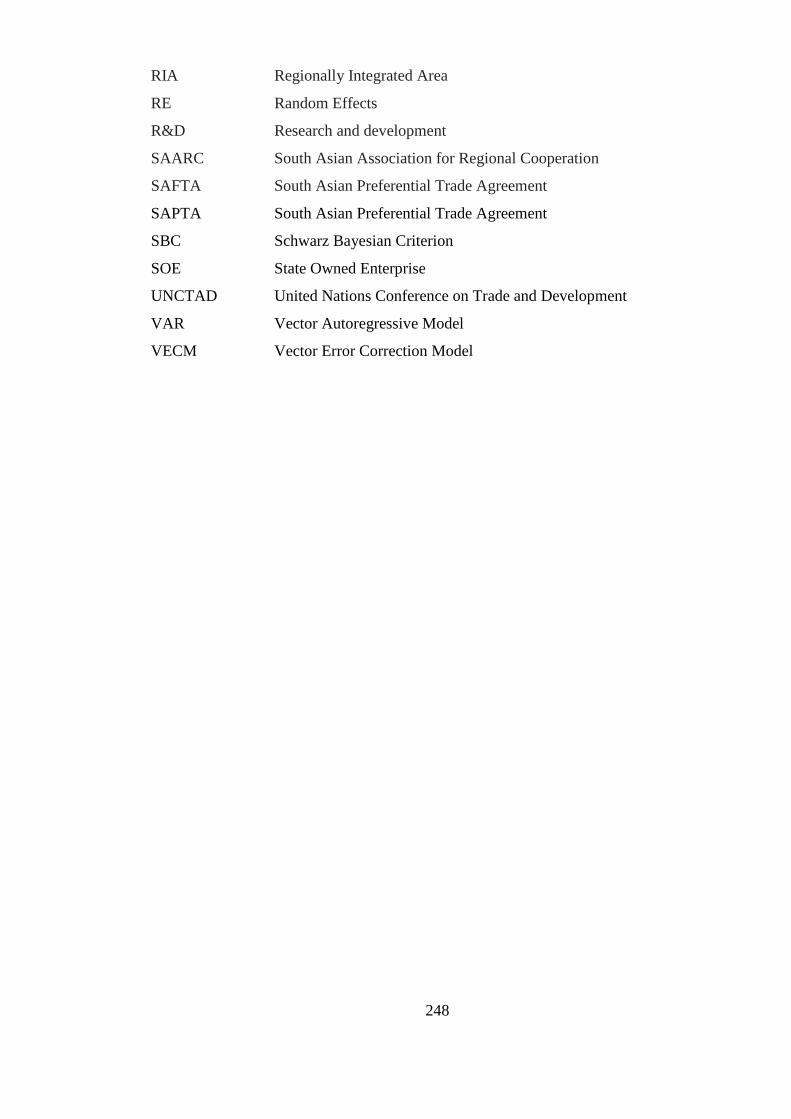
248
RIA Regionally Integrated Area
RE Random Effects
R&D Research and development
SAARC South Asian Association for Regional Cooperation
SAFTA South Asian Preferential Trade Agreement
SAPTA South Asian Preferential Trade Agreement
SBC Schwarz Bayesian Criterion
SOE State Owned Enterprise
UNCTAD United Nations Conference on Trade and Development
VAR Vector Autoregressive Model
VECM Vector Error Correction Model
249
References
Abadie, A. & Gardeazabal, J. 2003. The Economic Costs of Conflict: A Case Study of
the Basque Country. The American Economic Review, 93(1): 113-32.
Abbas, Q. 2001. Endogenous Growth and Human Capital: A Comparative Study of
Pakistan and Sri Lanka. The Pakistan Development Review, 40(4): 987-1007.
Abbott, A., Cushman, D. O., & De Vita, G. 2012. Exchange Rate Regimes and Foreign
Direct Investment Flows to Developing Countries. Review of International Economics,
20(1): 95-107.
Abeyratne, S. 2008. Economic Development and Political Conflict: Comparative Study
of Sri Lanka and Malaysia. South Asia Economic Journal 9: 393-417.
Abeysekera, I. 2011. Civil war, stock return, and intellectual capital disclosure in Sri
Lanka. Advances in Accounting, 27(2): 331-37.
Adam, A. & Filippaios, F. 2007. Foreign direct investment and civil liberties: A new
perspective. European Journal of Political Economy, 23(4): 1038-52.
Adam , A. M. & Tweneboah , G. 2009. Foreign Direct Investment and Stock market
Development: Ghana‘s Evidence. International Research Journal of Finance and
Economics, 26: 178-85.
Agarwal, J. 1980. Determinants of foreign direct investment: A survey.
Weltwirtschaftliches Archiv, 116(4): 739-73.
Aggarwal, A. 2008. Regional Economic Integration and FDI in South Asia : Prospects
and Problems: Indian Council for Research On International Economic Relations.
Agodo, O. 1978. The Determinants of U. S. Private Manufacturing Investments in
Africa. Journal of International Business Studies, 9(3): 95-107.
Agosin, M. R. & Mayer, R. 2000. Foreign Investment In Developing Countries Does it
Crowd in Domestic Investment?: No. 146, United Nations Conference on Trade and
Development (UNCTAD).

250
Agrawal, P. 2000. Economic Impact of Foreign Direct Investment In South Asia: Indira
Gandhi Institute of Development Research.
Aitken, B., Harrison, A., & Lipsey, R. E. 1996. Wages and foreign ownership A
comparative study of Mexico, Venezuela, and the United States. Journal of International
Economics, 40(3–4): 345-71.
Aitken, B. J. & Harrison, A. E. 1999. Do Domestic Firms Benefit from Direct Foreign
Investment? Evidence from Venezuela. American Economic Review, 89(3): 605-18.
Akyuz, Y. & Chang, H.-J. 1998. New Perspectives on East Asian Development. Journal
of Development Studies, 34(6): 4.
American Association of Port Authorities. 2010. World Port Rankings 2010: American
Association of Port Authorities.
Ang, J. B. 2007. CO2 emissions, energy consumption, and output in France. Energy
Policy, 35(10): 4772-78.
Anwar, S. & Nguyen, L. P. 2011. Foreign direct investment and export spillovers:
Evidence from Vietnam. International Business Review, 20(2): 177-93.
Arunatilake, N., Jayasuriya, S., & Kelegama, S. 2001. The Economic Cost of the War in
Sri Lanka. World Development, 29(9): 1483-500.
Asian Development Bank 2008. Country Partnership Stratergy, Sri Lanka 2009-2011.
Asiedu, E. 2002. On the Determinants of Foreign Direct Investment to Developing
Countries: Is Africa Different? World Development, 30(1): 107-19.
Athukorala, P.-c. 2006. Outward-oriented Policy Reforms and Industrialisation: The Sri
Lankan Experience. Journal of South Asian Development, 1(1): 19-49.
Athukorala, P.-c. 2009. Trends and Patterns of Foreign Direct Investments in Asia: A
Comparative Perspective. The Journal of Applied Economic Research, 3(4): 365–408.
Athukorala, P.-c. & Rajapatirana, S. 2000. Liberalization and industrial transformation:
Lessons from the Sri Lankan experience. Economic Development & Cultural Change,
48(3): 543.
251
Athukorala, P. 1995. Foreign Direct Investment and Manufacturing for Export in a New
Exporting Country: The Case of Sri Lanka. World Economy, 18(4): 543-64.
Athukorala, P. C. & Jayasuriya, S. 2004. Complementarity of Trade and FDI
Liberalization in Industrial Growth: Lessons from Sri Lanka, ASARC an International
Conference. Canberra Australia.
Athukorala, W. P. P. A. 2003. The Impact of Foreign Direct Investment for Economic
Growth: A Case Study in Sri Lanka, 9th International conference on Sri Lanka Studies.
Matara, Sri Lanka.
Aturupane, H. 2009. The Pearl of Great Price: Achieving Equitable Access to Primary
and Secondary Education and Enhancing Learning in Sri Lanka, CREATE PATHWAYS
TO ACCESS: Consortium for Research on Educational Access, Transitions and Equity.
Baker, M., Foley, C. F., & Wurgler, J. 2009. Multinationals as Arbitrageurs: The Effect
of Stock Market Valuations on Foreign Direct Investment. The Review of Financial
Studies, 22(1): 337-69.
Balasubramanyam, V. N., Salisu, M., & Sapsford, D. 1996. Foreign direct investment
and growth in EP and IS countries. Economic Journal, 106(434): 92-105.
Balasubramanyam, V. N., Sapsford, D., & Griffiths, D. 2002. Regional Integration
Agreements and Foreign Direct Investment: Theory and Preliminary Evidence.
Manchester School (14636786), 70(3): 460.
Banalieva, E., Gregg, G., & Sarathy, R. 2010. The Impact of Regional Trade Agreements
on the Global Orientation of Emerging Market Multinationals. Management
International Review, 50(6): 797-826.
Bang Nam, J. & Se Young, A. 2004. Multinational Corporations and Host Country
Receptivity: Perceptions from Three Asian Countries. Multinational Business Review (St.
Louis University), 12(2): 17-36.
Bardhan, P. 1997. Corruption and development: A review of issues. Journal of Economic
Literature, 35(3): 1320.
252
Barro, R. J. 1991. Economic Growth in a Cross Section of Countries. The Quarterly
Journal of Economics, 106(2): 407-43.
Barro, R. J. & Lee, J. W. 2010. Data Query.
Barth, E., Gulbrandsen, T., & Schønea, P. 2005. Family ownership and productivity: the
role of owner-management. Journal of Corporate Finance, 11(1–2): 107-27.
Bénassy-Quéré, A., Fontagné, L., & LahrÈche-Révil, A. 2001. Exchange-Rate Strategies
in the Competition for Attracting Foreign Direct Investment. Journal of the Japanese and
International Economies, 15(2): 178-98.
Benito, G. R. G. 1997. Why are Foreign Subsidiaries Divested?In Bjorkman, I & M
Forsgren, (Eds.), The Nature of the International Firm. Copenhagen: Copenhagen
Business School Press.
Bennett, P. D. & Green, R. T. 1972. Political Instability as a Determinant of Direct
Foreign Investment in Marketing. Journal of Marketing Research, 9(2): 182-86.
Beugelsdijk, S., Smeets, R., & Zwinkels, R. 2008. The impact of horizontal and vertical
FDI on host's country economic growth. International Business Review, 17(4): 452-72.
Bhaumik, S. K. & Dimova, R. 2012. Does Human Capital Endowment of FDI Recipient
Countries Really Matter? Evidence from Cross-Country Firm Level Data: IZA
Discussion Paper No. 6382.
Billington, N. 1999. The location of foreign direct investment: an empirical analysis.
Applied Economics, 31(1): 65-76.
Blalock, G. & Gertler, P. J. 2009. How firm capabilities affect who benefits from foreign
technology. Journal of Development Economics, 90(2): 192-99.
Blomberg, S. B., Hess, G. D., & Orphanides, A. 2004. The macroeconomic
consequences of terrorism. Journal of Monetary Economics, 51(5): 1007-32.
Blomström, M. 1988. Labor productivity differences between foreign and domestic firms
in Mexico. World Development, 16(11): 1295-98.
253
Blomström, M. & Kokko , A. 1997. How Foreign Investment Affects Host Countries,
Policy Research Working Paper 1745: The World Bank, International Economics
Department, International Trade Division.
Blomström, M. & Kokko, A. 2003a. The Economics of Foreign Direct Investment
Incentives: NBER Working Paper Series, Working Paper 9489.
Blomström, M. & Kokko, A. 2003b. Human Capital and Inward FDI, Working Paper
167.
Blomström, M. & Kokko, A. 1998. Multinational Corporations and Spillovers. Journal
of Economic Surveys, 12(3): 247-77.
Blomström, M. & Persson, H. 1983. Foreign investment and spillover efficiency in an
underdeveloped economy: Evidence from the Mexican manufacturing industry. World
Development, 11(6): 493-501.
Blonigen, B. A. 1997. Firm-Specific Assets and the Link Between Exchange Rates and
Foreign Direct Investment. American Economic Review, 87(3): 447-65.
Blonigen, B. A. 2005. A Review of the Empirical Literature on FDI Determinants, ASSA
conference. Philadelphia.
Board of Investment Sri Lanka. 2011. Board of Investment Sri Lanka (BOI) (2011).
Board of Investment Sri Lanka. 2012. Board of Investment Sri Lanka, 2012.
Borensztein, E., De Gregorio, J., & Lee, J. W. 1998. How does foreign direct investment
affect economic growth? Journal of International Economics, 45(1): 115-35.
Bosworth, B. P., Collins, S. M., & Reinhart, C. M. 1999. Capital Flows to Developing
Economies: Implications for Saving and Investment. Brookings Papers on Economic
Activity, 1999(1): 143-80.
Brada, J. C., Kutan, A. M., & Yigit, T. M. 2006. The effects of transition and political
instability on foreign direct investment inflows. Economics of Transition, 14(4): 649-80.
Brakman, S., Garretsen, H., Marrewijk, C. V., & Witteloostuijn, A. V. 2007. Nations and
Firms in the Global Economy. 2 ed. Cambridge: Cambridge University Press.
254
Brouthers, K. D. & Brouthers, L. E. 2003. Why Service and Manufacturing Entry Mode
Choices Differ: The Influence of Transaction Cost Factors, Risk and Trust. Journal of
Management Studies, 40(5): 1179-204.
Brown, M. 2011. Sri Lankan Nationalization Law Could Hinder Investment: Fitch
Ratings.
Buckley, P. J., Clegg, J., Forsans, N., & Reilly, K. T. 2001. Increasing the size of
―country‖: Regional economic integration and foreign direct investment in a globalized
world economy. Management International Review, 41(3): 251-74.
Buckley, P. J., Clegg, J., & Wang, C. 2002. The Impact of Inward FDI on the
Performance of Chinese Manufacturing Firms. Journal of International Business Studies,
33(4): 637-55.
Bukowska, G. & Siwińska-Gorzelak, J. 2011. School competition and the quality of
education: introducing market incentives into public services. Economics of Transition,
19(1): 151-77.
Bureau of Democracy United States. 2012. Sri Lanka 2012 Human Rights Report:
Executive Summary, Country Reports on Human Rights Practices: United States
Department of State, Bureau of Democracy, Human Rights and Labor.
Bureau of Democracy United States. 2011. Sri Lanka: Executive Summary, ountry
Reports on Human Rights Practices: United States Department of State, Bureau of
Democracy, Human Rights and Labor.
Bureau of Economic, E. a. B. A. 2011. Openness to, and restrictions upon, foreign
investment, 2011 Investment Climate Statement - Sri Lanka.
Bureau of Economic, E. a. B. A. 2012. Openness to, and restrictions upon, foreign
investment, Bureau of Economic, Energy and Business Affairs, Investment Climate
Statement – Sri lanka (2012).
Busse, M. & Hefeker, C. 2007. Political risk, institutions and foreign direct investment.
European Journal of Political Economy, 23(2): 397-415.
255
Bwalya, S. M. 2006. Foreign direct investment and technology spillovers: Evidence from
panel data analysis of manufacturing firms in Zambia. Journal of Development
Economics, 81(2): 514-26.
Calvet, A. L. 1981. A Synthesis of Foreign Direct Investment Theories and Theories of
the Multinational Firm. Journal of International Business Studies, 12(1): 43-59.
Campa, J. M. 1993. Entry by Foreign Firms in the United States Under Exchange Rate
Uncertainty. Review of Economics & Statistics, 75(4): 614-22.
Caves, R. E. 1971. International Corporations: The Industrial Economics of Foreign
Investment. Economica, 38(149): 1-27.
Caves, R. E. 2007. Multinational Enterprise and Economic Analysis. 3 ed: Cambridge
University Press.
Central Bank of Sri Lanka. 1950. Central Bank Annual Report 1950: Central Bank of Sri
Lanka.
Central Bank of Sri Lanka. 2002. Central Bank Annual Report 2002. Colombo: Central
Bank of Sri Lanka.
Central Bank of Sri Lanka. 2009. Central Bank Annual Report 2009: Central Bank of Sri
Lanka.
Central Bank of Sri Lanka. 2010. Central Bank Annual Report 2010: Central Bank of Sri
Lanka.
Central Bank of Sri Lanka. 2011. Central Bank Annual Report 2011: Central Bank
Annual Report.
Central Bank of Sri Lanka. 2007. Central Bank of Sri Lanka 2007: Central Bank of Sri
Lanka.
Central Intelligence Agency. 2012. The World Fact Book (2012): Central Intelligence
Agency
Chakrabarti, A. 2001. The Determinants of Foreign Direct Investments: Sensitivity
Analyses of Cross-Country Regressions. Kyklos, 54(1): 89-114.

256
Chang, S.-J., Chung, J., & Moon, J. J. 2013. When do foreign subsidiaries outperform
local firms? Journal of International Business Studies, 44: 853–60.
Charemza, W. W. & Deadman, D. F. 1997. Econometric Practice: Edward Elgar
Publishing Inc.
Chen, C. J., Ding, Y., & Kimand, C. 2010. High-level politically connected firms,
corruption, and analyst forecast accuracy around the world. Journal of International
Business Studies, 41(9): 1505-24.
Chen, K.-M., Rau, H.-H., & Lin, C.-C. 2006. The Impact of Exchange Rate Movements
on Foreign Direct Investment: Market-Oriented Versus Cost-Oriented. The Developing
Economies, 44(3): 269-87.
Cheng, L. K. & Kwan, Y. K. 2000. What are the determinants of the location of foreign
direct investment? The Chinese experience. Journal of International Economics, 51(2):
379-400.
Chuang, Y.-C. & Lin, C.-M. 1999. Foreign Direct Investment, R&D and Spillover
Efficiency: Evidence from Taiwan's Manufacturing Firms. Journal of Development
Studies, 35(4): 117.
Chudnovsky, D., López, A., & Rossi, G. 2008. Foreign Direct Investment Spillovers and
the Absorptive Capabilities of Domestic Firms in the Argentine Manufacturing Sector
(1992–2001). The Journal of Development Studies, 44(5): 645-77.
Claessens, S., Klingebiel, D., & Schmukler, S. L. 2001. FDI and Stock Market
Development: Complements or Substitutes?
Colino, A. 2012. Conflict Resolution Processes, Uncertainty and Investment Dynamics:
Evidence for the Basque Country. Defence and Peace Economics, 24(3): 229-45.
Colombo Stock Exchange. 2009. CSE Annual Report 2009. Colombo: Colombo Stock
Exchange.
Conyon, M., Girma, S., Thompson, S., & Wright, P. 1999. The Impact of Foreign
Acquisition on Wages and Productivity in the UK: Centre for Research on Globalisation
257
and Labour Markets, School of Economics, University of Nottingham, Research Paper
99/8.
Country Summary of Higher Education. 2007. Country Summary of Higher Education,
Sri Lanka.
Cushman, D. 1988. Exchange-rate uncertainty and foreign direct investment in the
United States. Weltwirtschaftliches Archiv, 124(2): 322-36.
Cushman, D. O. 1987. The Effects of Real Wages and Labor Productivity on Foreign
Direct Investment. Southern Economic Journal, 54(1): 174-85.
Cushman, D. O. 1985. Real Exchange Rate Risk, Expectations, and the Level of Direct
Investment. The Review of Economics and Statistics, 67(2): 297-308.
Czinkota, M. R., Knight , G., Liesch, P. W., & Steen, J. 2010. Terrorism and
international business: A research agenda. Journal of International Business Studies, 41:
826-43.
Daily Mirror. 2012. Manipulation in the Sri Lankan stock market: Daily Mirror.
Dash, K. C. 1996. The Political Economy of Regional Cooperation in South Asia. Pacific
Affairs, 69(2): 185-209.
Daude, C. & Stein, E. 2007. The Quality of Institutions and Foreign Direct Investment.
Economics & Politics, 19(3).
Deborah, W. 2013. Potential and Actual FDI Spillovers in Global Value Chains: The
Role of Foreign Investor Characteristics, Absorptive Capacity and Transmission
Channels: The World Bank.
Demirbag, M., McGuinness, M., & Altay, H. 2010. Perceptions of Institutional
Environment and Entry Mode. Management International Review, 50(2): 207-40.
DeVotta, N. 2004. Blowback: Linguistic Nationalism, Institutional Decay, and Ethnic
Conflict in Sri Lanka. Stanford, Califonia: Stanford University Press.
DeVotta, N. 2000. Control Democracy, Institutional Decay, and the Quest for Eelam:
Explaining Ethnic Conflict in Sri Lanka. Pacific Affairs, 73(1): 55-76.

258
DeVotta, N. 2010. From civil war to soft authoritarianism: Sri Lanka in comparative
perspective. Global Change, Peace & Security, 22(3): 331-43.
Dhanaraj, C. & Beamish, P. W. 2009. Institutional Environment and Subsidiary Survival.
Management International Review, 49(3): 291-312.
Dimelis, S. & Louri, H. 2002. Foreign Ownership and Production Efficiency: A Quantile
Regression Analysis. Oxford Economic Papers, 54(3): 449-69.
Domes, M. E. & Jensen, J. B. 1998. Comparing Wages, Skills, and Productivity between
Domestically and Foreign-Owned Manufacturing Establishments in the United States.In
Baldwin, Robert E, Robert E Lipsey, & J David Richards, (Eds.), Geography and
Ownership as Bases for Economic Accounting: University of Chicago Press.
Doms, M. E. & Jensen, J. B. 1998. Comparing Wages, Skills, and Productivity between
Domestically and Foreign-Owned Manufacturing Establishments in the United States.In
Baldwin, Robert E, Robert E Lipsey, & J David Richards, (Eds.), Geography and
Ownership as Bases for Economic Accounting: University of Chicago Press.
Drakos, K. 2011. Security Economics: A Guide for Data Availability and Needs. Defence
and Peace Economics, 22(2): 147-59.
Driffield, N., Jones, C., & Crotty, J. 2013. International business research and risky
investments, an analysis of FDI in conflict zones. International Business Review, 22(1):
140-55.
Duma, N. 2007. Sri Lanka‘s Sources of Growth: International Monetary Fund.
Dunning, J. 1981. Explaining the international direct investment position of countries:
Towards a dynamic or developmental approach. Review of World Economics, 117(1): 30-
64.
Dunning, J. H. 1989. Multinational Enterprises and the Growth of Services: Some
Conceptual and Theoretical Issues. Service Industries Journal, 9(1): 5-39.
Dunning, J. H. 2003. The Role of Foreign Direct Investment in Upgrading China's
Competitiveness. Journal of International Business And Economy, 4(1): 1-13.

259
Dunning, J. H., Kim, C.-S., & Lin, J.-D. 2001. Incorporating Trade into the Investment
Development Path: A Case Study of Korea and Taiwan. Oxford Development Studies,
29(2): 145-54.
Dunning, J. H. & Lundan, S. M. 2008. Mutinational Enterprises and the Global
Economy. 2 ed: Edward Elgar Publishing Limited.
Dunning, J. H. & Narula, R. 1996. The Investment development Path Revisited: Some
emerging issues.In Dunning, J H & Rajneesh Narula, (Eds.), Foreign Direct Investment
and Governments: Catalysts for economic restructuring. London: Routledge.
Economic Analysis and Statistics Division. 2011. Classification of manufacturing
industries into categories based on R&D intensities, Technology Intensity Definition:
OECD Directorate for Science, Technology and Industry.
Egger, P. & Winner, H. 2005. Evidence on corruption as an incentive for foreign direct
investment. European Journal of Political Economy, 21(4): 932-52.
Elyasiani, E., Perera, P., & Puri, T. N. 1998. Interdependence and dynamic linkages
between stock markets of Sri Lanka and its trading partners. Journal of Multinational
Financial Management, 8(1): 89-101.
Enderwick, P. 2001. Terrorism and The International Business Environment: Academy
of International Business.
Engle, R. F. & Granger, C. W. J. 1987. Co-Integration and Error Correction:
Representation, Estimation, and Testing. Econometrica, 55(2): 251-76.
Erdal, F. & Tatoglu, E. 2002. Locational Determinants Of Foreign Direct Investment In
An Emerging Market Economy: Evidence From Turkey. Multinational Business Review
(St. Louis University), 10(1): 21.
Faeth, I. 2005 Foreign Direct Investment in Australia: Determinants and Consequences,
Department of Economics, The University of Melbourne.
Feierabend, I. K. & Feierabend, R. L. 1966. Aggressive Behaviors within Polities, 1948-
1962: A Cross-National Study. The Journal of Conflict Resolution, 10(3): 249-71.
260
Feils, D. & Rahman, M. 2011. The Impact of Regional Integration on Insider and
Outsider FDI. Management International Review, 51(1): 41-63.
Feliciano, Z. & Lipsey, R. E. 1999. Foreign ownership and wages in the United States,
1987 - 1992: NBER working paper series, Working paper 6923.
Fielding, D. 2004. How Does Violent Conflict Affect Investment Location Decisions?
Evidence from Israel during the Intifada. Journal of Peace Research, 41(4): 465-84.
Foreign and Commonwealth Office. 2012.
Forsgren, M. 2008. Theories of the multinational firm: amultidimensional creature in the
global economy: Cheltenham : Edward Elgar.
Francis, J., Zheng, C., & Mukherji, A. 2009. An Institutional Perspective on Foreign
Direct Investment. Management International Review, 49(5): 565-83.
Frankel, J. A. 1999. No Single Currency Regime is Right for all Countries or at All
Times, NBER Working Paper Series, Working Paper 7338. Cambridge: National Bureau
of Economic Research.
Frobel, F., Heinrichs, J., & Kreye, O. 1980. The new international division of labour:
Cambridge University Press.
Froot, K. A. & Stein, J. C. 1991. Exchange Rates and Foreign Direct Investment: An
Imperfect Capital Markets Approach. The Quarterly Journal of Economics, 106(4):
1191-217.
Ganegodage, K. R. & Rambaldi, A. N. 2011. The impact of education investment on Sri
Lankan economic growth. Economics of Education Review, 30(6): 1491-502.
Ganotakis, P. & Love, J. H. 2012. Export propensity, export intensity and firm
performance: The role of the entrepreneurial founding team. Journal of International
Business Studies, 43(8): 693-718.
Gao, T. 2005. Labor quality and the location of foreign direct investment: Evidence from
China. China Economic Review, 16(3): 274-92.
261
Girma, S. & Görg, H. 2007. The Role of the Efficiency Gap for Spillovers from FDI:
Evidence from the UK Electronics and Engineering Sectors. Open Economies Review,
18(2): 215-32.
Globerman, S., Ries, J. C., & Vertinsky, I. 1994. The Economic Performance of Foreign
Affiliates in Canada. The Canadian Journal of Economics / Revue canadienne
d'Economique, 27(1): 143-56.
Goldberg, M. A., Heinkel, R. L., & Levi, M. D. 2005. Foreign direct investment: The
human dimension. Journal of International Money and Finance, 24(6): 913-34.
Goldstein, I. & Razin, A. 2006. An information-based trade off between foreign direct
investment and foreign portfolio investment. Journal of International Economics, 70(1):
271-95.
Gordon, R. G. 2005. Ethnologue : languages of the world 15 ed: Dallas, Tex. : SIL
International.
Görg, H. & Greenaway, D. 2001. Foreign direct investment and intraindustry spillovers :
a review of the literature, Globalisation and Labour Markets Programme: Kiel Institute
for the World Economy.
Görg, H. & Strobl, E. 2001. Multinational Companies and Productivity Spillovers: A
Meta-Analysis. The Economic Journal, 111(475): F723-F39.
Govindan, K. 1997 The Impact of Foreign Direct Investment On a Developing Country:
A Case Study of Malaysia, Department of Economics, University of Lancaster,
Lancaster.
Greenaway, D. & Kneller, R. 2007. Firm heterogeneity, exporting and foreign direct
investment. Economic Journal, 117(517): F134-F61.
Guha-Khasnobis, B. & Bari, F. 2000. Sources of Growth in South Asian Countries:
Global Research Project.
Haddad, M. & Harrison, A. 1993. Are there positive spillovers from direct foreign
investment?: Evidence from panel data for Morocco. Journal of Development
Economics, 42(1): 51-74.
262
Hajzler, C. 2012. Expropriation of foreign direct investments: sectoral patterns from
1993 to 2006. Review of World Economics, 148(1): 119-49.
Hanousek, J., Kočenda, E., & Maurel, M. 2011. Direct and indirect effects of FDI in
emerging European markets: A survey and meta-analysis. Economic Systems, 35(3): 301-
22.
Hanson, J. R. 1996. Human Capital and Direct Investment in Poor Countries.
Explorations in Economic History, 33(1): 86-106.
Harris, R. & Robinson, C. 2003. Foreign Ownership and Productivity in the United
Kingdom Estimates for U.K. Manufacturing Using the ARD. Review of Industrial
Organization, 22(3): 207-23.
Harzing, A.-W., Köster, K., & Magner, U. 2011. Babel in business: The language barrier
and its solutions in the HQ-subsidiary relationship. Journal of World Business, 46(3):
279-87.
Havranek, T. & Irsova, Z. 2012. Survey Article: Publication Bias in the Literature on
Foreign Direct Investment Spillovers. The Journal of Development Studies, 48(10):
1375-96.
Heckman, J. J. 1979. Sample Selection Bias as a Specification Error. Econometrica,
47(1): 153-61.
Hejazi, W. & Ma, J. 2011. Gravity, the English language and international business. The
Multinational Business Review, 19(2): 152-67.
Henry, P. B. 2000. Do stock market liberalizations cause investment booms? Journal of
Financial Economics, 58(1–2): 301-34.
Herzer, D. 2012. How Does Foreign Direct Investment Really Affect Developing
Countries' Growth? Review of International Economics, 20(2): 396-414.
Hicks, M. J. & Jeff, S. 2009. Warfare, Civil Conflict and the Spatial Impacts on
Domestic Investment: Evidence from South America, 1950-2000. Peace Economics,
Peace Science and Public Policy, 15(1).
263
Hill, C. W. L. 2011. International Business Completing in the Global Marketplace:
McGraw-Hill.
Hill, C. W. L. & Snell, S. A. 1989. Effects of Ownership Structure and Control on
Corporate Productivity. Academy of Management Journal, 32(1): 25-46.
Hoang, T. T. 2006. Determinants of Foreign Direct Investment in Vietnam.
Hohenthal, A. 2003. English In India: Loyalty and Attitudes, Language In India.
Hsiao, F. S. T. & Hsiao, M.-C. W. 2006. FDI, exports, and GDP in East and Southeast
Asia—Panel data versus time-series causality analyses. Journal of Asian Economics,
17(6): 1082-106.
Hymer, S. H. 1960 The International Operations of National Firms: A Study of Direct
Foreign Investment, Massachusetts Institute of Technology.
International Monetary Fund. 2008. De Facto Classification of Exchange Rate Regimes
and Monetary Policy Frameworks.
International Monetary Fund. 2011. Economic Indicators, International Financial
Statistics Public Data: International Monetary Fund.
Jain, S. C. & Grosse, R. 2009. Impact of Terrorism and Security Measures on Global
Business Transactions: Some International Business Guidelines. Journal of
Transnational Management, 14(1): 42-73.
Jaleel, F. M. & Samarakoon, L. P. 2009. Stock market liberalization and return volatility:
Evidence from the emerging market of Sri Lanka. Journal of Multinational Financial
Management, 19(5): 409-23.
Javorcik, B. S. 2004. Does Foreign Direct Investment Increase the Productivity of
Domestic Firms? In Search of Spillovers through Backward Linkages. The American
Economic Review, 94(3): 605-27.
Jayasinghe, A. 2012. Sri Lanka stock market roiled by scandal. Colombo: Lanka
Business Online.
264
Jensen, N. 2008. Political Risk, Democratic Institutions, and Foreign Direct Investment.
The Journal of Politics, 70(4): 1040-52.
Jensen, N. M., Li, Q., & Rahman, A. 2010. Understanding corruption and firm responses
in cross-national firm-level surveys. Journal of International Business Studies, 41(9):
1481-504.
Jeon, Y., Park, B. I., & Ghauri , P. N. 2013. Foreign direct investment spillover effects in
China: Are they different across industries with different technological levels? China
Economic Review, 26: 105–17.
Jinyoung, K. & Jungsoo, P. 2012. Foreign Directy Investment and Country-Specific
Human Capital: Economic Inquiry, Western Economic Association International.
Kapstein, E. B. 2002. Virtuous Circles? Human Capital Formation, Economic
Development and The Multinational Enterprise: Working Paper No. 191, Research
programme on: Global Interdependence and Income Distribution.
Kearney, A. T. 2011. Offshoring Opportunities Amid Economic Turbulence, Global
Services Location Index.
Kelegama, S. 2000. Development in Independent Sri Lanka: What Went Wrong?
Economic and Political Weekly, 35(17): 1477-90.
Kelegama, S. & Foley, F. 1999. Impediments to Promoting Backward Linkages from the
Garment Industry in Sri Lanka. World Development, 27(8): 1445-60.
Khwaja, A. I. & Mian, A. 2005. Unchecked intermediaries: Price manipulation in an
emerging stock market. Journal of Financial Economics, 78(1): 203-41.
Kinoshita, Y. & Campos, N. F. 2004. Estimating the Determinants of Foreign Direct
Investment Inflows: How Important are Sampling and Omitted Variable Biases?: Bank
of Finland (BOFIT) - Institute for Economies in Transition.
Kobrin, S. J. 1976. The Environmental Determinants of Foreign Direct Manufacturing
Investment: An Ex Post Empirical Analysis. Journal of International Business Studies,
7(2): 29-42.
265
Kohlhagen, S. W. 1977. Exchange Rate Changes, Profitability, and Direct Foreign
Investment. Southern Economic Journal, 44(1): 43-52.
Kokko, A. 1994. Technology, market characteristics, and spillovers. Journal of
Development Economics, 43(2): 279-93.
Kokko, A., Zejan, M., & Tansini, R. 2001. Trade Regimes and Spillover Effects of FDI:
Evidence from Uruguay. Weltwirtschaftliches Archiv, 137(1): 124-49.
Konara, P. & Wei, Y. 2013a. The role of language in bilateral foreign direct investment:
a forgotten factor? Paper presented at Academy of International Business (AIB)
UK/Ireland Chapter Conference, Birmingham, UK.
Konara, P. & Wei, Y. 2013b. The role of language in bilateral foreign direct investment:
a forgotten factor?In Chris, Jones & Yama Temouri, (Eds.), International Business,
Institutions and Performance after the Financial Crisis: Palgrave Macmillan.
Konings, J. 2000. The Effects of Direct Foreign Investment on Domestic Firms:
Evidence from Firm Level Panel Data in Emerging Economies: Working Paper Number
344.
Kravis, I. B. & Lipsey, R. E. 1982. The location of overseas production and production
for export by U.S. multinational firms. Journal of International Economics, 12(3–4):
201-23.
Kugler, M. 2006. Spillovers from foreign direct investment: Within or between
industries? Journal of Development Economics, 80(2): 444-77.
Kumar, N. 2001. Infrastructure Availability, Foreign Direct Investment Inflows and
Their Export-orientation: A Cross-Country Exploration. New Delhi: Research and
Information System for Developing Countries.
Kumaraswamy, P. R. 2007. Terrorism in South Asia: The Changing Trends. South Asia:
Journal of South Asian Studies, 30(1): 7-24.
Lall , S. & Streeten, P. 1997. Foreign investment, transnationals, and developing
countries Palgrave Macmillan.
266
Liljeblom, E. & Löflund, A. 2005. Determinants of international portfolio investment
flows to a small market: Empirical evidence. Journal of Multinational Financial
Management, 15(3): 211-33.
Lipsey, R. E. 2004. Home- and Host-Country Effects of Foreign Direct Investment:
University of Chicago Press.
Lipsey, R. E. & Sjoholm, F. 2001. Foreign Direct Investment and Wages in Indonesian
Manufacturing, NBER Working Paper, Working papaer 8299. Cambridge: National
Bureau of Economic Research.
Lipsey, R. & Sjöholm, F. 2004a. FDI and wage spillovers in Indonesian manufacturing.
Review of World Economics, 140(2): 321-32.
Lipsey, R. E. & Sjöholm, F. 2004b. Foreign direct investment, education and wages in
Indonesian manufacturing. Journal of Development Economics, 73(1): 415-22.
Lipsey, R. E. & Sjöholm, F. 2004c. Host Country Impacts of Inward FDI: Why Such
Different Answers?: Working Paper No 192.
Lonely Planet. 2012. Best in Travel 2013 - Top 10 countries.
Loree, D. W. & Guisinger, S. E. 1995. Policy and Non-Policy Determinants of U.S.
Equity Foreign Direct Investment. Journal of International Business Studies, 26(2): 281-
99.
Loungani, P. & Razin, A. 2001. How Beneficial Is Foreign Direct Investment for
Developing Countries? Finance and Development, 38(2).
Lundan, S. M. & Jones, G. 2001. The ‗Commonwealth Effect‘ and the Process of
Internationalisation. World Economy, 24(1): 99-118.
Makki, S. S. & Somwaru, A. 2004. Impact of Foreign Direct Investment and Trade on
Economic Growth: Evidence from Developing Countries. American Journal of
Agricultural Economics, 86(3): 795-801.
Malik, S. K. 2010. Technology Spillovers from Foreign Direct Investment Evidence
from Indian Manufacturing Industries. New Delhi: Jawaharlal Nehru University.
267
Marin, A. & Bell, M. 2006. Technology spillovers from Foreign Direct Investment
(FDI): the active role of MNC subsidiaries in Argentina in the 1990s. Journal of
Development Studies, 42(4): 678-97.
Mata, J. & Portugal, P. 1999. Closure and Divestiture by Foreign Entrants: The Impact of
Entry and Post-Entry Strategies. Lisboa, Portugal: Banco De Portugal, Economics
Research Department.
McMahon, W. W. 1984. The relation of education and R&D to productivity growth.
Economics of Education Review, 3(4): 299-313.
Mencinger, J. 2008. Direct And Indirect Effects of FDI on Current Account: University
of Ljubljana.
Meyer, K. E. & Sinani, E. 2009. When and Where Does Foreign Direct Investment
Generate Positive Spillovers? A Meta-Analysis. Journal of International Business
Studies, 40(7): 1075-94.
Ministry of Education Sri Lanka. 2006. School Census - 2006, Preliminary Report:
Ministry of Education Sri Lanka, Statistics Branch.
Miyamoto, K. 2003. Human Capital Formation and Foreign Direct Investment in
Developing Countries: Working Paper No.211, OECD Development Center.
Moller, N. M., Markusen, J. R., & Schjerning, B. 2007. Foreign Firms, Domestic Wages:
Natinal Bureau Of Economic Research, Working Paper 13001.
Moosa, I. A. 2002. Foreign Direct Investment: Theory, Evidence and Practice: Palgrave
Macmillan.
Moran, T. H. 2005. How Does FDI Affect Host Country Development? Using Industry
Case Studies to Make Reliable Generalizations: Institute for International Economics
Center for Global Development.
Mottaleb, K. A. & Kalirajan, K. 2010. Determinants of Foreign Direct Investment in
Developing Countries: A Comparative Analysis.
268
Murdoch, J. & Sandler, T. 2002. Civil wars and economic growth: A regional
comparison. Defence and Peace Economics, 13(6): 451-64.
Nigh, D. 1985. The Effect of Political Events on United States Direct Foreign
Investment: A Pooled Time-Series Cross-Sectional Analysis. Journal of International
Business Studies, 16(1): 1-17.
Nonnemberg, M. B. & Mendonça, M. J. C. d. 2004. The Determinants Of Foreign Direct
Investment In Developing Countries.
Noorbakhsh, F., Paloni, A., & Youssef, A. 2001. Human Capital and FDI Inflows to
Developing Countries: New Empirical Evidence. World Development, 29(9): 1593-610.
Noorbakhsh, F., Paloni, A., & Youssef, A. 1999. Low wages or skilled labour? Prospects
for foreign direct investment in developing countries: Department of Economics,
University of Glasgow.
North, D. C. 1991. Institutions. Journal of Economic Perspectives, 5(1): 97-112.
Nunnenkamp, P. 2002. Foreign Direct Investment in Developing Countries: What
Economists (Don‘t) Know and What Policymakers Should (Not) Do: Kiel Institute of
World Economics, Germany.
Nunnenkamp, P. & Spatz, J. 2002. Determinants of FDI in developing countries: has
globalization changed the rules of the game? Transnational Corporations 11(2).
Oh, C. H., Travis Selmier, W., & Lien, D. 2011. International trade, foreign direct
investment, and transaction costs in languages. The Journal of Socio-Economics, 40(6):
732-35.
Perera, Q. 2011. Insider trading? ‗Nothing wrong - we all do it‘-top investor says: The
Sunday Times, Business Times.
Petesch, P. & Thalayasingam, P. 2010. Sri Lanka: Unequal Mobility in an Ethnic Civil
War In Narayan, Deepa & Patti Petesch, (Eds.), Moving Out of Poverty: Rising from the
Ashes of Conflict: Palgrave Macmillan.
269
Pradhan, G. 2001. Economic cost of Sri Lanka's ethnic conflict. Journal of
Contemporary Asia, 31(3): 375-84.
Pravakar, S. 2006. Foreign Direct Investment in South Asia:Policy, Trends, Impact and
Determinants: ADB Institute Discussion Paper No. 56.
Protsenko, A. 2003 Vertical and Horizontal Foreign Direct Investments in Transition
Countries, Ludwig Maximilian University of Munich, Munich.
Punchi, L. 2001. Resistance towards the Language of Globalisation: The Case of Sri
Lanka. International Review of Education / Internationale Zeitschrift für
Erziehungswissenschaft / Revue Internationale de l'Education, 47(3/4): 361-78.
Pursell, G. & Ahsan, Z. F. M. 2011. Sri Lanka‘s Trade Policies: Back to Protectionism:
ASARC Working Paper 2011/03
Quazi, R. M. & Mahmud, M. 2004. Determinants of Foreign Direct Investment in South
Asia.
Radelet, S., Sachs, J., & Lee, J.-W. 1997. Economic Growth in Asia, Emerging Asia:
Changes and Challenges: Asian Development Bank.
Rahman, M. 2010. Political instability discourages FDI: The Financial Express.
Rajan, R. S. 2010. The Evolution and Impact of Asian Exchange Rate Regimes: The
ADB Economics Working Paper Series No. 208.
Rajapaksha, P. & Arunatilake, N. 1997. Would a reduction in trade barriers promote
intra-SAARC trade?: A Sri Lankan perspective. Journal of Asian Economics, 8(1): 95-
115.
Rajapatirana, S. 1988. Foreign trade and economic development: Sri Lanka's experience.
World Development, 16(10): 1143-57.
Ramstetter, E. D. 1999. Comparisons of Foreign Multinationals and Local Firms in Asian
Manufacturing over Time. Asian Economic Journal, 13(2): 163.
Ranasinghe, A. & Hartog, J. 2002. Free-education in Sri Lanka. Does it eliminate the
family effect? Economics of Education Review, 21(6): 623-33.
270
Razin, A. 2002. FDI Contribution to Capital Flows and Investment in Capacity: NBER
Working Paper Series, Working Paper 9204.
Religare Enterprise Limited. 2011. Institutional Research Report 2011.
Reuters. 2013. Sri Lanka bans land sales to foreigners: Thomson Reuters.
Root, F. R. & Ahmed, A. A. 1979. Empirical Determinants of Manufacturing Direct
Foreign Investment in Developing Countries. Economic Development and Cultural
Change, 27(4): 751-67.
Ruane, M. C. M. 2008. Attracting Foreign Direct Investments: Challenges and
Opportunities for Smaller Host Economies. Journal of International Business Research,
7(2): 65-74.
Saggi, K. 1998. Optimal Timing of Foreign Direct Investment Under Uncertainty.
Journal of Transnational Management Development, 3(2): 73-87.
Salih, R. 2000. Privatization in Sri Lanka.In Joshi, G, (Ed.), Privatization in South Asia:
Minimising Negative Social Effects through Restructuring: External Publication.
Saunders, R. S. 1982. The Determinants of Interindustry Variation of Foreign Ownership
in Canadian Manufacturing. The Canadian Journal of Economics / Revue canadienne
d'Economique, 15(1): 77-84.
Schneider, F. & Frey, B. S. 1985. Economic and political determinants of foreign direct
investment. World Development, 13(2): 161-75.
Selmier Ii, W. T. & Oh, C. H. 2012. International business complexity and the
internationalization of languages. Business Horizons, 55(2): 189-200.
Semasinghe, W. M. 2011. The Effects of Public Welfare Policies on Rural Poverty in Sri
Lanka: A Logistic Regression Analysis. Sri Lanka Journal of Advanced Social Studies,
1(1).
Severn, S.-L. 2007 Do conventional foreign direct investment theories explain why
multinational enterprises conduct foreign direct investment in Thailand? , University of
Nottingham, Nottingham.
271
Shastry, G. K. 2012. Human Capital Response to Globalization: Education and
Information Technology in India. Journal of Human Resources, 47(2): 287-330.
Shaver, J. M. 1998. Accounting for Endogeneity When Assessing Strategy Performance:
Does Entry Mode Choice Affect FDI Survival? Management Science, 44(4): 571-85.
Silva, L. 2012. Over 7,000 go overseas annually for studies The Island. Colombo, Sri
Lanka: The Island News.
Smarzynska, B. K. 2002. Spillovers from Foreign Direct Investment through Backward
Linkages: Does Technology Gap Matter?
Snodgrass, D. R. 1998. The Economic Development of Sri Lanka: A Tale of Missed
Opportunitie, Development Discussion Papers, Paper no. 637: Harvard Institute for
International Development, Harvard University.
Solomon, E. M. 2011. Foreign Direct Investment, Host Country Factors and Economic
Growth. Ensayos Revista de Economía, XXX(1): 41-70.
Suliman, A. H. & Mollick, A. V. 2009. Human Capital Development, War and Foreign
Direct Investment in Sub-Saharan Africa. Oxford Development Studies, 37(1): 47-61.
Takii, S. 2005. Productivity spillovers and characteristics of foreign multinational plants
in Indonesian manufacturing 1990–1995. Journal of Development Economics, 76(2):
521-42.
Teece, D. J. 1986. Transactions cost economics and the multinational enterprise An
Assessment. Journal of Economic Behavior & Organization, 7(1): 21-45.
Teitelbaum, E. 2007. Can a developing democracy benefit from labour repression?
Evidence from Sri Lanka. Journal of Development Studies, 43(5): 830-55.
Telecommunications Regulatory Commission of Sri Lanka 2012. Statistical Overview.
The Economist. 2011. Sri Lanka regulations: Expropriation law raises investor concerns.
The New York Times. 2010. New York: The New York Times.
The World Bank. 1993. The East Asian Miracle: Economic Growth and Public Policy.
272
The World Bank. 1994. World Development Report, Infrastructure for Development
The World Bank. 1998. World Investment Report 1998: The World Bank.
The World Bank. 2004. Sri Lanka Development Policy Review, Poverty Reduction and
Economic Management Sector Unit, South Asia Region.
The World Bank. 2005: The World Bank.
The World Bank. 2007. Sri Lanka Development Forum: The Economy, Regional
Disparities, and Global opportunities, Poverty Reduction and Economic Management
Unit South Asia Region.
The World Bank. 2010. Worldwide Governance Indicators, Country data report for Sri
Lanka 1996-2010: The World Bank.
The World Bank. 2011. World Development Indicators 2011.
The World Bank. 2012a. World Development Indicators
The World Bank. 2012b. World Wide Governance Indicators The World bank.
The World Bank. 2013. World Development Indicators 2013.
Thomas, V., Dailami, M., Dhareshwar, A., Kaufman, D., Kishor, N., Lopez, R., & Wang,
Y. 2000. The Quality of Growth: Oxford University Press.
UNCTAD. 2004. Investment Policy Review Sri Lanka. New York and Geneva: United
Nations Conference on Trade and Development (UNCTAD).
UNCTAD. 2004. World Investment Report, The Shift Towards Services. New York and
Geneva: United Nations Conference on Trade and Development
UNCTAD. 2012. UNCTAD Statistics: United Nations Conference on Trade and
Development (UNCTAD).
UNDP Sri Lanka. 1998. National Human Development Report 1998; Regional
Dimensions of Human Development. Colombo, Sri Lanka: United Nations Developmemt
Programme.
273
UNDP Sri Lanka. 2012. Sri Lanka Human Development Report 2012; Bridging Regional
Disparities For Human Development. Colombo, Sri Lanka: United Nations Development
Programme.
United Nations. 1992. World Investment Report 1992: Transnational Corporations As
Engines of Growth: Transnational Corporations and Management Division, Department
of Economic and Social Development, United Nations, New York.
United Nations. 2006. World Investment Report 2006: FDI from Developing and
Transition Economies: Implications for Development. New York and Geneva: United
Nations Conference on Trade and Development.
United Nations Development Programme. 1998. National Human Development Report
1998: Regional Dimensions of Human Development.In Hettiarachchi, K, (Ed.).
Colombo, Sri Lanka.
University Grant Commission Sri Lanka. 2010. University Admissions, Sri Lanka
University Statistics 2010. Colombo: University Grant Commission, Sri Lanka
Urban, D. M. 2010. FDI, Technology Spillovers, and Wages. Review of International
Economics, 18(3): 443-53.
Utne, B. B. & Garbo, G. 2009. Language and Power: The Implications of Language for
Peace and Development.In Wedikkarage , L.K, (Ed.), Science Education and English
Medium: The Sri Lankan Experience: Mkuki na Nayota Publishers.
Vahter, P. 2004. The Effect of Foreign Direct Investment on Labour Productivity:
Evidence from Estonia and Slovenia: Tartu University Press.
Vahter, P. & Masso, J. 2006. Home versus Host Country Effects of FDI: Searching for
New Evidence of Productivity Spillovers, William Davidson Institute Working Paper
Number 820: William Davidson Institute At the University of Michigan.
Velde, D. W. t. & Bezemer, D. 2004. Regional Integration and Foreign Direct Investment
in Developing Countries.
274
Vernon, R. 1966. International Investment and International Trade in the Product
Cycle.In Buckely, P.J & P.N Ghauri, (Eds.), The Internationalization of the Firm.
London: Thomas Learning London.
Walsh, J. P. & Yu, J. 2010. Determinants of Foreign Direct Investment: A Sectoral and
Institutional Approach IMF Working Paper, WP/10/187: International Monetary Fund
(IMF).
Walter, E. 1948. Applied econometric time series. 3 ed: Hoboken, NJ : Wiley.
Wang, C., Wei, Y., & Liu, X. 2010. Determinants of bilateral trade flows in OECD
countries: Evidence from gravity panel data models. World Economy, 33(7): 894-915.
Wei, S.-J. 2000. Local Corruption and Global Capital Flow, Brookings Papers on
Economic Activity: Brookings Institution.
Wei, S.-J. 1997. Why is corruption so much more taxing than tax? Arbitrariness kills:
National Bureau of Economic Research, Working Paper 6255.
Wei, Y. & Wang, C. 2009. Understanding China's international economic integration.
Journal of Chinese Economic and Business Studies, 7(4): 401-08.
Welch, D. & Welch, L. 2008. The importance of language in international knowledge
transfer. Management International Review, 48(3): 339-60.
Welch, D. E., Welch, L. S., & Marschan-Piekkari, R. 2001. The Persistent Impact of
Language on Global Operations. Prometheus, 19(3): 193-209.
Wenzlhuemer, R. 2008. From Coffee to Tea Cultivation in Ceylon, 1880–1900: An
Economic and Social History. Boston.
Wheeler, D. & Mody, A. 1992. International investment location decisions: The case of
U.S. firms. Journal of International Economics, 33(1–2): 57-76.
Wieser, R. 2005. Research And Development Productivity And Spillovers: Empirical
Evidence At The Firm Level. Journal of Economic Surveys, 19(4): 587-621.
275
Wijeweera, A. & Mounter, S. 2008. A VAR Analysis on the Determinants of FDI
Inflows: The Case of Sri Lanka. Applied Econometrics and International Development,
8(1).
Williamson, O. E. 1981. The Economics of Organization: The Transaction Cost
Approach. American Journal of Sociology, 87(3): 548-77.
Williamson, O. E. 1979. Transaction-Cost Economics: The Governance of Contractual
Relations. Journal of Law and Economics, 22(2): 233-61.
Woodward, D. P. & Rolfe, R. J. 1993. The Location of Export-Oriented Foreign Direct
Investment in the Caribbean Basin. Journal of International Business Studies, 24(1):
121-44.
Wooster, R. B. & Diebel, D. S. 2010. Productivity Spillovers from Foreign Direct
Investment in Developing Countries: A Meta-Regression Analysis. Review of
Development Economics, 14(3): 640-55.
World Trade Organization. 1996. Trade and foreign direct investment: World Trade
Organization.
Wößmann, L. 2007. International Evidence on School Competition, Autonomy, and
Accountability: A Review. Peabody Journal of Education, 82(2-3): 473-97.
Wößmann, L. 2003. Specifying Human Capital. Journal of Economic Surveys, 17(3):
239-70.
Xing, Y. & Wan, G. 2006. Exchange Rates and Competition for FDI in Asia: Blackwell
Publishing Ltd.
Xu, D. & Shenkar, O. 2002. Institutional Distance and the Multinational Enterprise. The
Academy of Management Review, 27(4): 608-18.
Yasar, M. & Paul, C. J. M. 2007. Firm Performance and Foreign Direct Investment:
Evidence from Transition Economies. Economics Bulletin, 15(21): 1-11.

276
Yeyati, E. L., Stein, E., & Daude , C. 2002. Regional Integration and the Location of
FDI, Looking Beyond Our Borders: Opportunities and Challenges of the New
Regionalism: Inter-American Development Bank.
Yeyati, E. L., Stein, E., & Daude, C. 2002. Regional Integration and the Location of FDI:
Looking Beyond Our Borders: Opportunities and Challenges of the New Regionalism.
Fortaleza, Brazil: Inter-American Development Bank Integration and Regional Programs
Department Research Department.
Zhang, K. H. 2001. Does Foreign Direct Investment Promote Economic Growth?
Evidence from East Asia and Latin America. Contemporary Economic Policy, 19(2):
175-85.
Zhou, Y. 2007. An empirical study of the relationship between corruption and FDI: with
sample selection error correction. Edgbaston: Economics Department, University of
Birmingham.
Zita, K. & Kapur, A. 2004. Sri Lanka Telecom Brief. New Delhi, India: USTDA South
Asia Communications Infrastructure Conference.