Embed Size (px)
Citation preview

Title
CONCLUSIONS PAPER
Forecasting 101How to Get More Accurate Forecasts With Less Cost and Effort
Insights from a webinar in the SAS Applying Business Analytics Series
Featuring Michael Gilliland, Product Marketing Manager, SAS
ii
ContentsIntroduction ........................................................................................................... 1
Top Five Big Ideas in Forecasting ..................................................................... 1
A Dose of Realism for the Science of Uncertainty......................................... 2
Worst Practices in Setting Forecast Accuracy Objectives ............................ 3
Setting Goals Based on Industry Benchmarks ...............................................3
Setting Arbitrary Accuracy Objectives ............................................................3
A Better Way: Benchmark Against the Naïve Forecast ................................ 4
A Simple FVA Analysis Example ....................................................................... 5
What Does FVA Analysis Tell Us? ...................................................................... 5
Where You Can Improve the Forecasting Process ................................................5
Which Forecaster Is Doing the Best Job? ................................................................6
Getting Started With FVA Analysis ................................................................... 7
1. Map Your Overall Forecasting Process ................................................................7
2. Collect the Necessary Data ....................................................................................8
3. Analyze the Process ..................................................................................................8
4. Report the Results .....................................................................................................9
5. Interpret the Results and Take Action on the Findings ..................................10
FVA Analysis in Action: Case Studies .............................................................11
What If You’re Just Getting Started With FVA Analysis? ............................12
Closing Thoughts ...............................................................................................13
About the Presenter ..........................................................................................13
About SAS® Forecast Server ............................................................................13
For More Information ........................................................................................14

IntroductionOrganizations spend much time and money searching for a magic formula for the perfect forecast, yet still get bad forecasts. Does it have to be this way?
There’s nothing magic about the forecasting process, and there’s no such thing as the perfect forecast. But you can achieve better accuracy and forecasting process efficiency by understanding the nature of your demand patterns and where your forecasting process is adding value – or not.
That was the topic of a SAS webinar in the Applying Business Analytics Series – showing how forecast value added (FVA) analysis is being used at major corporations to identify and eliminate waste in the forecasting process, streamline forecasting efforts, reduce costs and achieve the best results possible – given the nature of the patterns or behav-iors being forecast.
The one-hour presentation led by Michael Gilliland, Product Marketing Manager at SAS, focused on how to:
• Assess the stability or variability of demand to set appropriate expectations for forecast accuracy.
• Gather the data necessary for conducting FVA analysis.
• Interpret FVA results and communicate results to management.
• Identify and eliminate forecasting process waste – those activities that fail to improve the forecast.
Top Five Big Ideas in Forecasting1. Begin with reasonable expectations. Forecast accuracy is limited by the nature of the
behavior we are trying to forecast – its forecastability. Perfect forecasting is not possible, so don’t pursue that ideal.
2 Discover the appropriate way to benchmark the accuracy level you should be attaining. Industry benchmarking can be fruitless; benchmarking against naïve fore-casts is the better choice.
3. Identify waste and inefficiency in the forecasting process. FVA analysis shows you which process steps improve forecast accuracy and which do not.
4. Use FVA analysis to compare the results of a naïve forecast against a statistically generated forecast, the forecast with analyst override and the forecast that is ulti-mately approved by senior management.
5. If good software can give you reasonably good forecasts with little or no manage-ment intervention, trust in the software and invest that management time in other areas that can bring more value to the company.
1

2
A Dose of Realism for the Science of Uncertainty“Although we live in an uncertain and largely unpredictable world, we prefer to operate with an illusion of control,” said Gilliland. “No matter what kind of behavior or activity we are trying to forecast – be it customer demand, financial costs and revenue, call center activity, loan defaults, insurance claims, or whatever – we think a bigger computer, a fancier model and a more elaborate process are all we need to get better forecasts. Unfortunately, the world doesn’t work that way.”
The illusion of control – the belief that we can command the future with accuracy – is simply unrealistic, but there are practical ways for dealing with that painful reality.
“The first thing to acknowledge is that perfect forecasting is not possible, so it makes little sense to pursue this goal,” said Gilliland. “Accuracy is limited by the nature of the behavior we are trying to forecast – its forecastability. Sometimes it is possible to forecast accurately because the behavior follows smooth, stable, repeating patterns.”
However, some behaviors are too infrequent, volatile or erratic – or follow complex patterns that are unknown to us. We can never expect to accurately forecast such behaviors, no matter how hard we try. And when there is randomness in the behavior – and there almost always is – the degree of randomness limits the degree of accuracy we can ever expect to achieve.
For example, suppose you had three processes to be forecast: P10, P100 and P1000, representing the percentage of heads in the tossing of 10, 100 and 1,000 fair coins. What would be the only rational forecast for each process? Which process could be forecast most accurately, and why?
Since each toss of the coin offers a 50 percent probability of heads, the only rational forecast for each trial of each process would be 50 percent heads. Figure 1 shows the results from 100 trials of each process. Because there is natural randomness in the coin-toss process – which is more evident in a small sample size than in a larger one – we can forecast P1000 more accurately than P100, and P100 more accurately than P10.
The first thing to acknowledge is that perfect forecasting is not possible, so it makes little sense to pursue this goal.
Figure 1: Randomness in the process determines the level of forecast accuracy that can be achieved.

3
Although less obvious, this same phenomenon is present in forecasting business behaviors or outcomes, said Gilliland. “The coin-tossing example illustrates that there are limits to the forecasting accuracy we can achieve. We can’t just assume that by working harder, by applying more data, bigger computers and more sophisticated software, that we can always achieve the level of accuracy that we desire.”
Worst Practices in Setting Forecast Accuracy ObjectivesSetting Goals Based on Industry Benchmarks
Goals are sometimes based on industry benchmarks that supposedly represent best-in-class forecasting performance. This is a very bad idea, said Gilliland. First, can you trust the data? Unless it has been rigorously audited, it might not be trustworthy. Second, is the measure consistent? Companies might be reporting forecast accuracy at different organizational levels, in different time buckets (week, month, etc.), and at different lead time offsets. Are they using the same metric? Even metrics as similar sounding as mean absolute percent error (MAPE), weighted MAPE and symmetric MAPE can deliver very different values for the same data. Finally and most important, is the comparison even relevant? Does the “best-in-class” benchmark company have equally forecastable data?
“Suppose a benchmark study shows that Company X has the lowest forecasting error,” said Gilliland. “Consultants and academics converge on Company X to study its forecasting process and publish reports touting Company X’s best practices. Other companies read these reports and begin to copy Company X’s so-called best practices. However, upon further review, we might discover that Company X had very easy-to-forecast demand and would have had an even lower error if they had just used a simple moving average. In other words, Company X’s so-called ‘best practices’ just made the forecast worse.”
Setting Arbitrary Accuracy Objectives
Management sometimes sets blanket goals across the board based on arbitrary wants or needs. “While management may want to achieve 90 percent forecast accuracy, the nature of demand patterns may be such that 90 percent is not achievable,” said Gilliland. “When an organization commits to plans based on unrealistic expectations for forecast accuracy, they can get themselves into deep trouble. And when people are assigned unachievable goals, they will either give up or cheat.
“Suppose you are working in an organization in a strange line of business involving the daily tossing of a fair coin. Your job as a forecast analyst is to forecast heads or tails of each daily toss. Over the course of a lengthy career, not surprisingly, you have achieved a forecast accuracy of 50 percent. But then one day a hotshot new CEO comes in who doesn’t really understand your line of business involving the tossing of fair coins, and unfortunately the CEO doesn’t understand much about randomness or variation either. But he is a big fan of setting new goals as a way of motivating better employee perfor-mance. So your new goal is now set to 60 percent forecast accuracy or you will be fired. So what do you do next? Basically all you can do in this case is to polish your resume while you wait to be fired, or else figure out a way to cheat.”
4
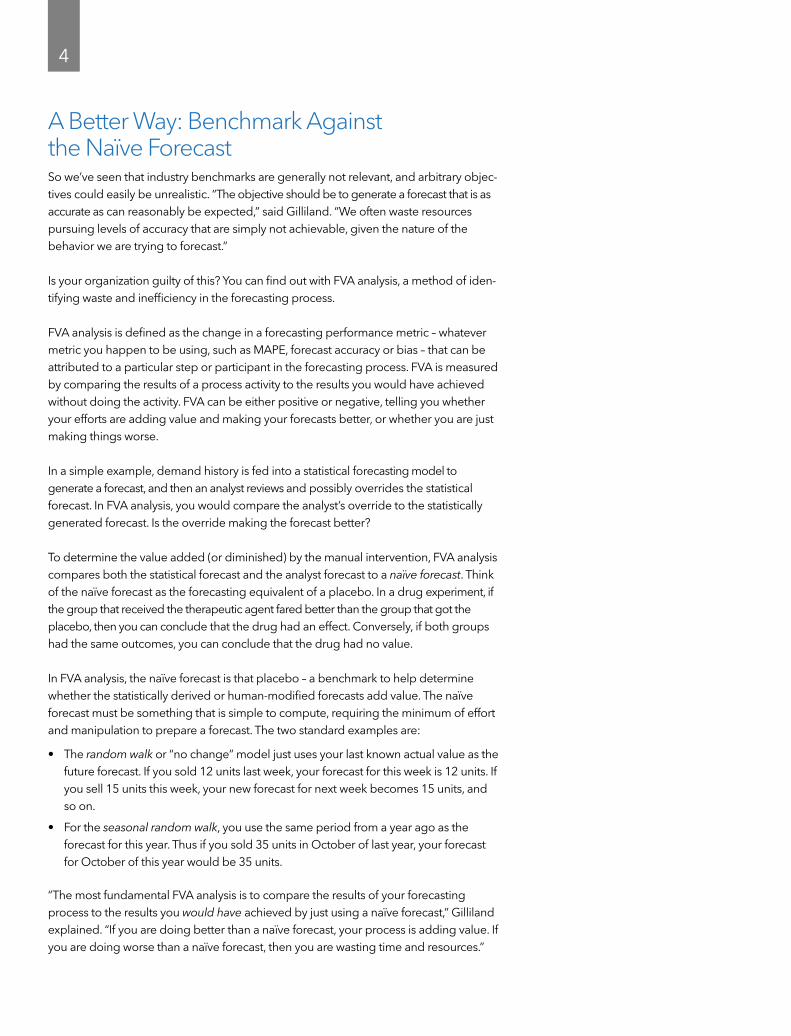
A Better Way: Benchmark Against the Naïve ForecastSo we’ve seen that industry benchmarks are generally not relevant, and arbitrary objec-tives could easily be unrealistic. “The objective should be to generate a forecast that is as accurate as can reasonably be expected,” said Gilliland. “We often waste resources pursuing levels of accuracy that are simply not achievable, given the nature of the behavior we are trying to forecast.”
Is your organization guilty of this? You can find out with FVA analysis, a method of iden-tifying waste and inefficiency in the forecasting process.
FVA analysis is defined as the change in a forecasting performance metric – whatever metric you happen to be using, such as MAPE, forecast accuracy or bias – that can be attributed to a particular step or participant in the forecasting process. FVA is measured by comparing the results of a process activity to the results you would have achieved without doing the activity. FVA can be either positive or negative, telling you whether your efforts are adding value and making your forecasts better, or whether you are just making things worse.
In a simple example, demand history is fed into a statistical forecasting model to generate a forecast, and then an analyst reviews and possibly overrides the statistical forecast. In FVA analysis, you would compare the analyst’s override to the statistically generated forecast. Is the override making the forecast better?
To determine the value added (or diminished) by the manual intervention, FVA analysis compares both the statistical forecast and the analyst forecast to a naïve forecast. Think of the naïve forecast as the forecasting equivalent of a placebo. In a drug experiment, if the group that received the therapeutic agent fared better than the group that got the placebo, then you can conclude that the drug had an effect. Conversely, if both groups had the same outcomes, you can conclude that the drug had no value.
In FVA analysis, the naïve forecast is that placebo – a benchmark to help determine whether the statistically derived or human-modified forecasts add value. The naïve forecast must be something that is simple to compute, requiring the minimum of effort and manipulation to prepare a forecast. The two standard examples are:
• The random walk or “no change” model just uses your last known actual value as the future forecast. If you sold 12 units last week, your forecast for this week is 12 units. If you sell 15 units this week, your new forecast for next week becomes 15 units, and so on.
• For the seasonal random walk, you use the same period from a year ago as the forecast for this year. Thus if you sold 35 units in October of last year, your forecast for October of this year would be 35 units.
“The most fundamental FVA analysis is to compare the results of your forecasting process to the results you would have achieved by just using a naïve forecast,” Gilliland explained. “If you are doing better than a naïve forecast, your process is adding value. If you are doing worse than a naïve forecast, then you are wasting time and resources.”

5
A Simple FVA Analysis ExampleSuppose you found that over the past year, the statistical forecast process achieved a MAPE of 25 percent, and that the analyst override reduced MAPE to 24 percent. In this case we could say that the extra step of having an analyst review and adjust the statis-tical forecast appeared to “add value” by making the forecast better.
In the example below, the naïve model was able to achieve a MAPE of 30 percent. The statistical forecast added value by reducing MAPE to 20 percent. While the analyst override (MAPE of 25 percent) did better than the naïve model, reducing MAPE by five percentage points, it actually made the forecast worse compared to the statistical model, adding five percentage points of error.
Process Step MAPE FVA vs. Naïve FVA vs. StatNaive 30% . .
Statistical 20% 10% .
Override 25% 5% -5%
Figure 2: Here the statistical forecast outperformed the naïve model, but human intervention made the forecast worse.
“You may wonder how adding human judgment to the statistical process could possibly make it worse, but this actually happens all the time,” Gilliland said. “Probably the most common way to do it is with elaborate consensus and collaborative processes where lots of participants can have a say in the final number. Each contributor to the fore-casting process has a bias or personal agenda and can play politics with the forecast.”
For example, if it’s quota-setting time, and you ask salespeople what they’re going to sell next year, their natural bias is to forecast low, to keep their quota low and make it easier to earn their bonuses. However, during the rest of the year, those same sales-people may bias their forecasts too high. They want to make sure there is plenty of inventory and capacity available, so when customers want to buy, there’s plenty avail-able to sell. The more players in the process, and the more manual intervention – the greater the possibility of contaminating the forecast.
What Does FVA Analysis Tell Us?Where You Can Improve the Forecasting Process“A key reason we measure FVA is to identify and eliminate waste and inefficiency in the process,” said Gilliland. “The goal is to generate forecasts that are as accurate as can reasonably be expected, while automating the process to the extent possible and mini-mizing the resources required in the forecasting process.”
• When FVA is negative, you can see that a process activity is making the forecast worse. Clearly, that activity is unproductive and should be eliminated. FVA can also be used as an ongoing metric tracking statistical model performance and indicating when models need to be recalibrated.
• By identifying and improving (or eliminating) non-value-adding activities, you can streamline your process and reduce the cost of resources invested in forecasting – essentially getting better forecasts for free.
6
• When FVA is positive from one step to another, it can indicate that the process step is adding value, as long as the incremental benefits justify the cost. “In the first example, the analyst override did reduce error by one percentage point, but having to hire an analyst to review every forecast is costly,” Gilliland noted. “If the improve-ment is only one percentage point, is it really worth it?”
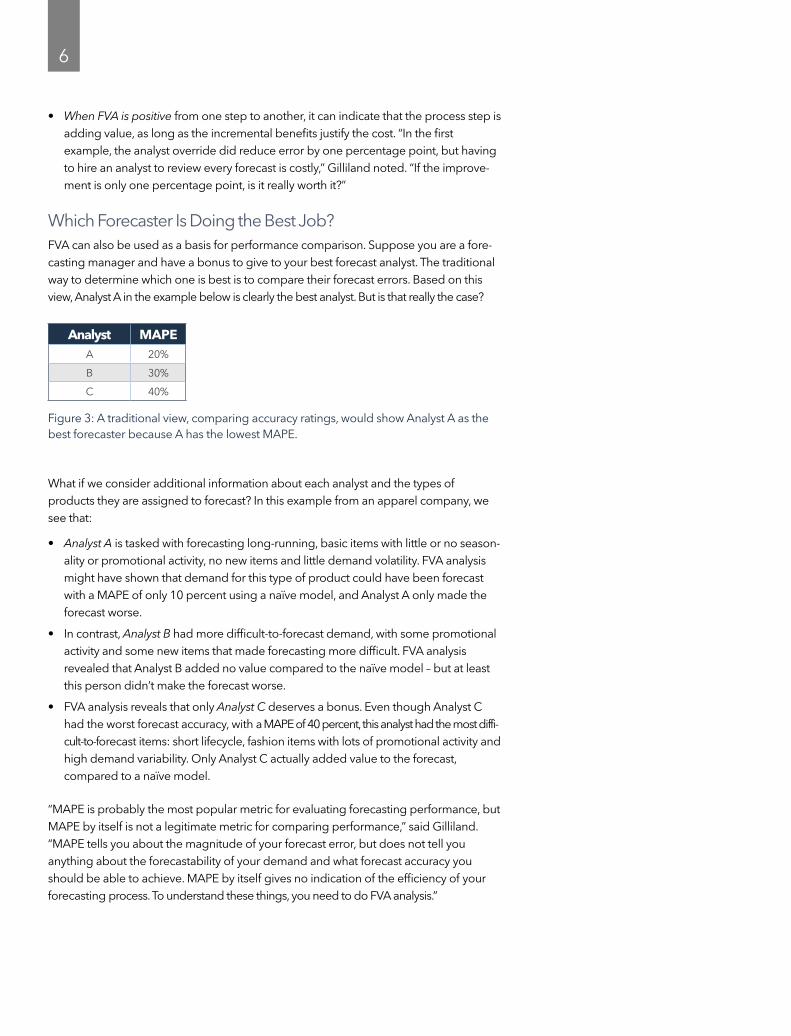
Which Forecaster Is Doing the Best Job?FVA can also be used as a basis for performance comparison. Suppose you are a fore-casting manager and have a bonus to give to your best forecast analyst. The traditional way to determine which one is best is to compare their forecast errors. Based on this view, Analyst A in the example below is clearly the best analyst. But is that really the case?
Analyst MAPEA 20%
B 30%
C 40%
Figure 3: A traditional view, comparing accuracy ratings, would show Analyst A as the best forecaster because A has the lowest MAPE.
What if we consider additional information about each analyst and the types of products they are assigned to forecast? In this example from an apparel company, we see that:
• Analyst A is tasked with forecasting long-running, basic items with little or no season-ality or promotional activity, no new items and little demand volatility. FVA analysis might have shown that demand for this type of product could have been forecast with a MAPE of only 10 percent using a naïve model, and Analyst A only made the forecast worse.
• In contrast, Analyst B had more difficult-to-forecast demand, with some promotional activity and some new items that made forecasting more difficult. FVA analysis revealed that Analyst B added no value compared to the naïve model – but at least this person didn’t make the forecast worse.
• FVA analysis reveals that only Analyst C deserves a bonus. Even though Analyst C had the worst forecast accuracy, with a MAPE of 40 percent, this analyst had the most diffi-cult-to-forecast items: short lifecycle, fashion items with lots of promotional activity and high demand variability. Only Analyst C actually added value to the forecast, compared to a naïve model.
“MAPE is probably the most popular metric for evaluating forecasting performance, but MAPE by itself is not a legitimate metric for comparing performance,” said Gilliland. “MAPE tells you about the magnitude of your forecast error, but does not tell you anything about the forecastability of your demand and what forecast accuracy you should be able to achieve. MAPE by itself gives no indication of the efficiency of your forecasting process. To understand these things, you need to do FVA analysis.”
7
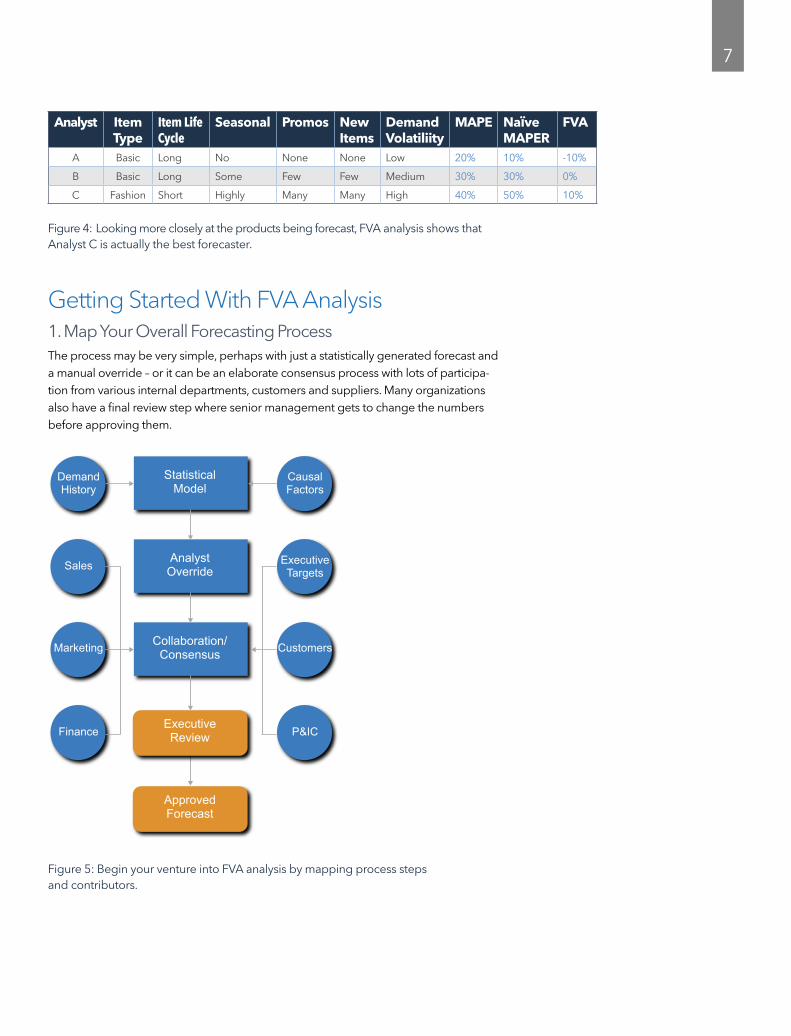
Getting Started With FVA Analysis1. Map Your Overall Forecasting ProcessThe process may be very simple, perhaps with just a statistically generated forecast and a manual override – or it can be an elaborate consensus process with lots of participa-tion from various internal departments, customers and suppliers. Many organizations also have a final review step where senior management gets to change the numbers before approving them.
DemandHistory
CausalFactors
Sales ExecutiveTargets
Marketing Customers
Finance P&IC
StatisticalModel
AnalystOverride
Collaboration/Consensus
ExecutiveReview
ApprovedForecast
Figure 5: Begin your venture into FVA analysis by mapping process steps and contributors.
Analyst Item Type
Item Life Cycle
Seasonal Promos New Items
Demand Volatiliity
MAPE NaÏve MAPER
FVA
A Basic Long No None None Low 20% 10% -10%
B Basic Long Some Few Few Medium 30% 30% 0%
C Fashion Short Highly Many Many High 40% 50% 10%
Figure 4: Looking more closely at the products being forecast, FVA analysis shows that Analyst C is actually the best forecaster.

8
2. Collect the Necessary DataTo conduct FVA analysis, you need the forecast provided by each participant and step of the process. You want to gather this information at the most granular level of detail available, such as by product and location, as shown in the two leftmost columns in the table below. You also need to record the time bucket of the forecast, typically the week or month you are forecasting – and of course, the demand or behavior you were trying to forecast.
The rightmost columns contain the forecast provided by each step and participant in the process. In this example for a very simple forecasting process, you only need to gather the naïve forecast, the statistical forecast generated by your forecasting software, and the final forecast made after any manual overrides.
DemandHistory
StatisticalModel
AnalystOverride
Figure 6: For a simple FVA analysis, you would collect these data elements.
However, the forecasting process is often more complex. In this case, you might need to capture much more data, including the naïve forecast, statistical model forecast, inputs/overrides from multiple contributors, the consensus forecast and the manage-ment-approved forecast.
3. Analyze the ProcessHaving gathered the necessary data, you can now do FVA analysis – looking at how each process step results in a positive or negative change in MAPE, weighted MAPE, or whatever traditional metric you are using. It doesn’t matter which metric you choose, because FVA analysis measures not the value of the metric but the degree of change at each step of the process. Comparisons may include:
• Statistical versus naïve forecast.
• Analyst override versus statistical forecast.
• Consensus versus analyst forecast.
• Approved versus consensus forecast.
• Consensus participant inputs versus naïve forecast.
9
“If you wanted to do a one-time FVA report for just one or a few items, you could do that in a spreadsheet,” said Gilliland. “However, a thorough and ongoing FVA analysis requires you to capture the forecast for each participant at each step for all your item-and-location combinations for every period, so it will quickly grow into a very large amount of data to store and maintain. This is definitely not something you do in Excel. The entry-level SAS® Visual Data Discovery software easily handles huge FVA data sets, analysis and reporting, as well as dynamic visualization of FVA data.”
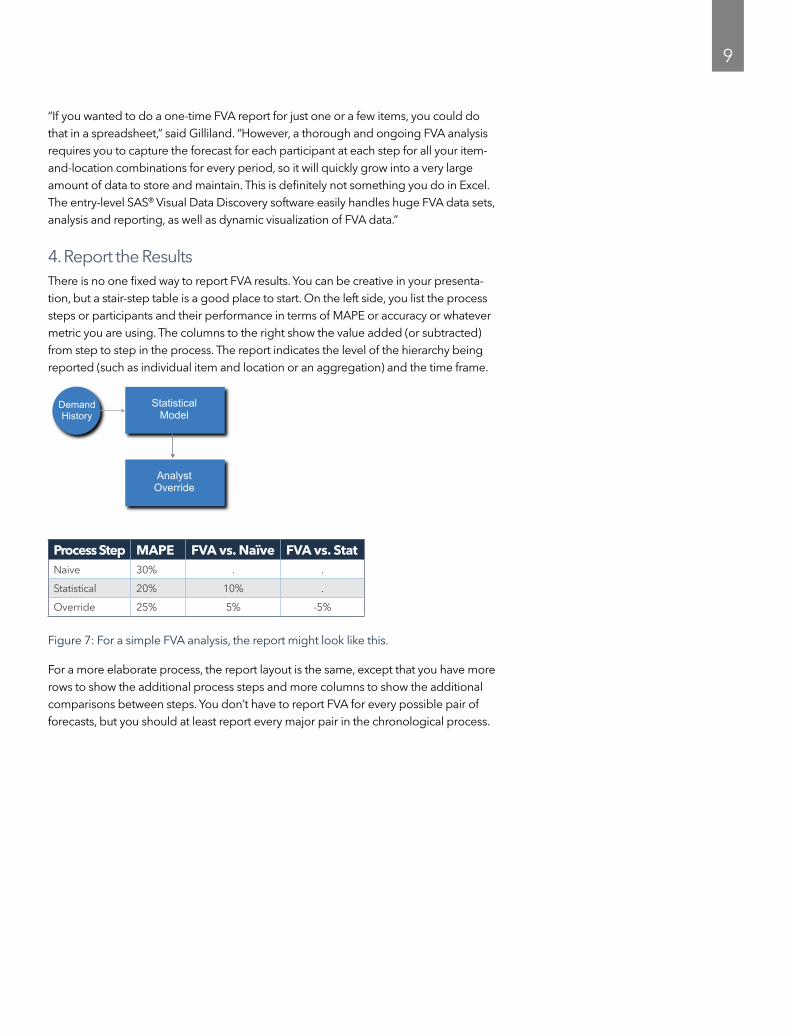
4. Report the ResultsThere is no one fixed way to report FVA results. You can be creative in your presenta-tion, but a stair-step table is a good place to start. On the left side, you list the process steps or participants and their performance in terms of MAPE or accuracy or whatever metric you are using. The columns to the right show the value added (or subtracted) from step to step in the process. The report indicates the level of the hierarchy being reported (such as individual item and location or an aggregation) and the time frame.
DemandHistory
StatisticalModel
AnalystOverride
Process Step MAPE FVA vs. Naïve FVA vs. StatNaive 30% . .
Statistical 20% 10% .
Override 25% 5% -5%
Figure 7: For a simple FVA analysis, the report might look like this.
For a more elaborate process, the report layout is the same, except that you have more rows to show the additional process steps and more columns to show the additional comparisons between steps. You don’t have to report FVA for every possible pair of forecasts, but you should at least report every major pair in the chronological process.
10
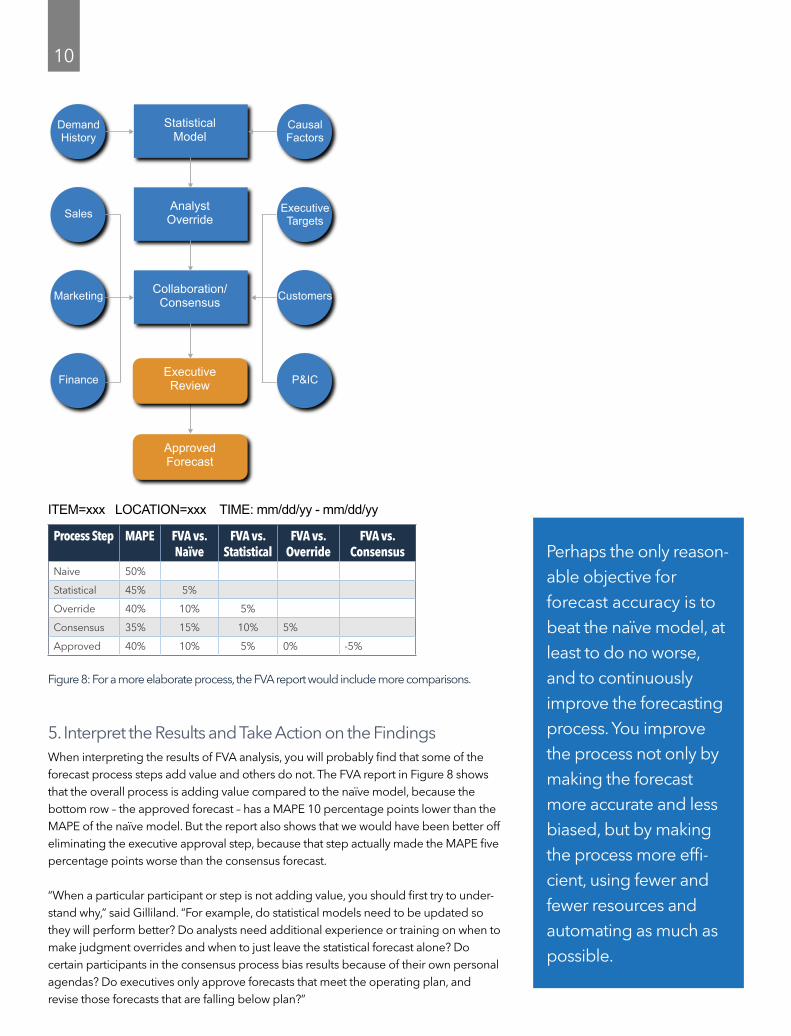
5. Interpret the Results and Take Action on the FindingsWhen interpreting the results of FVA analysis, you will probably find that some of the forecast process steps add value and others do not. The FVA report in Figure 8 shows that the overall process is adding value compared to the naïve model, because the bottom row – the approved forecast – has a MAPE 10 percentage points lower than the MAPE of the naïve model. But the report also shows that we would have been better off eliminating the executive approval step, because that step actually made the MAPE five percentage points worse than the consensus forecast.
“When a particular participant or step is not adding value, you should first try to under-stand why,” said Gilliland. “For example, do statistical models need to be updated so they will perform better? Do analysts need additional experience or training on when to make judgment overrides and when to just leave the statistical forecast alone? Do certain participants in the consensus process bias results because of their own personal agendas? Do executives only approve forecasts that meet the operating plan, and revise those forecasts that are falling below plan?”
DemandHistory
CausalFactors
Sales ExecutiveTargets
Marketing Customers
Finance P&IC
StatisticalModel
AnalystOverride
Collaboration/Consensus
ExecutiveReview
ApprovedForecast
ITEM=xxx LOCATION=xxx TIME: mm/dd/yy - mm/dd/yy
Process Step MAPE FVA vs. Naïve
FVA vs. Statistical
FVA vs. Override
FVA vs. Consensus
Naive 50%
Statistical 45% 5%
Override 40% 10% 5%
Consensus 35% 15% 10% 5%
Approved 40% 10% 5% 0% -5%
Figure 8: For a more elaborate process, the FVA report would include more comparisons.
Perhaps the only reason-able objective for forecast accuracy is to beat the naïve model, at least to do no worse, and to continuously improve the forecasting process. You improve the process not only by making the forecast more accurate and less biased, but by making the process more effi-cient, using fewer and fewer resources and automating as much as possible.

11
FVA Analysis in Action: Case StudiesFVA has been used by a wide range of companies across several major industries, such as pharmaceuticals, retail, technology manufacturing, home furnishings, transportation, apparel, and food and beverage. We have not named the companies in the selected examples, but all of them have spoken publicly about their use of FVA analysis and their findings.
• A premium bedding manufacturer uses a multistep forecasting process where the baseline model is manually updated with market intelligence, resulting in a collab-orative forecast. When the company used FVA analysis to gain visibility into the process, it found that input from the sales force tended to erode forecast accuracy. So the company encouraged a friendly competition, challenging salespeople to “beat the nerd in the corner” and add value to the nerd’s computer-generated forecast, rather than tweak the forecasts to personal agendas.
• A major pharmaceutical company reported FVA as part of a forecast quality dash-board that included metrics for forecast accuracy, process governance and organiza-tional response to the forecast. The company realized that not all forecasts are created equal, and gives special attention to the forecastability of its products. Which have stable demand and can be forecast with confidence? Which have unstable demand, representing higher risk? Forecasts are now differentiated by the degree of risk, so the company can build plans that account for that risk.
• An automotive supplier used FVA analysis to evaluate the effects of management adjustments to the forecast. On the surface, it would seem that any improvement in forecast accuracy would have merit. After all, if forecasts are too high, the company bears the cost of excess inventory. Too low, and there is the risk of unfilled orders and loss of credibility as a supplier. Coupling FVA analysis with a cost-of-inaccuracy metric, the company found that even though management adjustments slightly improved the forecasts, the incremental gains were not worth the cost in time and resources. They were able to streamline the process and eliminate costly manage-ment effort that did not provide sufficient financial benefit.
• A technology manufacturer used FVA analysis to review forecasting performance for the previous six years. It found that half the time, the naïve model did as well or better than the official forecast. When the official forecast was better, the value added was less than 10 percent. Much of the time, the same or better results could be achieved with much less effort and cost. FVA analysis provided the information to help shift management thinking and open the creative process of re-engineering.
• A specialty retailer had forecast analysts who were busy as they could be, constantly revising forecasts based on the latest bits of sales information. The new forecasting manager applied FVA analysis to compare the analysts’ accuracy to a simple, five-week moving average. Only 25 percent of the time did the analysts beat the naïve model. “This is a common situation of overreacting to information,” said Gilliland. “There’s always going to be some randomness – ups and downs in sales numbers. It is important to understand what variability is natural, and only react when something out of the ordinary is occurring. If your statistical forecasting software is doing well enough, just leave it alone. Don’t second-guess it, and don’t create a lot of extra work for yourself revising numbers based on last week’s sales data.”

12
What If You’re Just Getting Started With FVA Analysis?“The FVA approach is intended to be objective and scientific, so you must be careful not to draw conclusions that are unwarranted by results based on insufficient data,” said Gilliland. “For example, measuring FVA over one week or one month is just not enough data to draw any valid conclusions. Period to period, FVA will go up or down, and over particular stretches of periods, FVA may be particularly high or low just due to random-ness or luck.”
What if you haven’t been thoroughly tracking inputs from the forecasting process, and you don’t have a full year of data? Does that mean you can’t make use of FVA analysis right now?
“While a full year of data is nice, if you are just starting fresh collecting forecasting data, you don’t necessarily have to wait a full year to draw conclusions,” said Gilliland. “You just have to understand whether the data you do have is potentially meaningful.”
Gilliland presented an example based on 13 weeks of data. In Figure 9 below, the upper chart shows weekly MAPE for the statistical forecast as the thin line, and the consensus override as the thick line. Summarizing for the entire period, the consensus override is 1.4 percentage points lower than the statistical forecast; so overall, FVA is positive. It would appear that the consensus staff is adding value by delivering a forecast that has lower error than the statistical forecast. “However, in this situation, there isn’t enough data to conclude that the consensus process is a good use of resources,” said Gilliland. “There is quite a lot of variation in the performance of the statistical model, the consensus process and the resulting FVA. You also see that FVA is positive in only seven of the 13 weeks. Because the value added is relatively small, and there is so much variability in the results, a positive FVA may be just due to chance. In a case like this, you need to gather more data before drawing definitive conclusions about the efficacy of the consensus process.”
Figure 10: Forecast performance and FVA are more stable, so some conclusions may be drawn.
In Figure 10, we still only have 13 weeks of data, but we see that the consensus forecast is consistently doing worse than the statistical forecast, with positive FVA in only two of the 13 weeks. Because the findings are more consistent than in the previous example, you can begin to draw some meaningful conclusions about the consensus process.

13
Closing Thoughts“Forecast accuracy is determined by the nature of the behavior you are trying to forecast,” said Gilliland. “While you cannot control the accuracy of your forecasts, you can control the process used and the resources you invest. Rather than making the fore-casting better, overly elaborate forecasting processes with a lot of management touch points generally tend to make the forecast worse. More touch points mean more opportunities for people to add their own biases and personal agendas – and contami-nate what should be an objective, dispassionate, scientific process.
“Setting arbitrary objectives without any consideration to the underlying forecastability of the data is completely wrong. With FVA, you realize that perhaps the only reasonable goal for forecasting performance is to beat a naïve model, along with continuous improvement. Improvement can be reflected in reducing forecasting error and reducing process, minimizing the resources invested in forecasting.
“If good software can give you reasonably good forecasts with little or no management intervention, why not just rely on the software and invest that management time in other areas that can bring more value to the company? Let your production people produce, let your sales people sell, and let your executives do whatever it is that executive management does. Don’t encumber them with forecasting unless you really have to.”
About the PresenterMichael Gilliland, Product Marketing Manager, SAS
Mike Gilliland worked in consumer products forecasting for more than 15 years in the food, electronics and apparel industries. He wrote a quarterly column on “Worst Practices in Business Forecasting” for Supply Chain Forecasting Digest and has published in Supply Chain Management Review, Journal of Business Forecasting, Foresight: The International Journal of Applied Forecasting, Analytics and APICS magazine. He edits the Forecasting Practice section of Foresight, and is on the Board of Directors of the International Institute of Forecasters.
Gilliland holds master’s degrees in philosophy and mathematical sciences from Johns Hopkins University. He is author of The Business Forecasting Deal, and primary editor of Business Forecasting: Practical Problems and Solutions. You can follow his blog The Business Forecasting Deal at blogs.sas.com/content/forecasting. He can be contacted at [email protected].
About SAS® Forecast ServerSAS Forecast Server is SAS’ flagship forecasting product, suitable for the forecasting needs of even the largest enterprises. A high-performance forecasting engine provides large-scale, automatic forecasting from SAS code or via the SAS Forecast Studio inter-face. SAS Forecast Server can diagnose the historical behavior of a time series, deter-mine the appropriate class of models to deal with that behavior, and customize model parameters for each individual series. SAS Forecast Server has been adopted at more than 500 organizations worldwide, across a wide range of industries.

14
For More InformationRead Mike Gilliland’s blog, The Business Forecasting Deal: blogs.sas.com/content/forecasting.
Read the SAS white paper, Forecast Value Added Analysis: Step by Step at sas.com/reg/wp/corp/6216.
Purchase Gilliland’s books, The Business Forecasting Deal and Business Forecasting: Practical Problems and Solutions, through the SAS bookstore, Amazon.com and other booksellers.

SAS and all other SAS Institute Inc. product or service names are registered trademarks or trademarks of SAS Institute Inc. in the USA and other countries. ® indicates USA registration. Other brand and product names are trademarks of their respective companies. Copyright © 2017, SAS Institute Inc. All rights reserved. 104916_G57912.0717
To contact your local SAS office, please visit: sas.com/offices