Embed Size (px)
Citation preview

-4
-2
0
2
4
6
CBO
Administration
Blue ChipConsensus
Percentage Points
Forecast Minus Actual Growth of Inflation-Adjusted Output: Two-Year Forecasts
1976–1977
1981–1982
1986–1987
1991–1992
1996–1997
2001–2002
2006–2007
2011–2012
CONGRESS OF THE UNITED STATESCONGRESSIONAL BUDGET OFFICE
CBOCBO’s Economic
Forecasting Record:
2017 Update
OCTOBER 2017
NotesMany of the figures and the two tables show data from the Blue Chip consensus, which is an average of about 50 private-sector forecasts published in Blue Chip Economic Indicators.
Supplemental data, including an interactive graphic, are posted along with this report on CBO’s website (www.cbo.gov/publication/53090).
www.cbo.gov/publication/53090
Contents
Summary 1How Does CBO’s Forecasting Record Compare With Those of the
Administration and the Blue Chip Consensus? 1Do CBO’s Forecasts Exhibit Statistical Bias? 1How Accurate Are CBO’s Forecasts? 4What Are Some Sources of Forecast Errors? 4How Do Assumptions About Fiscal Policy Affect Forecast Errors? 4What Are the Limitations of This Evaluation? 4
CBO’s Methods for Evaluating Forecasts 4Calculation of Forecast Errors 5BOX 1. HOW CBO CALCULATES ECONOMIC FORECAST ERRORS 6Assessment of Forecasts 6Limitations of the Forecast Evaluations 8
Some Sources of Forecast Error 10Turning Points in the Business Cycle 10Changes in Productivity Trends 11Changes in Crude Oil Prices 13
CBO’s Two-Year Forecasts 13Output 15BOX 2. COMPARISON OF CBO’S AND THE FEDERAL RESERVE’S TWO-YEAR FORECASTS 16Inflation 20Interest Rates 25Wages and Salaries 29
CBO’s Five-Year Forecasts 34Output 36Inflation 38Interest Rates 41Wages and Salaries 45
Appendix: Forecast and Historical Data Used in This Evaluation 51
List of Tables and Figures 55
About This Document 56


CBO’s Economic Forecasting Record: 2017 Update
SummaryFor four decades, the Congressional Budget Office has prepared economic forecasts to use in making its projec-tions for the federal budget. Forecasts of output, infla-tion, interest rates, and wages and salaries, in particular, play a significant role in CBO’s budget analysis. For example, to project receipts from individual income taxes, CBO uses its forecasts of wages and salaries.
CBO regularly evaluates the quality of its economic fore-casts for several reasons.1 One is to determine if it needs to change its forecasting methods. For example, partly in response to past forecast errors, CBO has changed the way it forecasts productivity growth and interest rates in recent years. Another reason for evaluating past fore-casts is to calculate the errors in those forecasts, which in turn can be used to approximate the range of errors or uncertainty in the agency’s current forecasts. Finally, publishing such evaluations gives readers a tool to assess the usefulness of the agency’s projections and is thus one way in which CBO demonstrates its commitment to transparency.
To evaluate its economic forecasts, CBO compares them with the economy’s actual performance and with the Administration’s forecasts, which are published in the Office of Management and Budget’s annual budget documents, and the Blue Chip consensus—an average of about 50 private-sector forecasts published in Blue Chip Economic Indicators. Such comparisons can indicate the extent to which imperfect information and analysis may have caused CBO to miss patterns or turning points in the economy. They can also help the agency identify areas where it has tended to make larger errors than other analysts. This report evaluates CBO’s economic forecasts over two-year and five-year periods. The span of years that CBO examined for this evaluation differs by variable and by forecast period on the basis of data availability.
1. CBO has also evaluated its revenue forecasts. See Congressional Budget Office, CBO’s Revenue Forecasting Record (November 2015), www.cbo.gov/publication/50831. The agency is currently analyzing its past projections of outlays.
How Does CBO’s Forecasting Record Compare With Those of the Administration and the Blue Chip Consensus?CBO’s forecasting record is comparable in quality to those of the Administration and the Blue Chip consen-sus. When CBO’s projections were inaccurate by large margins, the other two forecasters’ projections tended to have similar errors because all forecasters faced the same challenges. For example, all three sets of forecasts of inflation were relatively inaccurate during the late 1970s and early 1980s but generally became more accurate as inflation stabilized in more recent decades.
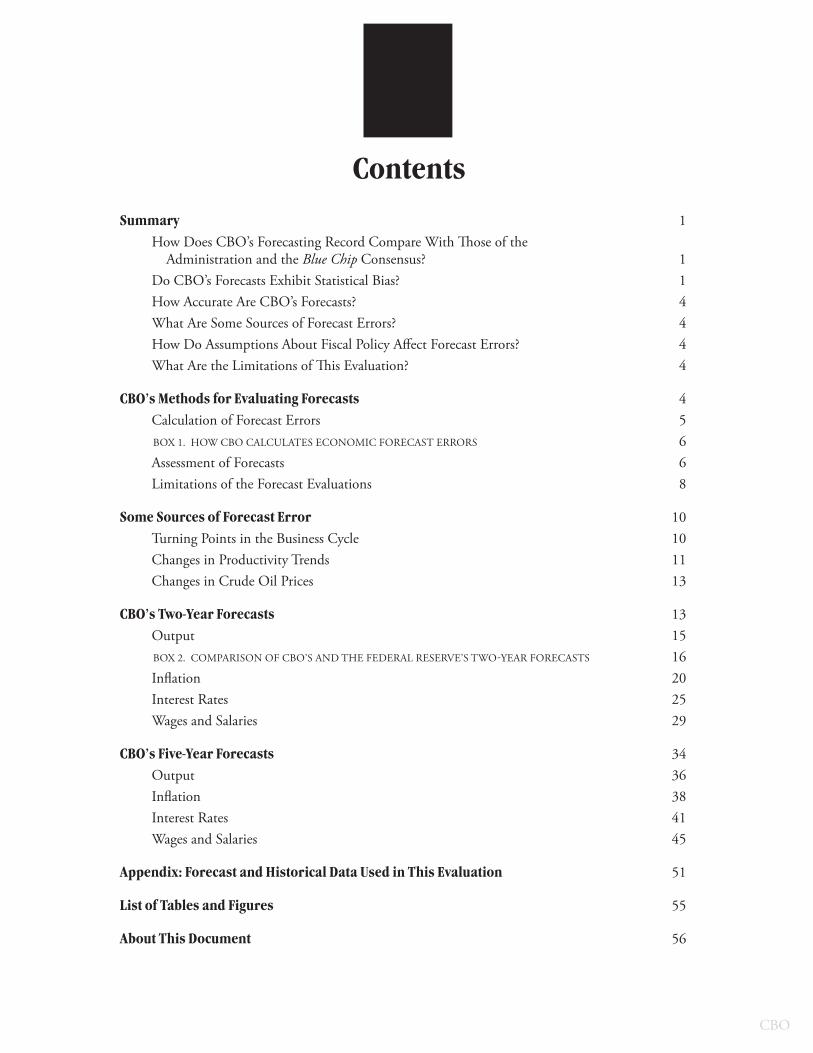
Do CBO’s Forecasts Exhibit Statistical Bias? Statistical bias is the tendency of a forecaster’s projections to be too low or too high over a period of time. A simple and widely used indicator of bias is the mean error. By that measure, CBO’s forecasts of most economic indi-cators examined here have tended to be too high by small amounts, but the agency’s two-year forecasts of real (inflation-adjusted) output were slightly too low, on average.
After evaluating the mean errors of its forecasts, CBO reached two conclusions:
■ CBO’s two-year forecasts of output growth and inflation have been less biased than its two-year forecasts of interest rates and the growth of wages and salaries, which exhibit a sizable upward bias—that is, they have tended to be higher than actual values by a larger amount (see Figure 1).2
■ For most economic indicators, the mean errors of CBO’s five-year forecasts (which are discussed in the second half of the report) have been slightly larger than those of the agency’s two-year forecasts. That pattern shows that CBO has a tendency to overestimate economic trends over the longer term.
2. Forecast errors throughout this report were calculated as projected values minus actual values; thus, a positive error is an overestimate.
2 CBO’s ECOnOmiC FOrECasting rECOrd: 2017 UpdatE OCtOBEr 2017
Figure 1 .
Mean Errors of Two-Year Forecasts Percentage Points
CBOAdministration
Blue Chip Consensus
Output
Inflation
Interest Rates
Wages and Salaries
Growth of Real Output (1980–2014)
Growth of Nominal Output (1980–2014)
Inflation in the CPI (1981–2014)
Di�erence BetweenInflation in the CPI and in the
Output Price Index (1981–2014)
Interest Rate on 3-Month Treasury Bills (1981–2014)
Real Interest Rate on 3-Month Treasury Bills
(1981–2014)a
Interest Rate on 10-Year Treasury Notes (1984–2014)
Growth of Wages and Salaries (1980–2014)
Change in Wages and Salaries Measured as a Percentage of Output (1980–2014) b
b
-0.3 -0.2 -0.1 0 0.1 0.2 0.3 0.4 0.5 0.6 0.7
Sources: Congressional Budget Office; Office of Management and Budget; Wolters Kluwer, Blue Chip Economic Indicators; Bureau of Economic Analysis; Bureau of Labor Statistics; Federal Reserve.
Forecast errors are projected values minus actual values; thus, a positive error is an overestimate. The mean error is the arithmetic average of the forecast errors.
Date ranges refer to the years in which the forecasts were made. For details on the data underlying the summary measures presented here, see the appendix.
Output is either GDP or (before 1992) GNP. Real output is nominal output adjusted to remove the effects of inflation.
CPI = consumer price index; GDP = gross domestic product; GNP = gross national product.
a. The real interest rate is the nominal interest rate deflated by the projected rate of growth in the CPI.
b. The Blue Chip consensus does not include forecasts of wages and salaries.

3OCtOBEr 2017 CBO’s ECOnOmiC FOrECasting rECOrd: 2017 UpdatE
Figure 2 .
Root Mean Square Errors of Two-Year ForecastsPercentage Points
CBOAdministration
Blue Chip Consensus
Output
Inflation
Interest Rates
Wages and Salaries
Growth of Real Output (1980–2014)
Growth of Nominal Output (1980–2014)
Inflation in the CPI (1981–2014)
Di�erence Between
Inflation in the CPI and in the Output Price Index (1981–2014)
Interest Rate on 3-Month Treasury Bills (1981–2014)
Real Interest Rate on 3-Month Treasury Bills
(1981–2014)a
Interest Rate on 10-Year Treasury Notes (1984–2014)
Growth of Wages and Salaries (1980–2014)
Change in Wages and Salaries Measured as a Percentage of Output (1980–2014) b
b
0 0.2 0.4 0.6 0.8 1.0 1.2 1.4 1.6 1.8 2.0 2.2
Sources: Congressional Budget Office; Office of Management and Budget; Wolters Kluwer, Blue Chip Economic Indicators; Bureau of Economic Analysis; Bureau of Labor Statistics; Federal Reserve.
Forecast errors are projected values minus actual values. The root mean square error is calculated by squaring the forecast errors, averaging those squares, and taking the square root of that average.
Date ranges refer to the years in which the forecasts were made. For details on the data underlying the summary measures presented here, see the appendix.
Output is either GDP or (before 1992) GNP. Real output is nominal output adjusted to remove the effects of inflation.
CPI = consumer price index; GDP = gross domestic product; GNP = gross national product.
a. The real interest rate is the nominal interest rate deflated by the projected rate of growth in the CPI.
b. The Blue Chip consensus does not include forecasts of wages and salaries.

4 CBO’s ECOnOmiC FOrECasting rECOrd: 2017 UpdatE OCtOBEr 2017
Other forecasters’ projections generally exhibited bias of a similar magnitude and in the same direction. The mean errors of the Blue Chip consensus forecasts were very similar to those of CBO’s forecasts. The Administration’s forecasts of the growth of real output had larger mean errors than CBO’s forecasts and the Blue Chip consensus, but its forecasts of inflation and interest rates exhibited less upward bias than did the other two forecasters’.
How Accurate Are CBO’s Forecasts?Accuracy is the degree to which forecast values are dis-persed around actual outcomes. One widely used mea-sure of accuracy is the root mean square error (RMSE). By that measure, CBO’s two-year forecasts are generally as accurate as those of the Blue Chip consensus and, for most economic indicators, slightly more accurate than the Administration’s two-year forecasts (see Figure 2). The accuracy of all three sets of five-year forecasts is comparable.
Comparing the accuracy of its two-year and five-year forecasts, CBO observed the following:
■ CBO’s five-year forecasts of output and inflation are more accurate than its two-year forecasts of those variables, in part because long-term forecasts rest more on underlying trends in the economy than on short-term cyclical movements, which are very difficult to predict.
■ CBO’s five-year interest rate forecasts are less accurate than its two-year forecasts of those rates because of the large and unexpectedly persistent decline in long-term interest rates that began in the early 1980s.
■ For its forecasts of wages and salaries, CBO’s findings are less clear-cut. The agency’s two-year and five-year forecasts of the growth of wages and salaries are equal in terms of accuracy, but its five-year forecasts of the change in wages and salaries measured as a percentage of output are more accurate than the corresponding two-year forecasts.
What Are Some Sources of Forecast Errors?CBO’s and other forecasters’ largest forecast errors often stem from the difficulties of anticipating three key developments:
■ Turning points in the business cycle—that is, the beginning and end of recessions;
■ Changes in trends in productivity; and
■ Changes in crude oil prices.
How Do Assumptions About Fiscal Policy Affect Forecast Errors?Fiscal policy refers to the federal government’s policies on taxes and spending. Assumptions about fiscal policy are an important ingredient of an economic forecast because such policy affects output, inflation, interest rates, and wages and salaries. To provide lawmakers with a bench-mark against which they can assess potential changes in the law, CBO constructs its economic forecasts under the assumption that federal fiscal policy will generally remain the same as under current law. By contrast, the Administration’s forecasts reflect the assumption that the policies in the President’s proposed budget will be adopted. Forecasters in the private sector (such as those who contribute to the Blue Chip consensus) form their own projections about the future of federal fiscal policy, so their forecasts reflect changes in law that they antici-pate will be made.
Those different assumptions about fiscal policy account for some of the variation among forecasts and thus in forecast errors. Assumptions about fiscal policy can be particularly significant when policymakers are consid-ering major changes to current law. For example, in 2009 and 2010, CBO’s two-year forecasts of real output growth diverged noticeably from the Administration’s forecasts and the Blue Chip consensus because of the dif-ferent fiscal policy assumptions underlying the forecasts.
What Are the Limitations of This Evaluation?This evaluation has three limitations. First, all forecasters change their procedures over time, which makes it hard to draw inferences about future errors. Second, because forecasters make different assumptions about future fiscal policy, it is difficult to compare the quality of forecasts without considering the role of expected changes in laws. Finally, the historical data (on output and income, for example) that forecasters use to make economic projec-tions are often revised, which can complicate the task of interpreting forecast errors.
CBO’s Methods for Evaluating ForecastsCBO evaluates the quality of its forecasts by examin-ing its past forecast errors and comparing them to the errors in the Administration’s forecasts and the Blue Chip consensus. The Blue Chip consensus is particularly useful

5OCtOBEr 2017 CBO’s ECOnOmiC FOrECasting rECOrd: 2017 UpdatE
for comparisons because it incorporates a variety of forecasts and therefore reflects a broader blend of sources and methods than any single forecaster would use. Over time, composite forecasts like the Blue Chip consensus often provide better estimates than any projection made by a single forecaster or using a single method.3
This report evaluates CBO’s economic forecasts over the first two years and over the first five years of CBO’s 10-year baseline projection period. The forecasts are made at the beginning of a calendar year, and the errors are calculated by subtracting the average actual value over the forecast period from the average projected value. The two-year forecasts include the full period that is used to prepare the baseline budget for the upcoming fiscal year. The five-year forecasts are used to examine the accuracy of longer-term projections of several variables that are important for CBO’s baseline budget projections.4
The span of years evaluated differs by economic indicator and by forecast horizon depending on the data available. CBO’s and the Administration’s forecasts published in the early months of the years 1976 to 2014 were examined, but those published in early 2015 were not, because actual data for all of 2016—which are necessary to evaluate the two-year forecasts made in 2015—were not available when the analysis for this report was com-pleted. To ensure that differences in the availability of forecast data did not affect the interpretation of forecast errors, the ranges of years covered by the comparisons were determined by the earliest possible year for which data from the Blue Chip consensus were available. The first two-year Blue Chip consensus forecast that CBO examined for this evaluation was released in 1980 and included projections of real and nominal output. In
3. See Allan Timmermann, “Forecast Combinations,” in Graham Elliott, Clive W. J. Granger and Timmermann, eds., Handbook of Economic Forecasting, vol. 1 (North Holland, 2006), pp. 135–196, https://doi.org/10.1016/S1574-0706(05)01004-9; Andy Bauer and others, “Forecast Evaluation with Cross-Sectional Data: The Blue Chip Surveys,” Economic Review, vol. 88, no. 2 (Federal Reserve Bank of Atlanta, 2003), pp. 17–31, http://tinyurl.com/yb6bj9dq; Henry Townsend, “A Comparison of Several Consensus Forecasts,” Business Economics, vol. 31, no. 1 (January 1996), pp. 250–261, www.jstor.org/stable/23487509; and Robert Clemen, “Combining Forecasts: A Review and Annotated Bibliography,” International Journal of Forecasting, vol. 5, no. 4 (1989), pp. 559–583, https://doi.org/10.1016/0169-2070(89)90012-5.
4. CBO’s baseline projection period is currently 10 years, but in the past, it has been as short as 5 years.
1981, forecasts of inflation and 3-month interest rates were also included. Blue Chip first published five-year forecasts of real and nominal output in 1979, of infla-tion and the 3-month interest rate in 1983, and of the 10-year Treasury note rate in 1984.5
This report updates CBO’s 2015 Economic Forecasting Record with additional forecasts and new and revised historical data.6 This evaluation adds two years of CBO’s, the Administration’s, and Blue Chip’s forecasts that were not included in the previous report—the two-year forecasts published in 2013 and 2014 and the five-year forecasts published in 2010 and 2011. It also includes a few additional forecasts from the early years of the Blue Chip consensus and revisions to previously published historical data that have been made since the last report was released. The additional data and revisions to older data did not significantly alter the main findings from the previous report—namely, that the quality of CBO’s two-year and five-year forecasts is similar to that of other organizations’ forecasts.
Another difference between this report and previous versions is that this report analyzes five-year forecasts of interest rates. In the past, CBO analyzed only two-year forecasts of interest rates.
Calculation of Forecast ErrorsFor this report, CBO measured forecast errors as the difference between the average forecast value and the average actual value over each forecast period. (See Box 1 for an example of how CBO calculates its forecast errors.) The actual values are based on the latest available data from the Bureau of Economic Analysis (BEA) and other statistical agencies. A positive error indicates that the actual value of the indicator was lower than CBO expected, and a negative error indicates that it was higher than expected.
The method used to calculate the forecast errors for this report differs slightly from that used in CBO’s evaluation
5. See the appendix for further details on the choice of historical time-series data and on the sources of the forecast data used in the comparisons.
6. See Congressional Budget Office, CBO’s Economic Forecasting Record: 2015 Update (February 2015), www.cbo.gov/publication/49891.

6 CBO’s ECOnOmiC FOrECasting rECOrd: 2017 UpdatE OCtOBEr 2017
of errors in revenue projections.7 In that evaluation, pro-jection errors were calculated for a single fiscal year. For example, the error in CBO’s two-year revenue projection for 2007 is the percentage difference between the actual amount of revenues received in fiscal year 2007 and the revenues projected for that year in January 2006.8
7. Congressional Budget Office, CBO’s Revenue Forecasting Record (November 2015), www.cbo.gov/publication/50831.
8. In CBO’s evaluation of its revenue projections, the agency calculated errors as the percentage difference (rather than the simple difference used in this report) between the projected and actual values because revenues are expressed as dollar amounts.
Assessment of ForecastsLike CBO’s previous studies of its economic forecasts, this evaluation focuses on two indicators of quality:
If the errors in revenue projections were measured as simple differences in dollar amounts, they would be difficult to compare over time. (A $5 billion error in 1992, for example, would be significantly larger than a $5 billion error in 2014.) The simple difference is more appropriate here because this report evaluates errors in forecasts of economic indicators that are expressed as rates or percentages—growth rates, interest rates, and changes in wages and salaries as a percentage of output. Forecast errors in this report are thus percentage-point differences between forecast and actual values.
Box 1.
How CBO Calculates Economic Forecast Errors
The Congressional Budget Office calculates forecast errors by subtracting the average actual value of an economic indi-cator over a two-year (or five-year) period from the average projected value of that indicator over the same period. For example, to calculate the error for the two-year forecast of the growth of real (inflation-adjusted) gross domestic product (GDP) that was published in the January 2000 Budget and Economic Outlook, CBO first calculated the geometric average of the projected growth rates of real GDP for calendar years 2000 and 2001, which was 3.2 percent.1 The agency then
1. The geometric average is the appropriate measure for averaging growth rates. It was used to calculate the average for all indicators except the change in wages and salaries as a percentage of output. Because that
calculated the average actual growth rate of real GDP for those two years, which was 2.5 percent. Finally, it subtracted the average actual rate of 2.5 percent from the average pro-jected rate of 3.2 percent, resulting in an error of 0.7 percent-age points. To determine the error for the five-year forecast made that same year, CBO took the averages of projected and actual output growth rates for calendar years 2000 through 2004.
indicator is a ratio rather than a growth rate, the appropriate measure for averaging is the arithmetic average.
Example: Calculating the Error in the Two-Year Forecast of the Growth of Real GDP That CBO Published in January 2000
CBO’s Forecast
Rate
The error for the two-year forecast made in 2000 is . . .
Calculate the Two-Year Average
ActualRate
2000
2001
3.3%
3.1%
4.1%
1.0%
3.2% – 2.5% = 0.7 percentage points
Sources: Congressional Budget Office; Bureau of Economic Analysis.
GDP = gross domestic product.

7OCtOBEr 2017 CBO’s ECOnOmiC FOrECasting rECOrd: 2017 UpdatE
statistical bias and accuracy. Other characteristics of forecast quality—such as whether forecasters optimally incorporate all relevant information when making their projections—are harder to assess.9
Statistical Bias. Statistical bias indicates the tendency of a set of forecasts to err in a certain direction. To measure bias, CBO used the mean error—that is, the arithmetic average of the forecast errors—which is the simplest and most widely used measure. CBO measures bias to determine whether its forecasts are systematically too high or too low. The agency’s goal is to provide forecasts of economic indicators that represent the middle of the distribution of possible outcomes. The presence of bias might indicate that the forecast methods should be mod-ified to eliminate persistent error.
The mean error does not, however, provide a complete characterization of the quality of a forecast. Because pos-itive and negative errors are added together to calculate the average, underestimates and overestimates offset one another. A small mean error might indicate that all the forecasts had only small errors, but it could also result from large overestimates and large underestimates that offset one another. Experimenting with alternatives to the mean error measure, several analysts outside of CBO have used more elaborate techniques to test for bias in the agency’s forecasts.10
9. Several studies that have examined how well relevant information has been incorporated into CBO’s economic forecasts—a characteristic referred to as forecast efficiency—have found that the agency’s forecasts are relatively efficient. See, for example, Robert Krol, “Forecast Bias of Government Agencies,” Cato Journal, vol. 34, no. 1 (Winter 2014), pp. 99–112, https://tinyurl.com/y7cmapw3 (PDF, 88 KB); Stephen M. Miller, “Forecasting Federal Budget Deficits: How Reliable Are US Congressional Budget Office Projections?” Applied Economics, vol. 23, no. 12 (December 1991), pp. 1789–1799, http://doi.org/10.1080/00036849100000168; and Michael T. Belongia, “Are Economic Forecasts by Government Agencies Biased? Accurate?” Review, vol. 70, no. 6 (Federal Reserve Bank of St. Louis, November/December 1988), pp. 15–23, http://tinyurl.com/ychze7ah. Although statistical tests can identify sources of inefficiency in a forecast after the fact, they generally do not indicate how such information could be used to improve forecasts when they are being made.
10. One such alternative approach to testing a forecast for bias is based on linear regression analysis of actual values compared with forecast values. For details of that method, see Jacob A. Mincer and Victor Zarnowitz, “The Evaluation of Economic Forecasts,” in Jacob A. Mincer, ed., Economic Forecasts and Expectations: Analysis of Forecasting Behavior and Performance
Accuracy. The accuracy of a set of forecasts is the degree to which forecast values are dispersed around actual out-comes. Narrower dispersion indicates greater accuracy. Generally, the more accurate CBO’s economic forecasts are, the more accurate its forecasts of revenues and out-lays will be.
Two commonly used measures of accuracy are the mean absolute error and the root mean square error. The mean absolute error is the arithmetic average of the forecast errors without regard to the direction of the errors (that is, the negative signs are removed from underestimates before averaging). Thus, unlike in the mean error, in the mean absolute error, underestimates and overestimates do not offset one another. The RMSE—the calculation of which involves squaring the errors (thus removing the negative signs)—also shows the size of the error without regard to direction, but it places a greater weight on larger deviations.11
(National Bureau of Economic Research, 1969), pp. 3–46, www.nber.org/chapters/c1214. Studies that have used that method to evaluate CBO’s and the Administration’s short-term forecasts have not found statistically significant evidence of bias over short forecast horizons. See, for example, Robert Krol, “Forecast Bias of Government Agencies” Cato Journal, vol. 34, no. 1 (Winter 2014), pp. 99–112, https://tinyurl.com/y7cmapw3 (PDF, 88 KB); Graham Elliott and Allan Timmermann, “Economic Forecasting,” Journal of Economic Literature, vol. 46, no. 1 (March 2008), pp. 3–56, https://doi.org/10.1257/jel.46.1.3; George A. Krause and James W. Douglas, “Institutional Design Versus Reputational Effects on Bureaucratic Performance: Evidence from U.S. Government Macroeconomic and Fiscal Projections,” Journal of Public Administration Research and Theory, vol. 15, no. 2 (April 2005), pp. 281–306, https://doi.org/10.1093/jopart/mui038; and Michael T. Belongia, “Are Economic Forecasts by Government Agencies Biased? Accurate?” Review, vol. 70, no. 6 (Federal Reserve Bank of St. Louis, November/December 1988), pp. 15–23, http://tinyurl.com/ychze7ah. For more elaborate studies of bias that included CBO’s forecasts among a sizable sample, see J. Kevin Corder, “Managing Uncertainty: The Bias and Efficiency of Federal Macroeconomic Forecasts,” Journal of Public Administration Research and Theory, vol. 15, no. 1 (January 2005), pp. 55–70, https://doi.org/10.1093/jopart/mui003; and David Laster, Paul Bennett, and In Sun Geoum, “Rational Bias in Macroeconomic Forecasts,” Quarterly Journal of Economics, vol. 114, no. 1 (February 1999), pp. 293–318, https://doi.org/10.1162/003355399555918.
11. The RMSE is calculated by squaring the forecast errors, averaging those squares, and taking the square root of that average. The mean square forecast error is equal to the square of the bias in the errors plus the variance (that is, the square of the standard deviation) of the errors.
8 CBO’s ECOnOmiC FOrECasting rECOrd: 2017 UpdatE OCtOBEr 2017
For this evaluation, CBO focused primarily on the RMSE, which can be used to gauge the uncertainty surrounding future forecasts. A smaller RMSE sug-gests that a forecaster’s projections have less uncertainty surrounding them than they would if the RMSE was larger. Each time CBO produces a forecast, it does so with the expectation that the forecast will be unbiased, which implies that the RMSE of CBO’s past forecasts approximates the standard deviation associated with the new forecast. In general, when the errors of a given set of forecasts are normally distributed around a mean error of zero—that is, if the misestimates are roughly sym-metrically distributed around zero and there are more relatively small errors than large ones—about two-thirds of the forecasts will have misestimates within a range of plus or minus one RMSE. For example, the RMSE of CBO’s two-year forecasts of the growth of real output is 1.3 percentage points (see Table 1). An RMSE of that value indicates that there is about a two-thirds chance that the actual average growth rate over the next two years will be within 1.3 percentage points of the rate in CBO’s current forecast.12
Limitations of the Forecast EvaluationsThere are three reasons to be cautious when interpreting the results of this forecast evaluation: Forecasting meth-ods change over time, different forecasters make different assumptions about future fiscal policy, and many of the actual values of the projected variables are periodically revised.
Over time, CBO and other forecasters have changed the procedures that they use to develop economic fore-casts—partly in response to changes in the economy and partly in response to advances in forecasting methods. Although such changes are aimed at improving the qual-ity of forecasts, they make it difficult to draw inferences about future errors.
12. For a similar approach to measuring uncertainty that uses the RMSE, see David Reifschneider and Peter Tulip, Gauging the Uncertainty of the Economic Outlook Using Historical Forecasting Errors: The Federal Reserve’s Approach, Finance and Economics Discussion Series Paper 2017-020 (Board of Governors of the Federal Reserve System, February 2017), https://doi.org/10.17016/FEDS.2017.020 (PDF, 404 KB). For a visual representation of the uncertainty in CBO’s forecasts of real gross domestic product, see Congressional Budget Office, The Budget and Economic Outlook: 2017 to 2027 (January 2017), Figure 2-11, www.cbo.gov/publication/52370.
Another limitation of this analysis is that the forecast-ers considered here make different assumptions about future changes in fiscal policy, and it can be impossi-ble to isolate those assumptions from each forecaster’s overall economic analysis. CBO is required by statute to assume that future fiscal policy will generally reflect the provisions in current law, an approach that derives from the agency’s responsibility to provide a benchmark for lawmakers as they consider proposed changes in law.13 When the Administration prepares its forecasts, how-ever, it assumes that the fiscal policy in the President’s proposed budget will be adopted. The private forecast-ers included in the Blue Chip survey make their own assumptions about fiscal policy, but the survey does not report them. Forecast errors may be driven by those different assumptions, especially when forecasts are made while policymakers are considering major changes to current fiscal policy.14
A third reason to be cautious when interpreting the results of this forecast evaluation is that the historical values of many of the data series that CBO and other analysts forecast are periodically revised by the agencies that compile those data. BEA and other agencies use var-ious methods and statistical definitions to estimate gross domestic product (GDP) and other economic indicators on the basis of data that they and others collect. Those agencies periodically revise their published estimates of economic indicators for past years as more informa-tion becomes available and as definitions and methods improve. Not all series—the consumer price index (CPI) and interest rates, for example—are revised.
Revisions to historical data can affect the calculations of forecast errors. For example, the RMSE of CBO’s two-year forecasts of the growth of real output is 1.2 per-centage points if calculated using the data that were available immediately after the two-year horizon of each forecast. But the RMSE is 1.3 percentage points if the most recently available data are used in the calculation.
13. For further discussion of why CBO assumes that current laws generally remain in place when preparing its economic forecasts, see Congressional Budget Office, What Is a Current-Law Economic Baseline? (June 2005), www.cbo.gov/publication/16558.
14. Different assumptions about monetary policy can also make it difficult to compare CBO’s forecasts with other forecasts. CBO assumes that monetary policy will reflect the economic conditions that the agency expects to prevail under the fiscal policy specified in current law.

9OCtOBEr 2017 CBO’s ECOnOmiC FOrECasting rECOrd: 2017 UpdatE
Table 1 .
Summary Measures for Two-Year ForecastsPercentage Points
Mean error -0.1 0.2 *Mean absolute error 1.0 1.2 1.1Root mean square error 1.3 1.5 1.4
Mean error 0.2 0.5 0.4Mean absolute error 1.1 1.3 1.1Root mean square error 1.5 1.7 1.5
Mean error 0.2 0.1 0.3Mean absolute error 0.7 0.7 0.8Root mean square error 0.9 0.9 1.0
Mean error -0.1 -0.2 -0.1Mean absolute error 0.3 0.4 0.4Root mean square error 0.4 0.6 0.4
Mean error 0.6 0.2 0.5Mean absolute error 0.9 1.0 1.0Root mean square error 1.3 1.3 1.2
Mean error 0.3 0.1 0.2Mean absolute error 1.0 1.1 1.0Root mean square error 1.2 1.4 1.4
Mean error 0.4 0.2 0.5Mean absolute error 0.7 0.8 0.7Root mean square error 0.7 0.9 0.8
Mean error 0.4 0.7 bMean absolute error 1.3 1.5 bRoot mean square error 1.8 2.0 b
Mean error 0.1 0.1 bMean absolute error 0.4 0.4 bRoot mean square error 0.5 0.5 b
Inflation
Blue ChipConsensusCBO Administration
Growth of Real Output (1980–2014)
Growth of Nominal Output (1980–2014)
Output
Change in Wages and Salaries Measured as a Percentage of Output (1980–2014)
Interest Rates
Wages and Salaries
Inflation in the CPI (1981–2014)
Difference Between Inflation in the CPI and the Output Price Index (1981–2014)
Interest Rate on 3-Month Treasury Bills (1981–2014)
Real Interest Rate on 3-Month Treasury Bills (1981–2014)a
Interest Rate on 10-Year Treasury Notes (1984–2014)
Growth of Wages and Salaries (1980–2014)
Sources: Congressional Budget Office; Office of Management and Budget; Wolters Kluwer, Blue Chip Economic Indicators; Bureau of Economic Analysis; Bureau of Labor Statistics; Federal Reserve.
Forecast errors are projected values minus actual values; thus, a positive error is an overestimate. The mean error is the arithmetic average of the forecast errors. The mean absolute error is the average of the errors with the negative signs removed from the underestimates. The root mean square error is calculated by squaring the forecast errors, averaging those squares, and taking the square root of that average.
Date ranges refer to the years in which the forecasts were made. For details on the data underlying the summary measures presented here, see the appendix.
Output is either GDP or (before 1992) GNP. Real output is nominal output adjusted to remove the effects of inflation.
CPI = consumer price index; GDP = gross domestic product; GNP = gross national product; * = between –0.05 percentage points and zero.
a. The real interest rate is the nominal interest rate deflated by the projected rate of growth in the CPI.
b. The Blue Chip consensus does not include forecasts of wages and salaries.

10 CBO’s ECOnOmiC FOrECasting rECOrd: 2017 UpdatE OCtOBEr 2017
Researchers have found that in some cases, such as when comparing the performance of models over time, it may be more appropriate to use earlier estimates of data than to use the more recent updates.15
Data revisions also make it difficult to identify the source of forecast error. For example, BEA made several downward revisions to estimates of real GDP growth during the 2007–2009 recession (see Figure 3). When CBO prepared its baseline forecast in January 2009, real GDP had reportedly fallen by an annualized rate of 0.5 percent during the third quarter of 2008; however, revised data now show a 1.9 percent drop that quarter. Similarly, the latest revisions show that average annual growth of real GDP was nearly one-half of a percent-age point lower during the recession than BEA initially reported in January 2010. Had CBO and other forecast-ers known the true state of the economy at that time, their projections probably would have been different. It is therefore difficult to identify how much of the forecast error (measured using current data) is due to the fact that forecasters based their projections on contemporary data that has since been revised and how much of the error is attributable to other sources, such as unforeseen eco-nomic developments.
Changes to definitions and methods also affect the comparability of current versions of historical data series with past forecasts. For example, business and govern-ment spending on computer software was once treated as spending for an intermediate good—that is, an input into the production process—and thus did not count as a component of GDP. But in 1999, BEA reclassified such spending as investment. That same year, BEA adopted new methods for calculating the price indexes for various categories of consumption. Largely as a result of those changes, BEA increased its estimates of growth in real GDP for the 1980s and 1990s. In particular, BEA’s estimates of average annual growth in real GDP from 1992 to 1998 rose by 0.4 percentage points, and infla-tion in the GDP price index for those years was revised downward by 0.1 percentage point per year.16 Forecasters
15. See, for example, Tom Stark and Dean Croushore, “Forecasting With a Real-Time Data Set for Macroeconomists,” Journal of Macroeconomics, vol. 24, no. 4 (December 2002), pp. 507–531, https://doi.org/10.1016/S0164-0704(02)00062-9.
16. See Eugene P. Seskin, “Improved Estimates of the National Income and Product Accounts for 1959–98: Results of the Comprehensive Revision,” Survey of Current Business
cannot anticipate such changes when making their pro-jections; they rely on the definitions and methods that exist at the time.
Some Sources of Forecast ErrorForecast errors often stem from the difficulties of antici-pating three key economic developments—turning points in the business cycle, changes in productivity trends, and changes in crude oil prices.
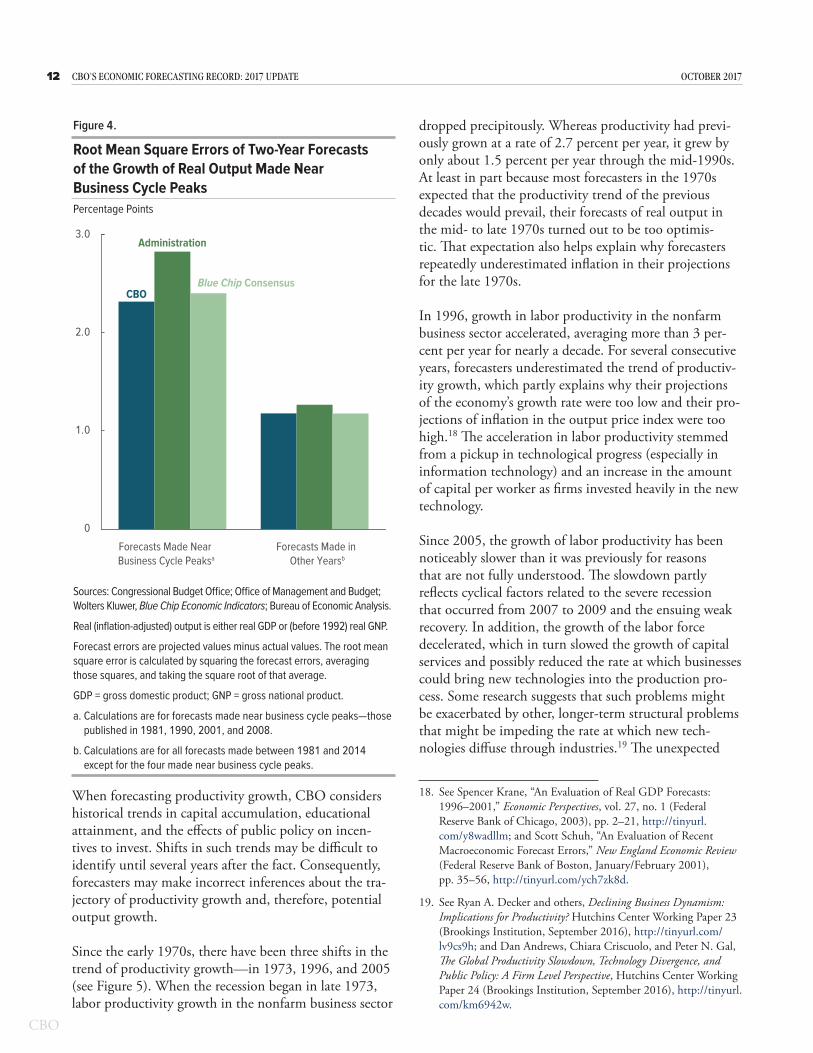
Turning Points in the Business CycleTurning points—peaks and troughs in the business cycle—mark the beginning and end of recessions, which are periods of significant contraction in economic activity. Between 1976 and 2014, the years covered in this evaluation, there were five recessions—in 1980, from 1981 to 1982, from 1990 to 1991, in 2001, and from 2007 to 2009. CBO’s, the Administration’s, and Blue Chip’s forecasts of the growth of real output made around each recession since 1981 were substantially less accurate than those made in other years (see Figure 4).
Forecast errors tend to be large around business cycle peaks for a number of reasons. First, recessions are sometimes prompted by events or shocks that forecasters cannot predict. For example, in August 1990, the Iraqi invasion of Kuwait led to a spike in oil prices and a drop in consumer confidence, which probably contributed to the recession that followed.
Another reason errors in forecasts made near the start of a recession tend to be larger is that economists cannot be sure that a recession has begun until sufficient data are available, typically many months after the fact. For example, the Business Cycle Dating Committee of the National Bureau of Economic Research did not announce the December 2007 business cycle peak until 11 months later. For that reason, forecasters may not account for a recession in their projections even after it has started because they may not yet be aware of it.
Further complicating the forecasting process is that turning points in the business cycle often occur during periods of high uncertainty. For example, in January 2008, one month after the business cycle peak, CBO reported, “The economic outlook this year is particularly vulnerable to uncertainty about the degree to which
(December 1999), pp. 15–43, www.bea.gov/scb/pdf/national/nipa/1999/1299niw.pdf (PDF, 392 KB).

11OCtOBEr 2017 CBO’s ECOnOmiC FOrECasting rECOrd: 2017 UpdatE
Figure 3 .
CBO’s Forecasts and Actual Growth Rates of Real GDPPercentage Change From Previous Year
-6
-4
-2
0
2
4
6
2006 2007 2008 2009 2010 2011 2012 2013 2014
Actual and Forecast Values,
January 2010
Actual Values,Current Estimates
Actual andForecast Values,
January 2009
The Bureau of Economic Analysis made several downward revisions to its estimates of real GDP growth during the 2007–2009 recession (indicated by the vertical bar), making it di�cult to identify the source of forecast error.
Sources: Congressional Budget Office; Bureau of Economic Analysis.
Solid lines represent the estimates of actual values that were available at the time each forecast was prepared. Dashed lines represent forecast values.
Real GDP is nominal GDP adjusted to remove the effects of inflation.
Data are quarterly and are plotted through the fourth quarter of 2014.
GDP = gross domestic product.
the problems in the housing and financial markets will spill over to affect other sectors of the economy. Growth in 2008 could be weaker than CBO expects if the turmoil in the financial markets leads to a more severe economy-wide curtailment of lending than CBO anticipates.”17 Under such uncertain conditions, widely different outcomes can appear equally probable, making it difficult to gauge whether an economic downturn is imminent.
Finally, the nature of business cycles has changed over time. Until the early 1990s, the U.S. economy typically grew rapidly for several quarters after a recession ended. Since then, however, recoveries have been much slower. Failing to anticipate the changing nature of business cycles has been one source of forecast error.
Changes in Productivity TrendsForecasts of productivity growth play a critical role in forecasting potential output, which is an estimate of
17. Congressional Budget Office, The Budget and Economic Outlook: Fiscal Years 2008 to 2018 (January 2008), p. 21, www.cbo.gov/publication/41661.
the maximum sustainable level of production. CBO’s forecast of potential output is a measure of how much the economy can sustainably grow during periods of expansion and determines the trajectory of GDP in the later years of the agency’s 10-year forecasts.
Labor productivity is the average real output per hour of work. Thus, by definition, real output equals labor productivity times the total number of hours worked. The following are some of the sources of growth in labor productivity:
■ Capital accumulation (the change in the amount of equipment, structures, software, and infrastructure in use),
■ Education and skills development (also called investment in human capital), and
■ Innovation (the greater efficiency achieved through better tools, systems, or methods).
12 CBO’s ECOnOmiC FOrECasting rECOrd: 2017 UpdatE OCtOBEr 2017
When forecasting productivity growth, CBO considers historical trends in capital accumulation, educational attainment, and the effects of public policy on incen-tives to invest. Shifts in such trends may be difficult to identify until several years after the fact. Consequently, forecasters may make incorrect inferences about the tra-jectory of productivity growth and, therefore, potential output growth.
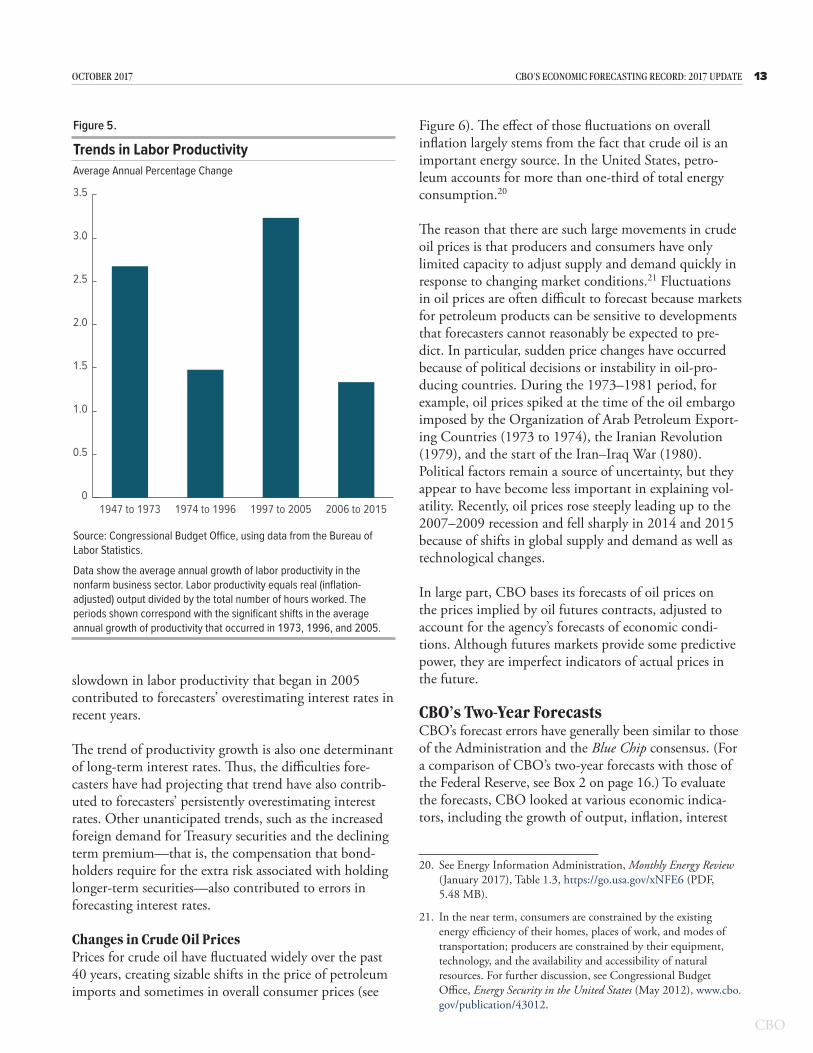
Since the early 1970s, there have been three shifts in the trend of productivity growth—in 1973, 1996, and 2005 (see Figure 5). When the recession began in late 1973, labor productivity growth in the nonfarm business sector
dropped precipitously. Whereas productivity had previ-ously grown at a rate of 2.7 percent per year, it grew by only about 1.5 percent per year through the mid-1990s. At least in part because most forecasters in the 1970s expected that the productivity trend of the previous decades would prevail, their forecasts of real output in the mid- to late 1970s turned out to be too optimis-tic. That expectation also helps explain why forecasters repeatedly underestimated inflation in their projections for the late 1970s.
In 1996, growth in labor productivity in the nonfarm business sector accelerated, averaging more than 3 per-cent per year for nearly a decade. For several consecutive years, forecasters underestimated the trend of productiv-ity growth, which partly explains why their projections of the economy’s growth rate were too low and their pro-jections of inflation in the output price index were too high.18 The acceleration in labor productivity stemmed from a pickup in technological progress (especially in information technology) and an increase in the amount of capital per worker as firms invested heavily in the new technology.
Since 2005, the growth of labor productivity has been noticeably slower than it was previously for reasons that are not fully understood. The slowdown partly reflects cyclical factors related to the severe recession that occurred from 2007 to 2009 and the ensuing weak recovery. In addition, the growth of the labor force decelerated, which in turn slowed the growth of capital services and possibly reduced the rate at which businesses could bring new technologies into the production pro-cess. Some research suggests that such problems might be exacerbated by other, longer-term structural problems that might be impeding the rate at which new tech-nologies diffuse through industries.19 The unexpected
18. See Spencer Krane, “An Evaluation of Real GDP Forecasts: 1996–2001,” Economic Perspectives, vol. 27, no. 1 (Federal Reserve Bank of Chicago, 2003), pp. 2–21, http://tinyurl.com/y8wadllm; and Scott Schuh, “An Evaluation of Recent Macroeconomic Forecast Errors,” New England Economic Review (Federal Reserve Bank of Boston, January/February 2001), pp. 35–56, http://tinyurl.com/ych7zk8d.
19. See Ryan A. Decker and others, Declining Business Dynamism: Implications for Productivity? Hutchins Center Working Paper 23 (Brookings Institution, September 2016), http://tinyurl.com/lv9cs9h; and Dan Andrews, Chiara Criscuolo, and Peter N. Gal, The Global Productivity Slowdown, Technology Divergence, and Public Policy: A Firm Level Perspective, Hutchins Center Working Paper 24 (Brookings Institution, September 2016), http://tinyurl.com/km6942w.
Figure 4 .
Root Mean Square Errors of Two-Year Forecasts of the Growth of Real Output Made Near Business Cycle Peaks Percentage Points
0
1.0
2.0
3.0
Forecasts Made Near Business Cycle Peaksa
Forecasts Made in Other Yearsb
CBO
Administration
Blue Chip Consensus
Sources: Congressional Budget Office; Office of Management and Budget; Wolters Kluwer, Blue Chip Economic Indicators; Bureau of Economic Analysis.
Real (inflation-adjusted) output is either real GDP or (before 1992) real GNP.
Forecast errors are projected values minus actual values. The root mean square error is calculated by squaring the forecast errors, averaging those squares, and taking the square root of that average.
GDP = gross domestic product; GNP = gross national product.
a. Calculations are for forecasts made near business cycle peaks—those published in 1981, 1990, 2001, and 2008.
b. Calculations are for all forecasts made between 1981 and 2014 except for the four made near business cycle peaks.
13OCtOBEr 2017 CBO’s ECOnOmiC FOrECasting rECOrd: 2017 UpdatE
slowdown in labor productivity that began in 2005 contributed to forecasters’ overestimating interest rates in recent years.
The trend of productivity growth is also one determinant of long-term interest rates. Thus, the difficulties fore-casters have had projecting that trend have also contrib-uted to forecasters’ persistently overestimating interest rates. Other unanticipated trends, such as the increased foreign demand for Treasury securities and the declining term premium—that is, the compensation that bond-holders require for the extra risk associated with holding longer-term securities—also contributed to errors in forecasting interest rates.
Changes in Crude Oil PricesPrices for crude oil have fluctuated widely over the past 40 years, creating sizable shifts in the price of petroleum imports and sometimes in overall consumer prices (see
Figure 6). The effect of those fluctuations on overall inflation largely stems from the fact that crude oil is an important energy source. In the United States, petro-leum accounts for more than one-third of total energy consumption.20
The reason that there are such large movements in crude oil prices is that producers and consumers have only limited capacity to adjust supply and demand quickly in response to changing market conditions.21 Fluctuations in oil prices are often difficult to forecast because markets for petroleum products can be sensitive to developments that forecasters cannot reasonably be expected to pre-dict. In particular, sudden price changes have occurred because of political decisions or instability in oil-pro-ducing countries. During the 1973–1981 period, for example, oil prices spiked at the time of the oil embargo imposed by the Organization of Arab Petroleum Export-ing Countries (1973 to 1974), the Iranian Revolution (1979), and the start of the Iran–Iraq War (1980). Political factors remain a source of uncertainty, but they appear to have become less important in explaining vol-atility. Recently, oil prices rose steeply leading up to the 2007–2009 recession and fell sharply in 2014 and 2015 because of shifts in global supply and demand as well as technological changes.
In large part, CBO bases its forecasts of oil prices on the prices implied by oil futures contracts, adjusted to account for the agency’s forecasts of economic condi-tions. Although futures markets provide some predictive power, they are imperfect indicators of actual prices in the future.
CBO’s Two-Year ForecastsCBO’s forecast errors have generally been similar to those of the Administration and the Blue Chip consensus. (For a comparison of CBO’s two-year forecasts with those of the Federal Reserve, see Box 2 on page 16.) To evaluate the forecasts, CBO looked at various economic indica-tors, including the growth of output, inflation, interest
20. See Energy Information Administration, Monthly Energy Review (January 2017), Table 1.3, https://go.usa.gov/xNFE6 (PDF, 5.48 MB).
21. In the near term, consumers are constrained by the existing energy efficiency of their homes, places of work, and modes of transportation; producers are constrained by their equipment, technology, and the availability and accessibility of natural resources. For further discussion, see Congressional Budget Office, Energy Security in the United States (May 2012), www.cbo.gov/publication/43012.
Figure 5 .
Trends in Labor ProductivityAverage Annual Percentage Change
0
0.5
1.0
1.5
2.0
2.5
3.0
3.5
2006 to 20151997 to 20051974 to 19961947 to 1973
Source: Congressional Budget Office, using data from the Bureau of Labor Statistics.
Data show the average annual growth of labor productivity in the nonfarm business sector. Labor productivity equals real (inflation-adjusted) output divided by the total number of hours worked. The periods shown correspond with the significant shifts in the average annual growth of productivity that occurred in 1973, 1996, and 2005.

14 CBO’s ECOnOmiC FOrECasting rECOrd: 2017 UpdatE OCtOBEr 2017
Figure 6 .
Price of Petroleum Imports and Consumer Price Inflation
0
0.4
0.8
1.2
1.6
2.0
-4
0
4
8
12
16
1965 1970 1975 1980 1985 1990 1995 2000 2005 2010 2015
Consumer Price Index With and Without Energy Pricesb
Percentage Change
CPI-U WithoutEnergy Prices
CPI-U
Price of Petroleum Importsa
Index, 2009 = 1
Changes in petroleum prices have been an important source of forecast error for overall inflation over the past 40 years.
Sources: Congressional Budget Office; Bureau of Labor Statistics; Bureau of Economic Analysis.
The vertical bars indicate the duration of recessions, which extend from the peak of a business cycle to its trough.
Data are annual and are plotted through 2015. The first year for which data on the price of petroleum imports are shown is 1967.
CPI-U = consumer price index for all urban consumers.
a. The price of petroleum imports is the price index for petroleum imports divided by the price index for personal consumption expenditures, excluding prices for food and energy.
b. The major components of energy prices in the CPI-U are motor fuel (which is primarily composed of petroleum products), electricity, and natural gas purchased from utilities.
15OCtOBEr 2017 CBO’s ECOnOmiC FOrECasting rECOrd: 2017 UpdatE
rates, and changes in wages and salaries (a significant part of taxable income).22 For most economic indica-tors, all three sets of forecasts exhibited an upward bias (see Figure 1 on page 2). On average, CBO and the Blue Chip consensus slightly underestimated real out-put growth, and the Administration overestimated it. Compared with the Administration’s forecasts, CBO’s forecasts of nominal output growth were less biased, but its forecasts of interest rates were more biased. Measured on the basis of the RMSE, CBO’s two-year forecasts were about as accurate as the Blue Chip consensus (see Figure 2 on page 3). They were also comparable, in terms of accuracy, to the Administration’s forecasts, though for some economic indicators, CBO’s forecasts were slightly more accurate.
CBO’s forecasts of the growth of output (real and nominal) and of inflation show less upward bias than its forecasts of interest rates and of the growth of wages and salaries. However, the output forecasts were less accurate than the forecasts of long-term interest rates, despite the fact that the interest rate forecasts exhibit a sizeable upward bias. Forecaster accuracy is affected by a variety of factors, and indicators are difficult to project for a variety of different reasons. For example, the errors in forecasts of output are particularly sensitive to cyclical movements in the economy, whereas those for inflation are influenced by sudden movements in prices for crude oil.
OutputCBO’s forecasts of real and nominal output growth were similar to the Blue Chip consensus forecasts in terms of both bias and accuracy; although they were similar to the Administration’s forecasts in terms of accuracy, they differed in terms of bias.23 CBO and the Blue Chip con-sensus underestimated real output growth, on average, whereas the Administration tended to overestimate it. All three forecasters overestimated nominal output growth, on average, but the Administration did so to a greater degree. The accuracy of all three sets of forecasts of the growth of real and nominal output was similar.
22. Tables showing the errors of each forecast are available as supplemental material on CBO’s website (www.cbo.gov/publication/53090).
23. Before 1992, CBO, the Administration, and the Blue Chip consensus forecast output as measured by gross national product (GNP); since 1992, they have forecast output as measured by GDP. Unlike the more commonly cited GDP, GNP includes the income that U.S. residents earn abroad and excludes the income that foreigners earn in this country.
Errors in projecting real output growth reveal forecast-ers’ difficulty anticipating turning points in the busi-ness cycle and changing trends in productivity growth. Forecasts of nominal output growth are subject to those same difficulties and are affected by errors in projecting inflation as well.
Growth of Real Output. CBO and the Blue Chip con-sensus tended to underestimate the growth of real out-put, whereas the Administration tended to overestimate it. Nonetheless, the accuracy of all three forecasters was similar. They all tended to significantly overestimate real output around recessions. All three forecasters made their largest forecast errors during the 2007–2009 recession, although CBO did a better job than the other two did of predicting the relative weakness of the recovery that followed (see Figure 7).
Errors in forecasts of real output growth primarily arise from two sources: cyclical movements in the economy and changes in the growth rate of productivity. Cyclical movements are difficult to anticipate, so forecasters typi-cally generate larger errors when the economy is entering a recession. Changes in the trend of productivity growth contribute to persistent misestimates of future real output growth because forecasters are able to detect such changes only well after they have occurred.
In the late 1970s, CBO and the Administration appear to have expected productivity growth to move back toward its earlier post–World War II trend. That expec-tation contributed to their overly optimistic forecasts of the growth of real output. Early in 1980, CBO, the Administration, and the Blue Chip consensus anticipated the coming recession, and consequently, they produced relatively accurate forecasts that year. They did not, however, anticipate that a second recession would follow so soon thereafter. They missed the beginning of the 1981–1982 recession and were unaware of how deep it would be, so the forecasts of real output they made in those two years were too high.
In 1983 and 1984, the economy recovered quickly from the 1981–1982 recession, and real output grew faster than CBO, the Administration, or the Blue Chip consensus expected. In forecasts prepared during the 1983–1989 expansion, CBO and the Blue Chip consen-sus underestimated real output growth by roughly 1 per-centage point per year, on average; the Administration also underestimated real output growth, but by notably

16 CBO’s ECOnOmiC FOrECasting rECOrd: 2017 UpdatE OCtOBEr 2017
Box 2.
Comparison of CBO’s and the Federal Reserve’s Two-Year Forecasts
Errors in Forecasts of the Growth of Real Output
Percentage Points
-3
-2
-1
0
1
2
3
4
FederalReserveaCBO
1976–1977
1981–1982
1986–1987
1991–1992
1996–1997
2001–2002
2006–2007
2011–2012
Sources: Congressional Budget Office; Federal Reserve; Bureau of Labor Statistics; Bureau of Economic Analysis.
The date ranges on the horizontal axis refer to the two-year forecast period; each forecast was issued in the first year of that period. The dots shown on the horizontal axis indicate that the two-year forecast period overlapped a recession by six months or more.
Forecast errors are projected values minus actual values; thus, a positive error is an overestimate. In the left panel, errors are shown for forecasts of the average annual growth rate of real (inflation-adjusted) output over the two-year forecast period. Output is either GDP or (before 1992) GNP. In the right panel, errors are shown for forecasts of the average annual growth rate of consumer prices over the two-year forecast period. The CPI was forecast through 2011; the price index for personal consumption expenditures has been forecast since 2012. For details on the underlying data, see the appendix.
Continued
Like the Administration’s forecasts and the Blue Chip consen-sus, the Federal Reserve’s forecasts provide an informative point of comparison when evaluating the Congressional Budget Office’s forecasts. But the Federal Reserve does not release forecasts of Treasury interest rates or of wages and salaries, nor does it publish any five-year forecasts. Therefore, CBO did not include the Federal Reserve’s forecasts in the principal analysis for this report. The Federal Reserve does, however, publish timely two-year forecasts of real output growth and inflation rates, which can be compared with CBO’s forecasts of those variables.
The Federal Reserve’s forecasts differ from CBO’s forecasts in two ways.1 First, the Federal Reserve’s forecasts include the effects of anticipated changes in fiscal policy, whereas CBO’s
1. For a detailed description of the Federal Reserve’s forecasts, see David Reifschneider and Peter Tulip, Gauging the Uncertainty of the Economic Outlook Using Historical Forecasting Errors: The Federal Reserve’s Approach, Finance and Economics Discussion Series Paper 2017-020 (Board of Governors of the Federal Reserve System, February 2017), https://doi.org/10.17016/FEDS.2017.020 (PDF, 404 KB).
forecasts reflect the assumption that current laws governing fiscal policy will remain generally unchanged. Second, the Federal Reserve’s forecasts published in recent years are modal forecasts—that is, they represent the single most likely outcome for the economy. By contrast, CBO’s fore-casts represent the middle of a range of possible economic outcomes. In periods when the range of possible outcomes is highly skewed, the Federal Reserve’s forecasts will differ from CBO’s. For example, Federal Reserve officials might view the most likely outcome for the economy to be rapid growth, but if there is considerable risk that actual growth might be significantly less than projected, CBO’s forecast—represents the middle of the distribution of possible outcomes—might be for slower growth than the Federal Reserve’s modal forecast.
CBO’s and the Federal Reserve’s two-year forecasts of the growth of real output have, for the most part, been similar (see the figure below). The most notable divergences were in forecasts made in the early 1980s and between 2010 and 2012. Before the 1980 recession, CBO produced a fairly accurate forecast of real output growth, whereas Federal

17OCtOBEr 2017 CBO’s ECOnOmiC FOrECasting rECOrd: 2017 UpdatE
Box 2. Continued
Comparison of CBO’s and the Federal Reserve’s Two-Year Forecasts
Errors in Forecasts of Consumer Price Inflation
Percentage Points
-4
-2
0
2
1976–1977
1981–1982
1986–1987
1991–1992
1996–1997
2001–2002
2006–2007
2011–2012
FederalReservea
CBO
Beginning with 1986 for inflation and 2012 for output, growth rates are based on the quarterly growth rates over the two-year forecast period.
The most recent forecasts included are those published in 2014. The Federal Reserve first published a two-year forecast of real output in 1979 and of consumer prices in 1980.
CPI = consumer price index; GDP = gross domestic product; GNP = gross national product.
a. Forecasts prepared by the staff of the Board of Governors of the Federal Reserve System are reported with a five-year lag and are therefore available only through 2011. For the forecasts made between 2012 and 2014, the shaded area represents the central tendencies of Federal Reserve officials’ forecasts—that is, the range of estimates formed by removing the three highest and three lowest forecasts reported by the members of the Board of Governors and the presidents of the Federal Reserve Banks.
Reserve officials overestimated the depth of the coming recession. However, because CBO failed to anticipate the start of the 1981–1982 recession and, after it had begun, how deep it would be, the agency overestimated growth in real output in its 1981 and 1982 forecasts. Federal Reserve officials more accurately forecast the downturn. In 2010, CBO correctly anticipated that the economic recovery following the 2007–2009 recession would continue to be slow; however, as required by law, the agency assumed that certain tax provisions scheduled to expire would do so and add to fiscal restraint, but those provisions were subsequently extended.2 By contrast, Federal Reserve officials considerably over-estimated growth. The underestimate of output growth in CBO’s 2012 forecast reflects, in part, the extension of certain expiring tax provisions, which significantly reduced the
2. When CBO prepared its forecast in early 2010, several tax provisions were set to expire at the end of the calendar year. Most of those provisions were originally enacted in the Economic Growth and Tax Relief Reconciliation Act of 2001 and the Jobs and Growth Tax Relief Reconciliation Act of 2003.
amount of fiscal restraint below the amount reflected in CBO’s current-law projection. Federal Reserve officials, by contrast, overestimated growth in 2012. In 2013 and 2014, CBO’s and the Federal Reserve’s forecast errors were similar.
In general, CBO and the Federal Reserve also had similar fore-casts of inflation (see the figure below). Forecasts prepared between 2001 and 2005, however, were exceptions. In early 2001, CBO overestimated growth in consumer prices in its two-year forecast, largely because it did not anticipate the 2001 recession. The Federal Reserve’s forecast from that year showed little error. Between 2003 and 2005, both forecast-ers underestimated inflation rates, but the Federal Reserve’s errors were somewhat larger. From 2006 to 2011, the two agencies’ inflation forecasts were once again similar. For fore-casts made between 2012 and 2014, errors in CBO’s estimates of inflation were comparable to the smallest errors produced by the Federal Reserve’s central tendency—that is, the range of estimates formed by removing the three highest and three lowest estimates made by Federal Reserve officials.

18 CBO’s ECOnOmiC FOrECasting rECOrd: 2017 UpdatE OCtOBEr 2017
Figure 7 .
Growth of Real Output: Two-Year Forecasts
-4
-2
0
2
4
6
CBO
Administration
Blue ChipConsensus
Percentage Points
Two-Year Forecast Period
Forecast Error (Forecast Minus Actual)
-2
0
2
4
6
8
Percent
CBO
Actual
Comparison of CBO’s Forecast and Actual Annual Growth
Underestimate
Overestimate
1976–1977
1981–1982
1986–1987
1991–1992
1996–1997
2001–2002
2006–2007
2011–2012
Sources: Congressional Budget Office; Office of Management and Budget; Wolters Kluwer, Blue Chip Economic Indicators; Bureau of Economic Analysis.
The date ranges on the horizontal axis refer to the two-year forecast period; each forecast was issued in the first year of that period. The dots indicate that the two-year forecast period overlapped a recession by six months or more.
Forecast and actual data show the average annual growth rate of real (inflation-adjusted) output over the two-year forecast period. Output is either GDP or (before 1992) GNP.
The most recent forecasts included are those published in 2014. The first two-year Blue Chip consensus forecast of real output was published in 1980.
GDP = gross domestic product; GNP = gross national product.

19OCtOBEr 2017 CBO’s ECOnOmiC FOrECasting rECOrd: 2017 UpdatE
smaller amounts, particularly during the latter half of the decade.
The 1990–1991 recession resulted in the forecasters’ overestimating real output growth in their 1990 fore-casts. Even so, the errors by CBO and the Blue Chip con-sensus that year were actually smaller than the RMSEs for the forecasts made between 1980 and 2014. By contrast, the Administration’s forecast error that year was considerably larger than its RMSE for the whole period.
In every year between 1992 and 1999, all the forecast-ers underestimated two-year growth in real output. The errors were particularly large for the two-year forecasts made between 1996 and 1999. About one-fourth of the magnitude of those errors is attributable to subsequent revisions—including important changes to definitions—that BEA made to the national income and product accounts (NIPAs). Those revisions aside, the significant underestimates made between 1996 and 1999 resulted from forecasters’ failure to anticipate several important economic developments. One such development was the investment boom of the late 1990s, which increased capital stock and thereby boosted labor productivity and real output more than many forecasters had expected.
When preparing their projections in 2001, forecasters did not anticipate the recession that occurred later that year. CBO and the Blue Chip consensus overestimated the growth of real output by similar amounts, and the Administration overestimated it by a slightly larger amount. Following the recession, the economy under-went an unusually slow recovery and weak expansion.
Between 2004 and 2006, all three forecasters’ expecta-tions for real output growth proved to be too optimistic; however, the errors in the Administration’s forecasts and Blue Chip consensus forecasts were smaller than those in the forecasts that CBO made during those years. Perhaps contributing to the overestimates, rising energy prices (unanticipated by many forecasters) dampened the growth of real GDP by roughly a quarter of a percentage point in 2004, by less than half of a percentage point in 2005, and by about a quarter of a percentage point during the first half of 2006.24
In 2007 and 2008, forecasters failed to appreciate the effect of the growing imbalances in the housing and
24. See Congressional Budget Office, The Economic Effects of Recent Increases in Energy Prices (July 2006), p. 6, www.cbo.gov/publication/17984.
financial markets. During the early 2000s, real output growth was partly supported by a boom in residential construction, which was fueled by a growing bubble in house prices. By 2007, a downturn in the housing market was apparent, and tensions in financial markets began to rise. Despite those tensions, in early 2008 fore-casters expected that the U.S. economy would avoid fall-ing into recession. For example, in January 2008, CBO stated, “If a severe credit crunch did occur, it would drive the economy into recession by significantly curb-ing financial activity and consumer spending. However, CBO assumes in its forecast that the Federal Reserve will implement policies to prevent such a crunch and that the financial sector is capable of absorbing most of the losses it faces.”25 Those expectations proved to be incorrect: In 2008, forecasts by CBO, the Administration, and the Blue Chip consensus overestimated real output growth by at least 3¾ percentage points.
Despite the unusually weak recovery from the 2007–2009 recession, the two-year forecasts of real output growth that CBO made from 2009 to 2013 were relatively accurate compared with the Administration’s projections and the Blue Chip consensus forecasts from those years and compared with the agency’s own forecasts made over the entire 1980–2014 period. Whereas the Administration and the Blue Chip consensus consistently overestimated future growth in real output during the recovery, CBO’s projections were relatively close to actual growth, with one notable exception—in 2011, CBO sig-nificantly overestimated real output growth, though even then, it did so by less than the other forecasters.
One source of divergence between CBO’s forecasts and the other forecasts during the years immediately follow-ing the most recent recession was the forecasters’ differ-ent fiscal policy assumptions. In early 2009, contributors to the Blue Chip consensus reported that they expected additional fiscal stimulus, which implied stronger output growth than would be expected under current law.26 CBO’s growth projections were thus tempered by the requirement that its forecasts reflect current law. In the end, fiscal stimulus was weaker than those private fore-casters had predicted—as was the underlying momen-tum in the economy—making CBO’s forecast more
25. See Congressional Budget Office, The Budget and Economic Outlook: Fiscal Years 2008 to 2018 (January 2008), p. 23, www.cbo.gov/publication/41661.
26. See Congressional Budget Office, The Budget and Economic Outlook: Fiscal Years 2009 to 2019 (January 2009), pp. 10–11, www.cbo.gov/publication/41753.

20 CBO’s ECOnOmiC FOrECasting rECOrd: 2017 UpdatE OCtOBEr 2017
accurate than the Blue Chip consensus. When preparing its forecast in 2010, CBO assumed that expiring tax provisions would result in additional fiscal restraint, but those provisions were subsequently extended.27
The forecasts that CBO made in 2012 and 2013 were fairly accurate, especially compared with the Adminis-tration’s, but in 2014, all forecasters overestimated real output growth by a moderate amount.
Growth of Nominal Output. Differences between errors in forecasts of the growth of real and nominal output reflect inaccuracies in projections of inflation in the output price index. (The two indexes that CBO uses to measure inflation are discussed in the next section.) Because all the forecasters overestimated future inflation, their forecasts of nominal output growth exhibit more upward bias, as measured by the mean error, than do their projections of real output growth. All the forecast-ers’ projections of nominal output growth were slightly less accurate than their projections of real output growth (see Figure 8).
During the 1980s and 1990s, CBO, the Administration, and the Blue Chip consensus tended to overestimate inflation, partially offsetting their underestimates of real output growth. Consequently, their forecasts of nominal output growth exhibited less bias over that period than did their forecasts of real output growth.
During much of the 2000s, all the forecasters tended to underestimate inflation rates. Those underestimates generally offset their overestimates of real output growth. However, the forecasts prepared in 2008 were a notable exception. Early that year, all the forecasters expected that a recession would be avoided, and they therefore overestimated both inflation and real output growth. As a result, in that year’s forecasts, estimates of nominal output growth were between 4 percentage points and 5 percentage points too high. Since the recession, CBO has slightly underestimated nominal output, on average, because it has underestimated inflation. By contrast, the Blue Chip consensus and the Administration’s forecasts of
27. At the time, several tax provisions—most of which were originally enacted in the Economic Growth and Tax Relief Reconciliation Act of 2001 and the Jobs and Growth Tax Relief Reconciliation Act of 2003—were due to expire at the end of December 2010. See Congressional Budget Office, The Budget and Economic Outlook: Fiscal Years 2010 to 2020 (January 2010), p. 1, www.cbo.gov/publication/41880.
nominal output have consistently erred on the high side throughout that same period, mostly because the Blue Chip consensus and the Administration anticipated that real output growth would be higher than it was.
InflationInflation is the increase in the average price of a broad basket of goods or services and is measured as the percentage change in a general price index. From 1981 to 2014, inflation forecasts were relatively accurate and exhibited only a small upward bias. But during the unusually volatile period of the late 1970s (before the first full Blue Chip consensus forecast was published), CBO and the Administration substantially underes-timated inflation. Since the mid-1980s, inflation has stabilized, and forecasting accuracy has improved.
CBO’s evaluation of inflation forecasts focuses on two measures: the percentage change in the CPI and the dif-ference between that measure and the percentage change in the price index for output. The CPI measures inflation in the prices of a fixed group of consumer goods and ser-vices.28 The output price index measures the prices of all goods and services that make up GDP (or, before 1992, gross national product [GNP]).
Inflation in the CPI and inflation in the output price index affect federal outlays and revenues differently. All else being equal, higher inflation in the CPI implies faster growth in outlays and slower growth in revenues. Inflation in the CPI increases federal outlays because the index is used to adjust payments to Social Security bene-ficiaries as well as payments made under other programs, such as civil service retirement. Since the mid-1980s, elements of the individual income tax—including the tax brackets—have also been indexed to the CPI, so inflation in the index reduces revenues. By contrast, growth in the output price index, which is closely linked to growth in nominal income subject to federal taxes, implies faster
28. In most of the years examined here, the inflation forecasts are for the CPI-U, which measures inflation in the prices of goods and services consumed by all urban consumers. Some forecasts, however, were for the CPI-W, which measures inflation in the prices of goods and services consumed by urban wage earners and clerical workers. CBO forecast the CPI-W from 1976 to 1978 and again from 1986 to 1989; the Administration forecast the CPI-W through 1991. For the purpose of this evaluation, the distinction between the two measures was most consequential in 1984, when inflation in the CPI-U and CPI-W diverged by 0.9 percentage points.

21OCtOBEr 2017 CBO’s ECOnOmiC FOrECasting rECOrd: 2017 UpdatE
Figure 8 .
Growth of Nominal Output: Two-Year Forecasts
CBO
Administration
Blue ChipConsensus
Percentage PointsForecast Error (Forecast Minus Actual)
-4
-2
0
2
4
6
Percent
CBO
Actual
Comparison of CBO’s Forecast and Actual Annual Growth
Underestimate
Overestimate
-4
0
4
8
12
16
1976–1977
1981–1982
1986–1987
1991–1992
1996–1997
2001–2002
2006–2007
2011–2012
Two-Year Forecast Period
Sources: Congressional Budget Office; Office of Management and Budget; Wolters Kluwer, Blue Chip Economic Indicators; Bureau of Economic Analysis.
The date ranges on the horizontal axis refer to the two-year forecast period; each forecast was issued in the first year of that period. The dots indicate that the two-year forecast period overlapped a recession by six months or more.
Forecast and actual data show the average annual growth rate of nominal output over the two-year forecast period. Output is either GDP or (before 1992) GNP.
The most recent forecasts included are those published in 2014. The first two-year Blue Chip consensus forecast of nominal output was published in 1980.
GDP = gross domestic product; GNP = gross national product.
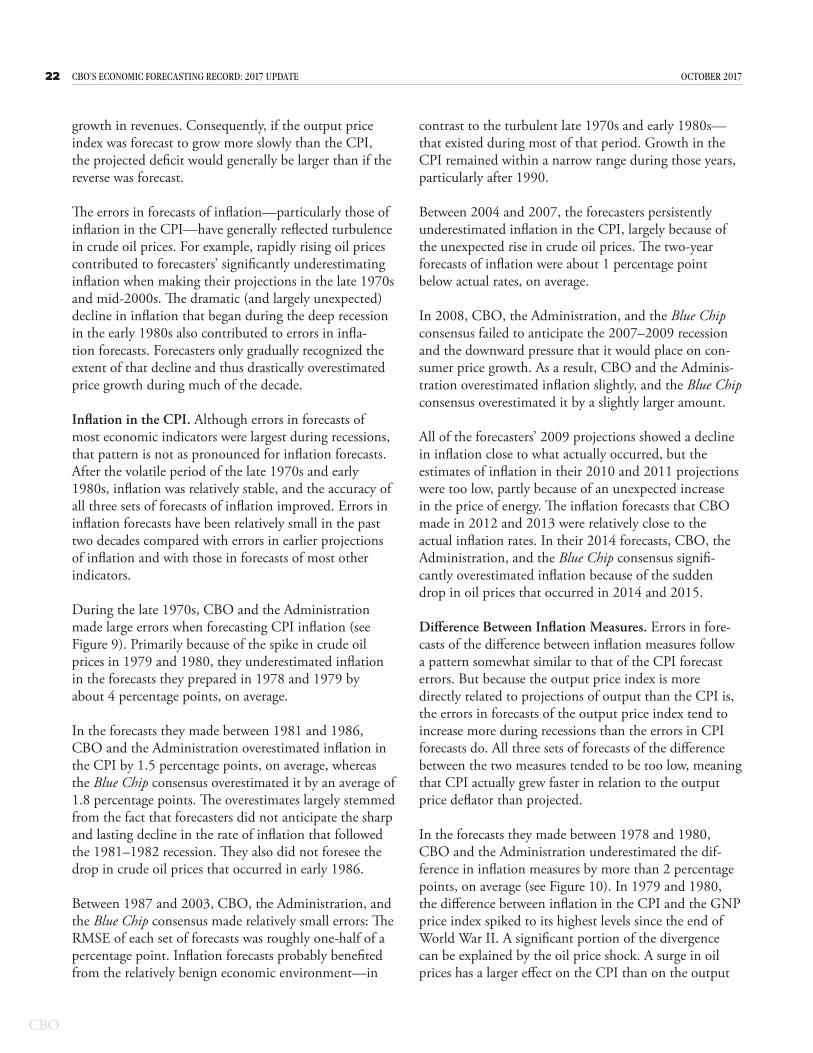
22 CBO’s ECOnOmiC FOrECasting rECOrd: 2017 UpdatE OCtOBEr 2017
growth in revenues. Consequently, if the output price index was forecast to grow more slowly than the CPI, the projected deficit would generally be larger than if the reverse was forecast.
The errors in forecasts of inflation—particularly those of inflation in the CPI—have generally reflected turbulence in crude oil prices. For example, rapidly rising oil prices contributed to forecasters’ significantly underestimating inflation when making their projections in the late 1970s and mid-2000s. The dramatic (and largely unexpected) decline in inflation that began during the deep recession in the early 1980s also contributed to errors in infla-tion forecasts. Forecasters only gradually recognized the extent of that decline and thus drastically overestimated price growth during much of the decade.
Inflation in the CPI. Although errors in forecasts of most economic indicators were largest during recessions, that pattern is not as pronounced for inflation forecasts. After the volatile period of the late 1970s and early 1980s, inflation was relatively stable, and the accuracy of all three sets of forecasts of inflation improved. Errors in inflation forecasts have been relatively small in the past two decades compared with errors in earlier projections of inflation and with those in forecasts of most other indicators.
During the late 1970s, CBO and the Administration made large errors when forecasting CPI inflation (see Figure 9). Primarily because of the spike in crude oil prices in 1979 and 1980, they underestimated inflation in the forecasts they prepared in 1978 and 1979 by about 4 percentage points, on average.
In the forecasts they made between 1981 and 1986, CBO and the Administration overestimated inflation in the CPI by 1.5 percentage points, on average, whereas the Blue Chip consensus overestimated it by an average of 1.8 percentage points. The overestimates largely stemmed from the fact that forecasters did not anticipate the sharp and lasting decline in the rate of inflation that followed the 1981–1982 recession. They also did not foresee the drop in crude oil prices that occurred in early 1986.
Between 1987 and 2003, CBO, the Administration, and the Blue Chip consensus made relatively small errors: The RMSE of each set of forecasts was roughly one-half of a percentage point. Inflation forecasts probably benefited from the relatively benign economic environment—in
contrast to the turbulent late 1970s and early 1980s—that existed during most of that period. Growth in the CPI remained within a narrow range during those years, particularly after 1990.
Between 2004 and 2007, the forecasters persistently underestimated inflation in the CPI, largely because of the unexpected rise in crude oil prices. The two-year forecasts of inflation were about 1 percentage point below actual rates, on average.
In 2008, CBO, the Administration, and the Blue Chip consensus failed to anticipate the 2007–2009 recession and the downward pressure that it would place on con-sumer price growth. As a result, CBO and the Adminis-tration overestimated inflation slightly, and the Blue Chip consensus overestimated it by a slightly larger amount.
All of the forecasters’ 2009 projections showed a decline in inflation close to what actually occurred, but the estimates of inflation in their 2010 and 2011 projections were too low, partly because of an unexpected increase in the price of energy. The inflation forecasts that CBO made in 2012 and 2013 were relatively close to the actual inflation rates. In their 2014 forecasts, CBO, the Administration, and the Blue Chip consensus signifi-cantly overestimated inflation because of the sudden drop in oil prices that occurred in 2014 and 2015.
Difference Between Inflation Measures. Errors in fore-casts of the difference between inflation measures follow a pattern somewhat similar to that of the CPI forecast errors. But because the output price index is more directly related to projections of output than the CPI is, the errors in forecasts of the output price index tend to increase more during recessions than the errors in CPI forecasts do. All three sets of forecasts of the difference between the two measures tended to be too low, meaning that CPI actually grew faster in relation to the output price deflator than projected.
In the forecasts they made between 1978 and 1980, CBO and the Administration underestimated the dif-ference in inflation measures by more than 2 percentage points, on average (see Figure 10). In 1979 and 1980, the difference between inflation in the CPI and the GNP price index spiked to its highest levels since the end of World War II. A significant portion of the divergence can be explained by the oil price shock. A surge in oil prices has a larger effect on the CPI than on the output
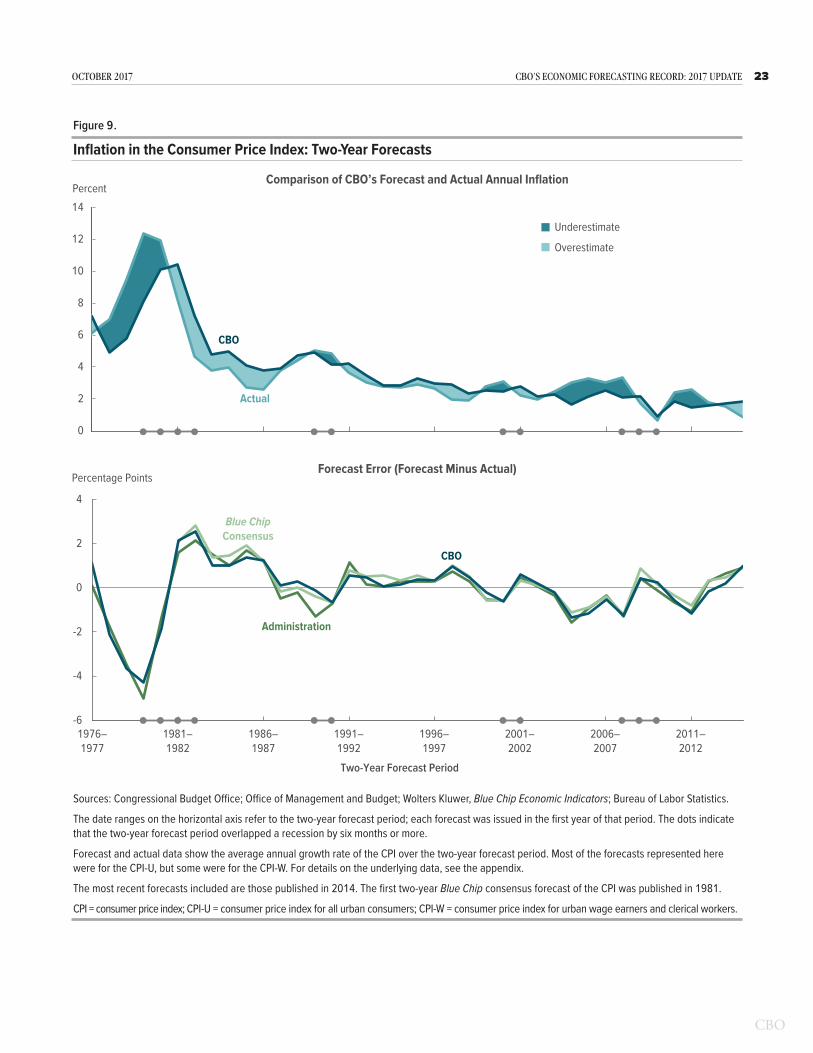
23OCtOBEr 2017 CBO’s ECOnOmiC FOrECasting rECOrd: 2017 UpdatE
Figure 9 .
Inflation in the Consumer Price Index: Two-Year Forecasts
CBO
Administration
Blue ChipConsensus
Percentage PointsForecast Error (Forecast Minus Actual)
-6
-4
-2
0
2
4
Percent
CBO
Actual
Comparison of CBO’s Forecast and Actual Annual Inflation
Underestimate
Overestimate
0
2
4
6
8
10
12
14
1976–1977
1981–1982
1986–1987
1991–1992
1996–1997
2001–2002
2006–2007
2011–2012
Two-Year Forecast Period
Sources: Congressional Budget Office; Office of Management and Budget; Wolters Kluwer, Blue Chip Economic Indicators; Bureau of Labor Statistics.
The date ranges on the horizontal axis refer to the two-year forecast period; each forecast was issued in the first year of that period. The dots indicate that the two-year forecast period overlapped a recession by six months or more.
Forecast and actual data show the average annual growth rate of the CPI over the two-year forecast period. Most of the forecasts represented here were for the CPI-U, but some were for the CPI-W. For details on the underlying data, see the appendix.
The most recent forecasts included are those published in 2014. The first two-year Blue Chip consensus forecast of the CPI was published in 1981.
CPI = consumer price index; CPI-U = consumer price index for all urban consumers; CPI-W = consumer price index for urban wage earners and clerical workers.

24 CBO’s ECOnOmiC FOrECasting rECOrd: 2017 UpdatE OCtOBEr 2017
Figure 10 .
Difference Between Inflation in the CPI and in the Output Price Index: Two-Year Forecasts
CBO
Administration
Percentage PointsForecast Error (Forecast Minus Actual)
-4
-3
-2
-1
0
1
Blue ChipConsensus
Percentage Points
CBO
Actual
Comparison of CBO’s Forecast and Actual Di�erence
Underestimate
Overestimate
-1
0
1
2
3
4
1976–1977
1981–1982
1986–1987
1991–1992
1996–1997
2001–2002
2006–2007
2011–2012
Two-Year Forecast Period
Sources: Congressional Budget Office; Office of Management and Budget; Wolters Kluwer, Blue Chip Economic Indicators; Bureau of Labor Statistics; Bureau of Economic Analysis.
The date ranges on the horizontal axis refer to the two-year forecast period; each forecast was issued in the first year of that period. The dots indicate that the two-year forecast period overlapped a recession by six months or more.
Forecast and actual data show average annual growth in the CPI over the two-year forecast period minus average annual growth in the output price index over that period. In most of the forecasts represented here, the CPI-U was projected, but in some, the CPI-W was forecast. The output price index measures the prices of all goods and services that make up either GDP or (before 1992) GNP. For details on the underlying data, see the appendix.
The most recent forecasts included are those published in 2014. The first two-year Blue Chip consensus forecast of the CPI was published in 1981.
CPI = consumer price index; CPI-U = consumer price index for all urban consumers; CPI-W = consumer price index for urban wage earners and clerical workers; GDP = gross domestic product; GNP = gross national product.

25OCtOBEr 2017 CBO’s ECOnOmiC FOrECasting rECOrd: 2017 UpdatE
price index because petroleum products are a much larger share of households’ out-of-pocket expenditures than of total output in the economy.
Underestimates of the difference between inflation measures in forecasts made before 2000 partly reflect the methodological change to the national income and product accounts that BEA made in 1999. That year the agency began to treat business and government pur-chases of software as investment and thus to include such spending in its calculations of GDP. Because the price of software grew much less rapidly, on average, than other prices, the change in the classification of spend-ing on software resulted in a downward revision to the historical data on the growth in the output price index. Hence, the forecasts made before 2000 were based on a pattern of historical growth in the output price index that was higher than such growth is currently reported to have been. That difference probably accounts for about 0.2 percentage points—or two-fifths—of the apparent bias in forecasts from that period.
In 2000, all three forecasters’ projections of the differ-ence between the inflation measures were very accurate, but between 2001 and 2006, their forecasts were typi-cally too high. Forecasters did not anticipate the large declines in the difference between the measures that occurred in 2001 and 2002. The declines stemmed from two developments—the slowdown in inflation in energy prices and the reduction in inflationary pressures that followed the 2001 recession. Those two developments caused growth in the CPI to slow more than growth in the output price index through 2002. From 2003 to 2006, forecasters continued to overestimate the differ-ence between the measures.
The sharp increase in the difference between the inflation measures in 2008 caught CBO, the Administration, and the Blue Chip consensus by surprise. As a consequence, the absolute values of the errors in their 2007 fore-casts were among the largest of the forecast errors since the late 1970s. Despite the volatility in the difference between measures in 2009 and 2010, forecasts made in those years were fairly accurate. Errors were slightly larger in the next three years’ forecasts, but not notably so. In 2014, CBO and other forecasters failed to antici-pate that the output price index would continue to grow faster than the CPI—an unusual trend that was related to the sudden drop in oil prices in 2014 and 2015.
Interest RatesBetween 1981 and 2014, CBO’s and the Administra-tion’s projections of interest rates, along with the Blue Chip consensus forecasts, were too high, on average. Of the three sets, the Administration’s forecasts were the least biased over the period because large negative errors in the forecasts that it prepared in the late 1980s partly offset positive errors in its forecasts from other periods, particularly the 2000s. Measured by the RMSE, CBO’s interest rate forecasts were about as accurate as those of the Administration and the Blue Chip consensus. The forecasts of interest rates produced by CBO and the Blue Chip consensus have, however, tended to be more biased than their forecasts of other economic indicators. In general, forecasters have been surprised by the persistent decline in interest rates over the past three decades.
CBO’s forecasts of interest rates on Treasury securities underlie its projections of payments on federal debt and other components of the budget. The forecasts evaluated here are for two key rates—a short-term rate (the rate on 3-month Treasury bills) and a long-term rate (the rate on 10-year Treasury notes).29 CBO evaluated forecasts of the interest rate on 3-month Treasury bills in both nominal and real terms. The nominal rate of interest is the rate quoted in the secondary market. The real interest rate equals the nominal rate minus inflation in the CPI. Errors in forecasts of the real interest rate reflect errors in forecasts of both the nominal interest rate and the inflation rate.
For forecasts of the 3-month Treasury bill rate, the largest errors have tended to occur during downturns in the business cycle. Short-term interest rates tend to move down when the economy enters a recession. Just as reces-sions are difficult to anticipate, so too are movements in short-term interest rates. Changes to monetary policy
29. Forecasters have projected different interest rates through the years, so the specific rates used for this evaluation vary slightly in some years. The Administration forecast the rate on newly issued bills through 2000, and the Blue Chip consensus forecast the rate from 1982 to 1985 and from 1992 to 1997. In 1981, the only short-term rate available for the Blue Chip consensus was the 6-month commercial paper rate. CBO did not forecast the rate on 10-year notes in 1984 or 1985, and the Blue Chip consensus did not include forecasts of the rate between 1984 and 1995. However, for the sake of simplicity, this report refers to the rate on 10-year Treasury notes even when discussing those years’ forecasts. Forecasts of the Moody’s Aaa corporate bond rate were used as a substitute for forecasts of the 10-year Treasury note rate in the years when the Treasury rate was not forecast.

26 CBO’s ECOnOmiC FOrECasting rECOrd: 2017 UpdatE OCtOBEr 2017
made in response to recessions are a primary contributor to errors in forecasting short-term interest rates. Typi-cally, when the economy enters a recession, inflation falls and unemployment rises, prompting the Federal Reserve to stimulate demand by lowering short-term interest rates.
The errors in forecasting the 10-year Treasury note rate have tended to be less related to turning points in the business cycle than to the gradual and mostly unantic-ipated decline in long-term interest rates that began in the early 1980s. Several factors have contributed to the decline in long-term interest rates, including slowdowns in labor force and productivity growth and a decline in the term premium.30
In addition, changes in expectations of inflation, stron-ger than anticipated demand for Treasury securities by foreign purchasers, and changes in the amount of federal debt held by the public have contributed to errors in forecasting both short-term and long-term interest rates.
Interest Rate on 3-Month Treasury Bills. Between 1981 and 2014, forecasts of nominal interest rates on 3-month Treasury bills exhibited notable upward bias. CBO and the Blue Chip consensus overestimated nominal interest rates, on average; the Administration did as well, but its forecasts had slightly less of an upward bias. In part, that bias stemmed from forecasters’ tendency to overestimate inflation rates between 1981 and 1998. All three sets of forecasts were comparable in terms of accuracy; the Administration’s forecasts were less biased only because large underestimates in the late 1980s somewhat offset overestimates in other periods. Errors in forecasts of real interest rates follow a pattern similar to that of errors in nominal interest rates, but they are further affected by errors in projecting growth in the CPI. Sometimes the two types of errors worked in opposite directions, mak-ing the forecast of the real interest rate more accurate, and sometimes errors in forecasts of growth in the CPI exacerbated errors in forecasts of the nominal interest rate.
In the forecasts they prepared in 1978 and 1979, both CBO and the Administration underestimated the
30. For more on factors contributing to the decline in long-term interest rates, see Congressional Budget Office, The Budget and Economic Outlook: 2017 to 2027 (January 2017), www.cbo.gov/publication/52370.
nominal interest rate on 3-month Treasury bills by about 2½ percentage points, on average (see Figure 11). Those errors stemmed entirely from the forecasters’ under-estimating inflation rates during that period. In fact, CBO and the Administration overestimated real interest rates by more than 1¼ percentage points, on average, in those years (see Figure 12). Those overestimates may be the result of the forecasters’ overly optimistic projections of real output growth during the period.
During the early 1980s, the Federal Reserve raised interest rates, which contributed to two recessions in close succession and, ultimately, to a sharp and lasting reduction in the rate of inflation. In 1980 and 1981, many forecasters did not fully anticipate that prolonged period of restraint in monetary policy or its impact on price growth. In their 1980 forecasts, CBO and the Administration underestimated both nominal and real interest rates, suggesting that monetary policy proved to be tighter than either expected over the next two years. In 1981, CBO overestimated nominal interest rates, but because it also overestimated inflation, the agency under-estimated real interest rates; the Administration and the Blue Chip consensus underestimated both nominal and real interest rates that year.
Although all three sets of forecasts were less biased during the rest of the 1980s, they exhibited a notable upward bias after 1990, mainly because in the wake of a reces-sion, forecasters tend to underestimate the extent and duration of the easing of monetary policy. In early 1991 and 1992, forecasters expected interest rates to begin rising as the economy recovered from the 1990–1991 recession, but the recovery was unexpectedly weak, and inflation remained low. In response, the Federal Reserve continued to ease monetary policy for several years, pushing down the nominal interest rate on 3-month Treasury bills from nearly 8 percent in the first half of 1990 to 3 percent in 1993. In the forecasts published between 2000 and 2011, CBO, the Administration, and the Blue Chip consensus overestimated real interest rates by more than 1¼ percentage points, on average, and nominal interest rates by slightly less. Some of that bias can be attributed to the 2001 and 2007–2009 recessions and the surprisingly sluggish recoveries that followed them. But some of that bias is due to the largely unantic-ipated persistent downward trend in interest rates.
CBO’s 2012 and 2013 forecasts of negative real interest rates proved to be fairly accurate, but the estimated rate

27OCtOBEr 2017 CBO’s ECOnOmiC FOrECasting rECOrd: 2017 UpdatE
Figure 11 .
Interest Rate on 3-Month Treasury Bills: Two-Year Forecasts
Administration
Percentage PointsForecast Error (Forecast Minus Actual)
Blue ChipConsensus
-4
-2
0
2
4
CBO
PercentComparison of CBO’s Forecast and Actual Interest Rate
CBO
Actual
Underestimate
Overestimate
0
4
8
12
16
1976–1977
1981–1982
1986–1987
1991–1992
1996–1997
2001–2002
2006–2007
2011–2012
Two-Year Forecast Period
Sources: Congressional Budget Office; Office of Management and Budget; Wolters Kluwer, Blue Chip Economic Indicators; Federal Reserve; Bureau of the Public Debt.
The date ranges on the horizontal axis refer to the two-year forecast period; each forecast was issued in the first year of that period. The dots indicate that the two-year forecast period overlapped a recession by six months or more.
Forecast and actual data show the average annual interest rate over the two-year forecast period. Most of the forecasts represented here were for the secondary-market interest rate, but some were for the rate on newly issued bills or for the 6-month commercial paper rate. For details on the underlying data, see the appendix.
The most recent forecasts included are those published in 2014. The first two-year Blue Chip consensus forecast of short-term interest rates was published in 1981.

28 CBO’s ECOnOmiC FOrECasting rECOrd: 2017 UpdatE OCtOBEr 2017
Figure 12 .
Real Interest Rate on 3-Month Treasury Bills: Two-Year Forecasts
Percentage PointsForecast Error (Forecast Minus Actual)
-4
-2
0
2
4
Administration Blue ChipConsensus
CBO
Two-Year Forecast Period
PercentComparison of CBO’s Forecast and Actual Interest Rate
CBO
Actual
Underestimate
Overestimate
-4
-2
0
2
4
6
1976–1977
1981–1982
1986–1987
1991–1992
1996–1997
2001–2002
2006–2007
2011–2012
Sources: Congressional Budget Office; Office of Management and Budget; Wolters Kluwer, Blue Chip Economic Indicators; Bureau of Labor Statistics; Federal Reserve; Bureau of the Public Debt.
The date ranges on the horizontal axis refer to the two-year forecast period; each forecast was issued in the first year of that period. The dots indicate that the two-year forecast period overlapped a recession by six months or more.
Forecast and actual data show the average nominal annual interest rate over the two-year forecast period deflated by the growth in the CPI over that period. Most of the forecasts represented here were for the secondary-market interest rate, but some were for the rate on newly issued bills or for the 6-month commercial paper rate. In most cases, the CPI-U was used as the deflator, but in some, the CPI-W was used. For details on the underlying data, see the appendix.
The most recent forecasts included are those published in 2014. The first two-year Blue Chip consensus forecast of short-term interest rates was published in 1981.
CPI = consumer price index; CPI-U = consumer price index for all urban consumers; CPI-W = consumer price index for urban wage earners and clerical workers.

29OCtOBEr 2017 CBO’s ECOnOmiC FOrECasting rECOrd: 2017 UpdatE
in its 2014 forecast—like the rates in the Administra-tion’s forecast and the Blue Chip consensus that year—was slightly below the actual rate.
Interest Rate on 10-Year Treasury Notes. Between 1984 and 2014, CBO and the Blue Chip consensus tended to overestimate the nominal interest rate on 10-year Treasury notes by similar amounts; the Administration’s forecasts were slightly less biased (see Figure 13). Large negative errors in the forecasts that the Administration made in the late 1980s and early 1990s offset positive errors in the forecasts it prepared during other periods, particularly the 2000s. As measured by the RMSE, all the forecasters had a similar degree of accuracy.
Between 2000 and 2008, CBO, the Administration, and the Blue Chip consensus persistently overestimated the nominal interest rate on 10-year Treasury notes (by 0.7 percentage points, on average). To some extent, those errors were related to the recessions in 2001 and from 2007 to 2009. However, even during the expansion that occurred between the two recessions, long-term interest rates continued to decline because of slow growth in the labor force, a declining term premium, strong foreign demand for Treasury securities, and, toward the end of that period, a slowdown in productivity growth. All three forecasters were largely surprised by the effect of those trends on interest rates.
By 2009, all of the forecasters had revised their expec-tations for interest rates downward. For that reason, the forecasts of the rate for 10-year Treasury notes that they made that year were relatively accurate, deviating from actual interest rates by less than one-quarter of a percentage point.
After the 2007–2009 recession ended, forecasters expected long-term interest rates to rise, but they continued to decline over the next two years, especially in 2011. From 2010 to 2012, CBO overestimated the interest rate on 10-year Treasury notes by 0.8 percent-age points, on average; the Administration and the Blue Chip consensus overestimated that rate by 1.1 percentage points, on average. CBO’s 2013 forecast of long-term interest rates was relatively accurate, but the agency’s 2014 forecast proved too high when, contrary to expec-tations, interest rates stayed low.
Wages and SalariesBetween 1980 and 2014, CBO and the Administra-tion overestimated the growth of wages and salaries, on average. (Because the Blue Chip consensus does not include forecasts of wages and salaries, only CBO’s and the Administration’s forecasts are discussed in this section.) CBO’s forecasts were less biased than those of the Administration, but that is mostly due to bias in the Administration’s forecasts of nominal output growth—both forecasters’ projections of wages and salaries mea-sured as a percentage of output were essentially unbiased. The two forecasters’ accuracy was similar for projections of the growth of wages and salaries and projections of the change in wages and salaries as a percentage of output. Projections of federal revenues depend significantly on forecasts of wages and salaries, which are a major com-ponent of taxable income.31 Errors in forecasts of wages and salaries may result from inaccurate forecasts of these items:
■ Output. Wages and salaries generally grow with overall economic activity and inflation. A forecaster that failed to anticipate a downturn in output growth would probably overestimate growth in wages and salaries as well.
■ The statistical discrepancy between GDP and gross domestic income (GDI, the income earned in the production of GDP). In principle, GDP and GDI should be equal, but in practice, they differ because BEA uses a different set of primary sources to estimate each of them. To project GDI, of which wages and salaries is the largest component, forecasters must also project the statistical discrepancy, which is difficult to do because the discrepancy stems from imperfect methods of data collection and estimation. As a result, unexpected swings in the discrepancy may raise or lower wages and salaries in relation to GDP.
31. In some earlier editions of this report, CBO included an analysis of its forecast of a broader category of taxable income: the sum of wages and salaries and corporate book profits. That sum has been dropped from this analysis because legislative changes to the tax rules governing corporations can affect book profits, and they have increasingly done so, which makes it difficult to identify the economic forecast errors. Wages and salaries are less directly affected by legislation.

30 CBO’s ECOnOmiC FOrECasting rECOrd: 2017 UpdatE OCtOBEr 2017
Figure 13 .
Interest Rate on 10-Year Treasury Notes: Two-Year Forecasts
Percentage PointsForecast Error (Forecast Minus Actual)
Administration
Blue ChipConsensus
CBO
-2
-1
0
1
2
PercentComparison of CBO’s Forecast and Actual Interest Rate
CBO
Actual
Underestimate
Overestimate
0
2
4
6
8
10
12
14
1976–1977
1981–1982
1986–1987
1991–1992
1996–1997
2001–2002
2006–2007
2011–2012
Two-Year Forecast Period
Sources: Congressional Budget Office; Office of Management and Budget; Wolters Kluwer, Blue Chip Economic Indicators; Federal Reserve.
The date ranges on the horizontal axis refer to the two-year forecast period; each forecast was issued in the first year of that period. The dots indicate that the two-year forecast period overlapped a recession by six months or more.
Forecast and actual data show the average annual interest rate over the two-year forecast period. CBO did not forecast the interest rate on 10-year Treasury notes in 1984 or 1985, and the Blue Chip consensus did not include forecasts of the rate from 1984 to 1995. In those cases, the forecaster’s projections of the Moody’s Aaa corporate bond rate were used as a substitute.
Data are for forecasts made between 1984 and 2014.

31OCtOBEr 2017 CBO’s ECOnOmiC FOrECasting rECOrd: 2017 UpdatE
■ Income shares. Income shares refer to the percentage of each type of income in GDI.32 Unexpected shifts in the composition of income may cause sizable errors in forecasts of wages and salaries.
Growth of Wages and Salaries. Between 1980 and 2014, CBO and the Administration slightly overestimated the growth of wages and salaries, on average, and the accu-racy of their forecasts was similar (see Figure 14). The directions of the errors in the forecasts of the growth of wages and salaries followed a pattern similar to those of the errors in forecasts of nominal output, indicating that the errors stemmed in part from errors in projecting the growth of both real output and prices.
Particularly since 2001, CBO and the Administration have tended to overestimate growth in wages and salaries. To some extent, the fact that forecasters did not antic-ipate the 2001 and 2007–2009 recessions accounts for that tendency. In addition, starting in the early 2000s, wages began to grow more slowly than productivity. The unexpected departure from the historically close relation-ship between those two growth rates probably contrib-uted to the overestimates of wage growth since the early 2000s. Both CBO and the Administration also were surprised by the unusually sluggish recovery in wages and salaries relative to output following the two recessions.
Change in Wages and Salaries Measured as a Percentage of Output. To isolate the errors that were unique to the forecasts of wages and salaries, evaluating those fore-casts as a percentage of nominal output is helpful (see Figure 15). Two notable historical patterns emerge from such an analysis:
■ Measured as a percentage of output, wages and salaries typically move in a cyclical pattern, falling during periods of high unemployment and rising when labor markets tighten.
■ Since the early 1970s, wages and salaries have been declining as a percentage of output. In part, that is because employers and employees have substituted untaxed noncash, or fringe, benefits
32. The types of income included in GDI are wages and salaries, domestic economic profits, employee benefits, proprietors’ income, rental income, net interest payments, taxes on production and imports, the surplus of government enterprises, business current transfer payments, and depreciation—all minus subsidies.
(such as employer-paid health insurance premiums and pension contributions) for taxable wages and salaries.33 Other factors, such as technological change and globalization, also appear to have contributed to the decline during the past two decades.34
Two-year forecasts of the average annual change in wages and salaries measured as a percentage of output that were made over the entire 1980–2014 period exhibited a very small upward bias, but both CBO and the Administra-tion overestimated the change in that percentage by a larger amount after 2000.35 Both forecasters had a simi-lar degree of accuracy as measured by the RMSE.
During the first half of the 1980s, wages and salaries fell markedly as a percentage of GNP. CBO and the Admin-istration correctly anticipated that decline, but they over-estimated the magnitude of the reduction in most years.
Following a slight rebound in the mid-1980s, wages and salaries generally declined as a percentage of output through the early 1990s. To some extent, that decline derived from a large increase in the statistical discrepancy between GDP and GDI—the measure of total output grew faster than the measure of total income during those years. The increase in that discrepancy probably explains why CBO and the Administration tended to overestimate wages and salaries as a percentage of output during the period.
In the late 1990s, wages and salaries grew rapidly as a percentage of GDP, and CBO and the Administration significantly underestimated the magnitude of that growth. Three factors probably contributed to the rise in wages and salaries relative to output:
■ The statistical discrepancy between GDP and GDI generally declined during that period because the output measure grew more slowly than the income measure.
33. For more on employers’ contributions to defined-benefit pension plans, see Congressional Budget Office, The Budget and Economic Outlook: An Update (August 2005), Box 2-2, pp. 32–33, www.cbo.gov/publication/17091.
34. See Congressional Budget Office, How CBO Projects Income (July 2013), p. 15, www.cbo.gov/publication/44433.
35. For forecasts made before 1992, wages and salaries were measured as a percentage of GNP; since 1992, they have been measured as a percentage of GDP.

32 CBO’s ECOnOmiC FOrECasting rECOrd: 2017 UpdatE OCtOBEr 2017
Figure 14 .
Growth of Wages and Salaries: Two-Year Forecasts
Percentage PointsForecast Error (Forecast Minus Actual)
CBO
-4
-2
0
2
4
6
8
Administration
PercentComparison of CBO’s Forecast and Actual Annual Growth
CBO
Actual
Underestimate
Overestimate
-2
0
2
4
6
8
10
12
1976–1977
1981–1982
1986–1987
1991–1992
1996–1997
2001–2002
2006–2007
2011–2012
Two-Year Forecast Period
Sources: Congressional Budget Office; Office of Management and Budget; Bureau of Economic Analysis.
The date ranges on the horizontal axis refer to the two-year forecast period; each forecast was issued in the first year of that period. The dots indicate that the two-year forecast period overlapped a recession by six months or more.
Forecast and actual data show the average annual growth rate of wages and salaries over the two-year forecast period.
Data are for forecasts made between 1980 and 2014. The Blue Chip consensus does not include forecasts of wages and salaries.

33OCtOBEr 2017 CBO’s ECOnOmiC FOrECasting rECOrd: 2017 UpdatE
Figure 15 .
Change in Wages and Salaries Measured as a Percentage of Nominal Output: Two-Year Forecasts
-1.0
-0.5
0
0.5
1.0
1.5
2.0
-2.0
-1.5
-1.0
-0.5
0
0.5
1.0
1976–1977
1981–1982
1986–1987
1991–1992
1996–1997
2001–2002
2006–2007
2011–2012
Percent
Percentage Points
Comparison of CBO’s Forecast and Actual Annual Change
CBO
Actual
Underestimate
Overestimate
Forecast Error (Forecast Minus Actual)
CBO
Administration
Two-Year Forecast Period
Sources: Congressional Budget Office; Office of Management and Budget; Bureau of Economic Analysis.
The date ranges on the horizontal axis refer to the two-year forecast period; each forecast was issued in the first year of that period. The dots indicate that the two-year forecast period overlapped a recession by six months or more.
Forecast and actual data show the average annual change in wages and salaries as a percentage of nominal output over the two-year forecast period. Output is either GDP or (before 1992) GNP.
Data are for forecasts made between 1980 and 2014. The Blue Chip consensus does not include forecasts of wages and salaries.
GDP = gross domestic product; GNP = gross national product.

34 CBO’s ECOnOmiC FOrECasting rECOrd: 2017 UpdatE OCtOBEr 2017
■ Although labor compensation has increasingly been paid in the form of nontaxable benefits in the years since World War II, that trend was temporarily reversed in the late 1990s as employers’ contributions to employees’ pension funds and health insurance premiums fell as a share of compensation.36
■ Employee stock options became more prevalent during the 1990s, and gains from exercising stock options count as wage and salary income in the NIPAs. Changes in wages and salaries as a percentage of GDP generally corresponded to movements in the stock market in those years.37
During the first half of the 2000s, forecasters expected wages and salaries measured as a percentage of GDP to either rise or remain roughly unchanged, but instead they fell sharply. In part, the decline resulted from the shift in labor compensation toward nontaxable benefits. The 2001 recession and sluggish recovery in the labor market also contributed to the decline. However, the recession had only modest effects on output growth and the rate of unemployment, so the decline in wages and salaries as a percentage of GDP appears to be unusually large relative to the severity of the recession.
In the forecasts they made between 2008 and 2010, CBO and the Administration underestimated the effects of the severe 2007–2009 recession on wages and salaries relative to GDP. In early 2008, neither forecaster antic-ipated the onset of the recession, which reduced wages and salaries as a percentage of GDP, so both expected that measure to change very little over the following two years. By early 2009, the recession led both forecasters to significantly lower their projections of real output growth; however, they did not anticipate the effects that slower growth would have on wages and salaries relative
36. For information about changes in employers’ contributions to health insurance during the late 1990s, see David Cutler, Employee Costs and the Decline in Health Insurance Coverage, Working Paper 9036 (National Bureau of Economic Research, July 2002), www.nber.org/papers/w9036.
37. See Hamid Mehran and Joseph Tracy, The Impact of Employee Stock Options on the Evolution of Compensation in the 1990s, Working Paper 8353 (National Bureau of Economic Research, July 2001), www.nber.org/papers/w8353; and David Lebow and others, Recent Trends in Compensation Practices, Finance and Economics Discussion Series Paper 1999-32 (Board of Governors of the Federal Reserve System, July 1999), https://go.usa.gov/xNkbV.
to GDP. Toward the end of 2010—in anticipation of tax policy changes scheduled to take effect in 2011 and on the basis of the assumption that fiscal policy would follow current law—CBO overestimated the increase in wages and salaries relative to GDP.38
For the forecasts prepared in 2011 and 2012, CBO’s errors were slightly larger than the Administration’s. In 2011, CBO expected the cyclical rebound in wages and salaries measured as a percentage of GDP to be greater than it actually was, and the next year, it anticipated a slightly larger decline than actually occurred; the Admin-istration’s errors were negligible in both years. In the 2013 and 2014 forecasts, CBO and the Administration underestimated the change in wages and salaries as a percentage of output.
CBO’s Five-Year ForecastsAs with the two-year forecasts, the five-year forecasts made by CBO and the Blue Chip consensus show similar degrees of bias and accuracy, and both sets of forecasts are slightly more accurate than the Administration’s forecasts (see Table 2). Although the patterns of accuracy and bias are similar, the five-year forecasts have some characteristics that are distinct from those of the two-year forecasts:
■ The five-year forecasts rely more heavily on underlying trends in the economy. CBO, for example, does not usually forecast fluctuations in the economy after the first few years of the projection period. Instead, in the agency’s projections, output growth returns to its historical relationship with potential output growth, and other variables move to their estimated long-term values. As a result, errors in five-year forecasts often reveal inaccurate projections of the long-term growth of the economy.
■ The five-year forecasts may be less likely to produce large errors that are attributable to relatively brief or small shifts in economic activity. For example,
38. In early 2009, CBO’s fiscal policy assumptions were consistent with the scheduled expiration of major provisions of the Economic Growth and Tax Relief Reconciliation Act of 2001 and the Jobs and Growth Tax Relief Reconciliation Act of 2003. Those provisions were subsequently extended. The implications for the agency’s baseline forecasts of subsequent legislative changes are discussed in Congressional Budget Office, What Is a Current-Law Economic Baseline? (June 2005), www.cbo.gov/publication/16558.

35OCtOBEr 2017 CBO’s ECOnOmiC FOrECasting rECOrd: 2017 UpdatE
Table 2 .
Summary Measures for Five-Year ForecastsPercentage Points
Mean error 0.2 0.4 0.1Mean absolute error 0.9 1.1 0.9Root mean square error 1.2 1.3 1.1
Mean error 0.8 0.9 0.9Mean absolute error 1.1 1.2 1.1Root mean square error 1.4 1.5 1.4
Mean error 0.2 * 0.4Mean absolute error 0.4 0.5 0.5Root mean square error 0.6 0.6 0.8
Mean error -0.2 -0.3 -0.2Mean absolute error 0.3 0.4 0.4Root mean square error 0.4 0.5 0.4
Mean error 1.2 0.8 1.3Mean absolute error 1.4 1.3 1.5Root mean square error 1.7 1.7 1.8
Mean error 1.0 0.7 0.9Mean absolute error 1.4 1.4 1.3Root mean square error 1.7 1.7 1.6
Mean error 0.8 0.3 0.9Mean absolute error 1.0 1.1 1.0Root mean square error 1.1 1.3 1.1
Mean error 1.0 1.2 bMean absolute error 1.5 1.6 bRoot mean square error 1.8 1.9 b
Mean error 0.1 0.1 bMean absolute error 0.3 0.3 bRoot mean square error 0.3 0.3 b
Change in Wages and Salaries Measured as a Percentage of Output (1980–2011)
Interest Rates
Wages and Salaries
Inflation in the CPI (1983–2011)
Difference Between Inflation in the CPI and the Output Price Index (1983–2011)
Interest Rate on 3-Month Treasury Bills (1983–2011)
Real Interest Rate on 3-Month Treasury Bills (1983–2011)a
Interest Rate on 10-Year Treasury Notes (1984–2011)
Growth of Wages and Salaries (1980–2011)
Inflation
Growth of Real Output (1979–2011)
Growth of Nominal Output (1979–2011)
Blue Chip Consensus
Output
AdministrationCBO
Sources: Congressional Budget Office; Office of Management and Budget; Wolters Kluwer, Blue Chip Economic Indicators; Bureau of Economic Analysis; Bureau of Labor Statistics; Federal Reserve.
Forecast errors are projected values minus actual values; thus, a positive error is an overestimate. The mean error is the arithmetic average of the forecast errors. The mean absolute error is the average of the errors with the negative signs removed from the underestimates. The root mean square error is calculated by squaring the forecast errors, averaging those squares, and taking the square root of that average.
Date ranges refer to the years in which the forecasts were made. For details on the data underlying the summary measures presented here, see the appendix.
Output is either GDP or (before 1992) GNP. Real output is nominal output adjusted to remove the effects of inflation.
CPI = consumer price index; GDP = gross domestic product; GNP = gross national product; * = between zero and 0.05 percentage points.
a. The real interest rate is the nominal interest rate deflated by the projected rate of growth in the CPI.
b. The Blue Chip consensus does not include forecasts of wages and salaries.

36 CBO’s ECOnOmiC FOrECasting rECOrd: 2017 UpdatE OCtOBEr 2017
because CBO did not anticipate that a recession would occur later in the year when it made its forecast in early 2001, the agency overestimated the average two-year growth rate of real output by about 1½ percentage points but overestimated the average five-year growth rate by about one-half of a percentage point.
■ On the other hand, the error in the five-year forecast prepared in a given year can be larger than the error in the two-year forecast made that same year if a recession occurs after the second year of the forecast period. For example, the two-year forecast of real output growth made in 2005 was relatively accurate because it was unaffected by the recession that began at the end of 2007, just after the forecast period ended. The error in the five-year forecast made that year, however, was over three times as high because it included the effects of that recession.
OutputAll the forecasters’ five-year projections of output growth (both real and nominal) exhibited similar bias and accu-racy. Compared with the two-year forecasts, the five-year forecasts had slightly more upward bias but were roughly as accurate.
Growth of Real Output. Errors in forecasting real output growth over five-year periods are generally due to unexpected shifts in the growth rate of productivity. Recessions and cyclical factors tend to have less of an effect on the longer-term forecasts, although the 2007–2009 recession remains a significant source of error in the five-year forecasts.
In the forecasts they made between 1976 and 1979, CBO and the Administration overestimated the five-year aver-age growth rate of real GNP by more than 2 percentage points, on average (see Figure 16). In part, those errors reflect the slowdown in productivity growth that followed the 1973–1975 recession (see Figure 5 on page 13). Because the forecasters did not expect that slowdown, they overestimated the trend in output growth during the late 1970s. When preparing their forecasts in early 1978 and 1979, CBO and the Administration did not anticipate the two recessions that occurred during the early 1980s, which contributed to the errors made in those forecasts.
The five-year forecasts of the growth of real output that CBO, the Administration, and the Blue Chip consensus made during the early 1980s were relatively accurate despite the severe 1981–1982 recession. Real output rebounded very quickly after the recession, so average growth during the recession and the subsequent recov-ery slightly exceeded the growth projected before the recession. As economic conditions stabilized after the turbulent early 1980s, CBO and the Blue Chip consensus made accurate forecasts in the second half of the decade. The Administration, however, slightly overestimated real output growth in those years.
Five-year forecasts of the growth of real GDP made between 1991 and 1999 were too pessimistic. On aver-age, actual growth exceeded all three forecasts’ projec-tions of growth by more than a percentage point. Those errors largely resulted from the investment boom of the late 1990s, which increased the capital stock and thereby boosted labor productivity and potential output. Meth-odological revisions made by BEA in 1999 also contrib-uted to underestimates in forecasts prepared near the end of the period.
In the forecasts they made between 2000 and 2003, CBO, the Administration, and the Blue Chip consensus slightly overestimated the five-year average growth rate of real GDP (by less than one-half of a percentage point, on average). A portion of the errors probably stemmed from overestimates of potential output. For example, in early 2002, CBO projected that potential output would grow at an average annual rate of 3.0 percent over the next five years. However, the agency now estimates that poten-tial output grew at an average rate of 2.4 percent per year between 2002 and 2006. That revision reflects an emerging consensus that productivity growth slowed for structural reasons even before the deep recession started at the end of 2007.39 Because estimates of potential output underpin the medium-term projections, errors in forecasts of potential output carry through to forecasts of other variables.
39. The revisions to CBO’s estimates of potential output reflect updated historical data and analytical methods. For further discussion of the sources of those revisions, see Congressional Budget Office, The Budget and Economic Outlook: 2017 to 2027 (January 2017), pp. 64–65, www.cbo.gov/publication/52370, and Revisions to CBO’s Projection of Potential Output Since 2007 (February 2014), www.cbo.gov/publication/45150.

37OCtOBEr 2017 CBO’s ECOnOmiC FOrECasting rECOrd: 2017 UpdatE
Figure 16 .
Growth of Real Output: Five-Year Forecasts
–3
–2
–1
0
1
2
3
4
0
1
2
3
4
5
6
PercentComparison of CBO’s Forecast and Actual Annual Growth
Underestimate
Overestimate
CBO
Administration
Percentage PointsForecast Error (Forecast Minus Actual)
Blue ChipConsensus
CBO
Actual
1976–1980
1981–1985
1986–1990
1991–1995
1996–2000
2001–2005
2006–2010
2011–2015
Five-Year Forecast Period
Sources: Congressional Budget Office; Office of Management and Budget; Wolters Kluwer, Blue Chip Economic Indicators; Bureau of Economic Analysis.
The date ranges on the horizontal axis refer to the five-year forecast period; each forecast was issued in the first year of that period. The dots indicate that the five-year forecast period overlapped a recession by six months or more.
Forecast and actual data show the average annual growth rate of real (inflation-adjusted) output over the five-year forecast period. Output is either GDP or (before 1992) GNP.
The most recent forecasts included are those published in 2011. The first five-year Blue Chip consensus forecast of real output was published in 1979.
GDP = gross domestic product; GNP = gross national product.

38 CBO’s ECOnOmiC FOrECasting rECOrd: 2017 UpdatE OCtOBEr 2017
The unexpectedly severe and prolonged effects of the 2007–2009 recession account for most of the errors in the five-year forecasts of real GDP growth that were pre-pared from 2004 to 2011. Forecasts made between 2005 and 2008, in particular, were much too optimistic. On average, during that period, CBO’s and the Administra-tion’s forecasts exceeded actual growth by 2.4 percentage points, and the Blue Chip consensus forecast exceeded actual growth by 2.2 percentage points.
In the aftermath of the 2007–2009 recession, forecast errors remained high because of the economy’s unusually slow recovery. Forecasters expected the pace of the recov-ery to quicken as it had following most previous reces-sions. The slowdown in the growth of productivity—which started in the mid-2000s but was not immediately recognized by forecasters—contributed to the sluggish recovery and to forecasters’ continuing to overestimate real output growth in 2010 and 2011. CBO was more accurate than the Administration but less accurate than the Blue Chip consensus in those two years.
Growth of Nominal Output. Differences between fore-cast errors for real and nominal output growth indicate inaccuracies in forecasts of inflation in the output price index.40 For the entire 1979–2011 period covered in this evaluation, all three sets of forecasts overestimated the five-year growth rate of nominal output by more than three-quarters of a percentage point, on average. Overall, errors in forecasts of nominal output tend to be more pronounced around turning points in the economy than errors in forecasts of real output because they depend on forecasts of two cyclical components—real output growth and growth in the output price index.
In the 1980s and 1990s, forecasters’ tendency to over-estimate inflation contributed to overestimates of nomi-nal output growth (see Figure 17). By contrast, between 2000 and 2005 forecasters tended to underestimate inflation rates, which partially offset their overestimates of real output growth. All the forecasters had large errors in the lead-up to the 2007–2009 recession, and they continued to overestimate economic growth during the recovery.
40. As noted above in the discussion of the two-year forecasts, the forecasters projected GNP before 1992 and have projected GDP since then.
InflationIn the five-year forecasts they made between 1983 and 2011, CBO, the Administration, and the Blue Chip consensus slightly overestimated inflation in the CPI and underestimated the difference between inflation in the CPI and the output price index, on average. (The average error in forecasts of inflation in both indexes is positive, but it is larger for forecasts of inflation in the output price index). The RMSE of the inflation forecasts is roughly similar for all forecasters, indicating that they were all about equally accurate.
Inflation in the CPI. By far, the largest errors in five-year forecasts of inflation in the CPI were made during the late 1970s and early 1980s; projections became more accurate as inflation stabilized starting in the mid-1980s (see Figure 18). Between 1976 and 1979, CBO and the Administration underestimated the inflation rate in their five-year forecasts by an average of 3.2 percentage points and 3.9 percentage points, respectively. As the inflation rate fell during and after the 1981–1982 recession, forecasters gradually lowered their five-year estimates. On average, between 1980 and 1984, CBO over-estimated the inflation rate by 2.1 percentage points, and the Administration overestimated it by 1.6 percentage points.
As inflation rates moderated after the early 1980s, errors in the five-year forecasts diminished. Between 1985 and 1999, CBO and the Blue Chip consensus overestimated the inflation rate by about one-half of a percentage point, on average, whereas the Administration over-estimated the rate by a negligible amount. Nevertheless, all three sets of forecasts had the same mean absolute error over the 1985–1999 period.
All the forecasters made only small errors in projecting the five-year average rate of inflation in 2000 and 2001, but they failed to anticipate the rise in that rate after 2001. As a result, they all underestimated inflation sig-nificantly in the forecasts they made from 2002 to 2004.
Errors in forecasts of inflation were generally small from 2005 to 2009. All the forecasters correctly anticipated a fall in inflationary pressures as a result of the 2007–2009 recession and the subsequent slowdown in the growth of output. In 2010, CBO underestimated infla-tion by one-half of a percentage point, but the next year it accurately forecast inflation. The Blue Chip consensus overestimated inflation in both those years, whereas the

39OCtOBEr 2017 CBO’s ECOnOmiC FOrECasting rECOrd: 2017 UpdatE
Figure 17 .
Growth of Nominal Output: Five-Year Forecasts
-2
-1
0
1
2
3
4
2
4
6
8
10
12
14
PercentComparison of CBO’s Forecast and Actual Annual Growth
Underestimate
Overestimate
CBOAdministration
Percentage PointsForecast Error (Forecast Minus Actual)
Blue ChipConsensus
CBO
Actual
1976–1980
1981–1985
1986–1990
1991–1995
1996–2000
2001–2005
2006–2010
2011–2015
Five-Year Forecast Period
Sources: Congressional Budget Office; Office of Management and Budget; Wolters Kluwer, Blue Chip Economic Indicators; Bureau of Economic Analysis.
The date ranges on the horizontal axis refer to the five-year forecast period; each forecast was issued in the first year of that period. The dots indicate that the five-year forecast period overlapped a recession by six months or more.
Forecast and actual data show the average annual growth rate of nominal output over the five-year forecast period. Output is either GDP or (before 1992) GNP.
The most recent forecasts included are those published in 2011. The first five-year Blue Chip consensus forecast of nominal output was published in 1979.
GDP = gross domestic product; GNP = gross national product.
40 CBO’s ECOnOmiC FOrECasting rECOrd: 2017 UpdatE OCtOBEr 2017
Figure 18 .
Inflation in the Consumer Price Index: Five-Year Forecasts
-6
-4
-2
0
2
4
0
2
4
6
8
10
Five-Year Forecast Period
PercentComparison of CBO’s Forecast and Actual Annual Inflation
Underestimate
Overestimate
CBO
Administration
Percentage PointsForecast Error (Forecast Minus Actual)
Blue ChipConsensus
CBO
Actual
1976–1980
1981–1985
1986–1990
1991–1995
1996–2000
2001–2005
2006–2010
2011–2015
Sources: Congressional Budget Office; Office of Management and Budget; Wolters Kluwer, Blue Chip Economic Indicators; Bureau of Labor Statistics.
The date ranges on the horizontal axis refer to the five-year forecast period; each forecast was issued in the first year of that period. The dots indicate that the five-year forecast period overlapped a recession by six months or more.
Forecast and actual data show the average annual growth rate of the CPI over the five-year forecast period. Most of the forecasts represented here were for the CPI-U, but some were for the CPI-W. For details on the underlying data, see the appendix.
The most recent forecasts included are those published in 2011. The first five-year Blue Chip consensus forecast of the CPI was published in 1983.
CPI = consumer price index; CPI-U = consumer price index for all urban consumers; CPI-W = consumer price index for urban wage earners and clerical workers.
41OCtOBEr 2017 CBO’s ECOnOmiC FOrECasting rECOrd: 2017 UpdatE
Administration made fairly accurate forecasts. Compared with their two-year forecasts from the same period, all of the forecasters’ five-year projections of inflation made from 2005 to 2011 were more accurate.
Difference Between Inflation Measures. In the forecasts they prepared between 1976 and 1980, CBO and the Administration underestimated the difference between the five-year average inflation rates measured by the CPI and the output price index by 1.4 percentage points, on average (see Figure 19). The widening of the gap between the two inflation rates was mostly due to the increase in the price of oil in 1979. Between 1983 and 1998, CBO, the Administration, and the Blue Chip consensus consistently underestimated the difference between the inflation rates—CBO, by an average of 0.4 percentage points; the Administration, by an average of 0.6 percent-age points; and the Blue Chip consensus, by an average of 0.5 percentage points. In each of those cases, about 0.2 percentage points of the bias resulted from down-ward revisions to inflation in the GDP price index that were made following the comprehensive revision to the NIPAs in 1999.
When preparing their projections between 2000 and 2003, none of the forecasters anticipated that the differ-ence between the two inflation measures would decline significantly. They all moderately overestimated the difference in those years.
After 2003, forecast errors were generally small. On the whole, CBO made slightly more accurate forecasts during the 2007–2009 recession than the Administra-tion or the Blue Chip consensus did. In 2010 and 2011, all the forecasters slightly overestimated the difference between inflation measures.
Interest RatesBetween 1984 and 2011, CBO, the Administration, and the Blue Chip consensus tended to overestimate interest rates on 3-month Treasury bills and 10-year Treasury notes. Five-year forecasts of interest rates exhibited roughly twice as much upward bias as the comparable two-year forecasts and were less accurate than those forecasts as well. That is primarily because interest rates, particularly long-term rates, have declined more per-sistently since the early 1980s than they were expected to and they have not returned to the levels reached in the 1970s and 1980s.
Like those in the agency’s two-year forecasts, the errors in CBO’s five-year forecasts of short-term interest rates were largest around recessions. Errors tend to occur then partly because the demand for borrowing typically falls during recessions, which causes short-term interest rates to decline, and partly because the Federal Reserve gener-ally responds to recessions by acting to reduce short-term interest rates.
CBO’s tendency to overestimate long-term interest rates over five-year periods is less related to recessions than it is to the largely unanticipated decline in long-term interest rates that began in the early 1980s. CBO overestimated long-term interest rates in most years between 1984 and 2011 because it made those forecasts using models that were based on the assumption that interest rates would move back toward their historical levels. Unexpected trends, such as growing foreign demand for Treasury securities and the declining term premium, as well as factors that affect the long-term growth rates of output, such as the size of the labor force and productivity, add to the uncertainty of the five-year forecasts of interest rates.
Interest Rate on 3-Month Treasury Bills. On aver-age, between 1983 and 2011, CBO and the Blue Chip consensus overestimated nominal interest rates by about 1¼ percentage points, whereas the Administration over-estimated them by three-quarters of a percentage point. The Administration’s smaller mean error was mostly a consequence of the offsetting effect of larger under-estimates rather than of more accurate forecasts overall.
Forecasts of nominal interest rates prepared between 1983 and 2011 were not very accurate (see Figure 20). Forecasts of real interest rates were slightly less biased than the forecasts of nominal interest rates, but they had a similar degree of accuracy (see Figure 21). The differ-ence between errors in projections of nominal and real interest rates stems from errors in projecting inflation. That difference was substantial during the late 1970s and early 1980s but became less pronounced as inflation stabilized.
From 1976 to 1980, CBO and the Administration underestimated nominal interest rates mainly because of surprisingly high inflation during those years. Over-estimates of the real interest rate in the forecasts from the first two of those years improved the accuracy of the nominal rate projections, whereas underestimates of the

42 CBO’s ECOnOmiC FOrECasting rECOrd: 2017 UpdatE OCtOBEr 2017
Figure 19 .
Difference Between Inflation in the CPI and in the Output Price Index: Five-Year Forecasts
-2.5
-2.0
-1.5
-1.0
-0.5
0
0.5
-0.4
0
0.4
0.8
1.2
1.6
2.0
Five-Year Forecast Period
Percentage PointsComparison of CBO’s Forecast and Actual Di�erence
Underestimate
Overestimate
CBO
Administration
Percentage PointsForecast Error (Forecast Minus Actual)
Blue ChipConsensus
CBOActual
1976–1980
1981–1985
1986–1990
1991–1995
1996–2000
2001–2005
2006–2010
2011–2015
Sources: Congressional Budget Office; Office of Management and Budget; Wolters Kluwer, Blue Chip Economic Indicators; Bureau of Labor Statistics; Bureau of Economic Analysis.
The date ranges on the horizontal axis refer to the five-year forecast period; each forecast was issued in the first year of that period. The dots indicate that the five-year forecast period overlapped a recession by six months or more.
Forecast and actual data show average annual growth in the CPI over the five-year forecast period minus average annual growth in the output price index over that period. In most of the forecasts represented here, the CPI-U was forecast, but in some, the CPI-W was forecast. The output price index measures the prices of all goods and services that make up either GDP or (before 1992) GNP. For details on the underlying data, see the appendix.
The most recent forecasts included are those published in 2011. The first five-year Blue Chip consensus forecast of the CPI was published in 1983.
CPI = consumer price index; CPI-U = consumer price index for all urban consumers; CPI-W = consumer price index for urban wage earners and clerical workers; GDP = gross domestic product; GNP = gross national product.

43OCtOBEr 2017 CBO’s ECOnOmiC FOrECasting rECOrd: 2017 UpdatE
Figure 20 .
Interest Rate on 3-Month Treasury Bills: Five-Year Forecasts
Five-Year Forecast Period
-6
-4
-2
0
2
4
0
2
4
6
8
10
12
PercentComparison of CBO’s Forecast and Actual Interest Rate
Underestimate
Overestimate
CBO
Administration
Percentage PointsForecast Error (Forecast Minus Actual)
Blue ChipConsensus
CBO
Actual
1976–1980
1981–1985
1986–1990
1991–1995
1996–2000
2001–2005
2006–2010
2011–2015
Sources: Congressional Budget Office; Office of Management and Budget; Wolters Kluwer, Blue Chip Economic Indicators; Federal Reserve; Bureau of the Public Debt.
The date ranges on the horizontal axis refer to the five-year forecast period; each forecast was issued in the first year of that period. The dots indicate that the five-year forecast period overlapped a recession by six months or more.
Forecast and actual data show the average annual interest rate over the five-year forecast period. Most of the forecasts represented here were for the secondary-market interest rate, but some were for the rate on newly issued bills or for the 6-month commercial paper rate. For details on the underlying data, see the appendix.
The most recent forecasts included are those published in 2011. The first five-year Blue Chip consensus forecast for short-term rates was published in 1983.

44 CBO’s ECOnOmiC FOrECasting rECOrd: 2017 UpdatE OCtOBEr 2017
Figure 21 .
Real Interest Rate on 3-Month Treasury Bills: Five-Year Forecasts
-4
-2
0
2
4
-2
-1
0
1
2
3
4
5
Five-Year Forecast Period
PercentComparison of CBO’s Forecast and Actual Interest Rate
Underestimate
Overestimate
CBO
Administration
Percentage PointsForecast Error (Forecast Minus Actual)
Blue ChipConsensus
CBO
Actual
1976–1980
1981–1985
1986–1990
1991–1995
1996–2000
2001–2005
2006–2010
2011–2015
Sources: Congressional Budget Office; Office of Management and Budget; Wolters Kluwer, Blue Chip Economic Indicators; Bureau of Labor Statistics; Federal Reserve; Bureau of the Public Debt.
The date ranges on the horizontal axis refer to the five-year forecast period; each forecast was issued in the first year of that period. The dots indicate that the five-year forecast period overlapped a recession by six months or more.
Forecast and actual data show the average nominal annual interest rate over the five-year forecast period deflated by the growth in the CPI over that period. Most of the forecasts represented here were for the secondary-market interest rate, but some were for the rate on newly issued bills or for the 6-month commercial paper rate. In most cases, the CPI-U was used as the deflator, but in some, the CPI-W was used. For details on the underlying data, see the appendix.
The most recent forecasts included are those published in 2011. The first five-year Blue Chip consensus forecast for short-term interest rates was published in 1983.
CPI = consumer price index; CPI-U = consumer price index for all urban consumers; CPI-W = consumer price index for urban wage earners and clerical workers.

45OCtOBEr 2017 CBO’s ECOnOmiC FOrECasting rECOrd: 2017 UpdatE
real interest rate in the 1979 and 1980 forecasts contrib-uted to the errors in projections of the nominal rate.
CBO generally overestimated short-term nominal inter-est rates in its forecasts from 1981 to 1992, particularly in those it made around the 1990 recession. Notably, the Administration forecast significantly lower nominal interest rates over that period, resulting in underestimates of those rates that were larger than the other forecasters’ through the 1980s but in overestimates that were smaller than the others’ in the early 1990s.
Errors in projections of interest rates were relatively small between 1993 and 1997 for all forecasters, but they started rising again in the late 1990s. During the 2001 and 2007–2009 recessions, errors increased dramatically, partly because the forecasters failed to anticipate the recessions and the subsequent drop in interest rates and partly because rates remained unusually low during the recovery from both recessions. Over the past 15 years, all the forecasters have made fairly accurate projections of inflation, so nominal and real interest rate errors have tracked each other closely. The one notable excep-tion to that pattern was the period from 2003 to 2005, when underestimates of inflation led to more accurate projections of nominal interest rates for all three sets of forecasts.
In the wake of the 2007–2009 recession, unusually accommodative monetary policy reduced short-term interest rates to near zero. Forecasters did not anticipate that shift, which led them to overestimate both nominal and real interest rates. In addition to monetary policy, low foreign interest rates and concerns about foreign growth led to an increase in demand for Treasury securi-ties that CBO and other forecasters did not foresee in the years after the recession. Forecasters also failed to antic-ipate the persistence of the downward trend in interest rates.
Interest Rate on 10-Year Treasury Notes. Between 1984 and 2011, CBO and the Blue Chip consensus over-estimated the nominal interest rates on 10-year Treasury notes, on average. The Administration also overestimated the nominal interest rate on 10-year Treasury notes, on average, but only by about one-third as much as CBO and the Blue Chip consensus did. That lower mean error partly reflects the fact that the Administration under-estimated the long-term interest rates in the early years of the period, and those underestimates offset the large
overestimates it made later (see Figure 22). As measured by the RMSE, the accuracy of all three forecasts was similar.
Forecasters have consistently overestimated interest rates since the early 2000s. The mean errors of forecasts prepared since then were roughly three times larger than mean errors of forecasts made between 1984 and 1999. The unusually slow recoveries from the 2001 and 2007–2009 recessions contributed to the recent increase in forecast error—forecasters continued to overestimate interest rates on 10-year Treasury notes long after the recessions had ended.
Several factors in addition to those slow recoveries account for CBO’s and other forecasters’ persistently overestimating interest rates since the mid-2000s. The rate of growth in productivity—which is an important determinant of interest rates—has been lower than CBO and other forecasters expected. Additionally, low foreign interest rates, heightened concern about global growth, and increased demand (by both foreign and domestic investors) for Treasury securities as a hedge against possi-ble adverse economic outcomes have further contributed to low interest rates, especially since 2009, when the most recent recession ended. The Federal Reserve’s policy of quantitative easing—that is, the direct purchase of long-term Treasury securities, mortgage-backed securi-ties, and agency debt—also contributed to the unusually low long-term interest rates since 2009. Additionally, forecasters failed to anticipate the persistence of the long-term downward trend in interest rates.
Wages and SalariesIn their forecasts made between 1980 and 2011, CBO and the Administration tended to overestimate the growth of wages and salaries as well as the change in wages and salaries measured as a percentage of output. Forecast errors varied widely over time, however, and included substantial underestimates by both CBO and the Administration between 1995 and 1997.
Growth of Wages and Salaries. Between 1980 and 2011, CBO’s and the Administration’s forecasts of the five-year average growth rate of wages and salaries exhibited notable upward bias and similar degrees of accuracy (see Figure 23). Compared with the two-year forecasts, they had slightly more upward bias but were nevertheless just as accurate. Like those in the two-year forecasts, the
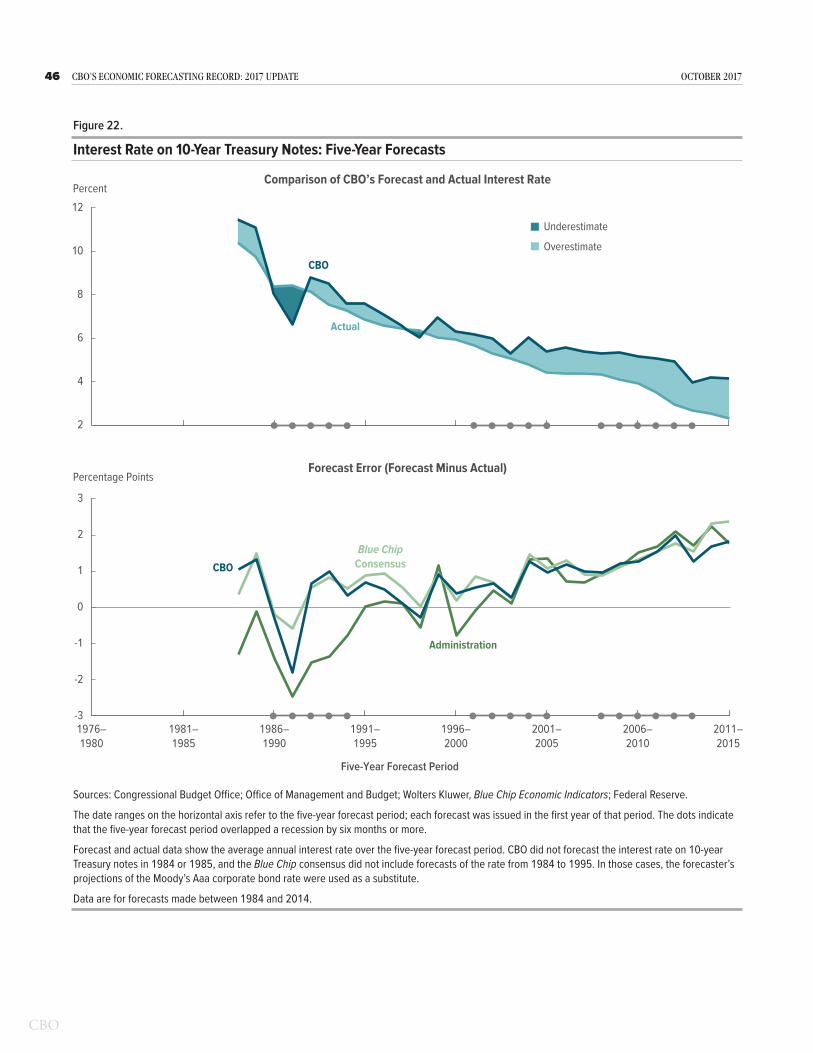
46 CBO’s ECOnOmiC FOrECasting rECOrd: 2017 UpdatE OCtOBEr 2017
Figure 22 .
Interest Rate on 10-Year Treasury Notes: Five-Year Forecasts
-3
-2
-1
0
1
2
3
2
4
6
8
10
12
Five-Year Forecast Period
PercentComparison of CBO’s Forecast and Actual Interest Rate
Underestimate
Overestimate
CBO
Administration
Percentage PointsForecast Error (Forecast Minus Actual)
Blue ChipConsensus
CBO
Actual
1976–1980
1981–1985
1986–1990
1991–1995
1996–2000
2001–2005
2006–2010
2011–2015
Sources: Congressional Budget Office; Office of Management and Budget; Wolters Kluwer, Blue Chip Economic Indicators; Federal Reserve.
The date ranges on the horizontal axis refer to the five-year forecast period; each forecast was issued in the first year of that period. The dots indicate that the five-year forecast period overlapped a recession by six months or more.
Forecast and actual data show the average annual interest rate over the five-year forecast period. CBO did not forecast the interest rate on 10-year Treasury notes in 1984 or 1985, and the Blue Chip consensus did not include forecasts of the rate from 1984 to 1995. In those cases, the forecaster’s projections of the Moody’s Aaa corporate bond rate were used as a substitute.
Data are for forecasts made between 1984 and 2014.
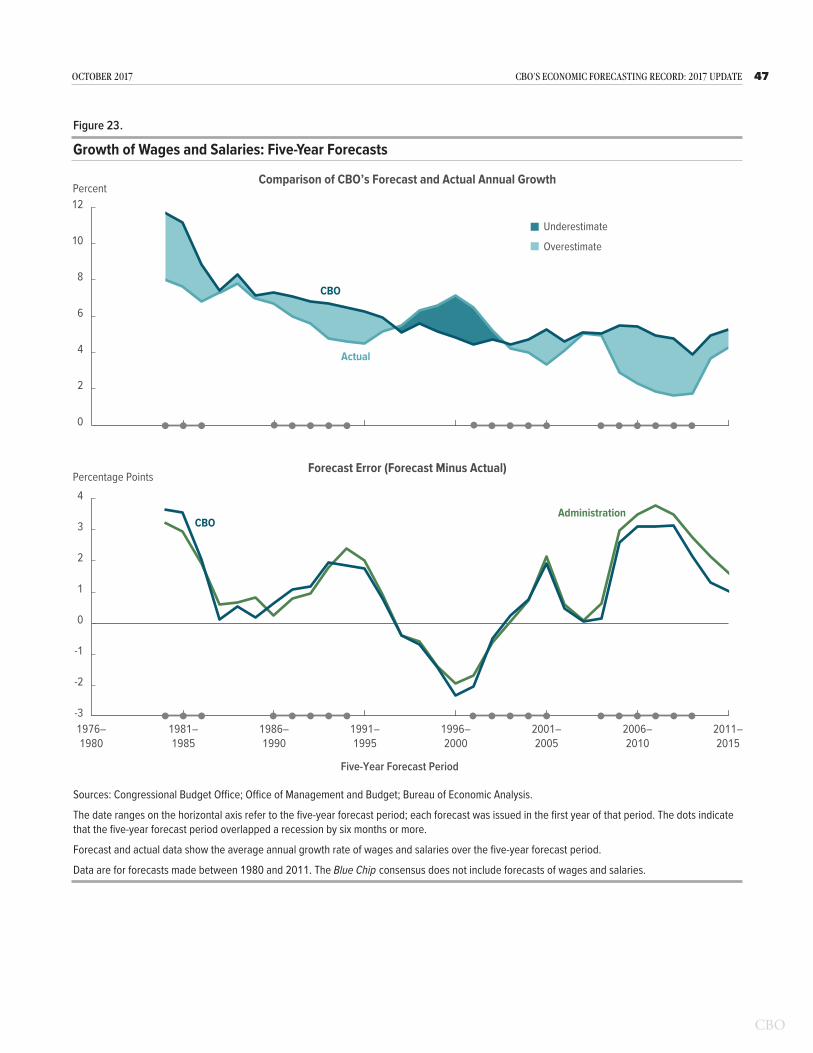
47OCtOBEr 2017 CBO’s ECOnOmiC FOrECasting rECOrd: 2017 UpdatE
Figure 23 .
Growth of Wages and Salaries: Five-Year Forecasts
-3
-2
-1
0
1
2
3
4
0
2
4
6
8
10
12
Five-Year Forecast Period
PercentComparison of CBO’s Forecast and Actual Annual Growth
Underestimate
Overestimate
CBOAdministration
Percentage PointsForecast Error (Forecast Minus Actual)
CBO
Actual
1976–1980
1981–1985
1986–1990
1991–1995
1996–2000
2001–2005
2006–2010
2011–2015
Sources: Congressional Budget Office; Office of Management and Budget; Bureau of Economic Analysis.
The date ranges on the horizontal axis refer to the five-year forecast period; each forecast was issued in the first year of that period. The dots indicate that the five-year forecast period overlapped a recession by six months or more.
Forecast and actual data show the average annual growth rate of wages and salaries over the five-year forecast period.
Data are for forecasts made between 1980 and 2011. The Blue Chip consensus does not include forecasts of wages and salaries.
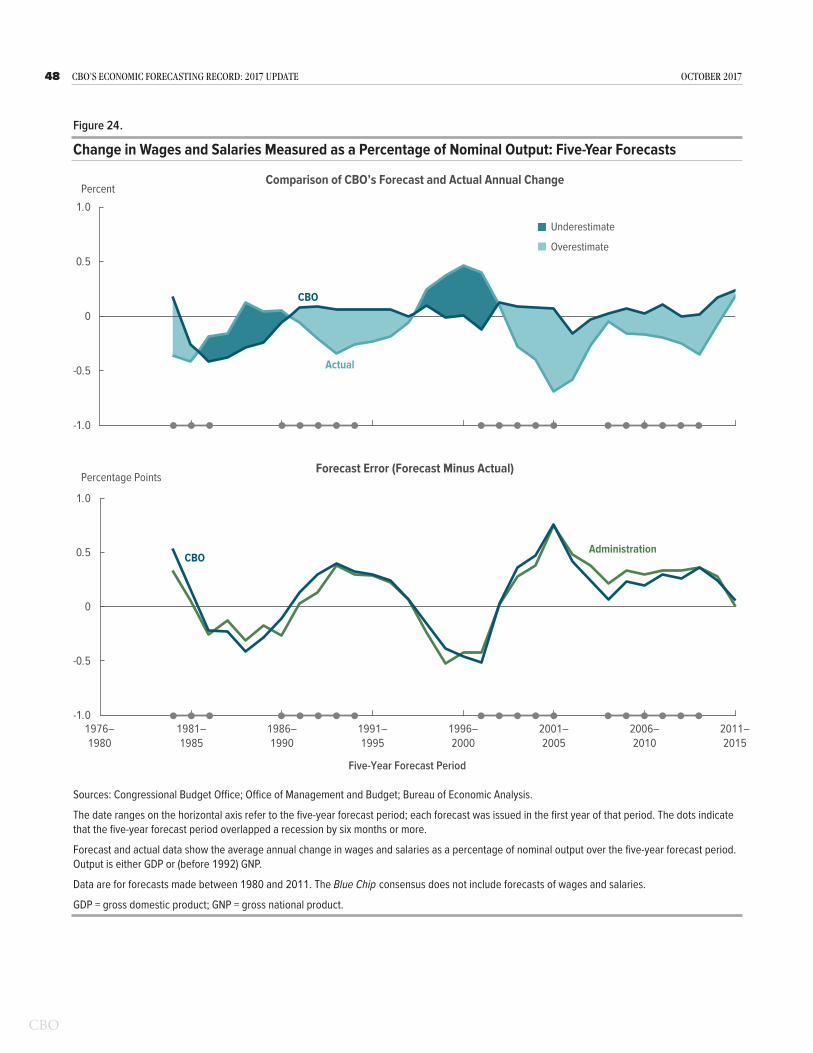
48 CBO’s ECOnOmiC FOrECasting rECOrd: 2017 UpdatE OCtOBEr 2017
Figure 24 .
Change in Wages and Salaries Measured as a Percentage of Nominal Output: Five-Year Forecasts
-1.0
-0.5
0
0.5
1.0
-1.0
-0.5
0
0.5
1.0Percent
Comparison of CBO’s Forecast and Actual Annual Change
Underestimate
Overestimate
CBOAdministration
Percentage PointsForecast Error (Forecast Minus Actual)
CBO
Actual
1976–1980
1981–1985
1986–1990
1991–1995
1996–2000
2001–2005
2006–2010
2011–2015
Five-Year Forecast Period
Sources: Congressional Budget Office; Office of Management and Budget; Bureau of Economic Analysis.
The date ranges on the horizontal axis refer to the five-year forecast period; each forecast was issued in the first year of that period. The dots indicate that the five-year forecast period overlapped a recession by six months or more.
Forecast and actual data show the average annual change in wages and salaries as a percentage of nominal output over the five-year forecast period. Output is either GDP or (before 1992) GNP.
Data are for forecasts made between 1980 and 2011. The Blue Chip consensus does not include forecasts of wages and salaries.
GDP = gross domestic product; GNP = gross national product.

49OCtOBEr 2017 CBO’s ECOnOmiC FOrECasting rECOrd: 2017 UpdatE
errors in the five-year forecasts of the growth of wages and salaries followed a cyclical pattern.
Change in Wages and Salaries Measured as a Percentage of Output. Between 1980 and 2011, CBO’s and the Administration’s forecasts of changes in wages and salaries measured as a percentage of output exceeded the actual changes by the same average amount (see Figure 24). Errors in forecasting the change in wages and salaries measured as a percentage of output were related to unex-pected trends in the economy.
From 1982 to 1986, CBO and the Administration underestimated the change in wages and salaries mea-sured as a percentage of output in their five-year projec-tions. They may have overestimated the depth and dura-tion of the cyclical decline in labor compensation relative to output following the 1980 and 1981–1982 recessions. Another possibility is that the forecasters overestimated the extent to which labor compensation would shift away from wages to nontaxable benefits.
In the five-year forecasts they made between 1987 and 1993, CBO and the Administration estimated only small changes in wages and salaries measured as a percentage of output, but the actual percentage declined significantly over the years covered by those forecasts. The 1990 reces-sion probably contributed to that unexpected decline.
From 1994 to 1997, CBO and the Administration forecast relatively small changes in wages and salaries measured as a percentage of output over each five-year projection period, but the actual changes exceeded the forecasters’ estimates. As with the two-year forecasts, the following three factors probably contributed to the increase during those years:
■ Measures of income grew more quickly than GDP;
■ Labor compensation temporarily shifted away from nontaxable benefits to wages; and
■ Employee stock options became more prevalent, and the value of the stock market rose.
In almost all the forecasts they made between 1999 and 2010, CBO and the Administration projected that in relation to GDP, wages and salaries would either remain roughly flat or rise slightly over the five-year horizon. However, the average five-year change in wages and salaries measured as a percentage of GDP was negative during the 2000s, particularly in the wake of the 2001 and 2007–2009 recessions. As wages and salaries have risen in relation to GDP in recent years, CBO and other forecasters have made more accurate forecasts.


Appendix: Forecast and Historical Data Used in This Evaluation
This appendix provides an overview of the data that the Congressional Budget Office used to evaluate its forecast-ing record. The evaluation covers forecasts of the growth of real (inflation-adjusted) and nominal output, infla-tion, interest rates, and changes in wages and salaries. The historical data for output and the output price index used were the current series available from the Bureau of Economic Analysis (BEA). Historical data for inflation and interest rates varied because CBO, the Administra-tion, and the Blue Chip consensus used slightly different measures in some years.
Forecasts Included in This EvaluationCBO evaluated the forecasts that it published between 1976—the first year that the agency made economic pro-jections—and 2014.1 (Two-year forecasts published in early 2015 were not included because when this analysis was completed, the latest full-year historical data did not extend beyond 2015.) For comparison, the agency also evaluated the Administration’s forecasts from those same years. In all but one case, the Administration’s forecasts were taken from its annual budget documents; the fore-cast made in early 1981 by the Reagan Administration, which was based on revisions of the Carter Administra-tion’s last budget, came from a separate document.2
1. Because CBO has published forecasts of wages and salaries on a regular basis only since 1985, this analysis used some unpublished forecasts of wages and salaries that the agency made in earlier years.
2. CBO’s corresponding forecast was taken from the agency’s analysis of President Reagan’s budgetary proposals. That forecast presented the agency’s baseline projections and did not include the economic effects of the new Administration’s fiscal policy proposals. But it did reflect the assumption that the tax and spending policies of the Second Concurrent Resolution on the Budget for Fiscal Year 1981, including accelerated depreciation of investment and a 10 percent cut in personal income taxes, would continue. Another exceptional case occurred in early 1993, when the Clinton Administration adopted CBO’s economic assumptions as the basis for its budget. As a result, the errors from the early 1993 forecast are the same for CBO and the Administration.
The Blue Chip consensus forecasts included in this evaluation were those published closest to the date on which CBO’s forecasts were released. The first two-year forecast by the Blue Chip consensus that CBO examined was published in early 1980; however, that forecast did not include all variables. For those indicators that were not included in the 1980 forecast, the earliest possible forecast was used—for inflation measures and interest rates on 3-month Treasury bills, the 1981 forecast, and for long-term interest rates, the 1984 forecast. Although the Blue Chip consensus is published monthly, only those forecasts published in March and October extend beyond two years. All but one of the five-year forecasts from the Blue Chip consensus used in this evaluation were published in March; the forecast of real output for the 1980–1984 period was published in May 1980. The Blue Chip consensus does not include forecasts of all the economic variables that underlie CBO’s baseline pro-jections. Most notably, it does not provide forecasts of wages and salaries.
Since 1979, the staff of the Board of Governors of the Federal Reserve System has regularly prepared detailed two-year economic forecasts for the Federal Open Market Committee (FOMC), the body responsible for conducting monetary policy. Those forecasts are released to the public on a delayed schedule, typically five years after they are made. In conjunction with certain meet-ings of the FOMC, members of the committee—the members of the Board of Governors and the presidents of the regional Federal Reserve Banks—compile their own forecasts for selected economic indicators. The ranges and central tendencies of those forecasts have been published in the minutes of the meetings since late 2007. For forecasts of real output and of inflation in consumer prices made between 1979 and 2011, CBO compared its projections with those prepared by the staff of the board; for those made from 2012 to 2014, the central tendencies of the FOMC members’ forecasts were used for comparison. All of the Federal Reserve’s fore-casts analyzed here were issued in January or February of

52 CBO’s ECOnOmiC FOrECasting rECOrd: 2017 UpdatE OCTOBER 2017
the initial year of the forecast period or in December of the preceding year.
OutputHistorical average growth rates of nominal output are based on calendar-year averages of the most recent quar-terly values of gross national product (GNP) and gross domestic product (GDP) published by BEA. In 1991, BEA changed its featured measure of output from GNP to GDP. GNP differs from GDP in that GNP includes the income that U.S. residents earn abroad and excludes the income that foreigners earn in this country.
Growth rates of real output were calculated using calendar-year averages of the most recent quarterly data on real GNP and real GDP published by BEA. Over the years covered in this analysis, BEA made several bench-mark revisions to real GNP and GDP. Such revisions make comparing forecasts with actual data difficult.
For example, from 1976 to 1985, forecasters published projections of real GNP growth that reflected BEA’s current measure of such growth at the time, which was based on 1972 prices. In late 1985, however, BEA discontinued the series presented in 1972 dollars and began to publish figures for GNP in 1982 dollars. As a result, no official data for GNP growth in 1972 dollars are available for the years after 1984, meaning that the actual two-year average growth rates that would be used to evaluate the forecasts made in 1984 and 1985 are unavailable.
Moreover, from 1986 to 1991, forecasters published projections of the growth of real GNP that were based on 1982 prices. In the second half of 1991, BEA made another benchmark revision and began publishing estimates of GNP in 1987 dollars. Today, the historical annual series for GNP in 1982 dollars is available only through 1990, so no actual two-year average growth rates are available for comparison with the forecasts made in 1990 and 1991. Late in 1995, BEA made another switch—to a chain-weighted measure of GDP. The historical annual series for GDP in 1987 dollars ends with the value for 1994; thus, there are no corresponding actual two-year average growth rates available for the forecasts made in 1994 and 1995.
By periodically updating the series to reflect recent prices, BEA ensures that its benchmark for real output is relevant for analyzing contemporary movements in real
growth. But that practice makes it difficult to evaluate forecasts of real output growth that are produced over several years on the basis of a series that is later discon-tinued. Consequently, comparisons in this evaluation use BEA’s chain-type annual-weighted index of real GNP or GDP for all historical values.
InflationCBO calculated averages of inflation in the consumer price index from calendar-year averages of monthly data published by the Bureau of Labor Statistics. Before 1978, the bureau published only one consumer price index series, now known as the CPI-W (the price index for urban wage earners and clerical workers). In January 1978, however, the bureau began to publish a second, broader consumer price index series, the CPI-U (the price index for all urban consumers).
Until 1992, the Administration published its forecasts for the CPI-W, the measure used to index most of the federal government’s spending for entitlement programs. By contrast, CBO based all but four of its forecasts of inflation published since 1979—those released from 1986 to 1989—on the CPI-U, which is the measure of inflation now used to index federal income tax brack-ets. The Blue Chip consensus and the Federal Reserve have always included forecasts for the CPI-U. Although annual fluctuations in the CPI-U and CPI-W are virtu-ally indistinguishable, the indexes differ in some years.
As part of its analysis, CBO also evaluated forecasts of the difference between CPI inflation and inflation in the price index for output. The agency used the implicit price deflator for GDP (or, before 1992, GNP) available from BEA to measure the price index for output.
Interest RatesCBO used data published by the Board of Governors of the Federal Reserve System and the Department of the Treasury to calculate two-year averages of short-term and long-term interest rates.
CBO’s comparison of forecasts of short-term interest rates relied primarily on historical values for two mea-sures of the interest rate on 3-month Treasury bills: the new-issue rate and the secondary-market rate. Before 2001, the Administration forecast the new-issue rate, which corresponds to the price of 3-month bills auc-tioned by the Department of the Treasury. The new-issue rate thus reflects the interest that would be earned by

53APPENDIX CBO’s ECOnOmiC FOrECasting rECOrd: 2017 UpdatE
an investor who purchased a bill at auction and held it to maturity. Since mid-2001, the Administration has forecast the secondary-market rate, which corresponds to the price of 3-month bills traded outside of Treasury auctions. Such transactions occur continually in markets that involve many more traders than there are bidders in Treasury auctions. Thus, the secondary-market rate pro-vides a better measure of conditions in financial markets.
Unlike the Administration, CBO has only ever forecast the secondary-market rate. The Blue Chip consensus, by contrast, has alternated between the two rates, and, in 1981, it even projected a third—the 6-month com-mercial paper rate. The Blue Chip consensus forecast the new-issue rate from 1982 to 1985, the secondary-market rate from 1986 to 1991, and the new-issue rate again from 1992 to 1997. Since March 1997, the Blue Chip consensus has forecast the secondary-market rate. There is no reason to expect the rates to differ persistently; indeed, the differences between their calendar-year aver-ages are minuscule.
CBO likewise compared the various forecasts of long-term interest rates with historical values for two measures of long-term rates: the 10-year Treasury note rate and Moody’s Aaa corporate bond rate. A comparison of fore-casts made before 1984 is not possible because not all of
the forecasters published forecasts of long-term interest rates then. In 1984 and 1985, CBO projected the Aaa corporate bond rate. Since then, however, CBO has pro-jected the 10-year Treasury note rate. The Administration has always published forecasts for the 10-year Treasury note rate. The Blue Chip consensus forecast the Aaa cor-porate bond rate until January 1996, when it switched to the 10-year Treasury rate.
CBO calculated separate historical values for real short-term interest rates using the nominal interest rate and the inflation rate appropriate for each forecaster. In each case, the average interest rate was deflated by the average growth rate of the consumer price index. The result-ing real short-term interest rates were similar among forecasts.
Wages and SalariesThe data on wages and salaries used in this report come from the National Income and Product Accounts published by the Department of Commerce’s Bureau of Economic Analysis. Wages and salaries are by far the biggest component of national income. CBO evaluates errors in forecasting wages and salaries because, given their share of personal taxable income, they are a key determinant of overall tax receipts.


List of Tables and FiguresTables
1. Summary Measures for Two-Year Forecasts 92. Summary Measures for Five-Year Forecasts 35
Figures
1. Mean Errors of Two-Year Forecasts 22. Root Mean Square Errors of Two-Year Forecasts 33. CBO’s Forecasts and Actual Growth Rates of Real GDP 114. Root Mean Square Errors of Two-Year Forecasts of the Growth of
Real Output Made Near Business Cycle Peaks 125. Trends in Labor Productivity 136. Price of Petroleum Imports and Consumer Price Inflation 147. Growth of Real Output: Two-Year Forecasts 188. Growth of Nominal Output: Two-Year Forecasts 219. Inflation in the Consumer Price Index: Two-Year Forecasts 2310. Difference Between Inflation in the CPI and in the Output Price
Index: Two-Year Forecasts 2411. Interest Rate on 3-Month Treasury Bills: Two-Year Forecasts 2712. Real Interest Rate on 3-Month Treasury Bills: Two-Year Forecasts 2813. Interest Rate on 10-Year Treasury Notes: Two-Year Forecasts 3014. Growth of Wages and Salaries: Two-Year Forecasts 3215. Change in Wages and Salaries Measured as a Percentage of Nominal
Output: Two-Year Forecasts 3316. Growth of Real Output: Five-Year Forecasts 3717. Growth of Nominal Output: Five-Year Forecasts 3918. Inflation in the Consumer Price Index: Five-Year Forecasts 4019. Difference Between Inflation in the CPI and in the Output Price
Index: Five-Year Forecasts 4220. Interest Rate on 3-Month Treasury Bills: Five-Year Forecasts 4321. Real Interest Rate on 3-Month Treasury Bills: Five-Year Forecasts 4422. Interest Rate on 10-Year Treasury Notes: Five-Year Forecasts 4623. Growth of Wages and Salaries: Five-Year Forecasts 4724. Change in Wages and Salaries Measured as a Percentage of Nominal
Output: Five-Year Forecasts 48

About This Document
The Congressional Budget Office regularly evaluates the accuracy of its economic forecasts by comparing them with the economy’s actual performance and with others’ forecasts. Such evaluations help guide CBO’s efforts to improve the quality of its forecasts and, as background information, are also intended to assist Members of Congress in their use of the agency’s estimates. In keeping with CBO’s mandate to provide objective, impartial analysis, the report makes no recommendations.
Edward Gamber and Claire Sleigh wrote the report with guidance from Kim Kowalewski. Robert Arnold, Mark Booth, Jeffrey Holland (formerly of CBO), and Jeffrey Werling provided helpful comments. Mark Lasky and Adam Staveski fact-checked the report.
Wendy Edelberg, Jeffrey Kling, and John Skeen reviewed the report. Bo Peery edited it, and Jorge Salazar prepared it for publication. The report is available on CBO’s website (www.cbo.gov/publication/53090).
Keith Hall Director October 2017