Embed Size (px)
Citation preview

Forecast 2040 Update
Presented to
NCTCOG Executive Board
January 22, 2015
Demographic Forecasting Process
the demographic forecasting process at NCTCOG is a data-driven analytical approach with consideration of stakeholders’ feedback
both at the aggregate (district level) and disaggregate (traffic survey zone level)
forecast stages
2

Demographic Forecast StepsDevelop Regional Control Totals
Develop Forecast Districts
Prepare District Forecasts
Prepare Forecast Data
Model Calibration
Check for Contextual and Temporal Consistency
Request Executive Board Approval
Done
In Progress
Prepare TSZ Forecast
Conduct Local Review
Prepare Input Data
Conduct Local Review
Model Validation
GLUMDistrict
Forecasts
UPlanSmall Area Forecasts
INDEPENDENT EXPERT ANALYSIS
Regional Forecast
3

Dallas-Fort Worth Metropolitan AreaPopulation Growth Trend
Source : Decennial Census, NCTCOG
0.0
1.0
2.0
3.0
4.0
5.0
6.0
7.0
1960 1970 1980 1990 2000 2010
Popu
latio
n M
illio
ns
Year
6.4 Million
4.8 Million
4

Texas Net Migration (2010-2013)
Source : Dr. Lloyd Potter, Texas State Demographer
5

Texas Job Growth (2004-2014)
Source : Dr. Lloyd Potter, Texas State Demographer
6

Texas Job Growth (2004-2014)
Source : Dr. Lloyd Potter, Texas State Demographer
7

Texas Population Projections(2010-2050)
Source : Dr. Lloyd Potter, Texas State Demographer
8

Texas Population Projectionsby County (2010-2050)
Source : Dr. Lloyd Potter, Texas State Demographer
9

2040 Population Forecasts(Control Total)
Sources : Decennial Census, Woods & Poole, Texas Water Development Board, State Data Center, The Perryman Group
0
2
4
6
8
10
12
14
1900 1910 1920 1930 1940 1950 1960 1970 1980 1990 2000 2010 2020 2030 2040
Popu
latio
n (m
illio
ns)
Year
NCTCOG 12-County MPA Population
SDC 0.0 SDC 0.5 SDC 1.0 Census NCTCOG W&P WDB
NCTCOG (Perryman)
SDC 1.0
SDC 0.0
SDC 0.5
W&P
WDB
12.9 million
7.8 million
10.6 million
10
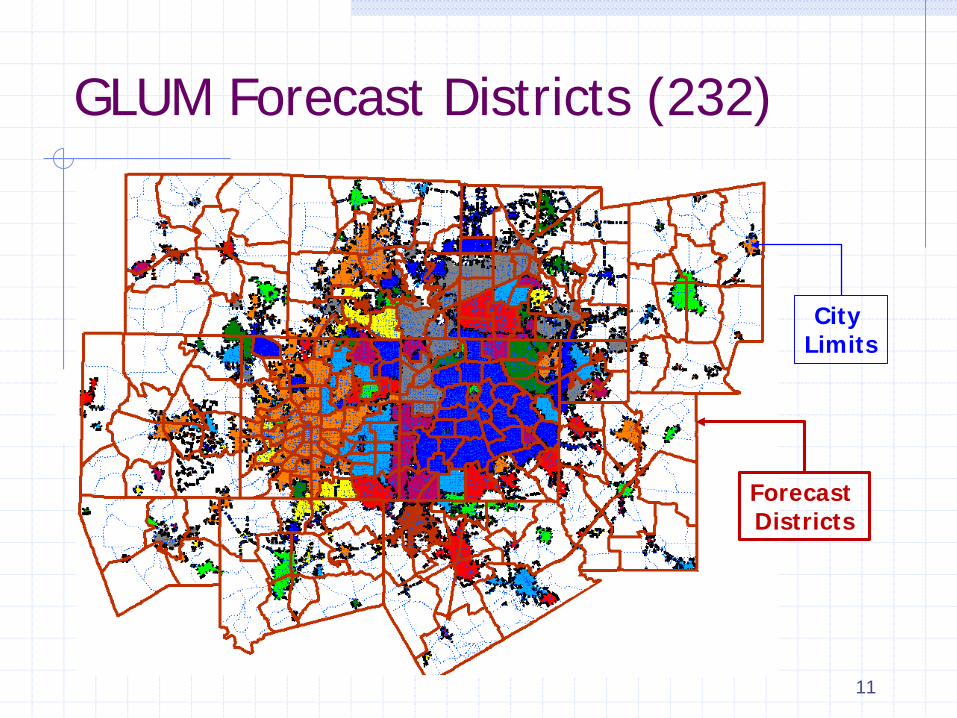
GLUM Forecast Districts (232)
Forecast Districts
City Limits
11

GLUM Calibration and ValidationCalibration is the process of building a mathematicalformulation and optimizing the parameters to ensurethat the model is accurately representing howpopulation and employment growth occurred (From2000 To 2005)
Validation is the process of using the calibrated model toverify the forecasted growth to a known future point intime (2010)
12
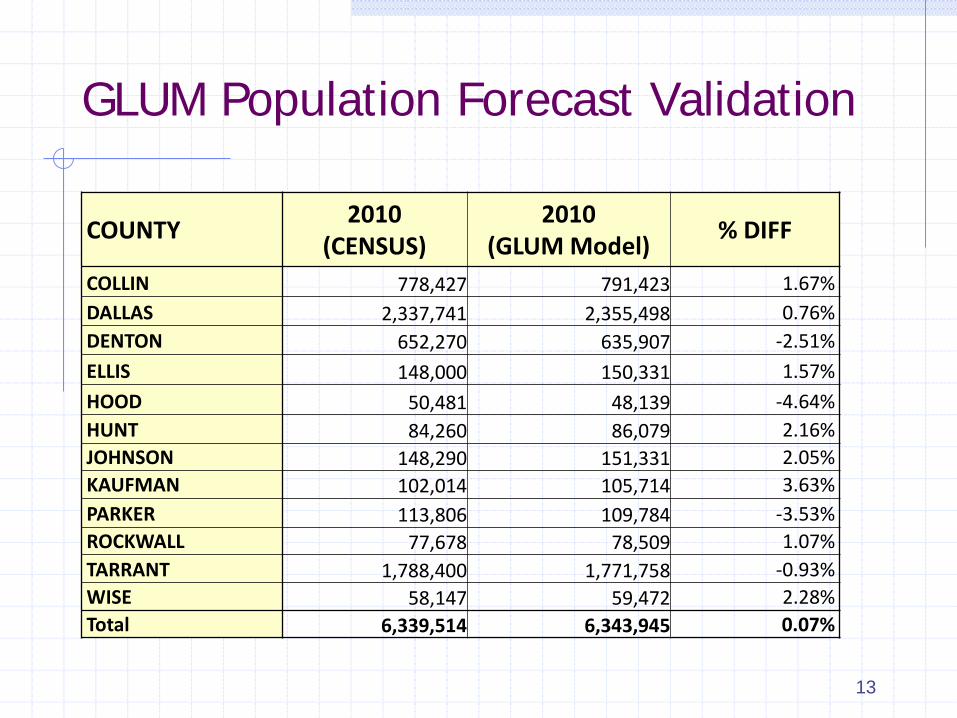
GLUM Population Forecast Validation
COUNTY 2010 (CENSUS)
2010 (GLUM Model) % DIFF
COLLIN 778,427 791,423 1.67%DALLAS 2,337,741 2,355,498 0.76%DENTON 652,270 635,907 -2.51%ELLIS 148,000 150,331 1.57%HOOD 50,481 48,139 -4.64%HUNT 84,260 86,079 2.16%JOHNSON 148,290 151,331 2.05%KAUFMAN 102,014 105,714 3.63%PARKER 113,806 109,784 -3.53%ROCKWALL 77,678 78,509 1.07%TARRANT 1,788,400 1,771,758 -0.93%WISE 58,147 59,472 2.28%Total 6,339,514 6,343,945 0.07%
13

GLUM 2040 Population Forecast*
County Census 2010 2040 Forecast % Difference
Collin 778,427 1,523,114 95.7%Dallas 2,337,741 3,357,524 43.6%Denton 652,270 1,241,664 90.4%Ellis 148,000 283,900 91.8%Hood 50,481 81,578 61.6%Hunt 84,260 131,024 55.5%Johnson 148,290 245,782 65.7%Kaufman 102,014 210,098 106.0%Parker 113,806 195,286 71.6%
Rockwall 77,678 166,356 114.2%Tarrant 1,788,400 3,094,651 73.0%Wise 58,147 101,864 75.2%
Total 6,339,514 10,632,841 67.7%
* Forecasts reviewed by local governments at the district level. 14

GLUM 2040 Employment Forecast*
County BEA 2010 2040 Forecast % Difference
Collin 452,982 751,908 66.0%Dallas 1,884,799 3,232,330 71.5%Denton 251,394 432,175 71.9%Ellis 58,519 96,877 65.5%Hood 18,045 29,450 63.2%Hunt 40,702 70,103 72.2%Johnson 64,198 105,194 63.9%Kaufman 40,558 64,036 57.9%Parker 52,532 80,411 53.1%
Rockwall 33,163 48,681 46.8%Tarrant 1,036,558 1,739,340 67.8%Wise 31,516 40,941 29.9%Total 3,964,966 6,691,447 68.8%
* Forecasts reviewed by local governments at the district level. 15
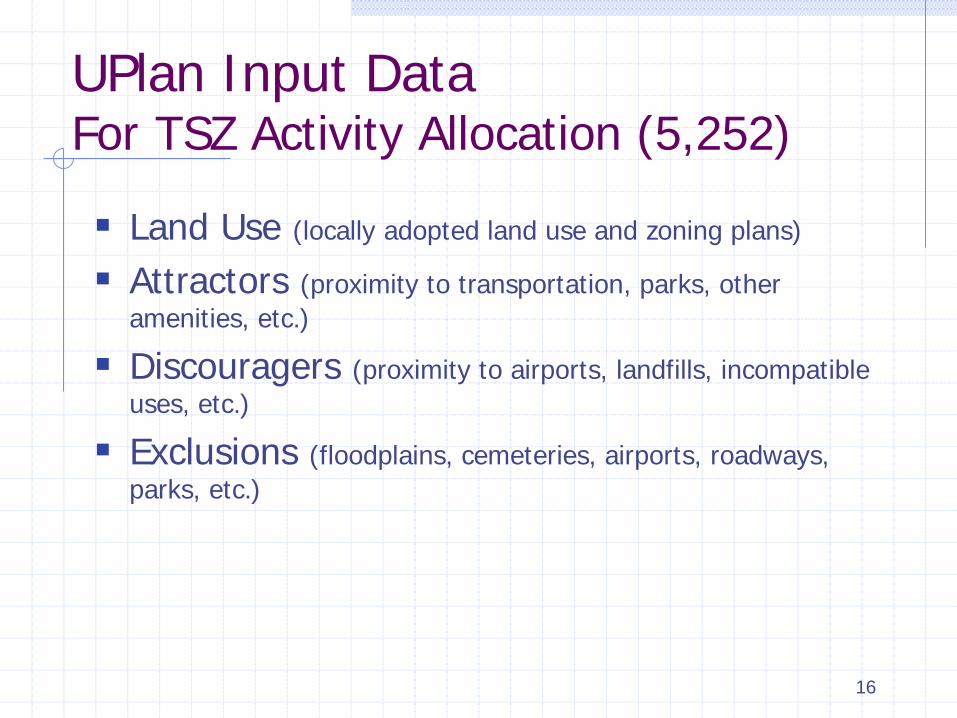
UPlan Input DataFor TSZ Activity Allocation (5,252)
Land Use (locally adopted land use and zoning plans)
Attractors (proximity to transportation, parks, other amenities, etc.)
Discouragers (proximity to airports, landfills, incompatible uses, etc.)
Exclusions (floodplains, cemeteries, airports, roadways, parks, etc.)
16
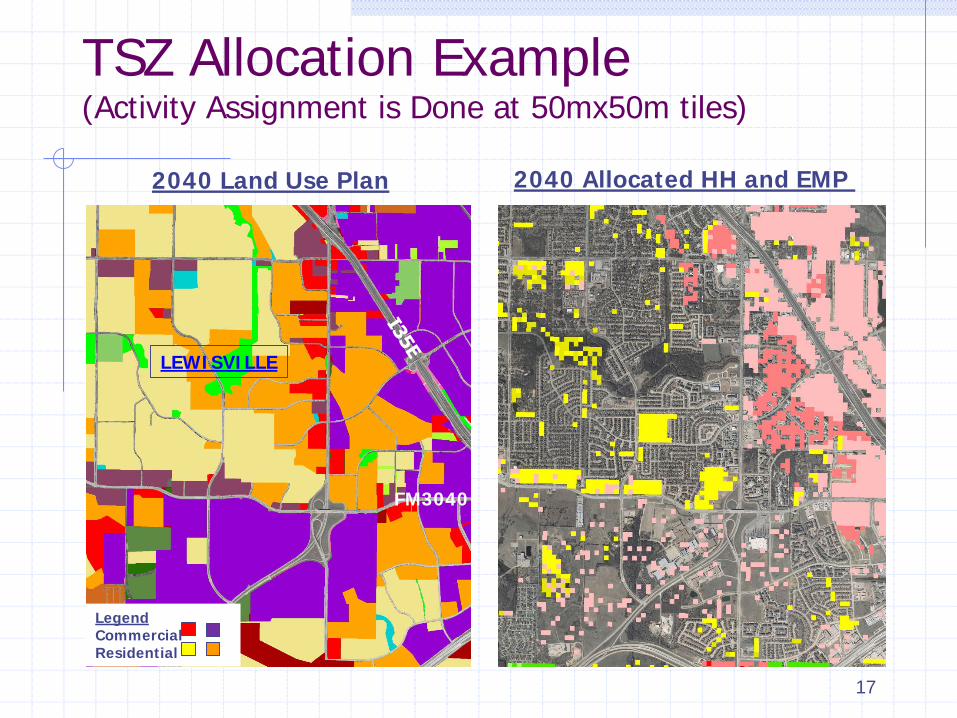
TSZ Allocation Example(Activity Assignment is Done at 50mx50m tiles)
2040 Land Use Plan 2040 Allocated HH and EMP
LegendCommercialResidential
LEWISVILLE
FM3040
17

Traffic Survey Zones (TSZ)
TSZ(5,252)
18

1950-2040 Growth Animation
19

October-December, 2014 Local government/agency review of TSZ forecasts
January-March, 2015 Review comments received Finalize TSZ forecasts
March-May, 2015 Approval by the NCTCOG Executive Board
2040 Forecast Completion Schedule
20

Forecast 2040 Project StaffArash Mirzaei817 695 [email protected]
Behruz Paschai817 704 [email protected]
Dan Kessler817 695 [email protected]
Donna Coggeshall817 695 [email protected]
Mark Folden817 608 [email protected]

Questions ?