Embed Size (px)
Citation preview

Forbo Annual Report 2008Forbo Holding LtdLindenstrasse 8CH-6340 Baar
Forbo International SALindenstrasse 8CH-6340 Baar
P +41 58 787 25 25F +41 58 787 20 [email protected]
flooring. bonding. movement. flooring. bonding. movement.
flo
ori
ng.
bo
nd
ing.
mo
vem
ent.
Fo
rbo
An
nu
al R
epo
rt 2008

Our Annual Report is published in German language and in an English language translation.
Publisher:Forbo Holding Ltd, Baar
Concept and Design:Gottschalk + Ash Int’l
Photos:Luxwerk, Zurich
Typesetting, Litho and Printing:Neidhart + Schön AG, Zurich
Financial calendar
Ordinary General Meeting: April 24, 2009
Letter to shareholders: August 18, 2009
Media release on the results in the first half of 2009: August 18, 2009

Forbo at a Glance
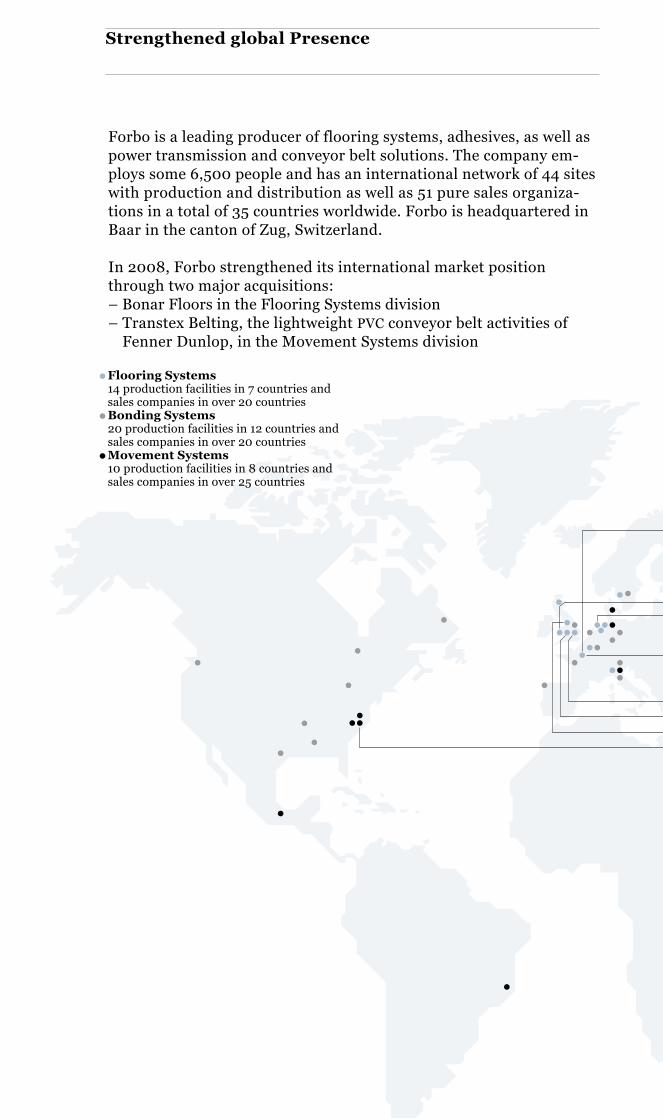
Forbo is a leading producer of flooring systems, adhesives, as well as power transmission and conveyor belt solutions. The company em-ploys some 6,500 people and has an international network of 44 sites with production and distribution as well as 51 pure sales organiza-tions in a total of 35 countries worldwide. Forbo is headquartered in Baar in the canton of Zug, Switzerland.
In 2008, Forbo strengthened its international market position through two major acquisitions:– Bonar Floors in the Flooring Systems division– Transtex Belting, the lightweight PVC conveyor belt activities of
Fenner Dunlop, in the Movement Systems division
· Flooring Systems 14 production facilities in 7 countries and sales companies in over 20 countries
· Bonding Systems 20 production facilities in 12 countries and sales companies in over 20 countries
· Movement Systems 10 production facilities in 8 countries and sales companies in over 25 countries
Strengthened global Presence

Exp
and
ed p
rod
uct
por
tfol
ioF
loo
rin
g S
yst
em
sS
tron
ger
mar
ket
pre
sen
ce i
n t
he
US
Mo
ve
me
nt
Sy
ste
ms
FlotexFlotex is a vinyl flooring manufactured by a unique electrostatic flocking technique. It combines the best characteristics of a carpet with the features of a heavy-duty and low-maintenance floor covering and has a smooth, velvety surface with the pleasantly soft feel of a carpet. The Flotex collections convince with their attractive designs such as lively colors and shades as well as almost three-dimensional visual appearance. The Sottsass special collection is the result of a creative cooperation with the Italian design studio Sottsass Associati. Flotex products are manufactured at the Ripley (UK) and Château-Renault (F) sites and are used mainly in public buildings, offices and hotels.
Coral & Nuway Coral and Nuway are entrance matting systems that take care of cleaning and drying shoes of whoever enters a building.
CORAL textile floor covering systems catch dirt and absorb moisture in the entrance area. They are manufactured at Krommenie (NL).
NUWAY entrance matting systems are systems for high-intensity entrance areas as for example at airports, supermarkets and shopping centers. Nuway systems are manufactured at Telford (UK).
ChocflexChocflex is a vinyl floor covering providing indentation resistance and excellent sound insulation (19 dB); it is manufactured at Château-Renault (FR).
Westbond & TesseraWestbond and Tessera are carpet tiles for demanding rooms and environments. A perfect extension to the existing Forbo product portfolio, they make an ideal fit for Forbo commercial floorings, especially in offices, hotels, leisure centers and public buildings.
WESTBOND is a product line of unique designer carpet tiles manufactured by a special process as fusion-bonded tiles. They are available in a range of attractive colors and can be individually designed to the customer’s specifications. They are manufactured at the Cottonwood (UK) site.
The TESSERA product line consists of high-performance carpet tiles for the most demanding commercial interiors; they are manufactured at Bamber Bridge (UK).
Transtex BeltingThe acquisition of the lightweight PVC conveyor belting activities of Fenner Dunlop in North America has enabled the Movement Systems division to round off its product offering for rip and tear-resistant conveyor belts primarily used in the logistics and food processing industry.
In connection with this acquisition, more- over, Forbo concluded a distribution agreement for lightweight rubber belting products manufactured by Fenner Dunlop.
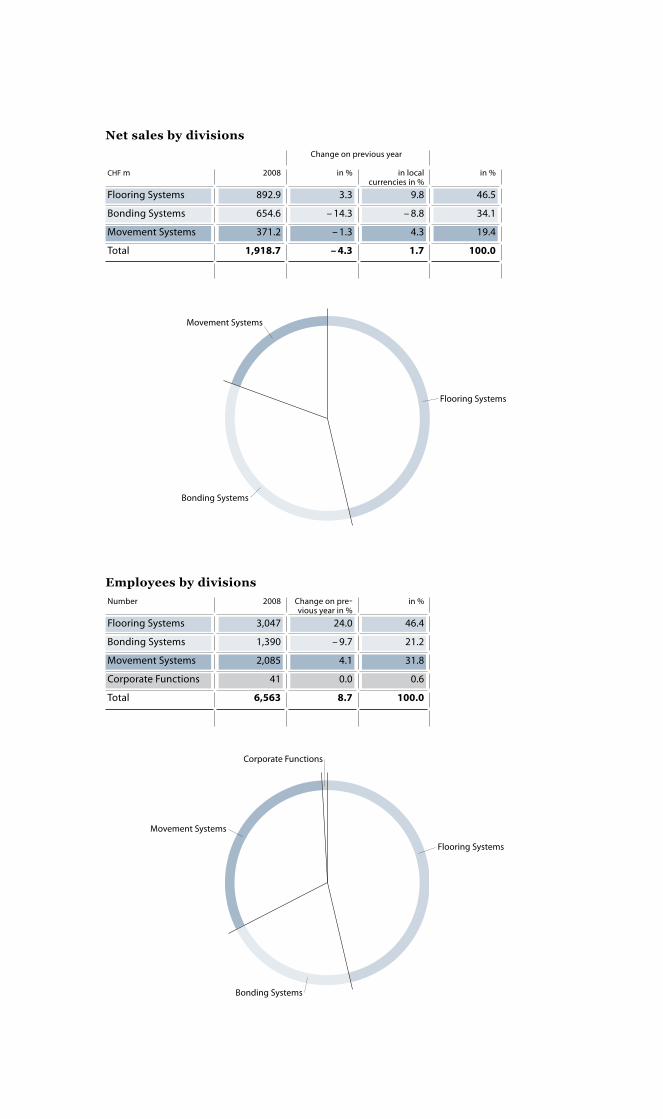
Net sales by divisions
Employees by divisions
Flooring Systems
Bonding Systems
Movement Systems
Movement Systems
Bonding Systems
Flooring Systems
Corporate Functions
Number 2008 Change on previous year in %
in %
Flooring Systems 3,047 24.0 46.4
Bonding Systems 1,390 – 9.7 21.2
Movement Systems 2,085 4.1 31.8
Corporate Functions 41 0.0 0.6
Total 6,563 8.7 100.0
Change on previous year
CHF m 2008 in % in local currencies in %
in %
Flooring Systems 892.9 3.3 9.8 46.5
Bonding Systems 654.6 – 14.3 – 8.8 34.1
Movement Systems 371.2 – 1.3 4.3 19.4
Total 1,918.7 – 4.3 1.7 100.0

2008 2007 2008 2007Income statement CHF m CHF m EUR m2) EUR m2)
Net sales 1,918.7 2,004.0 1,209.0 1,218.2
Flooring Systems 892.9 864.4 562.6 525.2
Bonding Systems 654.6 763.7 412.5 464.3
Movement Systems 371.2 375.9 233.9 228.5
EBITDA 205.8 221.9 129.7 134.9
EBIT 117.1 162.4 73.8 98.7
Group profit 16.0 110.7 10.1 67.3
Balance sheet CHF m CHF m EUR m2) EUR m2)
Total assets 1,837.8 1,405.2 1,158.0 854.2
Operating assets 1,516.2 1,201.6 955.4 730.5
Shareholders’ equity 584.4 713.1 368.2 433.5
Net debt 404.5 41.6 254.9 25.3
Cashflowstatement CHF m CHF m EUR m2) EUR m2)
Cash flow from operating activities 159.8 165.3 100.7 100.5
Cash flow from investing activities – 406.1 76.6 – 255.9 46.6
Free cash flow – 246.3 88.7 – 155.2 53.9
Key ratios % %
ROS (EBITDA / net sales) 10.7 11.1
ROA (EBIT / operating assets) 7.7 13.5
Equity ratio (shareholders’ equity / total assets) 31.8 50.7
Gearing (net debt / shareholders’ equity) 69.2 5.8
Employees (as of December 31) Number Number
6,563 6,040 Details per share CHF CHF EUR2) EUR2)
Earnings (undiluted) 6.9 43.6 4.3 26.5
Equity 249.6 281.1 157.3 157.3
Par value reduction 3.91) 10.0 2.5 6.1
Stock market capitalization (as of December 31) CHF m CHF m EUR m2) EUR m2)
435.0 1,717.0 274.1 1,043.8
1) Proposal of the Board of Directors to the Ordinary General Meeting.2) EUR values translated at the annual average rate of CHF 1.587 / 1 EUR (2008) and CHF 1.645 / 1 EUR (2007).
Financial Overview Group


Contents Annual Report 2008
2 Forbo – the first 80 years
3 To our Shareholders
6 Forbo Group:
weaker demand and special charges depress earnings
11 Three divisions – three areas of competence
12 Flooring Systems:
strategic extension of the product portfolio
18 Bonding Systems:
a demanding year
24 Movement Systems:
market presence in the US strengthened
30 Group Structure
31 Executive Board
35 Corporate Governance
56 The Forbo Share
Forbo Group Financial Report
60 Consolidated Income Statement
61 Consolidated Balance Sheet
62 Consolidated Cash Flow Statement
63 Consolidated Statement of
Recognized Income and Expenses
64 Group Accounting Policies
77 Notes
110 Group Companies
114 Report of the Statutory Auditor
116 Consolidated Income Statements 2004 – 2008
117 Consolidated Balance Sheets 2004 – 2008
Financial Statements of Forbo Holding Ltd
119 Income Statement
120 Balance Sheet
121 Notes to the Financial Statements
128 Proposal for Appropriation of Available Earnings
129 Report of the Statutory Auditor
Annual Report 2008
year
sye
ars
year
sye
ars
year
sye
ars
year
sye
ars
year
sye
ars
year
sye
ars
year
sye
ars
year
sye
ars
year
sye
ars
year
sye
ars
year
sye
ars
year
sye
ars
year
sye
ars
year
sye
ars
year
sye
ars
year
sye
ars
year
sye
ars
year
sye
ars
year
sye
ars
year
sye
ars
year
sye
ars
year
sye
ars
year
sye
ars
year
sye
ars
year
sye
ars
year
sye
ars
year
sye
ars
year
sye
ars
year
sye
ars
year
sye
ars
year
sye
ars
year
sye
ars
year
sye
ars
year
sye
ars
year
sye
ars
year
sye
ars
year
sye
ars
year
sye
ars
year
sye
ars
year
sye
ars
year
sye
ars
year
sye
ars
year
sye
ars
year
sye
ars
year
sye
ars
year
sye
ars
year
sye
ars
year
sye
ars
year
sye
ars
year
sye
ars
year
sye
ars
year
sye
ars
year
sye
ars
year
sye
ars
year
sye
ars
year
sye
ars
year
sye
ars
year
sye
ars
year
sye
ars
year
sye
ars
year
sye
ars
year
sye
ars
year
sye
ars
year
sye
ars
year
sye
ars
year
sye
ars
year
sye
ars
year
sye
ars
year
sye
ars
year
sye
ars
year
sye
ars
year
sye
ars
year
sye
ars
year
sye
ars
year
sye
ars
year
sye
ars
year
sye
ars
year
sye
ars
year
sye
ars
year
sye
ars
year
sye
ars
year
sye
ars
year
sye
ars
year
sye
ars
year
sye
ars
year
sye
ars
year
sye
ars
year
sye
ars
year
sye
ars
year
sye
ars
year
sye
ars
year
sye
ars
year
sye
ars
year
sye
ars
year
sye
ars
year
sye
ars
year
sye
ars
year
sye
ars
year
sye
ars
year
sye
ars
year
sye
ars
year
sye
ars
year
sye
ars
year
sye
ars
year
sye
ars
year
sye
ars
year
sye
ars
year
sye
ars
year
sye
ars
year
sye
ars
year
sye
ars
year
sye
ars
year
sye
ars
year
sye
ars
year
sye
ars
year
sye
ars
year
sye
ars
year
sye
ars
year
sye
ars
year
sye
ars
year
sye
ars
year
sye
ars
year
sye
ars
year
sye
ars
year
sye
ars
year
sye
ars
year
sye
ars
year
sye
ars
year
sye
ars
year
sye
ars
year
sye
ars
year
sye
ars
year
sye
ars
year
sye
ars
year
sye
ars
year
sye
ars
year
sye
ars
year
sye
ars
year
sye
ars
year
sye
ars
year
sye
ars
year
sye
ars
year
sye
ars
year
sye
ars
year
sye
ars
year
sye
ars
year
sye
ars
year
sye
ars
year
sye
ars
year
sye
ars
year
sye
ars
year
sye
ars
year
sye
ars
year
sye
ars
year
sye
ars
year
sye
ars
year
sye
ars
year
sye
ars
year
sye
ars
year
sye
ars
year
sye
ars
year
sye
ars
year
sye
ars
year
sye
ars
year
sye
ars
year
sye
ars
year
sye
ars
year
sye
ars
year
sye
ars
year
sye
ars
year
sye
ars
year
sye
ars
year
sye
ars
year
sye
ars
year
sye
ars
year
sye
ars
year
sye
ars
year
sye
ars
year
sye
ars
year
sye
ars
year
sye
ars
year
sye
ars
year
sye
ars
year
sye
ars
year
sye
ars
year
sye
ars
year
sye
ars
year
sye
ars
year
sye
ars
year
sye
ars
year
sye
ars
year
sye
ars
year
sye
ars
year
sye
ars
year
sye
ars
year
sye
ars
year
sye
ars
year
sye
ars
year
sye
ars
year
sye
ars
year
sye
ars
year
sye
ars
year
sye
ars
year
sye
ars
year
sye
ars
year
sye
ars
year
sye
ars
year
sye
ars
year
sye
ars
year
sye
ars
year
sye
ars
year
sye
ars
year
sye
ars
year
sye
ars
year
sye
ars
year
sye
ars
year
sye
ars
year
sye
ars
year
sye
ars
year
sye
ars
year
sye
ars
year
sye
ars
year
sye
ars
year
sye
ars
year
sye
ars
year
sye
ars
year
sye
ars
year
sye
ars
year
sye
ars
year
sye
ars
year
sye
ars
year
sye
ars
year
sye
ars
year
sye
ars
year
sye
ars
year
sye
ars
year
sye
ars
year
sye
ars
year
sye
ars
year
sye
ars
year
sye
ars
year
sye
ars
year
sye
ars
year
sye
ars
year
sye
ars
year
sye
ars
year
sye
ars
year
sye
ars
year
sye
ars
year
sye
ars
year
sye
ars
year
sye
ars
year
sye
ars
year
sye
ars
year
sye
ars
year
sye
ars
year
sye
ars
year
sye
ars
year
sye
ars
year
sye
ars
year
sye
ars
year
sye
ars
year
sye
ars
year
sye
ars
year
sye
ars
year
sye
ars
year
sye
ars
year
sye
ars
year
sye
ars
year
sye
ars
year
sye
ars
year
sye
ars
The picture shows the Forshaga factory in Gothenburg in 1896 – one of the production sites of the three founding companies.
In a milestone decision for industrial history, three firms, the Deutsche Linoleum-Werke AG in Berlin, Germany, the Swedish company Linoleum-Aktiebolaget Forshaga in Gothenburg and the Swiss company Linoleum AG in Giubiasco agreed in 1928 to establish a holding com- pany. It was their response to the fast-changing market situation for linoleum floor cover-ings on the European continent. Two years after the new company was founded, two further firms joined the Union: the French manufacturer Société Anonyme Rémoise du Linoléum in Reims and the Dutch firm N.V. Nederlandsche Linoleumfabriek in Krommenie.
In the immediate wake of the merger, these continental linoleum manufacturers saw their business flourish. The measures to streamline the business bore fruit, and factory turnover rose. But the world recession that began in 1929 very soon struck the European continent with its full force. The company later experienced difficult times during World War Two, especially when the French production plant was bombarded in 1944. Although there were no fatalities among staff, the factory suffered considerable damage. Following the de- pression and war years, the company diversified, initially within the flooring business, adding vinyl floor coverings and carpets to the range. In 1973, it started to build up a separate adhesives division and in 1994 it acquired the Siegling Group, a globally operating business in conveyor, processing and flat belts. As of the 1980s in particular, the company diversi- fied further into areas such as wall coverings, coated textiles, laminates and windows. The focus on the current three divisions was initiated in the late 1990s.
Following the diversification in the 1960s, the Annual General Meeting of May 3, 1974 de- cided to change the company’s name from Continentale Linoleum-Union to Forbo. It was an excellent choice because the name is unique, sounds pleasant in all languages and is easy to pronounce. Forbo was the designation used by the Swedish Group company for its wall and roofing elements. Originally, the name came from a joint venture between the two companies Forshaga and Bofors.
The year 2008 marked an important anniversary for Forbo. In February 1928, three of continental Europe’s leading linoleum manufacturers founded the Conti- nentale Linoleum-Union in the canton of Zurich, laying the foundation for today’s globally operating Forbo Group.
Forbo – the first 80 years
2

Dear Ladies and Gentlemen,Following an extraordinarily successful business year in 2007 with the best result ever in Forbo’s history, the company continued to report prospering sales and strong earnings in the first half of 2008. As of the second half of the year and especially in the fourth quarter of 2008, however, the global financial crisis and the economic downturn impact ed negatively on a wide range of industries. Key markets for Forbo such as construction and the auto-motive industry as well as the capital goods sector were particularly hard hit. Forbo has a strong presence in these industries directly or indirectly. Many of Forbo’s cus tomers faced vast problems in these difficult circumstances. The downturn has caused a huge global slump in demand. The recession has particularly strong struck key Forbo markets such as the United States. Despite the good results in the first three quarters, the economy’s tail- spin had a negative impact on Forbo’s sales and earnings for 2008 as a whole.
Selective acquisitions strengthen market positionOutstanding enhancement of the product portfolioAgainst this increasingly difficult environment, Forbo succeeded in making two important acquisitions in 2008. The purchase of Bonar Floors enabled Forbo to complement its Flooring Systems product portfolio in the strategically important commercial floorings business in Europe. The second acquisition, Transtex Belting (the lightweight PVC conveyor belt activities of Fenner Dunlop), strengthens and expands the market presence of Movement Systems in strategically significant market segments in North America.
Currencies had a strong negative impact on salesSales almost at the previous year’s level despite a steep fall in the fourth quarterSales were stable on the whole until the third quarter of 2008, but fell considerably in the course of October and then slumped further as of November. The trend was exacerbated in December when Forbo’s customers had to shut down factories and introduce forced vacation and short-time work. Consolidated net sales converted into Swiss francs came to CHF 1,918.7 million, just below the previous year’s level of CHF 2,004.0 million. Forbo’s ac - quisition-driven growth due to the takeover of Bonar Floors and Transtex Belting was 3.6 %. The negative impact of currency translations was 6.0 %. Exchange rate trends especially in the high-volume US dollar and euro zones plus the weakening of the pound sterling caused a sharp drop in sales reported in Swiss francs. Fortunately, despite this challenging envi-ronment, Flooring Systems and Movement Systems managed to increase net sales in local currencies after adjustment for acquisitions.
To our Shareholders
3

Operating profit impacted by sales development and extraordinary chargesCost-cutting measures prevented further margin erosionThe sharp decline in sales as of the fourth quarter of 2008, combined with rising credit risks, impairments as well as provisions for structural adjustments resulted in a lower EBIT than the previous year. The additional cost-cutting measures introduced towards the year-end only went part way to compensating for the impact resulting from the decline in sales. This led to an operating profit (EBIT) of CHF 117.1 million (previous year: CHF 162.4 million). The EBIT margin in 2008 thus came to 6.1 % (previous year: 8.1 %). Operating profit before depreciations and amortizations (EBITDA) stood at CHF 205.8 million, below the 2007 figure of CHF 221.9 million.
Net income reduced by additional special chargesImpairments on securities and higher net financial expense additionally depress the result Owing to the economic crisis, which has struck both Rieter divisions with full force, Forbo has had to take an impairment charge on its industrial participation in Rieter, which was acquired with a view to exploiting synergies resulting from a potential cooperation. This value adjustment has reduced net income by CHF 79.2 million before tax. Other net financial expense increased owing to the higher debt and came to CHF 16.5 million (previous year: CHF 7.6 million).
Consolidated net income came to CHF 16.0 million (previous year: CHF 110.7 million).
Strong balance sheetStrategic investmentsVarious strategic investments and the buyback of the company’s own shares increased net debt to CHF 404.5 million at year-end 2008.
Strengthening the balance sheetFor Forbo, a strong balance sheet in a prolonged economic downturn is a significant com - petit ive advantage. Selected asset categories were revalued at fair values in accordance with the applicable IFRS accounting standards. The use of the revaluation model makes the actual asset situation of the Group more transparent.
Proposals to the Ordinary General MeetingPar value repayment of CHF 3.90In view of the decline in net income compared to the previous year as well as the tough economic conditions expected to prevail in 2009, the Board of Directors proposes to the Ordinary General Meeting a cash payout of CHF 3.90 per share. As in the previous year, this distribution is to take the form of a reduction in par value.
Share buyback programOwing to the deterioration in economic conditions and the uncertain future, the Board of Directors proposes to the Ordinary General Meeting that the 213,152 shares of the company which were bought back through the second trading line should not yet be destroyed. Accordingly, the Board of Directors proposes that it should be authorized to resell these shares or to use them either as a means of payment for acquisitions or as underlying security for convertible and option rights.
4

Change in the Board of DirectorsThe period of office of Dr. Rudolf Huber ends on the date of the 2009 Ordinary General Meeting. He has decided not to stand for re-election anymore. The Board of Directors thanks him for the valuable contribution for the benefit of Forbo Group. The Board of Directors will propose to the Ordinary General Meeting the election of Mr. Vincent Studer, member of the Executive Board of the auditing and accountancy company T & R AG
and former partner of Ernst & Young, in his place as a member of the Board of Directors.
Outlook for 2009A challenging yearForbo does not anticipate a soon recovery of the markets and believes that 2009 will be significantly more challenging than 2008.
Given the uncertain outlook for the world economy and the difficult market conditions, Forbo at this point in time refrains from making concrete forecasts regarding sales and earnings trends for the 2009 business year.
Thank youOur thanks for your commitment and trustOn behalf of the Board of Directors and the Executive Board, we thank our employees for their great commitment, for their outstanding performance and for the necessary flexi- bility they have shown in their everyday work, with which they have contributed to the company’s success also in a difficult environment.
We thank all our partners for the close working relationship and the trust they show in Forbo. In particular we would like to express our gratitude to our shareholders and our loyal customers.
Baar, March 2009
This E. SchneiderDelegate of the Board of Directors and CEO
Dr. Albert GnägiChairman of the Board of Directors
5

Currency fluctuations had a strong negative impact on salesThe Flooring Systems division increased net sales by CHF 28.5 million to CHF 892.9 million, which is equivalent to an increase of 3.3 %. Although the acquisition of Bonar Floors contributed 6.8 % to this growth, exchange rates lowered sales growth by 6.5 %. In local currencies, sales growth was 9.8 %. The strategic focus on the commercial segment pro- vided some stability in an uncertain economic environment. Especially the United States, France and the Netherlands performed above average, even though overall a drop in demand was also observed in the flooring business in the second half of 2008. In local currencies, both linoleum and vinyl floorings once more drove solid sales growth.
The past business year was a very demanding one for the Bonding Systems division. Fol- lowing the termination of the subsidies for the synthetic fuel program in the synthetic polymers business as of the end of 2007, a demanding year in the United States had been expected. The unexpectedly fierce economic crisis in the United States, which by the end of the year also affected Europe and Asia, caused net sales to contract by CHF 109.1 million to CHF 654.6 million. This is equivalent to a decline of 14.3 %, of which exchange rates accounted for 5.5 %. Operations in the US market in particular were responsible for this de- cline, but Spain and Germany also reported lower sales revenue. There was a huge slump in demand especially in consumer durables such as automobiles, motor homes and furniture. The building and construction adhesives business was a bright spot, performing well despite the difficult economic circumstances.
After a record result in 2007, Forbo increased sales and earnings in the first half of 2008 too. However, as of the third quarter of 2008 some markets were reporting weaker demand, which then slumped strongly especially in the last months of the year, as the full force of the global downturn made itself felt. Group net sales translated into Swiss francs came to CHF 1,918.7 million, which fell just short of the previous year’s level. Exchange rates had a negative impact of 6 % on sales. Forbo’s acquisition-driven growth due to the takeover of Bonar Floors and Transtex Belting was 3.6 %. Despite these chal- lenges in a tough environment, both Flooring Systems and Move-ment Systems managed to increase net sales in local currencies without acquisitions. Raw material prices rose steeply again in the year under review and eased off somewhat only towards the end of the year. Efficient margin management compensated these high costs to some extent.
Net profit from ordinary business operations was slightly below the year-ago level. However, special charges for structural adjust-ments to the economic environment and for an impairment on the participation in Rieter were charged to income. Consolidated net income came to CHF 16.0 million.
Forbo Group: weaker demand and special charges depress earnings
6

Net sales by geographic areas
50 150 200 250 300 350 400 450100
Change on previous year
% in % in local cur-rencies in %
CHF m2008
North, Central and South America 22.4 – 15.4 – 6.4 430.1
Benelux 12.7 + 2.4 + 6.2 243.1
France 12.2 + 0.7 + 4.5 234.8
Germany 11.8 – 1.0 + 2.6 226.5
Asia / Australia / Africa 10.0 + 2.6 + 6.0 192.7
Southern Europe 8.6 – 6.8 – 3.3 165.0
Scandinavia 8.2 – 8.3 – 2.5 156.6
Great Britain / Ireland 6.1 + 14.5 + 34.0 117.0
Eastern Europe 5.6 – 2.1 + 1.6 108.3
Switzerland 2.3 – 7.1 – 7.1 44.6
The Movement Systems division generated net sales of CHF 371.2 million in the year under review, which was CHF 4.7 million below the previous year’s figure, representing a slight decline of 1.3 %. The acquisition of Transtex Belting contributed with 3.1 % to these sales, but exchange rates again reduced this figure by 5.6 %. In local currencies, however, sales grew by 4.3 %. Although the main markets of Movement Systems were affected by the slump in de- mand as of the fourth quarter, some markets such as Scandinavia, Eastern Europe and Italy performed very well. Orders that were part of larger projects generally remained at the previ- ous year’s level. Despite the unfriendly economic environment, the logistics and food- processing segments reported gains, confirming the success due to product innovation un- dertaken in recent years.
Declines in sales and special charges depress operating profitThe sharp fall in sales as of the fourth quarter of 2008, combined with rising debtor risks, re- sulted in a lower EBIT figure. The cost-cutting measures that were initiated only partly off- set this downtrend. The special charges that Forbo took to adjust structures to the changed economic conditions had an additional negative impact on the result. On balance, Forbo reported operating profit (EBIT) of CHF 117.1 million (versus CHF 162.4 million the previous year). The EBIT margin thus came to 6.1 %, compared with 8.1 % in the previous year. Operating profit before depreciations and amortizations (EBITDA) came to CHF 205.8 million (previous year: CHF 221.9 million).
The Flooring Systems division increased its operating profit before depreciations and amorti - zations (EBITDA) to CHF 137.7 million, up 12.9 % compared to the previous year (CHF 122.0 million). Together with strict cost management, productivity gains more than offset the steep rise in raw material prices for linseed oil and oil-based materials. The uptrend was also supported by an improved product portfolio mix, a rationalization of the product range and selective price adjustments.
7
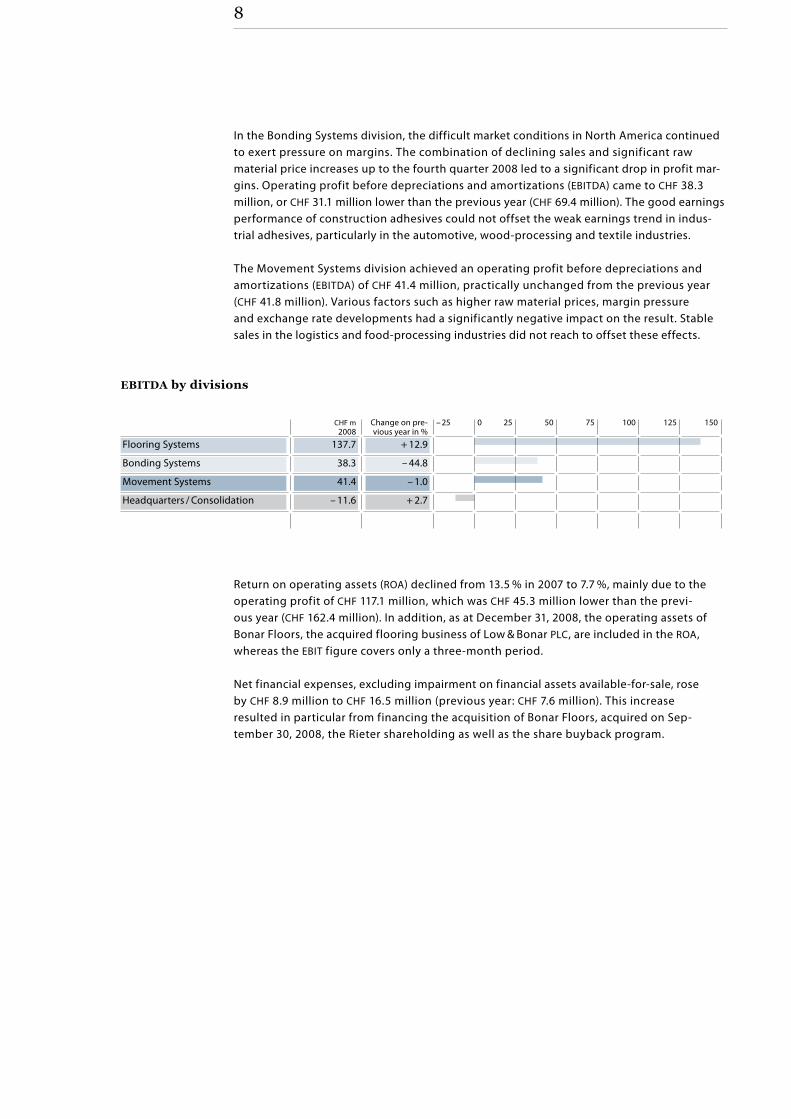
In the Bonding Systems division, the difficult market conditions in North America continued to exert pressure on margins. The combination of declining sales and significant raw material price increases up to the fourth quarter 2008 led to a significant drop in profit mar - gins. Operating profit before depreciations and amortizations (EBITDA) came to CHF 38.3 million, or CHF 31.1 million lower than the previous year (CHF 69.4 million). The good earnings performance of construction adhesives could not offset the weak earnings trend in indus-trial adhesives, particularly in the automotive, wood-processing and textile industries.
The Movement Systems division achieved an operating profit before depreciations and amorti zations (EBITDA) of CHF 41.4 million, practically unchanged from the previous year (CHF 41.8 million). Various factors such as higher raw material prices, margin pressure and exchange rate developments had a significantly negative impact on the result. Stable sales in the logistics and food-processing industries did not reach to offset these effects.
Return on operating assets (ROA) declined from 13.5 % in 2007 to 7.7 %, mainly due to the operating profit of CHF 117.1 million, which was CHF 45.3 million lower than the previ- ous year (CHF 162.4 million). In addition, as at December 31, 2008, the operating assets of Bonar Floors, the acquired flooring business of Low & Bonar PLC, are included in the ROA, whereas the EBIT figure covers only a three-month period.
Net financial expenses, excluding impairment on financial assets available-for-sale, rose by CHF 8.9 million to CHF 16.5 million (previous year: CHF 7.6 million). This increase resulted in particular from financing the acquisition of Bonar Floors, acquired on Sep- tember 30, 2008, the Rieter shareholding as well as the share buyback program.
EBITDA by divisions
– 25 25 50 75 1000CHF m 2008
Change on pre-vious year in %
Flooring Systems 137.7 + 12.9
Bonding Systems 38.3 – 44.8
Movement Systems 41.4 – 1.0
Headquarters / Consolidation – 11.6 + 2.7
125 150
8
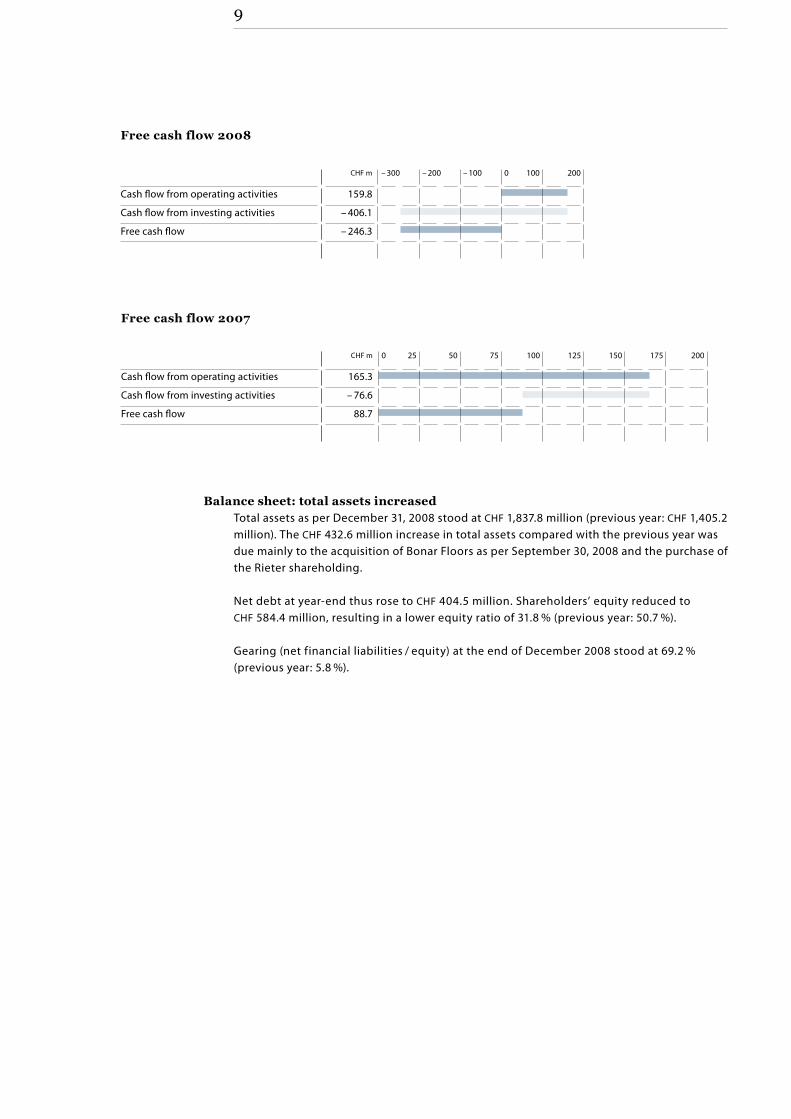
CHF m
Cash flow from operating activities 165.3
Cash flow from investing activities – 76.6
Free cash flow 88.7
Free cash flow 2007
0 25 50 75 100 125 150 175 200
Free cash flow 2008
Balance sheet: total assets increasedTotal assets as per December 31, 2008 stood at CHF 1,837.8 million (previous year: CHF 1,405.2 million). The CHF 432.6 million increase in total assets compared with the previous year was due mainly to the acquisition of Bonar Floors as per September 30, 2008 and the purchase of the Rieter shareholding.
Net debt at year-end thus rose to CHF 404.5 million. Shareholders’ equity reduced to CHF 584.4 million, resulting in a lower equity ratio of 31.8 % (previous year: 50.7 %).
Gearing (net financial liabilities / equity) at the end of December 2008 stood at 69.2 % (previous year: 5.8 %).
CHF m
Cash flow from operating activities 159.8
Cash flow from investing activities – 406.1
Free cash flow – 246.3
0– 300 – 200 – 100 100 200
9

Continuing investments to sustainably improve marginsThe Forbo Group invested CHF 58.0 million in fixed assets in 2008 (previous year: CHF 61.5 million). The funds were used primarily for projects to increase production capacity and for measures designed to boost efficiency and reinforce Forbo’s presence in new markets. Flooring Systems invested CHF 29.4 million in 2008, which was with CHF 3.8 million higher than the previous year (CHF 25.6 million). Amongst others, these are investments made to modernize production of vinyl floorings in France and Russia. Whereas in 2007 Bonding Systems reported exceptionally high investments of CHF 21.2 million due to the expansion of production capacity and the buildup of a factory in Russia, capital spending in 2008 came to CHF 10.5 million. Investments at Movement Systems, including intangible assets and the acquisition of Transtex Belting, came to CHF 17.1 million, a level above previous year (CHF 13.5 million).
% Change on pre-vious year in %
2008
Benelux 18.0 + 4.6 1,181
North, Central and South America 14.4 – 1.0 944
Germany 12.8 + 3.5 837
Great Britain / Ireland 12.3 + 128.2 808
Asia / Australia / Africa 11.5 – 2.7 755
France 11.3 + 27.2 743
Eastern Europe 6.3 + 9.0 412
Scandinavia 4.9 – 31.8 319
Southern Europe 4.7 – 6.0 311
Switzerland 3.9 – 1.6 253
Employees by geographic areas
200 400 600 800 1,000 1,200
Capital investments 2004 – 2008
10 20 30 400 50 60 70
Flooring Systems
Bonding Systems
Movement Systems
Corporate Total
CHF m CHF m CHF m CHF m CHF m
2008 29 11 17 1 58
2007 26 21 14 1 62
2006 18 31 13 3 65
2005 15 19 14 1 49
2004 27 10 14 4 55
Headcount developmentAt the end of the year, the Forbo Group employed 6,563 people, or 523 people more than in the previous year; the increase was due mainly to the acquisition of Bonar Floors. On the other hand, a reduction of staff has been caused by the closure of the parquet production in Sweden.
10

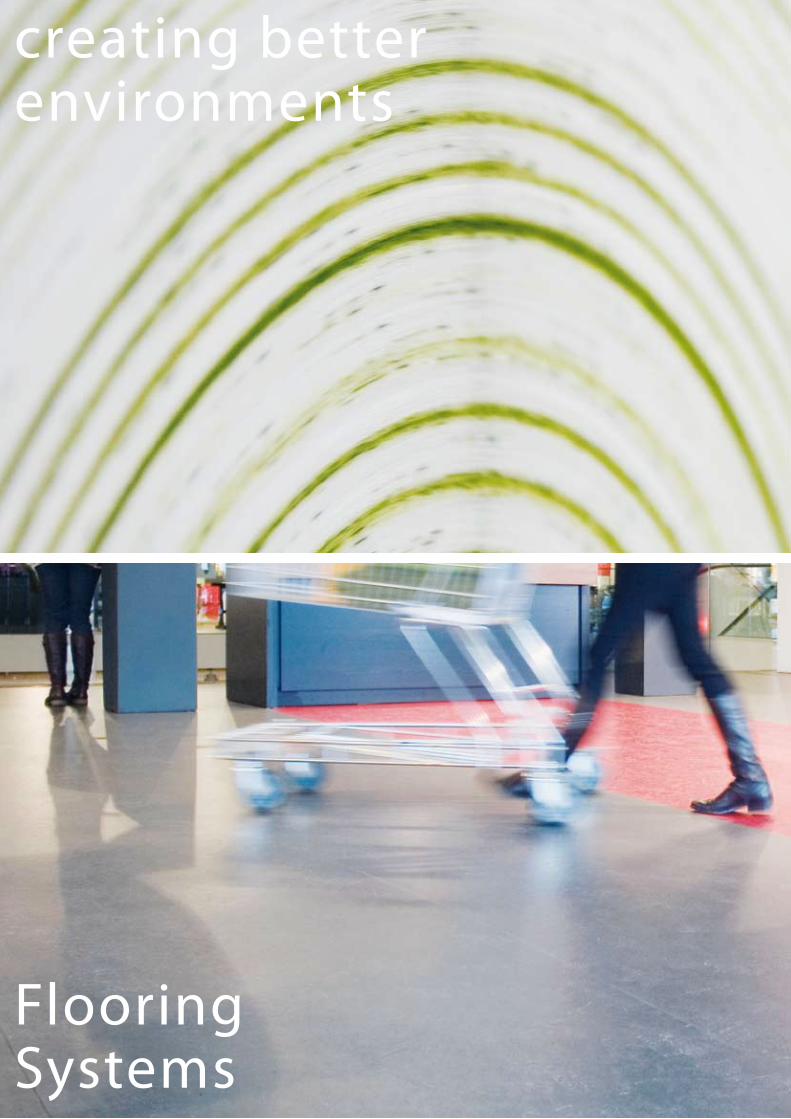
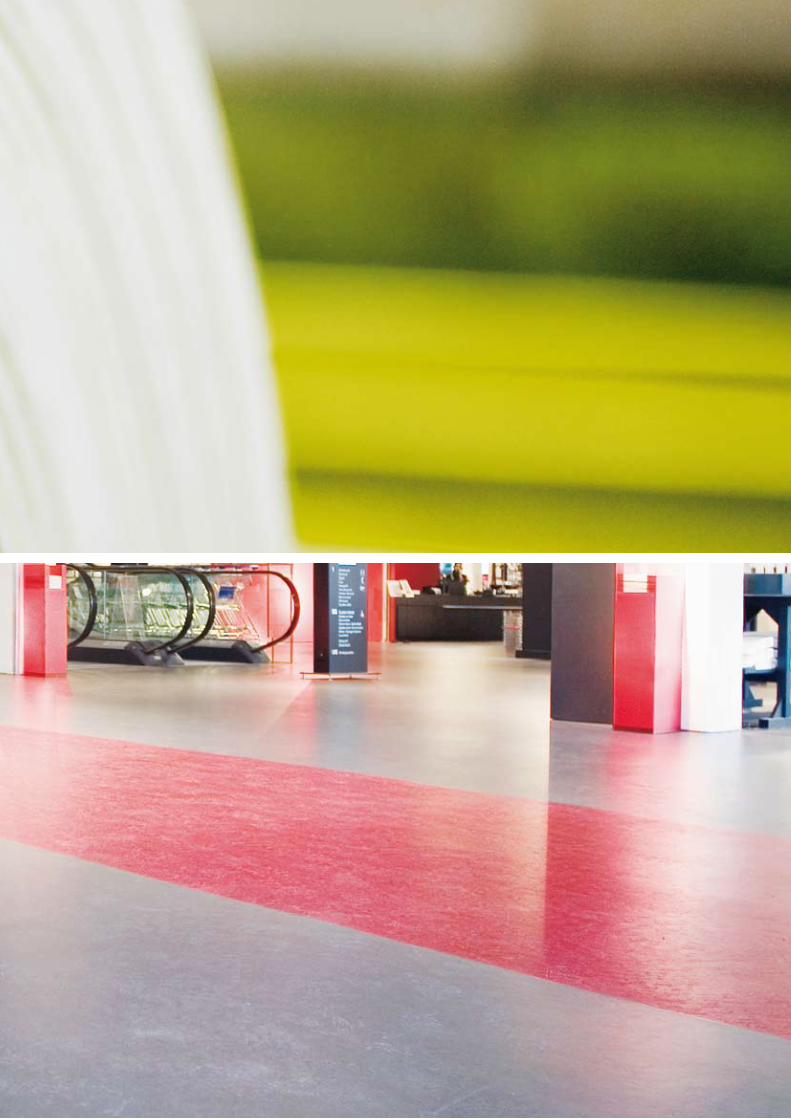
Flooring SystemsThe Flooring Systems division offers a broad and attractive range of environmentally friendly linoleum, high-quality vinyl floorings, en-trance matting systems that take care of cleaning and drying shoes, car- pet tiles and needlefelt. Thanks to their excellent technical properties and attractive design, these floorings are invariably the first choice for public buildings, department stores, hospitals, schools, libraries, com- mercial offices, leisure centers, hotels, restaurants and cafeterias as well as for applications in the residential market. With a market share of over 65 percent, Forbo is the world market leader in linoleum.
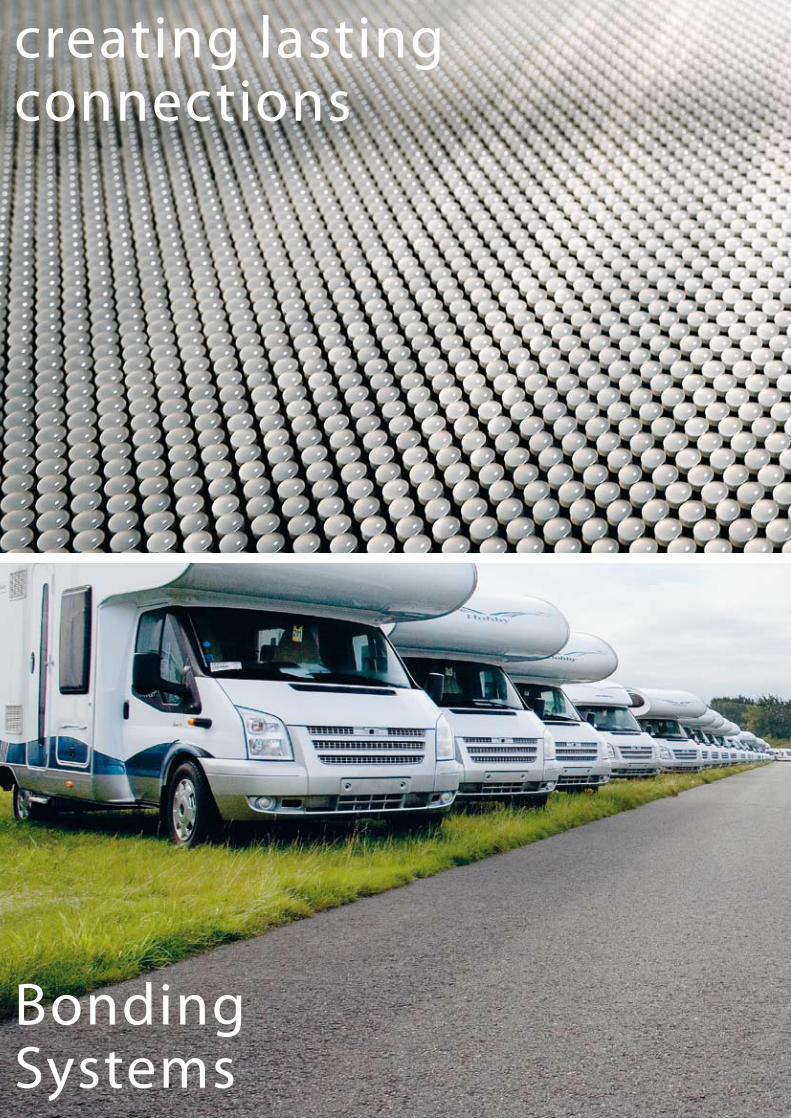
Bonding SystemsBonding Systems is among the world’s leading suppliers of industrial adhesives. Its high-performance products ensure stable and durable bonding and are suitable for a wide range of applications in key markets such as the paper processing industry, the packaging industry, the shoe and textile industries, the furniture industry, as well as for the manufacturing of automotive and motor home interior trims. Bonding Systems also provides ready-made adhesives for flooring installa- tions and ceramic tiles as well as welding rods and leveling compounds for the construction industry. The third business area is synthetic polymers which are marketed as emulsion polymers to customers in the ad hesives, varnish, paint and construction industries.
Movement SystemsMovement Systems is a global industry leader providing top-quality power transmission belts, sophisticated conveyor and processing belts as well as plastic modular, timing and flat belts made of synthetic materials. These products are known under the brand name Siegling. They are used in a wide range of applications in industry, trade and the service sector, e.g. as conveyor and processing belts in the food industry, as treadmill belts in fitness studios or as flat belts in mail distribution centers.
Three divisions – three areas of competence
11

The Flooring Systems division gener-ated net sales of CHF 892.9 million in 2008. This is equivalent to an overall growth of 3.3 % versus the previous year; of which the acquisition of Bonar Floors contributed 6.8 % to this expan-
sion, whereas exchange rates had a marked negative effect of 6.5 %. In local currencies, sales growth was at 9.8 %. Operations particular- ly in the US, France and the Netherlands reported a better-than-aver-age performance. The division’s share of Group total net sales was 47 %. Operating profit (EBIT) came to a gratifying CHF 111.6 million (previous year: CHF 94.9 million). Together with consistent cost man- agement, productivity gains more than offset the strong raw ma- terial price increases for linseed oil and oil-based materials.
Market situation: pleasant growth in a difficult economic environmentThe division’s strategic focus on the commercial market segment is a major reason why Flooring Systems has by a large been spared the effects of the economic downturn. Even markets affected early on by the slowdown of the economy such as the UK, Spain and Portugal held up well, but overall demand in the flooring business declined in the second half of 2008.
As part of the effort to streamline the range, the parquet production in Sweden was dis- continued. Since the output was mainly for the local market, sales in Scandinavia also edged down.
Measures and investments: optimized services for customers and expansion in Eastern Europe
The vinyl flooring factory acquired at the end of 2007 in the Russian town of Kaluga, a city southwest of Moscow, was completely refurbished in the year under review so it can now produce high-quality floor coverings for the commercial market, a segment that is growing continuously in Russia. The sales and distribution of the Smaragd product line will begin in March 2009.
With the acquisition of Bonar Floors at the end of September 2008, Flooring Systems has expanded and strengthened its range of high-end flooring products for the global commer-cial segment. Bonar Floors has a long standing and excellent reputation for innovative commercial flooring applications in the segments healthcare, education and office environ-ments.
Further investments to increase customer focus were made in 2008. In 2009, the new worldwide sales information system, designed to optimize the coordination of sales, marketing and customer service in the commercial segment, will be launched in step- wise fashion.
‘Flooring Systems maintained its growth path in the past business year. A strong first half, though, was followed by a downturn. An important event in the year under review was the acquisition of Bonar Floors, a transaction that was closed on September 30, 2008. This acquisition reinforces Flooring Systems’ leading posi-tion as a system supplier of floor coverings for the commercial segment and expands the product offering within the framework of its proven strategy.’
Tom KaiserExecutive Vice President Flooring Systems
Forbo Flooring Systems: strategic extension of the product portfolio
12

Products: expansion of product portfolioThe acquisition of Bonar Floors highlights a targeted expansion in the product portfolio of Flooring Systems. The range today additionally includes a very special vinyl floor covering. Manufactured by means of a unique electrostatic flocking method, it combines the best characteristics of a carpet with the features of a heavy-duty and low maintenance floor cov - ering. The acquisition also adds entrance matting systems as well as carpet tiles, which are an ideal fit with the existing product portfolio for commercial office environments, hotels, leisure areas and public buildings.
Flooring Systems launched also new collections for both vinyl and linoleum floor coverings. In April a vinyl collection for the commercial segment was launched, followed in October by a special collection with outstanding sound insulation properties. In June, Flooring Sys- tems launched a new design in the linoleum range which responds to the trend in archi-tecture and interior design for the use of tactile natural materials. In addition, a new line for furniture surfaces was launched in May.
Business trend: growth in linoleum and vinyl flooringsThe linoleum product group reported net sales of CHF 415.4 million, corresponding to a growth of well 3 % in local currencies. It thus accounted for 44 % of total divisional sales. Demand for environmentally friendly floor coverings made of renewable materials rose further especially in the US, the UK, France, in the Netherlands as well as in the Asia Pacific region.
The vinyl flooring product group contributed in local currencies with 39 % to sales, repre-senting CHF 365.4 million. This product group also increased sales revenue by well 4 %. Southern Europe, Germany, UK and the Benelux countries all made a higher-than-average contribution to growth in vinyl flooring sales.
As the economic downturn has weakened demand in the private sector, sales of vinyl floor coverings declined in the residential segment. Marmoleum Click, however, again reported growth due to the growing trend to environmentally friendly products.
Outlook: integration of Bonar FloorsEfforts this year will focus on the rapid and complete integration of Bonar Floors by the end of 2009. The aim is to achieve a uniform market appearance for all target groups. As a lead - ing system provider, Flooring Systems intends to expand its portfolio by offering a broad and harmonized product program along with an expanded range of services. At the beginning of 2009, the division unveiled the new Linoleum Global 3 collection – the core of the Flooring Systems product portfolio and the most sustainable product in the area of elastic floor coverings. This collection, available worldwide, includes new surface struc tures and designs, as well as over 50 new colors. The collection, the largest in Forbo’s history, will enforce the global market leadership of environmentally friendly linoleum.
The slowdown in the flooring business in the second half of 2008 will influence the business activity in 2009. The public investment programs in core markets will determine the future business trend to a large extent. Flooring Systems will keep a close look on these develop-ments and take additional measures should the situation deteriorate further.
13
FlooringSystems
creating better environments

FlooringSystems
Floors create spaces and determine the use these are put to, their ambience and comfort. The more specialized the use, the higher the demands placed on the properties of the f looring. The appropriate choice transforms ab- stract space into a personalized ‘living’ room. This is the art of architecture and interior design, an art in which the use of the right materials is essen-tial. Forbo therefore works very closely together with professionals in these areas. In designing its product collections, Forbo designers are also in- spired by nature, art and the latest design trends.

When judging new buildings and renovations, decision-makers take design and aesthetic aspects into account but are also increasingly influenced by two key factors: maintenance costs, i.e. the best functionality for low costs, as well as ecological sustainability. Forbo satisfies these high product demands with its fund of manufactur- ing know-how, life cycle analyses and new and innovative trends and materials that match the most varying needs of its customers. Environmen- tal compatibility plays an ever more important role here. Linoleum is a pure natural product that is manufactured from linseed oil, resin, wood flour, limestone, jute and ecological pigments.

The Bonding Systems division gener-ated net sales of CHF 654.6 million in 2008. This is equivalent to a 14.3 % decrease versus the previous year, of which exchange rates accounted for 5.5 %. The activities in the US market in particular were responsible for this decline, but Spain and Germany also reported lower turnover. The division accounted for 34 % of Group total net
sales. The combination of declining sales and the significant increase in raw material prices into the fourth quarter as well as value ad- justments and extraordinary charges for restructuring measures to adjust the structures to the economic environment led to a sharp drop in operating profit (EBIT) to CHF – 5.7 million (previous year: CHF 53.7 million).
Market situation: the US is the biggest challengeSince the United States account for about one third of the division’s sales, Bonding Systems is particularly exposed to any economic slowdown in this region. The decline in net sales was due in particular to the termination of tax credits for the synfuel business at the end 2007 in the synthetic polymers business. Since these products are used primarily as a raw mate - rial for the production of adhesives as well as of materials used in the construction industry, the sales level could not be maintained, despite intensified sales initiatives.
In the wake of the economic slump in the United States, also the industrial adhesives busi- ness found it significantly more difficult to maintain its sales volume. Since customer segments that are important for Bonding Systems such as durable consumer goods (auto-mobiles, motor homes and furniture) were especially hard hit, a sharp drop in sales was reported particularly towards the end of the year. Sales to the packaging and graphic arts industries more or less matched the previous year’s level.
Sales development in Europe and Asia was generally satisfying for Bonding Systems until October. As of November, however, the decrease was recognized strongly here too. By contrast, the packaging industry and the entire non-woven area (applications for outdoor and medical wear, hygienic products, etc.) continued to perform well. The automotive, wood-processing and textile industries felt the downturn as of mid-year.
Measures and investments: new capacity responds to demandIn the past year, Bonding Systems invested in various measures to increase efficiency. One such measure was the centralization of responsibilities for water-based adhesives in Pirmasens, Germany. Generally speaking, structures and processes were adjusted to con- form to lean manufacturing criteria, marking an important step in efforts to counteract the declining volumes and contracting margins the division is facing.
In the industrial adhesives area, investments were made primarily in fast-growing markets such as Russia, Vietnam and India as well as in marketing efforts in strategic segments. In the building and construction adhesives business, the sales network in Eastern Europe was expanded in order to ensure maximum capacity utilization of the new production plant in Russia.
‘After the termination of the synthetic fuel tax credits at the end of 2007, which impacted on our synthetic polymers business, we were expecting a demanding year in the United States. However, this turned out not to be our only challenge. The economic crisis in the US, which also effected Europe and Asia by the end of the year, and its direct effects on the automotive and textile industries plus other sectors that are important for us, tested us in all areas of the organization. In addition, the price increases for raw materials, which continued into the fourth quarter, caused further margin erosion. The building and construction adhesives business defied the demand downtrend and reached a positive performance de-spite the tougher economic conditions.’
Michel RivaExecutive Vice PresidentBonding Systems
Forbo Bonding Systems: a demanding year
18

In France and Greece, capacity for the production of thermoplastic hotmelts was expanded in order to meet the growing demand in the packaging industry. In China, capacity for the production of thermoplastic hotmelts was increased for applications in the wood-pro-cessing industry.
Products: innovations for the paper and packaging industriesBonding Systems has switched over completely to adhesives formulations with ecological plasticizers for its products for the packaging industry. In this way, Bonding Systems sup- ports the voluntary commitment of the paper and packaging industry to eliminate critical plasticizers from the paper cycle.
For bottle labels, Bonding Systems has introduced new synthetic adhesives with improved overall benefits for customers. They are less expensive, have a better yield and better cleaning properties. In the automotive industry, new PUR hotmelts with improved formula-tions are reducing both investment costs and adhesives consumption for our manufac-turing customers.
Business trend: construction adhesives were a bright spotIn the Bonding Systems divison the building and construction adhesives business has per- formed very well despite the difficult economic conditions. Growth was driven primarily by the markets in Germany and the Benelux countries as well as by the expansion in recent years of the local production in Russia for the Eastern European markets.
The industrial adhesives business performed well in Europe and Asia until the beginning of the fourth quarter and showed signs of weakness in the last months of the year. Expansion especially in Russia, Vietnam and India enabled these markets to make a larger contribution to sales, albeit still at a low level. However, seen on a global scale for the entire year, sales trended downwards.
In the synthetic polymers business, the entire year was characterized by a struggle for market shares owing to the termination of the synfuel business and overcapacity. The business could not reach the previous year’s sales level despite gaining new customers for various ap- plications.
Outlook: structures will be adapted to the changed economic conditionsSince the world economy is not expected to recover during the 2009 business year, Bonding Systems will further adapt its structures to the changed environment. Measures to boost efficiency and cut costs have been introduced in recent months. The synthetic polymer busi- ness, but also the US and European markets in the industrial adhesives business will con-tinue to face major challenges. As things stand now, the industrial adhesives business in Asia will probably be rather flat on the whole. Altough sales of the building and construction adhesives have held up well until now, Bonding Systems believes that they will be flat in 2009 owing to the deepening recession.
Raw material prices currently show a declining trend which could lead to a normalization of the margin situation. Nevertheless, 2009 will be a difficult business year. However, Bonding Systems is confident that it can contribute to positive earnings thanks to new products it has launched, an increased key account customer support as well as a tight cost management.
19
Bonding Systems
creating lasting connections


FlooringSystems
Adhesives are an age-old human invention that have developed into com-plex systems. Nowadays, adhesive systems are present everywhere, unseen, in everyday life. They provide stability and comfort to sports shoes; they impart stability to furniture and water-tightness to textiles; they join pages together to make a book; they ensure reliable and durable bonds for wood- en elements in bridges and prefabricated houses; they bond tiles to the wall; they fix flooring; they join diverse materials in vehicle interiors; they ensure odor-free packaging; and they help the packaging remain stable. Synthetic polymer emulsions are raw materials that are used in the adhe- sives, varnish, paint and construction industries.
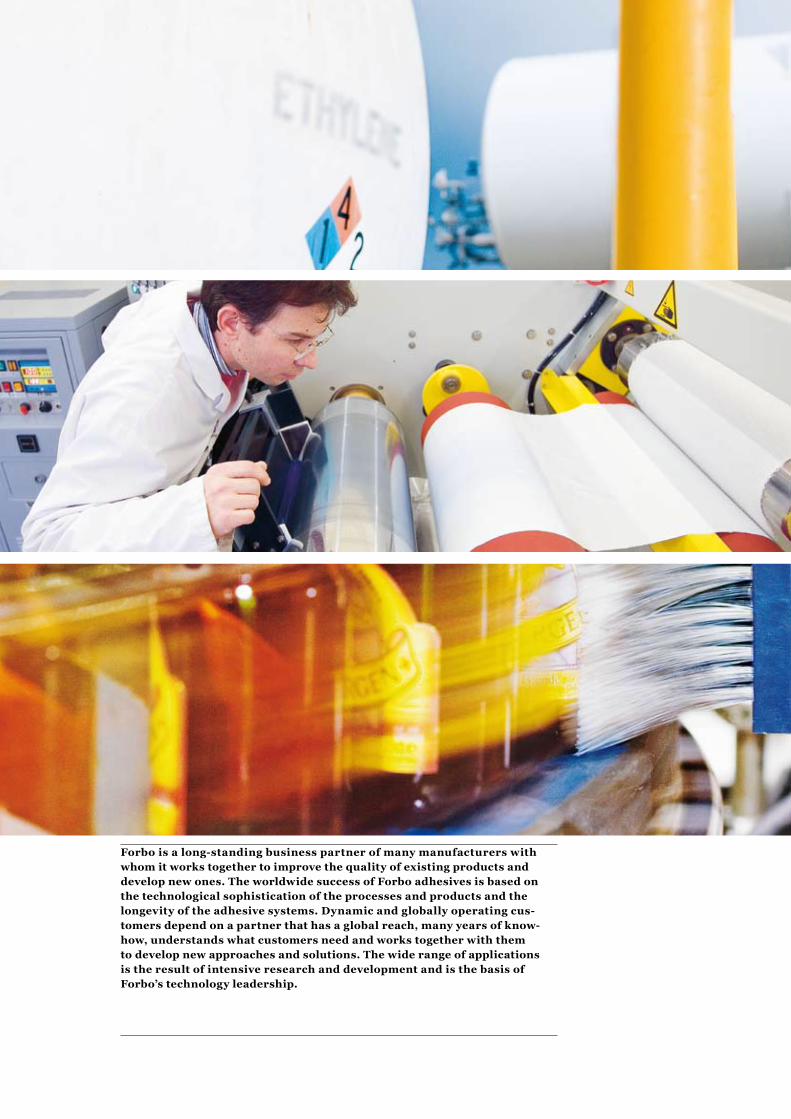
Forbo is a long-standing business partner of many manufacturers with whom it works together to improve the quality of existing products and develop new ones. The worldwide success of Forbo adhesives is based on the technological sophistication of the processes and products and the longevity of the adhesive systems. Dynamic and globally operating cus-tomers depend on a partner that has a global reach, many years of know-how, understands what customers need and works together with them to develop new approaches and solutions. The wide range of applications is the result of intensive research and development and is the basis of Forbo’s technology leadership.
The Movement Systems division generated net sales of CHF 371.2 million in the year under review. This is equivalent to an overall slight decrease of 1.3 % versus the previous year. The acquisition of Transtex Belting contributed with 3.1 % to sales, whereas exchange rates had a strong
negative effect of 5.6 %. However, in local currencies sales growth was at 4.3 %. Certain markets such as Scandinavia, Eastern Europe and Italy performed very well. Sales in other markets such as the UK and Spain were down in comparison with the previous year. The division’s share of Group total net sales was 19 %. Operating profit (EBIT) came to CHF 24.6 million (previous year: CHF 28.0 million). Various factors such as higher raw material prices, margin pressure and exchange rate developments impacted negatively on the result.
Market situation: sales trend firm until fall 2008The gratifying sales and earnings trend in 2007 continued until the end of the third quarter of 2008. As of October, sales declined significantly, which wiped out a good part of the gains made in the first nine months of the year. All the major markets important for Move-ment Systems were affected by this fourth quarter trend. United States, Western Europe, Japan and China, too, lost momentum, even though the US business began to flatten out as early as the summer of 2008.
Orders that were part of larger projects remained at the previous year’s level. Foremost among these are the airports in Helsinki, Fuerteventura, Seoul and Sochi, the Russian site of the Winter Olympics in 2014, which are all being equipped with Siegling belts. The division also supplied major orders to the international courier service companies like FedEx, DHL and UPS.
Measures and investments: substantial strengthening of market presence in US
Movement Systems further strengthened its market presence in the US by acquiring Transtex Belting, the lightweight PVC conveyor belting activities of Fenner Dunlop, in July 2008. The expanded product range features rip and tear-resistant lightweight PVC conveyor belts which are used primarily for special applications in logistics, agriculture and the food processing industry. In addition, Movement Systems has signed a distribution agreement with Fenner Dunlop, giving it access to the lightweight rubber belting products manu-factured by Fenner Dunlop. For Movement Systems, this marks a further step towards be- coming a total belting solutions provider.
A fabrication and logistics center for the Asia Pacific region was opened in Shanghai. Since December 2008, this center has been providing manufacturing services such as cutting and finishing power transmission and conveyor belts for the markets and customers in this region. The Shanghai center also warehouses the belting material manufactured in Europe and the US and then distributes it to the Movement Systems companies as well as distribu-tion partners in Asia Pacific.
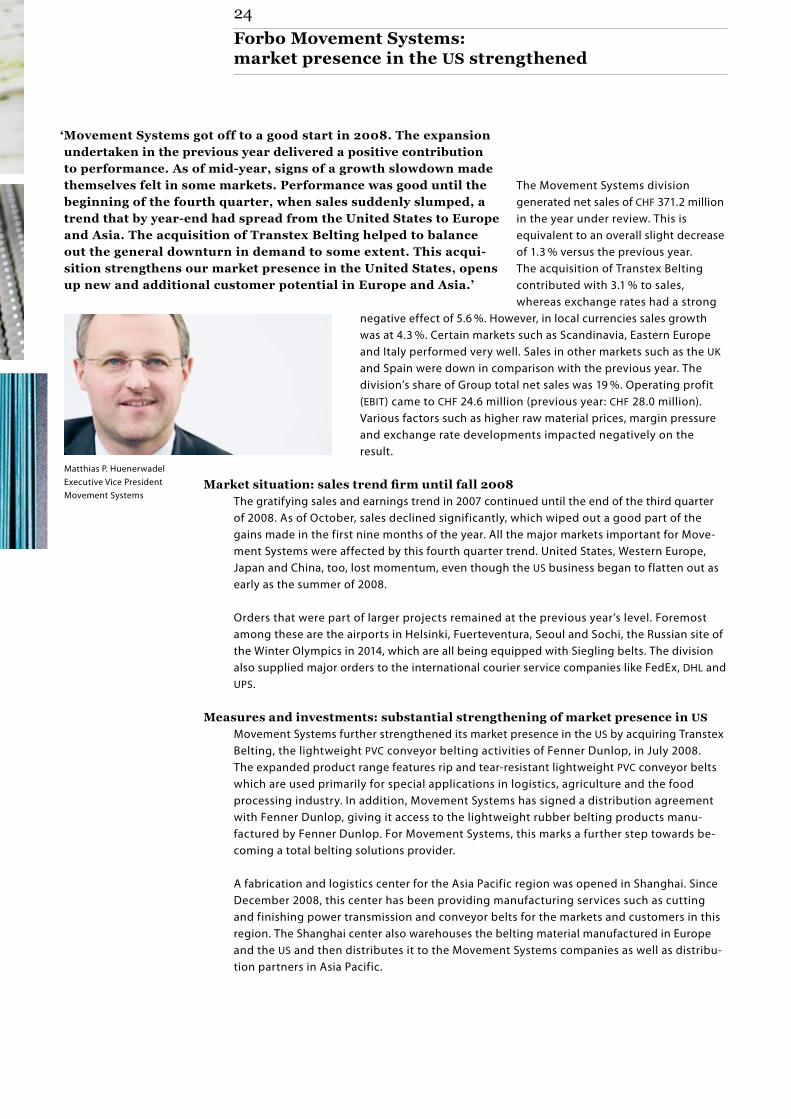
‘Movement Systems got off to a good start in 2008. The expansion undertaken in the previous year delivered a positive contribution to performance. As of mid-year, signs of a growth slowdown made themselves felt in some markets. Performance was good until the beginning of the fourth quarter, when sales suddenly slumped, a trend that by year-end had spread from the United States to Europe and Asia. The acquisition of Transtex Belting helped to balance out the general downturn in demand to some extent. This acqui-sition strengthens our market presence in the United States, opens up new and additional customer potential in Europe and Asia.’
Matthias P. Huenerwadel Executive Vice President Movement Systems
Forbo Movement Systems: market presence in the US strengthened
24
The strategic expansion of sales activities in markets where the division is still under- represented was supported by selective, small-scale acquisitions made in 2007 in Denmark, Italy and the Czech Republic.
Products: innovation for the food and packaging industriesIn the year under review a large number of product innovations were launched that are of great significance for certain customer segments. For the food and packaging industries, a belt-edge seal was developed and launched. This seal prevents contamination of the belts by sealing the edges against bacteria, oils and fats. The technology is new being used also for single-layer belts, which was not previously possible with traditional methods.
The Propipe products of the Italian acquisition made in 2007 have been further developed and have caught on with customers. These products are offered in two specialized lines: as a feeder belt for wide-belt sanders, planing and brushing machines or as a haul-off belt for conveying cables, extruded profiles, steel cables, tubes and hoses.
Business trend: stable growth in the segments food-processing and logisticsAfter the successful strategic reorganization in 2007, the expansion in certain under- represented geographic markets in 2008 as well as diverse product innovations for various customers segments, Movement Systems is today well positioned.
Despite the unfriendly economic environment, the food-processing industry made a positive contribution to sales volume over the entire year under review. This confirms the success of the innovations in this area. Sales to the logistics industry were also stable, owing to the division’s involvement in a number of major projects. As a direct result of the current down- turn, the industrial manufacturing segment and treadmill belts for fitness studios showed a decline in turnover.
Outlook: quality, innovation and service focus are paying offThe past two years have been a preparatory phase for further growth. The focal point in 2009 is the implementation of the measures already initiated to increase efficiency and optimize costs so as to counteract the impact of the economic downturn on the division.
At present, it is difficult to make any forecast about general market trends. However, Forbo expects markets to remain weak, and this will affect net sales of Movement Systems in 2009.
Despite the difficult circumstances, Movement Systems is sticking to its strategy and is banking on its strong roots in the markets and its long-standing cooperation with equip-ment manufacturers and end customers in all relevant markets and segments.
25
Movement Systems
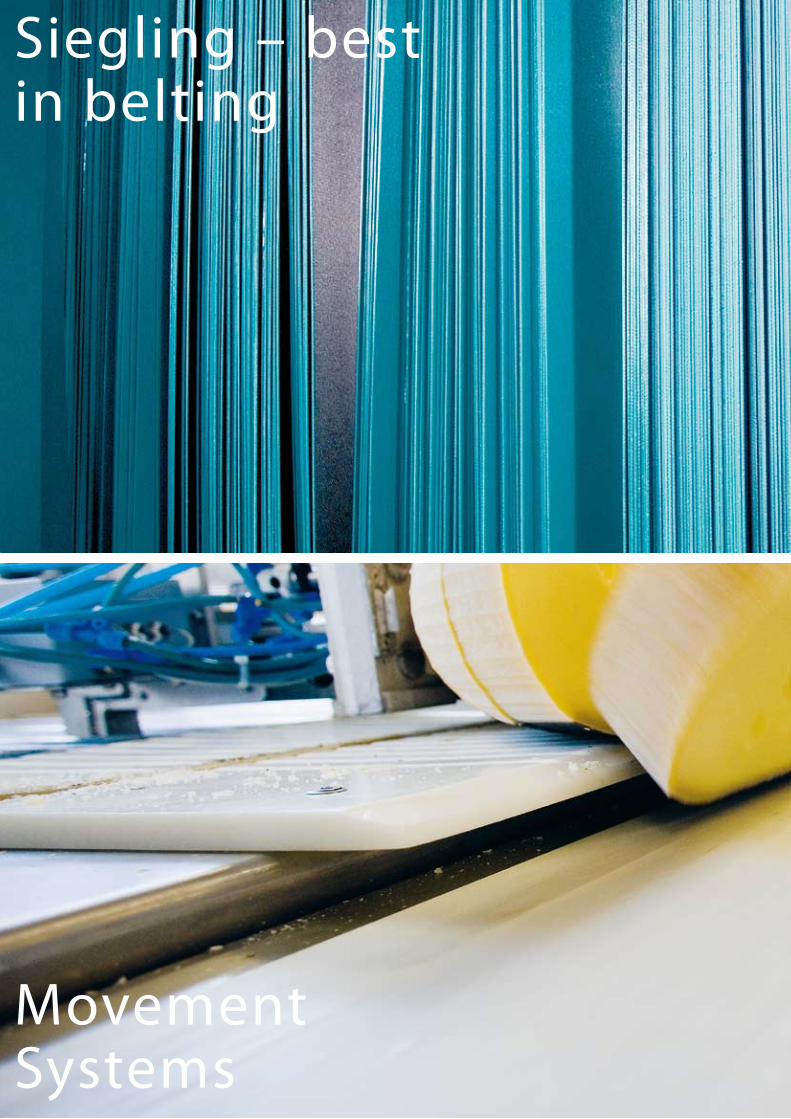
Siegling – best in belting


Global markets today require maximum mobility and f lexibility in all areas of business. Though not always visible, Forbo is present almost every- where, ensuring optimum process reliability. High-quality conveyor and processing belts in the food industry ensure that fresh products are processed efficiently and under hygienic conditions. Treadmill belts in fitness centers keep sports enthusiasts on the move. Conveyor belts and f lat belts are key components in paper manufacturing and processing machines. They are crucial for printing daily newspapers, magazines and journals. Conveyor belts provide smooth baggage handling at airports and an efficient flow in the distribution of letters and packages in logistics centers with state-of-the-art equipment. Forbo’s timing belts

are very widely used as a component in modern drive and handling tech nology and are synonymous with cost-effectiveness, precision and relia bility. As markets become more global, industry needs innovative concepts for production, material flows and logistics, in which conveyor, processing and flat belts often play a crucial role. Leading industrial companies the world over therefore depend on the know-how of Movement Systems as a profes-sional partner in developing sector-specific, forward-looking solutions for drives, transport and manufacturing.

Group Structure
This E. SchneiderDelegate of the Board of Directors and CEO
Tom Kaiser
Flooring Systems
Sales and Marketing
Supply Chain
Management
Services
Michel Riva
Bonding Systems
North America
Europe 1
Europe 2
Asia | Pacific
Building
and Construction
Adhesives
Matthias P.Huenerwadel
Movement Systems
Americas
Europe
Asia | Pacific
Jörg Riboni
Corporate Finance
Controlling
Treasury
Tax
IT
Pensions
international
Investor Relations
Daniel Keist
Corporate Center
Mergers & Acquisitions
Human Resources
Pensions
Switzerland
Communications
Legal Services
Internal Audit
30

Executive Board
Tom
Kaiser
Flooring Systems
Michel
Riva
Bonding Systems
Matthias P.
Huenerwadel
Movement Systems
This E.
Schneider
Delegate of the
Board of Directors
and CEO
Jörg
Riboni
Corporate Finance
Daniel
Keist
Corporate Center
31

This E. SchneiderDelegate of the Board of Directors and CEO
This E. Schneider, born 1952, is a Swiss citizen. He studied economics at the University of St. Gallen (lic. oec. HSG) and at the Graduate School of Business, Stanford University, California, USA. After various management functions in Europe and the USA, he joined the Executive Board of Schmidt-Agency, where he was responsible for strategic planning, operations and logistics from 1984 to 1990. From 1991 to 1993 he was Chairman and CEO of the listed company SAFAA, Paris. In 1994, he became a member of the Executive Board of Valora, with responsibility for the canteen and catering division. From 1997 to 2002, he was Delegate and Vice President of the Board of Directors of Selecta Group. This E. Schneider has been Delegate of the Board of Directors and CEO of the Forbo Group since March 2004. In addition, he is a member of the Board of Directors of Galenica SA and Selecta AG.
Tom KaiserExecutive Vice President Flooring SystemsTom Kaiser, born 1956, is a German citizen. He completed his commercial appren-ticeship in wholesale and export sales at Stahlwerke Süwestfalen in 1978. In 1992, he completed the International Executive Program INSEAD, Fontainebleau. From 1979 to 1988 he worked for Krupp Handel GmbH in North and South America as well as in other locations. From 1988 to 1998 he held various man-agement positions with Vaillant GmbH. In 1998, he joined the Wolf Group as Managing Director. In March 2004, Tom Kaiser was appointed Executive Vice President Flooring Systems and member of the Executive Board of Forbo.
Michel RivaExecutive Vice President Bonding SystemsMichel Riva, born 1964, is a Swiss citizen. He studied economics at the University of Applied Sciences Basel and the IMD Lausanne, where he completed his MBA. From 1989 to 1994 he held various positions in finance at Hoffmann-La Roche. Subsequently, he headed Strapex Corporation, Charlotte, NC, USA. From 1998 to 2004, he held various Managing Director positions for the chemical company DuPont, latterly as Business Director Europe, Middle East and Africa for the DuPont Powder Coatings business unit. In October 2004, Michel Riva was appointed Executive Vice President Bonding Systems and member of the Executive Board of Forbo.
Executive Board
32

Matthias P. HuenerwadelExecutive Vice President Movement SystemsMatthias P. Huenerwadel, born 1968, is a Swiss citizen. He studied engineering at the Federal Institute of Technology, specializing in manufacturing technologies and technology management. He began his professional career as assistant to the Executive Board of Franke Holding AG. In 1997, he moved to the USA, where he was responsible for logistics, information technology and customer service with Federal Home Products, Ruston, LA. From 1999, he held various managerial posi- tions for Franke Foodservice Systems and managed its European operations from 2002 to 2005. Matthias P. Huenerwadel assumed management of the Movement Systems division in October 2005 and is a member of the Executive Board of Forbo.
Jörg RiboniChief Financial Officer, Executive Vice PresidentJörg Riboni, born 1957, is a Swiss citizen. He studied economics at the University of St. Gallen (lic. oec. HSG) and is a Swiss certified public accountant. After various positions in the auditing and consultancy sector, Jörg Riboni joined the Cosa Liebermann Group where he was Head of Controlling and Finances for the Euro- pean Division. In 1995, he was appointed Chief Financial Officer of Jelmoli AG, which was sold at the end of 1996. From 1997 to December 2005, he was Chief Financial Officer of Sarna Kunststoff Holding AG in Sarnen. Jörg Riboni joined the Forbo Group in January 2006. He is a member of the Executive Board and Chief Financial Officer.
Daniel KeistHead Corporate Center, Executive Vice PresidentDaniel Keist, born 1957, is a Swiss citizen. He studied economics at the University of St. Gallen (lic. oec. HSG) and joined UBS in Zurich in 1984, where he was Managing Director and Co-Head of the Corporate Finance Equity Advisory unit. From 1998 to 2001 he was a member of the Executive Committee and CFO of the Selecta Group. He was then a partner at Ernst & Young Corporate Finance in Zurich until 2003, where he was responsible for various M & A, restructuring and financing transactions. Until the summer of 2007, he was a member of the Executive Committee of SIX Swiss Exchange and headed the Admissions division. Daniel Keist has been a member of the Executive Board since August 2007 as Head Corporate Center.
33
34
Division: Flooring Systems, Netherlands Operational Area: Production and Warehouse

35
Group structure and shareholdersGroup structureForbo Holding Ltd, domiciled at Lindenstrasse 8, 6340 Baar, is a limited company under Swiss law. The holding company holds all companies, directly or indirectly, that belong to the Forbo Group. The operational structure of the Group is shown in the organizational chart on page 30. The scope of consolidation of Forbo Holding Ltd does not include any listed companies. The unlisted companies within the scope of consolidation of Forbo Holding Ltd are listed under 'Group companies' starting on page 110 of the financial report. The com-pany name and domicile, share capital and percentage of participation along with informa-tion relating to the allocation of the Group companies to the Group’s businesses can also be found in this list.
Significant changes and developments in 2008On September 30, 2008, Forbo Holding Ltd completed the takeover of Bonar Floors, the flooring division of the UK company Low & Bonar PLC, which had been announced at the end of July 2008. The eleven Bonar Floors companies were acquired by Forbo Holding Ltd and its subsidiaries Forbo Participations SAS, Forbo Beteiligungen GmbH and Forbo NL Holding B.V.
Significant shareholdersAs of December 31, 2008, 1,905 shareholders were listed in the share register of Forbo Holding Ltd, or 19 (1 %) fewer than in the previous year. At December 31, 2008, Forbo Holding Ltd knew of the following significant shareholders with a holding of more than 3 %:
31.12.2008
in (%) Michael Pieper1) 31.45
Forbo Holding AG2) 17.78
This E. Schneider 5.24
Tweedy, Browne Company LLC 3.00 – 5.00
1) Michael Pieper holds his stake directly and indirectly through Artemis Beteiligungen I AG2) 1st trading line: 9.93 %; 2nd trading line 7.86 %
The disclosure of significant shareholders and significant groups of shareholders is effected in accordance with Article 20 of the Federal Stock Exchange and Securities Trading Act (SESTA) and the provisions of the Ordinance of the Federal Banking Commission (FBC Ordi- nance) on stock exchanges and securities trading. According to reports received by Forbo Holding Ltd, in 2008 the following significant shareholders or shareholder groups have exceeded or fallen below the thresholds set out in Article 20 SESTA and the FBC Ordinance:
At Forbo, the concept of corporate governance encompasses the entire set of principles and rules on organization, conduct and transparency designed to protect shareholders’ interests. Forbo’s aim is to strike a careful balance between management and con-trol. The central rules are contained in the Articles of Association, the Organizational Regulations, and the regulations of the com-mittees of the Board of Directors. The following information is set out in line with the Directive on Information relating to Corporate Governance (Corporate Governance Directive ‘DCG’) and the relevant publications of SIX Swiss Exchange.
Corporate Governance

36
Tweedy, Browne Company LLC reported on January 16, 2008, that it had fallen below the threshold of 5 % and now held 122,873 registered shares, corresponding to 4.53 % of the voting rights. The beneficiaries of these shares are the various funds of the asset manager Tweedy, Browne Company LLC. Tweedy, Browne Fund Inc., one of these funds, reported on January 16, 2008, that it held a total of 82,113 registered shares, corresponding to 3.03 % of the voting rights. Tweedy, Browne Fund Inc. then reported on September 23, 2008, that it had fallen below the threshold of 3 %, while Tweedy, Browne Company LLC still held over 3 % of the voting rights of Forbo Holding Ltd.
Focus Capital Investors, LLC, New York, reported on January 17, 2008, that it had exceeded the 10 % threshold (new 10.71 %). On February 22, 2008, it reported that its holding had fallen below the threshold of 5 % (new 3.51 %) and on February 27, 2008, it reported that its holding had fallen below 3 %.
Deutsche Bank AG reported several changes in the composition of the shareholders’ group on January 17, 2008, and on February 1, 2008. According to the latest report, the corporate group consists of Deutsche Bank AG, Frankfurt am Main (D), and Deutsche Bank Securities Inc., New York (USA). The group holds its stake directly and indirectly through Deutsche Bank AG, Frankfurt am Main (D), Taunus Corporation, Wilmington (USA), and DB U.S. Financial Mar- kets Holding Corporation, Wilmington (USA). On February 25 and 26, 2008, Deutsche Bank AG announced that it held 167,663 (and 156,445) registered shares, corresponding to 6.18 % (and 5.766 %) of the voting rights, plus 82,856,379 (and 37,896,309) convertible and purchase rights for 386,765 (and 161,970) registered shares, corresponding to 14.255 % (and 5.97 %) of the voting rights. Finally, on March 25, 2008, the group reported that its holding had fallen below the 3 % threshold for both purchase and selling positions.
Artemis Beteiligungen I AG, through which Michael Pieper indirectly holds part of his stake in Forbo Holding Ltd, reported on February 11, 2008, that Michael Pieper and Artemis Beteiligungen I AG held 814,894 registered shares of Forbo Holding Ltd directly and indi- rectly as per December 1, 2007, corresponding to 30.035 % of the voting rights.
Gartmore Investment Limited reported on February 27, 2008, that it had exceeded the 5 % threshold (new 8.382 %). On June 30, 2008, it reported that its holding had fallen below the threshold of 3 %.
Goldman Sachs Group Inc. reported on February 29, 2008, that its holding had fallen below the 3 % threshold as per December 1, 2007, and that it held its interest through Goldman Sachs International, London (UK), Goldman Sachs Asset Management, Wilmington (USA), and Goldman Sachs Asset Management International, London (UK). It also reported, first, that it had exceeded the 5 % threshold as per February 20, 2008 (new 5.05 %); second, that it had written convertible and purchase rights for 136,082 registered shares of Forbo Holding Ltd, corresponding to 5.02 % of the voting rights; and, third, that the group now consisted of Goldman Sachs International, London (UK), and Goldman Sachs Asset Management, Wilming- ton (USA). Lastly, it reported on February 29, 2008, that it had fallen below the 3 % threshold for both purchase and selling positions as per February 27, 2008.
Forbo Holding Ltd reported on July 2, 2008, that, as a result of acquiring its own shares via the second trading line, it had exceeded the threshold of 10 % as per June 26, 2008, and the threshold of 15 % as per July 1, 2008, and that, directly or indirectly, via Forbo Interna-tional SA, Baar (CH), and Forbo Finanz AG, Baar (CH), it held 425,665 registered shares, corre- sponding to 15.689 % of the voting rights. In addition, the Forbo Group has granted (written) 25,256 convertible and purchase rights for 26,256 registered shares of Forbo Holding Ltd, corresponding to 0.968 % of the voting rights.
37
For further information on significant shareholders or shareholder groups, we refer the reader to page 35 (duty of disclosure pursuant to Article 663c, Swiss Code of Obligations).
Cross-shareholdingsForbo Holding Ltd has not entered into any cross-shareholdings with mutual capital share- holdings or voting rights.
Capital structureShare capitalAs of December 31, 2008, Forbo Holding Ltd had a fully paid up share capital of CHF 10,852,608, which was divided into 2,713,152 listed registered shares, each with a par value of CHF 4. Of this amount:
– 61.94 % were registered in the name of 1,859 shareholders with voting rights– 26.81 % were shares of banks and SIS (SegaInterSettle AG) pending registration of transfer– 11.25 % were registered in the share register without voting rights
The shares of Forbo Holding Ltd (security number 000354151 / ISIN CH0003541510) are listed on SIX Swiss Exchange. No different categories of shares exist; each share entitles the shareholder to one vote. Further information on the Forbo share can be found on pages 56 and 57. Further information on the rights of participation associated with the share can be found on page 53.
At the Ordinary General Meeting of Shareholders of Forbo Holding Ltd of April 25, 2008, the Board of Directors was authorized to buy back the company’s own shares up to a maximum of 10 % of the share capital over a period of three years through a second trading line with the purpose to extinguish them at a later stage. By December 31, 2008, Forbo Holding Ltd had repurchased 213,152 shares (7.856 % of the voting rights) via the second trading line.
Conditional and authorized capital Pursuant to §6 of the Articles of Association, Forbo Holding Ltd has a maximum conditional capital of CHF 665,800, corresponding to 166,450 registered shares to be paid up in full with a par value of CHF 4 each. The capital increase takes place in accordance with the Articles of Association through the exercise of option and convertible rights which are granted in connection with bonds issued by the company or one of its subsidiaries or through the exer-cise of option rights which are granted to the shareholders. Except for shareholder options, shareholders have no right of subscription. Holders of option or convertible rights are entitled to subscribe to new share issues. The registration of the new shares is subject to the general restriction set out in §4 of the Articles of Association, which stipulates that share-holders are entered in the share register with voting rights only if they declare expressly that they have acquired the shares in their own name and for their own account.
There is no authorized capital.

38
Changes in capitalThe Ordinary General Meeting of Forbo Holding Ltd on April 25, 2008 decided, based on the audit report of an accredited expert auditor, to reduce the ordinary share capital of the company by CHF 27,131,520 from CHF 37,984,128 to CHF 10,852,608 by reducing the par value of the shares from CHF 14 to CHF 4. It was further decided to pay out the difference of CHF 10 per share to the shareholders and to amend the Articles of Association accordingly.
The Ordinary General Meeting of Forbo Holding Ltd on April 27, 2007 decided, based on the special audit report of a specially qualified auditor, to reduce the ordinary share capital of the company by CHF 16,278,912 from CHF 54,263,040 to CHF 37,984,128 by reducing the par value of the shares from CHF 20 to CHF 14. It was further decided to pay out the difference of CHF 6 per share to the shareholders and to amend the Articles of Association accordingly.
The share capital of Forbo Holding Ltd did not change in 2006.
Participation certificates and 'Genussscheine' (non-voting equity securities)Forbo Holding Ltd has neither participation certificates nor non-voting equity securities.
Limitations on transferability and nominee registrationsForbo Holding Ltd does not have any percentage limitations on voting rights. The Board of Directors may only refuse registering in the share register if the acquirer of the stock does not expressly declare at the company’s request that he has acquired the shares in his own name and for his own account.
Pursuant to §4 of the Articles of Association, nominees may be entered in the share register with voting rights for up to a maximum of 0.3 % of the registered share capital entered in the Commercial Register. Over and above this limit, nominees are only entered provided the name, address and shareholding of those persons are disclosed for whose account the nominee holds a total of 0.3 % or more of the registered share capital entered in the Com- mercial Register.
Resolutions on the amendment or abrogation of the clause on the registration of registered shares require a majority of two thirds of the votes represented at the General Meeting and the absolute majority of the par value of the shares represented.
No statutory privileges exist, and, with the exception of the above-mentioned requirement of making the beneficiary known, there is no restriction on the transferability of the shares of Forbo Holding Ltd.
Convertible bonds and warrants / optionsForbo Holding Ltd has no outstanding convertible bonds nor has it issued any marketable warrants / options. Information on the option program available to the Executive Board can be found on pages 50 and 51 of this Annual Report.

39
Board of DirectorsMembers of the Board of Directors The cutoff date for the following information is December 31, 2008.
With the exception of This E. Schneider, Delegate of the Board of Directors and CEO, none of the members of the Board of Directors listed below has or has had any operational management tasks for Forbo Holding Ltd or its Group companies. With the exception of This E. Schneider, none of the members of the Board of Directors sat on the Executive Board of Forbo Holding Ltd or the management of its Group companies in the three busi-ness years preceding the period under review. There are no essential business relation-ships between the members of the Board of Directors and Forbo Holding Ltd or its Group companies.
Dr. Albert Gnägi, Chairman Albert Gnägi, born in 1944, is a Swiss citizen. He studied law at the Universities of Zurich and Rome and holds a doctorate in law (Dr. iur.). He practices law in Zurich, specializing in commercial, company and inheritance law. He was Chairman of the Board of Selecta Group from the IPO in 1997 until the takeover by the British company Compass Group in early 2001. From 1982 to 1997, he was a member and Chairman of the Board of Directors of Immuno International AG, a manufacturer of biological pharmaceuticals, which went public in Zurich in 1989. Since 1980, Albert Gnägi has been a member of the Board of Trustees of the Sanitas Hospital in Kilchberg, and its president since 2002. Since 2007 he is Chairman of the Board of Directors of the SAM Group Holding AG in Zurich. He holds additional board memberships in other companies and foundations. He has been Chairman of the Board of Directors of Forbo Holding Ltd since March 2005.
Michael Pieper, Vice Chairman Michael Pieper, born 1946, is a Swiss citizen. He took a degree in economics (lic. oec. HSG) at the University of St. Gallen. Michael Pieper has been with the Franke Group since 1988 and its owner and CEO since 1989. He is a member of the Board of Directors of Hero AG, advalTech Holding AG, Feintool International Holding AG and of the Supervisory Board of ThyssenKrupp Stainless AG (Germany). He was first elected to the Board of Directors of Forbo Holding Ltd in 2000.
This E. Schneider, Delegate and CEO For the curriculum vitae of This E. Schneider, please see page 32 of this Report.
Dr. Peter Altorfer Peter Altorfer, born 1953, is a Swiss citizen. He studied law at the University of Zurich and holds a doctorate in law (Dr. iur.). He attended the PED program at the IMD, Lausanne. Until 1988, he worked at Bank Leu AG. He subsequently joined the law firm Wenger & Vieli in Zurich, where he is now a partner, specializing in bank and company law. Peter Altorfer is a member of the Board of Directors of various companies, including Huber + Suhner AG, Herisau, agta record ag, Fehraltorf, and Abegg Holding AG, Zurich, and of several private and foreign banks in Switzerland. He has been a member of the Board of Directors of Forbo Holding Ltd since March 2005.

Division: Movement Systems, North America Operational Area: Production
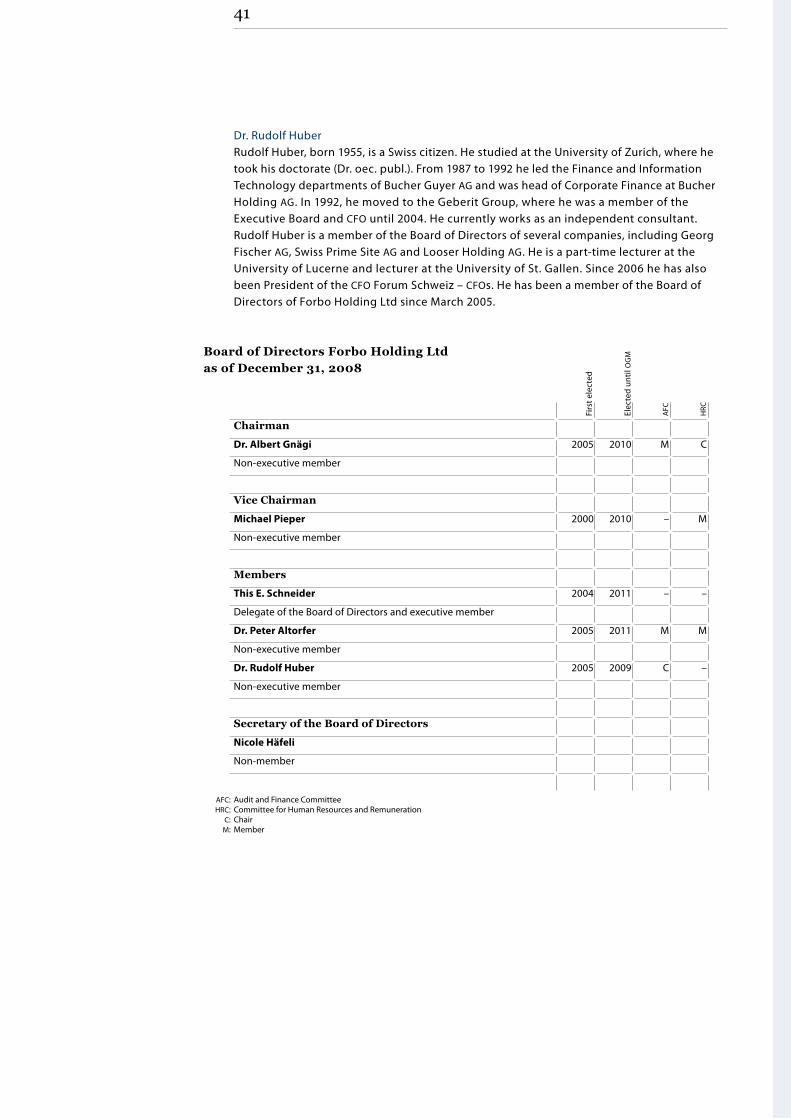
41
Dr. Rudolf Huber Rudolf Huber, born 1955, is a Swiss citizen. He studied at the University of Zurich, where he took his doctorate (Dr. oec. publ.). From 1987 to 1992 he led the Finance and Information Technology departments of Bucher Guyer AG and was head of Corporate Finance at Bucher Holding AG. In 1992, he moved to the Geberit Group, where he was a member of the Executive Board and CFO until 2004. He currently works as an independent consultant. Rudolf Huber is a member of the Board of Directors of several companies, including Georg Fischer AG, Swiss Prime Site AG and Looser Holding AG. He is a part-time lecturer at the University of Lucerne and lecturer at the University of St. Gallen. Since 2006 he has also been President of the CFO Forum Schweiz – CFOs. He has been a member of the Board of Directors of Forbo Holding Ltd since March 2005.
Chairman
Dr. Albert Gnägi 2005 2010 M C
Non-executive member
Vice Chairman
Michael Pieper 2000 2010 – M
Non-executive member
Members
This E. Schneider 2004 2011 – –
Delegate of the Board of Directors and executive member
Dr. Peter Altorfer 2005 2011 M M
Non-executive member
Dr. Rudolf Huber 2005 2009 C –
Non-executive member
Secretary of the Board of Directors
Nicole Häfeli
Non-member
Firs
t ele
cted
AFC
HRCElec
ted
until
OG
MBoard of Directors Forbo Holding Ltdas of December 31, 2008
AFC: Audit and Finance Committee HRC: Committee for Human Resources and Remuneration C: Chair M: Member
42
Elections and terms of office The members are elected by the General Meeting for a term of three years. A year is defined as the period between two Ordinary General Meetings. The first term of office after the first election of a member of the Board of Directors is designed so that every year about one third of all members have to be elected or re-elected. Members may be re-elected several times. At the Ordinary General Meeting on April 25, 2008, This E. Schneider was re-elected for a further three-year term. Dr. Peter Altorfer was re-elected for a three year-term in an election that had been brought forward. Further details on the terms of office of the other members of the Board of Directors are contained in the table on page 41. In accordance with the Organizational Regulations of Forbo Holding AG, members who have reached the age of 70 resign from the Board of Directors at the Ordinary General Meeting of the follow-ing year. The average age of the incumbent members of the Board is around 58. In deter-mining the composition of the Board of Directors, importance is attached to the election of independent individuals with international experience in industrial companies as well as in the financial and consultancy sectors.
Internal organizational structure The allocation of tasks within the Board of Directors and the composition of the two Board committees are shown in the table on page 41.
Decisions are as a general rule taken by the full Board of Directors. The Board constitutes two standing committees from its own ranks – the Audit and Finance Committee (AFC) and the Committee for Human Resources and Remuneration (HRC) – to deal with clearly defined subject areas of overriding importance. These two committees have mainly advisory and control functions. In addition, the HRC is empowered to determine the compensation paid to members of the Executive Board. The remuneration of the Delegate of the Board of Directors and CEO is determined by the full Board of Directors. The members of these two committees are elected by the Board of Directors on an annual basis and can be dismissed at any time.
As a rule, the Chairman of the Board of the Directors chairs the meetings of the Board and the General Meeting. He plans and conducts the meetings of the Board and the General Meeting. The meetings of the Board and the relevant items on the agenda are prepared by the Chairman in consultation with the CEO. The Chairman monitors the execution of the measures adopted by the Board and is in regular contact with the CEO for this purpose. He is the direct superior of the CEO. In addition, the Chairman, in consultation with the CEO, represents the Board vis-à-vis the public, the authorities and the shareholders.
The Vice Chairman is tasked with deputizing for the Chairman should the latter be prevented for any reason whatever. In accordance with the Organizational Regulations and actual practice, the Vice Chairman has no further duties.
The Delegate of the Board of Directors is also CEO and as such is responsible for the opera-tional management of the company and for the tasks delegated to him by the Board of Directors. The members of the Executive Board report to him for the exercise of this function.
The Chairman, Vice Chairman and Delegate (CEO) are elected by the Board of Directors.
43
The Board of Directors meets on being convened by the Chairman, as often as business requires but at least four times a year. When the Board is convened, the items on the agenda must be notified at least five working days before the day of the meeting. This notification period may be shortened in urgent cases. In 2008, the Board of Directors met eight times, the meetings usually lasting a whole day.
After mutual consultation, the Chairman and the CEO may invite members of the Executive Board or other senior employees to attend Board meetings for individual items. Regular use is made of this option. External consultants participate in the meetings of the Board of Directors, the AFC or the HRC only in exceptional circumstances to deal with particular items. In principle, however, the meetings are held without external consultants.
Audit and Finance CommitteeThe Audit and Finance Committee (AFC) advises the Board of Directors in respect of its duties on behalf of the company in the areas of financial reporting, the accounting standards and systems used, and significant financial decisions. The AFC establishes the audit program of the Internal Auditing and selects the external auditors for the attention of the Ordinary General Meeting and proposes the external auditors to the General Meeting respectively. The CEO, CFO, and Head Corporate Center are regularly requested to attend meetings in an advisory capacity, while the internal and external auditors may attend on special invitation.
The AFC convenes as often as business requires, but at least twice a year. In the 2008 business year, two meetings were held, each lasting about half a day.
Committee for Human Resources and Remuneration The Committee for Human Resources and Remuneration (HRC) advises the Board of Direc-tors in respect of its human resources duties on behalf of the Group, in particular as regards the Board itself and senior management personnel. The HRC prepares human resources policy proposals for the attention of the Board of Directors regarding the selection of the members of the Board and of the CEO, and it assesses and approves the proposals of the CEO regarding the employment of the Executive Board members. It prepares recommenda-tions for the Board of Directors regarding the remuneration of the Board, the Chairman, the Committee members and the CEO. The CEO is regularly involved in an advisory capacity. Agenda items and matters affecting the function or the person of the CEO are deliberated in his absence.
The HRC convenes as often as business requires. In 2008, two meetings were convened, each lasting about half a day.

Division: Bonding Systems, China Operational Area: Warehouse and Logistics
45
Areas of responsibility The Board of Directors bears ultimate responsibility for the management of Forbo Holding Ltd. The main duties of the Board are the following non-transferable and indefeasible tasks pursuant to the Swiss Code of Obligations and the Articles of Association:
– ultimate management of the company and issuing the necessary directives– defining the organization– organization of financial controlling, auditing and financial planning– appointment and dismissal of persons entrusted with management of the company– preparation of the Annual Report and of the General Meeting and implementation of
its resolutions– notification of the court in the event of overindebtedness
The Board of Directors bears ultimate responsibility for supervising and monitoring man - a gement of the company and is responsible for the corporate strategy. It issues guidelines for business policy and is regularly briefed on the current state of business.
Business to be dealt with by the Board of Directors is regularly submitted in advance to the AFC, HRC, ad hoc committees or individual members, depending on the subject, for review or an opinion. With the exception of its non-transferable and indefeasible tasks, the Board of Directors may transfer tasks and responsibilities in full or in part to individual members of the Board or to non-Board members.
The Board of Directors is empowered to take decisions on all matters which are not reserved or transferred to the General Meeting or another body of Forbo by law, the Articles of Association or regulations.
Management of the company has been delegated entirely to the CEO. Accordingly, the CEO is responsible for the operational management of the company.
In carrying out his tasks, the CEO is supported by the members of the Executive Board, who report to him directly. The Executive Board comprises the CEO, CFO, Head Corporate Center, and the Executive Vice Presidents of the three divisions. It is responsible for the long-term success and market-driven management of the Forbo Group. This involves preparing the bases for decision-making for the Board of Directors regarding:
– corporate strategy, corporate targets, business policy, medium-term plans and budgets– corporate organization– organization of financial planning, auditing and financial controlling– financing and treasury principles– human resources and compensation policy
The members of the Executive Board are responsible for their particular area of activity and also bear responsibility for safeguarding the interests of the company and the Group result.
46
Information and control instruments vis-à-vis managementThe Executive Board meets as often as business requires, normally once a month. In the 2008 business year, twelve meetings were held, each lasting between half a day and a full day.
At the meetings of the Board of Directors, any member may request information about all matters concerning the Forbo Group. Outside the meetings, such requests for informa-tion are to be addressed to the Chairman. The CEO and the other members of the Exe- cutive Board inform the Board of Directors at each regular meeting about the current state of business, important business events and significant deviations from the budget.
The Chairmen of the AFC and HRC report at the Board meetings on the activities of their committees and express their opinions and recommendations on the business items on which decisions are to be taken. Each member of the Board of Directors has the right to inspect the minutes of the AFC and HRC meetings. The Executive Board reports to the AFC through the CFO in consultation with the CEO; it reports to the HRC through the CEO.
The Board is also regularly briefed outside meetings about events and challenges facing the Group and the general performance of the businesses. In addition, the Chairman, Vice Chairman and CEO are in continuous contact when essential business policy issues are involved. For important, particularly urgent events, the CEO informs the Chairman and the other members of the Board immediately.
The Delegate of the Board, who is at the same time CEO, conducts the meetings of the Executive Board. For details concerning the participation of members of the Executive Board in meetings of the Board of Directors and its committees, see the sections on internal organization, the AFC and the HRC on pages 42 and 43 of this report.
The Board of Directors furthermore fulfils supervisory and monitoring obligations as regards financial reporting and its role in the planning cycle. The internal and external auditors also assist the Board in this task.
As part of financial reporting, the Board of Directors is informed as a rule once a month in writing about the company’s current business performance and earnings situation by means of annotated income statements, key ratios and deviation analyses.
The Board of Directors is, moreover, involved in the company’s planning cycle. In the first half of the year, the existing strategy is subjected to a thorough review by the Board. The revised strategy is quantified in the three-year medium-term plan, which is approved at mid- year by the Board. Based on the medium-term plan, the Board of Directors sets the budget objectives for the coming business year. These budget objectives are the basis for the detailed budget, which is approved and adopted by the Board of Directors in the fourth quarter.

47
The current business year is assessed in an initial appraisal at the end of April and in a second appraisal at the end of September. On completion of the business year, the extent to which the budget has been reached is checked and deviations are analyzed. This analysis is used to derive appropriate measures, which are then implemented in the next planning cycle.
Internal Auditing is administratively subordinated to the Head Corporate Center and is functionally independent. It reports to the AFC. Since March 2008, internal audits are no longer carried out with internal resources but are effected by Ernst & Young, which has been commissioned for this purpose.
The audits are conducted in accordance with an annual plan approved by the AFC. The following types of audit are distinguished: full scope audits, limited reviews, follow-up reviews, compliance audits und special engagements.
The risks and weaknesses identified in these audits are, where necessary, minimized or eliminated by measures adopted by management and are constantly monitored.
Prior to the transfer of Internal Auditing to Ernst & Young, the internal audit department had two auditors. In 2008 a total of eight full scope audits and one special engagement were conducted. The full scope audits were limited to individual business processes. Internal Auditing included in its review of audited Group companies any issues that had been de- fined in the framework of the internal control system (ICS). Internal audits, furthermore, involve various compliance reviews that focus on these processes. Lastly, additional risks and controls in connection with the above-mentioned business processes are analyzed in the audit. In each division at least one Group company was audited in the course of the full scope audits.
In compliance with Article 728a Swiss Code of Obligations, which came into force on January 1, 2008, the internal audit department and external consultants provided local man- agement of various Group companies with support in introducing a uniform internal control system (ICS). As part of the introduction of the ICS, the key control mechanisms in various business processes were documented and adjusted or completed where necessary. The necessary adjustments were made by local management on the basis of an action plan. By means of walk-through tests, the implementation and reliability of the controls were examined through random testing.

Division: Bonding Systems, France Operational Area: Quality Control / Research and Development
49
Risk management The ongoing and systematic evaluation of current and future risks invariably involves identifying and capitalizing on opportunities. Forbo regards risk management as a manage-rial and working tool designed to safeguard the tangible and intangible assets of the company.
Forbo has a risk-based insurance coverage in line with industry practice and has insured in particular operational risks such as property damage, business interruption, and statutory liability. The risks specifically in the areas of property damage, business interruption and statutory liability are examined in the context of periodic risk engineering reports by external experts. For this purpose, production companies are visited at regular intervals, and com- prehensive surveys are worked through with local management. Action plans are drawn up and implemented based on the risks identified. These risk engineering reports have been prepared since 1990.
As regards business risks, Forbo addresses both strategic risks and market and financial risks. In the area of market risks, interest and currency risks are monitored centrally and hedged in certain cases (see pages 105 until 109 of the financial report). The liquidity and financing of subsidiaries are also monitored centrally.
With respect to the risk management process introduced at the beginning of 2008 in con - nection with Article 663b, section 12, Swiss Code of Obligations, which came into force on January 1, 2008, please refer to the comments on page 105 of the financial report; note 33 'risk assessment and financial risk management'.
Executive BoardMembers of the Executive Board, activities and vested interestsThe members of the Executive Board, their nationality, function, training and professional career as well as other activities and vested interests are set out on page 32 and 33 of this report.
Management contracts Forbo Holding Ltd has concluded no management contracts with third parties.
Compensations, shareholdings and loansContent and method of determining the compensation and the shareholding programs
Board of DirectorsThe amount of compensation paid to the Board of Directors is worked out by the HRC in the spring for the current year and submitted to the full Board of Directors at its April meeting for approval. In order to determine the remuneration, the compensation paid to Board members of Forbo Holding Ltd is compared with that paid to Board members of comparable industrial companies based on information that is available from publicly accessible sources or is known to Board members from their experience of office in similar companies. No external consultants are co-opted for determining the remuneration.

50
The members of the Board of Directors receive a fixed remuneration, the amount of which is gradated according to whether the member is Chairman or a simple member of the Board and whether he is a member of the AFC or HRC. 40 % of the consideration is distributed to the Board of Directors as Forbo stock. These shares have a vesting period of three years. The shares are valued by taking the average price in the ten stock market days after distribution of a dividend or repayment of par value. If no dividend is distributed or no repayment of par value is made, the average price during the first ten stock market days in June of the relevant business year applies. Payment or the distribution of the shares takes place in December.
The amount of the remuneration for each Board member in the year under review, along with the details of the valuation of the shares, can be found on page 124 of the financial report.
Executive BoardThe amount of the fixed remuneration and the target bonus for the Executive Board is set by the HRC in the fall for the following year; members of the Executive Board are excluded from the deliberations. In order to determine the remuneration, the compensation paid to Forbo Executive Board members is compared with that paid to Executive Board members in comparable industrial companies based on information that is available from publicly accessible sources or is known to the members from their experience of office in similar companies. No external consultants are co-opted for determining the remuneration.
The compensation of the members of the Executive Board consists of a fixed base salary plus a performance-dependent bonus, which is determined in March, on completion of the business year, on the basis of individual and company target achievement.
The variable (performance-related) component is tied to financial (quantitative) and qual- itative targets which are defined in accordance with the operational responsibility of the Executive Board member in question. The qualitative targets are geared to the company’s long-term sustainable development and may account for between 15 % and 40 % of the total variable component; the remaining portion of the variable component depends on the achievement of the financial (quantitative) targets. Depending on the function of the respective Executive Board member, these may be Group or Division objectives and refer in particular to net sales, EBITDA, EBIT, net working capital and net income. The variable component may be as much as 120 % of the fixed remuneration, depending on the indi-vidual’s target achievement.
Payment of a bonus is linked with the Management Investment Plan (MIP) launched in 2006. According to this plan, at least 50 % of the annual bonus of Executive Board members is channeled into the MIP. 25 % of these sums in the MIP are invested in options and 75 % in shares. Shares and options are subject to a three-year vesting period; the options have a maturity of five years.

51
Of special note with regard to the MIP is the treatment of options in the event of termina-tion of the employment contract, invalidity or retirement. If notice is given terminating the employment contract during the vesting period, the options are repurchased; the repur-chase price corresponds to 100 % of the theoretical average value of the option based on the share value during the last 14 trading days for the share before the employment con- tract was terminated. In the event of invalidity or retirement (including early retirement), the options – regardless of whether or not they are still subject to a vesting period – may be sold during the entire remaining period to maturity from the moment the invalidity or retirement begins.
As per balance-sheet date December 31, 2008, the Board of Directors and Executive Board held the following options:
The amount of the remuneration for the Executive Board in the year under review, along with the details of the valuation and distribution of the shares, can be found on pages 124 and 126 of the financial report. This compensation consists of the base salary, a perfor-mance-related bonus, private use of the company car, employer contributions to the pension funds, AHV / ALV (old-age and unemployment insurance) and accident and company sick payment insurance.
With the exception of the severance payment for the Delegate of the Board of Directors and CEO mentioned below, no severance payments have been agreed with Executive Board members.
Delegate of the Board of Directors and CEO
The Delegate of the Board of Directors and CEO has a separate remuneration model which is independent of that of the Board of Directors and Executive Board; he is also not a partici-pant in the Management Investment Plan (MIP).
In fall 2005, it was agreed with the Delegate of the Board of Directors and CEO that part of his compensation for 2005 and the compensation for the following five years (from 2006 up to and including 2010) would be paid largely in stock. In lieu of salary payments for the contractual period of employment until December 31, 2010, he was allocated a number of shares for the entire five-year term of the agreement (i.e. 2006 – 2010). These shares are time-vested until December 31, 2010 and freely available only as of January 1, 2011. Should he leave the company before this date, the shares must be returned on a pro rata basis. Under the terms of this model, the Delegate of the Board of Directors and CEO is entitled to a severance payment amounting to a maximum of 18 monthly salaries in the event of notice being given for which he was not at fault. This right lapses without compensation on expiry of the vesting period on December 31, 2010.
Allocation year
Number
Term
Vested until
Ratio
Strike price in CHF
Board of Directors 0
Executive Board 2005 * 3,150 15.06.2005 – 14.06.2010 14.06.2008 1:1 235.00
2006 6,294 19.04.2006 – 19.04.2011 20.04.2009 1:1 370.00
2007 5,250 15.03.2007 – 15.03.2012 15.03.2010 1:1 564.69
2008 5,446 19.03.2008 – 19.03.2013 19.03.2011 1:1 822.00
* Including the options held by the Delegate of the Board of Directors and CEO.

Division: Movement Systems, North America Operational Area: Fabrication

53
In addition to the share package, the Delegate of the Board of Directors and CEO draws an annual cash compensation, which is used for settlement of employee contributions to the pension fund and for social insurance payments. With the share package and the cash remuneration, all compensations such as bonuses, inflation, adjustments, options, etc. are settled. The corresponding personnel expenditure is charged to the income statement over the entire contractual period on a pro rata basis.
The relevant figures for this compensation model are found on page 124 in the finance report.
In December 2008, the employment contract with the Delegate of the Board of Directors and CEO was extended to encompass the period from January 1, 2011, to April 30, 2013. The bulk of the remuneration will again be in shares. The modalities are to a large degree similar to the provisions of the first contract; the shares are time-vested until December 31, 2013.
Shareholders’ participationVoting right restriction and representationThe registration of shares with voting rights in the share register requires the consent of the Board of Directors. Such consent may be withheld if the purchaser does not expressly declare that he has acquired and is holding the shares in his own name and for his own account. Pursuant to the Articles of Association, nominees may be entered in the share reg- ister with voting rights for up to a maximum of 0.3 % of the registered share capital entered in the Commercial Register. The restriction also applies to shares that are subscribed or acquired through exercise of a subscription, option or convertible right. Resolutions on the amendment or abrogation of the clause on the registration of registered shares requires a majority of two thirds of the votes represented at the General Meeting and the absolute majority of the par value of shares represented.
Deviating from Article 689, paragraph 2, Swiss Code of Obligations, shareholders who are unable to attend the General Meeting in person may not be represented by any third party of their choosing. They may only be represented by a member of a corporate body of the company, the independent proxy or another shareholder who is registered in the share register.
Statutory quorumsPursuant to §13 of the Articles of Association, resolutions on the amendment or abrogation of the provisions regarding the moving of the company’s domicile, conversion of regis- tered shares into bearer shares, registration of registered shares, representation of shares at the General Meeting, the dissolution or merger of the company, and amendment of §13 paragraph 4 of the Articles of Association require the approval of two thirds of the votes represented at the General Meeting and the absolute majority of the par value of the shares represented.
Convening of the General Meeting The General Meeting is convened in accordance with the statutory provisions.
AgendaShareholders who represent shares with a par value of at least CHF 1,000,000 or 1 % of the share capital may request that an item be placed on the agenda. This request must be communicated to the Board of Directors in writing, indicating the proposals, at least 45 days before the date of the General Meeting.
Entry in the share registerPursuant to the Articles of Association, shareholders’ rights of participation and represen-tation at the General Meeting are determined by the status of the share register on the fourth day before the General Meeting.

54
Changes in control and defense measuresDuty to make an offerThe Articles of Association of Forbo Holding Ltd do not contain an opting-up clause or an opting-out clause pursuant to Article 32 respectively 22 SESTA. However, as regards the determination of the minimum price, the Articles of Association deviate from Article 32, paragraph 4 SESTA in that, in the event of a compulsory offer, the offer price must at least correspond to the share price and may not be lower than the highest price which the bidder paid in the last twelve months for shares of the company.
Clause in changes of control As per December 31, 2008, one member of the Executive Board is entitled to claim a severance payment in the event that certain conditions arise due to a change in the control-ling shareholder. This severance payment corresponds to one annual salary at most.
AuditorsDuration of the mandate and term of office of the head auditor PricewaterhouseCoopers has been the Forbo Group’s auditors since 1987. The predecessor company of PricewaterhouseCoopers had been Forbo’s auditors since 1928. The current head auditor, Stefan Räbsamen, took over this function in 2002. The auditors are elected every year by the Ordinary General Meeting.
Auditing fees The auditing fees levied by the Group’s auditors for auditing the consolidated financial statements, including the statutory audit of the individual financial statements of the holding company and the consolidated subsidiaries, amounted to CHF 1.6 million in the year under review.
Additional fees Total additional consultancy fees (e.g. for tax and legal advice, advice in connection with acquisitions, mergers and divestments), as invoiced by the auditing company, amount to CHF 2.1 million for 2008.
Information instruments of the external auditors The Audit and Finance Committee (AFC) of Forbo Holding Ltd assesses and evaluates the proposals and statements of the internal and external auditors. The AFC also obtains additional remarks in the form of Management Letters from the internal and external auditors and assesses the measures taken by management. At the AFC’s invitation, represen-tatives of the external auditors attend the AFC meetings in an advisory capacity. The Chairman of the AFC reports on the AFC’s activities at the meetings of the Board of Directors and states the opinion of the AFC on business items of decisive importance. On request, each member of the Board of Directors may inspect the minutes of the AFC meetings. The external auditors were not invited to any meetings of the Board of Directors in 2008 as there were no special incidents or discoveries. However, the external auditors were present at the meeting of the AFC on the financial statements, while the Ernst & Young represen-tatives responsible for internal auditing attended the discussion on the internal audit reports.
55
Information policyInvestors must be able to have a clear idea of the companyForbo provides objective and periodic communication with shareholders, the capital market, the media and the public by reporting in timely fashion on business trends and activities relevant for the company. Both the Chairman of the Board of Directors and the CEO can be contacted directly for such information.
Shareholders receive summary reports on the business year as well as half-year reports. The Annual Report, like all other published documents, is available in printed form as well as on the Internet at www.forbo.com. The Ordinary General Meeting is an additional source of information. Periodic publication of media releases and the annual media and analysts’ conference are further information instruments for the capital market and the media.
Ad hoc communicationThe push and pull links for the dissemination of ad hoc releases in accordance with the Directive on Ad hoc publicity of the SIX Swiss Exchange are available at the following addresses:
www.forbo.com � Media Center � Media Releases � Subscription Servicewww.forbo.com � Medien Center � Medienmitteilungen � Subscription Service
Communications to registered shareholders are sent by ordinary mail to the addresses stated in the share register. The company’s official publication is the Swiss Commercial Gazette.
A financial calendar with the key dates and further information on the share can be found on the inside cover of this report. Further information on the share is found on pages 56 and 57 of this report.
Publications may be ordered by email, fax or telephone.E-mail: [email protected]: +41 58 787 25 25Fax: +41 58 787 20 25
The contact address for Investor Relations is:Forbo International SA
Jörg Riboni, CFO
Lindenstrasse 8Postfach 1041CH-6341 BaarPhone: +41 58 787 25 25
The contact address for press information is:Forbo International SA
Karin Marti, Head Corporate CommunicationsLindenstrasse 8Postfach 1041CH-6341 BaarPhone: +41 58 787 25 25

56
2008 will go down in financial and economic history as an exceptionally poor year. The financial markets have not suffered such a rout as in 2008 since the crash of October 1929 and the Great Depression that followed on its heels.
With hindsight, it can now be seen that the main factor leading to the turmoil on the finan- cial markets was the absence of two elements essential to smoothly functioning markets: liquidity and confidence. As a result of the lack of liquidity, some hedge funds and other investment vehicles were no longer able to obtain the necessary financing for their leverage and had to dispose of share positions, in some cases suffering very high price losses as part of a 'de-leveraging'. The Forbo share was dragged down amid the general turmoil at the end of February when a hedge fund unloaded its large Forbo shareholding, causing the price to plunge by more than 20 % within a few days. During the rest of the first half of 2008, the Forbo share underperformed the Swiss Performance Index (SPI), closing the first six-month period some 35 % below the year-ago level. In the same period, the SPI fell by about 15 %.
The trend in the second half was shaped mainly by the events on the financial markets in September and October. In September, a leading US investment bank, Lehman Brothers, filed for bankruptcy – a painful proof for market players that even large financial institutions can fail. This realization led to the money and capital markets seizing up widely. The total collapse of the global financial system was only prevented by the massive intervention of governments and central banks.
By this time, the financial crisis had started spilling over into the real economy. The gloom-ier growth prospects were reflected in share valuations as of October 2008, and prices for cyclical and consumer related stocks in particular began a downward plunge. But even subcontractor companies, for instance companies such as Forbo that supply the automo-tive industry and capital goods sector, suffered significant price losses on their shares. The downtrend visible throughout the year was exacerbated towards the year-end. The Forbo share closed the year at CHF 195, which is about 72 % below the year-end price in 2007, whereas the SPI was down by about 34 % in 2008.
The Forbo Share
The Forbo share in comparison to the SPI
CHF
Dec. 31, 2004 Dec. 31, 2005 Dec. 31, 2006 Dec. 31, 2007 Dec. 31, 2008
750
700
650
600
550
500
450
400
350
300
250
200
150
200 %
160 %
120 %
80 %
40 %
0 %
– 40 %
Forbo shareSPI

57
2008 2007 2006 2005 2004Share capital Number Number Number Number Number
Issued registered shares1) 2,713,152 2,713,152 2,713,152 2,713,152 2,713,152
Thereof:
Shares outstanding 2,230,729 2,453,379 2,577,198 2,634,849 2,633,897
Share buyback second line 213,152 - - - -
Other treasury shares 247,852 238,354 114,535 56,884 57,836
Reserve shares (without dividend rights) 21,419 21,419 21,419 21,419 21,419
Issued nominal capital CHF CHF CHF CHF CHF
Total 10,852,608 37,984,128 54,263,040 54,263,040 54,263,040
Thereof:
Shares outstanding 8,922,916 34,347,306 51,543,960 52,696,980 52,677,940
Share buyback second line 852,608 - - - -
Other treasury shares 991,408 3,336,956 2,290,700 1,137,680 1,156,720
Reserve shares (without dividend rights) 85,676 299,866 428,380 428,380 428,380
Data per share CHF CHF CHF CHF CHF
Shareholders’ equity Group2) 250 281 246 212 206
Group profit3) 6.9 44 24 – 17 – 107
Gross dividend and cash distribution 3.94) 10 6 0 0
Gross dividend yield (in %) High 0.65) 1.45) 1.25) 0 0
Low 2.15) 2.25) 2.15) 0 0
Payout ratio6) (in %) 57 23 25 0 0
Stock market statistics CHF CHF CHF CHF CHF
Share prices7) High 705 721.5 490 285 301
Low 188.4 447 291 233 155
Year-end 195 700 486 285 248
Market capitalization (m)8) High 1,573 1,770 1,263 751 794
Low 420 1 097 750 614 408
Year-end 435 1,717 1,253 751 653
1) Nominal value per share 2008: CHF 4; 2007: CHF 14; 2004 – 2006: CHF 20.2) Adjustment from 2004 as per IAS 19 for actuarial profits / losses.3) See the financial report on page 83, 'earnings per share'.4) Proposal of the Board of Directors to the Ordinary General Meeting.5) Calculated on the basis of a cash distribution in the form of a reduction in par value.6) Gross cash distribution as a percentage of Group profit.7) 2004 adjusted for the capital increase.8) Based on shares outstanding.
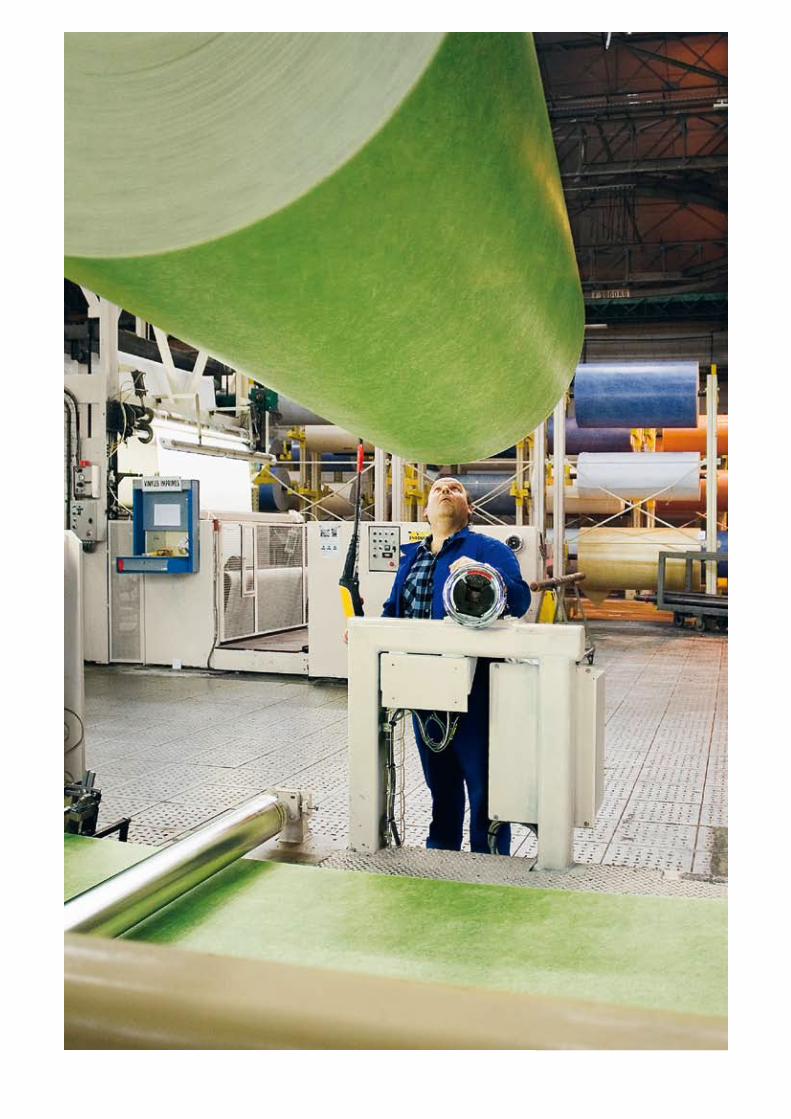
59
Content Forbo Group Financial Report
60 Consolidated Income Statement
61 Consolidated Balance Sheet
62 Consolidated Cash Flow Statement
63 Consolidated Statement of
Recognized Income and Expenses
64 Group Accounting Policies
77 Notes
110 Group Companies
114 Report of the Statutory Auditor
116 Consolidated Income Statements 2004 – 2008
117 Consolidated Balance Sheets 2004 – 2008
Financial Statements of Forbo Holding Ltd
119 Income Statement
120 Balance Sheet
121 Notes to the Financial Statements
128 Proposal for Appropriation of Available Earnings
129 Report of the Statutory Auditor
Financial Report

60
2008 2007
Note
CHF m Net sales 1 1,918.7 2,004.0
Cost of goods sold1) – 1,325.0 – 1,361.2
Gross profit 593.7 642.8
Development costs 2 – 29.9 – 31.6
Marketing and distribution costs – 282.7 – 296.6
Administrative costs 3 – 137.9 – 137.7
Other operating expenses 4 – 50.0 – 33.9
Other operating profit 5 23.9 19.4
Operating profit1) 117.1 162.4
Financial income 7 9.2 11.7
Financial expenses 8 – 104.9 – 19.3
Group profit before taxes 21.4 154.8
Income taxes 9 – 5.4 – 44.1
Group profit for the year 16.0 110.7
CHF Basic earnings per share 10 6.86 43.64
Diluted earnings per share 10 6.84 43.45
1) In the period under review, sales commissions and logistics costs are shown for the first time as part of cost of goods sold (previous year: operating expenditures) and costs of sample books as operating expenditures (previous year: cost of goods sold). To ensure comparability, the previous year’s report has been restated accordingly (effect: increase of cost of goods sold by CHF 29.3 million; decrease of operating expenditures by CHF 29.3 million).
The accompanying notes are an integral part of the consolidated financial statements.
Consolidated Income Statement

61
Consolidated Balance Sheet
31.12.2008 31.12.2007Assets
Note
CHF m Non-current assets 928.7 601.7
Property, plant and equipment 11 586.3 423.7
Intangible assets 12 311.7 151.9
Deferred income tax assets 9 28.8 20.7
Employee benefit assets 23 - 3.1
Investments in associates and other non-current assets 13 1.9 2.3
Current assets 909.1 803.5
Inventories 14 298.3 286.3
Trade receivables 15 265.8 287.7
Other receivables 32.2 29.5
Prepaid expenses and deferred charges 23.6 22.5
Marketable securities 16 73.6 -
Cash and cash equivalents 17 215.6 177.5
Total assets 1,837.8 1,405.2
Shareholders’ equity and liabilities
Shareholders’ equity 21 584.4 713.1
Share capital 19, 21 10.9 38.0
Treasury shares 21 – 2.0 – 4.0
Reserves and retained earnings 21 575.5 679.1
Non-current liabilities 676.6 254.7
Non-current financial debt 22 512.4 194.9
Employee benefit obligations 23 58.6 -
Non-current provisions 24 37.0 42.3
Deferred income tax liabilities 9 68.6 17.5
Current liabilities 576.8 437.4
Trade payables 25 144.5 138.1
Current provisions 24 18.6 7.4
Accrued expenses 26 130.4 160.2
Current financial debt 27 181.3 24.2
Current tax liabilities 25.3 29.8
Other current liabilities 76.7 77.7
Total liabilities 1,253.4 692.1
Total shareholders’ equity and liabilities 1,837.8 1,405.2
The accompanying notes are an integral part of the consolidated financial statements.

62
Consolidated Cash Flow Statement
2008 2007Cash flow from operating activities
CHF m Group profit for the year 16.0 110.7
Tax expense 5.4 44.1
Group profit before income tax 21.4 154.8
Financial expense, net 16.5 7.6
Depreciation and impairment charges on property, plant and equipment 81.5 58.2
Amortization and impairment charges on intangible assets 7.2 1.3
Impairment on available-for-sale financial assets 79.2 -
Profit on disposal of property, plant and equipment – 7.0 -
Share-based payments 5.0 5.2
Income tax paid – 37.2 – 34.6
(Decrease) / increase in provisions and employee benefit obligations – 12.7 1.2
Decrease in short-term debt – 12.9 – 25.6
Decrease / (increase) in working capital1) 18.8 – 2.8
Net cash generated from operating activites 159.8 165.3
Cash flow from investing activities
Acquisition of subsidiaries, net of cash acquired – 212.8 – 21.9
Purchase of property, plant and equipment – 55.4 – 61.5
Proceeds from sale of property, plant and equipment 12.1 6.8
Purchase of available-for-sale financial assets – 237.2 -
Sale of available-for-sale financial assets2) 83.8 -
Dividends received 3.4 -
Net cash used in investing activities – 406.1 – 76.6
Cash flow from financing activities
Increase / (decrease) in current debt 0.9 – 98.5
Proceeds from non-current debt 496.6 -
Repayment of debt of the acquiree to the seller – 43.0 -
Interest paid – 22.4 – 22.5
Interest received 5.3 9.9
Purchase of treasury shares – 105.6 – 83.1
Proceeds from sale of treasury shares 0.3 2.0
Reduction of par value – 22.4 – 15.3
Net cash generated / (used) from financing activities 309.7 – 207.5
Change in cash and cash equivalents
Net increase / (decrease) in cash and cash equivalents 63.4 – 118.8
Exchange (losses) / gains on cash and cash equivalents – 25.3 2.2
Cash and cash equivalents at beginning of year 177.5 294.1
Cash and cash equivalents at end of year 215.6 177.5
1) Excluding cash and marketable securities.2) This item includes the cash flow according to Note 32 'Related party transactions'.
The accompanying notes are an integral part of the consolidated financial statements.

63
Consolidated Statement of Recognized Income and Expenses
2008 2007
Note
CHF m Cash flow hedges – 1.1 2.4
Net investment hedges 8.1 1.5
Actuarial (loss) / profit on defined benefit plans, net – 46.6 49.6
Fair value change of available-for-sale financial assets 16 – 79.2 -
Impairment on available-for-sale financial assets 16 79.2 -
Revaluation of land and buildings 11 143.3 -
Release of provision directly recognized in the equity related to the revaluation of land and buildings 3.8 -
Currency translation difference – 129.5 1.5
Net (expense) / income recognized directly in equity (net) – 22.0 55.0
Group profit for the year 16.0 110.7
Total recognized (expense) / income for the year – 6.0 165.7
The accompanying notes are an integral part of the consolidated financial statements.

64
Methods Underlying Accounting Policies
General informationThe consolidated financial statements of Forbo Holding Ltd were prepared in accordance with the International Financial Reporting Standards (IFRS) and in compliance with Swiss law. They were drawn up on the basis of the audited financial statements of the subsidiaries prepared according to uniform corporate accounting policies. The balance sheet date for all subsidiaries is December 31. These financial statements were approved by the Board of Directors on March 11, 2009 and released for publication on March 17, 2009. The Report is subject to approval by the Annual General Meeting on April 24, 2009.
The consolidated statements have been prepared in accordance with the principle of historical purchase and manufacturing costs with the exception of securities, non-consoli-dated investments in associates, land and buildings, and derivative financial instruments, which are valued at fair value. The preparation of the consolidated financial statements re - quires management to make estimates and assumptions that can affect reported revenues, expenses, assets, liabilities and contingent assets and liabilities at the date of the financial statements. If the estimates and assumptions made by management at the date of the con- solidated financial statements to the best of their knowledge differ from the actual circum-stances, the original estimates and assumptions will be adjusted in the reporting year in which the circumstances have changed. The comparable data from the consolidated financial statements of the previous year were, where necessary, restated and supplemented and the presentation adjusted.
Scope and principles of consolidationThe scope of consolidation includes Forbo Holding Ltd and all domestic and foreign compa - nies in which the parent company holds, directly or indirectly, more than 50 percent of voting rights or in which it bears managerial responsibility for their operations and financial policies. These companies are fully consolidated. Assets and liabilities as well as revenues and expenses are fully consolidated, while intra-group balances (receivables and payables, revenues and expenses) are eliminated upon consolidation. Minority interests in the equity and net income of consolidated companies are reported separately but as part of Group equity capital and profit / loss. Inter-company profits on intra-group transactions and balances are eliminated in full. Capital consolidation is based on the purchase method. The purchase cost of an acquired company is offset against the fair value of the net assets acquired, assessed at the time of acquisition on the basis of uniform Group principles.
Companies acquired are consolidated from the date on which control is obtained, while com- panies disposed of in the course of the year are excluded from the scope of consolidation as from the date on which control is relinquished. The subsidiaries included in the scope of consolidation are listed under 'Group Companies'.
Joint ventures in which Forbo Holding Ltd holds, directly or indirectly, a 50 percent interest or in which the Forbo Group exercises joint control are included in the consolidated financial statements using the proportionate consolidation method.
Group Accounting Policies

65
Companies in which the Forbo Group has at least 20 percent of the voting rights but less than a 50 percent interest or in which it exercises a significant influence in some other way are treated according to the equity method. Interests of less than 20 percent are stated at fair value and are carried on the balance sheet under 'Other investments'. Unrealized profits and losses are included and reported in 'Reserves and retained earnings'. In the event of divestment or impairment, the related accumulated profit or loss is transferred to the income statement.
In the year under review, the scope of consolidation was increased by the acquisition of Bonar Floors (UK), the flooring business division of Low & Bonar PLC. In addition, the lightweight PVC conveyor belt operations of Fenner Dunlop (Charlotte) Inc., Transtex Belting, were ac- quired as an asset deal.
Foreign currency translationThe individual companies generally prepare their financial statements in the local currency. The local currency (functional currency) as a rule corresponds to the currency of the primary economic environment in which the company operates. Transactions in foreign currencies are translated at the current rate at the time of the transaction. Exchange gains and losses from transactions in foreign currencies and from adjustment of foreign currency balances on the balance sheet date are taken to the income statement.
The consolidated financial statements are prepared and presented in Swiss francs. Unless otherwise noted all sums are stated in millions of Swiss francs (CHF m). The annual state-ments of foreign Group companies stated in foreign currencies are translated into Swiss francs as follows: balance sheet at year-end exchange rates, income statement and cash flow statement at average exchange rates for the year under review. Currency translation differences arising from the different translation of balance sheets and income statements and from equity capital transactions are offset against consolidated shareholders’ equity and taken to the income statement in the event the company is divested. Foreign exchange gains on certain equity-like loans, which form part of net investment in a company, are likewise taken to shareholders’ equity provided no repayment of these loans is planned or intended in the foreseeable future.
The following exchange rates have been applied for the most important currencies concerned:
Income statement
(Average exchange rates) Balance sheet
(Year-end exchange rates)
2008 2007 2008 2007Currency
CHF Euro countries EUR 1 1.59 1.65 1.50 1.66
Sweden SEK 100 16.52 17.76 13.75 17.57
United Kingdom GBP 1 2.00 2.40 1.57 2.27
USA USD 1 1.08 1.20 1.07 1.14
Canada CAD 1 1.02 1.12 0.88 1.16
Japan JPY 100 1.05 1.02 1.19 1.01

66
MaturitiesAssets are designated current assets if they are realized or consumed in the Group’s ordinary business cycle within one year or are held for trading purposes. All other assets are assigned to non-current assets.
All obligations which the Group intends to settle within the ordinary business cycle using operating cash flows or which are due within one year of the balance sheet date are assigned to current liabilities. All other obligations are assigned to non-current liabilities.
Financial instrumentsA financial instrument is any contract that gives rise to a financial asset of one entity and a financial liability or equity instrument of another entity. Financial instruments are generally recognized as soon as Forbo becomes a party to the contractual regulations of the financial instrument. In the case of regular purchases or sales (purchases or sales under a contract whose terms require delivery of the asset within the timeframe generally established by reg- ulation or convention in the marketplace concerned), the settlement date is relevant for the initial recognition and derecognition. This is the day on which the asset is delivered to or by Forbo. As a general rule, financial assets and financial liabilities are offset and the net amount presented only when the entity has a right to offset the recognized amounts and intends to settle on a net basis.
Financial assets and liabilities are divided into the following valuation categories:
– Financial assets and liabilities that are measured at fair value and recognized in income include derivatives that form not part of a highly effective hedge relationship and other trading instruments.
– Loans and receivables comprise financial assets with fixed or determinable payments, which are not quoted on an active market and are not derivatives or classified as avail-able-for-sale. Interest-free and low-interest long-term loans and receivables are recorded at actual cash value. Subsequent valuations are generally done at amortized cost, taking account of the effective interest method.
– Held-to-maturity financial instruments consist of non-derivative financial assets with fixed or determinable payments, and a fixed term, which the company has the ability and intent to hold until maturity, and which do not fall under any other valuation categories. Initial valuation is done at fair value, which generally matches the nominal value. Subse- quent valuations are generally done at the amortized cost, taking account of the effective interest method.
– Available-for-sale financial instruments comprise financial assets which are not derivatives and do not fall under any of the previously stated valuation categories. Initial valuation is done at fair value, taking account of transaction costs directly attributable to the acqui- sition. Changes in the fair value are booked to equity (reserves) and are only recorded in the income statement when they are disposed of or have an impairment in value. Man- agement regards an asset held-for-sale as impaired if its fair value falls considerably or persistently below the acquisitions cost less any impairments previously recognized in income.
– Financial liabilities that are not derivatives are initially valued at fair value. This nor- mally corresponds to the amount received. Subsequent valuations are generally done at the amortized cost, applying the effective interest method.
There were no reclassifications between the valuation categories either in 2008 or in 2007.

67
The fair value of a financial instrument is the amount that two independent parties entering into the contract would agree to pay for this instrument. If prices are quoted on an active market (e.g. share prices), they are used as the basis for the valuation. Otherwise, internal valuation models are used, taking current market parameters into account.
Derivative financial instruments, which the Group uses solely to manage financial risks and not for speculation, are recognized at their fair value the first time they are reported on the balance sheet. The fair value of traded derivative financial instruments corresponds to the market value, which may be positive or negative. All derivative financial instruments with a positive fair value are reported as 'Other receivables', and all derivative financial in- struments with a negative fair value are reported as 'Other current liabilities'. If no market value can be determined, the fair value must be calculated using recognized valuation mod- els. In determining changes in fair values, it is decisive to know whether the hedging rela- tionship of the derivative financial instrument is highly effective or not. If the hedging rela- tionship is not highly effective, hedge accounting is not possible, and the fair values of the financial instruments are immediately recognized in the income statement. However, if the hedging relationship is highly effective, the hedge is recognized as such. The Forbo Group employs hedge accounting in connection with the hedging of periodic interest payments and the repayment of the nominal amount of the US private placement. Part of the derivatives employed are recognized as cash flow hedges in order to hedge the future cash flows from the US private placement against fluctuations. The effective portion of the change in market value of the hedging instrument is recognized in equity, with no effect on the income state- ment, until the gain or loss on the hedged item is realized; the ineffective portion of the change in market value of the hedging instrument is recognized in the income statement. The cumulative changes in market value are reported in the income statement when future firm commitments are recognized in the income statement.
Furthermore, the Group hedges certain net investments in foreign subsidiaries with foreign currency borrowings. All gains and losses from the currency translation of these loans are recognized in equity and reported in the cumulative translation differences. Only if and when the subsidiary is divested are the cumulative valuation changes of the foreign currency loans and the valuation change of the hedged item recognized in the income statement.
Financial assets, for instance trade receivables and assets held for sale, are tested annually for signs of impairment. If such signs are found, an impairment test is conducted. The real- izable value of the financial assets held by the Forbo Group corresponds to the cash value of the expected future cash flows. The original effective interest rate is used as the discount rate. Short-term financial assets are not discounted. Any impairment loss is recognized in the income statement.
An impairment on financial assets is generally reversed in whole or in part if the recovery of the recoverable value can be related to an event occurring after the impairment loss was recognized. Reversals of impairment losses are recognized in the income statement. Rever- sals of impairment losses on available-for-sale financial assets are recognized directly in equity with no effect on the income statement.
68
Segment informationA segment is a discrete activity of the Group, either providing particular products and ser- vices (divisions) or offering products and services in a particular economic environment (geographic segment), where they are subject to various opportunities and risks. The primary segmentation at Forbo consists of the three divisions Flooring Systems, Bonding Systems und Movement Systems. It corresponds to the Group’s management structure. The geograph- ic regions constitute the secondary segmentation.
Segment accounting is prepared to include operating profit (EBIT). Allocation of interest and taxes to the individual divisions and Corporate does not make sense owing to the highly centralized functions Finances and Taxes.
The divisions apply the same accounting principles as the Group. All operating activities and liabilities that can be allocated either directly or reasonably to the segments are reported in the different divisions or geographic regions. Sales between the divisions are effected at market prices.
Net sales and revenue recognitionInvoices for goods and services are booked as net sales when the service is provided or when ownership is transferred. Net sales are reported without any sales or valued-added tax and after deduction of any credits and discounts. Appropriate provisions are made for expected warranty claims.
Research and developmentAll research costs are charged directly to the income statement in the period in which they are incurred. Development costs have to be capitalized if all the recognition criteria have been met, the research phase can be clearly distinguished from the development phase and costs can be clearly allocated to individual project phases without any overlap. Given the numerous interdependencies within development projects and in view of the uncertainty as to which products will ultimately reach the market, all development expenditures are cur- rently charged to the income statement.
Share-based compensationEquity-settled share-based payments to employees are valued at the fair value of the equity instrument at the grant date. The fair value of the share options is determined by the Black-Scholes model. The anticipated maturity used in the model has been adjusted on the basis of best estimates with regard to the effects of non-transferability, restrictions on exercise and conduct. Further information on determining the fair value of the share options is provided in note 20. The fair value determined on granting equity-settled share-based pay- ments is charged over the vesting period to the income statement and is included in personnel expenditure.

69
Income taxesIncome taxes constitute the total of current and deferred income taxes.
Current income taxes are determined on the basis of profits on which taxes are to be paid and the applicable tax laws of the individual countries. They are carried as an expense in the accounting period in which the profits are made. The profit on which taxes are to be paid differs from the profit or loss for the year in the income statement since it excludes expenses and revenues which in subsequent years are never taxable or deductible from taxes. The Group’s liability for current income taxes is calculated on the basis of applicable tax rates.
Deferred tax liabilities are recognized for temporary differences between assets and liabili-ties in the balance sheet and the amounts as measured for tax purposes if they result in taxable income in future. Deferred tax assets are reported for temporary differences that will result in deductible amounts in future periods and for tax effects from fiscally offset-table losses but only insofar as it is likely that sufficient taxable profits will be available against which these differences can be offset. Deferred taxes are not reported if the tempo- rary differences arise from the recognition of goodwill or from the initial recognition of other assets or liabilities which relate to events not affecting taxable income or the profit for the year.
Deferred tax liabilities and tax claims are measured at the tax rates that are expected to apply in the period in which the asset will be realized or the liability will be settled based on enacted rates. Current and deferred tax assets and liabilities are offset when they arise from the same tax reporting group, relate to the same tax authority, the legal right to offset exists and they are intended to be settled net or realized simultaneously.
The book value of the deferred tax claims is checked each year on the balance sheet date and reduced if it is no longer likely that sufficient taxable profits are available to realize the claim either wholly or in part.
Current and deferred income taxes are recognized as an income tax benefit or expense in the income statement, except for net gains or losses directly recognized in equity. In this case, the corresponding tax effect is also to be recognized directly in equity.
Property, plant and equipmentLand and buildings (including property mainly rented out or held for the purpose of ob- taining rental income and / or of increasing the property’s value) are carried on the balance sheet at their revaluation amount, which corresponds to the fair value at the date of re- valuation less previously accumulated depreciations and impairment losses. However, the revaluations are conducted regularly, but at least every five years, by independent external valuers to ensure that the carrying amount does not differ materially from the carrying amounts determined on the basis of the fair value at the balance sheet date.

70
All accumulated depreciations are offset against the gross carrying amounts of the assets at the time the revaluation model is applied for the first time. The net amount is adjusted to the revalued amount.
An increase in the asset’s value that results from the revaluation of land and buildings is credited to equity under the heading of revaluation reserve. This does not apply if the re- valuation reserve represents a reversal of a revaluation decrease of the same asset. In this case, the increase is recognized as income in the amount of the impairment made previously. A decrease in the carrying amount arising from the revaluation of property or buildings is recognized as an expense to the extent that the decrease exceeds the amount previously credited to the revaluation reserve relating to the same asset.
Depreciations on revalued buildings are recognized in the income statement. If the revalued land or buildings are subsequently sold or closed, the revaluation excess attributable to the revaluation reserve is transferred directly to reserves. There are no transfers from the re- valuation reserve to reserves unless land and buildings are charged out.
Land is not depreciated.
Investments in construction for manufacturing or administrative purposes are carried on the balance sheet at cost less recognized impairments. The depreciation of these assets begins on the same basis as for other land and buildings, i.e. when they are ready for operation.
Machinery and equipment and other operational assets are reported at cost less accumu-lated depreciations and recognized impairments.
They are depreciated so that the costs or the revaluation amount of assets (with the excep- tion of assets under construction) are depreciated on a straight-line basis over their esti-mated useful life. The estimated useful life is usually 33 years for buildings used in operations and 5 – 10 years for plant and equipment. Other operational assets are depreciated over 3 to 10 years. Where components of larger systems have different useful lives, they are de- preciated as separate items. Useful lives and residual values are reviewed annually at the balance sheet date and any necessary changes are taken into account prospectively.
Assets which are held in financial leasing arrangements are depreciated over their esti-mated useful life in the same way as assets belonging to the company or, if this is shorter, over the life of the underlying leasing agreement.
The profit or loss arising from the sale or closure of property, plant or equipment is de- fined as the difference between the sale proceeds and the carrying amount of the asset and is recognized in income.
Maintenance costs are capitalized if this prolongs the useful life or increases production capacity. Maintenance and repair costs that do not increase value are charged directly to the income statement.

71
Intangible assets and goodwillThe goodwill generated on the acquisition of a subsidiary, associate or a jointly managed company represents the excess of the cost of an acquisition over the fair value of the Group’s share of net identifiable assets, debts and contingent debts of the subsidiary, asso- ciate or jointly managed company at the date of acquisition. Goodwill and other intangible assets such as acquired trademarks, similar rights and technologies are initially carried in the balance sheet at the date of acquisition at cost. Goodwill and intangible assets with an indefinite useful life are not subject to amortization but are tested for impairment at least annually. An impairment loss is recognized as expense in the income statement, and goodwill is not recovered in subsequent periods. Intangible assets are capitalized and amortized on a straight-line basis over the estimated useful life, if they produce a future economic benefit. The following useful lives are used: 20 years for trademark rights, between 5 and 25 years for customer relations and 3 years for software.
Gains or losses on the disposal of a subsidiary, associate or jointly managed company include the carrying amount of goodwill relating to the entity sold.
InventoriesInventories are stated at the lower of cost and net realizable value. Cost includes direct ma- terial and, if applicable, other direct costs and related production overheads to the extent that they are incurred in bringing the inventories to their present location and condition. The cost of inventories is assigned for the most part by using an average cost formula.
The net realizable value constitutes the estimated sales price less all estimated costs up to completion and the costs of marketing, sales and distribution. Adjustment is made for unsaleable inventories and inventories with insufficient turnover.
Trade receivablesCurrent trade receivables are stated at amortized cost, which generally corresponds to nomi- nal value. Allowances for doubtful risks are established based on the maturity structure and identifiable solvency risks. In addition to individual allowances for specific identifiable risks, allowances are also made on the basis of statistically determined credit risks.
Marketable securitiesSecurities include securities held for trading and financial assets available-for-sale. The se- curities held for trading are valued at their fair value, with unrealized gains and losses being recognized in the income statement and reported in the financial result. Securities, classi-fied as available-for-sale are valued at their fair value. Changes in the fair value are booked to equity (reserves) and are only recorded in the income statement when they are disposed of or have an impairment in value.
Cash and cash equivalentsCash and cash equivalents are stated at nominal value. They include cash on hand, postal and bank accounts and fixed-term deposits with an original maturity of up to 90 days.

72
Shareholders’ equityTreasury shares are deducted at their par value from share capital. The acquisition costs in excess of par value arising on the acquisition of treasury shares are deducted from reserves. Gains or losses from the sale of treasury shares are credited to or deducted from reserves.
The reserves constitute the payments from shareholder over and above the par value. The reserves likewise include realized gains and losses from the sale of treasury shares, the fair value of options from the stock option plan at the date of the grant, actuarial gains and losses in connection with defined benefit plans, gains and losses from the translation of the annual results of subsidiaries into the corporate currency, the effects of hedging future payment streams and net investments, and fluctuations in the fair value of securities classi- fied as 'available-for-sale'. The profit carried forward is the Group’s reinvested profit.
Dividends are debited to equity in the period in which they are decided on.
Current and non-current financial debtCurrent and non-current financial debt consists mainly of private placements, leasing debt, and bank loans. They are stated at amortized cost (less transaction costs). Borrowing costs are recognized in the income statement, using the effective interest method.
Financial debt is assigned to current assets, except if the Group enjoys unlimited right to post- pone payment of the debt by at least twelve months after the balance sheet date.
Employee pension plansForbo maintains various pension plans designed as defined contribution and defined bene- fit plans. These pension plans are established in accordance with the local conditions in each country. The plans are funded either by contributions to legally autonomous pension funds / insurance plans or by recognition of the pension plan liabilities in the financial statements of the respective companies.
For defined contribution plans, the costs incurred in the relevant period correspond to the agreed employer contributions.
For defined benefit plans, the pension liabilities are assessed annually by independent ac - tuaries according to the projected unit credit method. They correspond to the cash value of the expected future cash flows. The plan assets are stated at market value. Current service costs incurred in the relevant period, less employee contributions, are stated as personnel ex- penditure in the income statement. Past service costs resulting from changes in pension plans are recognized in the income statement on a straight-line basis over the remaining aver- age period until an active employee has a vested pension right, or they are immediately charged to the income statement in case the employee has already retired. Profits resulting from pension plan reductions or compensations are immediately taken to the income statement.
Actuarial gains and losses are stated in equity with no effect on the income statement, but with due regard to deferred taxes.
73
ProvisionsProvisions are recognized if the Group has a legal or constructive obligation as a result of past events, it is probable that an outflow of resources will be required to settle the obliga- tion, and a reliable estimate of the amount can be made. No provisions are made for future operating losses. The provision is the best estimate on the balance sheet date required to meet the current obligation, taking into account the risks and uncertainties underlying the obligation.
A provision for restructuring expenses is reported if the Group has defined a detailed, formal restructuring plan which has created a justified expectation among those affected that the restructuring will be carried out as a result of the plan’s implementation being initiated or es- sential parts being announced. In the evaluation of a restructuring provision, only direct expenses for the restructuring are considered. Only those expenses are included, therefore, which are caused by the restructuring and are not connected with the ongoing business activities of the company.
Trade payablesTrade payables are non-interest-bearing and are disclosed at nominal value.
Other current liabilitiesOther current liabilities include amongst others derivative financial instruments at market value in connection with hedging the payment streams from the US private placement.
Changes in accounting principlesIn the current year, the following new and revised standards and interpretations of the International Accounting Standards Board (IASB) and International Financial Reporting Inter- pretations Committee (IFRIC) came into force:
IFRIC 11 – Group and Treasury Share Transaction applying IFRS 2IFRIC 12 – Service Concession ArrangementsIFRIC 14 – The Limit on a Defined Benefit Asset, Minimum Funding Requirements
and their Interaction
These standards and interpretations have been applied provided they are relevant for the Group’s business activities. The application of these standards has no significant effect on the Group’s equity, profits or cash flows.
In its review of accounting principles, management has decided to carry land and buildings on the balance sheet in accordance with the revaluation model. Before, the company has used the cost model. The revaluation model gives persons interested in the company’s finan- cial statements a more transparent view of the actual value of its assets. The change in the accounting method was applied prospectively in accordance with IAS 8 and IAS 16 for the first time as per July 1, 2008. Owing to the application of the revaluation method, the reported value of land and buildings increased by CHF 184.5 million as per July 1, 2008, which is equiva- lent to the difference between the fair value and the net carrying amount at the balance sheet date. In line with this, there was a net effect of CHF 143.3 million in the revaluation reserve for land and buildings. The deferred tax effect in the balance sheet came to CHF 41.2 million. In the second half of 2008, the change resulted in an increase in depreciation of CHF 2.0 million compared to the cost model previously used. Earnings per share were re- duced by CHF 0.85 by this effect.

74
Management assumptions and estimates
Critical accounting methods and assumptionsThe application of the accounting principles requires that circumstances and estimates be assessed and assumptions be made with respect to the book values of assets and debts. The estimates and the underlying assumptions are based on past experience and on factors deemed to be relevant. The actual values may deviate from the estimates.
In the following, the main areas are indicated in which such a risk may result from the uncer- tainty of estimates that a significant restatement of the reported assets and debts becomes necessary within the next business year.
Impairment of non-financial assetsAlong with the regular periodic review of goodwill, the carrying amounts of fixed and intan- gible assets are also always reviewed if these amounts can potentially no longer be realized due to changed circumstances or events. If such a situation occurs, the recoverable amount is determined based on expected future revenues.
This corresponds to either the expected discounted future free cash flow or expected net sales price. If these values are less than the current carrying amount, the value is impaired to the newly calculated figure. This impairment is recognized in expenses in the income state- ment. If the asset itself does not generate any independent cash flow, the impairment test for a cash-generating unit is to be performed. As a rule, the Group defines the cash-gener-ating units on the basis of geographically cohesive markets, i.e. generally speaking an individ- ual country. Important assumptions in these calculations include growth rates, margins, estimates of the future development of net current assets and discount rates. The actual cash flows may deviate significantly from the discounted future values. Likewise, the useful lives may be shortened or investment assets impaired in the event of a change in the use of buildings, machinery and facilities, change or abandonment of locations or lower than expected revenues over the medium term. The book values of the capital and intangible assets in question are shown in notes 11 and 12.
Employee pension obligationsVarious employee pension plans and schemes exist for employees at Forbo. In order to mea- sure liabilities and costs, it is first of all necessary to determine whether a plan is a defined contribution or a defined benefit plan by applying the principle of substance over form. In the case of defined benefit plans, actuarial assumptions are made to estimate future devel- opments. These include assumptions and estimates relating to the discount rate, the ex- pected return on plan assets in individual countries, and future wage trends. In their actuarial calculations for determining employee benefit obligations, the actuaries also use statistical information such as mortality tables and staff turnover rates. If these parameters change owing to a change in the economic situation or market conditions, the subsequent results may deviate considerably from the actuarial reports and calculations. These deviations may have a significant medium-term effect on expenses and revenues from the employee pen- sion schemes and on equity. The carrying amounts of the plan assets and liabilities are set out in note 23.

75
ProvisionsIn the conduct of ordinary business activities, a liability of uncertain timing and / or amount may arise. Provisions are determined using available information based on reasonably ex- pected cash outflows. Depending on the outcome, claims against the Group may arise that may not be covered, or covered only in part, by provisions or insurance benefits. The car- rying amounts of such provisions are shown in note 24.
Income taxesThe measurement of current tax liabilities is subject to the interpretation of tax regulations in the relevant countries. The adequateness of this interpretation is assessed by the tax authorities in the course of the final assessment or tax audits. This may result in material changes to tax expense. Furthermore, in order to determine whether tax losses carried forward can be capitalized requires a critical estimate of the probability that they can be offset against future profits. This assessment depends on a number of different factors and developments. An analysis of the income taxes is set out in note 9.
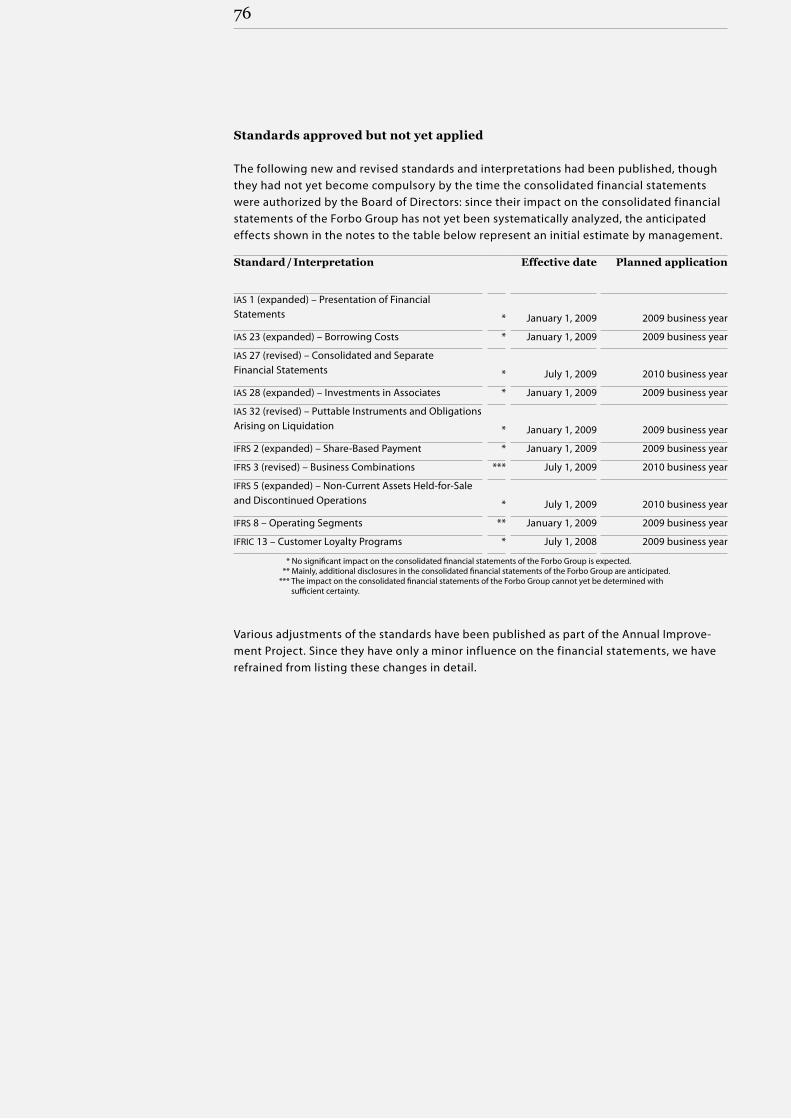
76
Standards approved but not yet applied
The following new and revised standards and interpretations had been published, though they had not yet become compulsory by the time the consolidated financial statements were authorized by the Board of Directors: since their impact on the consolidated financial statements of the Forbo Group has not yet been systematically analyzed, the anticipated effects shown in the notes to the table below represent an initial estimate by management.
Standard / Interpretation Effective date Planned application
IAS 1 (expanded) – Presentation of Financial Statements * January 1, 2009 2009 business year
IAS 23 (expanded) – Borrowing Costs * January 1, 2009 2009 business year
IAS 27 (revised) – Consolidated and Separate Financial Statements * July 1, 2009 2010 business year
IAS 28 (expanded) – Investments in Associates * January 1, 2009 2009 business year
IAS 32 (revised) – Puttable Instruments and Obligations Arising on Liquidation * January 1, 2009 2009 business year
IFRS 2 (expanded) – Share-Based Payment * January 1, 2009 2009 business year
IFRS 3 (revised) – Business Combinations *** July 1, 2009 2010 business year
IFRS 5 (expanded) – Non-Current Assets Held-for-Sale and Discontinued Operations * July 1, 2009 2010 business year
IFRS 8 – Operating Segments ** January 1, 2009 2009 business year
IFRIC 13 – Customer Loyalty Programs * July 1, 2008 2009 business year
* No significant impact on the consolidated financial statements of the Forbo Group is expected. ** Mainly, additional disclosures in the consolidated financial statements of the Forbo Group are anticipated.*** The impact on the consolidated financial statements of the Forbo Group cannot yet be determined with
sufficient certainty.
Various adjustments of the standards have been published as part of the Annual Improve-ment Project. Since they have only a minor influence on the financial statements, we have refrained from listing these changes in detail.
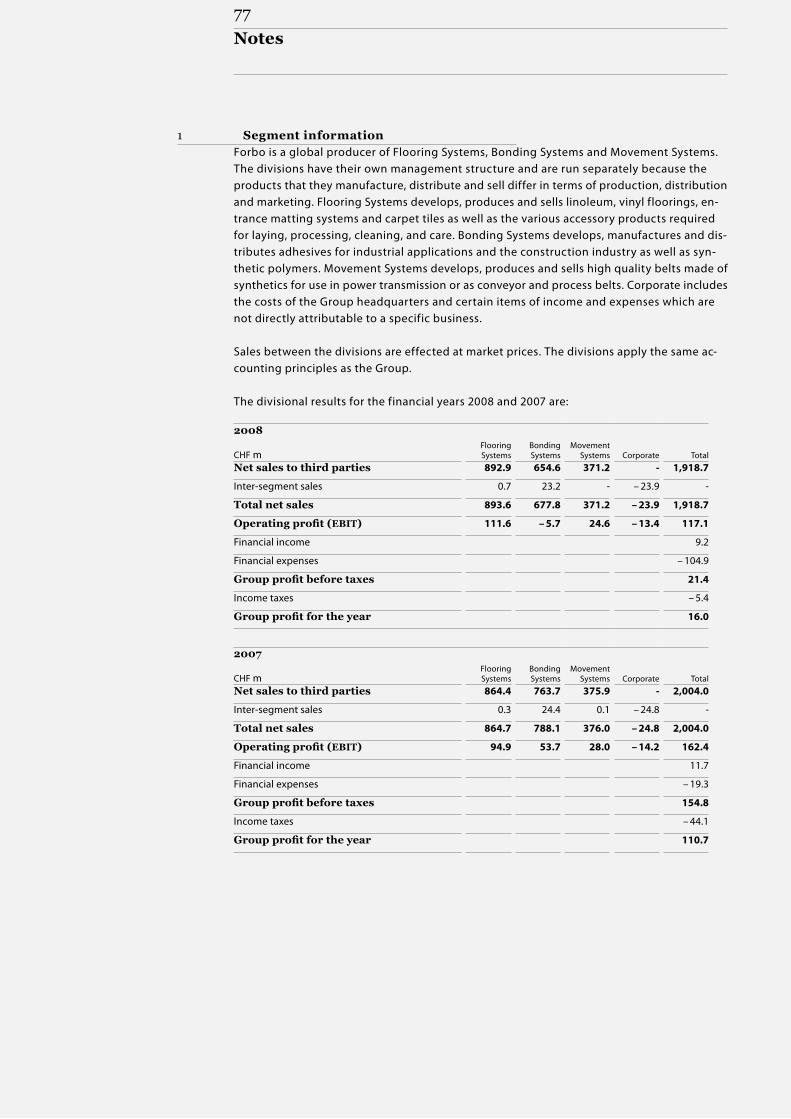
77
1 Segment informationForbo is a global producer of Flooring Systems, Bonding Systems and Movement Systems. The divisions have their own management structure and are run separately because the products that they manufacture, distribute and sell differ in terms of production, distribution and marketing. Flooring Systems develops, produces and sells linoleum, vinyl floorings, en- trance matting systems and carpet tiles as well as the various accessory products required for laying, processing, cleaning, and care. Bonding Systems develops, manufactures and dis- tributes adhesives for industrial applications and the construction industry as well as syn- thetic polymers. Movement Systems develops, produces and sells high quality belts made of synthetics for use in power transmission or as conveyor and process belts. Corporate includes the costs of the Group headquarters and certain items of income and expenses which are not directly attributable to a specific business.
Sales between the divisions are effected at market prices. The divisions apply the same ac- counting principles as the Group.
The divisional results for the financial years 2008 and 2007 are:
2008 Flooring Systems
Bonding Systems
Movement
Systems
Corporate
Total CHF m Net sales to third parties 892.9 654.6 371.2 - 1,918.7
Inter-segment sales 0.7 23.2 - – 23.9 -
Total net sales 893.6 677.8 371.2 – 23.9 1,918.7
Operating profit (EBIT) 111.6 – 5.7 24.6 – 13.4 117.1
Financial income 9.2
Financial expenses – 104.9
Group profit before taxes 21.4
Income taxes – 5.4
Group profit for the year 16.0
2007 Flooring Systems
Bonding Systems
Movement
Systems
Corporate
Total CHF m Net sales to third parties 864.4 763.7 375.9 - 2,004.0
Inter-segment sales 0.3 24.4 0.1 – 24.8 -
Total net sales 864.7 788.1 376.0 – 24.8 2,004.0
Operating profit (EBIT) 94.9 53.7 28.0 – 14.2 162.4
Financial income 11.7
Financial expenses – 19.3
Group profit before taxes 154.8
Income taxes – 44.1
Group profit for the year 110.7
Notes

78
Additional divisional information from the income statement and balance sheet:
Depreciation, amortization and impairment charges
2008 Flooring Systems
Bonding Systems
Movement
Systems
Corporate
Total CHF m Depreciation and amortization 28.6 14.8 14.3 1.8 59.5
Impairments, net – 2.5 29.2 2.5 - 29.2
2007 Flooring Systems
Bonding Systems
Movement
Systems
Corporate
Total CHF m Depreciation and amortization 26.7 15.7 13.8 2.9 59.1
Impairments 0.4 - - - 0.4
Assets, liabilities and investments
2008 Flooring Systems
Bonding Systems
Movement
Systems
Corporate
Total CHF m Operating assets 779.1 403.6 290.1 43.4 1,516.2
Operating liabilities 196.1 104.3 65.3 94.0 459.7
Investments 29.4 10.5 17.1 1.0 58.0
2007 Flooring Systems
Bonding Systems
Movement
Systems
Corporate
Total CHF m Operating assets 440.2 468.5 265.6 27.3 1,201.6
Operating liabilities 193.6 118.8 65.0 78.2 455.6
Investments 25.6 21.2 13.5 1.2 61.5
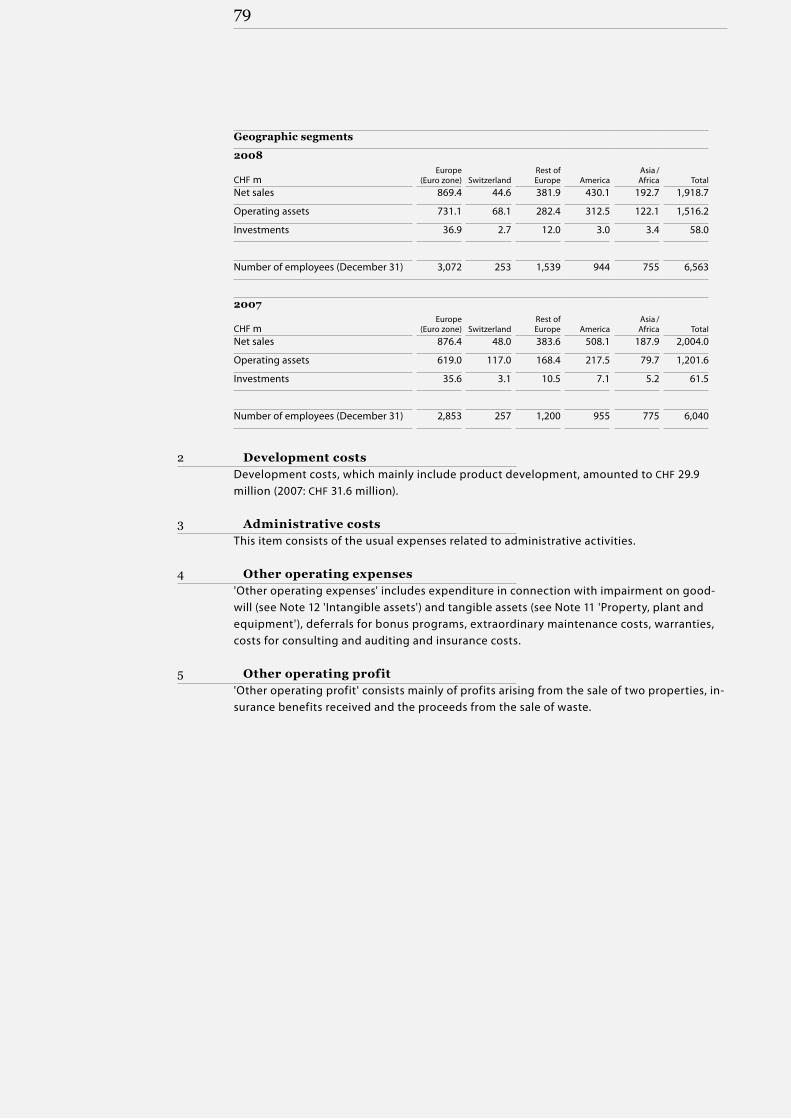
79
Geographic segments
2008 Europe
(Euro zone)
Switzerland
Rest of Europe
America
Asia / Africa
Total CHF m Net sales 869.4 44.6 381.9 430.1 192.7 1,918.7
Operating assets 731.1 68.1 282.4 312.5 122.1 1,516.2
Investments 36.9 2.7 12.0 3.0 3.4 58.0
Number of employees (December 31) 3,072 253 1,539 944 755 6,563
2007 Europe
(Euro zone)
Switzerland
Rest of Europe
America
Asia / Africa
Total CHF m Net sales 876.4 48.0 383.6 508.1 187.9 2,004.0
Operating assets 619.0 117.0 168.4 217.5 79.7 1,201.6
Investments 35.6 3.1 10.5 7.1 5.2 61.5
Number of employees (December 31) 2,853 257 1,200 955 775 6,040
2 Development costsDevelopment costs, which mainly include product development, amounted to CHF 29.9 million (2007: CHF 31.6 million).
3 Administrative costsThis item consists of the usual expenses related to administrative activities.
4 Other operating expenses'Other operating expenses' includes expenditure in connection with impairment on good-will (see Note 12 'Intangible assets') and tangible assets (see Note 11 'Property, plant and equipment'), deferrals for bonus programs, extraordinary maintenance costs, warranties, costs for consulting and auditing and insurance costs.
5 Other operating profit'Other operating profit' consists mainly of profits arising from the sale of two properties, in- surance benefits received and the proceeds from the sale of waste.

80
6 Personnel expenses 2008 2007
CHF m Salaries and wages 387.4 387.1
Social security contributions 94.2 104.1
Total personnel expenses 481.6 491.2
At December 31, 2008, the Group had 6,563 employees (2007: 6,040). The average head-count over the year was 6,092 (2007: 5,891). Salaries and wages include share-based pay- ments worth CHF 5.1 million.
About 120 managers participate in a bonus plan, which is linked to the achievement of financial targets of the Group, the divisions and individually determined objectives.
7 Financial income 2008 2007
CHF m Dividend income 3.4 -
Interest income1) 5.4 9.8
Gains on financial assets or liabilities at fair value through profit or loss 0.4 1.9
Total financial income 9.2 11.7
1) This consists particularly of interest income from cash and cash equivalents.
8 Financial expenses 2008 2007
CHF m Impairment on available-for-sale financial assets 79.2 -
Loss on sale of available-for-sale financial assets 1.2 -
Interest expenditure from financial liabilities valued at amortized cost 23.5 21.8
Gains from derivative financial instruments used in hedging – 2.8 – 4.0
Amortization of issuance costs for private placements 0.3 0.6
Foreign exchange losses / (gains), net 7.1 – 15.1
Foreign exchange (gains) / losses from derivative financial instruments used in hedging – 1.3 8.6
(Gains) / losses on financial assets or liabilities at fair value through profit or loss – 2.3 7.4
Total financial expenses 104.9 19.3
The item 'Impairment on available-for-sale financial assets' contains the impairment of the shareholding in Rieter Holding AG, Winterthur, reported under 'Marketable securities'. Rieter has been particularly hard hit by the current global economic crisis, and this is reflected in the company’s share price. Since it is not likely that Rieter’s profitability will recover any time soon, an impairment charge of CHF 79.2 million has been recognized in financial expenses as at year-end.
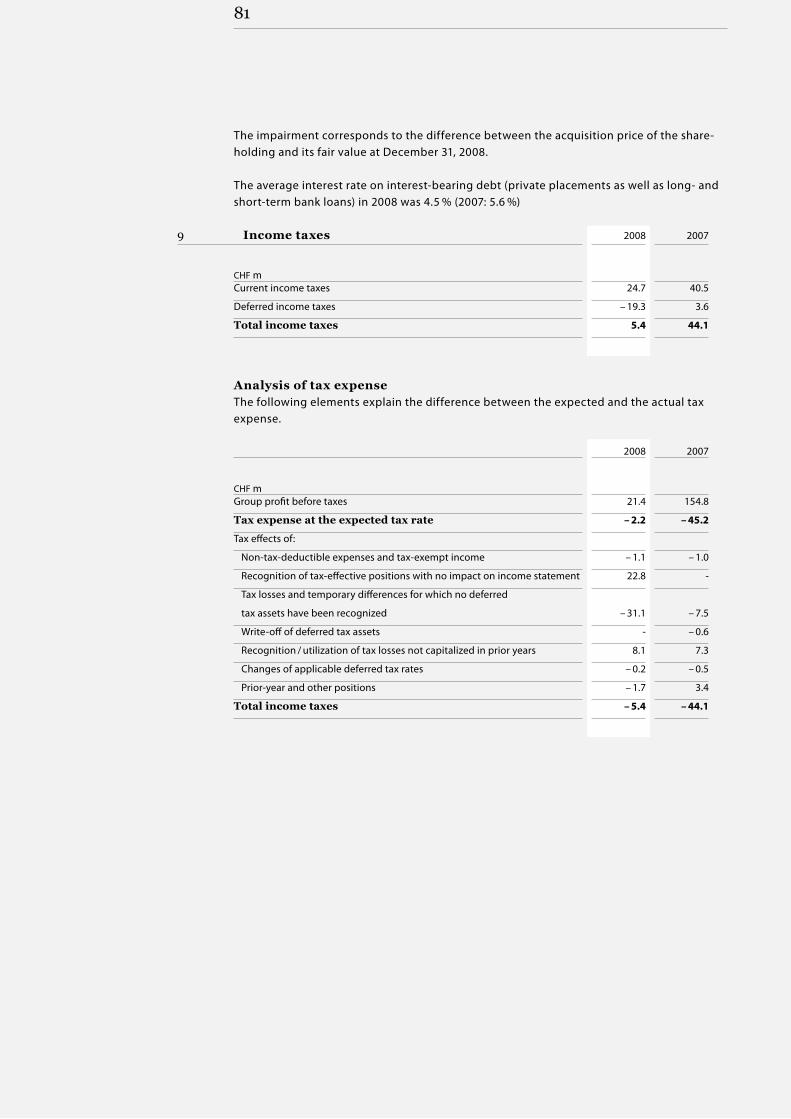
81
The impairment corresponds to the difference between the acquisition price of the share-holding and its fair value at December 31, 2008.
The average interest rate on interest-bearing debt (private placements as well as long- and short-term bank loans) in 2008 was 4.5 % (2007: 5.6 %)
9 Income taxes 2008 2007
CHF m Current income taxes 24.7 40.5
Deferred income taxes – 19.3 3.6
Total income taxes 5.4 44.1
Analysis of tax expenseThe following elements explain the difference between the expected and the actual tax expense.
2008 2007
CHF m Group profit before taxes 21.4 154.8
Tax expense at the expected tax rate – 2.2 – 45.2
Tax effects of:
Non-tax-deductible expenses and tax-exempt income – 1.1 – 1.0
Recognition of tax-effective positions with no impact on income statement 22.8 -
Tax losses and temporary differences for which no deferred
tax assets have been recognized – 31.1 – 7.5
Write-off of deferred tax assets - – 0.6
Recognition / utilization of tax losses not capitalized in prior years 8.1 7.3
Changes of applicable deferred tax rates – 0.2 – 0.5
Prior-year and other positions – 1.7 3.4
Total income taxes – 5.4 – 44.1

82
Since the Group operates around the world, it is subject to income taxes in many different tax jurisdictions. Consequently, the expected and the actual tax expense will vary from year to year according to the origin of earnings or losses by country. The expected tax expense is the sum of the expected, individual tax incomes / tax expenses of all foreign subsidiaries. The expected, individual tax income / tax expense in a single country results from the multi- plication of the individual profit / loss by the tax rate applicable in the country concerned. The expected tax rate in the financial year 2008 amounted to around 10.5 % (2007: 29.2 %). The gross value of unused tax loss carry forwards which have, or have not, been capitalized as deferred tax assets, with their maturities, is as follows:
2008
Not capitalized
Capitalized
Total CHF m Expiry after:
1 year 2.7 - 2.7
2 years 1.7 - 1.7
3 years 118.0 - 118.0
4 years 0.4 - 0.4
5 years 0.5 - 0.5
More than 5 years 304.2 86.1 390.3
Total 427.6 86.1 513.7
2007
Not capitalized
Capitalized
Total CHF m Expiry after:
1 year 2.8 - 2.8
2 years 3.1 - 3.1
3 years 3.8 - 3.8
4 years 119.5 - 119.5
5 years 3.6 - 3.6
More than 5 years 205.7 21.0 226.7
Total 338.5 21.0 359.5
In 2008, CHF 2.7 million (2007: CHF 0 million) of unused operating tax loss carry forwards expired.
Deferred income tax assets and liabilities are offset when they relate to the same fiscal authority, the legal right to offset exists, and they are intended to be settled net or realized simultaneously. The following amounts are shown in the balance sheet:
31.12.2008 31.12.2007
CHF m Deferred tax assets 28.8 20.7
Deferred tax liabilities – 68.6 – 17.5
Deferred tax (liabilities) / assets, net – 39.8 3.2

83
Deferred tax assets and liabilities and deferred tax charges and credits are attributed to the following items:
Deferred tax assets
Inventories
Property, plant
and equipment
Provisions
Loss carry forwards
Other
Total CHF m At December 31, 2007 14.4 7.2 20.9 6.2 7.5 56.2
Increase / (decrease) deferred tax assets – 1.7 9.1 12.7 12.5 1.8 34.4
At December 31, 2008 12.7 16.3 33.6 18.7 9.3 90.6
Deferred tax liabilities
Inventories
Property, plant
and equipment
Provisions
Loss carry forwards
Other
Total CHF m At December 31, 2007 – 2.7 – 13.9 – 11.8 - – 24.6 – 53.0
(Increase) / decrease deferred tax liabilities – 0.2 – 55.3 – 0.5 - – 21.4 – 77.4
At December 31, 2008 – 2.9 – 69.2 – 12.3 - – 46.0 – 130.4
Deferred tax assets / (liabilities), net at December 31, 2007 11.7 – 6.7 9.1 6.2 – 17.1 3.2
Deferred tax assets / (liabilities), net at December 31, 2008 9.8 – 52.9 21.3 18.7 – 36.7 – 39.8
Change in deferred tax assets / (liabilities), net 43.0
Of which addition to scope of consolidation – 24.9
Of which recognised in equity – 37.4
Of which recognised in the income statement 19.3
10 Earnings per shareUndiluted earnings per share is calculated by dividing the net profit or loss for the year at- tributable to registered shareholders by the weighted average number of registered shares issued during the year or outstanding, less the average number of treasury shares held.
Diluted earnings per share in addition takes into account the potential dilution effects which would result if all share options in the money were exercised.
2008 2007
Group profit for the year (CHF m) 16.0 110.7
Weighted average number of outstanding shares 2,341,187 2,536,699
Undiluted earnings per share (CHF) 6.86 43.64
Adjustment for stock option plans 4,597 10,773
Weighted average number of outstanding shares used to calculate the diluted profit / loss 2,345,784 2,547,472
Diluted earnings per share (CHF) 6.84 43.45
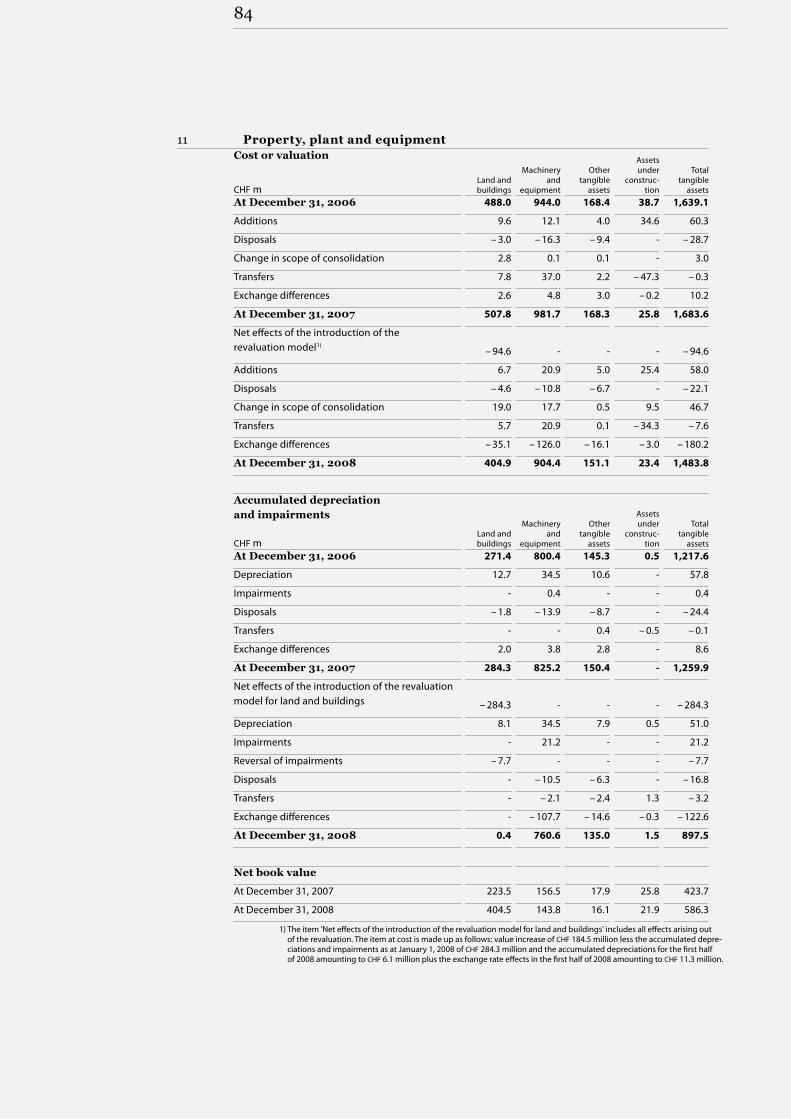
84
11 Property, plant and equipment Cost or valuation
Land and buildings
Machinery
and equipment
Other
tangible assets
Assets under
construc-tion
Total
tangible assets CHF m
At December 31, 2006 488.0 944.0 168.4 38.7 1,639.1
Additions 9.6 12.1 4.0 34.6 60.3
Disposals – 3.0 – 16.3 – 9.4 - – 28.7
Change in scope of consolidation 2.8 0.1 0.1 - 3.0
Transfers 7.8 37.0 2.2 – 47.3 – 0.3
Exchange differences 2.6 4.8 3.0 – 0.2 10.2
At December 31, 2007 507.8 981.7 168.3 25.8 1,683.6
Net effects of the introduction of the revaluation model1)
– 94.6 - - - – 94.6
Additions 6.7 20.9 5.0 25.4 58.0
Disposals – 4.6 – 10.8 – 6.7 - – 22.1
Change in scope of consolidation 19.0 17.7 0.5 9.5 46.7
Transfers 5.7 20.9 0.1 – 34.3 – 7.6
Exchange differences – 35.1 – 126.0 – 16.1 – 3.0 – 180.2
At December 31, 2008 404.9 904.4 151.1 23.4 1,483.8
Accumulated depreciation and impairments
Land and buildings
Machinery and
equipment
Other tangible
assets
Assets under
construc-tion
Total tangible
assets CHF m At December 31, 2006 271.4 800.4 145.3 0.5 1,217.6
Depreciation 12.7 34.5 10.6 - 57.8
Impairments - 0.4 - - 0.4
Disposals – 1.8 – 13.9 – 8.7 - – 24.4
Transfers - - 0.4 – 0.5 – 0.1
Exchange differences 2.0 3.8 2.8 - 8.6
At December 31, 2007 284.3 825.2 150.4 - 1,259.9
Net effects of the introduction of the revaluation model for land and buildings – 284.3 - - - – 284.3
Depreciation 8.1 34.5 7.9 0.5 51.0
Impairments - 21.2 - - 21.2
Reversal of impairments – 7.7 - - - – 7.7
Disposals - – 10.5 – 6.3 - – 16.8
Transfers - – 2.1 – 2.4 1.3 – 3.2
Exchange differences - – 107.7 – 14.6 – 0.3 – 122.6
At December 31, 2008 0.4 760.6 135.0 1.5 897.5
Net book value
At December 31, 2007 223.5 156.5 17.9 25.8 423.7
At December 31, 2008 404.5 143.8 16.1 21.9 586.3
1) The item 'Net effects of the introduction of the revaluation model for land and buildings' includes all effects arising out of the revaluation. The item at cost is made up as follows: value increase of CHF 184.5 million less the accumulated depre-ciations and impairments as at January 1, 2008 of CHF 284.3 million and the accumulated depreciations for the first half of 2008 amounting to CHF 6.1 million plus the exchange rate effects in the first half of 2008 amounting to CHF 11.3 million.

85
The item 'Additions' includes the property, plant and equipment acquired from Fenner Dunlop (Charlotte) Inc. in the amount of CHF 3.8 million (see Note 31 'Acquisition of subsid-iaries'). Property, plant and equipment also includes leased assets with a net book value of CHF 0.5 million (2007: CHF 1.1 million) as well as non-operating investment property with a fair value of CHF 3.9 million (2007: CHF 2.3 million).
The insured value of the insurance for buildings, machinery, equipment and inventories is CHF 2,321 million (2007: CHF 2,197 million).
Maintenance and repair costs amounted to CHF 35.5 million (2007: CHF 31.6 million). The de- preciation expense of CHF 57.1 million is included in the items 'Cost of goods sold', 'Develop-ment costs', 'Marketing and distribution costs', and 'Administrative costs'.
In the second half of the year, the Group examined the recoverable value of its machinery and equipment. It was found that owing to the changed economic circumstances the actual recoverable free cash flows from the use of certain assets were significantly poorer than originally planned. The review resulted in an impairment charge of CHF 21.2 million, which was recognized in the income statement. These assets are used in the Bonding Systems division, more specifically in production plants in the United States (CHF 20.0 million) and Russia (CHF 1.2 million). The recoverable value of the assets involved was determined on the basis of their value in use. These impairment tests were conducted over a planning period of five years by means of discounted free cash flows expected in future. The discount rate used to determine the value in use was 9 % per annum.
The impairments and appreciation in value are carried in the income statement under 'Other operating expenses'.

86
12 Intangible assets Cost
Goodwill
Trademarks / patents /
Technology
Other intangible
assets
Total CHF m At December 31, 2006 134.1 54.6 14.5 203.2
Additions 0.6 - 0.7 1.3
Disposals – 1.6 - – 0.4 – 2.0
Change in scope of consolidation 7.1 - - 7.1
Transfers - - 0.3 0.3
Exchange differences – 2.6 0.1 0.3 – 2.2
At December 31, 2007 137.6 54.7 15.4 207.7
Additions 1.2 - 2.3 3.5
Disposals - - – 1.8 – 1.8
Change in scope of consolidation 89.7 51.9 59.8 201.4
Transfers – 0.1 – 0.1 7.8 7.6
Exchange differences – 19.4 – 11.4 – 14.4 – 45.2
At December 31, 2008 209.0 95.1 69.1 373.2
Accumulated amortization and impairment
Goodwill
Trademarks / patents /
Technology
Other intangible
assets
Total CHF m At December 31, 2006 10.5 33.0 10.5 54.0
Amortization - - 1.3 1.3
Disposals - - – 0.4 – 0.4
Transfers - - 0.1 0.1
Exchange differences 0.4 - 0.4 0.8
At December 31, 2007 10.9 33.0 11.9 55.8
Amortization - - 2.3 2.3
Impairment 3.7 - 1.2 4.9
Disposals - - – 1.8 – 1.8
Transfers - - 3.1 3.1
Exchange differences – 1.2 – 0.2 – 1.4 – 2.8
At December 31, 2008 13.4 32.8 15.3 61.5
Net book value
At December 31, 2007 126.7 21.7 3.5 151.9
At December 31, 2008 195.6 62.3 53.8 311.7
The acquisition of Transtex Belting, the lightweight PVC conveyor belt operations of Fenner Dunlop (Charlotte) Inc. led to a CHF 1.2 million increase in goodwill. The item 'Additions' to intangible assets includes the customer list acquired in connection with this acquisition with a fair value of CHF 1.2 million. See Note 31 'Acquisition of subsidiaries'.
The intangible assets with an indefinite useful life are subject to an impairment test every year on the basis of the cash-generating unit. The test is carried out using a standardized method with discounted cash flow for calculating the value in use. The cash flows for the first 5 years are estimated by management. Growth ranging from 0 % to 3 % is assumed for the following years. The discount rate corresponds to the weighted cost of capital before taxes plus an extra risk charge estimated by management and is between 8 % and 15 %.

87
The goodwill item as at January 1, 2008 includes mainly goodwill from the Swift acquisition in 2002. The addition of goodwill under 'Change in the scope of consolidation' includes the goodwill acquired in connection with the acquisition of Bonar Floors (see Note 31 'Ac- quisition of subsidiaries').
As a result of the impairment test made at the balance sheet date, it was found that the value of the goodwill recognized in connection with the acquisition of Victa Holding and the cus- tomer list no longer exists. Impairment charges in the amount of CHF 3.7 million and CHF 1.2 million, respectively, were taken. This results from the fact that the original business plan could not be implemented as rapidly as possible owing to the decline in demand.
The impairment test for goodwill and intangible assets (mainly technologies, trademarks and customer relationships) of Bonar Floors, acquired during the year under review, yielded a value in use that was significantly higher than the carrying amount. The discount rate applied was 10 %. The value of the intangible assets were also tested by means of sensitivity analyses.
The impairment test of the goodwill and intangible assets from the Swift acquisition in 2002 yielded a value in use which was higher than the carrying amount. The discount rate applied was 8 %. The intangible assets items were also tested by means of sensitivity analyses. Even if the discount rate were increased to 10 % and a defensive business plan with a permanent yield of 1 % were applied, the value of the intangible assets would not be impaired.
13Investments in associates and other non-current assets 31.12.200731.12.2008
CHF m Other investments 1.5 1.9
Other non-current assets 0.4 0.4
Total investments in associates and other non-current assets 1.9 2.3
14 Inventories 31.12.2008 31.12.2007
CHF m Raw materials and supplies 87.8 74.0
Work in progress 79.2 97.5
Finished goods 161.7 144.8
Allowance for product risks – 30.4 – 30.0
Total inventories 298.3 286.3
The inventory allowance amounts to CHF 30.4 million (2007: CHF 30.0 million). Allowances totaling CHF 1.6 million (2007: CHF 1.4 million) are recognized in 'Cost of goods sold' in the income statement.
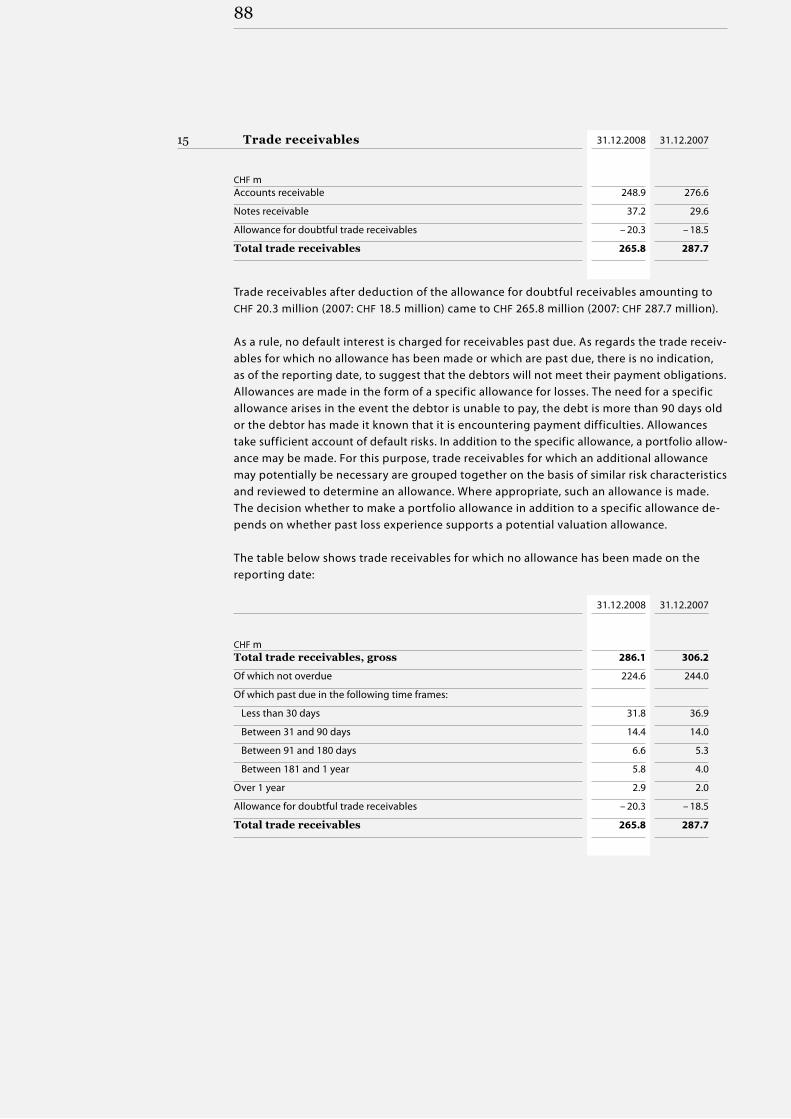
88
15 Trade receivables 31.12.2008 31.12.2007
CHF m Accounts receivable 248.9 276.6
Notes receivable 37.2 29.6
Allowance for doubtful trade receivables – 20.3 – 18.5
Total trade receivables 265.8 287.7
Trade receivables after deduction of the allowance for doubtful receivables amounting to CHF 20.3 million (2007: CHF 18.5 million) came to CHF 265.8 million (2007: CHF 287.7 million).
As a rule, no default interest is charged for receivables past due. As regards the trade receiv- ables for which no allowance has been made or which are past due, there is no indication, as of the reporting date, to suggest that the debtors will not meet their payment obligations. Allowances are made in the form of a specific allowance for losses. The need for a specific allowance arises in the event the debtor is unable to pay, the debt is more than 90 days old or the debtor has made it known that it is encountering payment difficulties. Allowances take sufficient account of default risks. In addition to the specific allowance, a portfolio allow- ance may be made. For this purpose, trade receivables for which an additional allowance may potentially be necessary are grouped together on the basis of similar risk characteristics and reviewed to determine an allowance. Where appropriate, such an allowance is made. The decision whether to make a portfolio allowance in addition to a specific allowance de- pends on whether past loss experience supports a potential valuation allowance.
The table below shows trade receivables for which no allowance has been made on the reporting date:
31.12.2008 31.12.2007
CHF m Total trade receivables, gross 286.1 306.2
Of which not overdue 224.6 244.0
Of which past due in the following time frames:
Less than 30 days 31.8 36.9
Between 31 and 90 days 14.4 14.0
Between 91 and 180 days 6.6 5.3
Between 181 and 1 year 5.8 4.0
Over 1 year 2.9 2.0
Allowance for doubtful trade receivables – 20.3 – 18.5
Total trade receivables 265.8 287.7
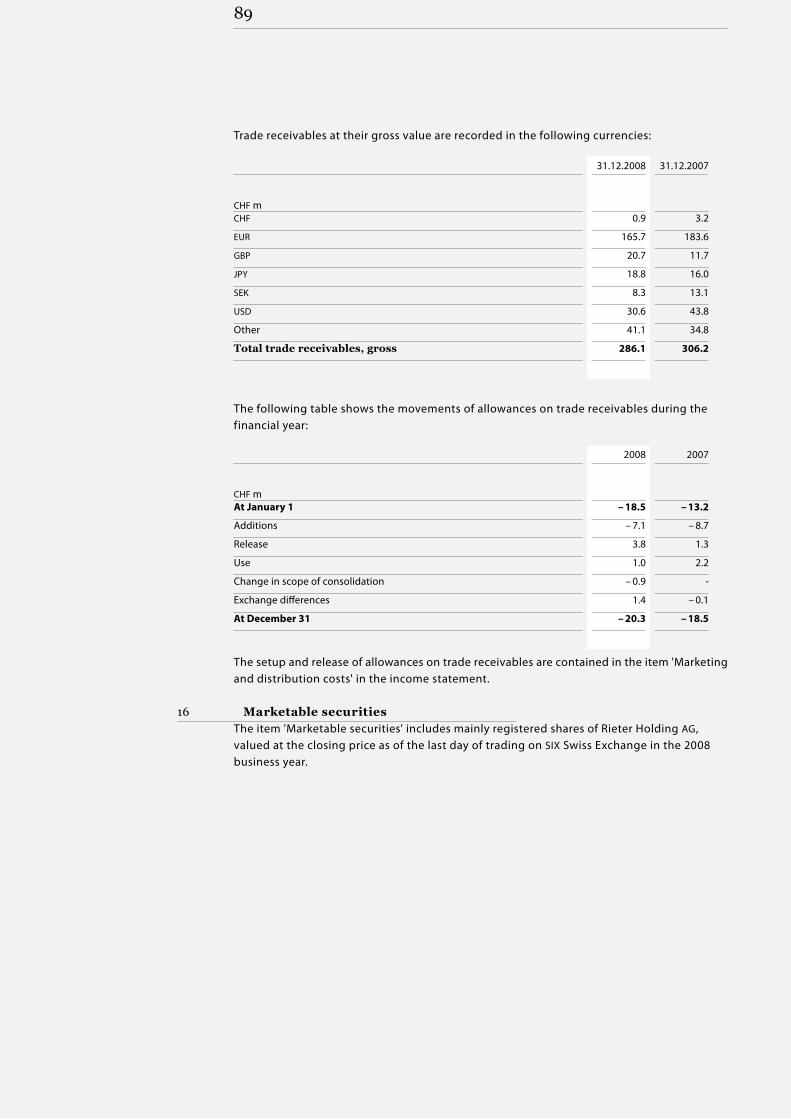
89
Trade receivables at their gross value are recorded in the following currencies:
31.12.2008 31.12.2007
CHF m CHF 0.9 3.2
EUR 165.7 183.6
GBP 20.7 11.7
JPY 18.8 16.0
SEK 8.3 13.1
USD 30.6 43.8
Other 41.1 34.8
Total trade receivables, gross 286.1 306.2
The following table shows the movements of allowances on trade receivables during the financial year:
2008 2007
CHF m At January 1 – 18.5 – 13.2
Additions – 7.1 – 8.7
Release 3.8 1.3
Use 1.0 2.2
Change in scope of consolidation – 0.9 -
Exchange differences 1.4 – 0.1
At December 31 – 20.3 – 18.5
The setup and release of allowances on trade receivables are contained in the item 'Marketing and distribution costs' in the income statement.
16 Marketable securitiesThe item 'Marketable securities' includes mainly registered shares of Rieter Holding AG, valued at the closing price as of the last day of trading on SIX Swiss Exchange in the 2008 business year.
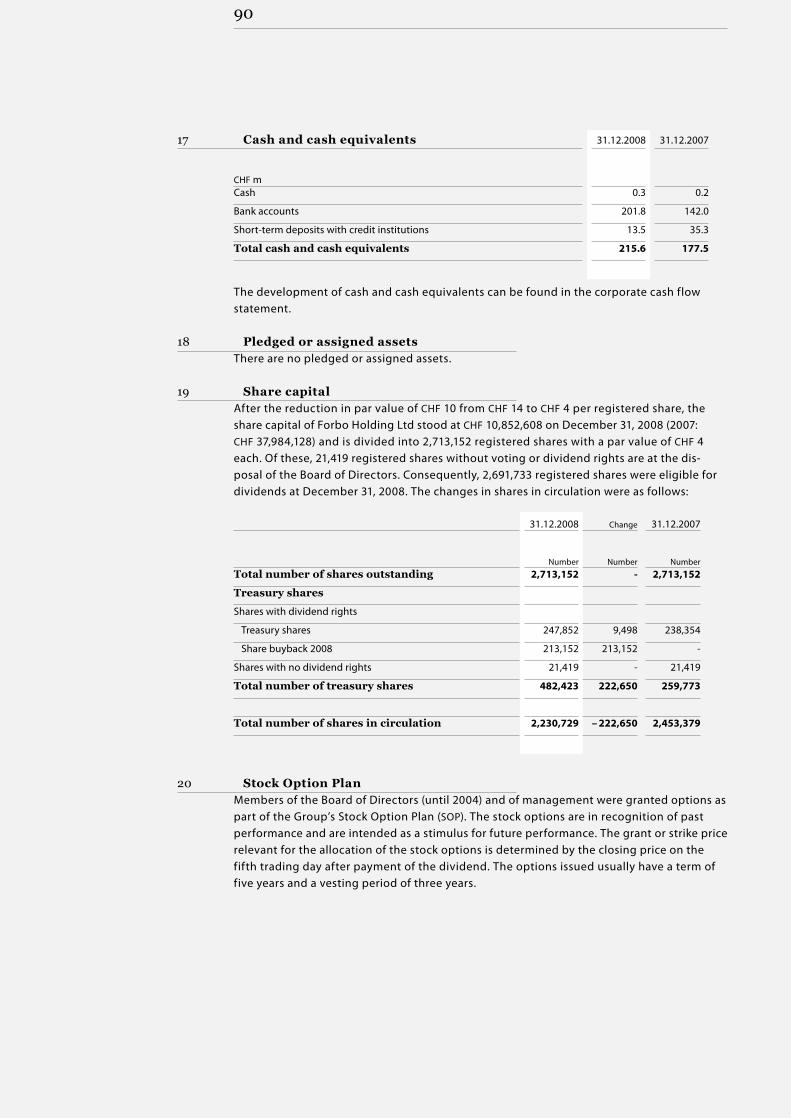
90
17 Cash and cash equivalents 31.12.2008 31.12.2007
CHF m Cash 0.3 0.2
Bank accounts 201.8 142.0
Short-term deposits with credit institutions 13.5 35.3
Total cash and cash equivalents 215.6 177.5
The development of cash and cash equivalents can be found in the corporate cash flow statement.
18 Pledged or assigned assetsThere are no pledged or assigned assets.
19 Share capitalAfter the reduction in par value of CHF 10 from CHF 14 to CHF 4 per registered share, the share capital of Forbo Holding Ltd stood at CHF 10,852,608 on December 31, 2008 (2007: CHF 37,984,128) and is divided into 2,713,152 registered shares with a par value of CHF 4 each. Of these, 21,419 registered shares without voting or dividend rights are at the dis- posal of the Board of Directors. Consequently, 2,691,733 registered shares were eligible for dividends at December 31, 2008. The changes in shares in circulation were as follows:
31.12.2008 Change 31.12.2007
Number
Number
Number
Total number of shares outstanding 2,713,152 - 2,713,152
Treasury shares
Shares with dividend rights
Treasury shares 247,852 9,498 238,354
Share buyback 2008 213,152 213,152 -
Shares with no dividend rights 21,419 - 21,419
Total number of treasury shares 482,423 222,650 259,773
Total number of shares in circulation 2,230,729 – 222,650 2,453,379
20 Stock Option PlanMembers of the Board of Directors (until 2004) and of management were granted options as part of the Group’s Stock Option Plan (SOP). The stock options are in recognition of past performance and are intended as a stimulus for future performance. The grant or strike price relevant for the allocation of the stock options is determined by the closing price on the fifth trading day after payment of the dividend. The options issued usually have a term of five years and a vesting period of three years.
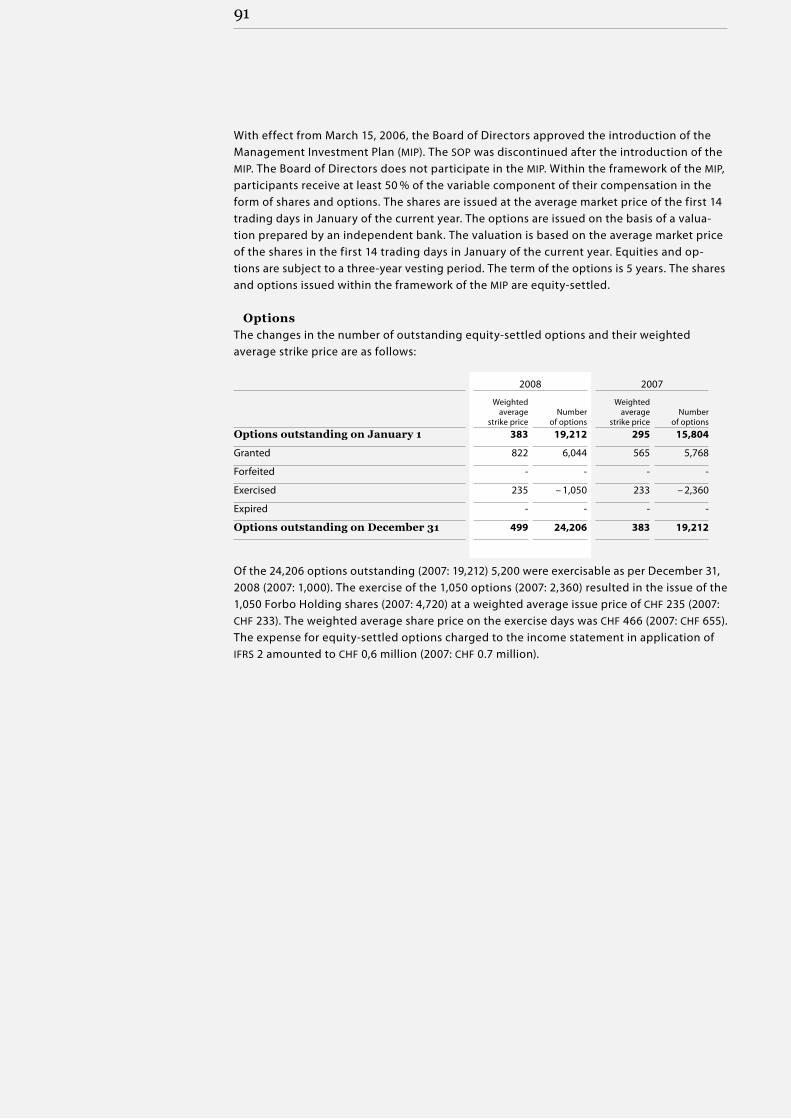
91
With effect from March 15, 2006, the Board of Directors approved the introduction of the Management Investment Plan (MIP). The SOP was discontinued after the introduction of the MIP. The Board of Directors does not participate in the MIP. Within the framework of the MIP, participants receive at least 50 % of the variable component of their compensation in the form of shares and options. The shares are issued at the average market price of the first 14 trading days in January of the current year. The options are issued on the basis of a valua-tion prepared by an independent bank. The valuation is based on the average market price of the shares in the first 14 trading days in January of the current year. Equities and op- tions are subject to a three-year vesting period. The term of the options is 5 years. The shares and options issued within the framework of the MIP are equity-settled.
OptionsThe changes in the number of outstanding equity-settled options and their weighted average strike price are as follows:
2008 2007 Weighted
average strike price
Number
of options
Weighted average
strike price
Number
of options Options outstanding on January 1 383 19,212 295 15,804
Granted 822 6,044 565 5,768
Forfeited - - - -
Exercised 235 – 1,050 233 – 2,360
Expired - - - -
Options outstanding on December 31 499 24,206 383 19,212
Of the 24,206 options outstanding (2007: 19,212) 5,200 were exercisable as per December 31, 2008 (2007: 1,000). The exercise of the 1,050 options (2007: 2,360) resulted in the issue of the 1,050 Forbo Holding shares (2007: 4,720) at a weighted average issue price of CHF 235 (2007: CHF 233). The weighted average share price on the exercise days was CHF 466 (2007: CHF 655). The expense for equity-settled options charged to the income statement in application of IFRS 2 amounted to CHF 0,6 million (2007: CHF 0.7 million).

92
The following table summarizes information about the options outstanding at December 31, 2008:
Series
Strike price
(CHF)
Number of outstanding
options
Average remaining
term (years)
Number of exercisable
options 2004 212 1,000 0.6 1,000
2005 235 4,200 1.5 4,200
2006 370 7,194 2.3 -
2007 565 5,768 3.3 -
2008 822 6,044 4.3 -
Total 24,206 2.8 5,200
In the year under review, a total of 6,044 equity-settled options (2007: 5,768) were granted under the MIP. The fair value of these options was CHF 43.20 (2007: CHF 75.60). The options were valued in accordance with the Black-Scholes model using the following input factors: share price at issue date CHF 520 (2007: CHF 475), strike price CHF 822 (2007: CHF 565), vola- tility 27.4 % (2007: 27.4 %), expected life of the financial instrument 4.1 years (2007: 4.1 years), dividend yield 1.5 % (2007: 1.5 %) and risk-free interest rate 2.8 % (2007: 2.6 %). The expected volatility is based on adjusted historical market data over a period comparable to the ex- pected life of the options. The expected useful life applied in the calculation model has been adapted, using the best possible estimate, to the limitation of exercise rights and to assess- ment of possible behavior.
SharesThe number of shares of Forbo Holding Ltd issued as part of the MIP in the year under review was 1,283 (2007: 1,455). The share price at measurement date was CHF 520 (2007: CHF 475).
The Delegate of the Board of Directors and CEO is remunerated primarily with shares. Based on an employment contract signed in 2005, 47,395 shares were issued in 2006 at a market value of CHF 270 each for the entire five-year contract term (2006 - 2010). These shares are vested until December 31, 2010. The corresponding personnel expenditure is charged to the income statement over the entire contractual period on a pro rata basis.
In the year under review, the amount charged to the income statement in application of IFRS 2 for shares issued came to CHF 4.5 million (2007: CHF 4.5 million).

93
21 Consolidated statement of changes in equity 2008
Share capital
Treasury shares
Reserves
Revalu-
ation reserve
Cash flow
hedge reserve
Net investment
hedge reserve
Exchange
differ-ences
Total CHF m At December 31, 2007 38.0 – 4.0 821.3 - – 5.9 – 7.7 – 128.6 713.1
Total income and expenses recognized in equity - - – 26.8 143.3 – 1.1 8.1 – 129.5 – 6.0
Share-based compensation - 0.1 4.9 - - - - 5.0
Treasury shares - – 2.8 – 102.5 - - - - – 105.3
Reduction in par value – 27.1 4.7 - - - - - – 22.4
At December 31, 2008 10.9 – 2.0 696.9 143.3 – 7.0 0.4 – 258.1 584.4
2007
Share capital
Treasury shares
Reserves
Revalu-
ation reserve
Cash flow
hedge reserve
Net investment
hedge reserve
Exchange
differ-ences
Total CHF m At December 31, 2006 54.3 – 3.5 735.4 - – 8.3 – 9.2 – 130.1 638.6
Total income and expenses recognized in equity - - 160.3 - 2.4 1.5 1.5 165.7
Share-based compensation - 0.2 5.0 - - - - 5.2
Treasury shares - – 1.7 – 79.4 - - - - – 81.1
Reduction in par value – 16.3 1.0 - - - - - – 15.3
At December 31, 2007 38.0 – 4.0 821.3 - – 5.9 – 7.7 – 128.6 713.1
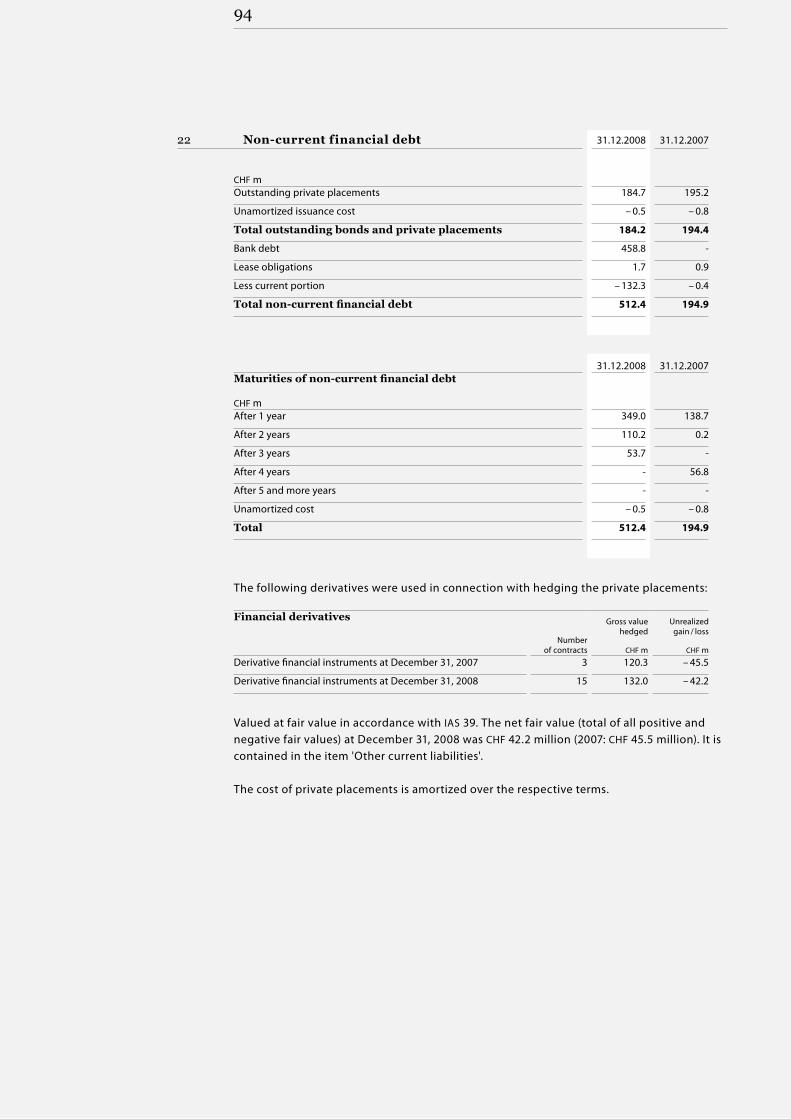
94
22 Non-current financial debt 31.12.2008 31.12.2007
CHF m Outstanding private placements 184.7 195.2
Unamortized issuance cost – 0.5 – 0.8
Total outstanding bonds and private placements 184.2 194.4
Bank debt 458.8 -
Lease obligations 1.7 0.9
Less current portion – 132.3 – 0.4
Total non-current financial debt 512.4 194.9
31.12.2008 31.12.2007 Maturities of non-current financial debt
CHF m After 1 year 349.0 138.7
After 2 years 110.2 0.2
After 3 years 53.7 -
After 4 years - 56.8
After 5 and more years - -
Unamortized cost – 0.5 – 0.8
Total 512.4 194.9
The following derivatives were used in connection with hedging the private placements:
Financial derivatives
Number of contracts
Gross value hedged
CHF m
Unrealized gain / loss
CHF m Derivative financial instruments at December 31, 2007 3 120.3 – 45.5
Derivative financial instruments at December 31, 2008 15 132.0 – 42.2
Valued at fair value in accordance with IAS 39. The net fair value (total of all positive and negative fair values) at December 31, 2008 was CHF 42.2 million (2007: CHF 45.5 million). It is contained in the item 'Other current liabilities'.
The cost of private placements is amortized over the respective terms.

95
Total outstanding private placements at 31.12.2008
Currency
m
Term
Interest
rate Company Forbo NL Holding B.V. (guaranteed by Forbo Holding AG) USD 122.0 2002 – 2009 5.79 %
Forbo NL Holding B.V. (guaranteed by Forbo Holding AG) USD 50.0 2002 – 2012 6.29 %
Covenants related to financial debtThe private placements (USD 172.0 million) as well as bank debt contain general covenants customary for such facilities. The private placements and certain bank debt also contain financial covenants, i.e. defined maximum debt coverage (the ratio of consolidated net debt to consolidated EBITDA may not be greater than 3 to 1), a defined minimum interest cov- erage (the ratio of consolidated EBITDA to consolidated net interest payable may not be less than 4 to 1) and a consolidated net worth test (shareholders’ equity on the consolidated balance sheet may not fall below CHF 535.5 million).
The private placements and part of the financing from banks include events of default customary for such facilities. All facilities are unsecured (with the exception of guarantees provided by Forbo Holding Ltd for obligations of its subsidiaries).
23 Employee benefit obligationsThe Group has established several pension plans on the basis of the specific requirements of the countries in which it operates. It has both defined contribution and defined benefit plans. The obligations and assets under all the essential defined benefit plans are assessed annually by independent actuaries in accordance with the 'projected unit credit method'.
Details of the pension costs related to the major defined benefit plans are as follows:
2008 2007
CHF m Current service cost, net 12.4 14.4
Interest costs on employment benefit obligations 35.2 37.3
Expected return on plan assets – 37.9 – 38.3
Curtailment loss – 0.2 – 1.2
Net periodic pension cost 9.5 12.2
The actual expense from plan assets came to CHF 59.1 million (2007: revenue of CHF 11.7 million).

96
The movements in liabilities under the defined benefit plans are as follows:
2008 2007
CHF m At January 1 734.9 807.2
Total pension costs, gross 17.2 19.9
Interest costs on employment benefit obligations 35.2 37.3
Benefits paid – 35.3 – 34.4
Actuarial gains – 23.6 – 91.6
Inclusion of new pension plans 1.1 6.3
Plan curtailments and compensations – 33.2 – 5.1
Exchange difference – 121.2 – 4.7
At December 31 575.1 734.9
The movements of plan assets at fair value are as follows:
2008 2007
CHF m At January 1 750.5 761.4
Expected return on plan assets 37.9 38.3
Employer contributions 16.6 14.0
Employee contributions 4.8 5.5
Actuarial losses – 96.9 – 26.6
Benefits paid – 35.3 – 34.4
Inclusion of new pension plans - 3.4
Plan curtailments and compensations – 33.0 – 4.0
Exchange differences – 128.1 – 7.1
At December 31 516.5 750.5
The present values of pension liabilities and fair value of plan assets at year-end were as follows:
31.12.2008 31.12.2007 31.12.2006 31.12.2005
CHF m Present value of defined benefit obligation 575.1 734.9 807.2 789.6
Fair value of plan assets – 516.5 – 750.5 – 761.4 – 688.5
Net liabilities / (assets) 58.6 – 15.6 45.8 101.1
Net assets not recognized in the balance sheet - 12.5 - -
Net liabilities / (assets) recognized in the balance sheet 58.6 – 3.1 45.8 101.1
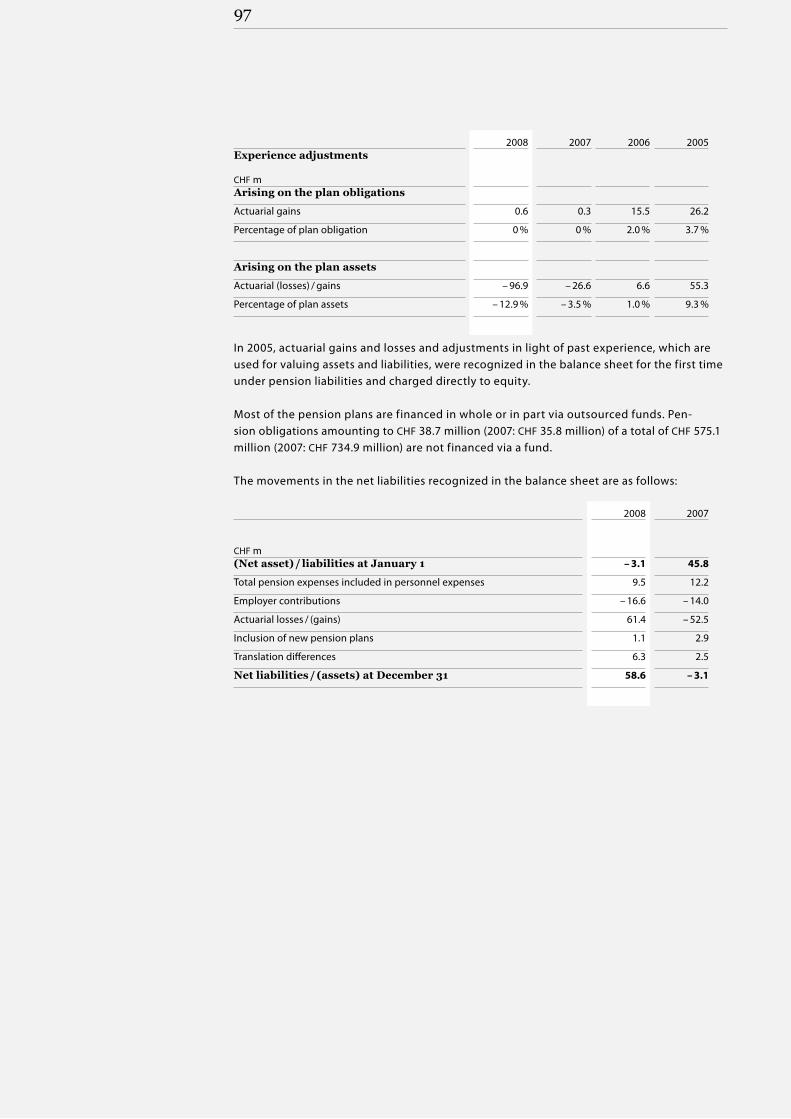
97
2008 2007 2006 2005 Experience adjustments
CHF m Arising on the plan obligations
Actuarial gains 0.6 0.3 15.5 26.2
Percentage of plan obligation 0 % 0 % 2.0 % 3.7 %
Arising on the plan assets
Actuarial (losses) / gains – 96.9 – 26.6 6.6 55.3
Percentage of plan assets – 12.9 % – 3.5 % 1.0 % 9.3 %
In 2005, actuarial gains and losses and adjustments in light of past experience, which are used for valuing assets and liabilities, were recognized in the balance sheet for the first time under pension liabilities and charged directly to equity.
Most of the pension plans are financed in whole or in part via outsourced funds. Pen- sion obligations amounting to CHF 38.7 million (2007: CHF 35.8 million) of a total of CHF 575.1 million (2007: CHF 734.9 million) are not financed via a fund.
The movements in the net liabilities recognized in the balance sheet are as follows:
2008 2007
CHF m (Net asset) / liabilities at January 1 – 3.1 45.8
Total pension expenses included in personnel expenses 9.5 12.2
Employer contributions – 16.6 – 14.0
Actuarial losses / (gains) 61.4 – 52.5
Inclusion of new pension plans 1.1 2.9
Translation differences 6.3 2.5
Net liabilities / (assets) at December 31 58.6 – 3.1
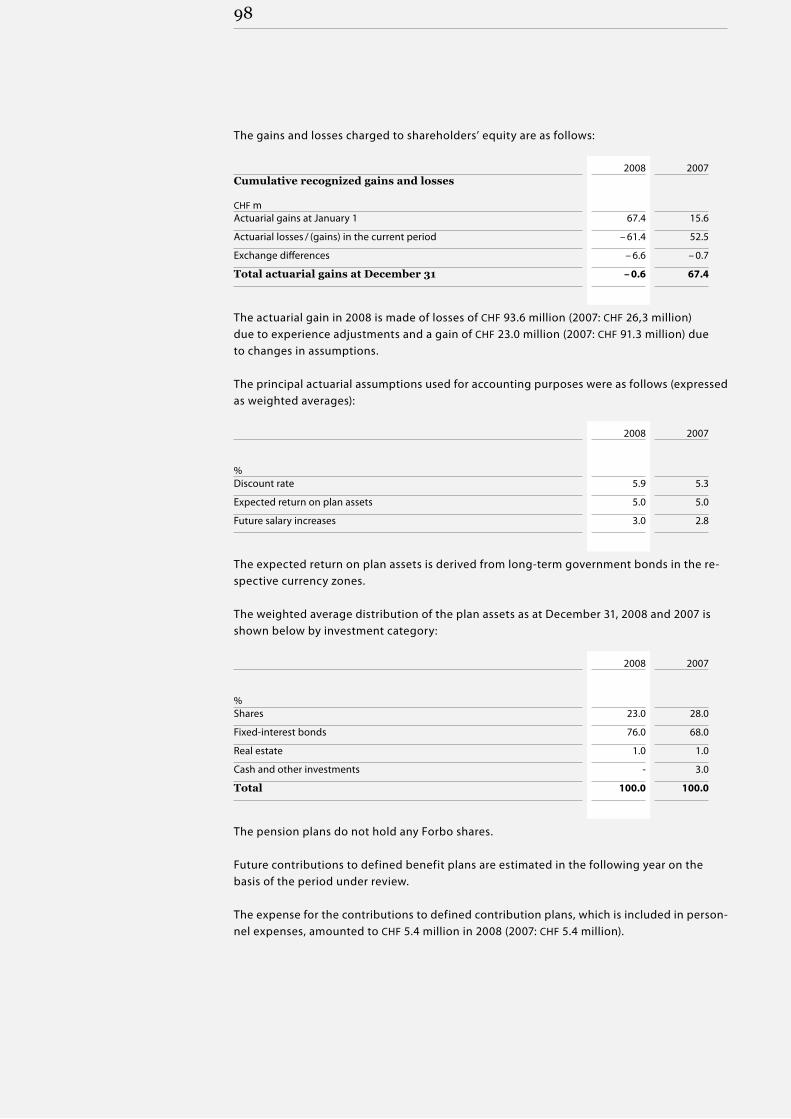
98
The gains and losses charged to shareholders’ equity are as follows:
2008 2007 Cumulative recognized gains and losses
CHF m Actuarial gains at January 1 67.4 15.6
Actuarial losses / (gains) in the current period – 61.4 52.5
Exchange differences – 6.6 – 0.7
Total actuarial gains at December 31 – 0.6 67.4
The actuarial gain in 2008 is made of losses of CHF 93.6 million (2007: CHF 26,3 million) due to experience adjustments and a gain of CHF 23.0 million (2007: CHF 91.3 million) due to changes in assumptions.
The principal actuarial assumptions used for accounting purposes were as follows (expressed as weighted averages):
2008 2007
% Discount rate 5.9 5.3
Expected return on plan assets 5.0 5.0
Future salary increases 3.0 2.8
The expected return on plan assets is derived from long-term government bonds in the re- spective currency zones.
The weighted average distribution of the plan assets as at December 31, 2008 and 2007 is shown below by investment category:
2008 2007
% Shares 23.0 28.0
Fixed-interest bonds 76.0 68.0
Real estate 1.0 1.0
Cash and other investments - 3.0
Total 100.0 100.0
The pension plans do not hold any Forbo shares.
Future contributions to defined benefit plans are estimated in the following year on the basis of the period under review.
The expense for the contributions to defined contribution plans, which is included in person- nel expenses, amounted to CHF 5.4 million in 2008 (2007: CHF 5.4 million).

99
24 Provisions
Warranty provisions
Environ-
mental provisions
Provisions for
legal claims
Personnel provisions
Other provisions
Total 2008
Total 2007 CHF m
At January 1 6.8 6.2 18.7 1.2 16.8 49.7 41.7
Reclassification1) - - - - - - 8.6
At January 1 6.8 6.2 18.7 1.2 16.8 49.7 50.3
Additions 3.1 0.3 2.5 8.6 6.5 21.0 9.1
Used during the year – 2.9 - – 1.0 – 0.4 – 2.2 – 6.5 – 8.0
Reversed during the year – 1.4 – 5.1 – 0.1 - – 3.3 – 9.9 – 2.1
Change in scope of consolidation 1.4 - - 2.3 - 3.7 -
Exchange differences – 1.2 – 0.9 – 0.3 – 0.2 0.2 – 2.4 0.4
At December 31 5.8 0.5 19.8 11.5 18.0 55.6 49.7
thereof current provisions 3.9 - 0.2 7.8 6.7 18.6 7.4
thereof non-current provisions 1.9 0.5 19.6 3.7 11.3 37.0 42.3
1) Current provisions in the amount of CHF 8.6 million from the previous year were reclassified from the item 'Current provisions and accrued expenses'. Of this amount, CHF 1.2 million was used in 2007. In the year under review the current provisions are part of the schedule of provisions. The previous year has been adjusted accordingly.
Warranty provisions are made in connection with the sale of products and are based on past experience. Experience shows that cash outflows are spread evenly over the warranty pe- riod of 5 to 10 years. The environmental provisions cover the anticipated remediation costs related to operations in previous years. The provisions for legal claims relate mainly to product liability claims in which the Group is involved in the course of its normal conduct of business.
25 Trade payables 31.12.2008 31.12.2007
CHF m Accounts payable 141.4 132.2
Notes payable 3.1 5.9
Total trade payables 144.5 138.1
26 Accrued expenses 31.12.2008 31.12.2007
CHF m Accrued expenses for compensation and benefits to employees 65.8 64.9
Other accrued expenses 64.6 95.3
Total accrued expenses1) 130.4 160.2
1) Current provisions in the amount of CHF 7.4 million from the previous year were reclassified from the item 'Current provisions and accrued expenses' to the item 'Provisions'.

100
Accrued expenses for compensation and benefits to employees mainly include holidays and overtime accruals as well as bonus provisions. Other accrued expenses include accrued volume rebates, commissions, premiums, interest and accrued warranty costs, and similar items.
27 Current financial debt 31.12.2008 31.12.2007
CHF m Current bank loans and overdrafts 49.0 23.8
Current portion of non-current debt 132.3 0.4
Total current financial debt 181.3 24.2
Regarding covenants please refer to Note 22 'Non-current financial debt'.
28 Commitments and contingent liabilities 31.12.2008 31.12.2007
CHF m Commitments and contingent liabilities 0.5 0.9
Contingent liabilities relate to sureties and guarantees in favor of third parties.
29 Leasing
Operational leasing
CHF m 2008 2007 Leasing obligation up to 1 year 9.7 10.4
Leasing obligation 2 – 5 years 18.0 16.1
Leasing obligations of more than 5 years 4.1 0.6
Total 31.8 27.1
The expense for operational leasing charged to the 2008 income statement came to CHF 28.7 million in 2008 (2007: CHF 25.5 million). The Group has no significant operational leasing contracts. The liability from financial leasing stood at CHF 1.7 million at year-end (2007: CHF 0.9 million) and is included in 'Non-current financial debt'.
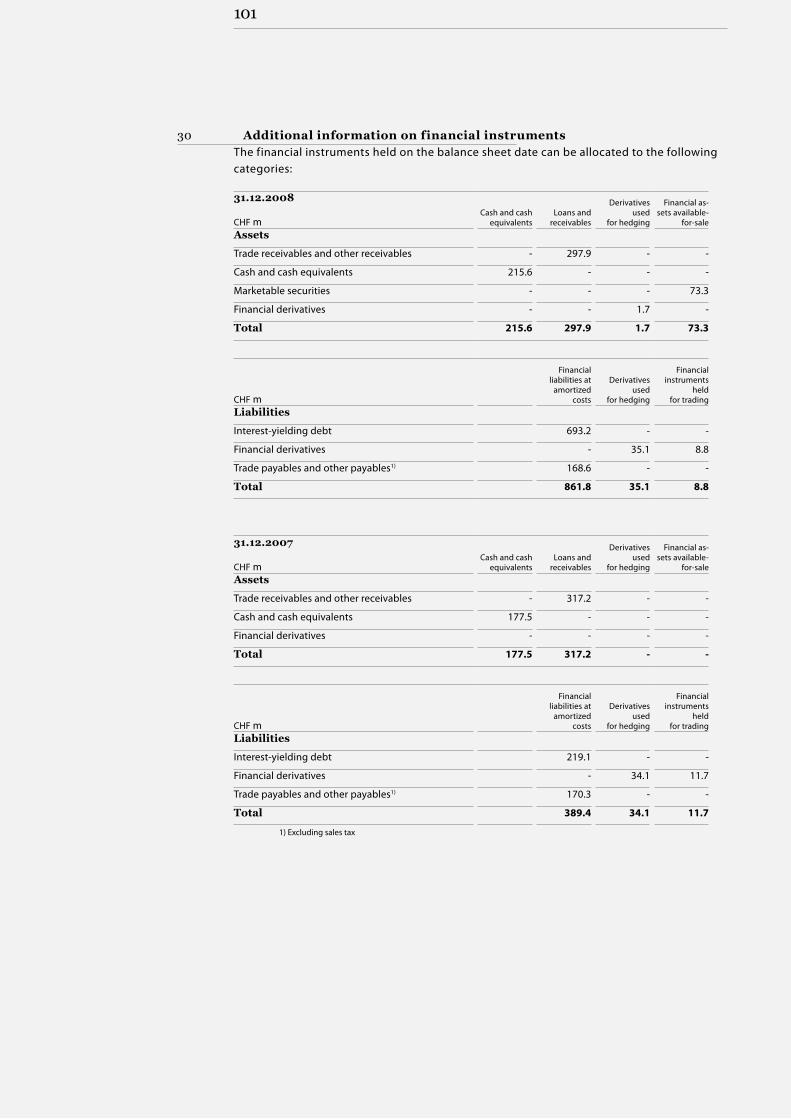
101
30 Additional information on financial instrumentsThe financial instruments held on the balance sheet date can be allocated to the following categories:
31.12.2008 Cash and cash
equivalents
Loans and
receivables
Derivatives used
for hedging
Financial as-sets available-
for-sale CHF m Assets
Trade receivables and other receivables - 297.9 - -
Cash and cash equivalents 215.6 - - -
Marketable securities - - - 73.3
Financial derivatives - - 1.7 -
Total 215.6 297.9 1.7 73.3
Financial liabilities at
amortized costs
Derivatives
used for hedging
Financial instruments
held for trading CHF m
Liabilities
Interest-yielding debt 693.2 - -
Financial derivatives - 35.1 8.8
Trade payables and other payables1) 168.6 - -
Total 861.8 35.1 8.8
31.12.2007 Cash and cash
equivalents
Loans and
receivables
Derivatives used
for hedging
Financial as-sets available-
for-sale CHF m Assets
Trade receivables and other receivables - 317.2 - -
Cash and cash equivalents 177.5 - - -
Financial derivatives - - - -
Total 177.5 317.2 - -
Financial liabilities at
amortized costs
Derivatives
used for hedging
Financial instruments
held for trading CHF m
Liabilities
Interest-yielding debt 219.1 - -
Financial derivatives - 34.1 11.7
Trade payables and other payables1) 170.3 - -
Total 389.4 34.1 11.7
1) Excluding sales tax

102
31 Acquisition of subsidiariesOn July 11, 2008, the Group acquired Transtex Belting, the lightweight PVC conveyor belt operations of Fenner Dunlop (Charlotte) Inc. The acquired activities were integrated in Forbo Siegling LLC, Huntersville, USA, and are reported as part of the Movement Systems division.
On September 30, 2008, the Group acquired the Bonar Floors division of Low & Bonar PLC, a company listed on the London Stock Exchange. Bonar Floors is a leading European manu - facturer of floorings for the commercial segment. By broadening the division’s product portfolio, the acquisition has strengthened the position of Flooring Systems as a system sup- plier of elastic floorcoverings for the commercial market.
Bonar Floors Transtex Belting Total
CHF m
Total purchase consideration, including transaction costs 222.0 11.1 233.1
Fair value of net assets – 132.3 – 9.9 – 142.3
Goodwill 89.7 1.2 90.9
The goodwill stems from the anticipated synergies which can be generated from the existing Flooring Systems and Movement Systems divisions. Bonar Floors products are distributed in the same markets as those in which Forbo Flooring Systems operates. The product port- folio of Bonar Floors is an ideal addition to the Forbo offering of linoleum and vinyl floor-ings. The acquisition of Bonar Floors has significantly strengthened the market position of Flooring Systems as a provider of floorcoverings for the commercial segment. With the acquisition of Transtex Belting products, Movement Systems strengthens its position in the
US market.

103
The provisional fair values of the identifiable assets and liabilities and the corresponding carrying amounts at the date of acquisition are as follows:
Bonar Floors Transtex Belting Total
as of 30.09.2008 as of 11.07.2008
CHF m Fair value
Aquiree’s carrying amount Fair value
Aquiree’s carrying amount
Property, plant and equipment (Note 11) 46.7 40.6 3.8 3.4
Intangible assets (Note 12) 111.7 38.4 1.2 -
Inventories 42.3 41.9 4.9 4.9
Trade receivables 36.5 36.5 - -
Cash and cash equivalents 20.3 20.3 - -
Other assets 2.6 2.6 - -
Deferred tax liabilities – 37.8 – 6.9 - -
Trade payables – 25.8 – 25.8 - -
Provisions (Note 24) – 3.7 – 3.7 - -
Other liabilities – 60.5 – 60.5 - -
Fair value of net assets acquired 132.3 83.4 9.9 8.3
Purchase consideration settled in cash – 219.3 – 10.5 – 229.8
Directly attributable transaction costs – 2.7 – 0.6 – 3.3
Cash and cash equivalents in subsidiaries acquired 20.3 - 20.3
Cash outflow on acquisition, net – 201.7 – 11.1 – 212.8
Since the date of acquisition, Bonar Floors has made a positive contribution of CHF 2,1 million to net income. Had the acquisition taken place as per January 1, 2008, Group sales would have been CHF 179 million higher and the net income attributable to shareholders would have been CHF 17 million higher. Since the date of acquisition, the negative contribu-tion (loss) of Transtex Belting to net income has been CHF 0.3 million. Had the acquisition taken place as per January 1, 2008, Group sales would have been CHF 9 million higher and the net income attributable to shareholders would have been CHF 0.3 million lower.
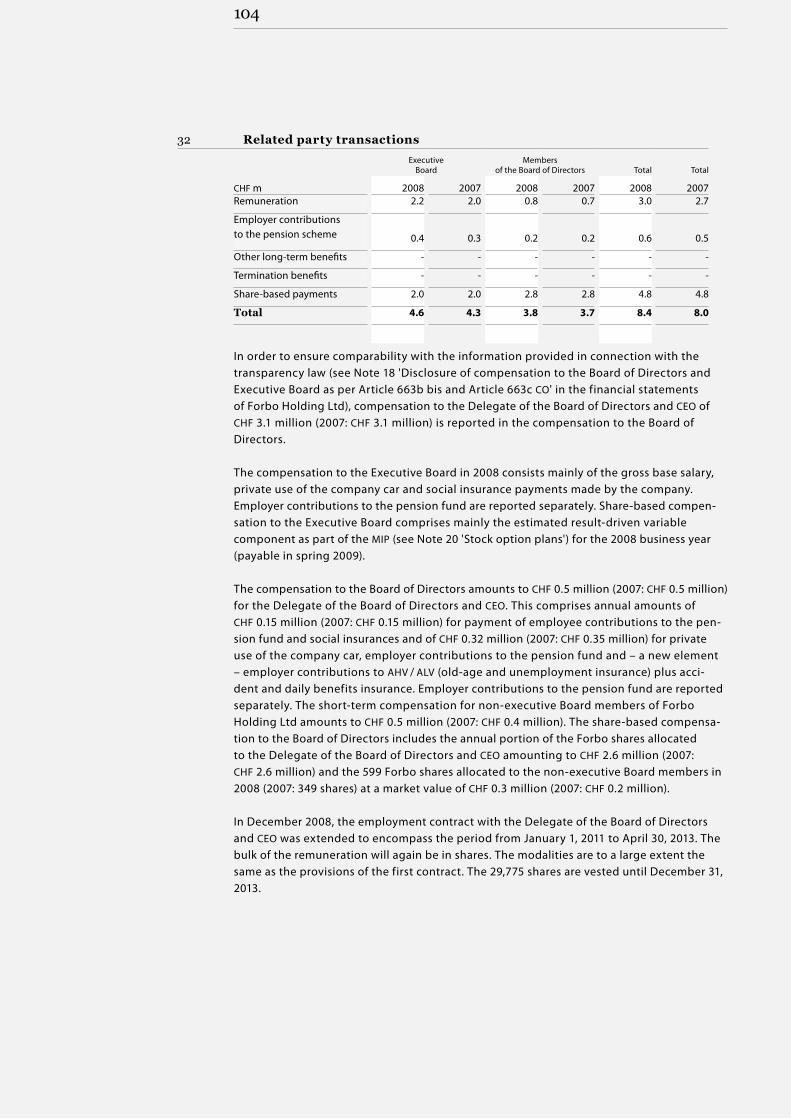
104
32 Related party transactions
Executive
Board Members
of the Board of Directors Total Total
CHF m 2008 2007 2008 2007 2008 2007 Remuneration 2.2 2.0 0.8 0.7 3.0 2.7
Employer contributions to the pension scheme 0.4 0.3 0.2 0.2 0.6 0.5
Other long-term benefits - - - - - -
Termination benefits - - - - - -
Share-based payments 2.0 2.0 2.8 2.8 4.8 4.8
Total 4.6 4.3 3.8 3.7 8.4 8.0
In order to ensure comparability with the information provided in connection with the transparency law (see Note 18 'Disclosure of compensation to the Board of Directors and Executive Board as per Article 663b bis and Article 663c CO' in the financial statements of Forbo Holding Ltd), compensation to the Delegate of the Board of Directors and CEO of CHF 3.1 million (2007: CHF 3.1 million) is reported in the compensation to the Board of Directors.
The compensation to the Executive Board in 2008 consists mainly of the gross base salary, private use of the company car and social insurance payments made by the company. Employer contributions to the pension fund are reported separately. Share-based compen-sation to the Executive Board comprises mainly the estimated result-driven variable component as part of the MIP (see Note 20 'Stock option plans') for the 2008 business year (payable in spring 2009).
The compensation to the Board of Directors amounts to CHF 0.5 million (2007: CHF 0.5 million) for the Delegate of the Board of Directors and CEO. This comprises annual amounts of CHF 0.15 million (2007: CHF 0.15 million) for payment of employee contributions to the pen- sion fund and social insurances and of CHF 0.32 million (2007: CHF 0.35 million) for private use of the company car, employer contributions to the pension fund and – a new element – employer contributions to AHV / ALV (old-age and unemployment insurance) plus acci- dent and daily benefits insurance. Employer contributions to the pension fund are reported separately. The short-term compensation for non-executive Board members of Forbo Holding Ltd amounts to CHF 0.5 million (2007: CHF 0.4 million). The share-based compensa-tion to the Board of Directors includes the annual portion of the Forbo shares allocated to the Delegate of the Board of Directors and CEO amounting to CHF 2.6 million (2007: CHF 2.6 million) and the 599 Forbo shares allocated to the non-executive Board members in 2008 (2007: 349 shares) at a market value of CHF 0.3 million (2007: CHF 0.2 million).
In December 2008, the employment contract with the Delegate of the Board of Directors and CEO was extended to encompass the period from January 1, 2011 to April 30, 2013. The bulk of the remuneration will again be in shares. The modalities are to a large extent the same as the provisions of the first contract. The 29,775 shares are vested until December 31, 2013.

105
In an off-exchange transaction, Artemis Beteiligungen IV AG, Hergiswil, an investment company controlled by Michael Pieper, acquired 221,600 Rieter registered shares (sec. no. 367 144) from Forbo International SA, Baar on July 25, 2008 at a price of CHF 350 per share. The closing price of Rieter registered shares on July 25, 2008 was CHF 336.25. According to the purchase agreement, the payment of the purchase price of CHF 77.6 million had to be made no later than December 22, 2008, and interest of 3.45 % per annum was to be paid on the purchase price for the period between July 25, 2008 and the date of payment. The purchase price was paid in full and on time on December 21, 2008. The interest from the deferred payment was CHF 1.1 million and is recognized in the income statement. The average-weighted acquisition price for each Rieter registered share was CHF 347.80.
In 2008, the Forbo Group, which holds 33 1/3 % of Enia Carpet Group, bought products worth CHF 3.8 million (2007: CHF 3.7 million) from Enia Carpet Group.
33 Risk assessment and financial risk managementThe tasks of the Board of Directors include identifying risks, determining suitable measures and implementing these measures or having them implemented. The Board of Directors of Forbo Holding Ltd conducted a Group-wide risk assessment in the year under review and also determined the risks to be managed at particular management levels. The Board of Directors is closely involved in assessing strategic risks and through dialogue with the Exec- utive Board ensures that operating risks are given due attention and reported accordingly. This approach gives the Board a complete overview of the key risks and measures. With this overview, the Group is able to prioritize and allocate the necessary resources.
Financial risk managementIn its financial operations, the Forbo Group uses derivative and non-derivative financial in- struments in order to control the risks and opportunities arising from fluctuations in ex- change rates and interest rates. The various risks involved in existing assets and liabilities as well as planned and anticipated transactions are assessed and monitored centrally – with due regard to the Group’s consolidated risk exposure. In adherence to the Group’s financial risk management policy (established on the basis of written guidelines and policies), Cor- porate Treasury continuously monitors both the risk exposure and the effectiveness of the hedging instruments and issues recommendations with regard to partial or complete hedging of existing risks.
The Group’s financial risk management policy does not permit the use of derivative financial instruments for speculation. Derivative financial transactions are concluded only with first- class banking institutions in order to manage the counterparty risk. The creditworthiness of these institutions is assessed on the basis of evaluations by leading rating agencies.
At Forbo, 'derivative instruments' are related to management either of currency risks or of interest rate risks (or a combination of both).
Management of currency risksRisks arising from short-term currency exposure created by purchases and sales of goods and services (transaction risks) are identified, and selective hedging strategies are im - plemented in line with an ongoing assessment of exchange rate movements. The Group only uses foreign exchange forward and option contracts with maturities of up to twelve months.

106
Furthermore, risks associated with the translation of assets and liabilities denominated in foreign currencies (translation risks) are managed by establishing an appropriate financing policy, including net investment hedges.
The following table shows the sensitivity of profit before tax and of equity to changes in the exchange rate of the US dollar and euro against the Swiss franc.
2008 Change in
exchange rate
Impact on profit
before tax
Impact on equity CHF m EUR / CHF 5 % – 0.7 – 4.2
– 5 % 0.7 4.2
USD / CHF 5 % 0.3 7.9
– 5 % – 0.3 – 7.9
EUR / USD 5 % 0.8 -
– 5 % – 0.8 -
GBP / CHF 5 % 0.2 2.2
– 5 % – 0.2 – 2.2
GBP / EUR 5 % – 0.2 1.7
– 5 % 0.2 – 1.7
2007 Change in
exchange rate
Impact on profit
before tax
Impact on equity CHF m EUR / CHF 5 % – 1.0 – 5.7
– 5 % 1.0 5.7
USD / CHF 5 % 0.1 7.8
– 5 % – 0.1 – 7.8
EUR / USD 5 % 0.5 -
– 5 % – 0.5 -

107
Management of interest rate risksInterest-rate risks arise from the fact that the market value of interest-bearing assets and liabilities is subject to fluctuations in interest rates. Since these risks may have a negative effect on net financial profit and equity, the Group uses derivative financial instruments to manage them. The table below shows the sensitivity of profit before tax and of equity to the stated changes in interest rates for liquidity, interest-bearing debt and financial deriva-tives.
An average figure has been used for liquidity since the final amount is not significant for calculating interest rate sensitivity. The average was arrived at by taking the arithmetic mean of the initial and final amounts.
2008 Change in
interest rate
Impact on profit
before tax
Impact on equity CHF m EUR 50 bp 1.1 0.1
– 50 bp – 1.1 – 0.1
USD 50 bp - – 0.6
– 50 bp - 0.6
CHF 50 bp 2.0 0.2
– 50 bp – 2.0 – 0.2
2007 Change in
interest rate
Impact on profit
before tax
Impact on equity CHF m EUR 50 bp 0.7 0.3
– 50 bp – 0.7 – 0.3
USD 50 bp – 0.1 – 0.9
– 50 bp 0.1 0.9
CHF 50 bp 0.2 0.6
– 50 bp – 0.2 – 0.6
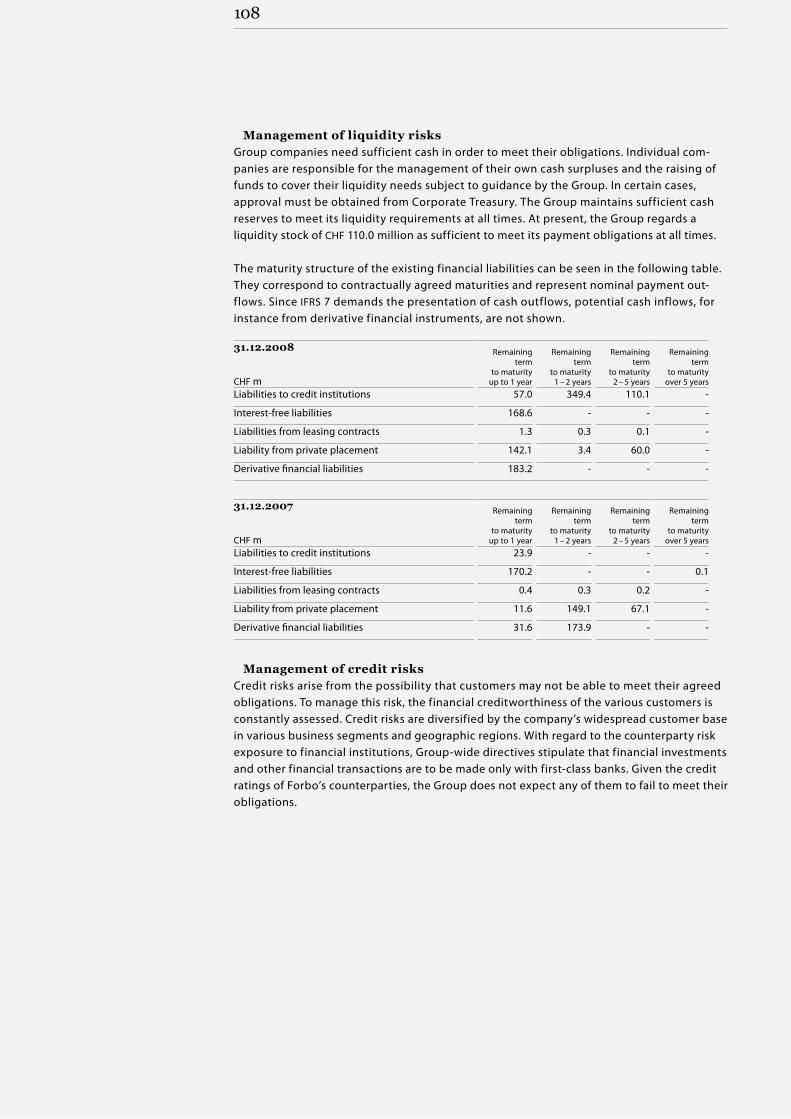
108
Management of liquidity risksGroup companies need sufficient cash in order to meet their obligations. Individual com - panies are responsible for the management of their own cash surpluses and the raising of funds to cover their liquidity needs subject to guidance by the Group. In certain cases, approval must be obtained from Corporate Treasury. The Group maintains sufficient cash reserves to meet its liquidity requirements at all times. At present, the Group regards a liquidity stock of CHF 110.0 million as sufficient to meet its payment obligations at all times.
The maturity structure of the existing financial liabilities can be seen in the following table. They correspond to contractually agreed maturities and represent nominal payment out- flows. Since IFRS 7 demands the presentation of cash outflows, potential cash inflows, for instance from derivative financial instruments, are not shown.
31.12.2008 Remaining term
to maturity up to 1 year
Remaining term
to maturity 1 – 2 years
Remaining term
to maturity 2 – 5 years
Remaining term
to maturity over 5 years CHF m
Liabilities to credit institutions 57.0 349.4 110.1 -
Interest-free liabilities 168.6 - - -
Liabilities from leasing contracts 1.3 0.3 0.1 -
Liability from private placement 142.1 3.4 60.0 -
Derivative financial liabilities 183.2 - - -
31.12.2007 Remaining term
to maturity up to 1 year
Remaining term
to maturity 1 – 2 years
Remaining term
to maturity 2 – 5 years
Remaining term
to maturity over 5 years CHF m
Liabilities to credit institutions 23.9 - - -
Interest-free liabilities 170.2 - - 0.1
Liabilities from leasing contracts 0.4 0.3 0.2 -
Liability from private placement 11.6 149.1 67.1 -
Derivative financial liabilities 31.6 173.9 - -
Management of credit risksCredit risks arise from the possibility that customers may not be able to meet their agreed obligations. To manage this risk, the financial creditworthiness of the various customers is constantly assessed. Credit risks are diversified by the company’s widespread customer base in various business segments and geographic regions. With regard to the counterparty risk exposure to financial institutions, Group-wide directives stipulate that financial investments and other financial transactions are to be made only with first-class banks. Given the credit ratings of Forbo’s counterparties, the Group does not expect any of them to fail to meet their obligations.

109
Capital managementFor the Group, capital management means managing its consolidated equity position. This consists of paid-up share capital, the capital reserve, the treasury shares and profit re- serves. The objectives of capital management are to ensure that the Group remains a going concern, to preserve its financial flexibility for investments and to achieve a risk-adjusted return on equity for investors.
If economic conditions change, capital management may require adjustments to the Group’s equity structure. These adjustments take the form of dividend distributions, capital repay- ments and capital increases as well as share buybacks.
In connection with the US private placement and certain bank facilities, there is a covenant which defines the minimum amount of consolidated equity, i.e. CHF 535.5 million.
34 Events after the balance sheet dateThere are no events after the balance sheet date to report.

110
Equi
ty
inte
rest
Floo
ring
Sy
stem
s
Bond
ing
Syst
ems
Mov
emen
t Sy
stem
s
Hol
ding
/Se
rvic
es
Company office Currency Share capital
Australia
Forbo Floorcoverings Pty. Ltd. Wetherill Park, NSW D AUD 1,400,000 100 % S
Forbo Siegling Pty. Ltd. Wetherill Park, NSW AUD 6,000,000 100 % S
Austria
Forbo-Contel Handelsges.m.b.H. Vienna EUR 73,000 100 % S
Forbo Siegling Austria Ges.m.b.H. Vienna EUR 330,000 100 % S
Bonar Floors GmbH Vienna D EUR 35,000 100 % S
Belgium
Forbo Adhesives België BVBA Dendermonde EUR 61,000 100 % S
Forbo Flooring N.V. Dilbeek EUR 250,000 100 % S
Brazil
Forbo Pisos Ltda. São Paulo BRL 10,000 100 % S
Forbo Siegling Brasil Ltda. São Paulo N BRL 7,008,746 50 % MS
Canada
Forbo Adhesives (Canada), Ltd. St. John CAD 3,500,157 100 % MS
Forbo Flooring, Inc. Toronto CAD 500,000 100 % S
Forbo Siegling, Ltd. Toronto CAD 501,000 100 % S
Chile
Forbo Siegling Chile S.A. Santiago N CLP 335,631,092 50 % MS
Czech Republic
Forbo s.r.o. Prague CZK 500,000 100 % S S
Forbo Siegling Ceska republika s.r.o. Liberec CZK 100,000 100 % S
Bonar Floors s.r.o. Prague CZK 200,000 100 % S
Denmark
Forbo Flooring A / S Glostrup DKK 500,000 100 % S
Forbo Siegling Danmark A / S Brøndby DKK 1,000,000 100 % MS
Finland
Oy Forbo Adhesives Finland Ab Esbo EUR 25,280 100 % MS
Forbo Linoleum OY Helsinki EUR 33,638 100 % H
France
Forbo Participations S.A.S. Reims D EUR 11,524,800 100 % H
Forbo Sarlino S.A.S. Reims EUR 6,400,000 100 % S
Forbo Adhesives France S.A.S. Surbourg EUR 1,440,000 100 % MS
Forbo Siegling France S.A.S. Lomme EUR 819,000 100 % S
Forbo Reims SNC Reims EUR 3,879,810 100 % MS
Bonar Floors SAS Château-Renault EUR 8,000,000 100 % MS
Registered
Group Companies (December 31, 2008)
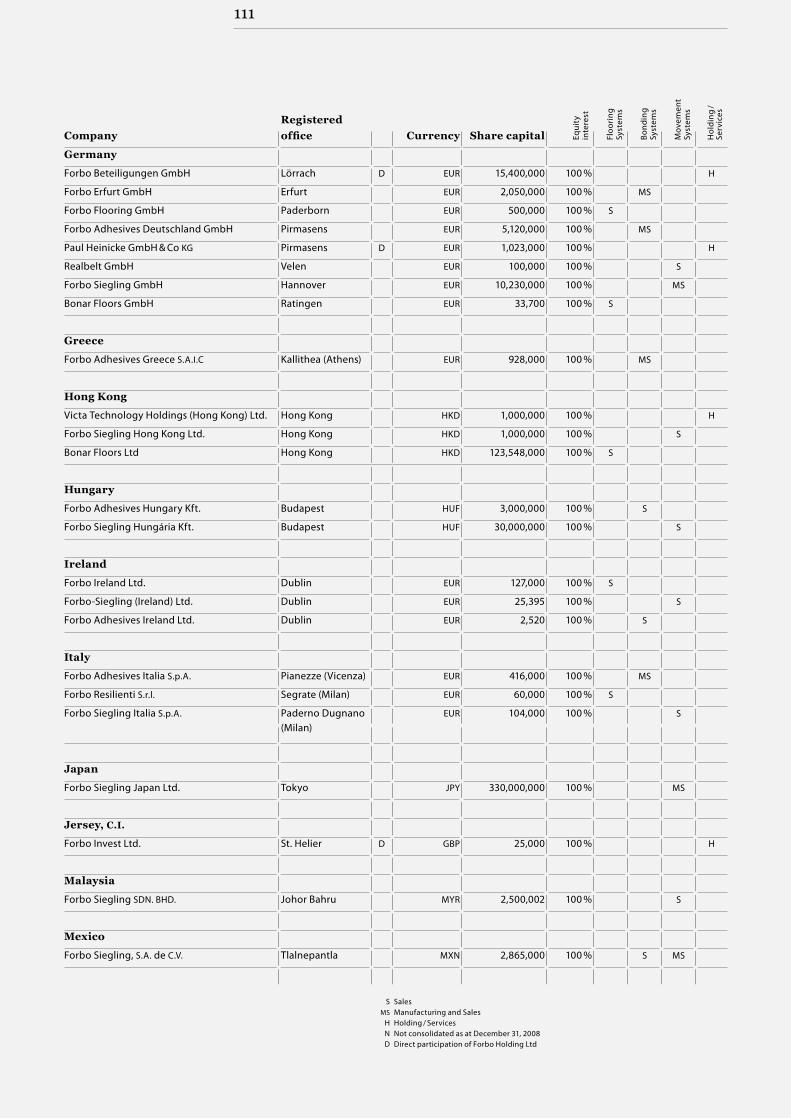
111
Equi
ty
inte
rest
Floo
ring
Sy
stem
s
Bond
ing
Syst
ems
Mov
emen
t Sy
stem
s
Hol
ding
/Se
rvic
es
Company office Currency Share capital
Germany
Forbo Beteiligungen GmbH Lörrach D EUR 15,400,000 100 % H
Forbo Erfurt GmbH Erfurt EUR 2,050,000 100 % MS
Forbo Flooring GmbH Paderborn EUR 500,000 100 % S
Forbo Adhesives Deutschland GmbH Pirmasens EUR 5,120,000 100 % MS
Paul Heinicke GmbH & Co KG Pirmasens D EUR 1,023,000 100 % H
Realbelt GmbH Velen EUR 100,000 100 % S
Forbo Siegling GmbH Hannover EUR 10,230,000 100 % MS
Bonar Floors GmbH Ratingen EUR 33,700 100 % S
Greece
Forbo Adhesives Greece S.A.I.C Kallithea (Athens) EUR 928,000 100 % MS
Hong Kong
Victa Technology Holdings (Hong Kong) Ltd. Hong Kong HKD 1,000,000 100 % H
Forbo Siegling Hong Kong Ltd. Hong Kong HKD 1,000,000 100 % S
Bonar Floors Ltd Hong Kong HKD 123,548,000 100 % S
Hungary
Forbo Adhesives Hungary Kft. Budapest HUF 3,000,000 100 % S
Forbo Siegling Hungária Kft. Budapest HUF 30,000,000 100 % S
Ireland
Forbo Ireland Ltd. Dublin EUR 127,000 100 % S
Forbo-Siegling (Ireland) Ltd. Dublin EUR 25,395 100 % S
Forbo Adhesives Ireland Ltd. Dublin EUR 2,520 100 % S
Italy
Forbo Adhesives Italia S.p.A. Pianezze (Vicenza) EUR 416,000 100 % MS
Forbo Resilienti S.r.l. Segrate (Milan) EUR 60,000 100 % S
Forbo Siegling Italia S.p.A. Paderno Dugnano (Milan)
EUR 104,000 100 % S
Japan
Forbo Siegling Japan Ltd. Tokyo JPY 330,000,000 100 % MS
Jersey, C.I.
Forbo Invest Ltd. St. Helier D GBP 25,000 100 % H
Malaysia
Forbo Siegling SDN. BHD. Johor Bahru MYR 2,500,002 100 % S
Mexico
Forbo Siegling, S.A. de C.V. Tlalnepantla MXN 2,865,000 100 % S MS
Registered
S Sales MS Manufacturing and Sales H Holding / Services N Not consolidated as at December 31, 2008 D Direct participation of Forbo Holding Ltd

112
Equi
ty
inte
rest
Floo
ring
Sy
stem
s
Bond
ing
Syst
ems
Mov
emen
t Sy
stem
s
Hol
ding
/Se
rvic
es
Company office Currency Share capital
Netherlands
Forbo Eurocol B.V. Zaanstad EUR 454,000 100 % MS
Forbo Flooring B.V. Krommenie EUR 11,350,000 100 % MS
Forbo NL Holding B.V. Krommenie EUR 13,500,000 100 % H
Forbo-Novilon B.V. Coevorden EUR 3,630,000 100 % MS
Forbo Adhesives Nederland B.V. Genderen EUR 27,000 100 % MS
Forbo Siegling Nederland B.V. Driebergen EUR 113,000 100 % S
Forbo Stamoid B.V. Krommenie EUR 227,000 100 % S
Bonar Floors N.V. Krommenie EUR 9,700,000 100 % MS
New Zealand
Forbo Siegling Ltd. Auckland NZD 650,000 100 % S
Norway
Forbo Flooring AS Asker D NOK 1,000,000 100 % S
People’s Republic of China
Forbo Siegling (Shenyang) Belting Co., Ltd. Shenyang CNY 146,391,000 100 % MS
Forbo Siegling (Shanghai) Co., Ltd. Shanghai CHF 3,300,000 100 % MS
Forbo Adhesives (Guangzhou) Co., Ltd. Guangzhou USD 8,000,000 100 % MS
Forbo Adhesives (Shanghai) Co., Ltd. Shanghai USD 1,000,000 100 % MS
Poland
Forbo Adhesives Poland Sp. z o.o. Warsaw PLZ 50,000 100 % S
Portugal
Forbo-Revestimentos, S.A. Leça da Palmeira (Porto)
EUR 74,850 100 % S
Siegling (Portugal) Lda. Gemunde (Porto) EUR 500,000 100 % S
Romania
Forbo Helmitin Romania S.R.L. Oradea RON 7,077 100 % S
Forbo Siegling Romania S.R.L. Bucharest RON 38,000 100 % S
Russia
ZAO 'Forbo Siegling' St. Petersburg RUB 400,000 100 % S
OOO 'Forbo Stroitech' Stary Oskol RUB 144,181,000 100 % MS
OOO 'Kaluga' Moscow RUB 158,313,780 100 % MS
OOO 'Flooring' Moscow RUB 500,000 100 % MS
Slovakia
Forbo Siegling, s.r.o. Malacky SKK 200,000 100 % S
Bonar Floors s.r.o. Bratislava SKK 200,000 100 % S
Registered

113
Equi
ty
inte
rest
Floo
ring
Sy
stem
s
Bond
ing
Syst
ems
Mov
emen
t Sy
stem
s
Hol
ding
/Se
rvic
es
Company office Currency Share capital
Spain
Forbo Adhesives Spain, S.L. Mos (Pontevedra) EUR 15,006 100 % MS
Forbo Pavimentos, S.A. Barcelona EUR 60,101 100 % S
Forbo Siegling Iberica, S.A. Montcada i Reixac (Barcelona)
EUR 1,532,550 100 % S
Sweden
Forbo Flooring AB Gothenburg D SEK 8,000,000 100 % S
Forbo Parquet AB Tibro SEK 20,000,000 100 % MS
Forbo Project Vinyl AB Gothenburg D SEK 50,000,000 100 % MS
Forbo Adhesives Sweden AB Gothenburg SEK 100,000 100 % S
Forbo Siegling Svenska AB Kållered (Gothenburg)
SEK 1,000,000 100 % S
Switzerland
Enia Carpet Group AG Ennenda N CHF 3,375,000 33 % H
FJK Carpet D GmbH Ennenda N CHF 20,000 25 % H
Forbo Financial Services AG Baar D CHF 100,000 100 % H
Forbo Finanz AG Baar D CHF 10,000,000 100 % H
Forbo-Giubiasco SA Giubiasco D CHF 10,000,000 100 % MS
Forbo International SA Baar D CHF 100,000 100 % MS MS H
Turkey
Forbo Adhesives Ticaret Limited Sirketi Istanbul TRY 725,000 100 % S
United Kingdom
Forbo-Nairn Ltd. London GBP 8,000,000 100 % MS
Forbo Adhesives UK Ltd. Chatteris GBP 100 100 % MS
Forbo UK Ltd. London D GBP 49,500,000 100 % H
Forbo Siegling (UK) Ltd. London GBP 51,000 100 % S
Bonar Floors Ltd. London GBP 2,236,392 100 % MS
Bonar Tiles Holdings Ltd. London GBP 1,000 100 % H
Bonar Tiles Ltd. London GBP 14,500,002 100 % H
Westbond Ltd. London GBP 400,000 100 % MS
USA
Forbo Adhesives, LLC Wilmington, DE USD 5,000,100 100 % MS
Forbo America, Inc. Wilmington, DE D USD 19,957,259 100 % H
Forbo America Services Inc. Wilmington, DE USD 50,000 100 % H
Forbo Flooring, Inc. Wilmington, DE USD 3,517,000 100 % S
Forbo Siegling, LLC Wilmington, DE USD 15,455,000 100 % MS
S Sales MS Manufacturing and Sales H Holding / Services N Not consolidated as at December 31, 2008 D Direct participation of Forbo Holding Ltd
Registered

114
Report of the Statutory Auditorto the General Meeting of Forbo Holding Ltd Baar
Report of the Statutory Auditor on the consolidated Financial StatementsAs statutory auditor, we have audited the consolidated financial statements of Forbo Holding Ltd, which comprise the consolidated balance sheet, consolidated income statement, consolidated cash f low statement, consolidated statement of recognised income and expense and notes (pages 60 to 113), for the year ended December 31, 2008.
Board of Directors’ ResponsibilityThe Board of Directors is responsible for the preparation and fair presentation of the consolidated financial statements in accordance with the International Financial Reporting Standards (IFRS) and the requirements of Swiss law. This responsibility in- cludes designing, implementing and maintaining an internal control system relevant to the preparation and fair presentation of consolidated financial statements that are free from material misstatement, whether due to fraud or error. The Board of Directors is further responsible for selecting and applying appropriate accounting policies and making accounting estimates that are reasonable in the circumstances.
Auditor’s ResponsibilityOur responsibility is to express an opinion on these consolidated financial statements based on our audit. We conducted our audit in accordance with Swiss law and Swiss Auditing Standards as well as the International Standards on Auditing. Those stan- dards require that we plan and perform the audit to obtain reasonable assurance whether the consolidated financial statements are free from material misstatement.
An audit involves performing procedures to obtain audit evidence about the amounts and disclosures in the consolidated financial statements. The procedures selected depend on the auditor’s judgment, including the assessment of the risks of material misstatement of the consolidated financial statements, whether due to fraud or error. In making those risk assessments, the auditor considers the internal control system relevant to the entity’s preparation and fair presentation of the consolidated financial statements in order to design audit procedures that are appropriate in the circum-stances, but not for the purpose of expressing an opinion on the effectiveness of the entity’s internal control system. An audit also includes evaluating the appropriateness of the accounting policies used and the reasonableness of accounting estimates made, as well as evaluating the overall presentation of the consolidated financial statements. We believe that the audit evidence we have obtained is sufficient and appropriate to provide a basis for our audit opinion.
Report of the Statutory Auditor

115
OpinionIn our opinion, the consolidated financial statements for the year ended December 31, 2008 give a true and fair view of the financial position, the results of operations and the cash f lows in accordance with the International Financial Reporting Standards (IFRS) and comply with Swiss law.
Report on other Legal RequirementsWe confirm that we meet the legal requirements on licensing according to the Auditor Oversight Act (AOA) and independence (Article 728 CO and Article 11 AOA) and that there are no circumstances incompatible with our independence.
In accordance with Article 728a paragraph 1 item 3 CO and Swiss Auditing Standard 890, we confirm that an internal control system exists which has been designed for the preparation of consolidated financial statements according to the instructions of the Board of Directors.
We recommend that the consolidated financial statements submitted to you be ap-proved.
PricewaterhouseCoopers AG
Stefan Räbsamen Gerhard SiegristAudit expert Audit expertAuditor in charge
Zurich, March 11, 2009
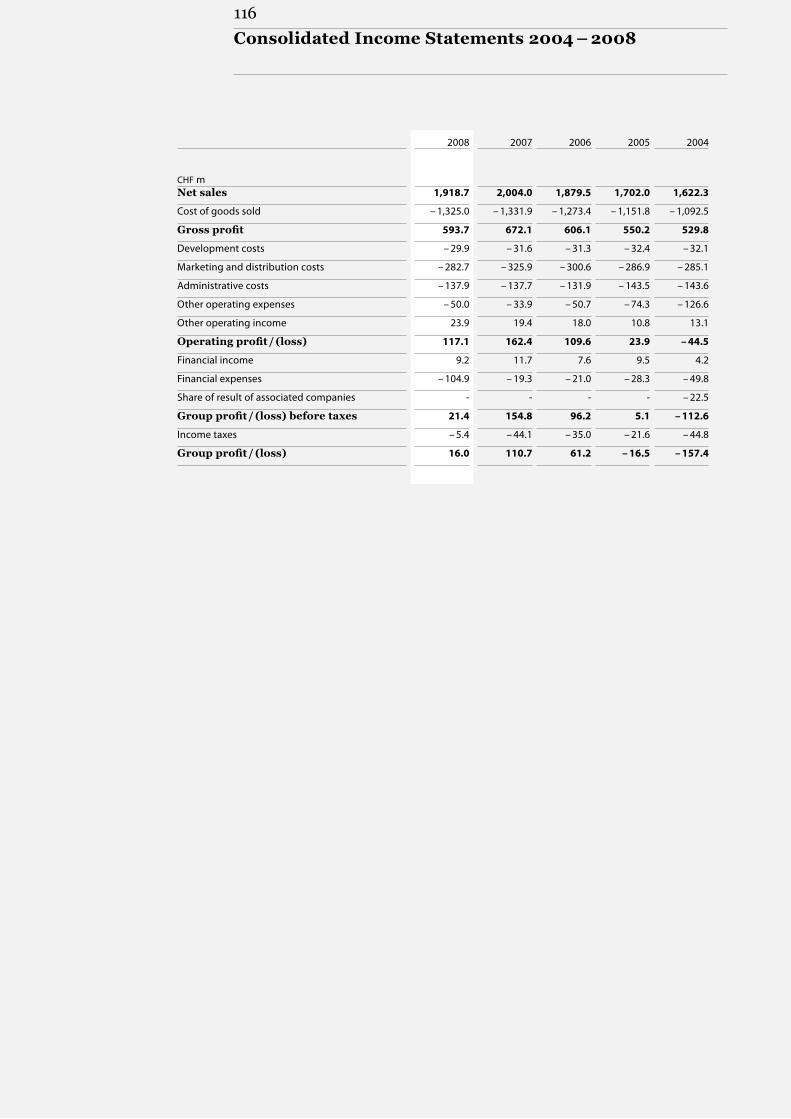
116
2008 2007 2006 2005 2004
CHF m Net sales 1,918.7 2,004.0 1,879.5 1,702.0 1,622.3
Cost of goods sold – 1,325.0 – 1,331.9 – 1,273.4 – 1,151.8 – 1,092.5
Gross profit 593.7 672.1 606.1 550.2 529.8
Development costs – 29.9 – 31.6 – 31.3 – 32.4 – 32.1
Marketing and distribution costs – 282.7 – 325.9 – 300.6 – 286.9 – 285.1
Administrative costs – 137.9 – 137.7 – 131.9 – 143.5 – 143.6
Other operating expenses – 50.0 – 33.9 – 50.7 – 74.3 – 126.6
Other operating income 23.9 19.4 18.0 10.8 13.1
Operating profit / (loss) 117.1 162.4 109.6 23.9 – 44.5
Financial income 9.2 11.7 7.6 9.5 4.2
Financial expenses – 104.9 – 19.3 – 21.0 – 28.3 – 49.8
Share of result of associated companies - - - - – 22.5
Group profit / (loss) before taxes 21.4 154.8 96.2 5.1 – 112.6
Income taxes – 5.4 – 44.1 – 35.0 – 21.6 – 44.8
Group profit / (loss) 16.0 110.7 61.2 – 16.5 – 157.4
Consolidated Income Statements 2004 – 2008
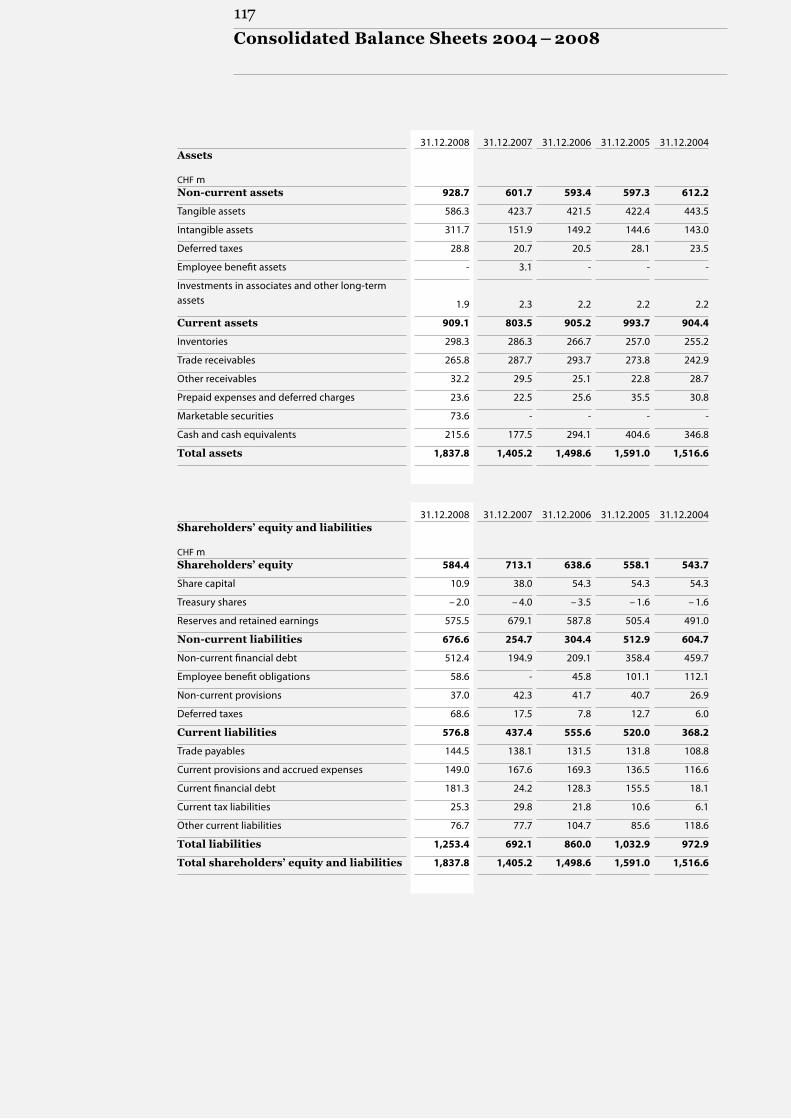
117
Consolidated Balance Sheets 2004 – 2008
31.12.2008 31.12.2007 31.12.2006 31.12.2005 31.12.2004Assets
CHF m Non-current assets 928.7 601.7 593.4 597.3 612.2
Tangible assets 586.3 423.7 421.5 422.4 443.5
Intangible assets 311.7 151.9 149.2 144.6 143.0
Deferred taxes 28.8 20.7 20.5 28.1 23.5
Employee benefit assets - 3.1 - - -
Investments in associates and other long-term assets 1.9 2.3 2.2 2.2 2.2
Current assets 909.1 803.5 905.2 993.7 904.4
Inventories 298.3 286.3 266.7 257.0 255.2
Trade receivables 265.8 287.7 293.7 273.8 242.9
Other receivables 32.2 29.5 25.1 22.8 28.7
Prepaid expenses and deferred charges 23.6 22.5 25.6 35.5 30.8
Marketable securities 73.6 - - - -
Cash and cash equivalents 215.6 177.5 294.1 404.6 346.8
Total assets 1,837.8 1,405.2 1,498.6 1,591.0 1,516.6
31.12.2008 31.12.2007 31.12.2006 31.12.2005 31.12.2004Shareholders’ equity and liabilities
CHF m Shareholders’ equity 584.4 713.1 638.6 558.1 543.7
Share capital 10.9 38.0 54.3 54.3 54.3
Treasury shares – 2.0 – 4.0 – 3.5 – 1.6 – 1.6
Reserves and retained earnings 575.5 679.1 587.8 505.4 491.0
Non-current liabilities 676.6 254.7 304.4 512.9 604.7
Non-current financial debt 512.4 194.9 209.1 358.4 459.7
Employee benefit obligations 58.6 - 45.8 101.1 112.1
Non-current provisions 37.0 42.3 41.7 40.7 26.9
Deferred taxes 68.6 17.5 7.8 12.7 6.0
Current liabilities 576.8 437.4 555.6 520.0 368.2
Trade payables 144.5 138.1 131.5 131.8 108.8
Current provisions and accrued expenses 149.0 167.6 169.3 136.5 116.6
Current financial debt 181.3 24.2 128.3 155.5 18.1
Current tax liabilities 25.3 29.8 21.8 10.6 6.1
Other current liabilities 76.7 77.7 104.7 85.6 118.6
Total liabilities 1,253.4 692.1 860.0 1,032.9 972.9
Total shareholders’ equity and liabilities 1,837.8 1,405.2 1,498.6 1,591.0 1,516.6

118
Content Financial Statements of Forbo Holding Ltd
119 Income Statement
120 Balance Sheet
121 Notes to the Financial Statements
128 Proposal for Appropriation of Available Earnings
129 Report of the Statutory Auditor
Financial Statements of Forbo Holding Ltd
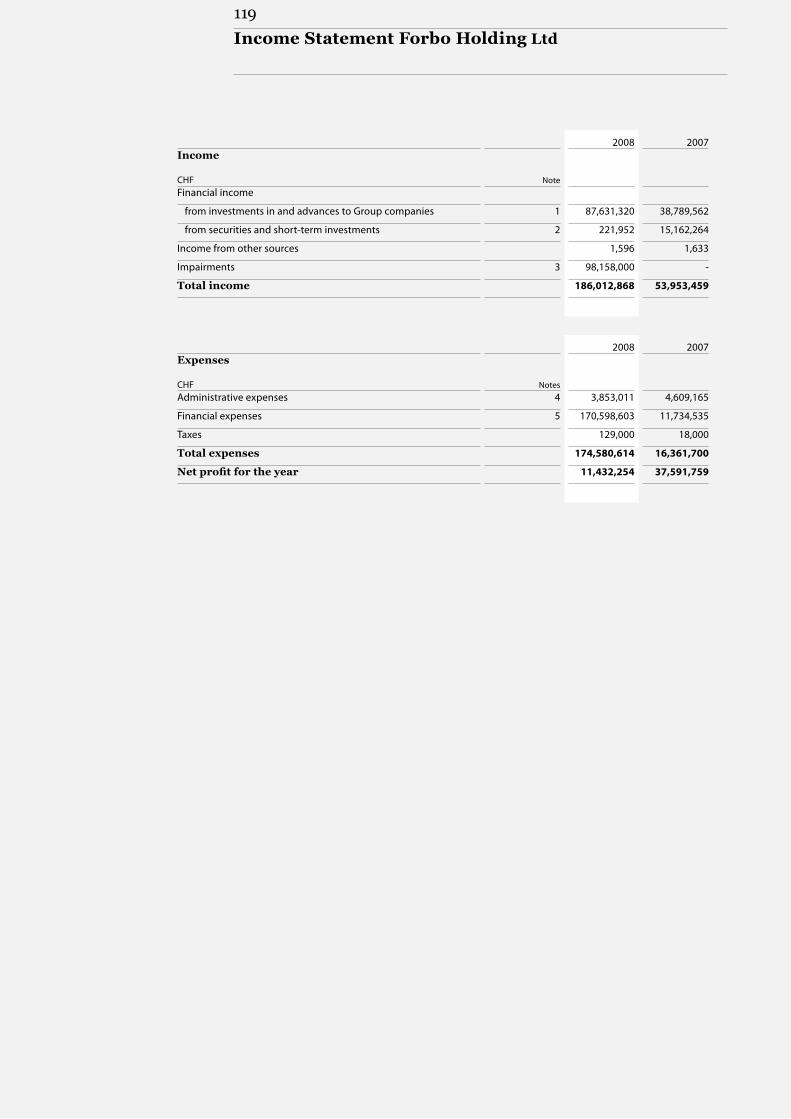
119
2008 2007Income
Note
CHF Financial income
from investments in and advances to Group companies 1 87,631,320 38,789,562
from securities and short-term investments 2 221,952 15,162,264
Income from other sources 1,596 1,633
Impairments 3 98,158,000 -
Total income 186,012,868 53,953,459
2008 2007Expenses
Notes
CHF Administrative expenses 4 3,853,011 4,609,165
Financial expenses 5 170,598,603 11,734,535
Taxes 129,000 18,000
Total expenses 174,580,614 16,361,700
Net profit for the year 11,432,254 37,591,759
Income Statement Forbo Holding Ltd

120
Balance Sheet Forbo Holding Ltd (before Appropriation of Available Earnings)
31.12.2008 31.12.2007Assets
Note
CHF Long-term assets 650,675,474 445,498,476
Investments in Group companies 6 442,361,270 346,804,727
Advances to Group companies 7 208,314,204 98,693,749
Current assets 100,362,171 153,856,306
Other receivables from Group companies 3,214,795 2,436,291
Other receivables from third parties 22,138 15,840
Prepaid expenses and deferred charges 264,433 15,196
Marketable securities 8 82,921,410 146,918,100
Cash and cash equivalents 9 13,939,395 4,470,879
Total assets 751,037,645 599,354,782
31.12.2008 31.12.2007Shareholders’ equity and liabilities
Note
CHF Shareholders’ equity 412,665,657 428,364,923
Share capital 10 10,852,608 37,984,128
Statutory reserve:
General reserves 15,600,000 15,600,000
Reserve for treasury shares 12 211,295,583 112,251,537
Other reserves 13 110,357,635 209,401,681
Available earnings:
Profit carried forward 53,127,577 15,535,818
Net profit for the year 11,432,254 37,591,759
Liabilities 338,371,988 170,989,859
Long-term provisions - 28,000,000
Long-term bank debt 14 181,300,000 -
Advances from Group companies 110,398,141 121,356,383
Short-term bank debt 15 45,000,000 20,000,000
Other liabilities to Group companies 663,234 974,879
Current liabilities to third parties 21,180 20,716
Accrued expenses 989,433 637,881
Total shareholders’ equity and liabilities 751,037,645 599,354,782

121
Notes to the Financial Statements of Forbo Holding Ltd
1 Financial income from investments in and advances to Group companiesIncome from investments in and advances to Group companies amounts to CHF 87.6 million (2007: CHF 38.8 million) and consists of interest, dividend income and the release of provisions.
2 Financial income from securities and short-term investmentsThis item includes income from short-term investments of CHF 0.2 million (2007: CHF 0.1 million). The previous year’s figure included income on securities transactions of CHF 15.1 million.
3 ImpairmentsThe valuation adjustments of CHF 98.2 million relate mainly to investments in connection with value adjustments at subsidiaries.
4 Administrative expensesAdministrative expenses decreased from the previous year by CHF 0.8 million and amount to CHF 3.9 million.
5 Financial expensesThe item relates mainly to losses on treasury shares, interest expenditures for long- and short- term bank debt and interest expense on loans of Group companies.
6 Investments in Group companies As at December 31, 2008 Forbo Holding Ltd held the following direct investments:
Company
Activity
Currency
Share capital
in 1,000
Equity
interest Forbo Floorcoverings Pty. Ltd. AU-Wetherill Park, NSW Sales AUD 1,400 100 %
Forbo Participations S.A.S FR-Reims Holding / Services EUR 11,525 100 %
Forbo Beteiligungen GmbH DE-Lörrach Holding / Services EUR 15,400 100 %
Paul Heinicke GmbH & Co KG DE-Pirmasens Services EUR 1,023 72 %
Forbo Invest Ltd. CI-St. Helier Services GBP 25 50 %
Forbo Flooring AS NO-Asker Sales NOK 1,000 100 %
Forbo Flooring AB SE-Gothenburg Sales SEK 8,000 100 %
Forbo Project Vinyl AB SE-Gothenburg Manufacturing and Sales SEK 50,000 100 %
Forbo Finanz AG CH-Baar Holding / Services CHF 10,000 100 %
Forbo-Giubiasco SA CH-Giubiasco Manufacturing and Sales CHF 10,000 100 %
Forbo International SA CH-Baar Services, Manufacturing and Sales CHF 100 100 %
Forbo UK Ltd. GB-London Holding / Services GBP 49,500 100 %
Forbo America, Inc. US-Wilmington, DE Holding / Services USD 19,957 100 %
Bonar Floors GmbH AT-Wien Sales EUR 35 100 %
Forbo Financial Services AG CH-Baar Services CHF 100 100 %
7 Advances to Group companiesAdvances to Group companies are denominated in Swiss francs and foreign currencies. The net increase compared to the previous year is CHF 109.6 million.
8 Marketable securitiesThe item 'Marketable securities' relates to the treasury shares of Forbo Holding AG. As part of the share buyback program, 213,152 registered shares were acquired. The balance sheet items were valued at market value at year-end.
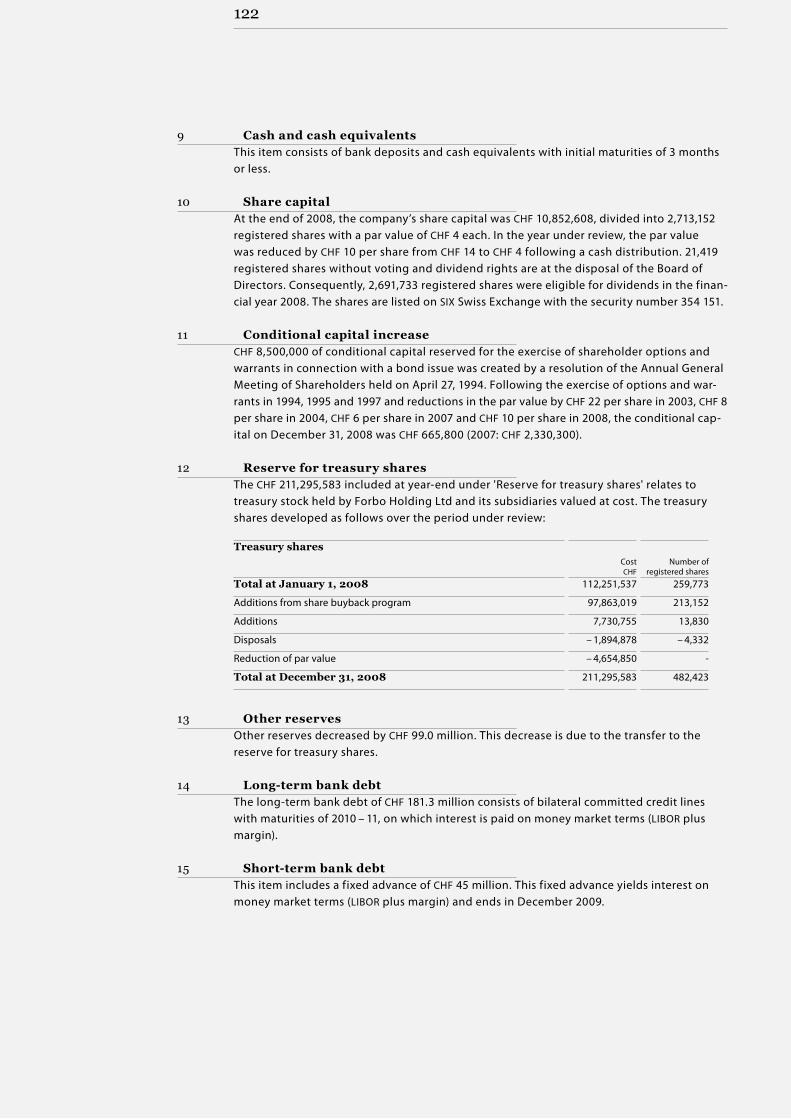
122
9 Cash and cash equivalentsThis item consists of bank deposits and cash equivalents with initial maturities of 3 months or less.
10 Share capitalAt the end of 2008, the company’s share capital was CHF 10,852,608, divided into 2,713,152 registered shares with a par value of CHF 4 each. In the year under review, the par value was reduced by CHF 10 per share from CHF 14 to CHF 4 following a cash distribution. 21,419 registered shares without voting and dividend rights are at the disposal of the Board of Directors. Consequently, 2,691,733 registered shares were eligible for dividends in the finan- cial year 2008. The shares are listed on SIX Swiss Exchange with the security number 354 151.
11 Conditional capital increaseCHF 8,500,000 of conditional capital reserved for the exercise of shareholder options and warrants in connection with a bond issue was created by a resolution of the Annual General Meeting of Shareholders held on April 27, 1994. Following the exercise of options and war- rants in 1994, 1995 and 1997 and reductions in the par value by CHF 22 per share in 2003, CHF 8 per share in 2004, CHF 6 per share in 2007 and CHF 10 per share in 2008, the conditional cap- ital on December 31, 2008 was CHF 665,800 (2007: CHF 2,330,300).
12 Reserve for treasury sharesThe CHF 211,295,583 included at year-end under 'Reserve for treasury shares' relates to treasury stock held by Forbo Holding Ltd and its subsidiaries valued at cost. The treasury shares developed as follows over the period under review: Treasury shares
Cost CHF
Number of
registered shares Total at January 1, 2008 112,251,537 259,773
Additions from share buyback program 97,863,019 213,152
Additions 7,730,755 13,830
Disposals – 1,894,878 – 4,332
Reduction of par value – 4,654,850 -
Total at December 31, 2008 211,295,583 482,423
13 Other reservesOther reserves decreased by CHF 99.0 million. This decrease is due to the transfer to the reserve for treasury shares.
14 Long-term bank debtThe long-term bank debt of CHF 181.3 million consists of bilateral committed credit lines with maturities of 2010 – 11, on which interest is paid on money market terms (LIBOR plus margin).
15 Short-term bank debtThis item includes a fixed advance of CHF 45 million. This fixed advance yields interest on money market terms (LIBOR plus margin) and ends in December 2009.

123
16 Commitments and contingent liabilitiesGuarantees and letters of support to third parties in favor of Group companies amounted to CHF 410.5 million at year-end, of which CHF 374.3 million (previous year: CHF 240.6 million) is utilized. Most of this relates to guarantees to investors in connection with funds raised by a Group company in the form of a US private placement (CHF 184.7 million) and guarantees in connection with utilized swap and bank facilities.
17 Significant shareholdersFrom information available to the Board of Directors, the following shareholders or groups of shareholders were major shareholders in the company pursuant to Article 663c CO as at the balance sheet date:
Number of shares
as percentage Michael Pieper, Hergiswil, and Artemis Beteiligungen I AG, Hergiswil 853,178 31.45 %
Forbo Holding AG, Baar, through its two subsidiaries Forbo International SA, Baar and Forbo Finanz AG, Baar 482,423 17.78 %
This E. Schneider, Wilen b. Wollerau 142,197 5.24 %

124
18 Disclosure of compensation to the Board of Directors and Executive Board pursuant to Article 663b bis and Article 663c CO
Compensation
for 20081): Name and function
Base compensation
Variable compen-
sation
Others
Cash Shares Cash, shares,
options Total
CHF Number CHF CHF CHF CHF
Dr. Albert Gnägi, Chairman 206,999 295 138,001 - 26,889 371,889
Michael Pieper, Vice Chairman 66,027 94 43,973 - 11,932 121,932
Dr. Peter Altorfer, member 71,817 103 48,183 - 12,650 132,650
Dr. Rudolf Huber, member 74,945 107 50,055 - 13,012 138,012
Non-executive Board of Directors2) 419,788 599 280,212 - 64,484 764,484
This E. Schneider, Executive Board member and CEO3)4)
150,000 9,479 2,559,330 - 369,817 3,079,147
Board of Directors 569,788 10,078 2,839,542 - 434,301 3,843,631
Executive Board5) 1,930,000 - - 2,005,500 666,274 4,601,774
Executive Board 1,930,000 - - 2,005,500 666,274 4,601,774
1) The amounts stated in the table are, in principle, based on valuation models used and disclosed in the consolidated financial statements. For the valua-tion of shares and options this means in particular that the grant date is authoritative. The compensation is booked to the appropriate period. The table therefore discloses all compensation that has been granted for the 2008 financial year, even if the date of the payment of the definitive legal ac- quisition is after December 31, 2008.
2) The non-executive members of the Board of Directors receive a fixed remuneration, the amount of which is gradated according to whether the mem-ber is Chairman or a simple member of the Board and whether he is a member of the AFC or HRC. The cash compensation is shown as a gross amount before deduction of social insurance contributions. 40 % of the compensation is paid to the directors in the form of shares of Forbo Holding AG. The shares are valued at fair value on the grant date. The total compensation to the non-executive members of the Board of Directors also includes a lump sum for expenses plus employer contributions to AHV / ALV (old-age and unemployment funds) and child allowance. These are reported in the column 'Other compensation'.
3) The compensation to the Delegate of the Board of Directors and CEO is disclosed separately and subsumed under total compensation to the Board of Directors. It is not possible to clearly allocate the total compensation to the two functions.
4) In fall 2005, it was agreed with the Delegate of the Board of Directors and CEO that part of his compensation for 2005 and for the following five years (2006 up to and including 2010) would be paid to a large extent in stock. In lieu of salary payments, for the contractual period of employment until December 31, 2010, he was allocated 47,395 shares at the market value on conclusion of the agreement, i.e. CHF 270 each, for the entire five-year term of the agreement (2006 – 2010). The shares are valued at fair value on the grant date. These shares are time-vested until December 31, 2010 and freely available only as of January 1, 2011. Should he leave the company before this date, the shares must be returned to the company on a pro rata basis. In addition to the share package, the Delegate of the Board of Directors and CEO draws an annual sum of CHF 150,000, which is used for settlement of employee contributions to the pension fund and for social insurance payments. With the share package and the cash remuneration, all compensa-tions such as bonuses, inflation, options, etc. are settled. The corresponding personnel expenditure is charged to the income statement over the entire contractual period on a pro rata basis (see Note 20 'Stock Option Plans' of the consolidated financial statements). The Delegate of the Board of Direc-tors and CEO does not participate in the Management Investment Plan (MIP) or the share-based compensation program of the non-executive Board members. The entire compensation for the Delegate of the Board of Directors and CEO for the financial year comes to CHF 3,079,147. This total includes private use of the company car, employer contributions to the pension fund and employer contributions to the AHV / ALV (old-age and unemployment insurance), plus accident and daily benefits insurance. These are show in the column 'Other compensation'.
5) The total compensation paid to the members of the Executive Board (excluding the Delegate of the Board of Directors and CEO) was CHF 4,601,774 in 2008. It comprises a gross base salary and a performance-related bonus, which is set in March of the year following the business year in question and is determined by the achievement of the individual and the Group targets. The performance-related component is paid in accordance with the rules of the Management Investment Plan (MIP) (see Note 20 'Stock Option Plans' in the consolidated financial statements). The total compensation paid to the members of the Executive Board also includes private use of the company car and employer contributions to the pension fund as well as employer contributions to the AHV / ALV (old-age and unemployment insurance) plus accident and daily benefits insurance, which are shown separately in the column 'Other compensation'.

125
for 20071): Name and function
Base compensation
Variable compen-
sation
Others
Cash Shares Cash, shares,
options Total
CHF Number CHF CHF CHF CHF
Dr. Albert Gnägi, Chairman 176,853 172 118,147 - 23,560 318,560
Michael Pieper, Vice Chairman 54,281 52 35,719 - 10,493 100,493
Dr. Peter Altorfer, member 60,160 58 39,840 - 11,212 111,212
Dr. Rudolf Huber, member 68,978 67 46,022 - 12,283 127,283
Non-executive Board of Directors2) 360,272 349 239,728 - 57,548 657,548
This E. Schneider, Executive Board member and CEO3)4)
150,000 9,479 2,559,330 - 380,938 3,090,268
Board of Directors 510,272 9,828 2,799,058 - 438,486 3,747,816
Executive Board5) 1,774,733 - - 1,876,750 510,772 4,162,255
Executive Board 1,774,733 - - 1,876,750 510,772 4,162,255
1) The amounts stated in the table are, in principle, based on valuation models used and disclosed in the consolidated statements. For the valuation of shares and options this means in particular that the grant date is authoritative. The compensation is booked to the appropriate period. The table therefore discloses all compensation that has been granted for the 2007 financial year, even if the date of the payment of the definitive legal acquisi- tion is after December 31, 2007.
2) The non-executive members of the Board of Directors receive a fixed remuneration, the amount of which is gradated according to whether the member is Chairman or a simple member of the Board and whether he is a member of the AFC or HRC. The cash compensation is shown as a gross amount be- fore deduction of social insurance contributions. 40 % of the compensation is paid to the directors in the form of shares of Forbo Holding Ltd. The shares are valued at fair value on the grant date. The total compensation to the non-executive members of the Board of Directors also includes a lump sum for expenses and employer contributions to AHV / ALV (old-age and unemployment funds) and child allowance. These are reported in the column 'Other compensation'.
3) The compensation to the Delegate of the Board of Directors and CEO is disclosed separately and subsumed under total compensation to the Board of Directors. It is not possible to clearly allocate the total compensation to the two functions.
4) In fall 2005, it was agreed with the Delegate of the Board of Directors and CEO that part of his compensation for 2005 and the compensation for the following five years (2006 up to and including 2010) would be paid to a large extent in stock. In lieu of salary payments, for the contractual period of employment until December 31, 2010, he was allocated 47,395 shares at the market value on conclusion of the agreement, i.e. CHF 270 each, for the entire five-year term of the agreement (2006 – 2010). The shares are valued at fair value on the grant date. These shares are time-vested until December 31, 2010 and freely available only as of January 1, 2011. Should he leave the company before this date, the shares must be returned to the company on a pro rata basis. In addition to the share package, the Delegate of the Board of Directors and CEO draws an annual sum of CHF 150,000, which is used for settlement of employee contributions to the pension fund and for social insurance payments. With the share package and the cash remunera-tion, all compensations such as bonuses, inflation, adjustments, options, etc. are settled. The corresponding personnel expenditure is charged to the income statement over the entire contractual period on a pro rata basis. The Delegate of the Board of Directors and CEO does not participate in the Management Investment Plan (MIP) or the share-based compensation program of the non-executive Board members. The entire compensation for the Delegate of the Board of Directors and CEO for the financial year comes to CHF 3,090,268. This total includes private use of the company car, employer contributions to the pension fund and – a new element – employer contributions to the AHV / ALV (old-age and unemployment insurance), plus accident and daily benefits insurance.
5) The total compensation paid to the members of the Executive Board (excluding the Delegate of the Board of Directors and CEO) was CHF 4,162,255 in the 2007 business year. It comprises a gross base salary and a performance-related bonus, which is set in March of the year following the business year in question and is determined by the achievement of the individual and the Group targets. The performance-related component is paid in accordance with the rules of the Management Investment Plan (MIP). The total compensation paid to the members of the Executive Board also includes private use of the company car and employer contributions to the pension fund as well as – a new element – employer contributions to the AHV / ALV (old-age and unemployment insurance) plus accident and daily benefits insurance, which are shown separately in the column 'Other compensation'.

126
Advances and loansAs at December 31, 2008, no advances or loans to members of the Board of Directors or members of the Executive Board were outstanding.
Investments in Group companies
In business year 2008As per December 31, 2008, the individual members of the Board of Directors and the Executive Board (including related parties) held the following number of shares in Forbo Holding Ltd:
Name and function
Shares
Options1)5)
Series 2008 Series 2007 Series 2006 Series 2005 Tradable
options
1:12) 1:12) 1:12) 1:12) Dr. Albert Gnägi, Chairman 18,416 - - - - -
Michael Pieper, Vice Chairman 853,178 - - - - -
Dr. Peter Altorfer, member 367 - - - - -
Dr. Rudolf Huber, member 2,062 - - - - -
Non-executive Board of Directors 874,023 - - - - -
This E. Schneider, Executive Board member and CEO3)
142,197 - - - 2,100
Board of Directors 1,016,220 - - - 2,100 -
This E. Schneider, Executive Board member and CEO4)
- - - - - -
Matthias P. Huenerwadel, Executive VP Movement Systems 909 1,157 1,204 1,385 - -
Tom Kaiser, Executive VP Flooring Systems 1,167 1,073 1,258 2,380 - -
Daniel Keist, Head Corporate Center 436 783 - - - -
Jörg Riboni, Chief Financial Officer 4,388 1,948 2,091 1,685 - -
Michel Riva, Executive VP Bonding Systems 498 485 697 844 1,050 -
Executive Board 7,398 5,446 5,250 6,294 1,050 -
1) The details of the options are described in Note 20 'Stock Option Plans' in the consolidated financial statements.2) Subscription ratio.3) The number of shares reported includes the vested 47,395 shares (see Note 4) in the previous table.4) The compensation to the Delegate of the Board of Directors and CEO is disclosed separately and shown in the line Board of Directors.5) Since participation in the MIP is not limited to members of the Executive Board, the number of outstanding options shown here as per December 31,
2008 differs from note 20 'Stock Option Plans' in the consolidated financial statements.
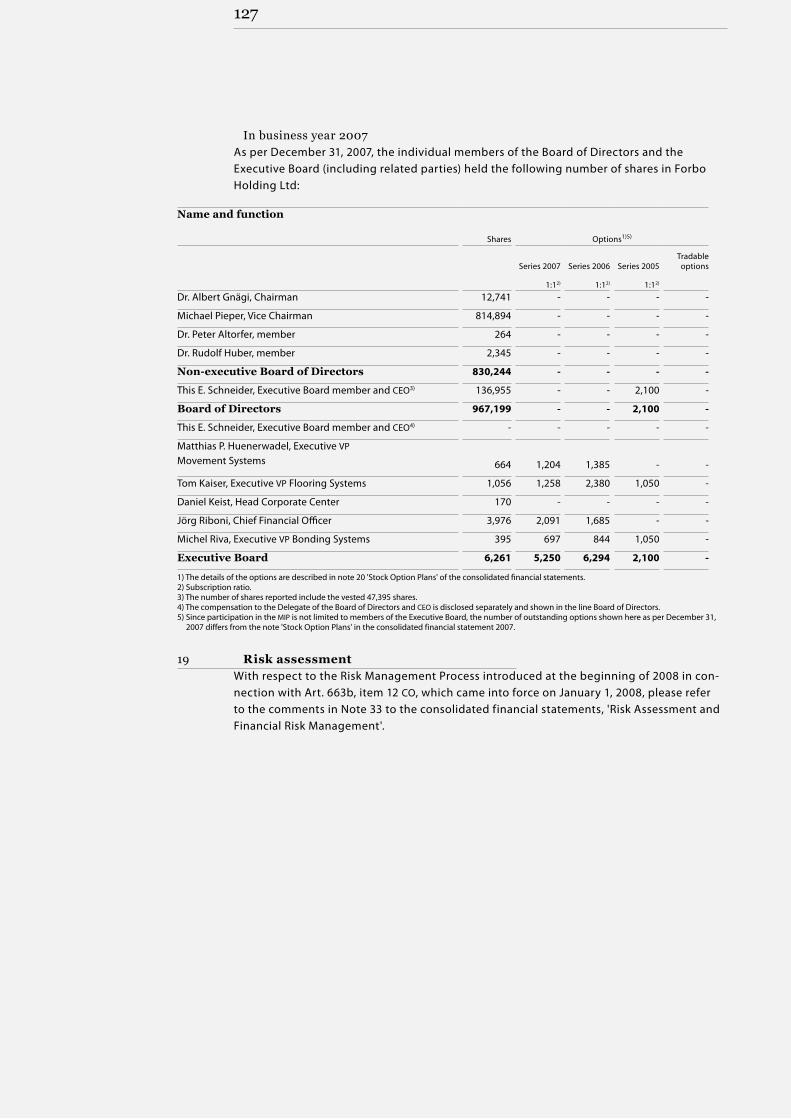
127
In business year 2007As per December 31, 2007, the individual members of the Board of Directors and the Executive Board (including related parties) held the following number of shares in Forbo Holding Ltd:
Name and function
Shares
Options1)5)
Series 2007 Series 2006 Series 2005 Tradable
options
1:12) 1:12) 1:12) Dr. Albert Gnägi, Chairman 12,741 - - - -
Michael Pieper, Vice Chairman 814,894 - - - -
Dr. Peter Altorfer, member 264 - - - -
Dr. Rudolf Huber, member 2,345 - - - -
Non-executive Board of Directors 830,244 - - - -
This E. Schneider, Executive Board member and CEO3) 136,955 - - 2,100 -
Board of Directors 967,199 - - 2,100 -
This E. Schneider, Executive Board member and CEO4) - - - - -
Matthias P. Huenerwadel, Executive VP Movement Systems 664 1,204 1,385 - -
Tom Kaiser, Executive VP Flooring Systems 1,056 1,258 2,380 1,050 -
Daniel Keist, Head Corporate Center 170 - - - -
Jörg Riboni, Chief Financial Officer 3,976 2,091 1,685 - -
Michel Riva, Executive VP Bonding Systems 395 697 844 1,050 -
Executive Board 6,261 5,250 6,294 2,100 -
1) The details of the options are described in note 20 'Stock Option Plans' of the consolidated financial statements.2) Subscription ratio.3) The number of shares reported include the vested 47,395 shares.4) The compensation to the Delegate of the Board of Directors and CEO is disclosed separately and shown in the line Board of Directors.5) Since participation in the MIP is not limited to members of the Executive Board, the number of outstanding options shown here as per December 31,
2007 differs from the note 'Stock Option Plans' in the consolidated financial statement 2007.
19 Risk assessmentWith respect to the Risk Management Process introduced at the beginning of 2008 in con- nection with Art. 663b, item 12 CO, which came into force on January 1, 2008, please refer to the comments in Note 33 to the consolidated financial statements, 'Risk Assessment and Financial Risk Management'.

128128
The Board of Directors proposes to the Annual General Meeting that the available earnings, consisting of:
2008 2007
CHF Net profit for the year 11,432,254 37,591,759
Profit carried forward from the previous year 53,127,577 15,535,818
Total available earnings 64,559,831 53,127,577
be appropriated as follows: 2008 2007
CHF
Proposal by the Board of Directors: Dividend payment 01) -
To be carried forward to the following year 64,559,831 53,127,577
Total available earnings 64,559,831 53,127,577
1) In lieu of a dividend, the Board of Directors will propose to the Annual General Meeting to be held on April 24, 2009 a reduction in par value of CHF 3.90 to CHF 0.10 per registered share.
Proposal for the Appropriation of Available Earnings of Forbo Holding Ltd

129
Report of the Statutory Auditorto the General Meeting ofForbo Holding Ltd Baar
Report of the Statutory Auditor on the Financial StatementsAs statutory auditor, we have audited the financial statements of Forbo Holding Ltd, which comprise the balance sheet, income statement and notes (pages 119 to 128), for the year ended December 31, 2008.
Board of Directors’ ResponsibilityThe Board of Directors is responsible for the preparation of the financial statements in accordance with the requirements of Swiss law and the company’s articles of incorpo-ration. This responsibility includes designing, implementing and maintaining an inter- nal control system relevant to the preparation of financial statements that are free from material misstatement, whether due to fraud or error. The Board of Directors is further responsible for selecting and applying appropriate accounting policies and making accounting estimates that are reasonable in the circumstances.
Auditor’s ResponsibilityOur responsibility is to express an opinion on these financial statements based on our audit. We conducted our audit in accordance with Swiss law and Swiss Auditing Standards. Those standards require that we plan and perform the audit to obtain reasonable assurance whether the financial statements are free from material mis-statement.
An audit involves performing procedures to obtain audit evidence about the amounts and disclosures in the financial statements. The procedures selected depend on the auditor’s judgment, including the assessment of the risks of material misstatement of the financial statements, whether due to fraud or error. In making those risk assess-ments, the auditor considers the internal control system relevant to the entity’s prep- aration of the financial statements in order to design audit procedures that are appro- priate in the circumstances, but not for the purpose of expressing an opinion on the effectiveness of the entity’s internal control system. An audit also includes evaluating the appropriateness of the accounting policies used and the reasonableness of account-ing estimates made, as well as evaluating the overall presentation of the financial statements. We believe that the audit evidence we have obtained is sufficient and appro- priate to provide a basis for our audit opinion.
OpinionIn our opinion, the financial statements for the year ended December 31, 2008 comply with Swiss law and the company’s articles of incorporation.
Report of the Statutory Auditor
130
Report on other Legal RequirementsWe confirm that we meet the legal requirements on licensing according to the Auditor Oversight Act (AOA) and independence (Article 728 CO and Article 11 AOA) and that there are no circumstances incompatible with our independence.
In accordance with Article 728a paragraph 1 item 3 CO and Swiss Auditing Standard 890, we confirm that an internal control system exists which has been designed for the preparation of financial statements according to the instructions of the Board of Directors.
We further confirm that the proposed appropriation of available earnings complies with Swiss law and the company’s articles of incorporation. We recommend that the financial statements submitted to you be approved.
PricewaterhouseCoopers AG
Stefan Räbsamen Reto TogninaAudit expert Audit expertAuditor in charge
Zurich, March 11, 2009

Our Annual Report is published in German language and in an English language translation.
Publisher:Forbo Holding Ltd, Baar
Concept and Design:Gottschalk + Ash Int’l
Photos:Luxwerk, Zurich
Typesetting, Litho and Printing:Neidhart + Schön AG, Zurich
Financial calendar
Ordinary General Meeting: April 24, 2009
Letter to shareholders: August 18, 2009
Media release on the results in the first half of 2009: August 18, 2009

Forbo Annual Report 2008Forbo Holding LtdLindenstrasse 8CH-6340 Baar
Forbo International SALindenstrasse 8CH-6340 Baar
P +41 58 787 25 25F +41 58 787 20 [email protected]
flooring. bonding. movement. flooring. bonding. movement.
flo
ori
ng.
bo
nd
ing.
mo
vem
ent.
Fo
rbo
An
nu
al R
epo
rt 2008