Embed Size (px)
Citation preview

nib holdings limited Head Office 22 Honeysuckle Drive Newcastle NSW 2300 abn 51 125 633 856
t 13 14 63 f 02 4925 1999 e [email protected] w nib.com.au
19 June 2014 The Manager Company Announcements Australian Securities Exchange Limited Level 4, Bridge Street SYDNEY NSW 2000 Subject: 2014 nib investor strategy briefing – 19 June 2014 Attached is nib’s 2014 investor strategy briefing presentation. The 2014 strategy briefing is being held in Sydney for investors and analysts. Within the presentation, nib has stated that latest forecast indicates that FY14 consolidated operating profit will be at the lower end of the previously published range of $73 million to $80 million. The presentation also includes an update to nib’s available capital position and internal capital targets. At 30 June 2014, the nib Group is forecast to have $50 million to $60 million in available capital above internal targets, with approximately $40 million forecast to be available for distribution to shareholders either through a special dividend or a share buy back, with the balance being available for business investment opportunities (noting capacity to also use debt). nib will announce its FY14 full year results on Monday 25 August 2014. Yours sincerely Michelle McPherson Company Secretary/Chief Financial Officer For further information contact Matthew Neat Corporate Affairs and Investor Relations Manager Tel: 02 4914 1777 Mob: 0411 700 006 Email: [email protected]
For
per
sona
l use
onl
y

For
per
sona
l use
onl
y
For
per
sona
l use
onl
y

MAIN HEADING GOES HERE IN UPPERCASE PLEASE
Put a footer here if you need to.
TODAY’S AGENDA
3
Time Topic Presenter Duration
9.00am Welcome & strategic update Mark Fitzgibbon CEO & Managing Director
30 mins(10 mins Q&A)
9.30am Capital Michelle McPhersonCFO and Deputy CEO
30 mins(10 mins Q&A)
10.00am Morning tea 15 mins
10.15am Australian Residents Health Insurance (arhi)
Rhod McKenseyGroup Manager – arhi
1 hour (15 mins Q&A)
11.15am Benefits & Provider Relations Justin Vaughan Group Manager – Benefits & Provider Relations
1 hour (15 mins Q&A)
12.15pm Lunch 30 mins
12.30pm nib New Zealand Rob Hennin CEO nib New Zealand
1 hour (15 mins Q&A)
1.30pm International & New Business Mark Fitzgibbon and Justin Vaughan 45 mins (10 mins Q&A)
2.15pm Innovation & IT Brendan Mills Chief Information Officer
30 mins(5 mins Q&A)
2.45pm Close Mark Fitzgibbon 5 minsFor
per
sona
l use
onl
y

MAIN HEADING GOES HERE IN UPPERCASE PLEASE
Put a footer here if you need to.
“THE JAWS OF DEATH”
4
Cumulative annual growth rates (from actual dollar expenditure)
Source: ABS, OECD stats, AIHW
0%
2000%
4000%
6000%
8000%
10000%
12000%
14000%
16000%
18000%
20000%
1964 1969 1974 1979 1984 1989 1994 1999 2004 2009Year ended 30 June
GDP growth Health expenditure growth Non Government health expenditure growth
For
per
sona
l use
onl
y

MAIN HEADING GOES HERE IN UPPERCASE PLEASE
Put a footer here if you need to.
INVESTMENT THESIS
5
1. We’re spending more and more on our healthcare
2. Spending growth is probably sustainable but not Government’s current relative share
3. The private sector and private funding will increasingly play an enhanced role
0%
1%
2%
3%
4%
5%
6%
7%
8%
% o
f GD
P
2009-10 2049-50
Graph above relates to Australian Government spending * Source: The 2010 Intergenerational Report (Treasury)
Australian Treasury projections
For
per
sona
l use
onl
y
MAIN HEADING GOES HERE IN UPPERCASE PLEASE
Put a footer here if you need to.
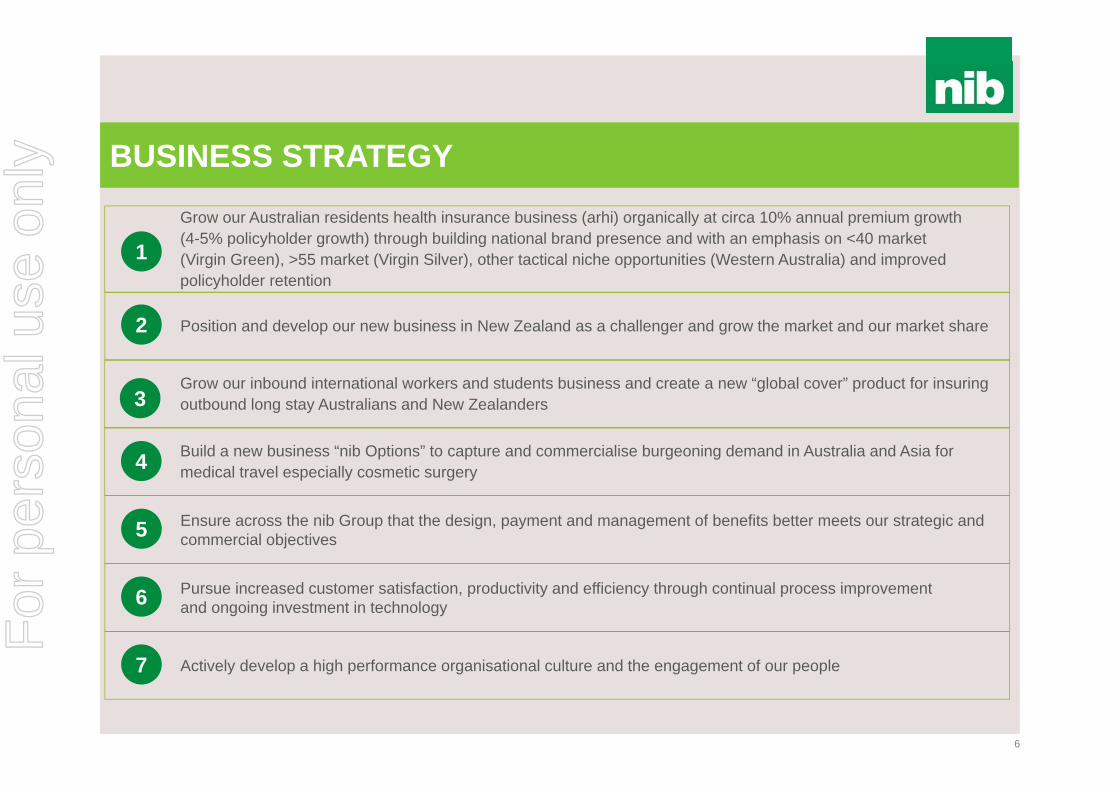
BUSINESS STRATEGY
6
1
2
3
4
5
6
7
Grow our inbound international workers and students business and create a new “global cover” product for insuring outbound long stay Australians and New Zealanders
Ensure across the nib Group that the design, payment and management of benefits better meets our strategic and commercial objectives
Grow our Australian residents health insurance business (arhi) organically at circa 10% annual premium growth (4-5% policyholder growth) through building national brand presence and with an emphasis on <40 market (Virgin Green), >55 market (Virgin Silver), other tactical niche opportunities (Western Australia) and improved policyholder retention
Build a new business “nib Options” to capture and commercialise burgeoning demand in Australia and Asia for medical travel especially cosmetic surgery
Position and develop our new business in New Zealand as a challenger and grow the market and our market share
Pursue increased customer satisfaction, productivity and efficiency through continual process improvement and ongoing investment in technology
Actively develop a high performance organisational culture and the engagement of our people
For
per
sona
l use
onl
y

MAIN HEADING GOES HERE IN UPPERCASE PLEASE
Put a footer here if you need to.
SO FAR SO GOOD
7
0%
10%
20%
30%
40%
50%
60%
Jun-07 Dec-08 Jun-10 Dec-11 Jun-13
Industry nibnib versus industry cumulative net policyholder growth
Consolidated operating profit – split of earnings
Total shareholder returnEarnings per share
arhi policyholder growth
* Includes demutualisation and listing costs
$33.1m$40.2m
$47.1m
$59.8m $64.6m $59.0m
$(2.8)m$(6.7)m $(4.5)m
$5.4m $10.2m
FY08A* FY09A FY10A FY11A FY12A FY13A FY14F
arhi underwriting result Non-arhi Contribution to operating profit FY14 guidance range ($73.0m-$80.0m)Latest forecast at lower end of range
$73.0m -$80.0m
Source: nib/Private Health Insurance Administration Councilarhi: Australian Residents Health Insurance arhi: Australian Residents Health Insurance
0
100
200
300
400
500
Nov-07 Aug-08 Jun-09 Apr-10 Feb-11 Dec-11 Oct-12 Aug-13 Jun-14
nib S&P/ASX 200 Accumulation Index
TSR rebased to 100 (assumes capital returns and dividends re-invested at the payout date)
473%
10%
15%8%
For
per
sona
l use
onl
y

MAIN HEADING GOES HERE IN UPPERCASE PLEASE
Put a footer here if you need to.
FY14 GUIDANCE
8
• Latest forecast indicates that we will be at the lower end of the previously published range for consolidated operating profit of $73 million to $80 million
For
per
sona
l use
onl
y

For
per
sona
l use
onl
y
For
per
sona
l use
onl
y

MAIN HEADING GOES HERE IN UPPERCASE PLEASE
Put a footer here if you need to.
• As reported in 1H14 results the introduction of the new PHIAC capital standards has resulted in a new internal capital target for nib health funds limited and has seen an increase in nib holdings limited group (the Group) available capital
• A full review of all internal capital targets for the Group has been completed and the updated capital targets are set out on subsequent slides
• At 30 June 2014 the Group is forecast to have $50m - $60m in available capital above internal targets, with approximately $40m forecast to be available for distribution to shareholders either through a special dividend or a share buy back, with the balance being available for business investment opportunities (noting capacity to also use debt)
• Available capital determined taking into consideration the following elements:
nib AVAILABLE CAPITAL
11
$ million Forecast at 30 June 2014nib Group net assetsLess: nib health fund capital requiredLess: nib nz limited capital requiredLess: nib nz holdings limited group intangiblesLess: International workers intangiblesLess: nib options intangiblesAdd: External borrowingsAdd/Less: Other assets and liabilitiesLess: Allowance for forecast final dividendAvailable capital before debt covenantLess: Reduction in available capital due to debt covenantNet available capital $50m - $60m
For
per
sona
l use
onl
y

MAIN HEADING GOES HERE IN UPPERCASE PLEASE
Put a footer here if you need to.
nib INTERNAL CAPITAL TARGETS
12
The internal capital target at Group level is the greater of:• the sum of the Australian and New Zealand regulated entities’ internal capital targets, plus the liabilities for other
group entities
• the capital required to meet the Group net tangible assets debt covenant, plus a $5 million allowance for forecast variability ($185 million includes the $5 million variability allowance)
Both assessments are made looking forward 12 months, so that forecast capital equals the target in one month and exceeds the target in all other months
The available capital is the difference between the groups actual capital and the capital target, as defined above. It excludes capital able to be raised by increased borrowings.
nib health funds limited (Australian Regulated Entity)• new internal target is 13.5% of total projected premiums for the next 12 months from any given date
• new internal target has been determined under the new PHIAC capital standards and represents the Board’s risk appetite. The current determination by the Board is that nib should:
• Maintain sufficient capital to meet minimum capital requirements under stressed conditions with a low probability of occurrence. Specifically the Board wishes to continue to meet regulatory capital requirements following a:
• 1 in 50 underwriting loss event, and
• a 1 in 150 investment return outcome, and
• a write-off of half of the deferred acquisition cost asset
For the avoidance of doubt, the risk appetite is to continue to meet regulatory capital requirements in the event that each of the above events occur simultaneously.
For
per
sona
l use
onl
y
MAIN HEADING GOES HERE IN UPPERCASE PLEASE
Put a footer here if you need to.
nib INTERNAL CAPITAL TARGETS (CONT)
13
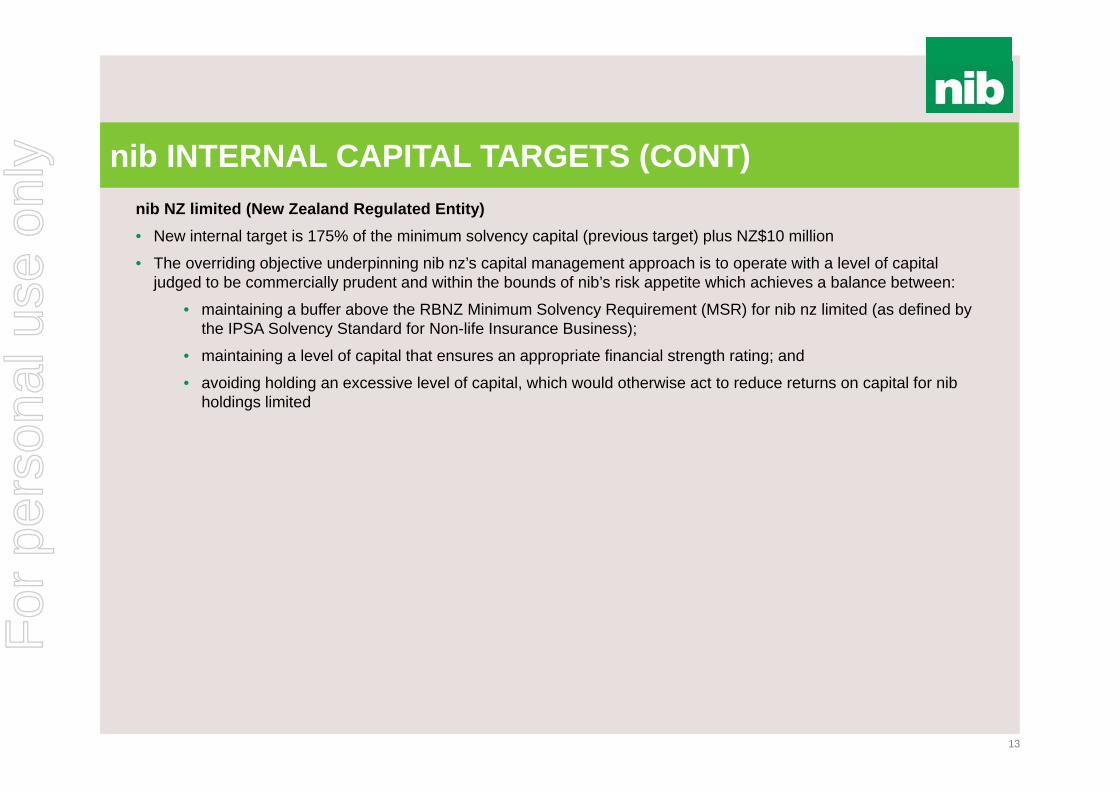
nib NZ limited (New Zealand Regulated Entity)• New internal target is 175% of the minimum solvency capital (previous target) plus NZ$10 million
• The overriding objective underpinning nib nz’s capital management approach is to operate with a level of capital judged to be commercially prudent and within the bounds of nib’s risk appetite which achieves a balance between:
• maintaining a buffer above the RBNZ Minimum Solvency Requirement (MSR) for nib nz limited (as defined by the IPSA Solvency Standard for Non-life Insurance Business);
• maintaining a level of capital that ensures an appropriate financial strength rating; and
• avoiding holding an excessive level of capital, which would otherwise act to reduce returns on capital for nib holdings limited
For
per
sona
l use
onl
y

MAIN HEADING GOES HERE IN UPPERCASE PLEASE
Put a footer here if you need to.
nib GEARING TARGETS
14
Target gearing at the Group level set in order to achieve an optimal WACC is:• nib will raise debt up to a level that achieves a long term average gearing ratio of 30%, with a short to medium term
target of 25% based on business as usual with the remaining 5% available for strategic M&A opportunities, noting that for a significant transaction gearing may be above 30% for a short time if necessary to effect the transaction
• This results in an improved WACC, where the benefits of introducing debt are not outweighed by a higher “leveraged cost of equity”
For
per
sona
l use
onl
y

MAIN HEADING GOES HERE IN UPPERCASE PLEASE
Put a footer here if you need to.
NEW PHIAC CAPITAL STANDARDS
15
• The new capital standards have moved the focus of capital standards away from the previous calculations based standards to more principles based ones, with insurers needing to be more “in touch” with their levels of risk. There has also been a push for insurers to look through their various investment holdings to understand various counterparty exposures
• PHIAC to be absorbed into APRA and ACCC by 1 July 2015. Note change may result in future changes but not expected in short/medium term
• The Solvency Standard has the following two requirements:
1. The value of an insurer’s cash must be equal to or greater than the “cash management amount”, plus any solvency supervisory adjustment amount:
• Cash has the meaning given in Australian Accounting Standards Standard 107.6
• The Cash Management Amount is the sum of the stressed net cash outflow amount plus 1% of the health business revenue estimate
• It is unlikely nib would have a solvency supervisory adjustment amount
2. Insurers must have, and comply with, a board endorsed, liquidity management plan designed to ensure compliance with the solvency requirement described above, and set minimum liquidity requirements and management action triggers
• It must give regard to the extent to which assets could readily be converted to cash, the concentration of exposures to related counterparties, the seasonality and variability in cash flows, and the potential of drawing down on cash to repay borrowings. Each of these is to be considered under “stressed market conditions”, and the board are required to review the liquidity management plan at least every two years
For
per
sona
l use
onl
y

MAIN HEADING GOES HERE IN UPPERCASE PLEASE
Put a footer here if you need to.
PHIAC SOLVENCY STANDARD
16
Solvency
The cash management amount is the sum of the stressed net cash outflow amount* + 1% of the central estimate of the health business revenue estimate for the next 12 months • Cash inflows are largely insurance premiums paid by customers and income from investments, and outflows are claims
payable on behalf of customers and risk equalisation.nib’s net cash flows are generally positive given premium revenue inflows comfortably exceed claim payment outflows • Term deposits are timed to mature to offset quarterly risk equalisation payments when they are due, and a buffer is
held to allow for variation in projected cash flows, thus nib’s stressed net cash outflow amount is $0
* The 98th percentile estimate of the net cash outflows for a 30 day period from the relevant day
The solvency supervisory adjustment amount is an amount determined by PHIAC “on reasonable grounds”• Similar to APRA regulations, PHIAC has the capacity to direct an insurer to hold a higher level of capital in certain
exceptional situations (for example, if the insurer is exposed to contagion risk)• No supervisory adjustments have been advised to nib, and we would not expect one to be notified in future.
Solvency Standard
Liquidity test- Cash is not less than
the sum of amounts below
Cash management
amount
Solvency supervisory adjustment
Liquidity management plan
For
per
sona
l use
onl
y

MAIN HEADING GOES HERE IN UPPERCASE PLEASE
Put a footer here if you need to.
NEW PHIAC CAPITAL ADEQUACY STANDARD
17
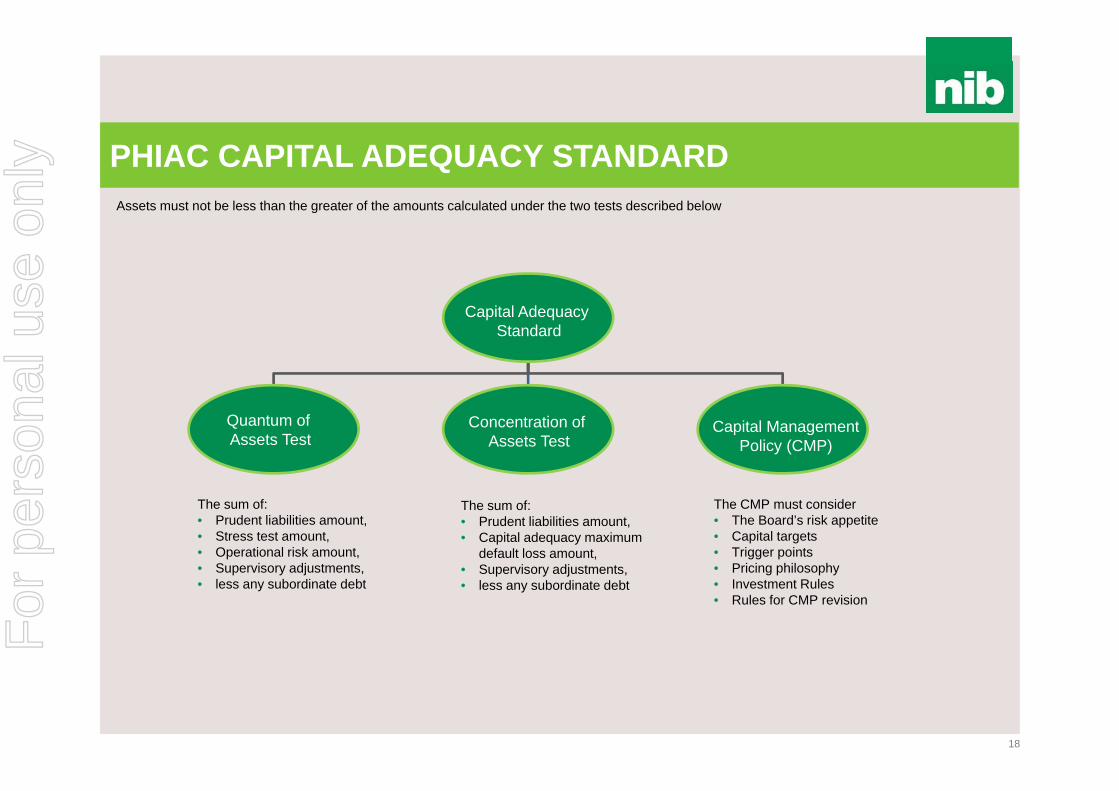
• The Capital Adequacy Standard (“Are the health fund’s assets large enough to ensure that it can survive a very bad year with its balance sheet intact?”) has two tests:
1. Test 1 – quantum of assets test (see example graph below)
2. Test 2 – concentration of assets test (see example graph below)
• In addition to the 2 tests, the Capital Adequacy Standard also requires insurers to have a Board-endorsed Capital Management Policy. This would include:
• probabilistically-determined capital targets and triggers;
• a pricing philosophy, with explicit consideration of capital implications;
• liquidity requirements designed to ensure ongoing compliance with the Solvency Standard;
• and investment rules, which include consideration of capital strength
Source: Private Health Insurance Administration Council (PHIAC)
For
per
sona
l use
onl
y
MAIN HEADING GOES HERE IN UPPERCASE PLEASE
Put a footer here if you need to.
PHIAC CAPITAL ADEQUACY STANDARD
Capital Adequacy Standard
Quantum of Assets Test
Concentration of Assets Test
Capital ManagementPolicy (CMP)
The sum of:• Prudent liabilities amount,• Stress test amount,• Operational risk amount,• Supervisory adjustments,• less any subordinate debt
The sum of:• Prudent liabilities amount,• Capital adequacy maximum
default loss amount,• Supervisory adjustments,• less any subordinate debt
The CMP must consider• The Board’s risk appetite• Capital targets• Trigger points• Pricing philosophy• Investment Rules• Rules for CMP revision
Assets must not be less than the greater of the amounts calculated under the two tests described below
18
For
per
sona
l use
onl
y

MAIN HEADING GOES HERE IN UPPERCASE PLEASE
Put a footer here if you need to.
PHIAC CAPITAL ADEQUACY STANDARD (CONT)
Prudent liabilities amount
• Outstanding claims liability amount (75% Probability of Sufficiency (PoS) plus size margin),• Future claims liability amount (75% PoS plus size margin)• Risk Equalisation Trust Fund accrued liability amount (balance sheet risk equalisation liabilities, with a 10% charge on
unbilled calculated deficit) • Other liabilities amount (98% PoS2)• Currently nib’s prudent liabilities amount is in the order of 2-5% (due to seasonal variations) above balance sheet liabilities
• Like the supervisory adjustment in the Solvency Standard, this could be determined by PHIAC on reasonable grounds. Capital adequacy supervisory adjustment amount
Subordinated debt
1 the maximum assumed price increase is 1.5x the industry average hospital inflation rate for the preceding 12 months2 nib values other liabilities at 98% PoS on the balance sheet 19
• Stressed net margin estimate1, plus• Stressed investment income estimate, plus• Stressed other income estimate, less• Tax attributable (positive or negative)
under the stressed estimates above• If the amount above is greater than $0, then $0,
else the amount calculated above
• 0.5% of the central estimate of the health business revenue estimate for the next 12 months, plus
• $1,000,000 (indexed by 2.5% p.a. from 2014)
• the largest uncompensated loss of the health benefits fund arising from any loss, other than losses arising from assets held with an Australian Government counterparty or deposits held with an ADI, in relation to:
• (a) any asset or any group of related assets; and • (b) any individual counterparty or group of related
counterparties.
TEST 1 - QUANTUM TEST 2- CONCENTRATION
Stress test amount(98% PoS)
Operational risk amount
Capital adequacy default loss amount
Greater of Test 1 or 2
• Not relevant to nib as debt is at Group level
For
per
sona
l use
onl
y

For
per
sona
l use
onl
y

For
per
sona
l use
onl
y

MAIN HEADING GOES HERE IN UPPERCASE PLEASE
Put a footer here if you need to.
STRATEGY…. OUR 5 AREAS OF FOCUS
22
1. Continue to focus our Direct-To-Consumer (DTC) efforts upon the under 40s segment (Virgin Green)
2. Look for additional growth and market share in the over 55s market via retail brokers and affiliations (Virgin Silver)
3. Maintain our brand reputation around price competitiveness and “value for money”
4. Place the customer at the centre of everything we do
5. Reduce claims inflation
For
per
sona
l use
onl
y
MAIN HEADING GOES HERE IN UPPERCASE PLEASE
Put a footer here if you need to.
BRAND STRATEGY
23
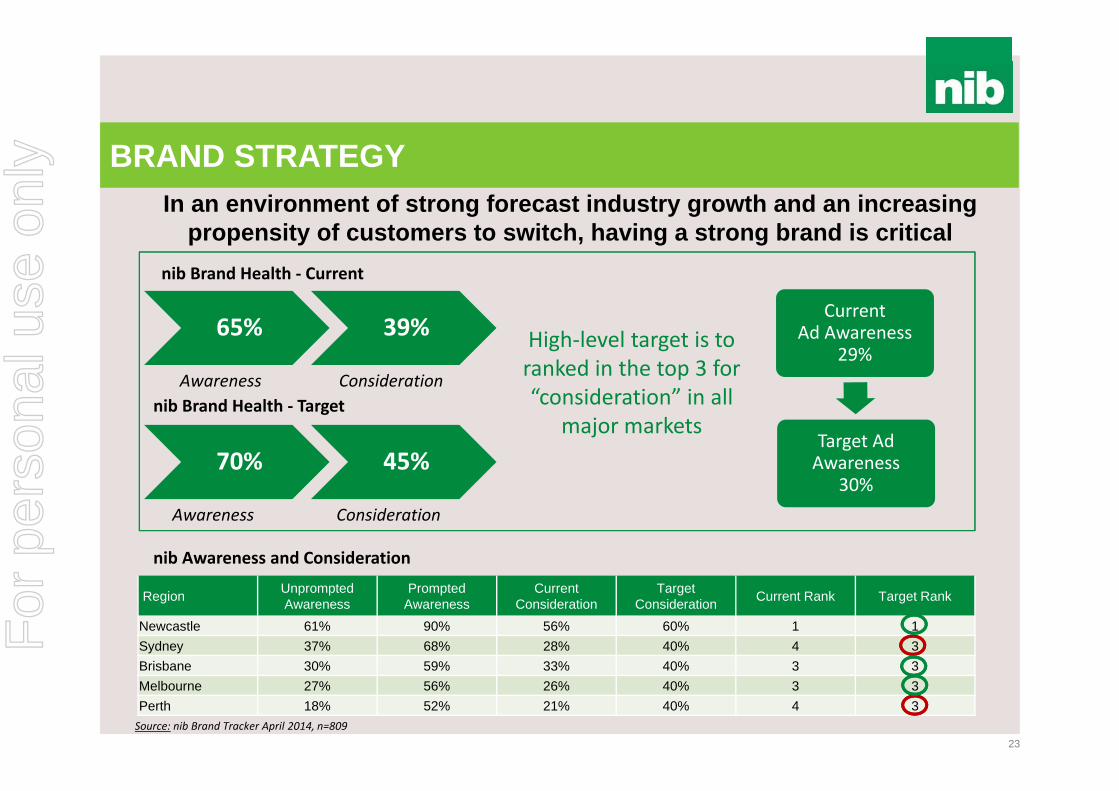
In an environment of strong forecast industry growth and an increasing propensity of customers to switch, having a strong brand is critical
70% 45%
Awareness Consideration
nib Brand Health ‐ Current
nib Awareness and Consideration
Source: nib Brand Tracker April 2014, n=809
Region Unprompted Awareness
Prompted Awareness
Current Consideration
Target Consideration Current Rank Target Rank
Newcastle 61% 90% 56% 60% 1 1Sydney 37% 68% 28% 40% 4 3Brisbane 30% 59% 33% 40% 3 3Melbourne 27% 56% 26% 40% 3 3Perth 18% 52% 21% 40% 4 3
65% 39%
Awareness
nib Brand Health ‐ Target
Consideration
High‐level target is to ranked in the top 3 for “consideration” in all
major markets
Current Ad Awareness
29%
Target Ad Awareness
30%
For
per
sona
l use
onl
y

MAIN HEADING GOES HERE IN UPPERCASE PLEASE
Put a footer here if you need to.
INDUSTRY AND nib GROWTH HAS BEEN STRONG
24
nib has achieved above industry growth for over a decade
Annual policyholder growth – 12 months to 31 March
Australian PHI growth drivers Government “carrots and sticks” Increasing wealth and favourable economic
circumstances Dissatisfaction with public system and rationing Competition and investment in marketing and growth
Last 12 months have been impacted by higher than expected lapse
nib growth in hospital persons covered (LHS) and share of industry growth (RHS) – 12 months to 31 March
0%
2%
4%
6%
8%
10%
12%
14%
16%
Mar-07 Mar-08 Mar-09 Mar-10 Mar-11 Mar-12 Mar-13 Mar-140
10,000
20,000
30,000
40,000
Mar-07 Mar-08 Mar-09 Mar-10 Mar-11 Mar-12 Mar-13 Mar-14
For
per
sona
l use
onl
y

MAIN HEADING GOES HERE IN UPPERCASE PLEASE
Put a footer here if you need to.
DISTRIBUTION STRATEGY
25
nib policyholder sales by demographic (% of all sales) – 12 months to 31 March
nib policyholder sales (monthly) by channel (% of all sales)
• Sales mix is changing based on optimising the cost of acquisition across channels
• Recent reduction in retail brokers (as a % of all sales), as channel now focussed on over 55s
• Introduction of Apia as new channel from 2 June 2014
• Slight reduction in proportion of sales in under 40s due to increased competition in this demographic and nib focus on over 55s segment
• Renewed focus and investment planned for FY15 on under 40s market
0%
20%
40%
60%
80%
100%
Mar-07 Mar-08 Mar-09 Mar-10 Mar-11 Mar-12 Mar-13 Mar-14
Under 40 40-54 55+
0%
20%
40%
60%
80%
100%
Mar-07 Mar-08 Mar-09 Mar-10 Mar-11 Mar-12 Mar-13 Mar-14
CCC Corporate Retail Broker Retail Network Web
For
per
sona
l use
onl
y
MAIN HEADING GOES HERE IN UPPERCASE PLEASE
Put a footer here if you need to.
RETAIL BROKERS AND NEW CHANNELS
26
New Channels - Apia
Retail Brokers
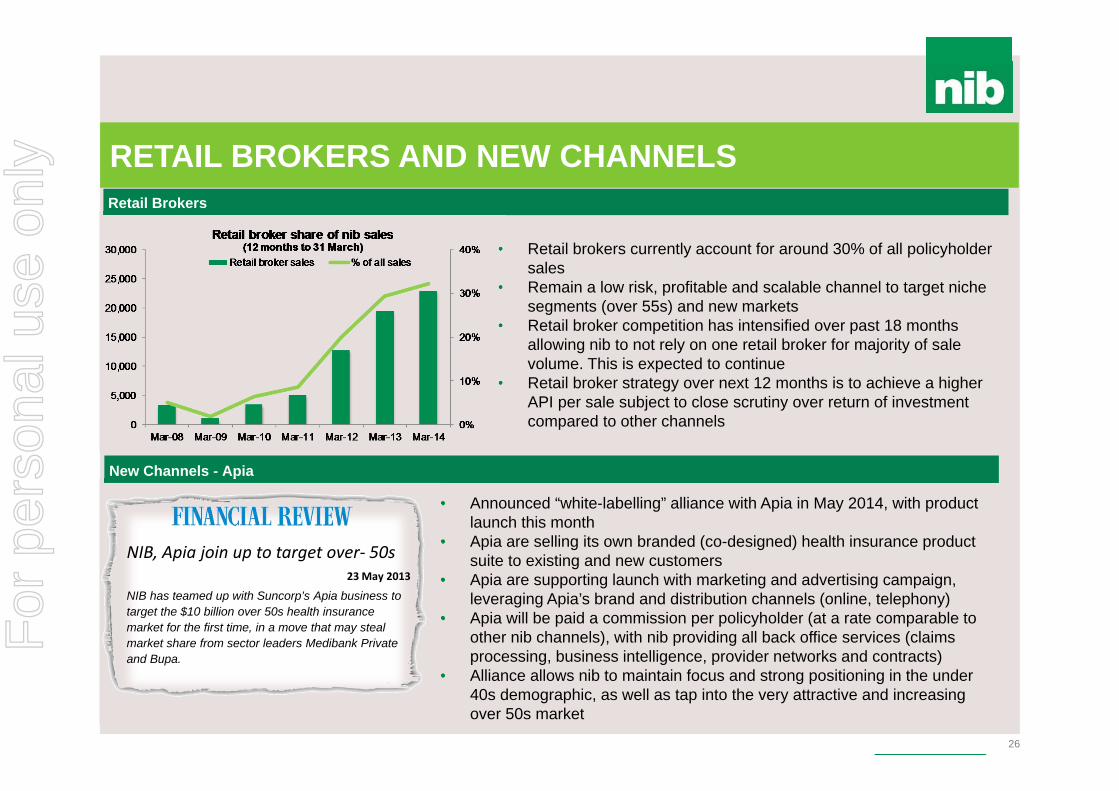
• Retail brokers currently account for around 30% of all policyholder sales
• Remain a low risk, profitable and scalable channel to target niche segments (over 55s) and new markets
• Retail broker competition has intensified over past 18 months allowing nib to not rely on one retail broker for majority of sale volume. This is expected to continue
• Retail broker strategy over next 12 months is to achieve a higher API per sale subject to close scrutiny over return of investment compared to other channels
• Announced “white-labelling” alliance with Apia in May 2014, with product launch this month
• Apia are selling its own branded (co-designed) health insurance product suite to existing and new customers
• Apia are supporting launch with marketing and advertising campaign, leveraging Apia’s brand and distribution channels (online, telephony)
• Apia will be paid a commission per policyholder (at a rate comparable to other nib channels), with nib providing all back office services (claims processing, business intelligence, provider networks and contracts)
• Alliance allows nib to maintain focus and strong positioning in the under 40s demographic, as well as tap into the very attractive and increasing over 50s market
NIB, Apia join up to target over‐ 50s23 May 2013
NIB has teamed up with Suncorp’s Apia business to target the $10 billion over 50s health insurance market for the first time, in a move that may steal market share from sector leaders Medibank Private and Bupa.
For
per
sona
l use
onl
y
MAIN HEADING GOES HERE IN UPPERCASE PLEASE
Put a footer here if you need to.
AVERAGE PREMIUM INCOME (API) CONTINUES TO GROW
27
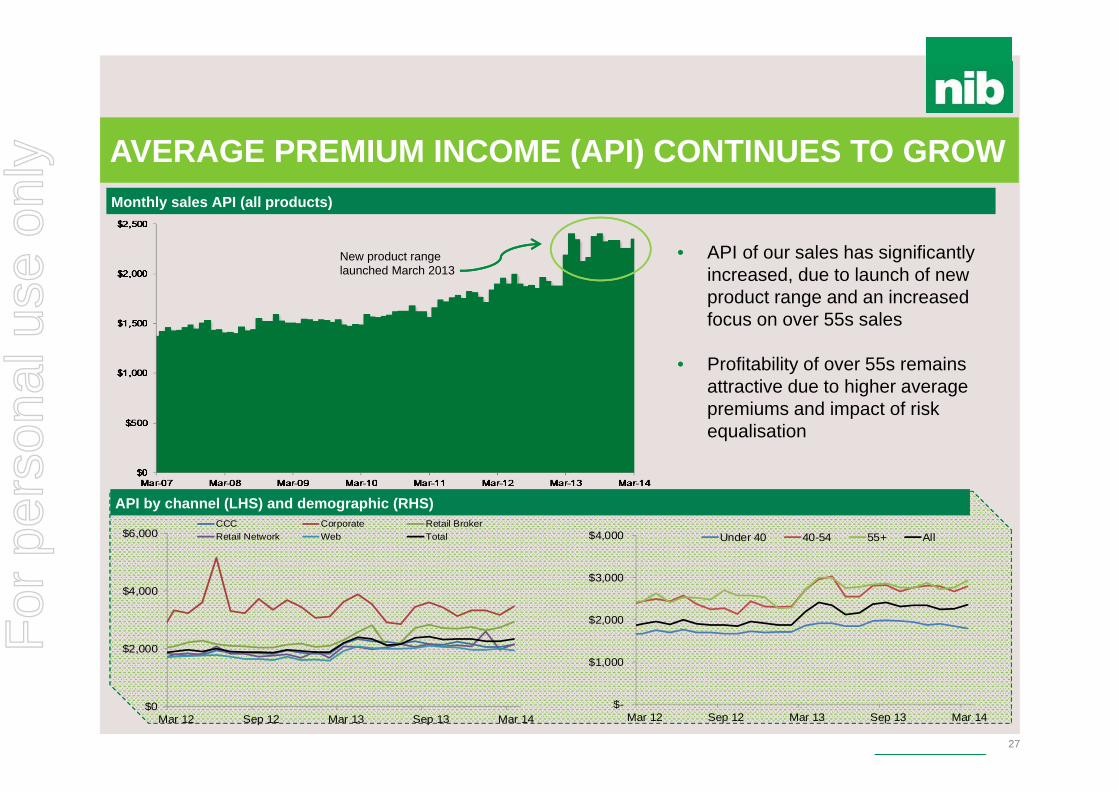
API by channel (LHS) and demographic (RHS)
New product range launched March 2013
Monthly sales API (all products)
• API of our sales has significantly increased, due to launch of new product range and an increased focus on over 55s sales
• Profitability of over 55s remains attractive due to higher average premiums and impact of risk equalisation
$-
$1,000
$2,000
$3,000
$4,000
Mar 12 Sep 12 Mar 13 Sep 13 Mar 14
Under 40 40-54 55+ All
$0
$2,000
$4,000
$6,000
Mar 12 Sep 12 Mar 13 Sep 13 Mar 14
CCC Corporate Retail BrokerRetail Network Web Total
For
per
sona
l use
onl
y

MAIN HEADING GOES HERE IN UPPERCASE PLEASE
Put a footer here if you need to.
NEW POLICYHOLDER COST OF ACQUSITION
28
• Competition from other health funds and retail brokers has seen cost of acquisition increase
• Increasing cost per acquisition is a function of distribution strategy – selling high value and over 55s products through retail brokers
• Increasing cost per acquisition has been offset by higher average API, so keeping effective commission relatively stable
• Acquisition costs remain well below breakeven levels
Effective commission* by state
• A judicious marketing investment has resulted in our effective commission remaining relatively stable
• Most notable is the change in WA, primarily due to a reduction in marketing investment with our brand becoming more established
Effective commission* and cost per acquisition per policyholder- 12 months rolling
* Effective Commission: cost to acquire customer as a percentage of first year’s premium
0 .0 %
1 0. 0 %
2 0. 0 %
3 0. 0 %
4 0. 0 %
5 0. 0 %
6 0. 0 %
7 0. 0 %
8 0. 0 %
Mar-10 Mar-11 Mar-12 Mar-13 Mar-14
NSW VIC QLD WA SA Total
0 %
5 %
1 0%
1 5%
2 0%
2 5%
3 0%
3 5%
$ 0
$ 10 0
$ 20 0
$ 30 0
$ 40 0
$ 50 0
$ 60 0
Mar-10 Mar-11 Mar-12 Mar-13 Mar-14
Effective Commission Cost Per Acquistion
For
per
sona
l use
onl
y
MAIN HEADING GOES HERE IN UPPERCASE PLEASE
Put a footer here if you need to.
RETENTION
29
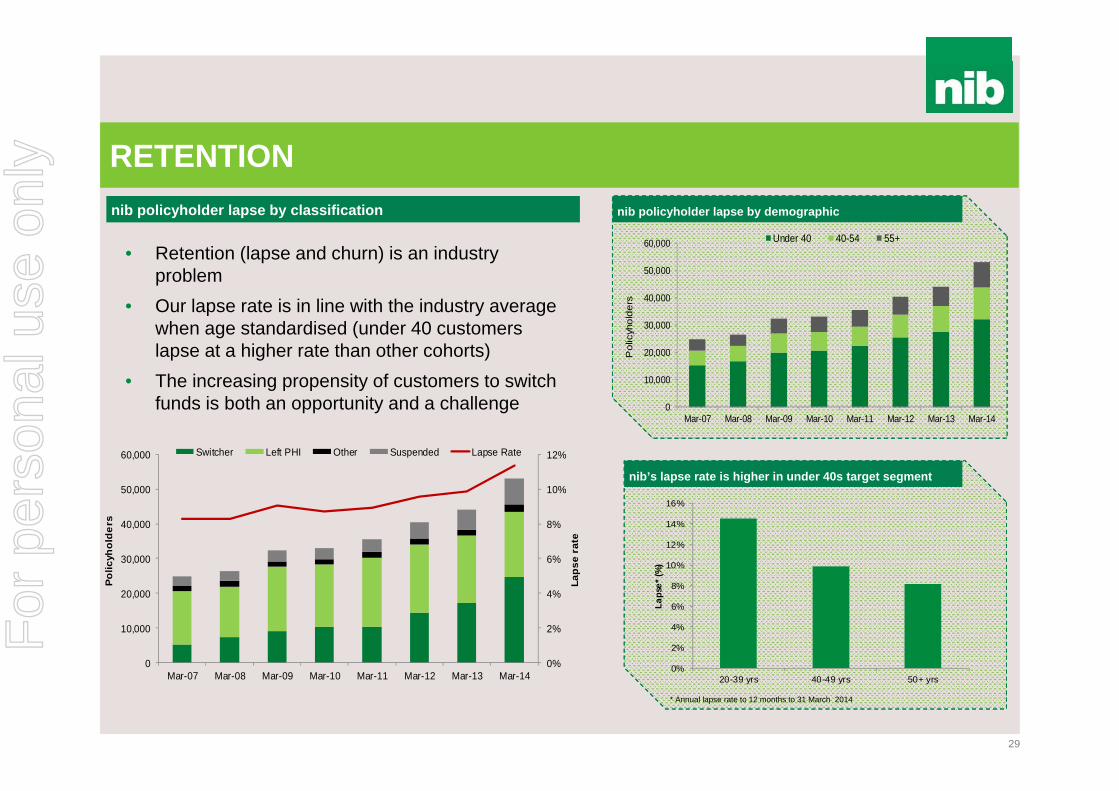
• Retention (lapse and churn) is an industry problem
• Our lapse rate is in line with the industry average when age standardised (under 40 customers lapse at a higher rate than other cohorts)
• The increasing propensity of customers to switch funds is both an opportunity and a challenge
0%
2%
4%
6%
8%
10%
12%
0
10,000
20,000
30,000
40,000
50,000
60,000
Mar-07 Mar-08 Mar-09 Mar-10 Mar-11 Mar-12 Mar-13 Mar-14
Laps
e ra
te
Polic
yhol
ders
Switcher Left PHI Other Suspended Lapse Rate
nib policyholder lapse by classification
nib’s lapse rate is higher in under 40s target segment
0%
2%
4%
6%
8%
10%
12%
14%
16%
20-39 yrs 40-49 yrs 50+ yrs
Laps
e* (%
)
* Annual lapse rate to 12 months to 31 March 2014
nib policyholder lapse by demographic
0
10,000
20,000
30,000
40,000
50,000
60,000
Mar-07 Mar-08 Mar-09 Mar-10 Mar-11 Mar-12 Mar-13 Mar-14
Pol
icyh
olde
rs
Under 40 40-54 55+
For
per
sona
l use
onl
y
MAIN HEADING GOES HERE IN UPPERCASE PLEASE
Put a footer here if you need to.
PRODUCT DESIGN PRINCIPLES
30
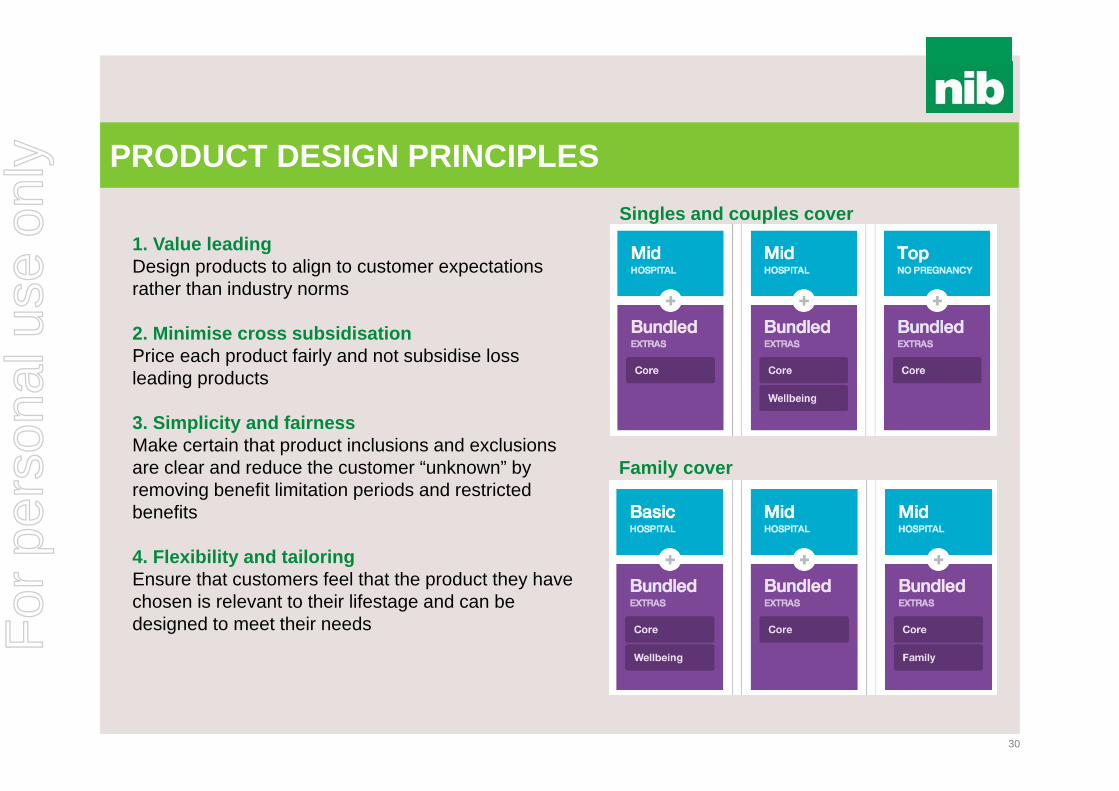
1. Value leadingDesign products to align to customer expectations rather than industry norms
2. Minimise cross subsidisationPrice each product fairly and not subsidise loss leading products
3. Simplicity and fairnessMake certain that product inclusions and exclusions are clear and reduce the customer “unknown” by removing benefit limitation periods and restricted benefits
4. Flexibility and tailoring Ensure that customers feel that the product they have chosen is relevant to their lifestage and can be designed to meet their needs
Singles and couples cover
Family cover
For
per
sona
l use
onl
y
MAIN HEADING GOES HERE IN UPPERCASE PLEASE
Put a footer here if you need to.
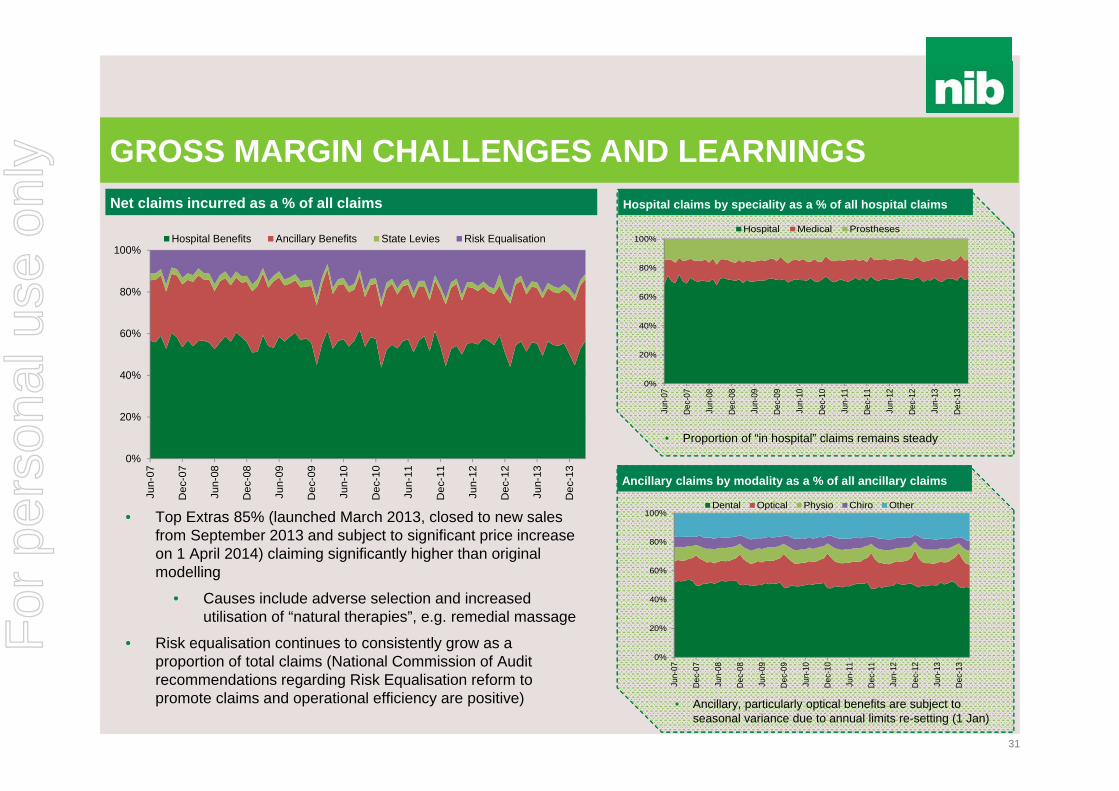
Hospital claims by speciality as a % of all hospital claims
GROSS MARGIN CHALLENGES AND LEARNINGS
31
Ancillary claims by modality as a % of all ancillary claims
• Ancillary, particularly optical benefits are subject to seasonal variance due to annual limits re-setting (1 Jan)
Net claims incurred as a % of all claims
• Top Extras 85% (launched March 2013, closed to new sales from September 2013 and subject to significant price increase on 1 April 2014) claiming significantly higher than original modelling
• Causes include adverse selection and increased utilisation of “natural therapies”, e.g. remedial massage
• Risk equalisation continues to consistently grow as a proportion of total claims (National Commission of Audit recommendations regarding Risk Equalisation reform to promote claims and operational efficiency are positive)
• Proportion of “in hospital” claims remains steady
0%
20%
40%
60%
80%
100%
Jun-
07
Dec
-07
Jun-
08
Dec
-08
Jun-
09
Dec
-09
Jun-
10
Dec
-10
Jun-
11
Dec
-11
Jun-
12
Dec
-12
Jun-
13
Dec
-13
Hospital Benefits Ancillary Benefits State Levies Risk Equalisation
0%
20%
40%
60%
80%
100%
Jun-
07
Dec
-07
Jun-
08
Dec
-08
Jun-
09
Dec
-09
Jun-
10
Dec
-10
Jun-
11
Dec
-11
Jun-
12
Dec
-12
Jun-
13
Dec
-13
Hospital Medical Prostheses
0%
20%
40%
60%
80%
100%
Jun-
07
Dec
-07
Jun-
08
Dec
-08
Jun-
09
Dec
-09
Jun-
10
Dec
-10
Jun-
11
Dec
-11
Jun-
12
Dec
-12
Jun-
13
Dec
-13
Dental Optical Physio Chiro Other
For
per
sona
l use
onl
y
MAIN HEADING GOES HERE IN UPPERCASE PLEASE
Put a footer here if you need to.
CLAIMS INFLATION - OUR 5 AREAS OF FOCUS
1. Service costs• Rely more upon data and evidence of variation in contract price negotiation• Seek to avoid payment for medical misadventure • Expand preferred ancillary provider network
2. Utilisation management• Contract with GPs to reduce avoidable hospital admissions and improve health status of “frequent fliers” (e.g.
advanced care plans, home care, health management programs) • Continue and expand selective chronic disease management plans
3. Claims leakage• More aggressively pursue fraudulent behaviour • Pursue compensable claims from 3rd parties
4. Customer empowerment• Support policyholder decision making with information and data on clinician and hospital performance (e.g.
Whitecoat) • Contract with GPs to assist policyholders in navigating and using information
5. Product design• More rigorous assessment of clinical efficacy • Review benefits structure for unprofitable products
32
For
per
sona
l use
onl
y

MAIN HEADING GOES HERE IN UPPERCASE PLEASE
Put a footer here if you need to.
Industry marketing and competitor activity
COMPETITOR ACTIVITY
33
$-
$20
$40
$60
$80
$100
$120
FY09 FY10 FY11 FY12 FY13
Mill
ions
nib Medibank/ahm Bupa iSelect
HCF HBF GMHBA Other
Data source: Nielsen AQX Fusion 2014
Estimated PHI Advertising by fund (excluding online)
• Industry continues to spend ~$100m on advertising annually (excluding online)
• Decrease in FY13 due to reduction by Medibank and BUPA
• Increased competitor and retail broker advertising is expected to increase as funds compete for customers (new to category and switchers)
• Expected funds and retail brokers will continue to focus on value based selling (price and benefits) targeting new to category and switchers, particularly in under 40s
• Competitor activity and advertising still expected to be skewed to peak acquisition periods (April – July)
For
per
sona
l use
onl
y

MAIN HEADING GOES HERE IN UPPERCASE PLEASE
Put a footer here if you need to.
FOCUS FOR NEXT 12 MONTHS
34
1. Building brand awareness and consideration in
target market
2. Web improvements
3. Stabilisation of lapse
4. Delivery of claims savings
5. Top Extras 85% rectification
6. Apia relationship
7. Leads management
8. Customer communications management
Net Promoter Score
We have worked to create a customer-focused culture
Introduced the Net Promoter Score (NPS) in July 2010 (survey sent to customers following contact with nib)
Embedded within organisation, as the “voice of the customer” and used as an assessment, coaching and continuous improvement tool with frontline employees
NPS also a KPI in each Executive's STI Recent NPS experience can be attributed to
seasonal impact of annual premium increase
0%
5%
10%
15%
20%
25%
30%
Sep-10 Mar-11 Sep-11 Mar-12 Sep-12 Mar-13 Sep-13 Mar-14
For
per
sona
l use
onl
y

MAIN HEADING GOES HERE IN UPPERCASE PLEASE
Put a footer here if you need to.
35
NATIONAL COMMISSION OF AUDIT
The National Commission of Audit Report (released in May 2014) outlined a number of recommendations aimed at reforming Australia’s healthcare system:
Effective move towards compulsory PHI for those on higher incomes Expanded cover into primary care to promote increased effort and investment in
chronic disease management and prevention Deregulation of premium pricing with only Government surveillance Review of risk equalisation to promote claims and operational efficiency Allowing private health insurers to reward good health behaviour with premium
discounts These measures if implemented will significantly change and improve the face of Australia’s healthcare system and PHI
For
per
sona
l use
onl
y
MAIN HEADING GOES HERE IN UPPERCASE PLEASE
Put a footer here if you need to.
36
FEDERAL BUDGET (2014-15)
According to the Government, the Health Budget (2014-15) was framed with four guiding principles: That taxpayer funds must be spent on programmes and services that improve
health outcomes for Australians; That bureaucracy and red tape should be cut, and efficiencies and productivity
improvements continually found; That people should take more responsibility for their own health, including through
modest contributions to the cost of care; and That the health system must be set up for the future.
For
per
sona
l use
onl
y

MAIN HEADING GOES HERE IN UPPERCASE PLEASE
Put a footer here if you need to.
37
FEDERAL HEALTH BUDGET (PHI) - WHAT’S CHANGED?
Income tiers for the Medicare Levy Surcharge (MLS) and premium rebates will not be indexed for three years from 1 July 2015, saving government $1.5 billion over that period. This means more people will be pushed into the high income tiers, and so get
lower premium rebates The MLS currently applies penalties to singles earning more than $88k per
year (or $176k for families). Not indexing these thresholds means more “middle income earners” will have to insure or pay the penalty
PHIAC (PHI Regulator) will be absorbed into APRA and ACCC by 1 July 2015. PHIO (PHI Ombudsman) will merge into the Office of the Commonwealth Ombudsman
Pausing indexation of Medicare Benefits Schedule rebates - From 1 July 2014 all items listed in the Medicare Benefits Schedule, except for GP items, will not be indexed for two yearsFor
per
sona
l use
onl
y

For
per
sona
l use
onl
y

For
per
sona
l use
onl
y
MAIN HEADING GOES HERE IN UPPERCASE PLEASE
Put a footer here if you need to.
To more effectively manage utilisation and benefits outlays that lead to:• Best value healthcare (i.e. funding services that make a difference in the most
cost-effective manner)• Lower claims and premium inflation and thereby improve price competitiveness• An improved experience for customers• Better clinical outcomes for customers
nib BENEFITS MANAGEMENT
40
We achieve this by focusing on 5 areas:1. Service costs2. Utilisation management3. Claims leakage4. Customer empowerment5. Product designFor
per
sona
l use
onl
y

For
per
sona
l use
onl
y

MAIN HEADING GOES HERE IN UPPERCASE PLEASE
Put a footer here if you need to.
DRIVERS OF HEALTH CARE COSTS
42
Improved survival rates imply more years of treatment
Lack of performance transparency prevents matching demand to the most productive supply
Increasing capacity induces demandPayment systems offer little
financial incentive for patient to minimise cost
Source: McKinsey & Company
For
per
sona
l use
onl
y
MAIN HEADING GOES HERE IN UPPERCASE PLEASE
Put a footer here if you need to.
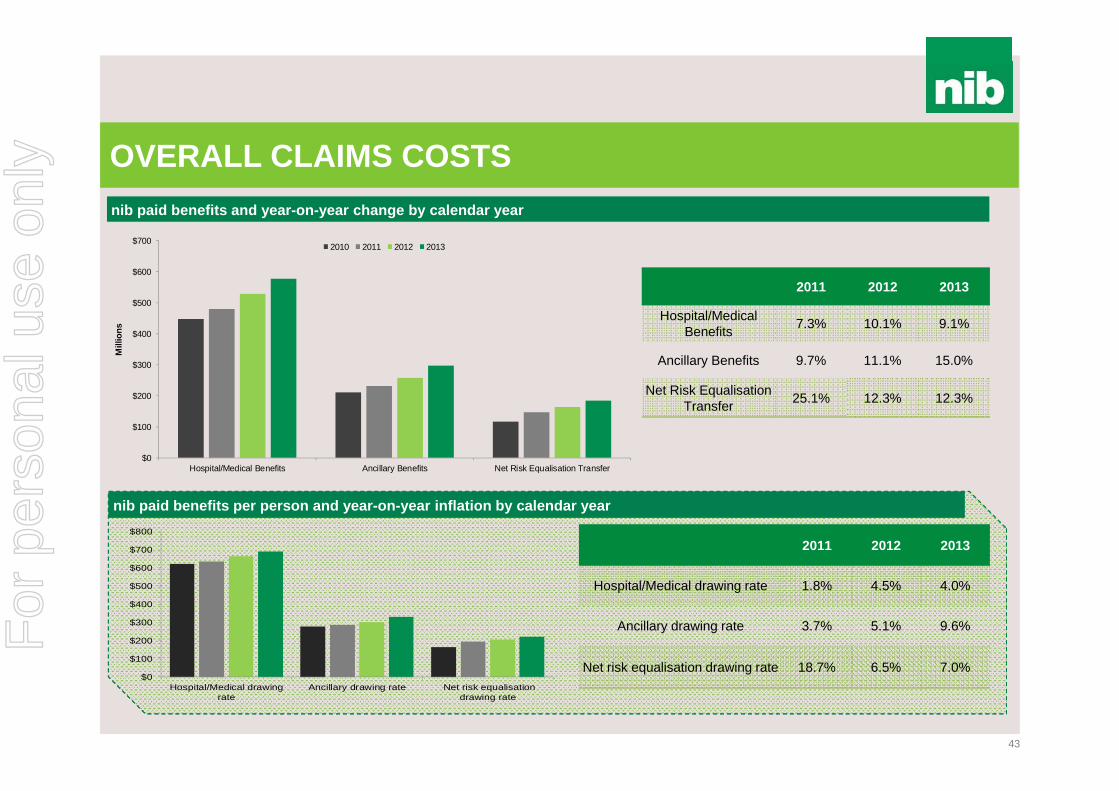
OVERALL CLAIMS COSTS
43
$0
$100
$200
$300
$400
$500
$600
$700
Hospital/Medical Benefits Ancillary Benefits Net Risk Equalisation Transfer
Mill
ions
2010 2011 2012 2013
nib paid benefits per person and year-on-year inflation by calendar year
$0
$100
$200
$300
$400
$500
$600
$700
$800
Hospital/Medical drawingrate
Ancillary drawing rate Net risk equalisationdrawing rate
nib paid benefits and year-on-year change by calendar year
2011 2012 2013
Hospital/Medical Benefits 7.3% 10.1% 9.1%
Ancillary Benefits 9.7% 11.1% 15.0%
Net Risk Equalisation Transfer 25.1% 12.3% 12.3%
2011 2012 2013
Hospital/Medical drawing rate 1.8% 4.5% 4.0%
Ancillary drawing rate 3.7% 5.1% 9.6%
Net risk equalisation drawing rate 18.7% 6.5% 7.0%
For
per
sona
l use
onl
y
MAIN HEADING GOES HERE IN UPPERCASE PLEASE
Put a footer here if you need to.
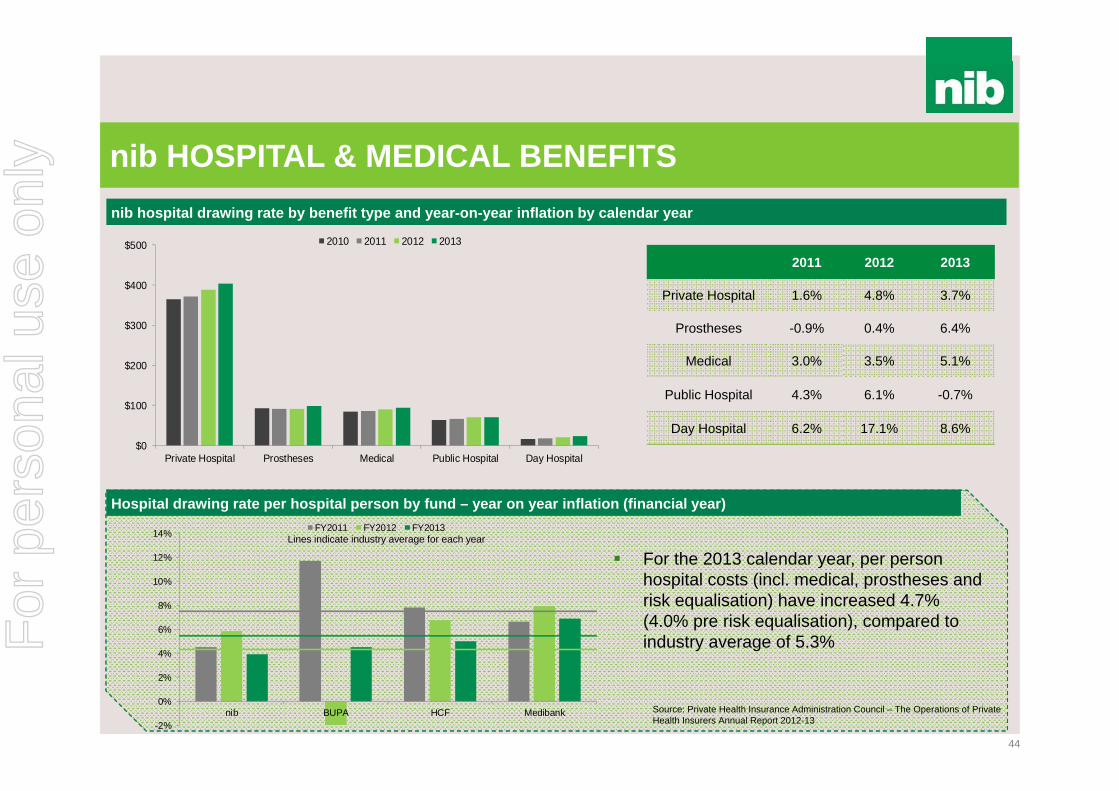
nib HOSPITAL & MEDICAL BENEFITS
44
nib hospital drawing rate by benefit type and year-on-year inflation by calendar year
$0
$100
$200
$300
$400
$500
Private Hospital Prostheses Medical Public Hospital Day Hospital
2010 2011 2012 2013
2011 2012 2013
Private Hospital 1.6% 4.8% 3.7%
Prostheses -0.9% 0.4% 6.4%
Medical 3.0% 3.5% 5.1%
Public Hospital 4.3% 6.1% -0.7%
Day Hospital 6.2% 17.1% 8.6%
Hospital drawing rate per hospital person by fund – year on year inflation (financial year)
-2%
0%
2%
4%
6%
8%
10%
12%
14%
nib BUPA HCF Medibank
FY2011 FY2012 FY2013
For the 2013 calendar year, per person hospital costs (incl. medical, prostheses and risk equalisation) have increased 4.7% (4.0% pre risk equalisation), compared to industry average of 5.3%
Source: Private Health Insurance Administration Council – The Operations of Private Health Insurers Annual Report 2012-13
Lines indicate industry average for each year
For
per
sona
l use
onl
y

MAIN HEADING GOES HERE IN UPPERCASE PLEASE
Put a footer here if you need to.
$0.0
$20.0
$40.0
$60.0
$80.0
Mill
ions
2010 2011 2012 2013
DRIVERS OF HOSPITAL & MEDICAL INFLATION
45
nib high cost procedures by calendar year (by nib DRG grouping)
Rehabilitation benefits (LHS) and episodes (RHS) by calendar year
0
5,000
10,000
15,000
20,000
$0
$10
$20
$30
$40
2010 2011 2012 2013
Benefits ($m) Episodes
Greatest growth in utilisation and overall claims costs = cardiac, orthopaedics and associated rehabilitation
Growth in rehab driven mainly by utilisation (rather than unit cost)
Capacity-driven demand is significant contributorF
or p
erso
nal u
se o
nly

MAIN HEADING GOES HERE IN UPPERCASE PLEASE
Put a footer here if you need to.
UNWARRANTED VARIATION
46
Admissions for knee arthroscopy by Medicare Local and peer group, 2010-11
Source: Australian Commission on Safety and Quality in Health Care and Australian Institute of Health and Welfare. Exploring Healthcare Variation in Australia: Analyses Resulting from an OECD Study. Sydney: ACSQHC, 2014.
Case study – knee arthroscopy
• Significant regional variation around Australia in terms of procedure utilisation (90% performed in private hospitals)
• Minimal evidence of benefit where underlying degeneration exists, but useful in younger ages where no degeneration exists
Number of knee arthroscopic episodes by age group (nib, FY13)
0
100
200
300
400
• nib benefit outlays >$1m per annum
For
per
sona
l use
onl
y

MAIN HEADING GOES HERE IN UPPERCASE PLEASE
Put a footer here if you need to.
HIGH COST CLAIMERS
47
Small proportion of our policyholders consume a large percentage of overall benefit outlays …we call them our “frequent flyers”
Distribution of hospital benefits amongst nib insured customers (incurred CY13)
0%
20%
40%
60%
80%
100%
120%
$0
$100
$200
$300
$400
$500
$600
$700
0% 1% 2% 3% 4% 5% 6% 7% 8% 9% 10% 11% 12%
Cum
ulat
ive
Prop
ortio
n of
Hos
pita
l Ben
efits
Cum
ulat
ive
Hosp
ital B
enef
its ($
m)
Proportion of Total Insured Hospital Customers
1% of our hospital customers account for more than 50% of hospital benefits (pre risk equalisation)
For
per
sona
l use
onl
y

MAIN HEADING GOES HERE IN UPPERCASE PLEASE
Put a footer here if you need to.
HOSPITAL & MEDICAL BENEFITS – KEY TAKEAWAYS
48
Drivers across all areas:
Utilisation more than unit cost
Orthopaedic procedures and subsequent rehab are a particular issue
Growth in cardiac and psychiatry also areas to watch
Unwarranted variation
“Frequent flyers” represent significant proportion of claims expenditure
Inflation from public hospital charges controlled but potential risk
subsequent to reduced future Government funding
Costs of (poor) quality are significantFor
per
sona
l use
onl
y

MAIN HEADING GOES HERE IN UPPERCASE PLEASE
Put a footer here if you need to.
xxx
49
nib ANCILLARY BENEFITSnib paid ancillary benefits per ancillary person by benefit type and year-on-year inflation by calendar year
$0
$20
$40
$60
$80
$100
$120
$140
$160
$180
Dental Other Ancillary Optical Physiotherapy Chiropractic
2010 2011 2012 2013 2011 2012 2013
Dental 3.1% 5.3% 10.9%
Other* 4.3% 5.7% 12.3%
Optical 5.7% 3.9% 5.2%
Physiotherapy 2.8% 6.2% 9.8%
Chiropractic 2.2% 3.7% 4.2%
Ancillary drawing rate per person – year on year inflation (financial year)
Source: Private Health Insurance Administration Council
0.0%
2.0%
4.0%
6.0%
8.0%
10.0%
12.0%
nib Industry
2011 2012 2013
2011 2012 2013
nib 3.7% 5.1% 9.6%
Industry 3.6% 5.0% 8.9%
* Other includes ancillary benefits such as remedial massage, podiatry, acupuncture, etc
*
For
per
sona
l use
onl
y

MAIN HEADING GOES HERE IN UPPERCASE PLEASE
Put a footer here if you need to.
ANCILLARY BENEFITS – KEY TAKEAWAYS
50
Utilisation more than unit cost
Changes to Government funding contributing factor (e.g. Chronic
Disease Dental Scheme ended Nov 2012) and supply induced demand
Product design and adverse selection
Effective preferred provider relationships can add value
Provider registration and fraud (provider and consumer) need to be
monitored closely
For
per
sona
l use
onl
y

MAIN HEADING GOES HERE IN UPPERCASE PLEASE
Put a footer here if you need to.
RISK EQUALISATION…WHO PAYS WHAT?
51
Current model does not incentivise preventative and other health manageemnt initiatives Potential for some (nib) gross deficit relief through targeting over 55s demographic (e.g. Apia
relationship), however unlikely to reduce liability given our significantly younger than average age profile compared to industry
Source: Private Health Insurance Administration Council – The Operations of Private Health Insurers Annual Report 2012-13
For
per
sona
l use
onl
y

For
per
sona
l use
onl
y

MAIN HEADING GOES HERE IN UPPERCASE PLEASE
Put a footer here if you need to.
CASE STUDY - TECHNOLOGY AT WHAT PRICE
53
• Approximately 80% US prostatectomies performed robotically
• Procedure costs ~$3,000 additional• Inconclusive proof of better outcomes
• JAMA (Journal of the American Medical Association) study of >250,000 hysterectomy surgeries – no better outcomes – 32% more expensive
• Recent safety concerns prompting an audit by US Food and Drug Administration
• Robotic surgery increases US healthcare costs by $2.5 billion per annum (and is increasing)
• Significant usage in Australia despite minimal reimbursement from health funds
“There is no good data proving robotic hysterectomy is even as good as – let alone better than existing, and far less costly minimally invasive alternatives”
American Congress of Obstetricians and Gynaecologists 2013
Da Vinci Robot
For
per
sona
l use
onl
y

MAIN HEADING GOES HERE IN UPPERCASE PLEASE
Put a footer here if you need to.
OUR AREAS OF FOCUS1. Service costs
• Contract price negotiation supported by enhanced information• Seek to avoid payment for poor quality• Expand ancillary preferred provider network
2. Utilisation management• Contract with primary care to reduce avoidable admissions and improve health status of “frequent flyers”
– For example health management programs, advanced care plans, home care visits • Continue and expand selective chronic disease management plans
3. Claims leakage• More aggressively audit providers and monitor for fraudulent behaviour • Pursue compensable claims from 3rd parties
4. Customer empowerment• Support decision making with clinical information and data on provider performance (e.g. Whitecoat) • Partner with GPs to assist policyholders in navigating and using information
5. Product design• More rigorous assessment of clinical efficacy • Review benefits structure for unprofitable products
6. NZ and international businesses• Preferred provider networks • Interaction with primary care• Consumer empowerment
54
For
per
sona
l use
onl
y
MAIN HEADING GOES HERE IN UPPERCASE PLEASE
Put a footer here if you need to.
CASE STUDY - CONSUMER ENGAGEMENT & EMPOWERMENT
55
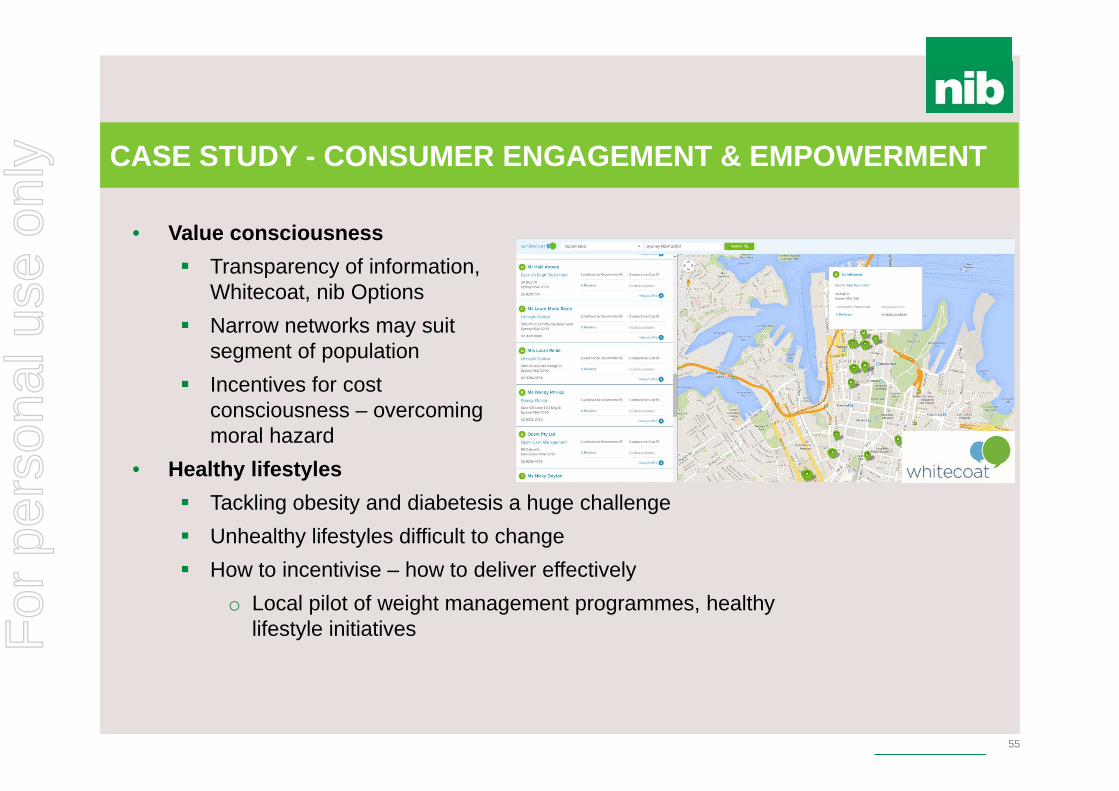
• Value consciousness Transparency of information,
Whitecoat, nib Options Narrow networks may suit
segment of population Incentives for cost
consciousness – overcoming moral hazard
• Healthy lifestyles Tackling obesity and diabetesis a huge challenge Unhealthy lifestyles difficult to change How to incentivise – how to deliver effectively
o Local pilot of weight management programmes, healthy lifestyle initiativesF
or p
erso
nal u
se o
nly

For
per
sona
l use
onl
y

For
per
sona
l use
onl
y

For
per
sona
l use
onl
y
MAIN HEADING GOES HERE IN UPPERCASE PLEASE
Put a footer here if you need to.
nib NZ BUSINESS STRATEGY
59
1. Build Direct-to-Consumer (DTC) channel and grow the market and our share
2. Recalibrate the adviser channel3. Pursue increased share in group market4. Build and execute “white labelling” capability5. Reduce claims inflation6. Place the customer at the centre of everything we do7. Pursue mergers and acquisitions at the right price8. Innovate – “choice, flexibility and affordability”
For
per
sona
l use
onl
y

MAIN HEADING GOES HERE IN UPPERCASE PLEASE
Put a footer here if you need to.
INDUSTRY STRUCTURE & OVERVIEW
60
NZ PHI coverage (% of population)
25.0%
27.5%
30.0%
32.5%
35.0% NZ PHI participation factors Increasing wealth and favourable economic
circumstances Vast majority of population is not insured Growing dissatisfaction with public system (elective
surgery) Ability to cover full spectrum of healthcare
(unlike Australia) enhances value propositionSource : Health Funds Association New Zealand (Dec 13)
NZ PHI is dominated by top three funds
• There are currently 10 registered health funds in NZ• Top 3 PHI players represent 87% of the industry by premium
revenue • Majority of health insurance is sold through advisors or
employer groups
• Policies are risk rated (unlike Australia)
* Source Health Funds Association New Zealand (March 2014)
Industry premium revenue
~NZ$1.2b
For
per
sona
l use
onl
y
MAIN HEADING GOES HERE IN UPPERCASE PLEASE
Put a footer here if you need to.
61
Components of NZ healthcare spending
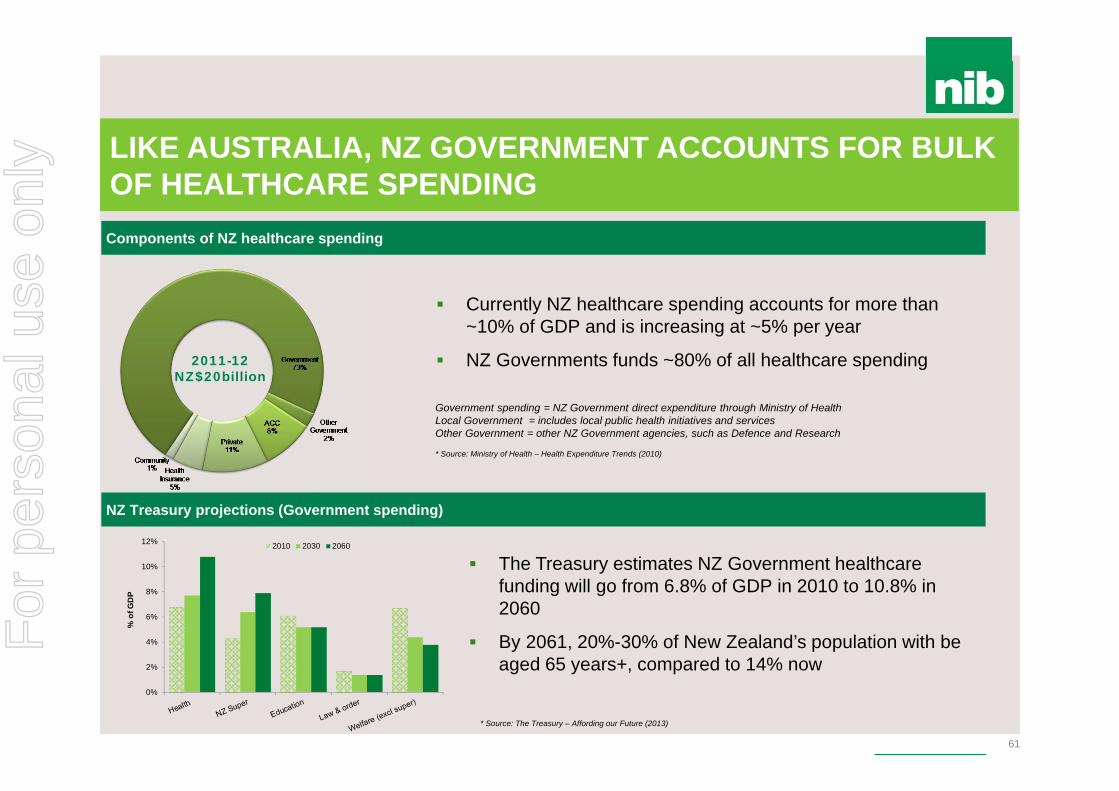
Government spending = NZ Government direct expenditure through Ministry of Health Local Government = includes local public health initiatives and servicesOther Government = other NZ Government agencies, such as Defence and Research
* Source: Ministry of Health – Health Expenditure Trends (2010)
LIKE AUSTRALIA, NZ GOVERNMENT ACCOUNTS FOR BULK OF HEALTHCARE SPENDING
2011-12NZ$20billion
NZ Treasury projections (Government spending)
0%
2%
4%
6%
8%
10%
12%
% o
f GD
P
2010 2030 2060
* Source: The Treasury – Affording our Future (2013)
Currently NZ healthcare spending accounts for more than ~10% of GDP and is increasing at ~5% per year
NZ Governments funds ~80% of all healthcare spending
The Treasury estimates NZ Government healthcare funding will go from 6.8% of GDP in 2010 to 10.8% in 2060
By 2061, 20%-30% of New Zealand’s population with be aged 65 years+, compared to 14% now
Components of NZ healthcare spending
For
per
sona
l use
onl
y

MAIN HEADING GOES HERE IN UPPERCASE PLEASE
Put a footer here if you need to.
62
Australia NZSupportive Government policy (ie “carrots and sticks”) X
Public Hospital (accommodation, theatre, etc), choice of specialist X
Private Hospital (accommodation, theatre, etc), choice of specialist Medical specialist (surgeon, anaesthetist ) in hospital Medical specialist (surgeon, anaesthetist ) outside hospital X General Practitioner Pharmaceuticals X X
Diagnostics (xray, blood tests) X General Treatment cover (dental, optical, etc) Ambulance
PHI IN NZ COMPARED TO AUSTRALIA
* National Commission of Audit Report recommends expanding PHI cover into primary care, including GPs
*
For
per
sona
l use
onl
y

For
per
sona
l use
onl
y

MAIN HEADING GOES HERE IN UPPERCASE PLEASE
Put a footer here if you need to.
nib NEW ZEALAND STRATEGIC FRAMEWORK
64
• Establish nib in NZ• Establish nib in NZ
2012-13
2014-152015-16
2017+
Phase I Phase II Phase III Phase IV
• Build DTC products and brand launch
• Build DTC products and brand launch
• Create DTC Channel• Establish Leadership in
20-40 year olds• Franchise starts regrowing
• Create DTC Channel• Establish Leadership in
20-40 year olds• Franchise starts regrowing
• Accelerate investment momentum; Leveraging capabilities installed
• Accelerate investment momentum; Leveraging capabilities installed
• nib – established as aspirational brand
• Establish trajectory of market share growth
• Leverage capabilities installed
• nib – established as aspirational brand
• Establish trajectory of market share growth
• Leverage capabilities installed
• Continue brand and acquisition investment
• Continue brand and acquisition investment
• nib established as leader in health cover
• Significant business in:• PHI• Travel Insurance • nib Options• IPMI/ISHI/IWHI
• nib established as leader in health cover
• Significant business in:• PHI• Travel Insurance • nib Options• IPMI/ISHI/IWHI
Consolidation & Capability Development
• Separation from Tower• Separation from Tower• 20% + market share and
growing• 20% + market share and
growing
Laying the Foundation
Creating Large Franchise
Larger Contribution to nib
WORK IN PROGRESS
For
per
sona
l use
onl
y

MAIN HEADING GOES HERE IN UPPERCASE PLEASE
Put a footer here if you need to.
BUILDING OUR BRAND
65
For
per
sona
l use
onl
y

MAIN HEADING GOES HERE IN UPPERCASE PLEASE
Put a footer here if you need to.
Prompted awareness (Target segment 25 – 39 year olds)
nib BRAND NOW IN CONVERSATION IN NZ
66Source: nib New Zealand brand tracker (Jan 2014 n=377, April 2014 n=364)
Spontaneous awareness (Target segment 25 – 39 year olds)
7%
48%
6% 3%
20%
55%
9%
1%
nib Sthn Cross Sovereign Accuro
Jan-14 Apr-14
21%
78%
38%
7%
40%
77%
48%
1%
nib Sthn Cross Sovereign Accuro
Jan-14 Apr-14
• Since launch in New Zealand in October 2013, nib is now ranked number 2 “top-of-mind” amongst consumers for health insurance
• nib unprompted awareness has grown by almost 300%
• The nib brand is cutting through at a faster rate than other more established brands
• Prompted brand awareness has almost doubled since January to 40%F
or p
erso
nal u
se o
nly
MAIN HEADING GOES HERE IN UPPERCASE PLEASE
Put a footer here if you need to.
0%
20%
40%
60%
80%
100%
Nov-06 Nov-07 Nov-08 Nov-09 Nov-10 Nov-11 Nov-12 Nov-13
Direct External Advisers Group
DTC* IS CONTRIBUTING STRONGLY TO SALES
67
nib NZ monthly policyholder sales by channel(as a % of all sales)
0%
20%
40%
60%
80%
100%
Nov-06 Nov-07 Nov-08 Nov-09 Nov-10 Nov-11 Nov-12 Nov-13
Under 40 40-49 50+
nib NZ policyholder sales by demographic (as a % of all sales)
Average Premium Income per DTC sale
$0
$150
$300
$450
$600
$750
Oct-13 Nov-13 Dec-13 Jan-14 Feb-14 Mar-14
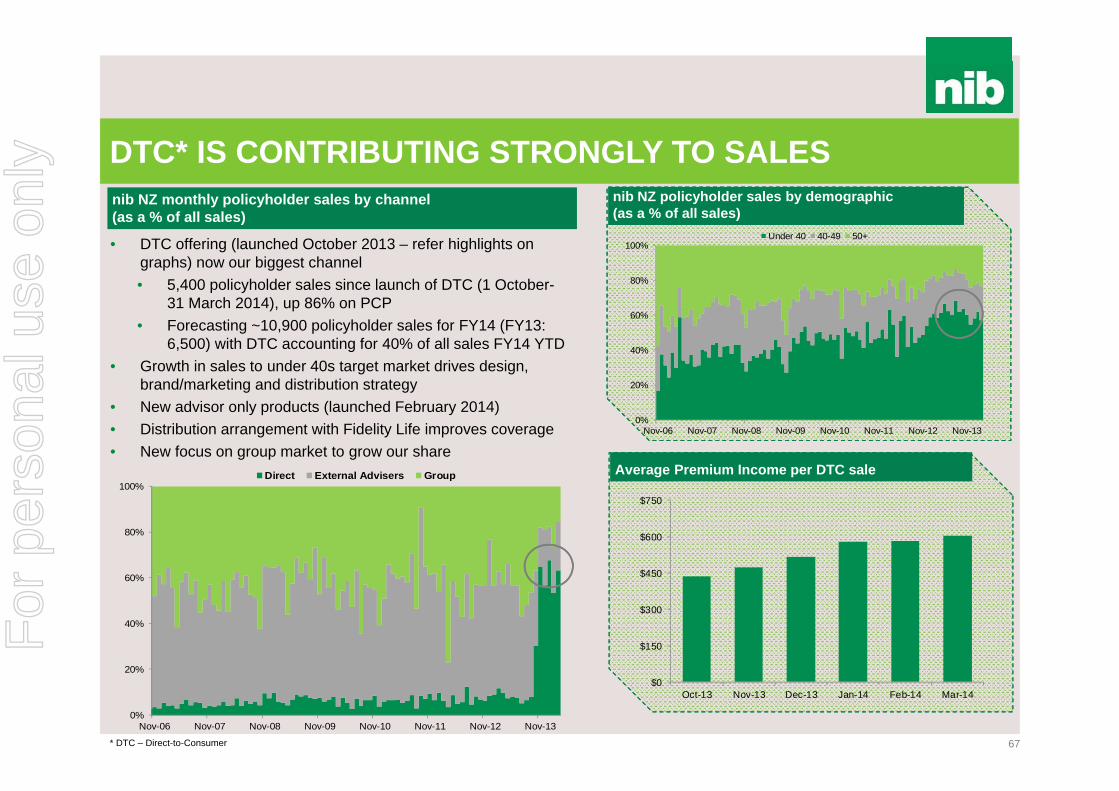
• DTC offering (launched October 2013 – refer highlights on graphs) now our biggest channel• 5,400 policyholder sales since launch of DTC (1 October-
31 March 2014), up 86% on PCP• Forecasting ~10,900 policyholder sales for FY14 (FY13:
6,500) with DTC accounting for 40% of all sales FY14 YTD• Growth in sales to under 40s target market drives design,
brand/marketing and distribution strategy• New advisor only products (launched February 2014)• Distribution arrangement with Fidelity Life improves coverage • New focus on group market to grow our share
* DTC – Direct-to-Consumer
For
per
sona
l use
onl
y

MAIN HEADING GOES HERE IN UPPERCASE PLEASE
Put a footer here if you need to.
FOCUS ON CLAIMS & LAPSE TO GROW MARGIN
68
Net claims as a % of all claims (Hospital surgical claims only)
nib NZ lapse rate (Rolling 12 months lives covered)
0%
20%
40%
60%
80%
100%
Mar-07 Mar-08 Mar-09 Mar-10 Mar-11 Mar-12 Mar-13 Mar-14
Hospital Anaesthetist Surgeon Prosthesis
• nib lapse rate remains above overall industry average, although recent trend positive
• Despite strong sales since October 2013, lapse remains a headwind for positive net policyholder growth for FY14
• Focused retention campaigns for new customers• Ongoing proactive campaign to address lapse through
arrears • Resolve root cause issues with nib Group “Think Like the
Customer” (TLC) initiatives• New migration plan to retain customers on “legacy” products
• Growth and targeting better risk policyholders (<40) through DTC, and an increase in low value claims such as diagnostics are resulting in steady average claims cost per person
• Underlying claims inflation within some cohorts still experiencing high single digit growth (%)
• Provider Relations strategy moving from development to implementation
10.0%
11.0%
12.0%
13.0%
14.0%
Dec-10 Dec-11 Dec-12 Dec-13
Chart does not include bundled bills (mix of hospital, medical and prosthesis)
For
per
sona
l use
onl
y
MAIN HEADING GOES HERE IN UPPERCASE PLEASE
Put a footer here if you need to.
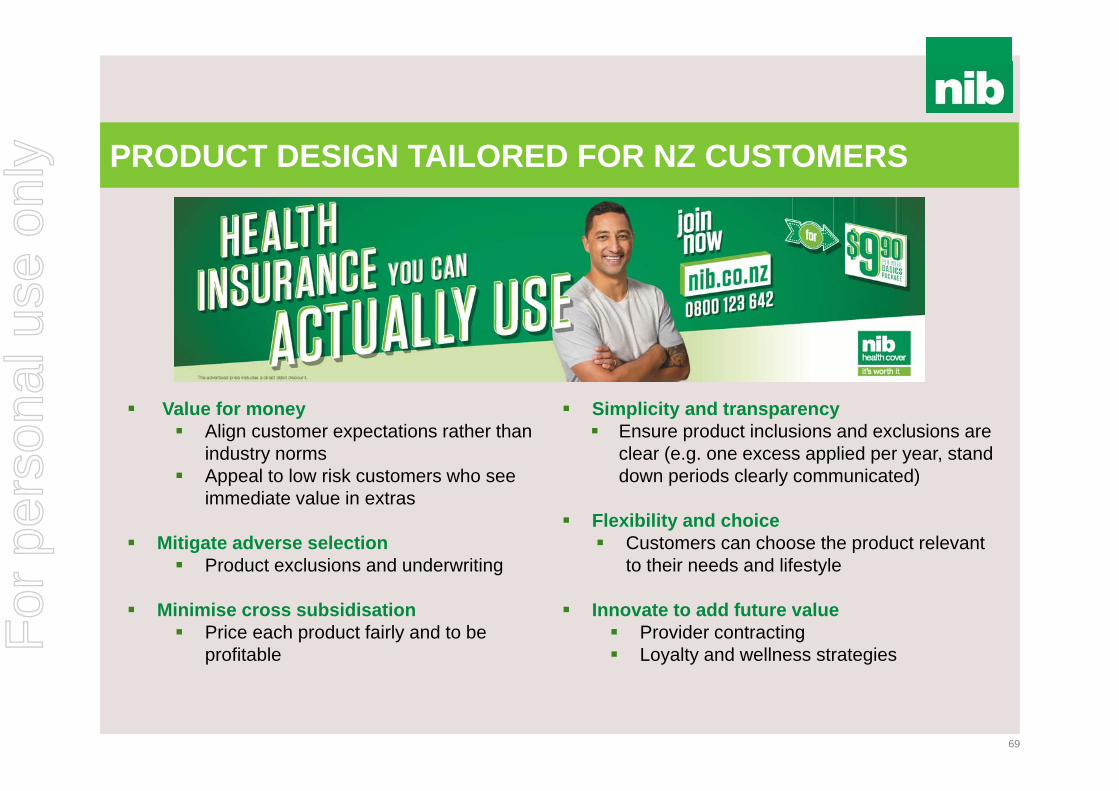
PRODUCT DESIGN TAILORED FOR NZ CUSTOMERS
69
Value for money Align customer expectations rather than
industry norms Appeal to low risk customers who see
immediate value in extras
Mitigate adverse selection Product exclusions and underwriting
Minimise cross subsidisation Price each product fairly and to be
profitable
Simplicity and transparency Ensure product inclusions and exclusions are
clear (e.g. one excess applied per year, stand down periods clearly communicated)
Flexibility and choice Customers can choose the product relevant
to their needs and lifestyle
Innovate to add future value Provider contracting Loyalty and wellness strategiesF
or p
erso
nal u
se o
nly
MAIN HEADING GOES HERE IN UPPERCASE PLEASE
Put a footer here if you need to.
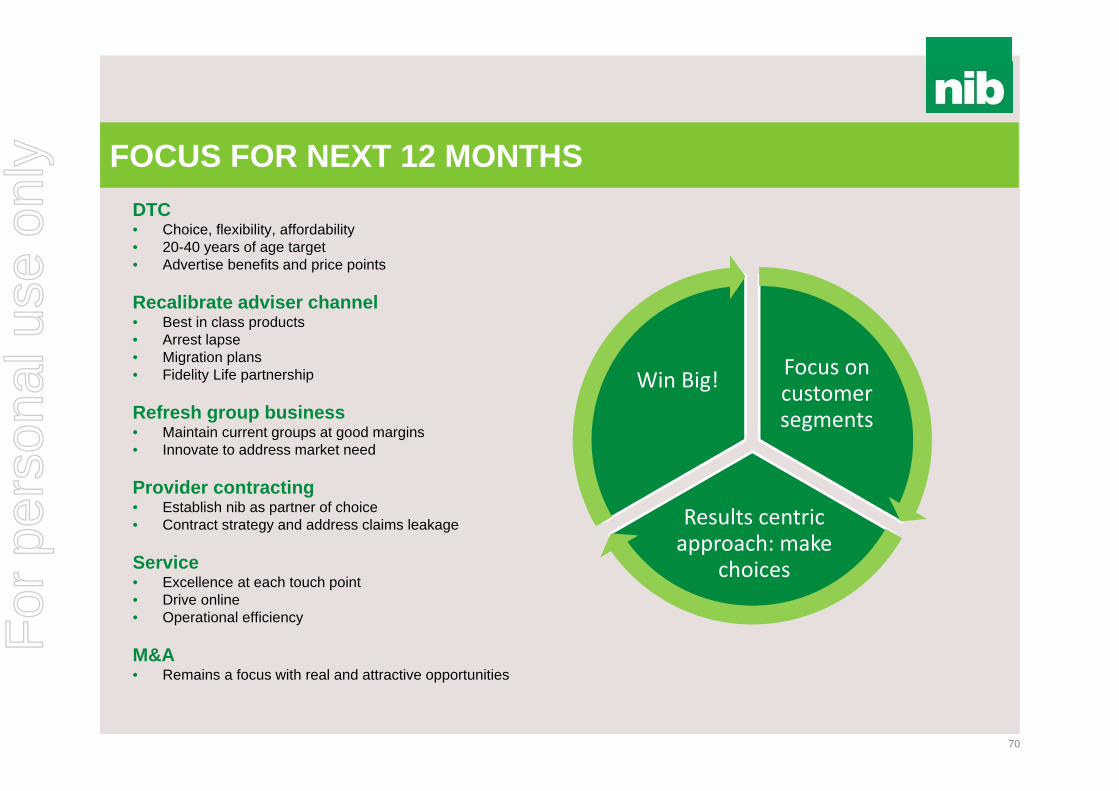
FOCUS FOR NEXT 12 MONTHS
70
DTC• Choice, flexibility, affordability• 20-40 years of age target• Advertise benefits and price points
Recalibrate adviser channel• Best in class products• Arrest lapse• Migration plans• Fidelity Life partnership
Refresh group business• Maintain current groups at good margins• Innovate to address market need
Provider contracting• Establish nib as partner of choice• Contract strategy and address claims leakage
Service• Excellence at each touch point• Drive online• Operational efficiency
M&A• Remains a focus with real and attractive opportunities
Focus on customer segments
Results centric approach: make
choices
Win Big!
For
per
sona
l use
onl
y

For
per
sona
l use
onl
y
For
per
sona
l use
onl
y

MAIN HEADING GOES HERE IN UPPERCASE PLEASE
Put a footer here if you need to.
$33.1m$40.2m
$47.1m
$59.8m $64.6m $59.0m
$(2.8)m$(6.7)m $(4.5)m
$5.4m $10.2m
FY08A FY09A FY10A FY11A FY12A FY13A FY14F
arhi underwriting result Non-arhi Contribution to operating profit
NON-ARHI* CONTRIBUTION TO OPERATING PROFITContribution of adjacent businesses to Group operating profit
* ARHI - Australian Residents Health Insurance# includes demutualisation and listing costs
15%8%
FY14 guidance range ($73.0m-$80.0m)Latest forecast at lower end of range
$73.0m -$80.0m
#
For
per
sona
l use
onl
y

MAIN HEADING GOES HERE IN UPPERCASE PLEASE
Put a footer here if you need to.
• Of the total student visas granted in FY13, almost 25% were to Chinese nationals, followed by 10% to Indian nationals
• Other countries include countries such as Saudi Arabia, Japan, Brazil, Pakistan and Philippines
• International student market continues to show positive signs of recovery and growth, with total student visa grants increasing by more than 11% in the March 2014 quarter
• As at 31 March 2014, there were 366,914 student visa holders in Australia
• Ongoing success with upstream distribution strategy as well as successful product design and market positioning continues to drive strong policyholder growth
• Will surpass 25,000 total policyholders by 30 June 2014
0
100,000
200,000
300,000
FY08 FY09 FY10 FY11 FY12 FY13 9 mths31/3/14
INTERNATIONAL STUDENTS (ishi)
74
International students visas granted (500 class) in Australia International students (visas granted) - country of origin
Distribution strategy delivering outstanding policyholder growth Components of net underwriting result as a % of premium revenueSource: Department of Immigration and Border Protection (2014)
0%
25%
50%
75%
100%
June 07 June 08 June 09 June 10 June 11 June 12 June 13 March 14
China India Vietnam South KoreaMalaysia Indonesia Thailand Other Countries
Source: Department of Immigration and Border Protection – Student visa programme quarterly report (31/3/2014)
-
5,000
10,000
15,000
20,000
Mar-10 Mar-11 Mar-12 Mar-13 Mar-14-400%
-200%
0%
200%
400%
FY11 1H12 FY12 1H13 FY13 1H14
Claims expense MER Net margin
• Strong policyholder sales has delivered premium revenue growth, with business now having scale to be profitable
• Claims ratio declining as a percentage of revenue due to product design• Management expenses have increased in 1H14 with business now
operating in standalone mode (i.e. no internal cost subsidisation)
For
per
sona
l use
onl
y

MAIN HEADING GOES HERE IN UPPERCASE PLEASE
Put a footer here if you need to.
ishi BUSINESS STRATEGY
75
1. Disrupt traditional distribution system and sell “upstream”
2. Focus direct to consumer efforts upon better risk, single policyholders
3. Reduce claims inflation
4. Place the customer at the centre of everything we do
5. Innovate, innovate and innovate
For
per
sona
l use
onl
y

MAIN HEADING GOES HERE IN UPPERCASE PLEASE
Put a footer here if you need to.
• Marketing and distribution strategy continues to drive policyholder growth• Market conditions tougher than previous years due to softening labour market
(FY14 net policyholder growth will be similar to previous year)• Now established as number 3 brand in market
• Track record of stable claims expense, management expenses and net margin
• Premium revenue lagging policyholder growth due to sales of lower premium products (price point and products to meet minimum visa requirements)
• Lower price products have lower benefits, benefiting claims ratio• Outlook is positive as well as opportunity to grow other visa classes
• The number of primary visa holders in Australia on 31 March 2014 was 111,780; 5.9% higher compared with PCP
• However, number of subclass 457 primary visas granted 30 June 2013 -31 March 2014 was 39,760; 23% lower compared with PCP
INTERNATIONAL WORKERS (iwhi)
76
Number of 457 visas (primary visa holders) in Australia Subclass 457 students visas (primary) granted by sponsor industry
Policyholder growth continues to be strong Components of net underwriting result as a % of premium revenue
0
50,000
100,000
June 08 June 09 June 10 June 11 June 12 June 13 March 14Source: Department of Immigration and Border Protection. Subclass 457 quarterly report (quarter ending at 31/3/2014
Industry % of total 457 visa applications granted*Accommodation and Food Services 12.5%Information Media, Telecommunications 10.8%Health Care and Social Assistance 10.3%Professional, Scientific and Technical 9.3%Construction 8.9%Education and Training 5.5%Mining 5.2%Retail Trade 4.9%Manufacturing 4.7%Financial and Insurance Services 3.3%* Percentage total of 457 primary applications granted from 1/7/2013 – 31/3/2014
Source: Department of Immigration and Border Protection. Subclass 457 quarterly report (quarter ending at 31/3/2014)
• Majority of 457 primary visas granted are for hospitality, IT and health care industries
• Resources downturn impacted number of mining industry 457 primary visas (5.2% of all 457 visas granted in 9 months to 31 March 2014, compared to 9.3% of all granted PCP). iwhi has little exposure to mining (~15%)
-
5,000
10,000
15,000
20,000
Jul-10 Jun-11 May-12 Apr-13 Mar-140%
20%
40%
60%
80%
100%
FY11 1H12 FY12 1H13 FY13 1H14
Claims expense MER Net margin
For
per
sona
l use
onl
y

MAIN HEADING GOES HERE IN UPPERCASE PLEASE
Put a footer here if you need to.
iwhi BUSINESS STRATEGY
77
1. Focus efforts on direct-to-consumer with key emphasis on price
2. Escalate risk rating within the business
3. Reduce claims inflation
4. Place the customer at the centre of everything we do
5. Innovate, innovate and innovate
6. Explore opportunities to win corporate business
For
per
sona
l use
onl
y

MAIN HEADING GOES HERE IN UPPERCASE PLEASE
Put a footer here if you need to.
nib OPTIONS – STRATEGIC LOGIC
78
Scale
Growth
Relatedness
Opportunity
Globalisation
The market conditions for medical travel is relatively underdeveloped. While the provider side is rapidly evolving there is little sophistication and scale in relation to facilitation and funding
Global trend and growing market for people travelling across international borders for healthcare treatment
There is a clear and present opportunity to play a role in the Australian market with respect to cosmetic treatment. The number of Australians travelling abroad to access medical treatment is now estimated at 15,000 per year
nib has the brand, service, distribution and provider network capability to serve this market
Once the business model, infrastructure and capability are proven, there is a further enormous opportunity to play a role in the global market for both cosmetic and medical treatmentF
or p
erso
nal u
se o
nly

MAIN HEADING GOES HERE IN UPPERCASE PLEASE
Put a footer here if you need to.
nib OPTIONS – KEY STRATEGIC PILLARS
79
1. We focus the value proposition, product offering and client service around reliability, quality, safety and trust
2. Build a marketing and sales culture and systems which capture market attention and delivers sales by putting the client at the heart of everything we do
3. Continue to invest in and develop the people, technology and capability
4. Research and prepare for the expansion of the business into supplying medical procedures both in the Australian and New Zealand markets and cosmetic and medical procedures in foreign countries, especially Asia
For
per
sona
l use
onl
y
MAIN HEADING GOES HERE IN UPPERCASE PLEASE
Put a footer here if you need to.
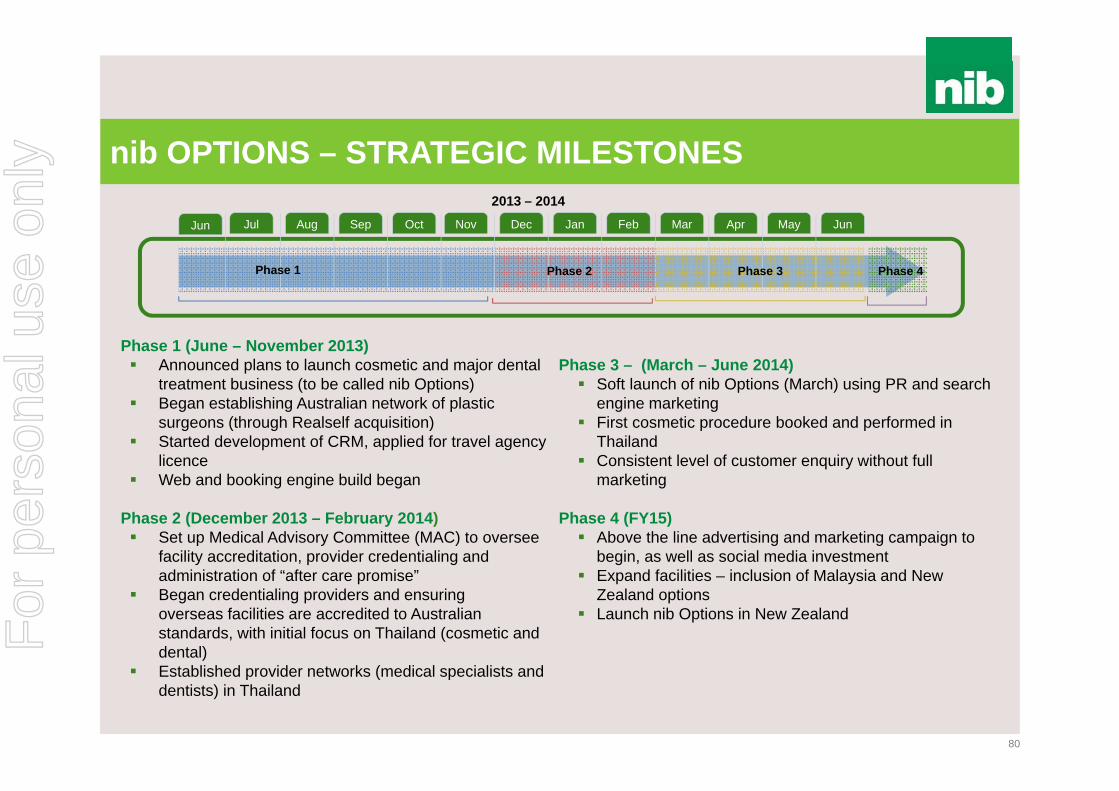
nib OPTIONS – STRATEGIC MILESTONES
80
Jul Aug Sep Oct Nov Dec Jan Feb Mar Apr May Jun
2013 – 2014
Phase 1 Phase 2 Phase 3 Phase 4
Phase 1 (June – November 2013) Announced plans to launch cosmetic and major dental
treatment business (to be called nib Options) Began establishing Australian network of plastic
surgeons (through Realself acquisition) Started development of CRM, applied for travel agency
licence Web and booking engine build began
Phase 2 (December 2013 – February 2014) Set up Medical Advisory Committee (MAC) to oversee
facility accreditation, provider credentialing and administration of “after care promise”
Began credentialing providers and ensuringoverseas facilities are accredited to Australian standards, with initial focus on Thailand (cosmetic and dental)
Established provider networks (medical specialists and dentists) in Thailand
Phase 3 – (March – June 2014) Soft launch of nib Options (March) using PR and search
engine marketing First cosmetic procedure booked and performed in
Thailand Consistent level of customer enquiry without full
marketing
Phase 4 (FY15) Above the line advertising and marketing campaign to
begin, as well as social media investment Expand facilities – inclusion of Malaysia and New
Zealand options Launch nib Options in New Zealand
Jun
For
per
sona
l use
onl
y

For
per
sona
l use
onl
y
For
per
sona
l use
onl
y
MAIN HEADING GOES HERE IN UPPERCASE PLEASE
Put a footer here if you need to.
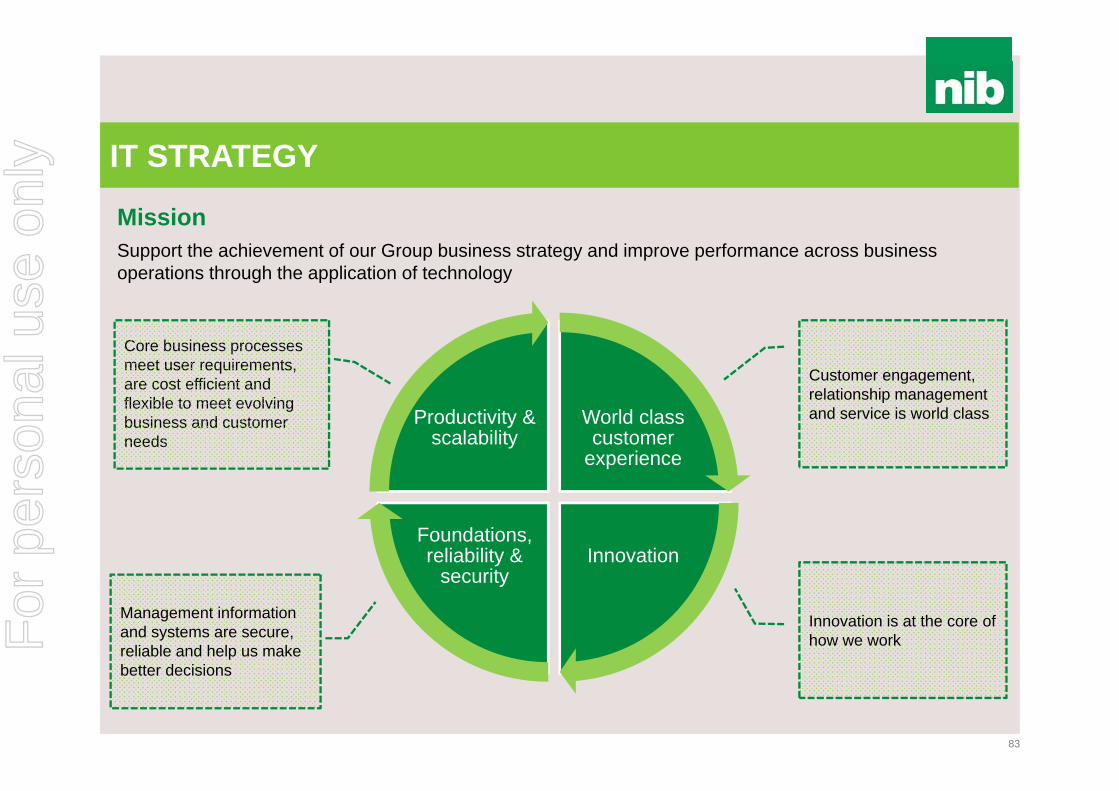
IT STRATEGY
83
World class customer
experience
InnovationFoundations, reliability &
security
Productivity & scalability
Core business processes meet user requirements, are cost efficient and flexible to meet evolving business and customer needs
Customer engagement, relationship management and service is world class
Management information and systems are secure, reliable and help us make better decisions
Innovation is at the core of how we work
MissionSupport the achievement of our Group business strategy and improve performance across business operations through the application of technology
For
per
sona
l use
onl
y

MAIN HEADING GOES HERE IN UPPERCASE PLEASE
Put a footer here if you need to.
PRODUCTIVITY & SCALABILITY
84
Hospital claims processing (electronic versus manual as a % of all claims)
Ancillary claims processing (electronic versus manual as a % of all claims)
0%
20%
40%
60%
80%
100%
Jul-08 Jan-09 Jul-09 Jan-10 Jul-10 Jan-11 Jul-11 Jan-12 Jul-12 Jan-13 Jul-13 Jan-14
Electronic Manual
• Approximately 60% of medical claims (specialists, etc) today are processed electronically (July 2008: less than 40%)
• Almost 65% of hospital claims today are processed electronically (July 2008: ~5%)
• Manual processing of medical/hospital claims now accounts for ~40% of all claims, compared to more than 70% in July 20080%
20%
40%
60%
80%
100%
Jul-08 Jan-09 Jul-09 Jan-10 Jul-10 Jan-11 Jul-11 Jan-12 Jul-12 Jan-13 Jul-13 Jan-14
Electronic Manual
• Widespread use of point-of-service claiming systems (ie HICAPS) continues to see a majority of ancillary claims processed electronically
• Online and mobile app claiming are proving popular with consumers and we have further developments in mind
For
per
sona
l use
onl
y

MAIN HEADING GOES HERE IN UPPERCASE PLEASE
Put a footer here if you need to.
Crazy birds app
Draw someth ing
Ipod
Face book
Internet
TV
Radio
Telephone
THE PACE OF TECHNOLOGY
85
Reaching 50 million users
75
38
13
4
3.5
3
50
35
years
years
years
years
years
days
days
years
Source: G. Kofi Annan/ @gkofiannan/gkofiannan.com
For
per
sona
l use
onl
y
MAIN HEADING GOES HERE IN UPPERCASE PLEASE
Put a footer here if you need to.
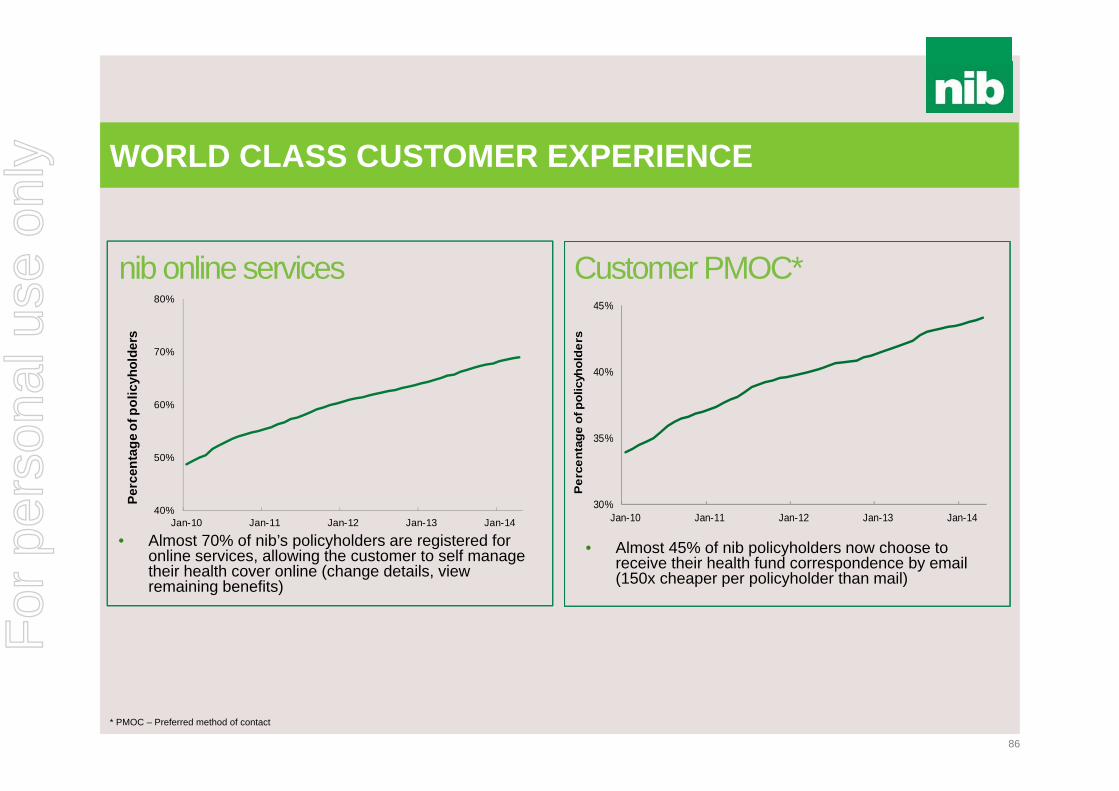
WORLD CLASS CUSTOMER EXPERIENCE
86
nib online services
• Almost 70% of nib’s policyholders are registered for online services, allowing the customer to self manage their health cover online (change details, view remaining benefits)
• Almost 45% of nib policyholders now choose to receive their health fund correspondence by email (150x cheaper per policyholder than mail)
Customer PMOC*
* PMOC – Preferred method of contact
40%
50%
60%
70%
80%
Jan-10 Jan-11 Jan-12 Jan-13 Jan-14
Perc
enta
ge o
f pol
icyh
olde
rs
30%
35%
40%
45%
Jan-10 Jan-11 Jan-12 Jan-13 Jan-14
Per
cent
age
of p
olic
yhol
ders
For
per
sona
l use
onl
y

MAIN HEADING GOES HERE IN UPPERCASE PLEASE
Put a footer here if you need to.
0
100
200
300
400
500
600
700
800
Dec-10 Dec-11 Dec-12 Dec-13
Num
ber
of d
ownl
oads
iOS Android
WORLD CLASS CUSTOMER EXPERIENCE
87
nib mobile app Customers claiming on mobiles
• Making claims from mobile devices has been embraced by nib customers
• Increase in claims from November last year due to launch of Android version of nib app and continued uptake (across all platforms)
• nib’s iOS (Apple) and Android app has been downloaded by almost 140,000 users
• On a monthly basis we currently have approximately 50,000 iOS and 5,000 Android users
Launch of iOS (LHS) Android (RHS) app
0
2,000
4,000
6,000
8,000
10,000
12,000
Sep-12 Mar-13 Sep-13 Mar-14
Num
ber o
f cla
ims
IOS Android
For
per
sona
l use
onl
y

MAIN HEADING GOES HERE IN UPPERCASE PLEASE
Put a footer here if you need to.
WORLD CLASS CUSTOMER EXPERIENCE
88
• iPad app launched throughout retail network in April 2014 to allow customers to process claims in-store
• Retail app has three main purposes:
1. Better in-store customer experience – quicker claims processing
2. Productivity gain – allows retail consultants to focus on other customer enquires (selling)
3. Channels customers to download app and transact electronically
• Early results are positive with some stores finding 20%-30% of claims being processed through retail app during peak times (11am – 2pm)F
or p
erso
nal u
se o
nly
MAIN HEADING GOES HERE IN UPPERCASE PLEASE
Put a footer here if you need to.
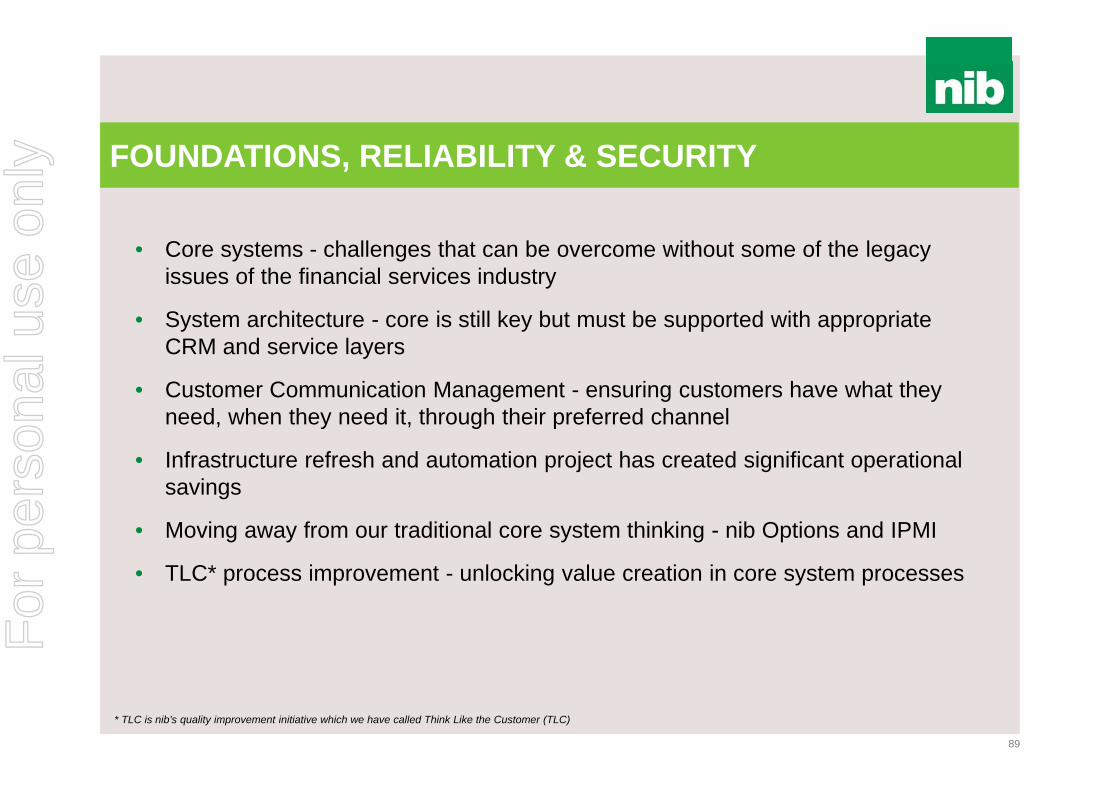
FOUNDATIONS, RELIABILITY & SECURITY
89
• Core systems - challenges that can be overcome without some of the legacy issues of the financial services industry
• System architecture - core is still key but must be supported with appropriate CRM and service layers
• Customer Communication Management - ensuring customers have what they need, when they need it, through their preferred channel
• Infrastructure refresh and automation project has created significant operational savings
• Moving away from our traditional core system thinking - nib Options and IPMI
• TLC* process improvement - unlocking value creation in core system processes
* TLC is nib’s quality improvement initiative which we have called Think Like the Customer (TLC)
For
per
sona
l use
onl
y

MAIN HEADING GOES HERE IN UPPERCASE PLEASE
Put a footer here if you need to.
FOUNDATIONS, RELIABILITY & SECURITY
90
• Building greater resiliency through technology
• The role of Agile and cross functional teams at nib
• Our innovation culture - ‘FedEx Day’ or ‘Hack Days’
• Data sovereignty - a new consideration as our business model changes
• Significant uplift in investment on security and IT risk management
• Technology and innovation changes the threat landscape including customer fraud
For
per
sona
l use
onl
y

MAIN HEADING GOES HERE IN UPPERCASE PLEASE
Put a footer here if you need to.
NEW OPPORTUNITIES - WHAT’S NEXT?
91
nib claims processing and payment in 1950s nib claims processing and payment today nib claims processing and payment tomorrow
• nib in discussion with joint venture partner
• “Incubator” style innovation centre with “start-up” mentality
• $3m investment over three years
• “Consumerisation” of IT driving customer behaviour
• Harness the development in mobile such as Apple’s iOS 8
• Focus on digital customer service channels
For
per
sona
l use
onl
y

For
per
sona
l use
onl
y
For
per
sona
l use
onl
y