Embed Size (px)
DESCRIPTION
akuntansi manajemen
Citation preview

Terms of Use
The copyright of this thesis is owned by its
author. Any reproduction, adaptation,
distribution or dissemination of this thesis
without express authorization is strictly
prohibited.
All rights reserved.

CORPORATE SOCIAL RESPONSIBILITY
AND FIRM PERFORMANCE:
EVIDENCE FROM CHINA
WONG HO YIN
MPHIL
LINGNAN UNIVERSITY
2012

CORPORATE SOCIAL RESPONSIBILITY
AND FIRM PERFORMANCE:
EVIDENCE FROM CHINA
by
WONG Ho Yin
A thesis
submitted in partial fulfillment
of the requirements for the Degree of
Master of Philosophy in Business
(Accountancy)
Lingnan University
2012
ABSTRACT
CORPORATE SOCIAL RESPONSIBILITY
AND FIRM PERFORMANCE:
EVIDENCE FROM CHINA
by
WONG HO YIN
Master of Philosophy
A series of China’s product safety scandals have recently aroused global concerns over the
business ethics and corporate social responsibility (CSR) in China. General public believe
that companies have a responsibility towards the society that goes beyond their obligation
of maximizing profits. The aims of this research are to understand the development of
CSR in China over the past few years and measure the effects of CSR on firm
performance by examining the standalone CSR reports for the period 2008-2009. The
latest data indicate that Chinese companies have been making progress in their CSR
practices. The results of this study show that the prior financial performance is positively
associated with CSR disclosure and the CSR disclosure has a significant and positive
effect on the firm financial performance in the next year.

DECLARATION
I declare that this is an original work based primarily on my own research, and I
warrant that all citations of previous research, published or unpublished, have been duly
acknowledged.
------------------------------------------
(WONG HO YIN)
12 JULY 2012


i
CONTENTS
LIST OF TABLES ……………………………………………………………………………. ACKNOWLEDGEMENT ……………………………………………………………………. CHAPTER 1 INTRODUCTION …………………………………………………………......
CHAPTER 2 CORPORATE SOCIAL RESPONSIBILITY ……………..…………........... 2.1 Overview ……………………………………………………………………………...... 2.2 Defining CSR …………………………………………………………………………... 2.3 CSR Reporting …………………………………………………………………………. 2.4 The Conceptual Framework ……………………………………………………………. 2.4.1 Shareholder Theory ………………………………………………………………. 2.4.2 Stakeholder Theory ………………………………………………………………. 2.4.3 Legitimacy Theory ……………………………………………………………......
CHAPTER 3 CSR DEVELOPMENT IN CHINA ….…………………………………….....
CHAPTER 4 CSR AND FIRM PERFORMANCE ….……………………........................... CHAPTER 5 HYPOTHESES ………………………………………………………...............
CHAPTER 6 MODELS AND VARIABLES …………………..……………………………. 6.1 Probit regression ……………………………………………………………………….. 6.2 CSR reporting ………………………………………………………………………….. 6.3 Current CSR Initiatives and Current Firm Performance ……………………………..... 6.4 Current CSR Initiatives and Subsequent Firm Performance …………………………... CHAPTER 7 SAMPLE AND DESCRIPTIVE STATISTICS……………………................ 7.1 Sample and Descriptive Statistics ……………………………………………………... 7.2 Descriptive Statistics of The Sample Companies ……………………………………... 7.3 Descriptive Statistics of CSR Initiatives ………………………………………………. CHAPTER 8 REGRESSION RESULTS…………………………………………………….. 8.1 Companies Issuing CSR reports ……………………………………………………….. 8.2 Issuance of CSR Reports ……………………………………………………………..... 8.3 Current Firm Performance ……………………………………………………………. 8.4 Subsequent Firm Performance ………………………………………………………….
CHAPTER 9 CONCLUSION……………………………………………….………………... 9.1 Discussion ……………………………………………………………………………… 9.2 Limitation of The Research ………………………………………………………….. 9.3 Recommendations for Future Studies ………………………………………………….. 9.4 Managerial Implication ………………………………………………………………… REFERENCE………………………………………………………..….….………………….
ii
iii
1
4 4 4 6 8 8 9
12
14
17
21
25 25 29 30 32
34 34 36 37
39 39 40 41 42
44 44 47 48 49
50

ii
List of Tables
Page
Table 1 Sample Companies by Industry ………………………………………….
56
Table 2 Descriptive Statistics for Sample Companies …………………………… 57 Table 3 Table 4 Table 5 Table 6 Table 7 Table 8
Results of Probit Analyses for Separate CSR Reports and Firm Characteristics of Sample Companies …………………………………... Results of Regression Analyses For CSR Report Issuance and Future Firm Performance ……………………………………………………….. Descriptive Statistics for CSR Initiatives in Separate CSR Reports…….. Results of Regression Analysis For CSR Initiatives and Current Firm Performance ……………………………………………………………... Results of Regression Analysis For CSR Initiatives and Future Firm Performance …………………………………………………………….. Hypotheses supported/ not supported ……………………………………
58
60
61
62
64
66

iii
ACKNOWLEDGMENTS
First and foremost I would like to express my immense gratitude to Dr. Suwina Cheng and
Professor Phyllis Mo for their inspiration and motivation during my MPhil study. Second, I
thank the panel examiners of my final defense: Dr. Susana Yuen, Dr. Gladie Lui, Dr. Agnes Lo
and Dr. Suwina Cheng for their valuable comments and suggestions. My special thanks go to Dr.
Suwina Cheng, who has been my supervisor in the past two academic years. As a new researcher,
I faced many obstacles, hurdles and challenges. She has been providing me with valuable advices
and comments. This study could not been completed without her patience, encouragement and
motivation. Various seminars and coursework have made my research life more fruitful and
meaningful. Thank Professor Chan Koon Hung and Dr. Suwina Cheng for their encouragement, I
attended a conference organized by the International Journal of Arts and Science in France in
May 2012. Feedbacks and advices from other scholars are useful and have enriched my research.

1
CORPORATE SOCIAL RESPONSIBILITY
AND FIRM PERFORMANCE:
EVIDENCE FROM CHINA
Chapter 1 Introduction
Recently, there have been growing concerns over corporate social responsibility (CSR).
Corporate scandals have drawn public attention to the social roles and responsibilities of
business enterprises. The general public believes that businesses have responsibilities
toward society, and companies are now under intense public scrutiny. CSR has become an
important research topic in business studies (Sweeney, 2009). In recent decades, various
studies have examined the determinants of CSR and the effects that practicing CSR has on
businesses.
The aims of this study are to understand the development of CSR in China and measure the
effects of CSR on firm performance. According to the Research Report on Corporate Social
Responsibility in China (Blue Book, 2009), CSR implementation and practice are far
behind those in other developed countries. This study provides useful information on the
early stages of China’s CSR development and address two gaps in the literature. First, this
is an empirical study focusing on CSR and its effect on firm performance in China since
the Shanghai Stock Exchange issued the “Notice on Strengthening Listed Companies’
Assumption of Social Responsibility (Shanghai CSR Notice)” and “The Guidelines on

2
Listed Companies' Environmental Information Disclosure” in 2008. CSR is usually
voluntary and companies are not mandated to implement related practices. A better
understanding of the Chinese experience would raise the awareness of CSR’s importance
and contribute to social development in China.
Second, the relationship between CSR performance and financial performance is complex
and inconclusive (Angelidis et al., 2008). Although much research on CSR in China has
been carried out recently, few studies have focused on the relationship between CSR and
financial performance. This study not only examines that relationship, but also investigates
the effects of specific socially responsible activities.
I use simple linear regression models to test the relationship between CSR performance and
firm performance in both the current and subsequent years. I investigate the effects of CSR
practices on firm performance in terms of economic profits, sales, and market returns to
provide new insights into China’s CSR development and its effect on firm performance.
Specifically, this study is driven by the following objectives.
Objective one - To investigate the characteristics of companies that are more likely to
issue a standalone CSR report. Although there has been a significant growth in the number

3
of companies issuing CSR reports, the percentage in China is still low considering the size
of the country and the number of organizations. CSR awareness in the business community
and the general public is low (Blue Book, 2009). A better understanding of the Chinese
companies that publish separate CSR reports may help to promote the practice.
Objective two - To explain the relationship between CSR contributions and firm
performance. While numerous studies have investigated this relationship, the results are
inconclusive. This study examines the relationship between these two sets of variables in a
Chinese context. The findings not only pertain to financial performance, but also to sales
and market performances, providing comprehensive insights into the CSR concerns
expressed by stakeholders, particularly shareholders and customers.
The remaining chapters are arranged as follows - In Chapter 2, CSR is defined and CSR
reporting is discussed. In Chapter 3, CSR development in China is addressed. In Chapter 4,
the literature on the relationship between CSR and financial performance is reviewed. In
Chapters 5 and 6, hypotheses are developed and the research method is illustrated. In
Chapter 7, sample and descriptive statistics are reported. In Chapters 8 and 9, findings and
conclusions are presented.

4
Chapter 2 Corporate Social Responsibility
2.1 Overview
Some businesses have generated profit without considering their social responsibilities. The
general public expects more of business enterprises; they expect companies to contribute to
society, not just maximize profits. In response to supply chain pressure, stakeholder
engagement (The Institute of Chartered Accountants, 2004), and wider media coverage
(LRQA, 2010), companies are now seeking to improve their sustainability performance and
become socially responsible for pragmatic reasons.
2.2 Defining CSR
The terms corporate social responsibility (CSR) and corporate citizenship are used
interchangeably (The Institute of Chartered Accountants, 2004). CSR is a broad and
complex concept with several definitions. Broadly, CSR is a business’s contribution to
sustainable development (United Nations, 2007) by meeting the needs of the present
without sacrificing the ability to meet those of the future (The Institute of Chartered
Accountants, 2004).
CSR also allows companies to voluntarily integrate social and environmental concerns into
their business operations and their interactions with stakeholders (European Commission,

5
2002). It extends beyond legal compliance, and companies are encouraged to voluntarily
implement CSR initiatives to address various stakeholder needs.
Businesses engage in CSR activities on a discretionary basis. Viewing CSR as a strategic
marketing tool (Qu, 2007) gives them a competitive advantage in the market that may make
them more capable of responding to public expectations and fulfilling their social and
environmental responsibilities. As a result of these activities, businesses develop a better
public image (Lancaster, 2004), which can help companies attract more customers (Ruf et
al., 1998) and better employees (Gatewood et al., 1993).
In contrast, if businesses do not perceive the value or benefits of CSR, they may take an
obstructive stance toward social responsibility, i.e., their behavior will not meet public
expectations (Fischer, 2004). These companies follow Milton Friedman’s argument (1970)
that, the sole and primary goal of a business is “to make as much money as possible while
conforming to the basic rules of the society.” As CSR activities do not directly generate
returns for businesses, their contributions are sometimes deemed to be a misallocation of
funds and may lead to objections from shareholders.

6
2.3 CSR reporting
Corporate Social Responsibility reporting (CSR reporting) helps to convey information
about businesses’ CSR initiatives to stakeholders and society. It also reflects their vision,
values and personalities. Through CSR reports, stakeholders are able to assess a company’s
reputation. Therefore, CSR reporting has become a mechanism for promoting business
values. According to Craib and PwC (2010), it has “become critical to a company’s
credibility, transparency, and endurance.”
CSR reporting can reduce information asymmetry between companies and their
stakeholders. As Generally Accepted Accounting Principles (GAAP) disallow the
recognition of intangible assets related to sustainability in financial statements, human and
social capital cannot be adequately included in statement of financial position (The Institute
of Chartered Accountants, 2004). Consequently, financial statement users may
underestimate a firm’s value. In practice, CSR reports can help fill this information gap.
For example, some companies recognize the net present value of future carbon liabilities
and social and human capital in the stand-alone CSR reports, which allow users to assess
the effects of CSR performance on firm performance (The Institute of Chartered
Accountants, 2004).
7
If CSR reporting is of high quality, stakeholders are provided with reliable and relevant
CSR information that helps to close the information gap between the companies and
stakeholders (The Institute of Chartered Accountants, 2004). Therefore, quality CSR
reporting increases a company’s reputation and strengthens its competitiveness.
However, companies in emerging markets do not fully recognize its importance.
According to Alon et al. (2010), Chinese listed companies are less communicative about
CSR issues than companies in other developing countries, such as Brazil, Russia, and India.
Neither Chinese companies nor their stakeholders are aware of the importance of CSR. As
most Chinese companies pursue profit maximizing activities, CSR initiatives may not be
fully reported and communicated to the public. If the CSR information, particularly that
pertaining to stakeholders’ information needs, is not comprehensively presented, then the
value of publishing stand-alone CSR reports is reduced. This proposition is in line with
Vurro and Perrini’s (2011) argument that relevant CSR information helps stakeholders to
differentiate between socially responsible and irresponsible companies in emerging
economies. Vurro and Perrini investigate the companies in the Fortune Global 100 and
confirm that the breadth of CSR disclosure is related to CSR performance, but they reject
the proposition that CSR depth is related to CSR performance. Their findings show that the
“best social performers from emerging economies are more likely to broaden the disclosure

8
beyond the narrow set of critical areas” (Vurro and Perrini, 2011).
CSR reporting is governed by a third-party standard but the adoption remains voluntary
(Vurro and Perrini, 2011). To enhance the credibility of CSR information, CSR reports
should be prepared using the Global Reporting Initiative (GRI) guidelines. GRI guidelines
include 13 economic indicators, 35 environmental indicators and 49 social indicators. To
further improve the credibility of CSR reports and build stakeholder confidence, the reports
should be verified by independent auditors.
2.4 The conceptual framework
The specific nature of companies’ social responsibilities is controversial. Classical
economists argue that companies are only responsible for their shareholders’ needs,
whereas other scholars argue that corporate responsibilities extend to all stakeholders.
2.4.1 Shareholder theory
According to the shareholder theory, the goal of companies is to maximize shareholders’
wealth. Following Milton Friedman (1970), the sole responsibility of companies is to
“make as much money as possible while conforming to the basic rules of the society, both
those embody in law and those embody in ethical custom.” As a company is deemed to be a
vehicle for creating wealth for those who risk capital (Greenwood, 2001), maximizing

9
profit is necessary for its survival. As managers have agency relationships with
shareholders, they have a fiduciary duty to maximize profit (Friedman, 1970) and will only
undertake projects that have a positive financial value.
Therefore, CSR initiatives may lead to objections from shareholders. According to Ruf et al.
(1998), CSR contributions are outflows of economic resources that cannot create wealth for
shareholders. From the standpoint of the shareholders, CSR contributions ruin their
investment. However, shareholder theory does not prohibit CSR contributions that create
value (Sweeney, 2009). In this case, the cost-benefit principle dictates a firm’s CSR
considerations, including contributions and disclosure. Under the shareholder theory, CSR
is justified if the related future income is expected to be higher than the current associated
costs.
2.4.2 Stakeholder theory
Freeman (1984) argues that companies’ responsibilities are not limited to shareholders, but
encompass their stakeholders, groups of people who can affect or be affected by the
companies, such as employees, customers and financiers. As stakeholders can contribute to
a company’s wealth capacity (Post et al, 2002), to sustain growth, companies should
prioritize stakeholders’ interests (Van der Laan, 2009) and take their perspectives and
activities into consideration. In this case, CSR disclosure is used as a means of displaying

10
company accountability (Van der Laan, 2009).
The underlying argument has two strands. First, stakeholders provide the resources, such as
capital, labor and revenue (Sweeney, 2009). If companies act irresponsibly toward
employees, customers, and society, then they risk losing these critical resources. Second,
stakeholders are both potential beneficiaries and risk bearers (Post et al., 2002). They are
exposed to risks associated with socially irresponsible behavior, such as poor quality
products or exploitation of labor and the natural environment. According to the distribution
justice principle (Sweeney, 2009), firm’s profit should be divided among all of the risk
takers, including stakeholders.
Metcalfe’s (1998) sub-classification of stakeholders into primary and secondary has helped
to clearly define this concept. Primary stakeholders are those whose participation is critical
to a company’s operation, e.g., customers, employees, and shareholders. Secondary
stakeholders are people who affect or are affected by a company’s activities, but are not
engaged in company transactions, e.g., the media (Metcalfe, 1998). This distinction
clarifies the determinants of CSR initiatives.
Stakeholder theory can be broken into three parts: descriptive, normative, and instrumental
11
(Donald and Preston, 1995). The first is the description of the specific characteristics of
responsible companies. The second is the justification for the actions taken by the company
based on the moral guidelines (Donald and Preston, 1995). The third is the connection
between the stakeholder approach and the desired outcome (Donald and Preston, 1995). It
examines the link between CSR performance and firm performance, contributing to the
understanding of the instrumental part of this theory.
Stakeholder theory is used to explain the motivations for CSR reporting. Roberts (1992)
uses stakeholder theory to analyze the determinants of CSR disclosure using logistic
regression. He examines the link between CSR disclosure and stakeholder power, and a
firm’s strategic posture and past economic performance respectively. Specifically, he uses
percentage of ownership, donations to political parties and leverage ratio as proxies for
stakeholder power, and the number of public affairs staff and philanthropic foundations as
proxies for strategic posture. In addition, he uses stock-market and accounting-based
measures to test the effect of economic performance in the previous year on a firm’s
decision regarding CSR disclosure in the current year. As the information on the proxies for
stakeholder power and firms’ strategic posture are difficult to obtain from Chinese firms,
this study focuses on testing the relationship between economic performance and the
publication of CSR reports.

12
2.4.3 Legitimacy theory
Legitimacy theory is also commonly used to explain the motivations for CSR reporting
(Van der Laan, 2009). It states that “the actions of an entity are desirable, proper, or
appropriate within some socially constructed system of norms, values, beliefs and
definitions” (Suchman, 1995). Accordingly, companies are required to match their behavior
to social expectations.
However, legitimacy gaps are common when corporate performance does not match
stakeholders’ expectations. According to the Blue Book (2009), nearly half of all
stakeholders believe that Chinese listed companies do not show enough concern for the
natural environment, their employees, or their customers. Therefore, a company may use
CSR disclosure to seek legitimacy from its stakeholders and to fill in the gap between
expectation and reality by “demonstrating the appropriateness of its output, methods, or
goals through education and information.” (Dowling and Pfeffer, 1975; Lindblom,1993).
As a result of these issues, there has been a sharp increase in the number of CSR reports
since 2007. In 2007, 38 CSR reports were released in China, compared with the 582, in
various forms,released in 2009, compared with that of 38 in 2007 (China WTO Tribune,
2009). This may reflect companies’ perceptions that CSR reports are a legitimacy device to
align stakeholders’ perceptions of a company with their expectations of good corporate

13
behavior (Vurro and Perrini, 2011).
Based on the above discussion, I argue that companies use CSR to discharge accountability
and legitimize business operations.

14
Chapter 3 CSR Development in China
Public awareness of CSR in China was low before the mid-2000s. A series of corporate
scandals in the 2005-2007 period raised awareness of business ethics and CSR. The food
safety and counterfeit product scandals led investors and the public to lose confidence in
the companies involved, and this was reflected in the drop in the companies’ stock prices
and a sharp decrease in sales revenues. As a result, many Chinese companies now
recognize the business risks associated with social obstruction and have changed their
attitudes toward CSR.
A series of product safety incidents involving food and other products have drawn
considerable public attention, leading to rising concerns over businesses’ social
responsibilities. The Chinese government and the general public now have higher
expectations of Chinese companies’ CSR performance. According to the Blue Book (2009),
nearly 96% of customers claim that they intend to purchase products from socially
responsible companies and 90% of investors claim that they would not invest in companies
with a negative image.
Despite increasing emphasis on CSR in China, it remains far below social expectations.
According to the report “Research Report on Corporate Social Responsibility of China”
15
issued by the Social Policy Research Center of the Chinese Academy of Social Science and
the Social Science Academic Press in 2009 (Blue Book, 2009), the CSR performance of the
top 100 Chinese listed companies, measured in terms of responsibility management, market
responsibility, social responsibility and environmental responsibility, is far below the
international standard. The average score for Chinese enterprises is 31 out of 100 points.
About one-fifth of the companies do not have a sound CSR system. Furthermore, many
Chinese companies have little awareness of CSR and that the CSR practiced by Chinese
firms is of low quality.
Commenting on China’s CSR at APEC 2009, the Chinese President, Hu Jintao, said,
“Enterprises should become aware of global responsibility, voluntarily include social
responsibility in their business strategy, optimize business model and seek harmony
between economic and social benefits.” With strong encouragement from the Central
Government, China has begun promoting CSR awareness (LRQA, 2010). Attempting to
make state-owned enterprises role models for society, the State Asset Supervision and
Administration Commission guidelines, issued in 2008, encourage state-owned enterprises
to assume responsibility for their stakeholders, society, and the natural environment
(SynTao, 2008).
Also in 2008, the Shanghai Stock Exchange (SSE) issued a “Notice on Strengthening

16
Listed Companies’ Assumption of Social Responsibilities” and the “Guidelines on Listed
Companies’ Environmental Information Disclosure” to encourage listed companies to
undertake CSR initiatives and to disclose CSR information to the public. In response to
pressure from the government and stakeholders, more companies have published their first
stand-alone report; they believed these reports are legitimacy devices designed to promote
alignment with stakeholder perceptions and expectations. According to the Development
Center for Chinese CSR and the China WTO Tribune (2009), there were 582 CSR reports
in various forms, released in 2009, which is 3.44 times more than were released in 2008.
However, these reports were below international standards; only 2.2% were in both
Chinese and English, 7.8% were prepared according to international guidelines, and 6.1%
were audited.

17
Chapter 4 Corporate Social Responsibility and Firm Performance
The PricewaterhouseCoopers 6th Annual Global CEO Survey (2003) examines prospects
for economic growth, efforts to rebuild public trust, and corporate social responsibility
issues. They survey 1000 CEOs from 43 countries, 79% of whom agree that sustainability
is important to the profitability of any company. Numerous studies have explored the
relationship between CSR and firm performance. However, the findings are inconclusive.
Roman et al. (1999) review 46 studies focusing on the CSR-performance relationship and
find that 63% demonstrate a positive relationship, 10% confirm a negative relationship, and
the rest of the results are inconclusive.
Davis (1973) argues that companies supporting CSR activities can capture a favorable
public image, which helps to attract customers and better employees; in the long-run, this
serves the interests of the companies. In contrast, irresponsible companies may acquire an
unfavorable public image that, in turn, devaluates the companies’ products (Roberts, 2003).
Therefore, public image is a major determinant of firm profitability and success.
To increase profitability, a company can either increase its revenue or reduce its costs.
Some studies have suggested that adopting CSR helps to develop a good business image
that can result in higher sales. Webster (1975) finds that customers consider the social

18
consequences of companies’ actions during purchase acts. In China, 96.6% of customers
intend to purchase from socially responsible companies (Blue Book, 2009). In addition,
other studies have contended that CSR initiatives aid businesses by reducing costs. Epstein
and Roy (2001) report that CSR not only reduces various costs, it also promotes efficiency
in the use of resources. Friedman and Miles (2001) argue that engaging in CSR activities
can reduce the waste and the associated treatment costs. Moreover, productivity can be
enhanced by implementing energy conservation and other environmental friendly programs.
McWilliams and Siegal (2001) also mention that CSR can reduce social and environment
costs, so as to increase corporate profit.
From the economic point of view, if the benefits associated with CSR are higher than the
costs incurred, companies are more willing to make CSR commitments.
The complex relationship between CSR and firm performance has attracted a great deal of
interest from academia. Lin et al. (2009) investigate 1000 Taiwan cases of long-term R&D
expenditures and find that CSR does not have much positive effect on short-term financial
performance, but that it significantly influences a firm’s long-term performance. However,
other researchers contend that CSR expenditure decreases a firm’s resources in the short
term and that companies with good previous financial performance (i.e., resources) are

19
more likely to initiate the socially responsible activities (Scholtens, 2008; McGuire et al.,
1988). McGuire et al. (1988) evaluate both the market and accounting returns, and report
that previous performance is more closely related to CSR than subsequent performance.
Scholtens (2008) applies simple OLS with distributed lags and Granger causation tests in
his study and finds that financial performance precedes social performance. From a
business perspective, the CSR will precede financial performance if it is seen as a strategic
marketing tool (Qu, 2007) that helps to expand a firm’s market share in the short run. In
contrast, the financial performance will precede CSR if it is treated as a long term
investment that enhances the company’s sustainability.
The Chinese government’s increasing involvement in CSR has propelled its development
in China since 2008. Recent CSR research has focused on Chinese corporations, but very
little effort has been made to evaluate the relationship between CSR and firm performance
in China. Cheung et al. (2012) construct a CSR index to measure the quality of CSR
practices in 100 major Chinese listed companies. Their results show that Chinese
companies, the overseas-listed and more profitable companies in particular, improved their
CSR practices in the 2004-2007 period, and the market rewarded these improvements.
Chen and Wang’s study (2011) assesses the association between CSR and financial
performance by surveying 141 Chinese firms over the 2007-2008 period. They note that

20
variations in CSR and financial performance influence each other significantly, and that
CSR activities can both improve the performance in the current year and have a significant
relationship with the performance in the coming year.

21
Chapter 5 Hypotheses
Previous research on CSR disclosure suggests that CSR disclosure decisions are associated
with a firm’s profitability (Brammer and Pavelin, 2008). Profit is an essential source of
funding for the publication of stand-alone reports (Brammer and Pavelin, 2008;
Gamerschlag et al., 2011). Therefore, only profitable firms can afford to issue stand-alone
reports. Moreover, according to the political cost theory (Watts and Zimmerman, 1986),
large companies are more likely to attract the attention of the government and stakeholders
because of their significant market power. To avoid provoking a negative public image
(Reverte, 2009), profitable firms have stronger incentives to disclose CSR information than
less profitable firms (Bewley and Li 2000). Based on these arguments, the following
hypothesis is developed.
Hypothesis 1: There is a positive association between firm performance in year t and
the publication of a CSR report in year t+1.
The stockholder theory holds that, “There is one and only one social responsibility of
business to use its resources and engage in activities designed to increase its profits so long
as it stays within the rule of game,” (Friedman, 1970). Profit is the sole motivation for any
business behavior, including CSR reporting and initiatives. CSR reporting creates

22
additional costs and, as a result, reduces profit. Companies may not be willing to invest
their resources in CSR reporting. However, if companies perceive that CSR reporting helps
generate future profit and that the future income exceeds the current associated costs, they
may publish stand-alone CSR reports. In this case, it is assumed that the publication of
CSR reports will lead to better firm performance. This argument is derived from Vurro and
Perrini’s study (2011), which reveals that the breadth of CSR disclosure is associated with
better current CSR performance, and Chen and Wang’s study (2011), which reveals that
CSR performance influences firm performance in both the current and subsequent years. As
stakeholders are important resource providers for Chinese listed firms, companies are
motivated to publish stand-alone CSR reports, which serve as legitimacy tools to align
stakeholder perceptions and expectations (Vurro and Perrini, 2011). As stakeholders favor
companies with legitimate and appropriate disclosure and reporting(Vurro and Perrini,
2011), the publication of a CSR report may result in a more favorable image. A better
corporate image may eventually translate into better firm performance. Based on the
foregoing discussion, I develop the following hypothesis.
Hypothesis 2: There is a positive association between the publication of a CSR report
in year t and firm performance in year t+1.

23
The PwC’s survey (2003) indicates that 79% of CEOs agree that CSR performance is
important to firm performance. Based on stakeholder theory, managers conduct CSR
initiatives to “gain their [stakeholders] support and approval; or to distract their opposition
or disapproval” (Gray et al., 1996) if they value stakeholders’ resources (Ullmann, 1985).
This may translate into higher sales and lower operating costs. This proposition is based on
Webster’s (1975) argument that customers consider the social effect of companies’ actions
when making purchasing decisions, and on the studies by Epstein and Roy (2001),
Friedman and Miles (2001), and McWilliams et al.’s (2001), which suggest that CSR
reduces various costs including wastage, treatment and environmental costs. Therefore,
companies are motivated to undertake different forms of CSR initiatives that will have
different effects on firm performance. Moreover, Chen and Wang’s (2011) survey of 141
Chinese firms confirms that CSR activities can improve firm performance in both the
current year and subsequent years respectively. I therefore propose the following two
hypotheses about the effect of current CSR practices on performance in the current and
subsequent years.
Hypothesis 3: There is a positive association between CSR performance in year t and
firm performance in year t.

24
Hypothesis 4: There is a positive association between CSR performance in year t and
firm performance in year t+1.

25
Chapter 6 Models and Variables
Four regression models are formulated to test the relationship between CSR reports and
firm performance.
6.1 Probit regression
The following probit regression model is developed to examine the characteristics of SSE-
listed firms that are more likely than others on the SSE to issue stand-alone CSR reports.
Issuet+1 = β0 + β1 ROAt + β2 Mktt+ β3 %∆Salet + β4 TobinQt+ β5 LnAssett
+ β6 D/Et + β7 SOEt +β8 FIt + β9 Issuet+ β10Yeart+ β11 Industryt + ε (1)
The dependent variable (Issuet+1) is a dummy variable that measures whether a company
would issue a standalone CSR report in the subsequent year; it takes the value of 1 if the
company issues a stand-alone CSR report during year t+1, and otherwise 0. Publishing a
CSR report increases a company’s costs in the current year; it is likely that companies with
richer resources are more willing to issue CSR reports. I expect that firms with better
performance in year t are more likely to issue stand-alone CSR reports in year t+1.
The independent variables are return on assets (ROAt), market return (Mktt), percentage

26
change of sales (%∆Salest) and Tobin’s Q (TobinQt). Return on assets (ROAt) is a
profitability ratio, measured by profit after tax divided by total assets. Companies with a
higher ROA in year t are more likely to issue CSR reports in the subsequent year. Therefore,
I predict that there is a positive association between the dependent variable (Issuet+1) and
returns on assets (ROAt).
Market return (Mktt) is an independent variable that is used to test the relationship between
market performance and the issuance of stand-alone CSR reports. The variable is calculated
as the change in share prices plus the cash dividend in the current year, divided by the
beginning share price. Shareholders expect to maintain a constant growth rate in a share
return, and companies are thus under pressure to improve the share prices. In addition to
profitability, companies may need to promote their images and reputations so as to increase
both the trading volume and stock price. Therefore, I predict that there is a positive
association between the dependent variable (Issue t+1) and market return (Mktt).
Percentage change of sales (%∆Salest) is used to measure the relationship between the sales
performance and the issuance of separate CSR reports. The variable is calculated as the
difference in sales in a year divided by sales in the previous year. Companies with an

27
increase in sales revenue in year t are more likely to issue CSR reports in the subsequent
year, as sales revenue from operating activities may eventually lead to higher cash flows.
Therefore, companies can better afford to pay the preparation costs. Based on the above
discussion, I predict that there is a positive association between the dependent variable
(Issuet+1) and change of sales (%∆Salest).
Finally, the model also analyzes the relationship between Tobin’s Q (TobinQt) and the
issuance of separate CSR reports. Tobin’s Q is the market-perceived net worth of a
company and calculated as the total market value divided by total asset value. A higher
Tobin’s Q ratio corresponds to a high perceived market value of the company. A higher
market to book ratio implies that intangible assets may not be recognized in the books.
Thus, companies with higher Tobin’s Q are motivated to voluntarily disclose the
information associated with intangible assets (i.e. human capital). It is predicted that there
is a positive association between the dependent variable (Issuet+1) and Tobin’s Q (TobinQt).
Previous studies show that there are significant relationships between the publication of
CSR reports and firm size, leverage, shareholdings and firm performance respectively. To
control for these different effects, several control variables are included in the regressions.
According to Roberts (1992), large and profitable firms are more likely to disclose CSR

28
activities, as more shareholders are interested in corporate socially responsibility activities.
There is also a positive correlation with company size and CSR activity (Robert, 1992). In
particular, large firms may have more onsite resources to support their extra activities than
small firms. The variable of total assets (LnAssett) is used to control for the firm size.
Three variables, leverage (D/Et), percentage of state-owned shares (SOEt) and foreign
investment (FIt), are used to control for the influence of capital structure on a company’s
decision. Leverage (D/Et) is measured by dividing the total debts by total shareholders’
equity. Percentage of state-owned shares (SOEt) is calculated by dividing the number of
state-owned shares by the total outstanding shares of the company. The numbers of “state-
owned shares” (Numerator) and “outstanding shares” (Denominator) are extracted from the
CSMAR database. Foreign investment (FIt) is a dummy variable that takes the value of 1 if
the company’s shares can be purchased by foreign investors on either the Shanghai or
overseas market, and otherwise 0. The rationale for the inclusion of FIt is that foreign
investors may bring in better internal control systems and new management methods that
could affect management decisions on CSR initiatives (Chan et al., 2010). Issuet is used to
control for the influence of the same disclosure practice in the previous year, as companies
are likely to follow the practices from the previous year. Industryt controls for the effects of
industry, as industry characteristics, including intensity of competition, legal risks, and
29
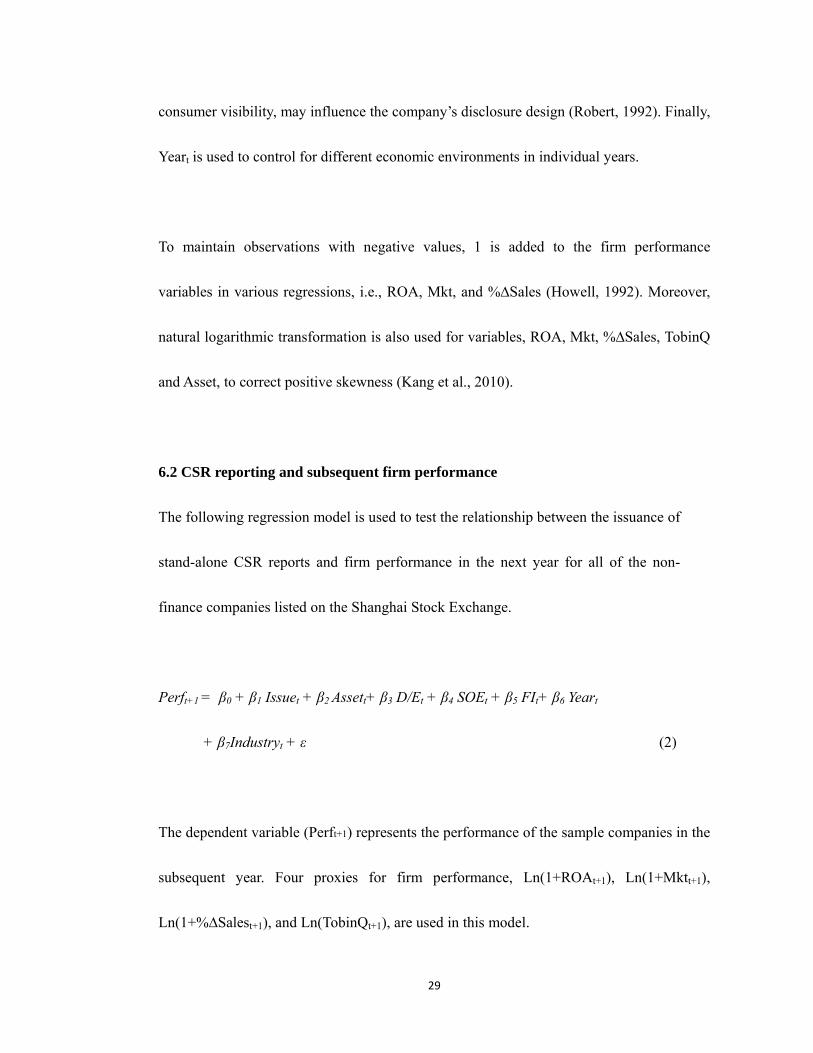
consumer visibility, may influence the company’s disclosure design (Robert, 1992). Finally,
Yeart is used to control for different economic environments in individual years.
To maintain observations with negative values, 1 is added to the firm performance
variables in various regressions, i.e., ROA, Mkt, and %∆Sales (Howell, 1992). Moreover,
natural logarithmic transformation is also used for variables, ROA, Mkt, %∆Sales, TobinQ
and Asset, to correct positive skewness (Kang et al., 2010).
6.2 CSR reporting and subsequent firm performance
The following regression model is used to test the relationship between the issuance of
stand-alone CSR reports and firm performance in the next year for all of the non-
finance companies listed on the Shanghai Stock Exchange.
Perft+1 = β0 + β1 Issuet + β2 Assett+ β3 D/Et + β4 SOEt + β5 FIt+ β6 Yeart
+ β7Industryt + ε (2)
The dependent variable (Perft+1) represents the performance of the sample companies in the
subsequent year. Four proxies for firm performance, Ln(1+ROAt+1), Ln(1+Mktt+1),
Ln(1+%∆Salest+1), and Ln(TobinQt+1), are used in this model.
30
Their measurements are very similar to those in the probit model; however, performance in
the previous year is measured in the probit regression, whereas performance in the coming
year is measured in this regression. The sole independent variable (Issuet) denotes whether
the company issues a stand-alone report in the current year; it takes a value of 1 if a CSR
report is issued in year t, and otherwise 0. Companies with better CSR performance are
more likely to use a stand-alone report to promote their reputation and image. Consequently,
CSR reports may have a positive influence on firm performance. Therefore, it is predicted
that there is a positive association between the issuance of CSR reports in year t and firm
performance in the year t+1.
As in the probit model, several control variables (LnAssett, D/Et, SOEt, FIt, Yeart and Indt),
are used in the regression to control for the effects of size, leverage, capital structure, year,
and industry.
6.3 Current CSR initiatives and firm performance
The following regression is used to assess the relationship between the individual CSR
activities in year t and firm performance in the same year for firms issuing stand-alone
reports in 2008 and 2009.

31
Perft = β0 + β1 Areat + β2 Expt+ β3 Assett + β4 D/Et +β5 SOEt + β6 FIt+ β7 Yeart
+ β8 Industry t + ε (3)
The dependent variable (Perft) in this regression represents the performance of the
company in year t. It is operationalized as return on assets (Ln(1+ROAt)), market return
(Ln(1+Mktt)), percentage of change of sales (Ln(1+(%∆Salest)), and Tobin’s Q
(Ln(TobinQt)).
The independent variables are Areat, which represents the company’s concerns for
employees, customers, suppliers, the general public and pollution, and Expt, which is the
company’s monetary contributions to the areas of disaster relief, infrastructure, poverty,
education, charity, arts, welfare, environment, and employee welfare. Areat and Expt are
used to capture the effect of individual CSR initiatives on firm performance. In the
regression, Areat is used to measure socially responsible endeavors that cannot be
expressed in a specific monetary value and Expt is used to measure socially responsibile
endeavors that can be expressed in pecuniary terms. To assess company’s concerns for
different stakeholders, I examine the CSR reports to identify whether the company has
committed to or contributed to any of the above areas. Five dummy variables (Employeet,
Customerst, Suppliert, Publict, and Pollutiont) are constructed, and each takes the value of 1

32
if the company has made commitments in the area and otherwise 0. Expt measures the
amounts donated or used in different areas including disaster relief, infrastructure, poverty,
education, charity, arts, welfare, environment, and employees welfare. Nine variables
(E_Disasterst, E_Infrastructuret, E_Povertyt, E_Educationt, E_Charityt, E_Artt,
E_Environmentt, E_Employeet, and E_Otherst) are created to reflect the spending in each
area. For standardization purposes, I divide each amount by the company’s sales.
The model in this section includes the same control variables as regressions (1) and (2).
6.4 Current CSR initiatives and subsequent firm performance
The following regression is used to test the relationship between the individual CSR
activities in year t and firm performance in year t+1 for companies issuing CSR reports
during the sample period.
Perft+1 = β0 + β1 Areat + β2 Expt+ β3 Hont + β4 GRIt + β5 Audt + β6 Assett
+ β7 D/Et +β8 SOEt + β9FIt+ β10Yeart + β11Industryt + ε (4)
Following the previous regression model, the dependent variable is firm performance. As in
regression (3), very similar proxies for firm performance, Ln(1+ROAt+1), Ln(1+Mktt+1),

33
Ln(1+(%∆Salest+1), and LnTobinQt+1, are used. The only difference is that equation (3)
measures the performance in the current year, whereas equation (4) in this section assesses
the performance in the subsequent year. Equation (4) also examines the same independent
variables, Areat and Expt, as equation (3).
Three new independent variables, Hont, GRIt, and Audt, are introduced in the regression to
assess firms’ significant contributions and the quality of the separate reports. These
variables are not included in equation (3) as the annual CSR information is not available
until the subsequent year. Therefore, performance is less likely be affected by Hont, GRIt,
and Audt in the same year. The variable Hont is a proxy for CSR contributions and it
represents the number of awards received by the company for outstanding CSR
performance in the areas of environment (H_Environment, charity (H_Charityt), employee
welfare (H_Employeest), and areas other than the above (H_Otherst) in year t. GRIt and
Audt are variables that measure the quality of the reports and control for the effect of
disclosure structure and the quality of released CSR information (Dando and Swift, 2003).
GRIt is a dummy variable indicating whether the report is prepared following the GRI
guidelines; it takes the value of 1 if followed, and otherwise 0. Audt is also a dummy
variable denoting whether the report is audited by independent assurer, either an auditor or
environmental expert; it takes the value of 1 if audited, and otherwise 0.

34
Chapter 7 Sample and Descriptive Statistics
7.1 Sample and data collection
There has been a sharp increase in the number of stand-alone CSR reports since the
Shanghai Stock Exchange issued “A Notice on Strengthening Listed Companies’
Assumption of Social Responsibilities” and “The Guidelines on Listed Companies’
Environmental Information Disclosure” in 2008. These CSR reports provide the data for
this study.
The sample in this study consists of non-finance companies listed on the Shanghai Stock
Exchange in 2008 and 2009. As all finance companies are required to issue stand-alone
CSR reports, the inclusion of finance companies in the sample may lead to a
misinterpretation of the voluntary nature of CSR disclosure in other industries and the link
between CSR initiatives and firm performance. Therefore, financial institutions are
excluded from the final sample. To test the lag effect, I also collect the relevant
performance data for 2009 and 2010. To be included in the sample, companies’ financial
information must be available in the China Securities Market Research Database (CSMAR).
Companies traded on the Shenzhen Stock Exchange are not considered in this study
because regulatory rules and CSR guidelines in these two exchanges are not comparable for
the period under investigation.

35
To measure the CSR performance, I obtain the CSR reports from the China Sustainability
Reporting Resource Center website, which is owned by the Center for Environmental
Education and Communications (CEEC) of the State Environmental Protection
Administration (SEPA) of China and Syn Tao. The former is a governmental body that
promotes environmental publicity and the latter is a consulting company that promotes
CSR in China. The Chinese names of the listed companies are input into the website during
in the search for stand-alone CSR reports. .
To test H1, 1661 firm-year observation for the 2008-2009 period are input into the probit
regression. During the probit regression analysis, 79 observations are dropped by the
program due to missing data problems. When running equation (2), a further 73, 72, 76 and
74 observations are dropped from panels A, B, C and D, respectively, due to further
missing data problems.
To test H2 and H3, 388 firm-year observations, including only companies issuing stand-
alone CSR reports, are used. When running equations (3) and (4), 15 and 2 observations are
dropped from panel D in each equation due to missing data problems.
Table 1 presents the distribution of the total observations by year and by industry. There are

36
825 observations for 2008, and 836 for 2009.
[INSERT TABLE 1 HERE]
Table 1 shows the number of companies issuing stand-alone reports by year and by industry.
There are 183 observations in 2008 and 205 in 2009, making up 22.18% and 24.52% of the
total observations in 2008 and 2009, respectively.
7.2 Descriptive statistics of the sample companies
Table 2 summarizes the descriptive statistics for the sample companies traded on the
Shanghai Stock Exchange and companies issuing separate CSR reports in 2008 and 2009.
The statistics for the full sample are listed below, with those for the sub-sample in
parentheses. The means value for all companies (for companies issuing separate CSR
reports) are as follows: return on total assets 37.6% (7%), market return 41.7% (35.4%),
change in sales 18.6% (14.9%) and Tobin’s Q ratio 2.297 (1.61).The statistics show that
companies issuing stand-alone CSR reports have relatively low financial and market
performances.
[INSERT TABLE 2 HERE]

37
Table 2 shows that the average total asset value is RMB11932 million (RMB 20000
million), leverage is 1.818 (2.585), proportion of state-owned equity is 17% (18.5%) and
foreign investment is 4.55% (9%) for all of the companies (for companies issuing separate
CSR reports). The results show that companies issuing stand-alone CSR reports own assets
of higher value and have higher leverage. Specifically, they have a 67% higher asset value
than the value in the full sample and higher risk in terms of leverage. As for the equity
structure, the sub-sample has a higher proportion of state-owned equity and foreign
investment.
7.3 Descriptive Statistics of CSR initiatives
Table 5 summarizes the descriptive statistics for the CSR initiatives that are tested in
regressions (3) and (4). As shown in Table 5, companies listed on SSE do not show equal
concerns for all primary stakeholders. Whereas 93% and 84% of the companies are
concerned about their employees and customers, respectively, only 28% of the companies
show concern for their suppliers.
[INSERT TABLE 5 HERE]
Table 5 also shows that companies underspend on social programs and activities. An

38
average of 0.1% of total revenue is spent on environmental protection compared with
0.051% and 0.055% on disaster relief and employee improvement, respectively. The
expenditure on infrastructure is even less and amounts to less than 0.03% of total revenue.
Social awards reflect a company’s contribution in all of the different areas. The average
number of awards companies received recognizing their contributions to environmental
protection, charity, and employee welfare are 0.43, 0.21 and 0.22, respectively.
In terms of reporting quality, only 5% of the CSR reports are prepared following the Global
Reporting Initiative (GRI) framework and 3% are audited by independent assurers. This
shows that the CSR reports in China do not conform to generally accepted international
standards.

39
Chapter 8 Regression results
8.1 Companies issuing CSR reports
This section examines the characteristics of companies issuing stand-alone CSR reports.
Table 3 reports the results of the probit regression analysis for equation (1) where the
dependent variable (Issuet+1) takes the value of 1 if companies issue a stand-alone CSR
report at time t+1, and otherwise 0.
[INSERT TABLE 3 HERE]
The final sample for probit analysis contains 1582 firm-year observations. Table 3 shows
that companies with a higher return on assets (Ln_(1+ROAt)) are more willing to publish
CSR reports in year t+1 and the results are significant and positive at the 0.01 level. In
other words, companies that generate higher economic profit in year t are more able to
prepare and disseminate CSR information. Consistent with the previous discussion, firms
with higher financial capabilities in year t are more likely to issue stand-alone CSR report
in the subsequent year, t+1.
In addition, as shown in Table 3, companies with higher asset values (LnAssett) are more
likely to issue CSR reports. The result is significant and positive at the 0.01 level.

40
Moreover, the probit analysis shows that the decision to issue CSR reports in the current
year is influenced by the decision in the previous year. The result is significant and positive
at the 0.01 level. Table 3 also shows that mineral companies and foreign invested
companies are less likely to issue CSR reports. The result is significant and negative at the
0.01 level.
8.2 Issuance of CSR reports
This section analyzes the association between the issuance of stand-alone CSR reports in
year t and the firm performance in year t+1. Table 4 exhibits the regression results for
equation (2) where the dependent variables are Perft+1 in year t+1. The Perft+1 variable is
operationalized as Ln(1+ROAt+1), Ln(1+Mktt+1), Ln(1+%ΔSalest+1), and Ln(TobinQt+1).
[INSERT TABLE 4 HERE]
Panel A of Table 4 shows that there is a positive association between CSR report issuance
in year t and Ln(1+ROAt+1) in year t+1, and that the coefficient of the independent variable
(Issuet) is significant and positive at the 0.01 level. The results demonstrate that the
issuance of CSR reports is more likely to be associated with a higher return on assets in the
subsequent year.

41
Separate CSR reporting in year t seems to have no effect on other performance proxies. The
results in Panels B, C, and D show that there is no association between CSR report issuance
in year t and Ln(1+Mktt+1), Ln(1+%ΔSalest+1), and Ln(TobinQt+1). Therefore, H2 is
partially supported.
8.3 Current firm performance
This section assesses the association between the individual CSR contributions in year t
and firm performance in the same year. Table 6 illustrates the empirical results for equation
(3), where the dependent variable is Perft in year t. Perft is operationalized as Ln(1+ROAt),
Ln(1+Mktt), Ln(1+%ΔSalest), and Ln(TobinQt).
[INSERT TABLE 6 HERE]
The findings show that companies concerns in different areas have no instant effect on a
firm’s current performance. However, contributions to disaster relief (E_Disastert) are
significantly and positively associated with Ln(1+ROAt) (t-value=2.25), Ln(1+Mktt) (t-
value=2.861), and Ln(TobinQt) (t-value=2.26). Contributions to employee welfare
(E_Employeet) are significantly but negatively associated with Ln(1+Mktt) (t-value=-
1.974).

42
However, the results also show that the individual CSR initiatives have no effect on current
sales performance (Ln(1+%ΔSalest+1)), except for contributions to education
(E_Educationt). Its coefficient is significant and negative (t-value = -5.581), indicating that
CSR initiatives in education in year t are associated with lower sales in the same year.
Therefore, H3 is partially supported.
8.4 Subsequent firm performance
This section examines the association between individual CSR initiatives in year t and the
firm performance in year t+1. Table 7 illustrates the empirical findings for equation (4)
where the dependent variable is Perft+1 in year t+1. Perft+1 is operationalized as
Ln(1+ROAt+1), Ln(1+Mktt+1), Ln(1+%ΔSalest+1), and Ln(TobinQt+1).
[INSERT TABLE 7 HERE]
Table 7 shows that contributions to disaster relief (E_Disastert) continuously effect firm
performance in the subsequent year. E_Disastert is significantly and positively associated
with Ln(1+ROAt+1) (t-value=4.755) and Ln(TobinQt) (t-value=2.638). Of all the CSR
initiative variables, only donation to education (E_Educationt) is significantly and
positively associated with Ln(1+%ΔSalest+1) (t-value=4.339). Donation to charity is

43
significantly and positively associated with Ln(TobinQt+1) (t-value=2.921). However, the
environmental improvement expenditure is significantly and negatively associated with
Ln(1+ROAt+1) at the 0.10 level (t-value=-1.815), and concern for suppliers is significantly
and negatively associated with Ln(1+Mktt+1) at the 0.05 level (t-value=-2.172). Table 7 also
measures the effect of reporting quality on future firm performance. Although following
GRI guidelines is positively related to next year’s market performance Ln(1+Mktt+1),
auditing CSR reports has no effect. Therefore, H4 is partially supported.
The following table summarizes the results of the hypothesis tests in this study.
[INSERT TABLE 8 HERE]

44
Chapter 9 Conclusion
9.1 Discussion
Responding to public demands for CSR, the Chinese Government has implemented various
guidelines and rules to encourage both local and foreign-invested companies to integrate
CSR initiatives into their business activities. More companies are attempting to conduct
CSR activities that contribute to society and to various stakeholders. CSR reports are
regarded as a communication tool to help stakeholders’ understand how the companies
pursue CSR activities, and more companies are opting to issue stand-alone CSR reports
that document their contributions to different areas.
This study addresses the issues of the quality of CSR reports in China. Although only
5.05% of Chinese listed firms issued CSR reports in 2007 (Gao, 2011), 22.18% and
24.52% of firms listed on SSE publishing separate CSR reports in 2008 and 2009,
respectively. However, the descriptive statistics in this study show that only 5% of these
stand-alone reports use a Global Reporting Initiative framework, and only 3% are reviewed
by independent assurers. This suggests that the quality of the reports is far below the
international level. The surge in the number of CSR reports indicates that there is only an
improvement in the “form” of CSR reporting, not the “substance” of the information. The
sharp increase in the number of CSR reports can be explained by the legitimacy theory.
Chinese listed companies may intend to use CSR disclosure to enhance their legitimacy and

45
to restore the discrepancy between stakeholders’ perception of corporate responsibility and
their expectations.
The empirical results show that profitability is the major concern of SSE-listed firms with
respect to CSR disclosure. Firms with more resources (e.g., profit) are more likely to issue
CSR reports, and issuing CSR reports leads to a higher economic profit in the subsequent
year. The findings indicate that the predominant factor determining CSR initiatives is a
company’s profitability. As a golden rule, a business has to generate profit to cover its costs
for survival and to provide funds for growth. For a business to maximize its profit, it must
satisfy the needs of its stakeholders, particularly its customers. Therefore, companies do not
undertake voluntary activities for altruistic reasons, but for their own self-interests
(Friedman, 1970).
However, the findings in this study do not confirm that CSR reporting is related to an
increase in sales, although some previous studies evidence have shown a positive
relationship between CSR and sales (Prado-Lorenzo et al. 2008). These results suggest that
one of the key profit drivers for companies with respect to CSR is cost reduction (Epstein
and Roy, 2001; Kong et al., 2002). CSR can reduce social and environment costs and
thereby increase corporate profit (McWilliams and Siegal, 2001).

46
The growing global concern over the exploitation of child labor and the natural
environment has accelerated the development of CSR in China. The descriptive statistics
given above show that companies undertaking CSR spend more resources on employee
welfare and on environmental protection than on other causes in the 2008-2009 period.
However, the insignificant association of these two social responsibility areas with firms’
performance suggests that the expenditure may be a reaction to international pressure.
The findings also show that donation to disaster recovery is significantly and positively
associated with economic and market-related performance. During the sample period, there
was an earthquake in Sichuan (in 2008) and deadly flooding caused by typhoon Morakot in
Taiwan (in 2009). Many companies fulfilled their responsibilities as corporate citizens and
donated to the natural disaster recovery effort. Such donations increase a company’s
reputation and standing in the market and make investors more willing to invest in the
company. In addition, CSR initiatives in disaster recovery help to promote employee
morale and productivity. As a result, firm performance is improved (Soloman and Hansen,
1985; Weber, 2008).

47
China’s CSR principles and practices may differ from those in Western countries. Although
CSR is usually initiated by individuals or individual enterprises in countries like the USA
or the UK, in China, it is largely backed or directed by the government. These difference
may reflect cultural differences, such as individualism, uncertainty avoidance, power
distance, and masculinity (Hofstede, 2001). This also suggests that Chinese stakeholders
may respond to CSR initiatives differently than stakeholders in other countries. This
requires further investigation.
Finally, the significant positive association between GRI-format reports and market-related
performance indicates that international CSR standards increase investors’ confidence.
Investors are more willing to invest in companies that follow international standards.
9.2 Limitations of the research
This study has several limitations. First, the sample of companies issuing standalone
reports is relatively small. The development of CSR is at the elementary stage in China and
only 24.52% of the companies listed on the SSE issued stand-alone CSR reports in 2009.
Therefore, the behavior of the companies undertaking CSR may not fully represent the
CSR attitudes of all of the companies listed on the SSE. This may make it difficult to
generalize the results to the overall population.

48
The second limitation is the relatively short sample period. Due to time constraints, the
research only covers a two-year period. This is not sufficient for the study of the long-term
effect of CSR performance on firm performance, and this study can only analyze the effect
on firm performance in the subsequent year. The short sample period does not allow me to
evaluate the effectiveness of the SSE guidelines on CSR by comparing the performance
between pre- and post-enforcement periods.
The third limitation is that the study does not include cross-country comparisons. A very
limited number of CSR reports in China are prepared using the Global Reporting Initiative
Framework and audited by independent assurers. The inconsistency with the international
standards makes cross-border comparisons difficult. .
9.3 Recommendation for future studies
There is a growing trend for Chinese listed firms to disclose CSR information. It is
expected that more stand-alone CSR reports will be published in the future. Therefore,
replication studies are possible and should be carried out. An increased sample size in
future studies may allow higher levels of generalization.

49
A longitudinal study that addresses the long-term relationship between CSR performance
and firm performance by measuring the CSR initiative over time (Sweeney, 2009) could
also be constructed when the CSR data for subsequent year is available.
9.4 Managerial implications
The empirical findings confirm that CSR reporting is associated with higher economic
profit in the subsequent year. My study provides further evidence for managers that CSR
may develop customer trust, mitigate reputation risks, and create long-term shareholder
value. Moreover, the results suggest that donations to disaster recovery can improve the
company’s financial and market-related performance in both the current year and the
subsequent year. Although CSR is still under-developed in China, management should be
aware of the strategic benefits that firms may attain from engaging in CSR activities. A
better understanding and practice of CSR among Chinese companies will not only enhance
companies’ financial and sustainability performance, it will also advance the development
of CSR in China.

50
Reference
Alon I., Lattemann C., Fetscherin M., Li S. and Schneider A. (2010). Usage of public
corporate communications of social responsibility in Brazil, Russia, India and China
(BRIC). International Journal of Emerging Markets, 5(1), 6-22.
Angelidis J.P., Massetti B.L. and Magee-Egan P. (2008). Does Corporate Social
Responsibility Orientation Vary by Position in the Organizational Hierarchy?. Review of
Business Spring, 28(3), 23-32.
Bewley, K. and Li, Y. (2000). Disclosure of environmental information by Canadian
manufacturing companies: a voluntary disclosure perspective. Advances in Environmental
Accounting and Management, (1), 201-226.
Brammer, S. and Pavelin, S. (2008). Factors influencing the quality of coporate
environmental disclosure. Business Strategy and the Environment, 17(2), 120-136.
Vurro, C. and Perrini, F. (2011). Making the most of corporate social responsibility
reporting: disclosure structure and its impact on performance. Corporate Governance,
11(4), 459 – 474.
Chen, H. and Wang, X. (2011). Corporate Social Responsibility and Corporate Financial
Performance in China: an Empirical Research from Chinese Firms. Corporate Governance,
11(4), 361-370.
Cheung, Y., Jiang, K. and Tan, W. (2012). Doing-good’ and ‘Doing-well’ in Chinese
Publicly Listed Firms. China Economic Review. Forthcoming.
Commission of the European Communities. (2002). Corporate Social Responsibility Main
Issue. Brussels: European Commission.
Craib Design and Communications and PricewaterhouseCooper LLC. (2010). CSR Trends
2010.
Dando, N., Swift, T., 2003. Transparency and assurance: minding the credibility gap.
Journal of Business Ethics, 44 (2), 195–200.
Davis, K. (1973). The Case for and against Business Assumption of Social Responsibilities.
Academy of Management Journal, 16(2), 312-322.

51
Development Centre for Chinese CSR of China WTO Tribune. (2009). Reporting Research
2001-2009, The 2nd International Conference on CSR Reporting in China. Available at:
http://www.csr-china.net/en/second.aspx?nodeid=d5dad5b2-2453-4015-9bb2-
d650db593831&page=contentpage&contentid=6514d4a1-1f4b-4df7-9047-ed408333254c
Donaldson, T. and Preston, L. (1995) The Stakeholder Theory of the Corporation:
Concepts, Evidence and Implications. Academy of Management Review, 20(1), 65-91.
Dowling, J. and Pfeffer, J. (1975) Organizational legitimacy: social values and
organizational behavior. Pacific Sociological Review, 18(1), 122-136.
Economics Division of China Academy of Social Science. (2009). Blue Book of Corporate
Social Responsibility: Research Report on Corporate Social Responsibility of China. China:
Social Sciences Academic Press (China).
Epstein, M. J. and Roy, M.J. (2001). Sustainability in action: Identifying and measuring the
key performance drivers. Long Range Planning, 34(5), 585-604.
Freeman, R.E. (1984). Strategic Management: A stakeholder Approach. Boston: Pitman.
Friedman, M. (1970). The Social Responsibility of Business is to Increase its Profit. The
New York Times Magazine, September 13, 1970.
Friedman, A.L. and Miles, S. (2001). SMEs and the Environment: Two Case Studies. Eco-
Management and Auditing, 8(4), 200-209.
Fischer, J. (2004). Social Responsibility and Ethics: Clarifying the Concepts. Journal of
Business Ethics, 52(4), 381-390.
GAAP. (2008). IAS 38-Intangible Assets. Available at
http://www.iasplus.com/en/standards/standard37
Gamerschlag, R., Möller, K. and Verbeeten, F. (2011). Determinants of voluntary CSR
disclosure: empirical evidence from Germany. Review of Managerial Science, 5(2), 233-
262.
Gao, Y. (2011). CSR in an Emerging Country: a Content Analysis of CSR Reports of Listed
Companies. Baltic Journal of Management, 6(2), 263-291.

52
Gatewood, R.D., Gowan, M.A. and Lautenschlager, G.J. (1993). Corporate Image,
Recruitment Image and Initial Job Choice Decisions. The Academy of Management
Journa,l 36(2), 414-427.
Global Reporting Initative. (2011). Latest Guidelines. Available at
https://www.globalreporting.org/reporting/latest-guidelines/Pages/default.aspx
Gray, R., Owen D. and Adams, C. (1996), Accounting and Accountability, Prentice Hall
Europe, Great Britain.
Greenwood, M. (2001). The Importance of Stakeholders According to Business Leaders.
Business & Society Review, 106(1), 29-49.
Hofstede, G. (2001). Culture’s Consequences: Comparing Values, Behaviors, Institutions,
and Organizations across nations. Thousand Oaks, CA: Sage.
Howell, D.C., (1992). Statistical Methods for Psychology. Belmont: Duxbury Press.
Kang, K.H., Lee, S. and Huh, C. (2010). Impacts of Positive and Negative Corporate Social
Responsibility Activities on Company Performance in the Hospitality Industry.
International Journal of Hospitality Management, 29(1), 72-82.
Kong, N., Salzmann, O., Steger, U. and Ionescu-Somers, A. (2002). Moving business/
industry towards sustainable consumption: The role of NGOs. European Management
Journal, 20(2), 109-127.
Lancaster, I. (2004). Flavour of the Month is Here to Stay as CSR Takes Firm Hold In PR.
Media Asia, 1-3.
Lin, C., Yang, H. and Liou, D. (2009). The Impact of Corporate Social Responsibility on
Financial Performance: Evidence from Business in Taiwan. Technology in Society, 31(1),
56-63.
Lindblom, C. K. (1993) The implications of organizational legitimacy for corporate social
performance and disclosure. Critical Perspectives on Accounting Conference.

53
Lloyd’s Register Quality Assurance. (2010). CSR in Asia: The Real Picture LRQA,
Vietnam: LRQA.
McGuire, J.B., Sundgren, A. and Schneeweis, T. (1988). Corporate Social Responsibility
and firm Financial Performance. Academy of Management Journal, 31(4), 854-872.
McWilliams, A. and Siegel, D. (2011). Corporate Social Responsibility: A Theory of the
Firm Perspective. Academic Management Review, 26(1), 117-127.
Metcalfe, C. E. (1998). The Stakeholder Corporation. Business Ethics: A European Review,
7(1), 30-36.
Plumlee, M. A., Brown, D, Hayes, R. M. and Marshall, S. (2011). Voluntary Environmental
Disclosure Quality and Firm Value: further evidence. SSRN Working paper.
Post, J., Preston, L. and Sachs. (2002). Redefining the Corporation. California: Stanford
University Press:
Prado-Lorenzo, J., Gellego-Alvarez, I., Garcia-Sanchez, I. and Rodriguez-Dominguez, L.
(2008). Social Responsibility in Spain: Practices and Motivations in Firms. Management
Decision, 46(8), 1247-1271.
PricewtaerhouseCooper. (2003). Sustaining value through people: turning corporate
responsibility into corporate opportunity. Available at
http://www.pwc.com/en_GX/gx/sustainability/sus_value.pdf
PricewaterhouseCoopers. (2004). Trends in Corporate Reporting 2004, Vol.69.
Qu, R. (2007). Corporate Social Responsibility: Impact of Regulations, Market Orientation
and Ownership Structure. Chinese Management Studies, 1(3), 198-207.
Reverte, C. (2009). Determinants of corporate social responsibility disclosure ratings by
Spanish listed firms. Journal of Business Ethics, 88(2), 351-366.
Roberts, S. (2003). Supply Chain Specific? Understanding the Patchy Success of Ethical
Sourcing Initiatives. Journal of Business Ethics, 44(2/3), 149-70.
Roman, R.M., Hayibor, S., and Agle, B.R. (1999). The Relationship Between Social and

54
Financial Performance. Business and Society, 38(1), 109-125.
Ruf, B.M., Muralidhar, K. and Paul, K. (1998). The Development of a Systematic,
Aggregate Measure of Corporate Social Performance. Journal of Management, 24(1), 119-
133.
Scholtens, B. (2008). A Note on the Interaction Between Corporate Social Responsibility
and Financial Performance. Ecological Economics, 68(1), 46-55.
Shanghai Stock Exchange. (2008). Guidelines on Listed Companies’ Environmental
Information Disclosure.
Shanghai Stock Exchange. (2008). Notice on Strengthening Listed Companies Assumption
of Social Responsibility.
Soloman, R. and Hansen, K. (1985). It’s Good Business. New York: Atheneum.
Suchman, M. (1995) Managing Legitimacy: Strategic approaches and institutional
approaches. Academy of Management Review, 20(3), 571-610.
Sweeney, L. (2009). A Study of Current Practice of Corporate Social Responsibility (CSR)
and an examination of the relationship between CSR and Financial Performance Using
Structural Equation Modelling (SEM). Doctoral Thesis. Dublin Institute of Technology.
The Institute of Chartered Accountants. (2004). Information for Better Markets
Sustainability: the role of accountants.
Performance Using Structural Equation Modeling (SEM). Doctoral Thesis. Dublin, Dublin
Institute of Technology.
Roberts, R W. (1992). Determinants of corporate social responsibility disclosure: an
application of stakeholder theory. Accounting, Organizations and Society, 17(6), 595-612.
Ullmann, A.A. (1985). Data in search of a theory: a critical examination of the relationships
among social performance, social disclosure, and economic performance of U.S. firms.
Academy of Management Review, 10(3), 540-547.
United Nation. (2007). CSR and Developing Countries: Sustainable Development.
Innovation Brief, (1).
Van der Lan, S. (2009). The Role of Theory in Explaining Motivation for Corporate Social

55
Disclosures: Voluntary Disclosures vs ‘Solicited’ Disclosures. Australasian Accounting
Business and Finance Journal, 3(4), 15-29.
Watts, R. L. and J. L.Zimmerman. (1986). Positive accounting Theory.
Weber, M. (2008). The business case for corporate social responsibility: A company-level
measurement approach for CSR. Eurpoean Management Journal, 26(4), 247-261.
Webster, F.E. (1975). Determining the Characteristics of the Socially Conscious Consumer.
Journal of Consumer Research, 2(3), 188-196.

56
Table 1 Sample Companies by Industry
Industry 2008 2009
All
Companies Companies
Issue CSR Report All
Companies Companies
Issue CSR Report Conglomerate 35 6 (3.28%) 35 7 (3.41%) Cultural 10 2 (1.09%) 11 2 (0.98%) Social Services 16 4 (2.19%) 18 4 (1.95%) Real Property 64 15 (8.20%) 64 15 (7.32%) Retail and Wholesale 62 8 (4.37%) 62 8 (3.90%) Information and Technology 42 6 (3.28%) 42 5 (2.44%) Transportation 45 16 (8.74%) 47 17 (8.29%) Construction 22 5 (2.73%) 24 6 (2.93%) Utilities 42 12 (6.56%) 42 10 (4.88%) Manufacturing 439 103 (56.28%) 443 120 (58.53%) Mineral 29 3 (1.64%) 29 6 (2.93%) Agriculture 19 3 (1.64%) 19 5 (2.44%) Total Issue Separate CSR Report
825
183 (100%) 22.18%
836
205 (100%) 24.52%
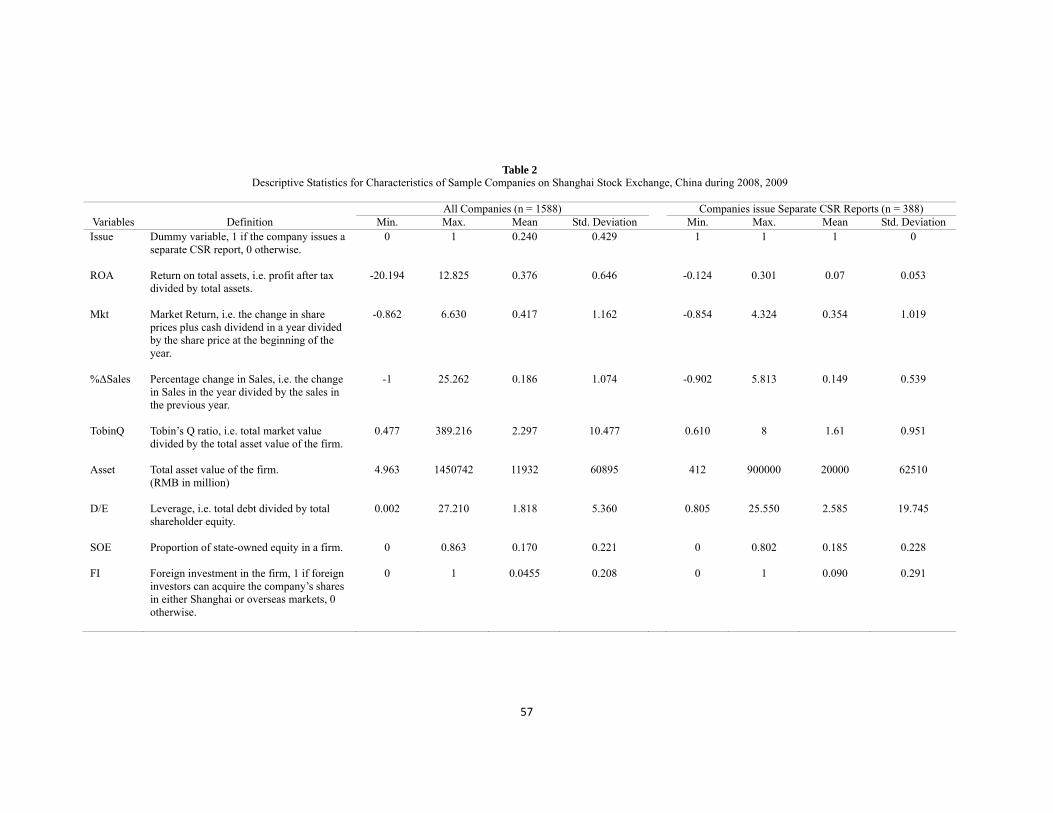
57
Table 2 Descriptive Statistics for Characteristics of Sample Companies on Shanghai Stock Exchange, China during 2008, 2009
All Companies (n = 1588) Companies issue Separate CSR Reports (n = 388) Variables Definition Min. Max. Mean Std. Deviation Min. Max. Mean Std. Deviation Issue Dummy variable, 1 if the company issues a
separate CSR report, 0 otherwise.
0 1 0.240 0.429 1 1 1 0
ROA Return on total assets, i.e. profit after tax divided by total assets.
-20.194 12.825 0.376 0.646 -0.124 0.301 0.07 0.053
Mkt Market Return, i.e. the change in share prices plus cash dividend in a year divided by the share price at the beginning of the year.
-0.862 6.630 0.417 1.162 -0.854 4.324 0.354 1.019
%ΔSales Percentage change in Sales, i.e. the change in Sales in the year divided by the sales in the previous year.
-1 25.262 0.186 1.074 -0.902 5.813 0.149 0.539
TobinQ Tobin’s Q ratio, i.e. total market value divided by the total asset value of the firm.
0.477 389.216 2.297 10.477 0.610 8 1.61 0.951
Asset Total asset value of the firm. (RMB in million)
4.963 1450742 11932 60895 412 900000 20000 62510
D/E Leverage, i.e. total debt divided by total shareholder equity.
0.002 27.210 1.818 5.360
0.805 25.550 2.585 19.745
SOE Proportion of state-owned equity in a firm.
0 0.863 0.170 0.221 0 0.802 0.185 0.228
FI Foreign investment in the firm, 1 if foreign investors can acquire the company’s shares in either Shanghai or overseas markets, 0 otherwise.
0 1 0.0455 0.208 0 1 0.090 0.291

58
Table 3
Results of Probit Analyses for Separate CSR Reports and Firm Characteristics of Sample Companies in Shanghai, China for 2008,2009 (t+1)
(n = 1582) Dependent Variable: Binary variable equaling 1 if a separate CSR report issued at time t+1
Variables
Estimate
Standard Error
Significant
Constant
1.366
3.806
(0.720)
Ln(1+ROAt) 11.457 2.123 (0.000)***
Ln(1+Mktt)
0.086 0.306 (0.780)
Ln (1+%ΔSales t) -0.230 0.265 (0.387) LnTobinQt
0.216 0.359 (0.547)
LnAssett
0.805 0.107 (0.000)***
D/Et
0.002 0.014 (0.869)
SOEt
-0.466 0.312 (0.135)
FIt
-0.102 0.225 (0.000)***
Issuet 8.253
0.000 (0.000)***
Year_2009
0.997 0.249 (0.648)
Conglomerate
0.026 0.409 (0.948)
Cultural
0.115 0.550
(0.834)
Social Services
-0.049 0.468 (0.917)
Real Properties
0.111 0.380 (0.770)
Retails and Wholesales -0.098 0.381 (0.796)
Information Technology
0.423 0.389 (0.276)
Transportation
0.337 0.385
(0.382)
Construction
0.011 0.433 (0.980)
Utilities
0.247 0.390
(0.527)
Manufacturing 0.100 0.347 (0.773) Mineral
-1.063
0.449
(0.018)***
Chi-Squared P Value
231.671 0.000
(* statistically significant at the 0.10 level; ** statistically significant at the 0.05 level; ***statistically significant at the 0.01 level )
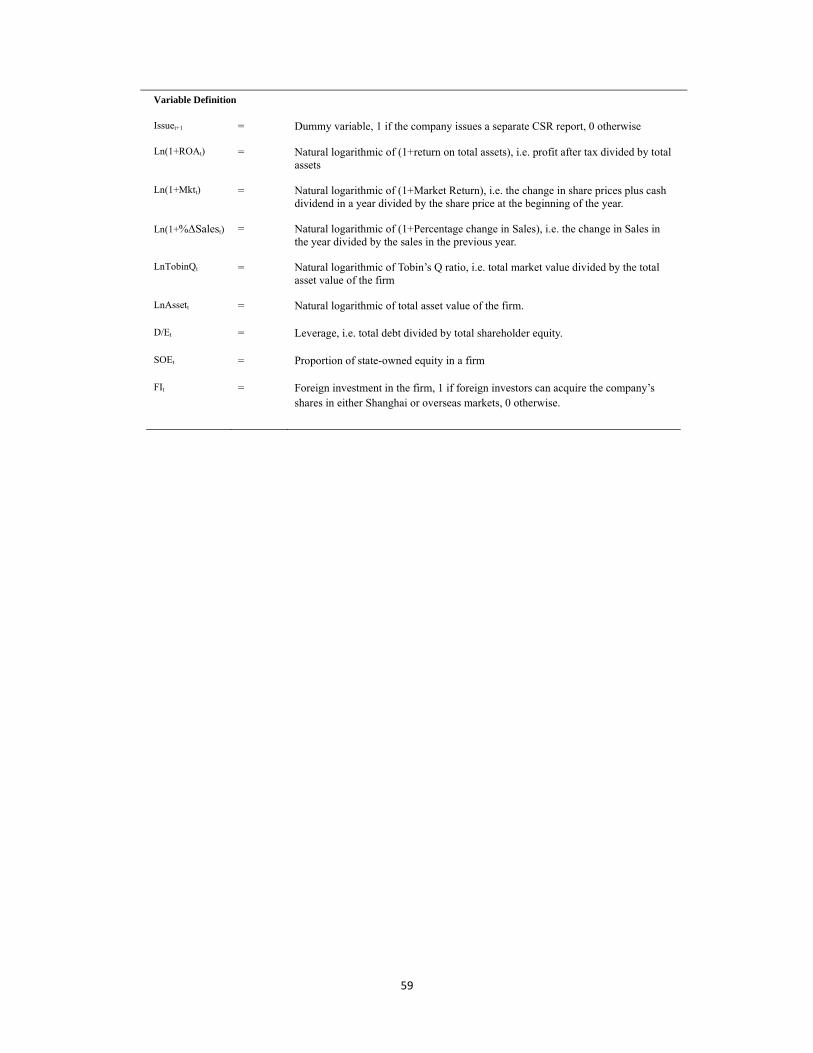
59
Variable Definition
Issuet+1 = Dummy variable, 1 if the company issues a separate CSR report, 0 otherwise
Ln(1+ROAt) = Natural logarithmic of (1+return on total assets), i.e. profit after tax divided by total assets
Ln(1+Mktt) = Natural logarithmic of (1+Market Return), i.e. the change in share prices plus cash dividend in a year divided by the share price at the beginning of the year.
Ln(1+%ΔSalest) = Natural logarithmic of (1+Percentage change in Sales), i.e. the change in Sales in the year divided by the sales in the previous year.
LnTobinQt = Natural logarithmic of Tobin’s Q ratio, i.e. total market value divided by the total asset value of the firm
LnAssett = Natural logarithmic of total asset value of the firm.
D/Et = Leverage, i.e. total debt divided by total shareholder equity.
SOEt = Proportion of state-owned equity in a firm
FIt
= Foreign investment in the firm, 1 if foreign investors can acquire the company’s shares in either Shanghai or overseas markets, 0 otherwise.

60
Variables definitions
Ln(1+ROAt+1) = Natural logarithmic of (1+return on total assets), i.e. profit after tax divided by total assets.
Ln(1+Mktt+1) = Natural logarithmic of (1+Market Return), i.e. the change in share prices plus cash dividend in a year divided by the share price at the beginning of the year.
Ln(1+%ΔSalest+1) = Natural logarithmic of (1+Percentage change in Sales), i.e. the change in Sales in the year divided by the sales in the previous year.
LnTobinQt+1 = Natural logarithmic of Tobin’s Q ratio, i.e. total market value divided by the total asset value of the firm
Issuet = Dummy variable, 1 if the company issues a separate CSR report, 0 otherwise
LnAssett = Natural logarithmic of total asset value of the firm.
D/Et = Leverage, i.e. total debt divided by total shareholder equity.
SOEt = Proportion of state-owned equity in a firm
FIt
= Foreign investment in the firm, 1 if foreign investors can acquire the company’s shares in either Shanghai or overseas markets, 0 otherwise.
Table 4
Results of Regression Analyses for CSR Report Issuance & Future Firm Performance of Sample Companies in Shanghai, China for 2008,2009 (t)
Variables
PANEL A Ln(1+ROAt+1)
PANEL B Ln(1+Mktt+1)
PANEL C Ln(1+%ΔSalest+1)
PANEL D LnTobinQt+1
Constant
-0.032 (-1.688)*
0.847 (13.337)***
-0.149 (-1.502)
2.603 (31.083)***
Issuet 0.008 (3.603)***
-0.008 (-1.072)
0.005 (0.409)
0.013 (1.225)
LnAssett
0.004 (2.242)**
-0.058 (-8.698)***
0.016 (1.589)
-0.239 (-27.178)***
D/Et
-0.000 (-2.172)**
-0.000 (-0.234)
0.001 (0.559)
-0.002 (-2.751)***
SOEt
0.000 (0.095)
-0.008 (-0.481)
0.028 (1.160)
-0.126 (-6.053)***
FIt
-0.005 (-1.436)
-0.029 (-2.478)**
-0.042 (-2.384)**
0.044 (2.865)***
Year Dummy Yes Yes Yes Yes Industry Dummy
Yes
Yes
Yes
Yes
No. of observations Adjusted R2
1588 0.049
1589 0.653
1585 0.062
1587 0.444
F-Statistics 5.875 177.193 7.165 75.848 ( t-statistics in parentheses: * statistically significant at the 0.10 level; ** statistically significant at the 0.05 level; ***statistically significant at the 0.01 level ) Results corrected for heteroskedasticity
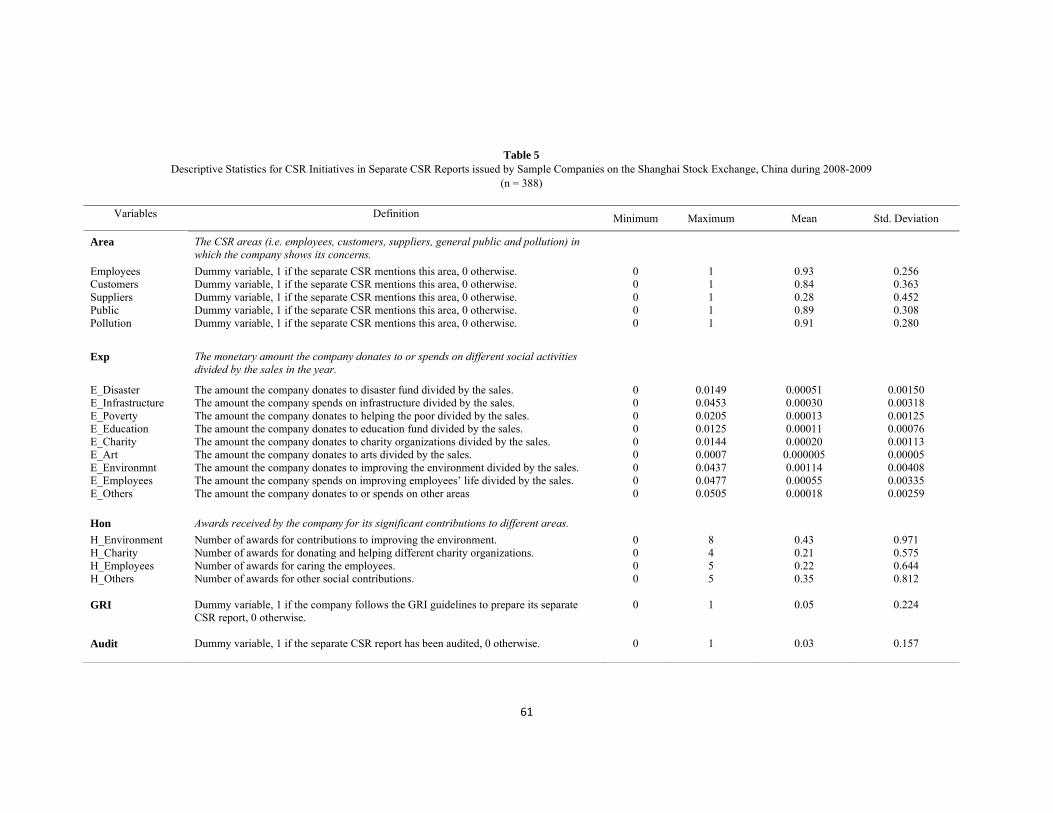
61
Table 5 Descriptive Statistics for CSR Initiatives in Separate CSR Reports issued by Sample Companies on the Shanghai Stock Exchange, China during 2008-2009
(n = 388)
Variables Definition Minimum Maximum Mean Std. Deviation
Area The CSR areas (i.e. employees, customers, suppliers, general public and pollution) in which the company shows its concerns.
Employees Customers Suppliers Public Pollution
Dummy variable, 1 if the separate CSR mentions this area, 0 otherwise. Dummy variable, 1 if the separate CSR mentions this area, 0 otherwise. Dummy variable, 1 if the separate CSR mentions this area, 0 otherwise. Dummy variable, 1 if the separate CSR mentions this area, 0 otherwise. Dummy variable, 1 if the separate CSR mentions this area, 0 otherwise.
0 0 0 0 0
1 1 1 1 1
0.93 0.84 0.28 0.89 0.91
0.256 0.363 0.452 0.308 0.280
Exp
The monetary amount the company donates to or spends on different social activities divided by the sales in the year.
E_Disaster E_Infrastructure E_Poverty E_Education E_Charity E_Art E_Environmnt E_Employees E_Others
The amount the company donates to disaster fund divided by the sales. The amount the company spends on infrastructure divided by the sales. The amount the company donates to helping the poor divided by the sales. The amount the company donates to education fund divided by the sales. The amount the company donates to charity organizations divided by the sales. The amount the company donates to arts divided by the sales. The amount the company donates to improving the environment divided by the sales. The amount the company spends on improving employees’ life divided by the sales. The amount the company donates to or spends on other areas
0 0 0 0 0 0 0 0 0
0.0149 0.0453 0.0205 0.0125 0.0144 0.0007 0.0437 0.0477 0.0505
0.00051 0.00030 0.00013 0.00011 0.00020
0.000005 0.00114 0.00055 0.00018
0.00150 0.00318 0.00125 0.00076 0.00113 0.00005 0.00408 0.00335 0.00259
Hon Awards received by the company for its significant contributions to different areas.
H_Environment H_Charity H_Employees H_Others
Number of awards for contributions to improving the environment. Number of awards for donating and helping different charity organizations. Number of awards for caring the employees. Number of awards for other social contributions.
0 0 0 0
8 4 5 5
0.43 0.21 0.22 0.35
0.971 0.575 0.644 0.812
GRI Dummy variable, 1 if the company follows the GRI guidelines to prepare its separate CSR report, 0 otherwise.
0 1 0.05 0.224
Audit
Dummy variable, 1 if the separate CSR report has been audited, 0 otherwise.
0
1
0.03
0.157

62
Table 6
Results of Regression Analyses for CSR Initiatives and Current Firm Performance of Sample Companies on the Shanghai Stock Exchange, China for 2008,2009 (t)
Variables
PANEL A Ln(1+ROAt)
PANEL B Ln(1+Mktt)
PANEL C Ln(1+%ΔSales t)
PANEL D LnTobinQt
Constant
0.018 (0.803)
-0.029 (-0.176)
-0.302 (-1.946)**
1.042 (6.716)***
Employeest -0.006 (-0.881)
-0.020 (-0.383)
-0.017 (-0.358)
0.064 (1.370)
Customerst
0.000 (-0.066)
0.029 (1.014)
-0.003 (-0.094)
0.030 (1.158)
Supplierst
0.002 (0.911)
0.010 (0.493)
-0.009 (-0.484)
-0.018 (-1.030)
Publict
0.000 (0.092)
-0.049 (-1.243)
0.005 (0.146)
-0.041 (-1.145)
Pollutiont
0.010 (1.615)
-0.022 (-0.472)
-0.007 (-0.167)
-0.018 (-0.440)
E_Disastert
1.730 (2.251)**
16.138 (2.861)***
8.480 (1.603)
11.517 (2.260)***
E_Infrastructuret
-0.023 (-0.069)
-0.520 (-0.211)
-0.813 (-0.351)
3.804 (1.704)
E_Povertyt
-0.438 (-0.518)
2.187 (0.352)
3.868 (0.665)
-1.199 (-0.214)
E_Educationt
2.288 (1.517)
5.194 (0.469)
-57.945 (-5.581)***
-4.316 (-0.432)
E_Charityt
0.394 (0.280)
-14.718 (-1.422)
0.878 (0.090)
14.806 (1.582)
E_Artt
1.366 (0.062)
79.364 (0.488)
123.411 (0.808)
-230.007 (-1.563)
E_Environmentt
-0.046 (-0.177)
0.271 (0.141)
-0.546 (-0.304)
-0.428 (-0.247)
E_Employeest
0.018 (0.057)
-4.506 (-1.974)**
-0.011 (-0.005)
-0.735 (-0.356)
E_Otherst 0.662 (1.165)
11.089 (2.660)***
1.172 (0.300)
1.809 (0.480)
LnAssett
0.002 (0.717)
-0.028 (-1.804)*
0.046 (3.136)***
-0.106 (-7.121)***
D/Et
-0.002 (-5.476)***
0.007 (2.250)**
0.001 (0.445)
-0.007 (-2.247)***
SOEt
0.002 (0.472)
0.009 (0.244)
0.019 (0.551)
-0.151 (-4.471)***
FIt
0.004 (1.123)
-0.020 (-0.717)
-0.065 (-2.455)**
-0.005 (-0.193)
Year Dummy Yes Yes Yes Yes Industry Dummy
Yes
Yes
Yes
Yes
No. of observations Adjusted R2
388 0.091
388 0.845
388 0.111
373 0.454
F-Statistics 2.251 69.405 2.565 11.303 ( t-statistics in parentheses: * statistically significant at the 0.10 level; ** statistically significant at the 0.05 level; ***statistically significant at the 0.01 level ) Results corrected for heteroskedasticity

63
Variable Definition
Ln(1+ROAt) = Natural logarithmic of (1+return on total assets), i.e. profit after tax divided by total assets.
Ln(1+Mktt) = Natural logarithmic of (1+Market Return), i.e. the change in share prices plus cash dividend in a year divided by the share price at the beginning of the year.
Ln(1+%ΔSalest) = Natural logarithmic of (1+Percentage change in Sales), i.e. the change in Sales in the year divided by the sales in the previous year.
LnTobinQt = Natural logarithmic of Tobin’s Q ratio, i.e. total market value divided by the total asset value of the firm.
Employeest = Dummy variable, 1 if the separate CSR mentions employees, 0 otherwise.
Customerst = Dummy variable, 1 if the separate CSR mentions customers, 0 otherwise.
Supplierst = Dummy variable, 1 if the separate CSR mentions suppliers, 0 otherwise.
Publict = Dummy variable, 1 if the separate CSR mentions general public, 0 otherwise.
Pollutiont = Dummy variable, 1 if the separate CSR mentions pollution protection, 0 otherwise.
E_Disastert = The amount the company donates to disaster fund divided by the sales.
E_Infrastructuret = The amount the company spends on infrastructure divided by the sales.
E_Povertyt = The amount the company donates to helping the poor divided by the sales.
E_Educationt = The amount the company donates to education fund divided by the sales.
E_Charityt = The amount the company donates to charity organizations divided by the sales.
E_Artt = The amount the company donates to arts divided by the sales.
E_Environmentt = The amount the company donates to improving the environment divided by the sales.
E_Employeest = The amount the company spends on improving employees’ life divided by the sales.
E_Otherst = The amount the company donates to or spends on other areas.
LnAssett = Natural logarithmic of total asset value of the firm.
D/Et = Leverage, i.e. total debt divided by total shareholder equity.
SOEt = Proportion of state-owned equity in a firm.
FIt = Foreign investment in the firm, 1 if foreign investors can acquire the company’s shares in either Shanghai or overseas markets, 0 otherwise.

64
Table 7 Results of Regression Analyses for CSR Initiatives and Future Firm Performance of Sample companies on the
Shanghai Stock Exchange, China for 2008,2009 (t)
Variables
PANEL A Ln(1+ROAt+1)
PANEL B Ln(1+Mktt+1)
PANEL C Ln(1+%ΔSales t+1)
PANEL D LnTobinQt+1
Constant
0.001 (0.035)
1.066 (7.444)***
-0.296 (-1.946)*
1.824 (10.226)***
Employeest -0.011 (-1.551)
0.030 (0.688)
-0.069 (1.463)
0.087 (1.611)
Customerst
0.001 (0.242)
0.015 (0.623)
0.016 (0.617)
0.016 (0.527)
Supplierst
-0.002 (-0.603)
-0.038 (-2.172)**
-0.012 (-0.659)
-0.042 (-1.943)
Publict
0.006 (1.154)
0.020 (0.607)
0.047 (1.327)
-0.017 (-0.412)
Pollutiont
0.009 (1.433)
-0.026 (-0.650)
0.021 (0.487)
-0.035 (-0.730)
E_Disastert
3.738 (4.755)***
-1.722 (-0.350)
6.456 (1.235)
15.802 (2.638)***
E_Infrastructuret
-0.075 (-0.217)
-0.620 (-0.289)
2.306 (1.012)
3.539 (1.355)
E_Povertyt
-0.330 (-0.396)
-0.839 (-0.161)
-3.081 (-0.555)
-4.171 (-0.656)
E_Educationt
2.300 (1.531)
5.206 (0.554)
43.343 (4.339)***
-4.774 (-0.417)
E_Charityt
1.330 (0.940)
8.645 (0.978)
-6.803 (-0.723)
31.457 (2.921)***
E_Artt
1.735 (0.078)
136.991 (0.991)
8.094 (0.055)
-125.326 (-0.744)
E_Environmentt
-0.472 (-1.815)*
-1.548 (-0.952)
-2.177 (-1.260)
-0.724 (-0.365)
E_Employeest
0.095 (0.303)
0.582 (0.297)
-0.027 (-0.013)
0.542 (0.227)
E_Otherst 0.407 (0.717)
4.438 (1.250)*
5.341 (1.415)
-0.283 (-0.065)
H_Environmentt 0.000 0.009 -0.009 0.001 (0.204) (1.099) (-1.081) (0.143) H_Charityt
-0.002 (-1.028)
-0.002 (-0.191)
0.001 (0.047)
0.003 (0.180)
H_Employeest
-0.001 (-0.773)
0.002 (0.171)
0.014 (1.206)
-0.010 (-0.703)
H_Otherst
0.001 (0.548)
-0.008 (-0.885)
-0.010 (-0.984)
-0.016 (-1.350)
GRIt
0.001 (0.196)
0.059 (1.429)**
-0.008 (-0.185)
-0.049 (-0.975)
Auditt
0.008 (0.986)
-0.045 (-0.879)
-0.006 (-0.112)
0.043 (0.692)
LnAssett
0.002 (0.838)
-0.083 (-6.055)***
0.030 (2.051)**
-0.172 (-10.063)***
D/Et
-0.001 (-2.211)**
0.003 (0.955)
0.003 (0.944)
-0.006 (-1.654)*
SOEt
0.002 (-0.301)
-0.004 (-1.390)
0.038 (1.115)
-0.137 (-3.512)***
FIt
0.003 (0.910)
-0.012 (-0.522)
-0.036 (-1.425)
0.026 (0.882 )
Year Dummy Yes Yes Yes Yes Industry Dummy Yes Yes Yes Yes No. of observations Adjusted R2
388 0.075
388 0.636
388 0.158
386 0.386
F-Statistics 1.849 19.222 2.958 7.505 ( t-statistics in parentheses: * statistically significant at the 0.10 level; ** statistically significant at the 0.05 level; ***statistically significant at the 0.01 level ) Results corrected for heteroskedasticity

65
Variable defintions Ln(1+ROAt+1) =
Natural logarithmic of (1+return on total assets), i.e. profit after tax divided by total assets.
Ln(1+Mktt+1) = Natural logarithmic of (1+Market Return), i.e. the change in share prices plus cash dividend in a year divided by the share price at the beginning of the year.
Ln(1+%ΔSalest+1) = Natural logarithmic of (1+Percentage change in Sales), i.e. the change in Sales in the year divided by the sales in the previous year.
LnTobinQt+1 = Natural logarithmic of Tobin’s Q ratio, i.e. total market value divided by the total asset value of the firm.
Employeest = Dummy variable, 1 if the separate CSR mentions employees, 0 otherwise.
Customerst = Dummy variable, 1 if the separate CSR mentions customers, 0 otherwise.
Supplierst = Dummy variable, 1 if the separate CSR mentions suppliers, 0 otherwise.
Publict = Dummy variable, 1 if the separate CSR mentions general public, 0 otherwise.
Pollutiont = Dummy variable, 1 if the separate CSR mentions pollution protection, 0 otherwise.
E_Disastert = The amount the company donates to disaster fund divided by the sales.
E_Infrastructuret = The amount the company spends on infrastructure divided by the sales.
E_Povertyt = The amount the company donates to helping the poor divided by the sales.
E_Educationt = The amount the company donates to education fund divided by the sales.
E_Charityt = The amount the company donates to charity organizations divided by the sales.
E_Artt = The amount the company donates to arts divided by the sales.
E_Environmentt = The amount the company donates to improving the environment divided by the sales.
E_Employeest = The amount the company spends on improving employees’ life divided by the sales.
E_Otherst = The amount the company donates to or spends on other areas.
H_Environmentt = Number of awards for contributions to improving the environment.
H_Charityt = Number of awards for donating and helping different charity organizations.
H_Employeest = Number of awards for caring the employees.
H_Otherst = Number of awards for other social contributions.
GRIt = Dummy variable, 1 if the company follows the GRI guidelines to prepare its separate CSR report, 0 otherwise.
Auditt = Dummy variable, 1 if the separate CSR report has been audited, 0 otherwise
LnAssett = Natural logarithmic of total asset value of the firm.
D/Et = Leverage, i.e. total debt divided by total shareholder equity.
SOEt = Proportion of state-owned equity in a firm.
FIt = Foreign investment in the firm, 1 if foreign investors can acquire the company’s shares in either Shanghai or overseas markets, 0 otherwise.

66
Table 8 Table for hypotheses supported/ not supported
Economic Performance Market Performance Sales Performance H1: The separate CSR reporting in year t is positively related to firms’ performance in year t-1
Support Not support Not support
H2: There is a positive association between CSR report issuance in year t and firm's performance in year t+1.
Support Not support Not support
H3: There is a positive association between CSR performance in year t and firm's performance in year t.
Partially support Partially support Not support
H4: There is a positive association between CSR performance in year t and firm's performance in year t+1
Partially support Partially support Partially support

67