Embed Size (px)
Citation preview

July 13, 2012
Financial Results Briefing
For 3Q of the Fiscal Year Ending August 2012
(3Q/FY2012)
- 2 -
This document has been prepared solely for the purpose of providing information on the Company’s financial results for 3Q/FY2012 and future business policy and should not be construed as a solicitation to invest in any securities issued by the Company. In addition, it has been prepared based on information as of July 13, 2012. The opinions, forecasts, etc., contained herein are the Company’s judgment made at the time of the preparation of this document and the Company does not guarantee or give any warranty as to the accuracy or completeness of the information, which is subject to change without notice.
CONTENTSCONTENTS
- 3 -
Overview of the Financial Results for 3Q/FY2012
Topics for 3Q/FY2012
Future Plans
Reference
Overview of the Financial Results for 3Q/FY2012
Topics for 3Q/FY2012
Future Plans
Reference

Overview of the Financial Results for 3Q/FY2012Overview of the Financial Results for 3Q/FY2012
- 4 -
Comparison between the Actual Results and the Estimates for 3Q/FY2012Overview of the Financial Results for 3Q/FY2012
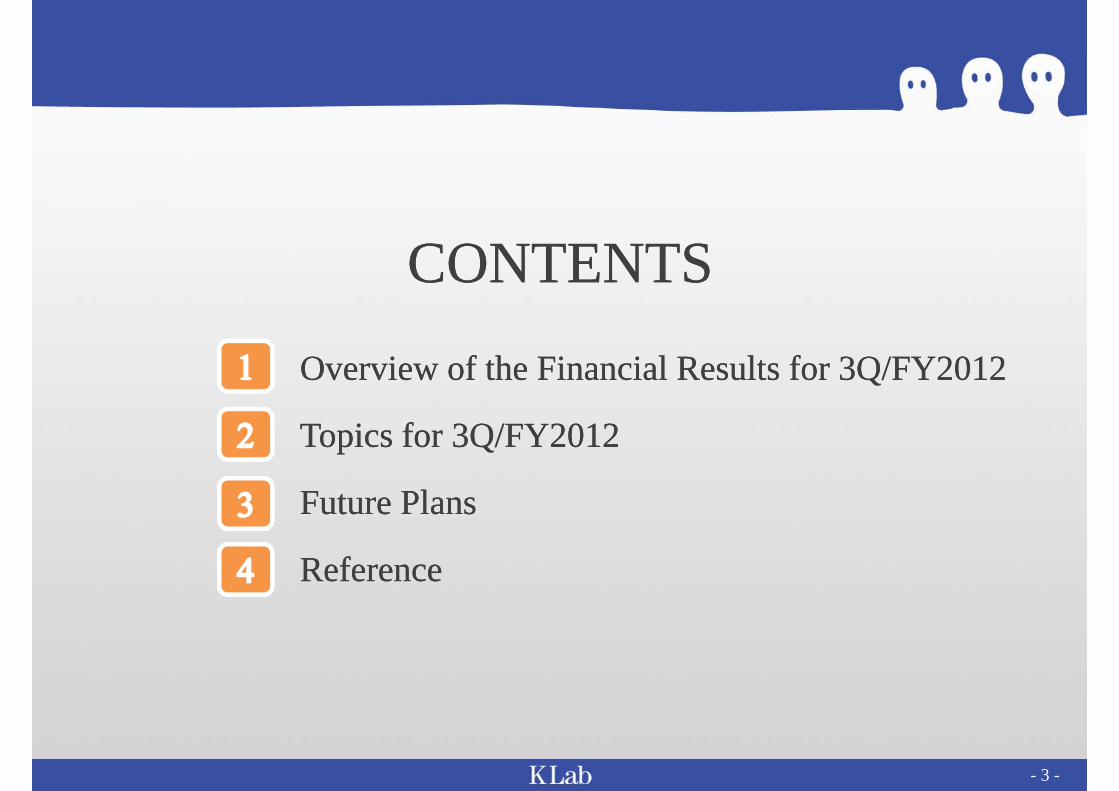
Although single-month sales hit a record high in May 2012, sales and operating income fell short of the estimates by 2.8% and 30.5%, respectively, in 3Q/FY2012.
1Q-3Q/FY2012Cumulative total Actual results Estimates Rate of deviation
from the estimate
Results for the previous year(1Q-3Q/FY2011)
For reference
Sales 11,626 11,742 -1.0% 3,385
Operating income 2,731 3,006 -9.1% 366
Ordinary income 2,737 3,010 -9.1% 363
Net income 1,594 1,755 -9.2% 198
3Q/FY2012 Actual results Estimates Rate of deviation from the estimate
Results for the previous year(3Q/FY2011)For reference
Sales 3,983 4,100 -2.8% 1,372
Operating income 625 900 -30.5% 212
Ordinary income 627 900 -30.3% 211
Net income 369 530 -30.3% 119
Unit: Million yen
- 5 -

- 6 -
Predictions[Basic policy of the company]
Putting long-term strategies before short-term sales• Excellent human resources channeled into global operations• Prioritize the development of native applications that require a
long period of time for development[Market environment]
Market attention was focused on famous IP titles
The pace of new title launches has deceleratedThe existing capacity for titles management has declinedUsers are moving away from non-IP browser games
Analysis of the 3Q/FY2012 SituationOverview of the Financial Results for 3Q/FY2012
IP browser games dropped more sharply Demand for non-IP browser games dropped more sharply than predicted.
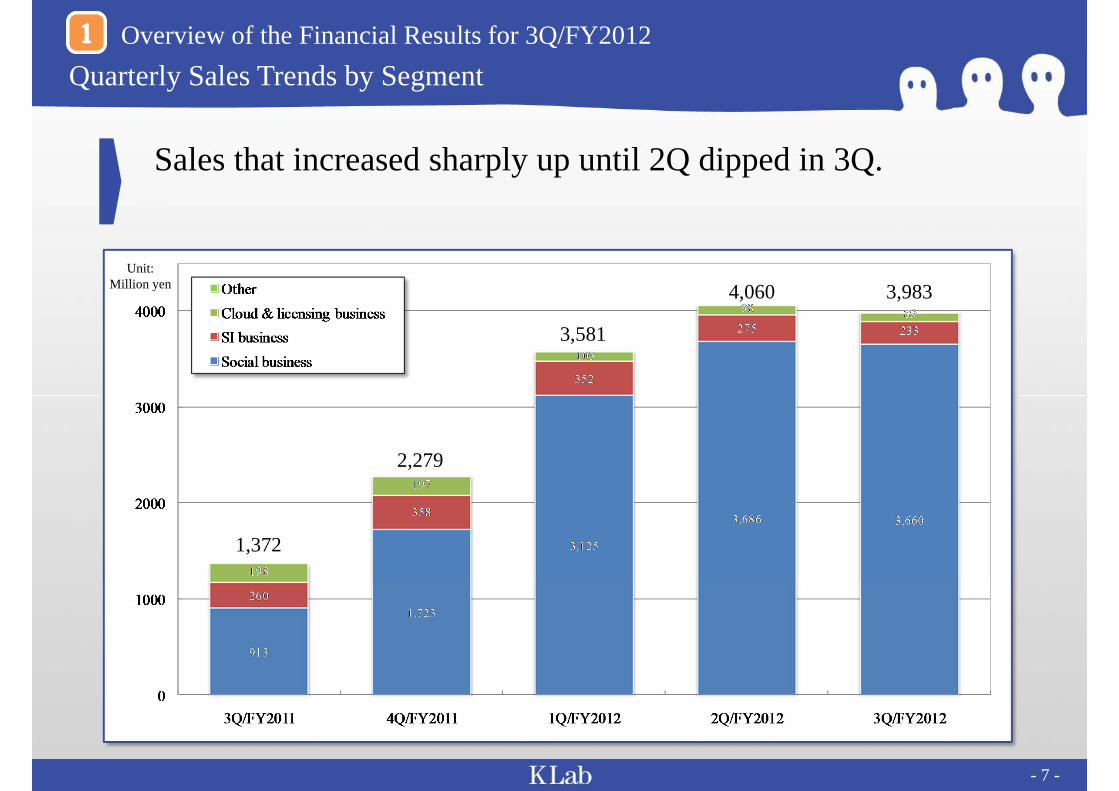
Sales that increased sharply up until 2Q dipped in 3Q.
Quarterly Sales Trends by SegmentOverview of the Financial Results for 3Q/FY2012
Unit: Million yen
- 7 -
1,372
2,279
3,581
4,060 3,983
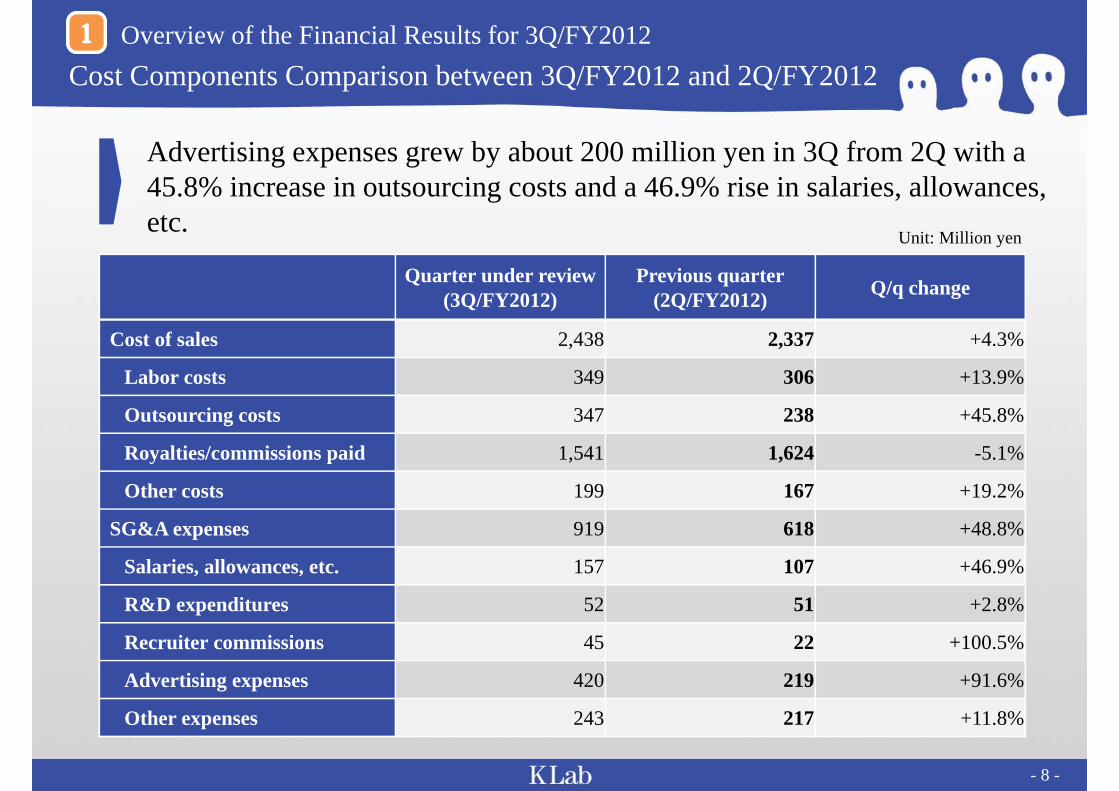
Cost Components Comparison between 3Q/FY2012 and 2Q/FY2012
Advertising expenses grew by about 200 million yen in 3Q from 2Q with a 45.8% increase in outsourcing costs and a 46.9% rise in salaries, allowances, etc.
Quarter under review(3Q/FY2012)
Previous quarter(2Q/FY2012) Q/q change
Cost of sales 2,438 2,337 +4.3%
Labor costs 349 306 +13.9%
Outsourcing costs 347 238 +45.8%
Royalties/commissions paid 1,541 1,624 -5.1%
Other costs 199 167 +19.2%
SG&A expenses 919 618 +48.8%
Salaries, allowances, etc. 157 107 +46.9%
R&D expenditures 52 51 +2.8%
Recruiter commissions 45 22 +100.5%
Advertising expenses 420 219 +91.6%
Other expenses 243 217 +11.8%
Unit: Million yen
- 8 -
Overview of the Financial Results for 3Q/FY2012
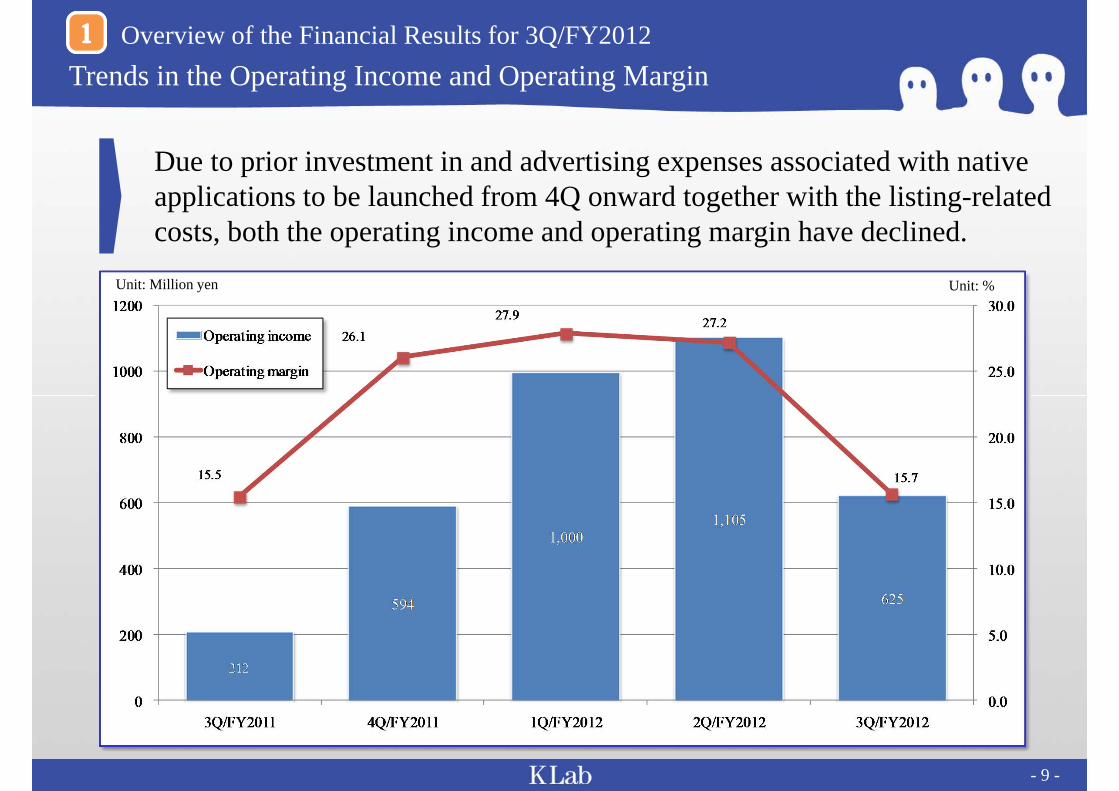
Due to prior investment in and advertising expenses associated with native applications to be launched from 4Q onward together with the listing-related costs, both the operating income and operating margin have declined.
Trends in the Operating Income and Operating Margin
- 9 -
Unit: Million yen Unit: %
Overview of the Financial Results for 3Q/FY2012

The operating income fell due to the cost of about 200 million yen in TV advertising expenses not factored into the initial budget.
Estimated Expenses and Actual ResultsOverview of the Financial Results for 3Q/FY2012
- 10 -
Actual results of 3Q Estimates for 3Q Rate of deviation from the estimate
Cost of sales 2,438 2,527 -3.5%
Labor costs 349 365 -4.5%
Outsourcing costs 347 348 -0.2%
Royalties/commissions paid 1,541 1,643 -6.2%
Other costs 199 169 +17.8%
SG&A expenses 919 672 +36.8%
Salaries, allowances, etc. 157 120 +30.4%
Recruiter commissions 45 35 +30.3%
Advertising expenses 420 212 +98.4%
Other expenses 295 304 -2.9%
Unit: Million yen

Due to the favorable performance in relation to the App Store, the dependence on Mobage declined in 3Q.
- 11 -
mobage60%
GREE9%
mixi12%
Others19%
3Q
Overview of the Financial Results for 3Q/FY2012Social Business Sales Breakdown by Platform
* Others include Yahoo!Mobage, Nico Nico Applications and App Store sales.

Sales to smartphone users accounted for 40% in 3Q; smartphones are expected to become the mainstream terminal from this point onward.
- 12 -
Overview of the Financial Results for 3Q/FY2012Social Business Sales Breakdown by Terminal
Topics for 3Q/FY2012Topics for 3Q/FY2012
- 13 -
New TitlesTopics for 3Q/FY2012
- 14 -
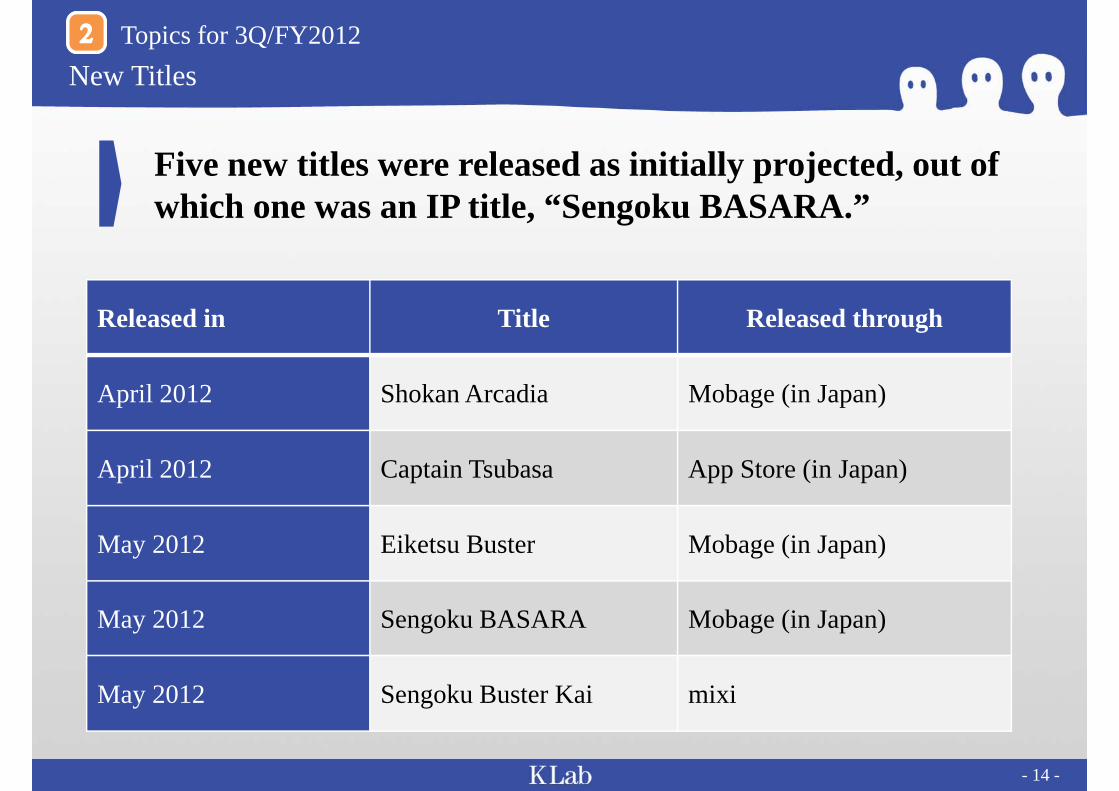
Five new titles were released as initially projected, out of which one was an IP title, “Sengoku BASARA.”
Released in Title Released through
April 2012 Shokan Arcadia Mobage (in Japan)
April 2012 Captain Tsubasa App Store (in Japan)
May 2012 Eiketsu Buster Mobage (in Japan)
May 2012 Sengoku BASARA Mobage (in Japan)
May 2012 Sengoku Buster Kai mixi

TV Commercial Utilization TestTopics for 3Q/FY2012
TV advertising for “Captain Tsubasa -Tsukurou Dream Team (Make a Dream Team)-” was launched in May 2012. Various commercial versions have been tested.
- 15 -
Sales: Up 33.9% Installed users: unpublishedDAU: Up 13.2% ARPU: Up 18.2%
Effects of the commercial strategy (Comparison between the broadcasting period in May and the same period of the preceding month)
Comparing costs for TV commercials and the increase in sales as a direct benefit from this, a loss was recorded on a single month basis. However, taking the lifetime value (LTV) of new users into account, the advertising expenses are recoverable in 3-4 months. We have also obtained know-how on how to launch effective commercials.
To be reflected in future promotion plansLarge-scale promotion projects scheduled from the next fiscal year onward
Creation of a Native Application Version of an IP TitleTopics for 3Q/FY2012
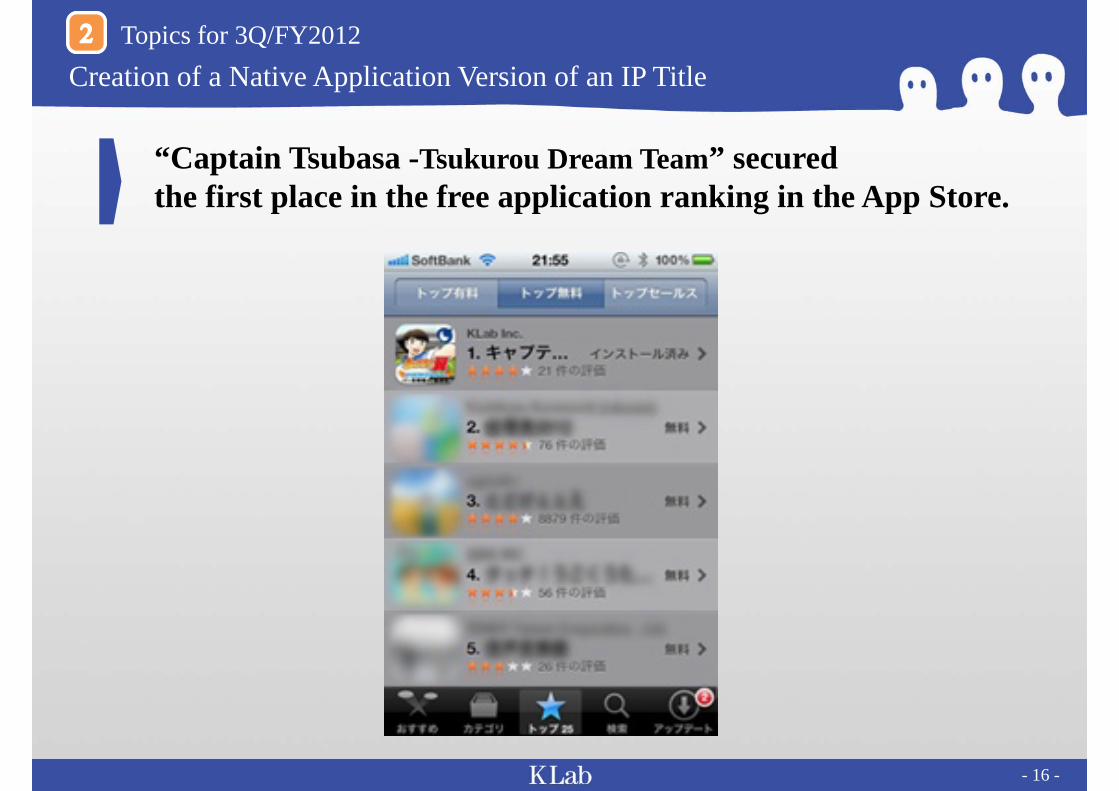
“Captain Tsubasa -Tsukurou Dream Team” secured the first place in the free application ranking in the App Store.
- 16 -
Our Competitive Edge in Native ApplicationsTopics for 3Q/FY2012
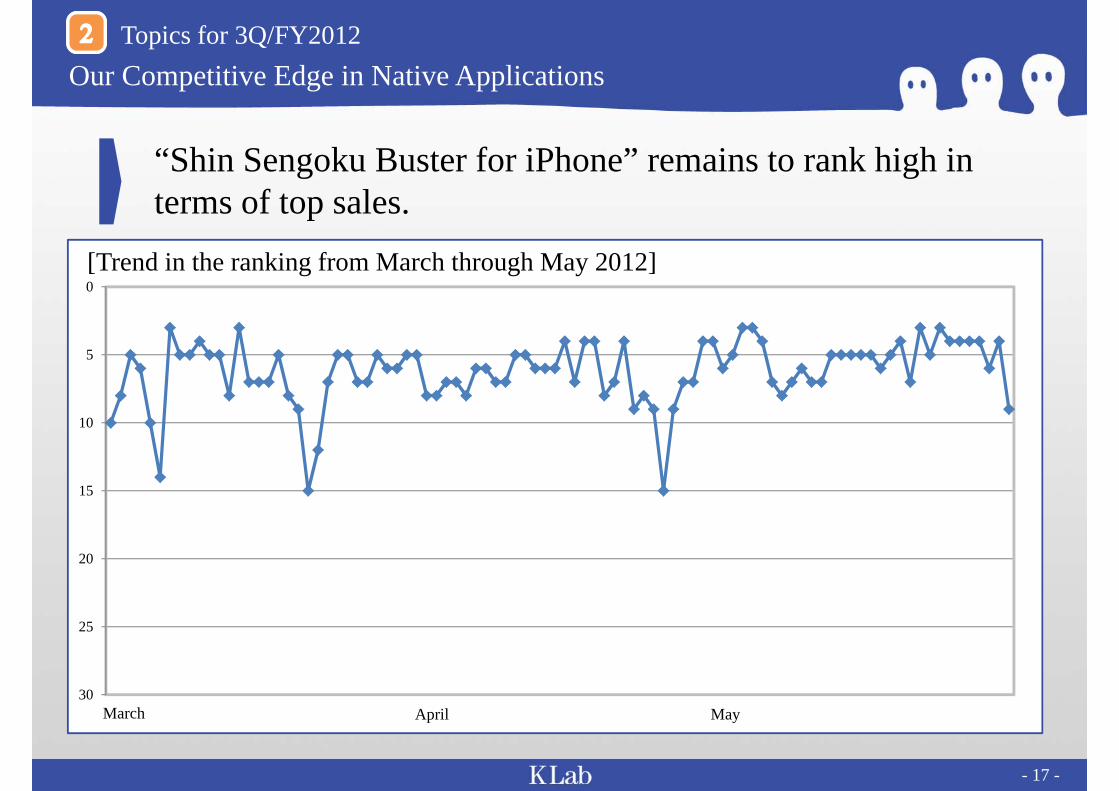
“Shin Sengoku Buster for iPhone” remains to rank high in terms of top sales.
- 17 -
0
5
10
15
20
25
30
[Trend in the ranking from March through May 2012]
March April May

Launch of “Sengoku Buster Kai” for MixiTopics for 3Q/FY2012
Launched in May 2012 for mixi, “Sengoku Buster Kai” received the top ranking in six categories on its fourth day after the launch.
- 18 -
Smartphone versionPopularity (total) 1stPopularity among male gamers 1stPopularity among female gamers 1st
Feature phone versionPopularity (total) 1stPopularity among male gamers 1stPopularity among female gamers 1st
Future PlansFuture Plans
- 19 -

Earnings Estimates for the Full-FY2012 and 4Q/FY2012
Although earnings are likely to surge in the full-FY2012 from the same period last year, quarter-on-quarter declines in both sales and profits are forecast for 4Q/FY2012 as compared to 3Q/FY2012.
Full-FY2012 Estimates Y/y change Actual results(Full-FY2011)
Sales 15,267 +169.5% 5,664Operating income 2,868 +198.2% 961Ordinary income 2,877 +202.5% 951
Net income 1,675 +204.6% 549
4Q/FY2012 Estimates Q/q change Actual results(3Q/FY2012)
Sales 3,642 -8.6% 3,983Operating income 137 -78.1% 625Ordinary income 140 -77.7% 627
Net income 81 -78.1% 369
Unit: Million yen
- 20 -
Unit: Million yen
Year-on-year comparison
Quarter-on-quarter comparison
Future Plans

Trend in the Cost Components from 1Q/FY2012 to 4Q/FY2012
In addition to rising labor and outsourcing costs, higher advertising expenses are expected for 4Q due to planned TV commercials.
- 21 -
Future Plans
Actual results Estimates
1Q 2Q 3Q 4Q
Cost of sales 2,035 2,337 2,438 2,550
Labor costs 285 306 349 445
Outsourcing costs 142 238 347 421
Royalties/commissions paid 1,435 1,624 1,541 1,464
Other costs 172 167 199 219
SG&A expenses 544 618 919 955
Salaries, allowances, etc. 121 107 157 149
Recruiter commissions 10 22 45 77
Advertising expenses 160 219 420 376
Other expenses 250 268 295 351
Unit: Million yen

Stock Price Simulation Based on the FY2012 EPS Estimate
The stock price simulation based on the PERs of the Company and competitors as well as the FY2012 EPS estimate indicates that the Company’s stock is undervalued.
- 22 -
* PER: Arrived at by dividing the July 11 closing price by the respective EPS estimate.
(1) PER (times) (2) The Company’sEPS Estimate (yen) (1) (2) (yen) Actual stock
price (yen)
KLab 8.66 65.8 570 570
Ateam 22.29 65.8 1,467 1,307
mobcast 21.49 65.8 1,414 1,974
GungHo 12.79 65.8 842 178,000
CAPCOM 11.22 65.8 738 1,624
SQUARE ENIX 16.41 65.8 1,080 1,281
Future Plans
New Titles to be Released in 4Q/FY2012
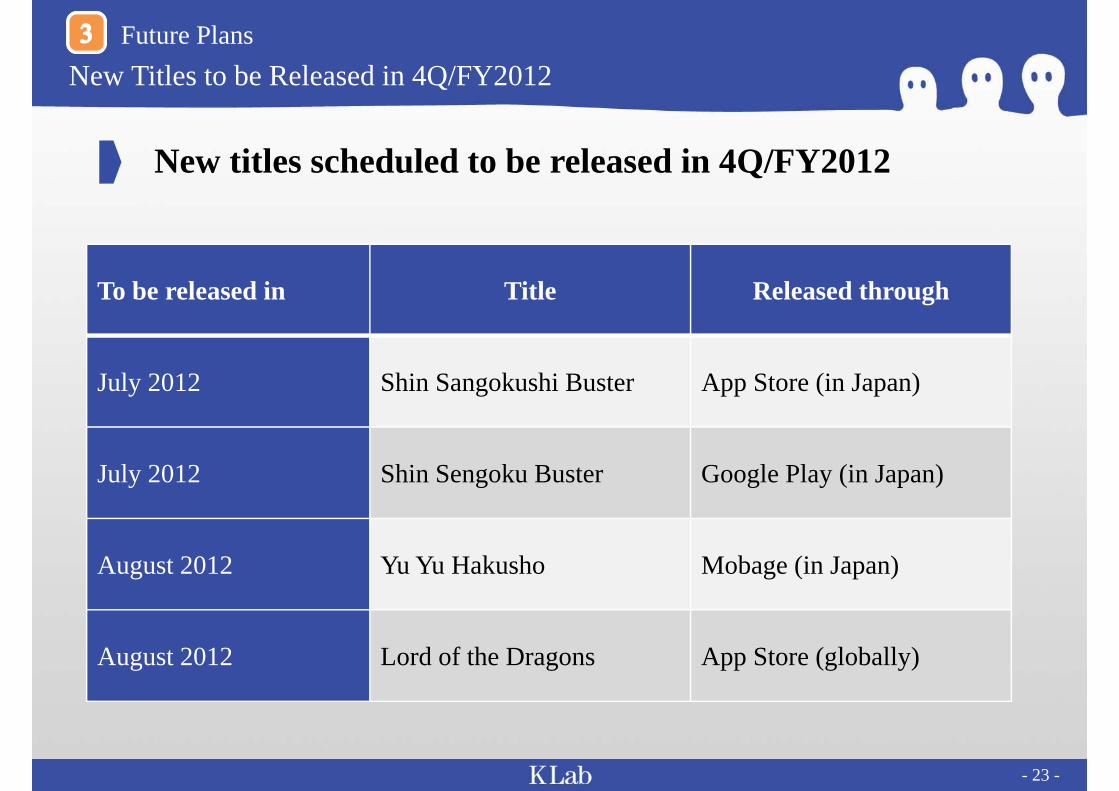
New titles scheduled to be released in 4Q/FY2012
- 23 -
To be released in Title Released through
July 2012 Shin Sangokushi Buster App Store (in Japan)
July 2012 Shin Sengoku Buster Google Play (in Japan)
August 2012 Yu Yu Hakusho Mobage (in Japan)
August 2012 Lord of the Dragons App Store (globally)
Future Plans
Impact of the Kompu Gacha Ban and the Response by the Council of Six Companies
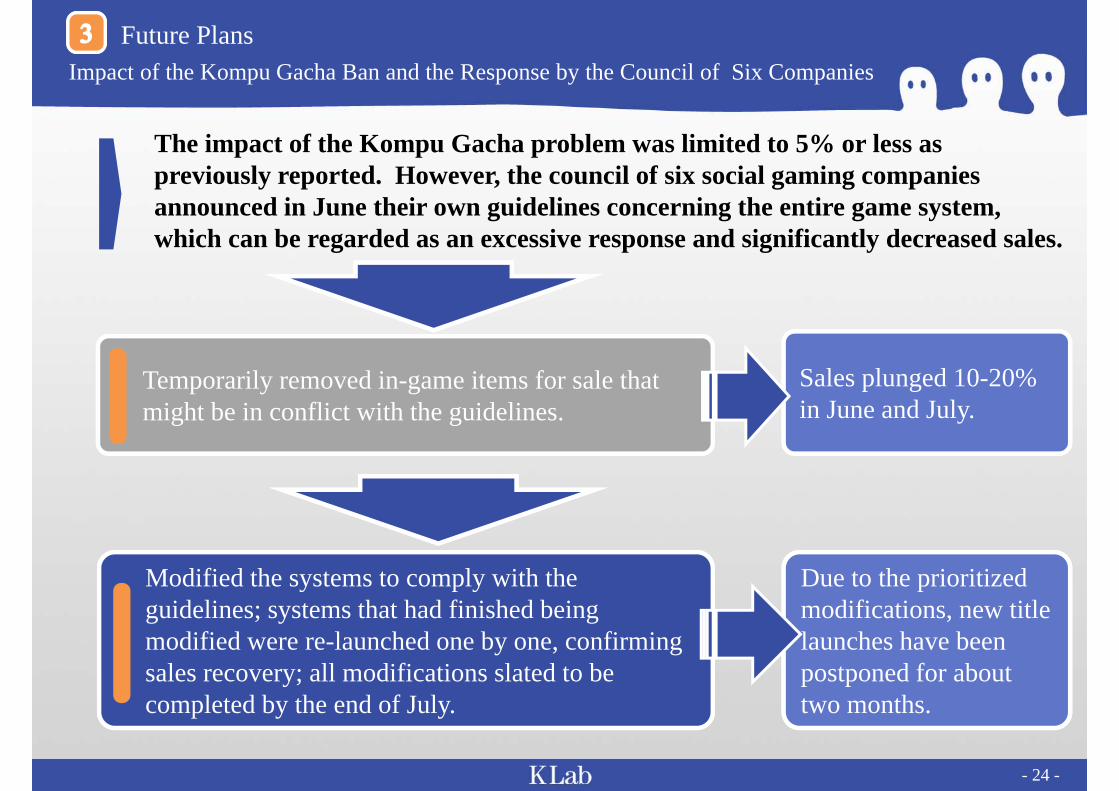
The impact of the Kompu Gacha problem was limited to 5% or less as previously reported. However, the council of six social gaming companies announced in June their own guidelines concerning the entire game system, which can be regarded as an excessive response and significantly decreased sales.
- 24 -
Temporarily removed in-game items for sale that might be in conflict with the guidelines.
Modified the systems to comply with the guidelines; systems that had finished being modified were re-launched one by one, confirming sales recovery; all modifications slated to be completed by the end of July.
Future Plans
Sales plunged 10-20% in June and July.
Due to the prioritized modifications, new title launches have been postponed for about two months.

Reasons for the Weak 4Q/FY2012 Earnings (1)
- 25 -
Future Plans
Structural factors
Temporary factors
Factors dampening sales
(1) Market attention was focused on famous IP titles(2) Demand for the existing non-IP browser games remained on a downtrend
(In the case of native applications, non-IP games performed well)
(3) A decline in sales due to compliance with the guidelines set down by the council of six social gaming companies
(4) Delay in the development of new titles caused by the system modifications; some launches were postponed until the following quarter
(5) Yu Yu Hakusho, which is expected to make a significant contribution to sales, is now scheduled to be launched in August, the last month of 4Q
(6) Planned release of an IP title cancelled

Reasons for the Weak 4Q/FY2012 Earnings (2)
- 26 -
Future Plans
Rising costs(1) Gaming companies typically book R&D investments as software assets
and start depreciating them upon the launch of the products. However, not following this industry practice, we book all R&D investments we make as expenses for the respective month. As a result, R&D expenditures on game engines for native applications to be used over the long term as well as applications scheduled for release in 1Q-3Q/FY2013 are booked as expenses for 4Q/FY2012.
(2) We have currently adopted a two-pronged strategy for a period of transition that centers on browser games for domestic SNSs and native applications.
(3) TV commercials are planned to be launched on the sidelines of the Olympic Games period.
(4) SG&A expenses are surging due to the promotion of international deployment, including obtaining global IP rights.

Earnings Estimates for 4Q/FY2012 and 1Q/FY2013Future Plans
Full-year earnings estimates will start to be announced from FY2013 and onward.Prior to this, the sales outlook for the coming six months is shown here.
3Q/FY2012(Actual results)
4Q/FY2012(Estimates)
1Q/FY2013(Estimates)
Sales 3,983 3,642 4,300
Operating income 625 137 ー
Ordinary income 627 140 ー
Net income 369 81 ー
Unit: Million yen
- 27 -

Sales projection for 1Q/FY2013Future Plans
- 28 -
3,5814,060 3,983
3,642
4,300
0
500
1,000
1,500
2,000
2,500
3,000
3,500
4,000
1Q/FY2012 2Q/FY2012 3Q/FY2012 4Q/FY2012 (estimate) 1Q/FY2013 (estimate)
Unit: Million yen
Sales are likely to resume following an upward path from 1Q/FY2013 onward.

Reasons for the Expected Earnings Recovery in 1Q/FY2013Future Plans
- 29 -
A number of new titles to be launched in succession from September, the beginning of 1Q/FY2013, onward are expected to make a significant contribution to sales of the quarter
Browser game sales are expected to pick up to the previous levels due to the completion of measures taken to meet the guidelines of the council of six gaming companies
Large-scale IP titles to be put on the domestic market
New titles launched in 4Q/FY2012 such as Yu Yu Hakusho to support an increase in sales
The effect of the TV commercials broadcast in 3Q-4Q/FY2012 is expected to last

- 30 -
Thirty new applications are planned to be released in 1Q/FY2013, of which 12 are aimed at the global market.
Application Release Plan for 4Q/FY2012 and 1Q/FY2013Future Plans
2 2 2 35
24
1
91
1
2
7
1
12
1
2
57
912
1720
25
30
60
0
10
20
30
40
50
60
0
5
10
15
20
25
30
35
2011/第1Q 2011/第2Q 2011/第3Q 2011/第4Q 2012/第1Q 2012/第2Q 2012/第3Q 2012/第4Q 2013/第1Q
パブリッシング
グローバル
国内Native
国内SNS
総タイトル数
* Example of counting the number of titles:In case of Captain Tsubasa, mogage+yahoo!mobage+GREE+mixi+iOS+Nico Nico Applications = 6
PublishingGlobalDomestic NativeDomestic SNSTotal
1Q/FY2011 2Q/FY2011 3Q/FY2011 4Q/FY2011 1Q/FY2012 2Q/FY2012 3Q/FY2012 4Q/FY2012 (projection)
1Q/FY2013 (projection)
- 31 -
Future PolicyFuture Plans
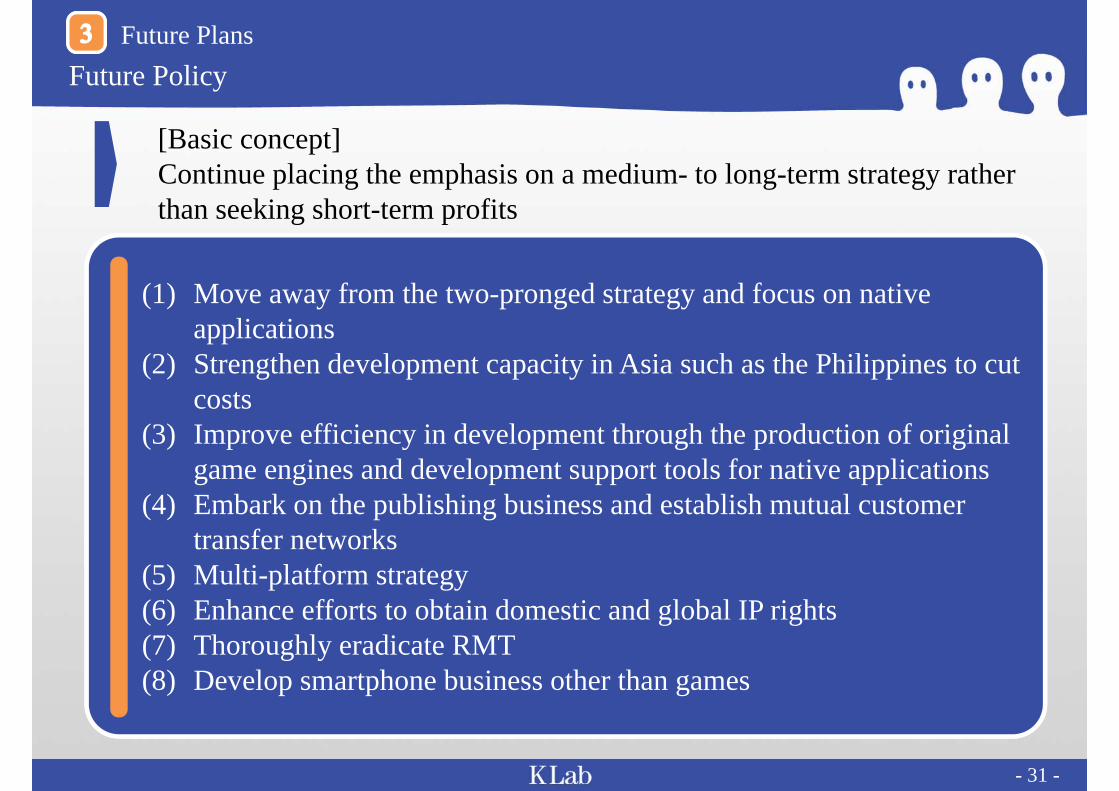
[Basic concept]Continue placing the emphasis on a medium- to long-term strategy rather than seeking short-term profits
(1) Move away from the two-pronged strategy and focus on native applications
(2) Strengthen development capacity in Asia such as the Philippines to cut costs
(3) Improve efficiency in development through the production of original game engines and development support tools for native applications
(4) Embark on the publishing business and establish mutual customer transfer networks
(5) Multi-platform strategy(6) Enhance efforts to obtain domestic and global IP rights(7) Thoroughly eradicate RMT(8) Develop smartphone business other than games

Improvement of Operation Bases to Establish International Specialization System
Personnel recruitment by KLab Cyscorpionsin the Philippines is going smoothly.
- 32 -
Employee breakdown by job(June 30, 2012)
Android developers: 15iPhone developers: 14UI developers: 2PHP developers: 19Network engineers: 4Designers: 7Administrators: 5(Other Japanese employees: 5)
Future Plans

- 33 -
Development of Original Game Engines and Development Support ToolsFuture Plans
Engine for miniscape games that are highly popular in Europe and the US
KLab Game Engine for 2D Games

- 34 -
KLab Game Engine for 2D Games (2) Future Plans
KLab Game Engine
■ CharacteristicsOnce developed, it can work across multiple platforms.It can be quickly developed through the use of many development support toolsSimple renewal of the game logic enables high-speed game management
■ Game logic layerAdoption of Lua scripting language known for its track record of being used in console game development
Lua script
Application
OS
■ Game engine layer
Map editor, UI editor, AI rule editor, texture editor, etc.
Development support tools

Publishing Business and Multi-Platform Strategy
- 35 -
Future Plans
Provision of gamesPublishing
Mutual customer transfer
SAPCompany’s own title
Company’s own title SAP
SAP
SAP
Publishing business
< User base >

Countermeasures against Real Money Trading (RMT)
Due to the implementation of the countermeasures, the number of the Company-related items listed on the leading auction sites decreased to 50% or less from the level before the implementation.
- 36 -
Concrete steps Details
Strengthen systems to check actions relating to RMT
Improve surveillance of auction sitesVirtual items traded via RMT on auction sites, etc. are monitored, found and requested to be eliminated around the clock by a manned check system centering on an operation team with professional expertise and know-how.
Improve in-game surveillance bysystems
In the case where any user is found through an access log that he/she might have got involved in RMT, measures are taken including warning given to the violating user, suspension of his/her account, etc.
Request to specialized RMT operators, etc.
Requests are made in writing, etc. to stop selling any character, item, card, etc. supplied over the Company’s games and completely delete related data from the relevant sites and servers.
Improve trading functions
Introduce an anonymous trading function
The trading system under which a gamer looks for a random trading partner has changed to a new trading system under which a gamer lists his/her virtual items on a public in-game site specifying trading conditions, while another gamer searches the site for an item he/she wants to obtain and submits his/her own item in exchange to bid for it.
Suspend the gift function The function that enables a gamer to give his/her own virtual item to any random user is suspended.
Future Plans

ReferenceReference
- 37 -

Corporate ProfileReference
- 38 -
Company name KLab Inc.
Establishment August 1, 2000
Capital 899.19 million yen (as of May 31, 2012)
Representative Tetsuya Sanada, President and CEO
Locations
Headquarters: Roppongi Hills Mori Tower, 6-10-1 Roppongi, Minato-ku, Tokyo
Osaka Office: Fujihisa FJ Bldg., 4-3-25 Nakanoshima, Kita-ku, Osaka-shi, Osaka Prefecture
Fukuoka Office: Kyukan Hakata Ekimae Bldg., 2-19-27 Hakata-ekimae, Hakata-ku, Fukuoka-shi, Fukuoka Prefecture
Sendai Office: Sendai Jozenji Bldg., 3-4-33 Kokubun-cho, Aoba-ku, Sendai-shi, Miyagi Prefecture
Number of employees 410 (as of May 31, 2012)
Our Business LinesReference
- 39 -
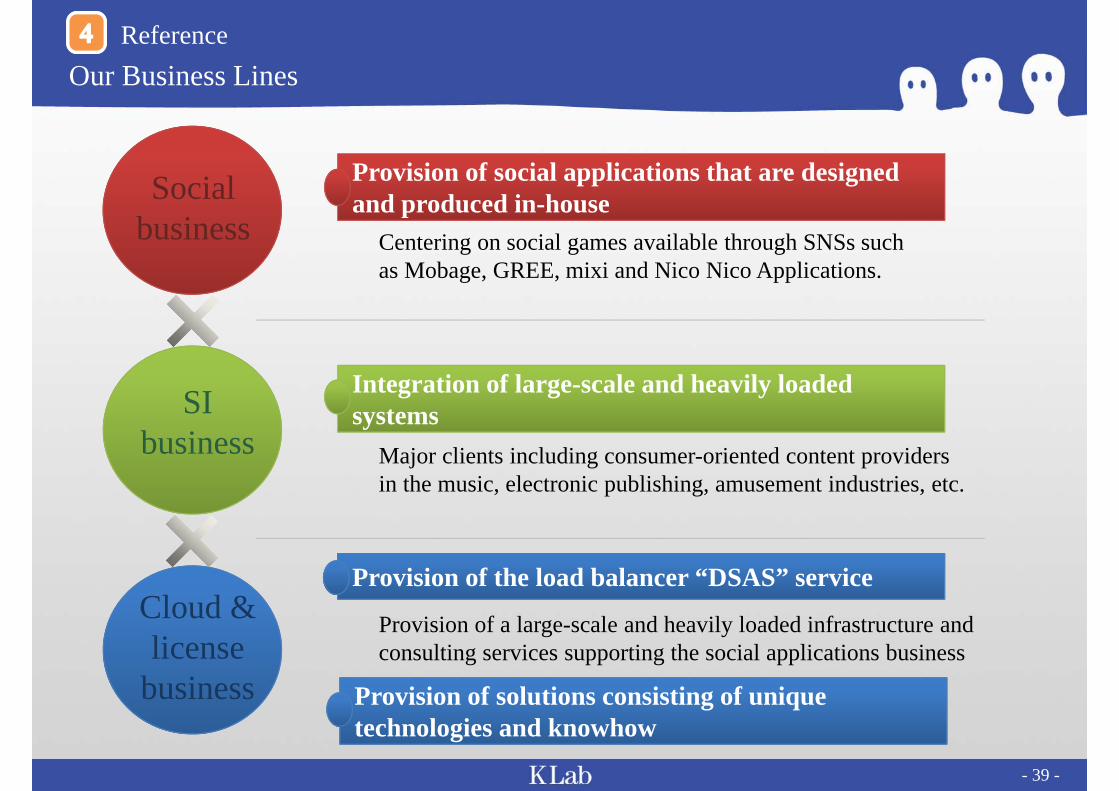
Centering on social games available through SNSs suchas Mobage, GREE, mixi and Nico Nico Applications.
Major clients including consumer-oriented content providersin the music, electronic publishing, amusement industries, etc.
Provision of a large-scale and heavily loaded infrastructure andconsulting services supporting the social applications business
Integration of large-scale and heavily loadedsystems
Provision of social applications that are designedand produced in-house
Provision of the load balancer “DSAS” service
Provision of solutions consisting of uniquetechnologies and knowhow
Social business
SI business
Cloud &license
business
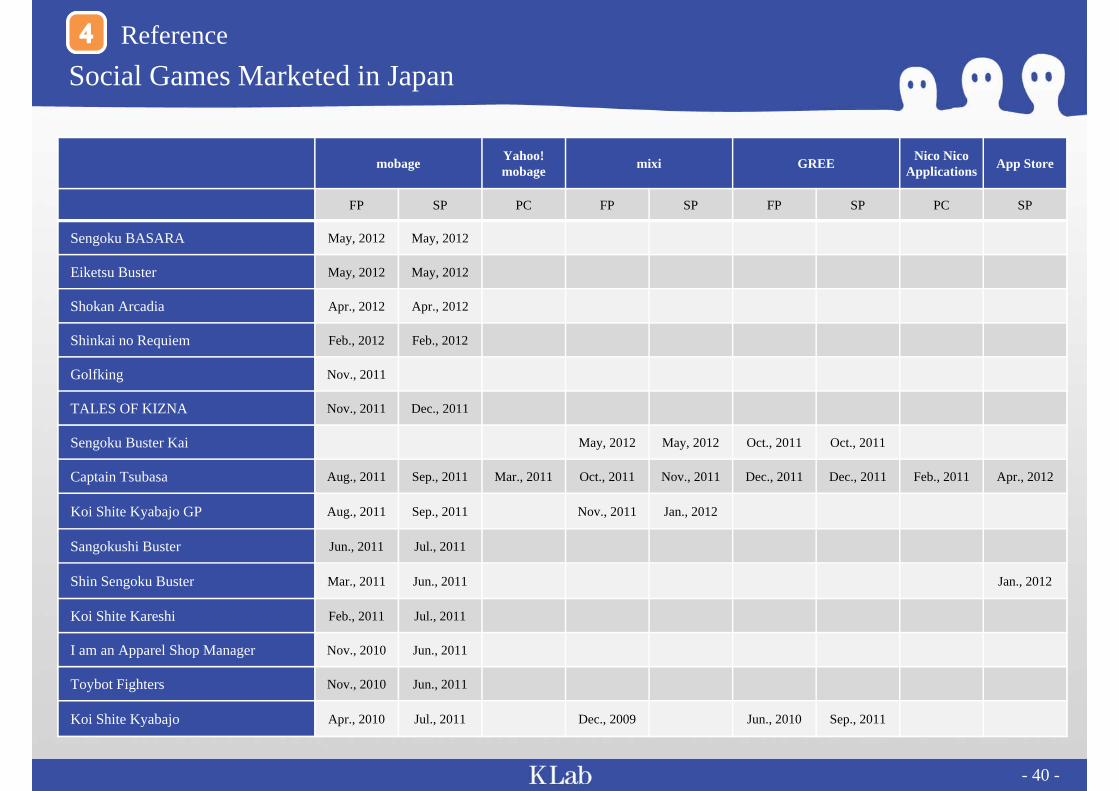
Social Games Marketed in JapanReference
- 40 -
mobage Yahoo!mobage mixi GREE Nico Nico
Applications App Store
FP SP PC FP SP FP SP PC SP
Sengoku BASARA May, 2012 May, 2012
Eiketsu Buster May, 2012 May, 2012
Shokan Arcadia Apr., 2012 Apr., 2012
Shinkai no Requiem Feb., 2012 Feb., 2012
Golfking Nov., 2011
TALES OF KIZNA Nov., 2011 Dec., 2011
Sengoku Buster Kai May, 2012 May, 2012 Oct., 2011 Oct., 2011
Captain Tsubasa Aug., 2011 Sep., 2011 Mar., 2011 Oct., 2011 Nov., 2011 Dec., 2011 Dec., 2011 Feb., 2011 Apr., 2012
Koi Shite Kyabajo GP Aug., 2011 Sep., 2011 Nov., 2011 Jan., 2012
Sangokushi Buster Jun., 2011 Jul., 2011
Shin Sengoku Buster Mar., 2011 Jun., 2011 Jan., 2012
Koi Shite Kareshi Feb., 2011 Jul., 2011
I am an Apparel Shop Manager Nov., 2010 Jun., 2011
Toybot Fighters Nov., 2010 Jun., 2011
Koi Shite Kyabajo Apr., 2010 Jul., 2011 Dec., 2009 Jun., 2010 Sep., 2011

GlossaryReference
- 41 -
[SNS platform]A game platform on a social networking service providing message, group forming, item trading and ranking functions, etc.
[iOS]An operating system for the iPhone, iPod touch and iPad of Apple Inc.
[IP]Abbreviation for intellectual property
[Native application]An application that is downloaded from an application store, etc., and installed on a terminal for use. It enables the users to make full use of the functions and processing capacity of the terminal.
[Top sales ranking]Sales rank of the App Store’s applications
[Kompu Gacha]Kompu is a Japanese abbreviation for complete. Gacha means a system where items are purchased using a lottery. In games virtual worlds, Kompu Gacha allows gamers to get a new item as a reward if they have collected a multiple number of items.
[Real money trading (RMT)]The act of buying and selling in-game items for real money
[FP]Mobile phones centering on the verbal communication function and equipped with some other characteristic features such as a camera and One Seg broadcasting.
[SP]Mobile phones equipped with multiple functions including verbal communication, Internet access, applications starting, etc.
[Number of installed users]The number of users who have installed an application on their terminals such as PCs and mobile phones.
[DAU]An acronym for Daily Active Users. The number of users per day who use a social media or social application service (active users).
[ARPU]Abbreviation for Average Revenue Per User.


![{,12g lz{ f O O e 20111017 PDFu(.ppt [N c 0 0 0 ]pdf.irpocket.com/C3656/XN1V/yLge/CSWe.pdf大規模・大規模 ・・・高負荷高負荷高負荷システム システムシステムの](https://img.dokumen.tips/doc/110x75/5ecdad3c67c3df2536342aec/12g-lz-f-o-o-e-20111017-pdfuppt-n-c-0-0-0-pdf-efe-fffeeeeeeeeeff.jpg)